upper mohawk river coliform bacteria monitoring … york state department of environmental...
TRANSCRIPT

New York State DEPARTMENT OF ENVIRONMENTAL CONSERVATION Division of Water
Upper Mohawk River Coliform Bacteria Monitoring Project
Portions 12 and 13 in the Utica-Rome Area
June 2012 - September 2012
November 2013 (Revised January 2014)

EXECUTIVE SUMMARY This report presents the results of coliform bacteria monitoring conducted by the New York State Department of Environmental Conservation (NYSDEC) from June through September 2012 in portions 12 and 13 of the Mohawk River (see Figure 2). Water sampling was conducted at two stations: Mohawk River in West Schuyler (Portion 12) and Mohawk River near Oriskany (Portion 13). Twenty-two samples per station were collected and analyzed for total and fecal coliform bacteria. Field parameters of dissolved oxygen, specific conductance, pH and temperature were also measured at each station during sampling. Portions 12 and 13 of the Mohawk River are listed in the Final 2012 Section 303(d) List, Part 1 - Individual Waterbody Segments with Impairment Requiring Total Maximum Daily Load (TMDL) Development. Pollutants and water quality indicators listed in the Section 303(d) list include floatables (aesthetics), pathogens and dissolved oxygen/oxygen demand. Pollution sources contributing to impairment include Combined Sewer Overflows (CSOs), Sanitary Sewer Overflows (SSOs), and urban stormwater runoff. The goal of the project was to collect and test samples for coliform frequently enough to satisfy the requirements of New York State Water Quality Standards (at least five samples per month). NYSDEC uses coliform bacteria as an indicator of pathogens. The water quality standard for coliform is based on a minimum of five examinations within a calendar month for Class B and C waterbodies. Portion 12 is designated Class C water and Portion 13 is designated Class B water. Previous coliform studies by NYSDEC have consisted of long-term trend monitoring on a statewide level. With more than 80,000 miles of streams and rivers, it would not be practical to collect and test water samples for coliform on a statewide level at the minimum frequency needed to comply with the water quality standard. Therefore, NYSDEC periodically conducts studies like this one on specific waterbody portions. The water quality standard for fecal coliform states that the monthly geometric mean from a minimum of five examinations shall not exceed 200 numbers/100 mL during all periods when disinfection is practiced. Project results confirmed that portions 12 and 13 of the Mohawk River exceeded the water quality standard for numbers of fecal coliform as follows: West Schuyler (Station 12010101) - The water quality standard for fecal coliform was exceeded during all four months at this station on Portion 12 of the Mohawk River, downstream of the significant discharge points. The geometric mean of all samples collected was 1,146 numbers/100 mL.
Oriskany (Station 12010116) - The water quality standard for fecal coliform was exceeded during three of four months at this station on Portion 13 of the Mohawk River, upstream of the significant discharge points. The geometric mean of all samples collected in 2012 was 273 numbers/100 mL. The current restoration strategy for the upper Mohawk River includes the elimination of the SSO at the Sauquoit Creek Pumping Station and implementation of a CSO Long-Term Control Plan
by the City of Utica. However, project results suggest that, even after the current restoration strategy has been implemented, water quality standards for fecal coliform may not be achieved. Relatively high fecal coliform results at the downstream station during periods of dry weather indicate that sources of pollution in addition to SSOs, CSOs and urban stormwater runoff are contributing to impairment of the upper Mohawk River. Therefore, in order to comply with the Clean Water Act, a TMDL pollution reduction plan must be developed for the upper Mohawk River.

Upper Mohawk River Coliform Bacteria Monitoring Project
Portions 12 and 13 in the Utica-Rome Area
June 2012 - September 2012
New York State Department of Environmental Conservation
Division of Water Region 6
207 Genesee Street Utica, New York 13501-2885
November 2013 (Revised January 2014)

TABLE OF CONTENTS 1. INTRODUCTION ...................................................................................................................... 1 2. BACKGROUND ........................................................................................................................ 2 3. MONITORING PROJECT ......................................................................................................... 6
A. Monitoring Locations ............................................................................................................. 6 B. Quality Assurance .................................................................................................................. 9
4. FIELD PARAMETER RESULTS ............................................................................................ 11 A. Dissolved Oxygen ................................................................................................................ 11 B. Specific Conductance ........................................................................................................... 12 C. pH ......................................................................................................................................... 13 D. Water Temperature .............................................................................................................. 14
5. COLIFORM TEST RESULTS ................................................................................................. 15 A. Total Coliform ...................................................................................................................... 17 B. Fecal Coliform ...................................................................................................................... 19 C. Baseline Fecal Coliform Levels ........................................................................................... 20
6. COMPARISON WITH PREVIOUS STUDIES ....................................................................... 22 7. CONCLUSIONS....................................................................................................................... 25 8. RECOMMENDATIONS .......................................................................................................... 26 9. REFERENCES ......................................................................................................................... 28 APPENDIX A. MONITORING RESULTS ................................................................................. 30

LIST OF FIGURES Figure 1. Upper Mohawk River Watershed .................................................................................... 5 Figure 2. Location of Upper Mohawk River Monitoring Stations in 2012 .................................... 6 Figure 3. Upper Mohawk River Monitoring Stations in 2012 ........................................................ 8 Figure 4. Upper Mohawk River Sampling Schedule in 2012 ......................................................... 8 Figure 5. Upper Mohawk River Dissolved Oxygen Measurements in 2012 ................................ 12 Figure 6. Upper Mohawk River Specific Conductance Measurements in 2012 ........................... 13 Figure 7. Upper Mohawk River pH Measurements in 2012 ......................................................... 14 Figure 8. Upper Mohawk River Temperature Measurements in 2012 ......................................... 15 Figure 9. Upper Mohawk River Median Total Coliform Results in 2012 .................................... 18 Figure 10. Upper Mohawk River Total Coliform Percent Exceedance in 2012 ........................... 18 Figure 11. Upper Mohawk River Fecal Coliform Results in 2012 ............................................... 19 Figure 12. Fecal Coliform Distribution Curve for Mohawk River in West Schuyler .................. 21 Figure 13. Fecal Coliform Distribution Curve for Mohawk River near Oriskany ....................... 22 Figure 14. Mohawk River Monitoring Stations ............................................................................ 24 Figure 15. Upper Mohawk River Watershed Fecal Coliform Results for 2001 - 2012 ................ 25 LIST OF TABLES Table 1. Upper Mohawk River Monitoring Stations in 2012 ......................................................... 6 Table 2. Analytical Specifications .................................................................................................. 9 Table 3. Summary of Field Parameter Results for Mohawk River in West Schuyler .................. 11 Table 4. Summary of Field Parameter Results for Mohawk River near Oriskany ....................... 11 Table 5. Upper Mohawk River Coliform Results in 2012 ............................................................ 17 Table 6. Upper Mohawk River Watershed Monitoring Stations from 2001 - 2012 ..................... 23
LIST OF ACRONYMS CFR Code of Federal Regulations
CSO Combined Sewer Overflow
DO Dissolved Oxygen
EPA See USEPA
LTCP Long-Term Control Plan
NYCRR New York State Code of Rules and Regulations
NYSDEC New York State Department of Environmental Conservation
NYSDOH New York State Department of Health
QAPP Quality Assurance Project Plan
RIBS Rotating Integrated Basin Studies
SPDES State Pollutant Discharge Elimination System
SSO Sanitary Sewer Overflow
TMDL Total Maximum Daily Load
USEPA United States Environmental Protection Agency
USGS United States Geological Survey
WI/PWL Waterbody Inventory/Priority Waterbodies List

1.
1. INTRODUCTION The Federal Clean Water Act requires states to periodically assess and report on the quality of waters of the state. Section 305(b) of the Act requires states to submit a report on the quality of the waters of the state every two years. Section 303(d) of the Act requires states to identify, compile and submit every two years a list of “impaired waters,” or waters for which designated uses are not fully supported. In order to restore and protect the designated uses of impaired waters, states must consider the development of a Total Maximum Daily Load (TMDL) pollution reduction strategy, or another strategy that reduces the input of the specific pollutant(s) that restrict uses. In order to fulfill the requirements of Section 305(b) of the Federal Clean Water Act, New York State Department of Environmental Conservation (NYSDEC) initiated a Statewide Water Monitoring Program that provides regular, periodic assessments of the quality of the water resources in the state and their ability to support specific uses. These assessments reflect monitoring and water quality information drawn from a number of programs and sources, both within and outside NYSDEC. NYSDEC maintains information on how well waters support their designated uses, including which waters are impaired and which have lesser water quality impacts. This information is compiled in the Waterbody Inventory/Priority Waterbodies List (WI/PWL) database. The Waterbody Inventory refers to a listing of all waters, identified as specific individual waterbodies or “assessment units,” within the state. The WI/PWL assessments provide the foundation for the Section 305(b) Water Quality Report on all waters of the state, and the Section 303(d) List of waters not meeting water quality standards nor supporting water uses. A core component of the Statewide Water Monitoring Program is the Rotating Integrated Basin Studies (RIBS) Program. Water quality information collected through the RIBS program is used to support water quality assessments made through the WI/PWL. The RIBS program is designed such that all major drainage basins in the state are monitored every five years for selected monitoring stations. The Mohawk River is divided into several assessment units. Portions 12 and 13 of the Mohawk River are listed in the Final 2012 Section 303(d) List, Part 1 - Individual Waterbody Segments with Impairment Requiring TMDL Development. Pollutants and water-quality indicators listed include floatables (aesthetics), pathogens and dissolved oxygen/oxygen demand. Water quality regulations, classifications and standards of quality and purity are promulgated under Title 6 of the Official Compilation of Codes, Rules and Regulations of the State of New York, Chapter X, Parts700-706 (6 NYCRR Parts 700-706). Water quality standards for coliform bacteria are found 6 NYCRR Part 703.4. NYSDEC uses coliform bacteria as an indicator of pathogens. Water quality standards for coliform are based on a minimum of five examinations within a calendar month. However, coliform samples collected through the RIBS program are typically

2.
collected at a frequency of one sample per month during April through October for watersheds scheduled for intensive sampling. For the Mohawk River watershed, this most recently occurred in 2001, 2006, and 2011. With thousands of streams and rivers covering more than 80,000 miles in New York State, it would not be practical to collect coliform samples at a minimum frequency of five per month on a statewide basis. The purpose of this project was to focus on testing pathogen-impaired segments of the Mohawk River for coliform by collecting coliform samples at a minimum frequency of five per month as required by water quality standards. The months from June through September were specifically selected because this is the period when municipal wastewater treatment plants are required to disinfect treated wastewater being discharged to Portions 12 and 13 of the Mohawk River. In addition to testing for coliform, field parameters of dissolved oxygen, specific conductance, pH and water temperature were measured at the time of sample collection. This project will contribute to the Statewide Water Monitoring Program and assist in the overall development of water management strategies to protect and improve New York State's natural resources. Specific uses of the data generated by this project include:
• Confirming that the designated uses of the Mohawk River are not fully supported.
• Establishing baseline conditions for evaluating the effectiveness of NYSDEC regulatory activities, which in part require that the City of Utica implement a Combined Sewer Overflow (CSO) Long-Term Control Plan (LTCP) and that Oneida County eliminate wet weather Sanitary Sewer Overflow (SSO) at the Sauquoit Creek Pumping Station.
• Providing additional water quality data should further studies be conducted on portions
12 and 13 of the Mohawk River.
• Supporting NYSDEC State Pollutant Discharge Elimination System (SPDES) permitting and compliance activities.
• Providing water quality data to stakeholders and the general public.
Funding for this project is made possible through the Clean Water Act Section 106 Monitoring Initiative, administered by U. S. Environmental Protection Agency (EPA).
2. BACKGROUND The Mohawk River extends from its headwaters in Central New York State to its eastern confluence with the Hudson River. It has a drainage area of 3,470 square miles. From its headwaters in southern Lewis County at Mohawk Hill, it flows 30 miles south towards Rome. At Rome, the river turns east and flows 130 miles until it reaches its confluence with the Hudson River in Cohoes.
3.
The upper Mohawk River at the end point of Portion 12 drains an area of 570 square miles. The three largest tributaries include Oriskany Creek, Ninemile Creek and Sauquoit Creek. 178,000 people (Census, 2001) live in this section of the drainage basin. Population centers along the main stem include the cities of Utica and Rome, and the villages of New York Mills, Yorkville, Whitesboro, New Hartford and Oriskany. The upper Mohawk River and Erie Canal are separate water courses, except for a short section where they are combined. Flows in the upper Mohawk River are regulated by the New York State Canal Corporation through a complex system that includes Delta Reservoir, feeder canals, locks, guard gates and lateral overflow weirs. During canal navigation season, a small portion the Mohawk River flow is diverted out of the Mohawk Basin at Rome and flows west towards Oneida Lake to supply water for canal lockages. Historically, the upper Mohawk River was used for wastewater disposal and had become severely polluted. Sanitary and industrial wastes from the City of Utica were discharged raw and several adjoining municipalities discharged either raw or partially treated wastewater (Joint Municipal Survey Committee, 1964). In 1965, the Oneida County Sewer District was formed to provide a common solution to the wastewater problems in the Utica area. Construction of the Oneida County Water Pollution Control Plant began in 1968 and the plant became operational in 1971. In 1984, significant upgrades were initiated that expanded the overall treatment capacity as well as providing advanced treatment from June through October. Currently, the facility serves 15 municipalities within the sewer district. The facility is required to disinfect its treated effluent during the months of June through September. Although significant and steady improvement in overall water quality has been made since construction of the regional treatment facility, combined sewer overflows (CSOs) and sanitary sewer overflows (SSOs) continue to contribute to the impairment of the upper Mohawk River (NYSDEC, 2010). Combined sewer systems are sewers that were originally designed to carry both stormwater and sanitary sewage in the same pipe. During dry weather, flows from combined sewers are transported to a treatment plant where it is treated and then discharged to a receiving waterbody. However, during wet weather, flows often exceed the hydraulic capacity of sewer system and/or treatment plant and the excess flow is diverted to a waterbody without treatment. The discharge of excess flow from combined sewers is considered a CSO and can contain a combination of stormwater, industrial waste and untreated human waste. CSOs are allowed under the Clean Water Act provided that they comply with EPA's 1994 CSO Control Policy which sets national standards for the control of CSO discharges. About 50 percent of the sewer system serving the City of Utica consists of combined sewers. The city was required to develop a CSO Long-Term Control Plan (LTCP) as a condition of its SPDES permit. CSO simulation modeling conducted by the city suggests that during a typical year, the total volume of CSO discharges to the Mohawk River is approximately 480 million gallons (City of Utica, 2010). The LTCP is scheduled to be fully implemented by 2021 and will increase the annual capture and treatment of CSO volume from 68 to 90 percent.
4.
An SSO is an overflow, spill or release of raw or partially treated sanitary sewage that results in discharge to a waterbody prior to reaching a wastewater treatment plant. A major distinction between SSOs and CSOs is that SSOs occur in systems where storm sewers and sanitary sewers are not connected. SSOs are typically caused by undersized treatment works, equipment failures, excessive inflow/infiltration into a sanitary sewer system, and plugged sewer pipes. SSOs are prohibited under Clean Water Act. The Sauquoit Creek Pumping Station is owned and operated by Oneida County Department of Water Quality and Water Pollution Control. It serves nine municipalities upstream of the City of Utica. During wet weather, flows can exceed the capacity of the pump station force main. The pump station runs the excess sewage through screens and then discharges the screened sewage directly into the Mohawk River. SSO simulation modeling conducted by Oneida County suggests that during a typical year, the volume of SSO discharges to the Mohawk River totals approximately 332 million gallons (Oneida County, 2010). Oneida County is currently under a NYSDEC issued consent order requiring that it eliminate SSOs by 2021. Other sources of pollution believed to be affecting the Mohawk River include urban stormwater runoff and historic/past industrial discharges (NYSDEC, 2010). PCB's from contaminated sediment have led to a fish consumption advisory by New York State Department of Health (NYSDOH) along the Mohawk River from Oriskany Creek to West Canada Creek, and for Sauquoit Creek (NYSDOH, 2012). A number of inactive hazardous waste sites in the area may also be affecting water quality (NYSDEC, 2010).

5.
Figure 1. Upper Mohawk River Watershed

6.
3. MONITORING PROJECT A. Monitoring Locations The two monitoring stations for this project are provided in Table 1 and Figure 2. The stations were chosen based on the sampling suitability, physical location, and availability of previously collected data.
Table 1. Upper Mohawk River Monitoring Stations in 2012
Station Id Station Name Latitude Longitude 12010101 Mohawk River in West Schuyler 43.09083 -75.15722 12010116 Mohawk River near Oriskany 43.16500 -75.32558
Figure 2. Location of Upper Mohawk River Monitoring Stations in 2012
7.
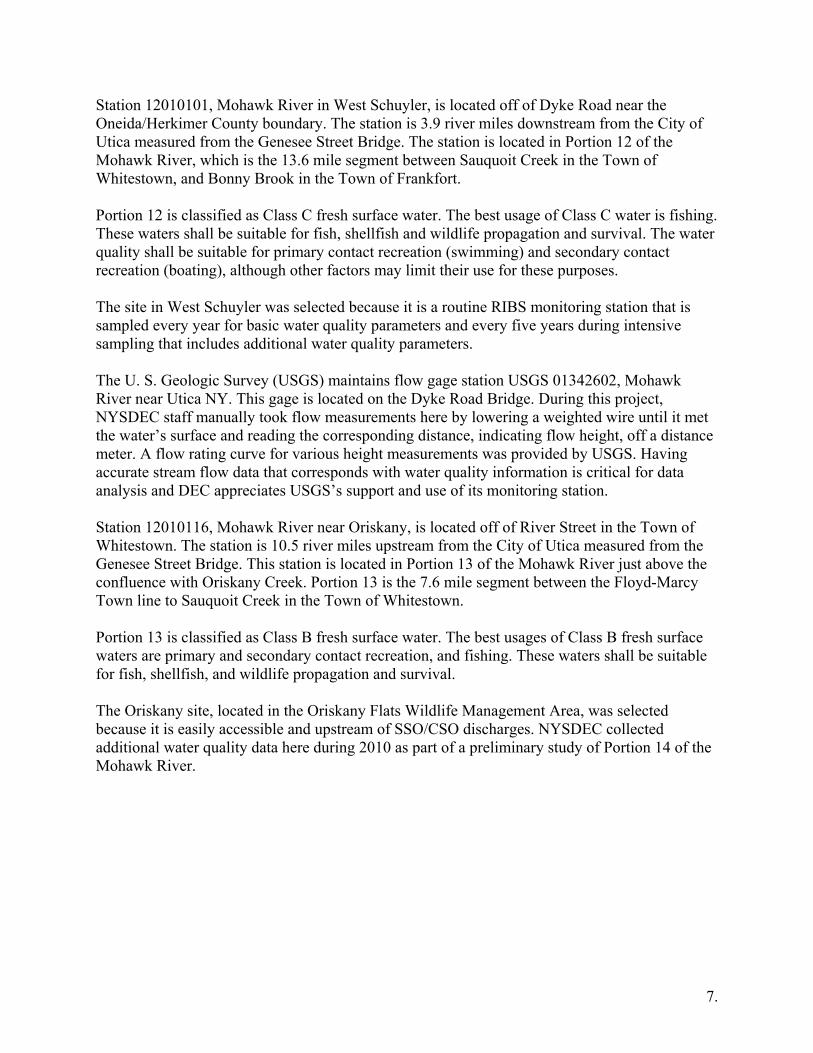
Station 12010101, Mohawk River in West Schuyler, is located off of Dyke Road near the Oneida/Herkimer County boundary. The station is 3.9 river miles downstream from the City of Utica measured from the Genesee Street Bridge. The station is located in Portion 12 of the Mohawk River, which is the 13.6 mile segment between Sauquoit Creek in the Town of Whitestown, and Bonny Brook in the Town of Frankfort. Portion 12 is classified as Class C fresh surface water. The best usage of Class C water is fishing. These waters shall be suitable for fish, shellfish and wildlife propagation and survival. The water quality shall be suitable for primary contact recreation (swimming) and secondary contact recreation (boating), although other factors may limit their use for these purposes. The site in West Schuyler was selected because it is a routine RIBS monitoring station that is sampled every year for basic water quality parameters and every five years during intensive sampling that includes additional water quality parameters. The U. S. Geologic Survey (USGS) maintains flow gage station USGS 01342602, Mohawk River near Utica NY. This gage is located on the Dyke Road Bridge. During this project, NYSDEC staff manually took flow measurements here by lowering a weighted wire until it met the water’s surface and reading the corresponding distance, indicating flow height, off a distance meter. A flow rating curve for various height measurements was provided by USGS. Having accurate stream flow data that corresponds with water quality information is critical for data analysis and DEC appreciates USGS’s support and use of its monitoring station. Station 12010116, Mohawk River near Oriskany, is located off of River Street in the Town of Whitestown. The station is 10.5 river miles upstream from the City of Utica measured from the Genesee Street Bridge. This station is located in Portion 13 of the Mohawk River just above the confluence with Oriskany Creek. Portion 13 is the 7.6 mile segment between the Floyd-Marcy Town line to Sauquoit Creek in the Town of Whitestown. Portion 13 is classified as Class B fresh surface water. The best usages of Class B fresh surface waters are primary and secondary contact recreation, and fishing. These waters shall be suitable for fish, shellfish, and wildlife propagation and survival. The Oriskany site, located in the Oriskany Flats Wildlife Management Area, was selected because it is easily accessible and upstream of SSO/CSO discharges. NYSDEC collected additional water quality data here during 2010 as part of a preliminary study of Portion 14 of the Mohawk River.
8.
Mohawk River in West Schuyler Mohawk River near Oriskany
Figure 3. Upper Mohawk River Monitoring Stations in 2012
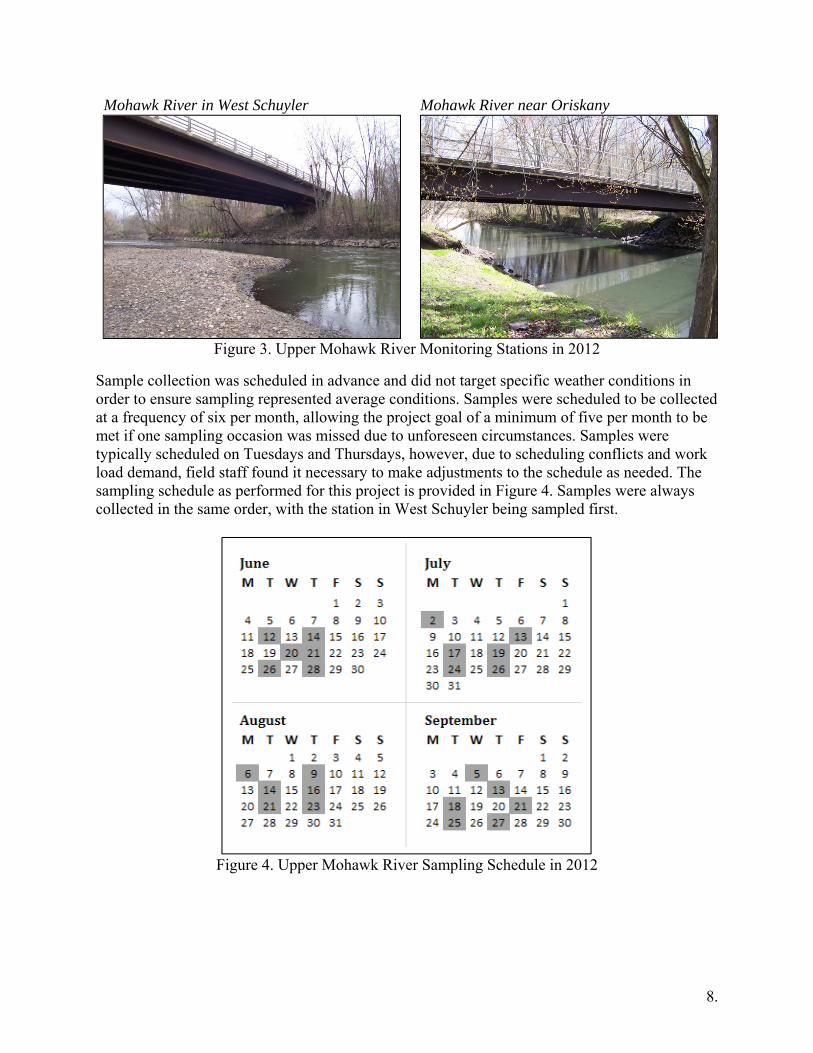
Sample collection was scheduled in advance and did not target specific weather conditions in order to ensure sampling represented average conditions. Samples were scheduled to be collected at a frequency of six per month, allowing the project goal of a minimum of five per month to be met if one sampling occasion was missed due to unforeseen circumstances. Samples were typically scheduled on Tuesdays and Thursdays, however, due to scheduling conflicts and work load demand, field staff found it necessary to make adjustments to the schedule as needed. The sampling schedule as performed for this project is provided in Figure 4. Samples were always collected in the same order, with the station in West Schuyler being sampled first.
Figure 4. Upper Mohawk River Sampling Schedule in 2012

9.
B. Quality Assurance Quality assurance included the development and approval of a quality assurance project plan (QAPP) prior to starting the project and preparation of a data validation report when the project was finished. Both the QAPP and data validation reports are available upon request. By following documented quality control procedures, a level of confidence in the data set, and interpretations and conclusions drawn from it, can be established. Sampling procedures and equipment calibration followed NYSDEC Division of Water standard operating procedures (SOPs). Field parameters of temperature, dissolved oxygen, pH and specific conductance were measured when samples were collected using a YSI 556 multi-parameter handheld meter. Samples were analyzed for fecal and total coliform by Verona Laboratory, Incorporated. Verona Laboratory is a commercial facility certified by the NYSDOH Environmental Laboratory Approval Program (ELAP). Verona Laboratory was responsible for maintaining internal quality control as a part of its quality assurance plan and in accordance with the NYSDOH ELAP certification manual. Analytical methods for this project were in accordance with Title 40 of the Code of Federal Regulation, Part 136, Guidelines Establishing Test Procedures for the Analysis of Pollutants (40 CFR Part 136). Specific analytical methods and criteria for precision, accuracy and detection limits are listed in Table 2.
Table 2. Analytical Specifications
Parameter Analytical Lab
Standard Method Precision Accuracy Calibration
Method Detection
Limit
Reporting Limit
Total Coliform Verona 9222B -- -- -- 1 CFU/100 mL 20. CFU/100 mL
Fecal Coliform Verona 9221E -- -- -- 1 MPN/100 mL 20. MPN/100 mL
Temperature Field Analysis 2550 B ± 1oC ± 1.5oC Factory Set ± 0.1oC ± 0.1oC
Dissolved Oxygen
Field Analysis 4500-O G ± 1% ± 2% Daily ± 0.1 mg/L ± 0.1 mg/L
pH Field Analysis 4500-H + B ± 0.05 SU ± 0.05 SU Weekly ± 0.1 SU ± 0.1 SU
Specific Conductance
Field Analysis 2510 B ± 1 μs/cm ± 1% Weekly ± 1 μmhos/cm ± 10 μmhos/cm

10.
Data validation is the review process used to qualify or reject data based on the established quality control procedures set forth by the project QAPP. Data validation for this project included data review, collecting duplicate and “field blank” samples, and determining the “percent completeness” of the samples collected in order to qualify the data as meeting the quality objectives of the project (See below for further explanation of data validation methods.). Twenty percent of the samples collected during the project were used for quality control. Data Review Calibration logs were reviewed to ensure that the monitoring equipment was operated in accordance with the project’s analytical specifications. Field parameter results were reviewed to determine whether the values that were obtained were within expected ranges. Results were found to be consistent with surface water monitoring and no outliers were identified. Laboratory analysis reports for the coliform results were also reviewed to ensure that the allowable holding time of six hours, as specified in the QAPP, was not exceeded. Duplicate Samples Data precision was assessed by collecting duplicate samples. Duplicate samples were collected once a month at each site and analyzed for precision by calculating the relative percent difference (RPD) between them. It is unlikely that both samples would be identical due to natural variation, but to be considered valid, the relative percent difference between the two samples must be equal to or less than twenty percent (20%) when using the following formula:
RPD = ( c - c ) x 100%
( c + c ) / 21 2
1 2
where:
RPD = relative percent difference c1 = larger of the two observed values c2 = smaller of the two observed values
The total coliform sample collected on 06/20/2012 and the fecal coliform sample collected on 08/14/2012 were flagged as not meeting the quality assurance criteria for RPD. Sampling results for those two days were omitted from the final results. Field Blank Samples Field blanks were collected at each site once a month. Field blanks are used to check for sample contamination during collection and handling procedures. Blanks are sterile distilled water that is obtained from a newly opened bottle and transferred to an empty sterile sampling container. After a sample is collected from the waterbody being tested, the field blank is handled and transported in the same manner as the waterbody sample. Field blanks were analyzed for total and fecal coliform. No coliform was found in any of the field blanks. Percent Completeness Percent completeness is the number of samples actually collected and analyzed divided by the number of samples originally intended to be collected and analyzed, expressed as a percentage.

11.
Percent completeness varies depending on the number of samples considered necessary to accomplish a project’s goals and objectives. For this project, six samples were scheduled to be collected per month and the completeness requirement of a minimum of five collections per month, or 83% was met.
4. FIELD PARAMETER RESULTS Tables 3 and 4 provide a statistical summary of the field parameters measured at each monitoring station in 2012.
Table 3. Summary of Field Parameter Results for Mohawk River in West Schuyler
Temperature ( ºC)
Dissolved Oxygen (mg/L)
pH (SU)
Specific Conductance(umhos/cm)
Number of Samples 22 22 22 22 Maximum 25.0 9.4 7.6 506 Minimum 15.9 6.3 6.1 409 Mean 21.3 7.7 7.1 453 Median 21.7 7.5 7.2 453 Standard Deviation 2.77 0.9 0.4 27.5
Table 4. Summary of Field Parameter Results for Mohawk River near Oriskany
Temperature ( ºC)
Dissolved Oxygen (mg/L)
pH (SU)
Specific Conductance (umhos/cm)
Number of Samples 22 22 22 22 Maximum 24.0 9.8 7.6 293 Minimum 15.7 6.6 6.3 213 Mean 20.5 8.2 7.2 256 Median 21.4 8.2 7.3 259 Standard Deviation 2.41 0.9 0.4 25.5 Results and comparisons of field parameters are presented in the following sections. A. Dissolved Oxygen The amount of dissolved oxygen in water is expressed in milligrams of oxygen per liter of water (mg/L). Dissolved oxygen (DO) is critical to the survival of all forms of aquatic life and is a good indicator of overall stream health. New York State’s water quality standard for DO is defined in 6 NYCRR Part 703.3. For the Mohawk River, minimum daily average DO shall not be less than 5.0 mg/L, and at no time shall DO be less than 4.0 mg/L. Many physical and biological factors can influence the level of DO in rivers and streams. Sources that contribute to DO levels include atmospheric replenishment, photosynthesis from aquatic plants, the churning of rapidly moving water, waterfalls and flow over dams. Sources that consume oxygen include aquatic animals, algal respiration, and decomposition of organic

12.
material. Sources of organic material can include, but are not limited to particles contained in sediment, decaying aquatic plants, treated wastewater from sewage treatment plants, failing septic systems, CSO and SSO discharges, and stormwater runoff. DO levels in streams will fluctuate over a 24-hour period and will vary with water temperature. Cold water has the ability to hold more oxygen than warmer water because of the solubility properties of oxygen in water. DO results from this project are presented in Figure 5. Water quality standards for dissolved oxygen were maintained throughout the project. Overall, DO values were lower at the downstream monitoring station.
Figure 5. Upper Mohawk River Dissolved Oxygen Measurements in 2012
B. Specific Conductance Specific conductance is used as an indicator of the impurities in water. Pure water conducts electricity very poorly and needs dissolved inorganic solids that carry either a negative or a positive charge in order to pass an electrical current. Specific conductance was measured in micromhos per centimeter (umhos/cm) compensated to 25 degrees Celsius. The higher the specific conductance, the higher the dissolved inorganic solids content in the water. New York State does not have a water quality standard for specific conductance. Specific conductance in lakes and streams can be affected by natural conditions, such as the geological makeup of the area and soil erosion. Sources of water pollution, such as stormwater runoff and point source discharges, could also affect specific conductance of a waterbody.
3.0
4.0
5.0
6.0
7.0
8.0
9.0
10.0
6/12
/2012
6/14
/2012
6/21
/2012
6/26
/2012
6/28
/2012
7/2/20
12
7/13
/2012
7/17
/2012
7/19
/2012
7/24
/2012
7/26
/2012
8/6/20
12
8/9/20
12
8/16
/2012
8/21
/2012
8/23
/2012
9/5/20
12
9/13
/2012
9/18
/2012
9/21
/2012
9/25
/2012
9/27
/2012
Dissolved
Oxygen (m
g/l)
Dissolved Oxygen Results
Mohawk River in West Schuyler Mohawk River near Oriskany
Daily Average Water Quality Standard Instantaneous Water Quality Standard
13.
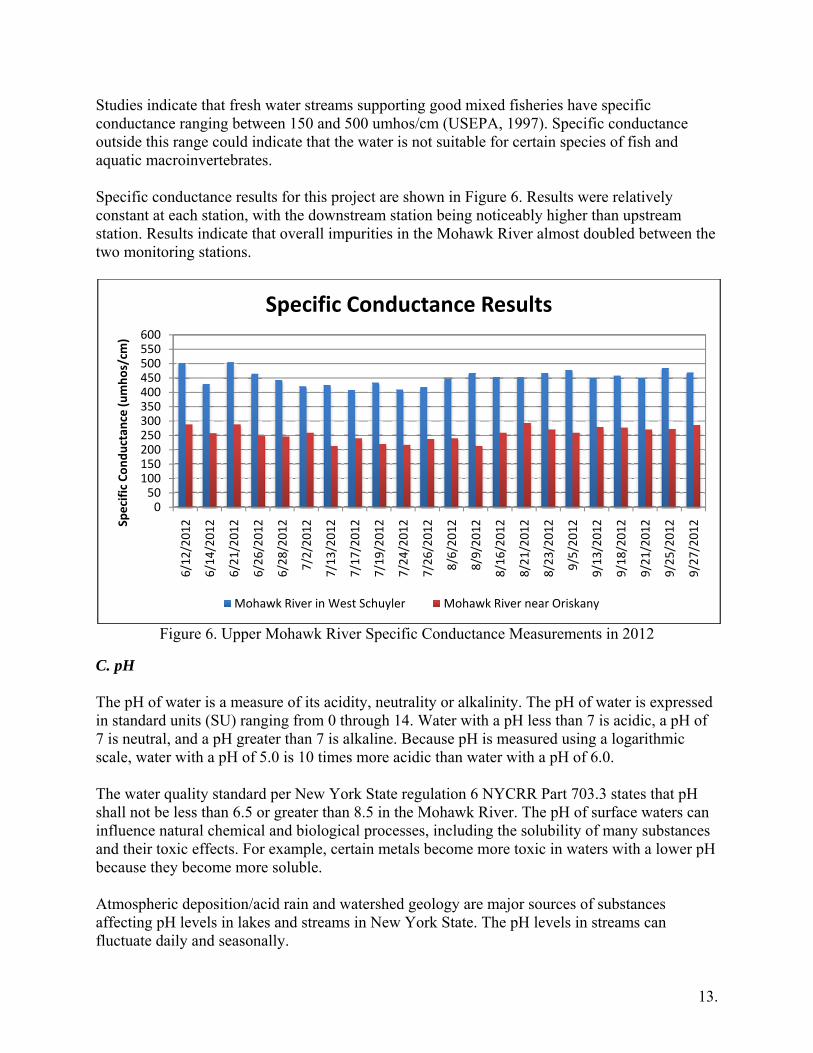
Studies indicate that fresh water streams supporting good mixed fisheries have specific conductance ranging between 150 and 500 umhos/cm (USEPA, 1997). Specific conductance outside this range could indicate that the water is not suitable for certain species of fish and aquatic macroinvertebrates. Specific conductance results for this project are shown in Figure 6. Results were relatively constant at each station, with the downstream station being noticeably higher than upstream station. Results indicate that overall impurities in the Mohawk River almost doubled between the two monitoring stations.
Figure 6. Upper Mohawk River Specific Conductance Measurements in 2012
C. pH The pH of water is a measure of its acidity, neutrality or alkalinity. The pH of water is expressed in standard units (SU) ranging from 0 through 14. Water with a pH less than 7 is acidic, a pH of 7 is neutral, and a pH greater than 7 is alkaline. Because pH is measured using a logarithmic scale, water with a pH of 5.0 is 10 times more acidic than water with a pH of 6.0. The water quality standard per New York State regulation 6 NYCRR Part 703.3 states that pH shall not be less than 6.5 or greater than 8.5 in the Mohawk River. The pH of surface waters can influence natural chemical and biological processes, including the solubility of many substances and their toxic effects. For example, certain metals become more toxic in waters with a lower pH because they become more soluble. Atmospheric deposition/acid rain and watershed geology are major sources of substances affecting pH levels in lakes and streams in New York State. The pH levels in streams can fluctuate daily and seasonally.
050
100150200250300350400450500550600
6/12
/2012
6/14
/2012
6/21
/2012
6/26
/2012
6/28
/2012
7/2/20
12
7/13
/2012
7/17
/2012
7/19
/2012
7/24
/2012
7/26
/2012
8/6/20
12
8/9/20
12
8/16
/2012
8/21
/2012
8/23
/2012
9/5/20
12
9/13
/2012
9/18
/2012
9/21
/2012
9/25
/2012
9/27
/2012Specific Co
nductance (umho
s/cm
)
Specific Conductance Results
Mohawk River in West Schuyler Mohawk River near Oriskany

14.
The pH results for the project are provided in Figure 7. Both stations had fairly consistent pH levels that were close to neutral. Each station had one pH measurement that was below the water quality standard. No explanation was found for the two measurements that were below the water quality standard.
Figure 7. Upper Mohawk River pH Measurements in 2012
D. Water Temperature Temperature is a measure of the thermal energy in water and is typically measured in either degrees Celsius (°C) or Fahrenheit (°F). Temperature affects the reaction rates of many chemical and biological processes in surface waters. The rate of many chemical reactions will increase as water temperature increases. Temperature also affects the amount of dissolved oxygen water can hold. As its temperature increases, water’s ability to hold dissolved oxygen decreases. Water temperature plays a critical role in the type of aquatic species that inhabit a particular surface water. Optimal temperatures for aquatic life depend on the species. For example, rainbow trout are intolerant of water temperatures above 70°F, while channel catfish can tolerate water temperatures in excess of 90°F (Smith, 1995). Sport fish found in the Mohawk River in the Utica/Rome area include largemouth and smallmouth bass, walleye and northern pike, tiger muskellunge, yellow perch and brown bullhead. Sources of thermal pollution that can influence water temperature include point-source discharges of heated water from industrial operations. The removal of trees and vegetation along stream banks, and urban stormwater runoff can also increase the water temperature of rivers and streams.
5.05.56.06.57.07.58.08.59.0
6/12
/2012
6/14
/2012
6/21
/2012
6/26
/2012
6/28
/2012
7/2/20
12
7/13
/2012
7/17
/2012
7/19
/2012
7/24
/2012
7/26
/2012
8/6/20
12
8/9/20
12
8/16
/2012
8/21
/2012
8/23
/2012
9/5/20
12
9/13
/2012
9/18
/2012
9/21
/2012
9/25
/2012
9/27
/2012
pH (SU)
pH Results
Mohawk River in West Schuyler Mohawk River near Oriskany
Lower Range for Water Quality Standard Upper Range for Water Quality Standard

15.
New York State water quality standards for water temperature apply to the source of a thermal discharge. A thermal discharge is any discharge that results, or would result, in a temperature change in the receiving water. Thermal discharges from point sources are regulated through SPDES discharge permits. New York State water quality standards governing thermal discharges can be found in 6 NYCRR Part 704. Water temperature results for the project are provided in Figure 8. Average water temperature was slightly warmer at the downstream station, but water temperature does not appear to be an environmental threat for Portions 12 and 13 of the Mohawk River.
Figure 8. Upper Mohawk River Temperature Measurements in 2012
5. COLIFORM TEST RESULTS A pathogen is any disease-producing agent that can cause illness in its host. Pathogens can include bacteria, viruses, protozoa, parasitic worms, and other microorganisms. Waterborne diseases such as campylobacteriosis, cryptosporidiosis, giardiasis, shigellosis and other gastrointestinal diseases can be transmitted through contact with, or consumption of, waters contaminated with pathogens (USEPA, 1993). Testing water samples for all the possible types of pathogens would be time consuming, complex, and very expensive. As a more practical alternative, samples are tested for coliform bacteria because coliform are derived, or introduced into a waterbody, from the same sources of contamination as pathogenic organisms, so their presence is an indicator that pathogens may also be present.
59
61
63
65
67
69
71
73
75
77
15
17
19
21
23
25
6/12
/2012
6/14
/2012
6/21
/2012
6/26
/2012
6/28
/2012
7/2/20
12
7/13
/2012
7/17
/2012
7/19
/2012
7/24
/2012
7/26
/2012
8/6/20
12
8/9/20
12
8/16
/2012
8/21
/2012
8/23
/2012
9/5/20
12
9/13
/2012
9/18
/2012
9/21
/2012
9/25
/2012
9/27
/2012
Tempe
rature (º
F)
Tempe
rature (º
C)
Water Temperature Results
Mohawk River in West Schuyler Mohawk River near Oriskany

16.
Pathogenic contamination in surface waters can be attributed to a wide variety of sources including sanitary and combined sewer overflows, inadequately treated sewage, failing onsite septic systems, stormwater runoff, domestic and wild animal wastes, and manure spreading and other agricultural activities. Pathogenic contamination due to untreated or inadequately treated human sewage discharged to surface waters is both a public health and environmental concern. The EPA estimates that the volume of combined sewer overflows discharged nationally is 850 billion gallons per year and the volume of sanitary sewer overflows is between 3 to 10 billion gallons per year (USEPA, 2004). To test water for possible pathogenic contamination, two types of coliform tests are conducted: total coliform and fecal coliform. Total coliform includes bacteria found naturally in the environment, such as bacteria in soil and plants, as well as in feces. Fecal coliform is a subset of total coliform. Fecal coliform are bacteria present in the intestines and feces of warm blooded animals, including humans. Total coliform test results were based on the membrane filter method (SM 9222B) with laboratory results being reported as the number of colony forming units per 100 milliliters (CFU/100 mL). Fecal coliform test results were based on the multiple fermentation tube method (SM 9221E) with laboratory results being reported as the most probable number per 100 milliliters (MPN/100 mL). Coliform test results for this project are presented in Table 5. Also included in Table 5 are precipitation totals observed 72 hours prior to each sampling event. Hourly precipitation was obtained for Griffiss Airfield in Rome, NY (NOAA, 2012b). Supplemental daily precipitation was obtained for Delta Dam in Rome, NY (NOAA, 2012a) when the gage at Griffiss was not operational.

17.
Table 5. Upper Mohawk River Coliform Results in 2012
Date
Mohawk River in West Schuyler
Mohawk River near Oriskany
Previous Precipitation (inches)
Total Coliform (CFU/100 mL)
Fecal Coliform (MPN/100 mL)
Total Coliform (CFU/100 mL)
Fecal Coliform (MPN/100 mL)
0-24 hrs
24-48 hrs
48-72 hrs
06/12/2012 4,700 1,300 5,400 130 06/14/2012 5,700 2,400 3,900 2,400 0.76 06/21/2012 1,400 300 880 130 0.26 06/26/2012 3,900 500 1,500 140 0.06 0.90 06/28/2012 4,000 1,300 1,600 110 07/02/2012 3,100 500 3,000 80 07/13/2012 2,600 300 3,200 300 07/17/2012 2,800 300 3,500 1,100 0.05 07/19/2012 2,700 230 3,100 170 07/24/2012 >17,000 16,000 4,800 1,700 1.85(1) 07/26/2012 5,700 800 3,300 230 0.30(1) 0.03(1) 1.85(1) 08/06/2012 17,000 16,000 5,700 230 0.23(1) 08/09/2012 3,300 1,300 2,400 170 08/16/2012 3,500 300 2,900 300 0.03 0.86 0.04 08/21/2012 3,700 3,000 2,700 110 08/23/2012 2,600 2,400 2,200 110 09/05/2012 11,000 9,000 2,100 500 0.49 0.05 09/13/2012 1,900 800 1,500 500 09/18/2012 1,700 170 1,300 500 0.10 09/21/2012 5,000 2,400 1,600 230 0.01 .01 1.16 09/25/2012 3,000 1,700 2,000 300 0.44 09/27/2012 2,900 1,100 2,200 300 0.26 0.05 (1) Hourly precipitation unavailable; daily totals from Delta Dam A. Total Coliform The New York State water quality standard for total coliform has two conditions: From examination of a minimum of five samples per month;
1. The monthly median value shall not exceed 2,400 numbers/100 mL; and 2. More than 20 percent of the samples shall not exceed 5,000 numbers/100 mL.
Both conditions must be satisfied to demonstrate compliance with the total coliform water quality standard. The standard applies during all periods when wastewater disinfection is practiced at a treatment facility. Total coliform results compared with water quality standards are provided in Figures 9 and 10. Because five to six examinations were made at each station per month throughout the project, in order to exceed the 20 percent threshold, at least two sampling results within a month must be 5,000 numbers/100 mL or higher.

18.
Figure 9. Upper Mohawk River Median Total Coliform Results in 2012
Figure 10. Upper Mohawk River Total Coliform Percent Exceedance in 2012
4000
2950
3500
2950
1600
3250
2700
1800
0
500
1000
1500
2000
2500
3000
3500
4000
4500
June July August September
Total Colifo
rm (C
FU/100
mL)
Total Coliform Results Monthly Median
Mohawk River in West SchuylerMohawk River near OriskanyWater Quality Standard
20
33
20 1720
0
20
00
10
20
30
40
50
60
70
80
90
100
June July August September
Percen
t (%)
Total Coliform Results Percent of Monthly Samples Exceeding 5,000 CFU/100 mL
Mohawk River in West Schuyler
Mohawk River near Oriskany

19.
The total coliform standard was exceeded during all four months at the downstream station in West Schuyler, and during two out of four months at the upstream station near Oriskany. B. Fecal Coliform The New York State water quality standard for fecal coliform is that the monthly geometric mean, from examination of a minimum of five samples per month, shall not exceed 200 numbers/100 mL. The standard applies during all periods when wastewater disinfection is practiced at a treatment facility. Wastewater disinfection is any process designed to kill or inactivate pathogenic microorganisms in treated wastewater, such that bacterial numbers are reduced to a safe level to prevent the spread of waterborne diseases and minimize public health problems. Chlorination, ultraviolet radiation, and ozonation are some of more common forms of disinfection practiced at municipal wastewater treatment plants. Treatment plants discharging to Portions 12 and 13 of the Mohawk River are required to disinfect their effluent (treated wastewater) from June through September. Unlike a simple arithmetic mean, which can be skewed by unusually high or low numerical values, a geometric mean is a more accurate type of average, indicating the central tendency of a group of numbers. As shown in Figure 11, the water quality standard for fecal coliform was exceeded during all four months at the downstream station in West Schuyler, and during three out of four months at the upstream station near Oriskany.
Figure 11. Upper Mohawk River Fecal Coliform Results in 2012
905714
2140
1328
229347
170371
0
500
1000
1500
2000
2500
June July August September
Fecal Colifo
rm (M
PN/100
mL)
Fecal Coliform ResultsMonthly Geometric Mean
Mohawk River in West SchuylerMohawk River near OriskanyWater Quality Standard

20.
Wet weather had an impact on the overall coliform concentrations as indicated by the results in Table 5. Fecal coliform concentrations were significantly higher when rain of one half inch or more occurred within 24 hours prior to a sampling. The sampling project captured both dry and wet weather conditions, although it was considerably drier throughout the project compared to the climate normal for the area. Historically, the average precipitation total in the area for the period from June through September is 16.45 inches (NOAA, 2002). During 2012, it was 13.52 inches. The dry summer of 2012 resulted in no SSO discharges, whereas during June through September from 2005 through 2011, average SSO volume from the Sauquoit Creek Pump Station was 82 million gallons. Similarly, during June through September from 2005 through 2011, the total duration of CSO discharges from the City of Utica at outfall #076 was 203 hours, whereas in 2012, it was 64 hours, a 68 percent reduction (SPDES monitoring data, Oneida County Department of Water Quality and Water Pollution Control). Outfall #076 is estimated to contribute to 85 percent of the total CSO discharge volume from the City of Utica. Only overflow duration (in hours) is monitored at outfall #076. There were also relatively high fecal coliform counts at the downstream station during periods of dry weather. To be considered a dry weather sampling event, there can be no more than a 0.10 inch of precipitation and no SSO/CSO discharges within 72 hours prior to sample collection. Out of 11 dry weather sampling events at each station, the fecal coliform geometric means were 708 and 209 numbers/100 mL for the downstream and upstream stations, respectively. Dry weather sampling results suggest that wet weather impacts from SSO/CSO/urban runoff may not be the only source contributing to the increase in fecal coliform levels between the two monitoring stations. Results also indicate that the water quality standard for fecal coliform may not be achieved after the elimination of the SSO at the Sauquoit Creek Pumping Station and implementation of Utica's CSO Long-Term Control Plan (LTCP). C. Baseline Fecal Coliform Levels One of the goals of the project was to establish baseline fecal coliform levels for the upper Mohawk River in order to evaluate the effectiveness of NYSDEC’s requirement that Oneida County eliminate the SSO at the Sauquoit Creek Pumping Station and that the City of Utica develop and implement a CSO LTCP. Based on all samples collected, the overall geometric mean was 1,146 numbers/100 mL for Portion 12 (West Schuyler Station) and 273 numbers/100 mL for Portion 13 (Oriskany Station). Because the 22 samples collected at each station is a relatively small sample size, using the overall geometric mean to establish a single background value for each station is not scientifically sound due to the variance of the data. It is more appropriate to express the background level as a range based on confidence limits of the data. In order to assess the confidence limits, the data at each station was fitted to a log-normal distribution. The log-normal distribution was selected because a geometric mean is the 50% probability of the distribution and that water quality data is often found to be log-normally distributed.
21.
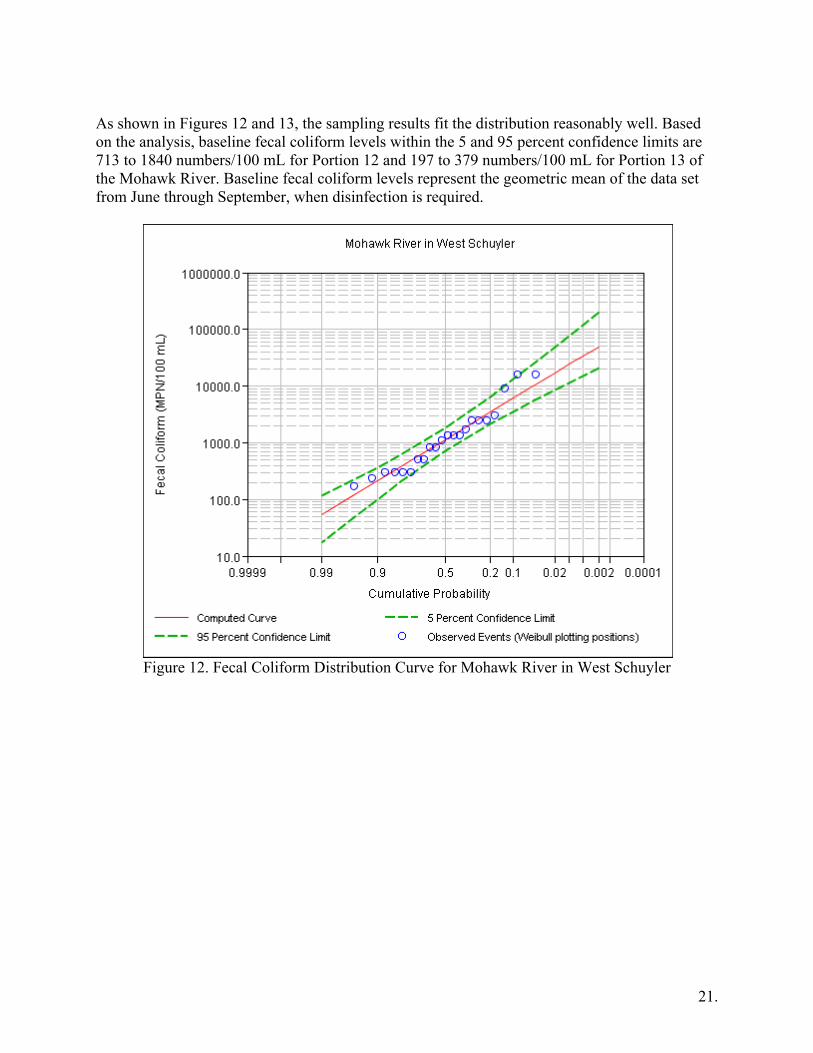
As shown in Figures 12 and 13, the sampling results fit the distribution reasonably well. Based on the analysis, baseline fecal coliform levels within the 5 and 95 percent confidence limits are 713 to 1840 numbers/100 mL for Portion 12 and 197 to 379 numbers/100 mL for Portion 13 of the Mohawk River. Baseline fecal coliform levels represent the geometric mean of the data set from June through September, when disinfection is required.
Figure 12. Fecal Coliform Distribution Curve for Mohawk River in West Schuyler

22.
Figure 13. Fecal Coliform Distribution Curve for Mohawk River near Oriskany
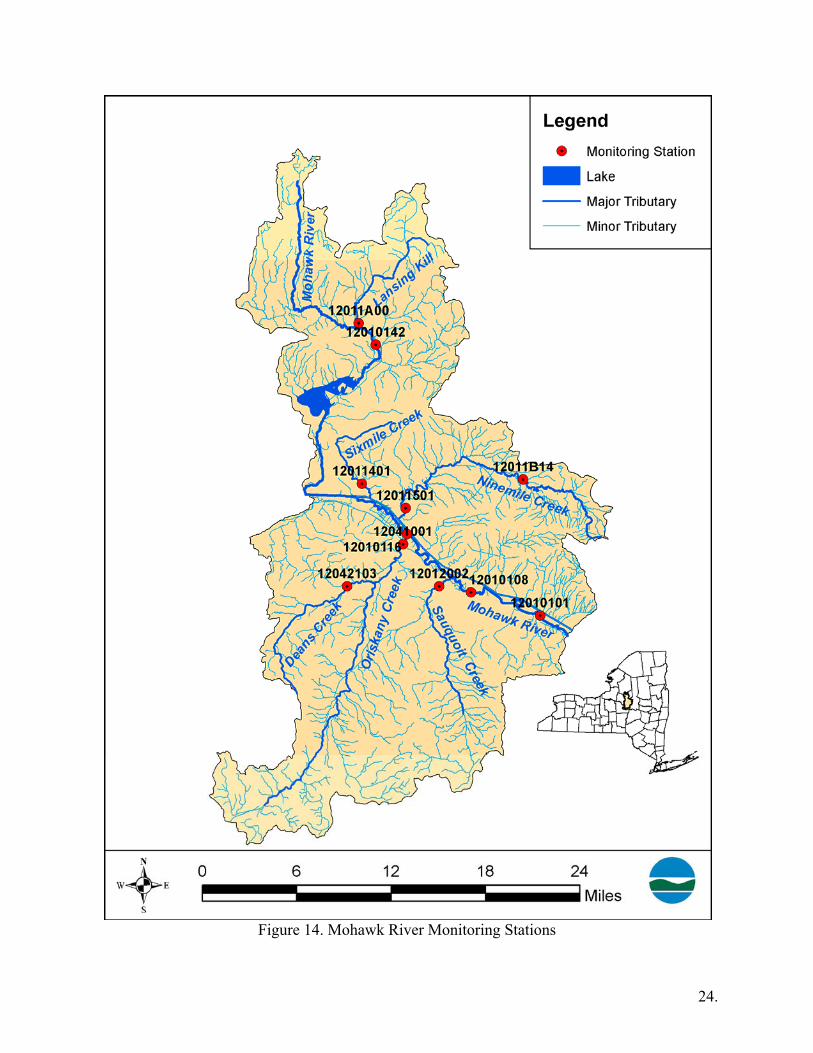
6. COMPARISON WITH PREVIOUS STUDIES NYSDEC collects and maintains an extensive inventory of water quality data in New York State. Based on 2,681 samples at 283 stations collected through the RIBS program since 2001, the statewide fecal coliform geometric mean is 140 numbers/100 mL. Fecal coliform data collected from this project was compared to RIBS data collected since 2001 for monitoring stations in the upper Mohawk River watershed. Monitoring stations are listed in Table 6 and locations are shown in Figure 14. Only those stations which were tributary to Portion 12 of the Mohawk River were used for the comparison.

23.
Table 6. Upper Mohawk River Watershed Monitoring Stations from 2001 - 2012
Station ID Station Name Drainage
Area (SQ MI)
Program ID Years Sampled Number
of Samples
12010101 Mohawk River in West Schuyler 553 DEC-RIBS 2001, 2006, 2011 14 12010101 Mohawk River in West Schuyler 553 DEC-2012 2012 22 12010108 Mohawk River in Utica 528 DEC-RIBS 2006 9 12010116 Mohawk River near Oriskany 300 DEC-2012 2012 22 12010142 Mohawk River in North Western 92 DEC-RIBS 2001, 2006, 2011 28 12011401 Sixmile Creek in Floyd 12 DEC-RIBS 2011 9 12011501 Ninemile Creek in Marcy 70 DEC-RIBS 2001 9 12011B14 Ninemile Creek in South Trenton 20 DEC-RIBS 2011 10 12012002 Sauquoit Creek in Whitesboro 62 DEC-RIBS 2006, 2011 19 12041001 Oriskany Creek in Oriskany 149 DEC-RIBS 2001, 2006, 2011 28 12042103 Deans Creek in Westmorland 18 DEC-RIBS 2006 9 12011A00 Lansing Kill in Hillside 28 DEC-RIBS 2011 10
One set of RIBS results for all samples collected on 9/25/2001 and 9/26/2001 was omitted because several stations had very high outliers. An extreme storm event delivered over 3 inches of precipitation to the area prior to the sampling events. Although the data points are valid, the results are not representative of normal stream conditions. For example, the Oriskany Creek station had fecal coliform result of 95,600 numbers/100 mL on 9/25/2001, which is over 200 times higher than the station geometric mean. Fecal coliform geometric means were used in the comparison to be consistent with water quality standards. However, the results are based on all values for each station and not on a minimum of five samples taken within a month. The water quality standard is being included for reference purposes only in Figure 15.
24.
Figure 14. Mohawk River Monitoring Stations

25.
Figure 15. Upper Mohawk River Watershed Fecal Coliform Results for 2001 - 2012
The comparison shows fecal coliform concentrations for Portion 12 of the Mohawk River are significantly higher compared to the rest of the watershed. Mohawk River in West Schuyler and Mohawk River in Utica are both located on Portion 12. Between the two monitoring stations used in this project, Oriskany Creek and Sauquoit Creek watersheds account for 75 percent of the total contributing drainage area. RIBS results for Oriskany Creek and Sauquoit Creek indicated fecal coliform geometric means of 417 and 354 numbers/100 mL, based on 28 and 19 samples, respectively. This suggests that pollutant sources in the remaining 25% of the watershed could be significantly contributing to the impairment of the upper Mohawk River. Results of the comparison also show that fecal coliform concentrations for the West Schuyler station collected through this project were not substantially different compared to long-term trend monitoring data collected through the RIBS program.
7. CONCLUSIONS Based on the monitoring results from a total of 44 coliform samples collected at two stations during June through September 2012, the following conclusions can be made:
• New York State Water Quality Standard for total coliform was exceeded during all four months in Portion 12 of the Mohawk River at the downstream station in West Schuyler.
987
1146
953
273
12465
306
95
354417
710
34
0
200
400
600
800
1000
1200
1400
Fecal Colifo
rm (M
PN/100
mL)
Fecal Coliform Geometric Mean1 ‐Mohawk River In West Schuyler (DEC‐RIBS)
2 ‐Mohawk River In West Schuyler (DEC‐2012)
3 ‐Mohawk River In Utica (DEC‐RIBS)
4 ‐Mohawk River Near Marcy (DEC‐2012)
5 ‐Mohawk River In North Western (DEC‐RIBS)
6 ‐ Sixmile Creek In Floyd (DEC‐RIBS)
7 ‐ Ninemile Creek In South Trenton (DEC‐RIBS)
8 ‐ Ninemile Creek in Marcy (DEC‐RIBS)
9 ‐ Sauquoit Creek In Whitesboro (DEC‐RIBS)
10 ‐ Oriskany Creek In Oriskany (DEC‐RIBS)
11 ‐ Deans Creek In Westmorland (DEC‐RIBS)
12 ‐ Lansing Kill In Hillside (DEC‐RIBS)
Water Quality Standard (Reference Only)1 2 3 4 5 6 7 8 9 10 11 12

26.
• New York State Water Quality Standard for fecal coliform was exceeded during all four months in Portion 12 of the Mohawk River at the downstream station in West Schuyler.
• New York State Water Quality Standard for total coliform was exceeded during two of
four months in Portion 13 of the Mohawk River at the upstream station in Oriskany.
• New York State Water Quality Standard for fecal coliform was exceeded during three of four months in Portion 13 of the Mohawk River at the upstream station in Oriskany.
• Fecal coliform geometric means are approximately four times higher at the downstream
station compared to the upstream station.
• Fecal coliform concentrations were significantly higher at both stations when precipitation events of one-half inch or more occurred within 24 hours prior to a sampling event.
• Baseline fecal coliform concentrations established for Portion 12 of the Mohawk River
range from 713 to 1840 numbers/100 mL. The geometric mean of all samples collected in 2012 was 1146 numbers/100 mL.
• Baseline fecal coliform concentrations established for Portion 13 of the Mohawk River range from 197 to 379 numbers/100 mL. The geometric mean of all samples collected in 2012 was 273 numbers/100 mL.
• Relatively high fecal coliform counts at the downstream station during periods of dry
weather indicate unidentified sources, in addition to SSO/CSO/urban runoff, may be contributing to the impairment of the Mohawk River.
• Fecal coliform concentrations measured at the downstream station were comparable to
long-term trend monitoring conducted by NYSDEC.
8. RECOMMENDATIONS For waters listed as impaired, the Federal Clean Water Act requires states to consider the development of a Total Maximum Daily Load (TMDL) or some other pollution control strategy to reduce the input of the specific pollutant(s) that restrict waterbody uses. The current restoration strategy for the upper Mohawk River includes requiring Oneida County to eliminate the SSO at the Sauquoit Creek Pumping Station and requiring the City of Utica to implement a CSO LTCP. Both projects are being coordinated together and scheduled to be completed in 2021. Dry weather sampling results indicate that additional sources of pollution may be contributing to fecal coliform levels in the upper Mohawk River such that fecal coliform standards may not be

27.
fully achieved, even after the elimination of the SSO and implementation of the CSO LTCP. Therefore, in order to fulfill the requirements of the Clean Water Act, a TMDL must be developed for Portions 12 and 13 of the Mohawk River. TMDL is the maximum pollutant loading that a waterbody can receive without violating water quality standards. It is the sum of nonpoint-source pollutant loads and natural background conditions (load allocations or LA), plus point-source pollutant loads (waste load allocations or WLA), plus a margin of safety (MOS). TMDL can be represented by the following formula:
TMDL = ΣLA + ΣWLA + MOS where:
TMDL = Total Daily Maximum Load: The maximum pollutant loading that a waterbody can receive without violating water quality standards.
LA = Load Allocation: The portion of TMDL allocated to nonpoint sources of pollutants and natural background conditions.
WLA = Waste Load Allocation: The portion of TMDL allocated to point sources of pollutants.
MOS = Margin of Safety: The portion of TMDL allocated to the uncertainty about the relationship between pollutant loads and receiving water quality.
One of the challenges in developing a TMDL is establishing the linkage between water quality and pollutant sources. Analytical methods for linking water quality and pollutant sources must be scientifically based and often involves water quality modeling. Methods used must be appropriate for the waterbody, the number and type of pollutant sources, and must produce justifiable results. Pollutant sources contributing to impairment must also be clearly identified and quantified in order to establish the linkage to water quality. In addition to known sources, such as CSOs, SSOs and urban stormwater, sampling results indicate additional unidentified sources between the two monitoring stations are contributing to high fecal coliform levels during periods of dry weather. Additional data may be needed to identify these unknown sources. A coliform track down study and microbial source tracking (MST) could be useful in identifying additional pollutant sources. It is recommended that additional monitoring be considered only after a screening-level analysis is performed and its results indicate the need for additional data. EPA estimates of TMDL development costs for a watershed area of 570 square miles range from $350,000 to $1,000,000 (2012 Dollars), depending on factors such as the complexity of the methodology/modeling used, additional data needs, and the number and type of pollutant sources (USEPA, 1996).

28.
9. REFERENCES Census, 2001. Census 2000, Census Blocks, New York State (Shapefile : 2001). U.S. Department of Commerce, U.S. Census Bureau, Geography Division, Washington D.C. City of Utica, 2010. Combined Sewer Overflows Long-Term Control Plan. Prepared by Shumaker Engineering and Land Surveying, P.C., Stearns and Wheeler, LLC. City of Utica, Utica, NY. July 2010. Joint Municipal Survey Committee, 1964. Comprehensive Sewerage Study for Utica Area. Prepared by Hazen and Sawyer Engineers. Joint Municipal Survey Committee of Utica, New York Mills, Yorkville, Whitesboro and Whitestown, Utica, NY. July 1964. NOAA, 2002. Climatography of the United States, No. 81, Monthly Station Normals of Temperature, Precipitation, and Heating and Cooling Degree Days, 1971 – 2000, 30 New York. National Oceanic and Atmospheric Administration, National Climatic Data Center, Asheville, NC. February 2002. NOAA, 2012a. Record of River and Climatological Observations, Delta Dam (Station 30-2047-06). National Oceanic and Atmospheric Administration, National Climatic Data Center, Asheville, NC. www.ncdc.noaa.gov. www.ncdc.noaa.gov. Accessed October 31, 2012. NOAA, 2012b. Quality Controlled Local Climatological Data, Hourly Precipitation Table, Griffiss Airfield (Station 64775), Rome, New York. National Oceanic and Atmospheric Administration, National Climatic Data Center, Asheville, NC. www.ncdc.noaa.gov. Accessed December 4, 2012. NYSDEC, 2010. 2010 Mohawk River Basin Waterbody Inventory and Priority Waterbodies List. New York State Department of Environmental Conservation, Division of Water, Bureau of Watershed Assessment and Management, Albany, NY. July 2010. NYSDEC, 2012. New York State 2012 Section 303(d) List of Impaired Waters Requiring a TMDL/Other Strategy. New York State Department of Environmental Conservation, Division of Water, Bureau of Watershed Assessment and Management, Albany, NY. NYSDOH, 2012. Health Advice on Eating Sportfish and Game. New York State Department of Health, Albany, NY. October 2012. Oneida County, 2010. Sauquoit Creek Pumping Station Sanitary Sewer Overflow Mitigation Plan, Oneida County Sewer District. Prepared by Shumaker Consulting Engineering and Land Surveying, P.C., Stearns and Wheeler, LLC, Brown and Caldwell. Oneida County Department of Water Quality and Water Pollution Control, Utica, NY. July 7, 2010. Smith, C.L., 1985. The Inland Fishes of New York State. New York State Department of Environmental Conservation, Albany, NY.

29.
USEPA, 1993. Preventing Waterborne Disease: A Focus on EPA's Research. EPA EPA/640/K-93/001. U. S. Environmental Protection Agency, Office of Research and Development, Washington, D.C. April 1993. USEPA, 1996. TMDL Development Cost Estimates: Case Studies of 14 TMDLs. EPA 841/R-96-001. U. S. Environmental Protection Agency, Office of Water, Washington, D.C. May 1996. USEPA, 1997. Volunteer Stream Monitoring: A Methods Manual. EPA 841/B-97-003. U. S. Environmental Protection Agency, Office of Water, Washington, D.C. November 1997. USEPA, 2004. Report to Congress, Impacts and Control of CSOs and SSOs. EPA 833/R-04-001. U. S. Environmental Protection Agency, Office of Water, Washington, D.C. August 2004.

30.
APPENDIX A. MONITORING RESULTS
2012 Upper Mohawk River Coliform Monitoring Project
Station ID Station Name Date Time Parameter Result Units Analytical Method Lab Name 12010101 Mohawk River in West Schuyler 06/12/2012 0830 Dissolved Oxygen 8.3 mg/L DEC-Field DEC-Field12010101 Mohawk River in West Schuyler 06/12/2012 0830 Specific Conductance 504 umhos/cm DEC-Field DEC-Field12010101 Mohawk River in West Schuyler 06/12/2012 0830 pH 6.5 SU DEC-Field DEC-Field12010101 Mohawk River in West Schuyler 06/12/2012 0830 Temperature 20.5 Deg C. DEC-Field DEC-Field12010101 Mohawk River in West Schuyler 06/12/2012 0830 Fecal Coliform 1,300 MPN/100mL SM 18 9221-E Verona Laboratory 12010101 Mohawk River in West Schuyler 06/12/2012 0830 Total Coliform 4,700 CFU/100mL SM 18 9222-B Verona Laboratory 12010101 Mohawk River in West Schuyler 06/12/2012 0830 Stream Flow 463 cfs DEC-Field DEC-Field12010101 Mohawk River in West Schuyler 06/12/2012 0830 Gage Height 11.80 ft DEC-Field DEC-Field12010116 Mohawk River near Oriskany 06/12/2012 1030 Dissolved Oxygen 8.5 mg/L DEC-Field DEC-Field12010116 Mohawk River near Oriskany 06/12/2012 1030 Specific Conductance 287 umhos/cm DEC-Field DEC-Field12010116 Mohawk River near Oriskany 06/12/2012 1030 pH 6.7 SU DEC-Field DEC-Field12010116 Mohawk River near Oriskany 06/12/2012 1030 Temperature 19.6 Deg C. DEC-Field DEC-Field12010116 Mohawk River near Oriskany 06/12/2012 1030 Fecal Coliform 130 MPN/100mL SM 18 9221-E Verona Laboratory 12010116 Mohawk River near Oriskany 06/12/2012 1030 Total Coliform 5,400 CFU/100mL SM 18 9222-B Verona Laboratory 12010101 Mohawk River in West Schuyler 06/14/2012 0900 Dissolved Oxygen 8.9 mg/L DEC-Field DEC-Field12010101 Mohawk River in West Schuyler 06/14/2012 0900 Specific Conductance 431 umhos/cm DEC-Field DEC-Field12010101 Mohawk River in West Schuyler 06/14/2012 0900 pH 6.6 SU DEC-Field DEC-Field12010101 Mohawk River in West Schuyler 06/14/2012 0900 Temperature 18.5 Deg C. DEC-Field DEC-Field12010101 Mohawk River in West Schuyler 06/14/2012 0900 Fecal Coliform 2,400 MPN/100mL SM 18 9221-E Verona Laboratory 12010101 Mohawk River in West Schuyler 06/14/2012 0900 Total Coliform 5,700 CFU/100mL SM 18 9222-B Verona Laboratory 12010101 Mohawk River in West Schuyler 06/14/2012 0900 Stream Flow 759 cfs DEC-Field DEC-Field12010101 Mohawk River in West Schuyler 06/14/2012 0900 Gage Height 12.45 ft DEC-Field DEC-Field12010116 Mohawk River near Oriskany 06/14/2012 0945 Dissolved Oxygen 9.5 mg/L DEC-Field DEC-Field12010116 Mohawk River near Oriskany 06/14/2012 0945 Specific Conductance 256 umhos/cm DEC-Field DEC-Field12010116 Mohawk River near Oriskany 06/14/2012 0945 pH 6.6 SU DEC-Field DEC-Field12010116 Mohawk River near Oriskany 06/14/2012 0945 Temperature 17.5 Deg C. DEC-Field DEC-Field12010116 Mohawk River near Oriskany 06/14/2012 0945 Fecal Coliform 2,400 MPN/100mL SM 18 9221-E Verona Laboratory 12010116 Mohawk River near Oriskany 06/14/2012 0945 Total Coliform 3,900 CFU/100mL SM 18 9222-B Verona Laboratory

31.
APPENDIX A. MONITORING RESULTS
2012 Upper Mohawk River Coliform Monitoring Project
Station ID Station Name Date Time Parameter Result Units Analytical Method Lab Name 12010101 Mohawk River in West Schuyler 06/21/2012 0800 Dissolved Oxygen 7.7 mg/L DEC-Field DEC-Field12010101 Mohawk River in West Schuyler 06/21/2012 0800 Conductivity 506 umhos/cm DEC-Field DEC-Field12010101 Mohawk River in West Schuyler 06/21/2012 0800 pH 7.4 SU DEC-Field DEC-Field12010101 Mohawk River in West Schuyler 06/21/2012 0800 Temperature 22.4 Deg C. DEC-Field DEC-Field12010101 Mohawk River in West Schuyler 06/21/2012 0800 Fecal Coliform 300 MPN/100mL SM 18 9221-E Verona Laboratory 12010101 Mohawk River in West Schuyler 06/21/2012 0800 Total Coliform 1,400 CFU/100mL SM 18 9222-B Verona Laboratory 12010101 Mohawk River in West Schuyler 06/21/2012 0800 Stream Flow 357 cfs DEC-Field DEC-Field12010101 Mohawk River in West Schuyler 06/21/2012 0800 Gage Height 11.58 ft DEC-Field DEC-Field12010116 Mohawk River near Oriskany 06/21/2012 0830 Dissolved Oxygen 6.6 mg/L DEC-Field DEC-Field12010116 Mohawk River near Oriskany 06/21/2012 0830 Specific Conductance 288 umhos/cm DEC-Field DEC-Field12010116 Mohawk River near Oriskany 06/21/2012 0830 pH 7.3 SU DEC-Field DEC-Field12010116 Mohawk River near Oriskany 06/21/2012 0830 Temperature 22.4 Deg C. DEC-Field DEC-Field12010116 Mohawk River near Oriskany 06/21/2012 0830 Fecal Coliform 130 MPN/100mL SM 18 9221-E Verona Laboratory 12010116 Mohawk River near Oriskany 06/21/2012 0830 Total Coliform 880 CFU/100mL SM 18 9222-B Verona Laboratory 12010101 Mohawk River in West Schuyler 06/26/2012 0815 Dissolved Oxygen 8.1 mg/L DEC-Field DEC-Field12010101 Mohawk River in West Schuyler 06/26/2012 0815 Specific Conductance 466 umhos/cm DEC-Field DEC-Field12010101 Mohawk River in West Schuyler 06/26/2012 0815 pH 7.6 SU DEC-Field DEC-Field12010101 Mohawk River in West Schuyler 06/26/2012 0815 Temperature 20.9 Deg C. DEC-Field DEC-Field12010101 Mohawk River in West Schuyler 06/26/2012 0815 Fecal Coliform 500 MPN/100mL SM 18 9221-E Verona Laboratory 12010101 Mohawk River in West Schuyler 06/26/2012 0815 Total Coliform 3,900 CFU/100mL SM 18 9222-B Verona Laboratory 12010101 Mohawk River in West Schuyler 06/26/2012 0815 Stream Flow 489 cfs DEC-Field DEC-Field12010101 Mohawk River in West Schuyler 06/26/2012 0815 Gage Height 11.85 ft DEC-Field DEC-Field12010116 Mohawk River near Oriskany 06/26/2012 0900 Dissolved Oxygen 8.5 mg/L DEC-Field DEC-Field12010116 Mohawk River near Oriskany 06/26/2012 0900 Specific Conductance 248 umhos/cm DEC-Field DEC-Field12010116 Mohawk River near Oriskany 06/26/2012 0900 pH 7.5 SU DEC-Field DEC-Field12010116 Mohawk River near Oriskany 06/26/2012 0900 Temperature 19.4 Deg C. DEC-Field DEC-Field12010116 Mohawk River near Oriskany 06/26/2012 0900 Fecal Coliform 140 MPN/100mL SM 18 9221-E Verona Laboratory 12010116 Mohawk River near Oriskany 06/26/2012 0900 Total Coliform 1,500 CFU/100mL SM 18 9222-B Verona Laboratory

32.
APPENDIX A. MONITORING RESULTS
2012 Upper Mohawk River Coliform Monitoring Project
Station ID Station Name Date Time Parameter Result Units Analytical Method Lab Name 12010101 Mohawk River in West Schuyler 06/28/2012 0800 Dissolved Oxygen 8.6 mg/L DEC-Field DEC-Field12010101 Mohawk River in West Schuyler 06/28/2012 0800 Specific Conductance 444 umhos/cm DEC-Field DEC-Field12010101 Mohawk River in West Schuyler 06/28/2012 0800 pH 7.4 SU DEC-Field DEC-Field12010101 Mohawk River in West Schuyler 06/28/2012 0800 Temperature 19.6 Deg C. DEC-Field DEC-Field12010101 Mohawk River in West Schuyler 06/28/2012 0800 Fecal Coliform 1,300 MPN/100mL SM 18 9221-E Verona Laboratory 12010101 Mohawk River in West Schuyler 06/28/2012 0800 Total Coliform 4,000 CFU/100mL SM 18 9222-B Verona Laboratory 12010101 Mohawk River in West Schuyler 06/28/2012 0800 Stream Flow 716 cfs DEC-Field DEC-Field12010101 Mohawk River in West Schuyler 06/28/2012 0800 Gage Height 12.35 ft DEC-Field DEC-Field12010116 Mohawk River near Oriskany 06/28/2012 0830 Dissolved Oxygen 8.7 mg/L DEC-Field DEC-Field12010116 Mohawk River near Oriskany 06/28/2012 0830 Specific Conductance 245 umhos/cm DEC-Field DEC-Field12010116 Mohawk River near Oriskany 06/28/2012 0830 pH 7.5 SU DEC-Field DEC-Field12010116 Mohawk River near Oriskany 06/28/2012 0830 Temperature 19.0 Deg C. DEC-Field DEC-Field12010116 Mohawk River near Oriskany 06/28/2012 0830 Fecal Coliform 110 MPN/100mL SM 18 9221-E Verona Laboratory 12010116 Mohawk River near Oriskany 06/28/2012 0830 Total Coliform 1,600 CFU/100mL SM 18 9222-B Verona Laboratory 12010101 Mohawk River in West Schuyler 07/02/2012 0830 Dissolved Oxygen 7.3 mg/L DEC-Field DEC-Field12010101 Mohawk River in West Schuyler 07/02/2012 0830 Specific Conductance 421 umhos/cm DEC-Field DEC-Field12010101 Mohawk River in West Schuyler 07/02/2012 0830 pH 7.3 SU DEC-Field DEC-Field12010101 Mohawk River in West Schuyler 07/02/2012 0830 Temperature 23.3 Deg C. DEC-Field DEC-Field12010101 Mohawk River in West Schuyler 07/02/2012 0830 Fecal Coliform 500 MPN/100mL SM 18 9221-E Verona Laboratory 12010101 Mohawk River in West Schuyler 07/02/2012 0830 Total Coliform 3,100 CFU/100mL SM 18 9222-B Verona Laboratory 12010101 Mohawk River in West Schuyler 07/02/2012 0830 Stream Flow 370 cfs DEC-Field DEC-Field12010101 Mohawk River in West Schuyler 07/02/2012 0830 Gage Height 11.61 ft DEC-Field DEC-Field12010116 Mohawk River near Oriskany 07/02/2012 1000 Dissolved Oxygen 8.1 mg/L DEC-Field DEC-Field12010116 Mohawk River near Oriskany 07/02/2012 1000 Specific Conductance 259 umhos/cm DEC-Field DEC-Field12010116 Mohawk River near Oriskany 07/02/2012 1000 pH 7.6 SU DEC-Field DEC-Field12010116 Mohawk River near Oriskany 07/02/2012 1000 Temperature 21.7 Deg C. DEC-Field DEC-Field12010116 Mohawk River near Oriskany 07/02/2012 1000 Fecal Coliform 80 MPN/100mL SM 18 9221-E Verona Laboratory 12010116 Mohawk River near Oriskany 07/02/2012 1000 Total Coliform 3,000 CFU/100mL SM 18 9222-B Verona Laboratory

33.
APPENDIX A. MONITORING RESULTS
2012 Upper Mohawk River Coliform Monitoring Project
Station ID Station Name Date Time Parameter Result Units Analytical Method Lab Name 12010101 Mohawk River in West Schuyler 07/13/2012 0800 Dissolved Oxygen 7.3 mg/L DEC-Field DEC-Field12010101 Mohawk River in West Schuyler 07/13/2012 0800 Specific Conductance 426 umhos/cm DEC-Field DEC-Field12010101 Mohawk River in West Schuyler 07/13/2012 0800 pH 7.6 SU DEC-Field DEC-Field12010101 Mohawk River in West Schuyler 07/13/2012 0800 Temperature 23.6 Deg C. DEC-Field DEC-Field12010101 Mohawk River in West Schuyler 07/13/2012 0800 Fecal Coliform 300 MPN/100mL SM 18 9221-E Verona Laboratory 12010101 Mohawk River in West Schuyler 07/13/2012 0800 Total Coliform 2,600 CFU/100mL SM 18 9222-B Verona Laboratory 12010101 Mohawk River in West Schuyler 07/13/2012 0800 Stream Flow 336 cfs DEC-Field DEC-Field12010101 Mohawk River in West Schuyler 07/13/2012 0800 Gage Height 11.54 ft DEC-Field DEC-Field12010116 Mohawk River near Oriskany 07/13/2012 0845 Dissolved Oxygen 7.9 mg/L DEC-Field DEC-Field12010116 Mohawk River near Oriskany 07/13/2012 0845 Specific Conductance 213 umhos/cm DEC-Field DEC-Field12010116 Mohawk River near Oriskany 07/13/2012 0845 pH 7.6 SU DEC-Field DEC-Field12010116 Mohawk River near Oriskany 07/13/2012 0845 Temperature 22.6 Deg C. DEC-Field DEC-Field12010116 Mohawk River near Oriskany 07/13/2012 0845 Fecal Coliform 300 MPN/100mL SM 18 9221-E Verona Laboratory 12010116 Mohawk River near Oriskany 07/13/2012 0845 Total Coliform 3,200 CFU/100mL SM 18 9222-B Verona Laboratory 12010101 Mohawk River in West Schuyler 07/17/2012 0800 Dissolved Oxygen 6.4 mg/L DEC-Field DEC-Field12010101 Mohawk River in West Schuyler 07/17/2012 0800 Specific Conductance 409 umhos/cm DEC-Field DEC-Field12010101 Mohawk River in West Schuyler 07/17/2012 0800 pH 7.4 SU DEC-Field DEC-Field12010101 Mohawk River in West Schuyler 07/17/2012 0800 Temperature 24.8 Deg C. DEC-Field DEC-Field12010101 Mohawk River in West Schuyler 07/17/2012 0800 Fecal Coliform 300 MPN/100mL SM 18 9221-E Verona Laboratory 12010101 Mohawk River in West Schuyler 07/17/2012 0800 Total Coliform 2,800 CFU/100mL SM 18 9222-B Verona Laboratory 12010101 Mohawk River in West Schuyler 07/17/2012 0800 Stream Flow 336 cfs DEC-Field DEC-Field12010101 Mohawk River in West Schuyler 07/17/2012 0800 Gage Height 11.54 ft DEC-Field DEC-Field12010116 Mohawk River near Oriskany 07/17/2012 0845 Dissolved Oxygen 7.6 mg/L DEC-Field DEC-Field12010116 Mohawk River near Oriskany 07/17/2012 0845 Specific Conductance 238 umhos/cm DEC-Field DEC-Field12010116 Mohawk River near Oriskany 07/17/2012 0845 pH 7.6 SU DEC-Field DEC-Field12010116 Mohawk River near Oriskany 07/17/2012 0845 Temperature 22.8 Deg C. DEC-Field DEC-Field12010116 Mohawk River near Oriskany 07/17/2012 0845 Fecal Coliform 1,100 MPN/100mL SM 18 9221-E Verona Laboratory 12010116 Mohawk River near Oriskany 07/17/2012 0845 Total Coliform 3,500 CFU/100mL SM 18 9222-B Verona Laboratory

34.
APPENDIX A. MONITORING RESULTS
2012 Upper Mohawk River Coliform Monitoring Project
Station ID Station Name Date Time Parameter Result Units Analytical Method Lab Name 12010101 Mohawk River in West Schuyler 07/19/2012 0800 Dissolved Oxygen 6.5 mg/L DEC-Field DEC-Field12010101 Mohawk River in West Schuyler 07/19/2012 0800 Specific Conductance 435 umhos/cm DEC-Field DEC-Field12010101 Mohawk River in West Schuyler 07/19/2012 0800 pH 7.6 SU DEC-Field DEC-Field12010101 Mohawk River in West Schuyler 07/19/2012 0800 Temperature 24.4 Deg C. DEC-Field DEC-Field12010101 Mohawk River in West Schuyler 07/19/2012 0800 Fecal Coliform 230 MPN/100mL SM 18 9221-E Verona Laboratory 12010101 Mohawk River in West Schuyler 07/19/2012 0800 Total Coliform 2,700 CFU/100mL SM 18 9222-B Verona Laboratory 12010101 Mohawk River in West Schuyler 07/19/2012 0800 Stream Flow 330 cfs DEC-Field DEC-Field12010101 Mohawk River in West Schuyler 07/19/2012 0800 Gage Height 11.53 ft DEC-Field DEC-Field12010116 Mohawk River near Oriskany 07/19/2012 0830 Dissolved Oxygen 7.7 mg/L DEC-Field DEC-Field12010116 Mohawk River near Oriskany 07/19/2012 0830 Specific Conductance 220 umhos/cm DEC-Field DEC-Field12010116 Mohawk River near Oriskany 07/19/2012 0830 pH 7.3 SU DEC-Field DEC-Field12010116 Mohawk River near Oriskany 07/19/2012 0830 Temperature 22.4 Deg C. DEC-Field DEC-Field12010116 Mohawk River near Oriskany 07/19/2012 0830 Fecal Coliform 170 MPN/100mL SM 18 9221-E Verona Laboratory 12010116 Mohawk River near Oriskany 07/19/2012 0830 Total Coliform 3,100 CFU/100mL SM 18 9222-B Verona Laboratory 12010101 Mohawk River in West Schuyler 07/24/2012 0800 Dissolved Oxygen 6.7 mg/L DEC-Field DEC-Field12010101 Mohawk River in West Schuyler 07/24/2012 0800 Specific Conductance 410 umhos/cm DEC-Field DEC-Field12010101 Mohawk River in West Schuyler 07/24/2012 0800 pH 7.1 SU DEC-Field DEC-Field12010101 Mohawk River in West Schuyler 07/24/2012 0800 Temperature 24.0 Deg C. DEC-Field DEC-Field12010101 Mohawk River in West Schuyler 07/24/2012 0800 Fecal Coliform 16,000 MPN/100mL SM 18 9221-E Verona Laboratory 12010101 Mohawk River in West Schuyler 07/24/2012 0800 Total Coliform TNC CFU/100mL SM 18 9222-B Verona Laboratory 12010101 Mohawk River in West Schuyler 07/24/2012 0800 Stream Flow 716 cfs DEC-Field DEC-Field12010101 Mohawk River in West Schuyler 07/24/2012 0800 Gage Height 12.35 ft DEC-Field DEC-Field12010116 Mohawk River near Oriskany 07/24/2012 0845 Dissolved Oxygen 8.3 mg/L DEC-Field DEC-Field12010116 Mohawk River near Oriskany 07/24/2012 0845 Specific Conductance 216 umhos/cm DEC-Field DEC-Field12010116 Mohawk River near Oriskany 07/24/2012 0845 pH 7.1 SU DEC-Field DEC-Field12010116 Mohawk River near Oriskany 07/24/2012 0845 Temperature 23.0 Deg C. DEC-Field DEC-Field12010116 Mohawk River near Oriskany 07/24/2012 0845 Fecal Coliform 1,700 MPN/100mL SM 18 9221-E Verona Laboratory 12010116 Mohawk River near Oriskany 07/24/2012 0845 Total Coliform 230 CFU/100mL SM 18 9222-B Verona Laboratory

35.
APPENDIX A. MONITORING RESULTS
2012 Upper Mohawk River Coliform Monitoring Project
Station ID Station Name Date Time Parameter Result Units Analytical Method Lab Name 12010101 Mohawk River in West Schuyler 07/26/2012 0800 Dissolved Oxygen 7.4 mg/L DEC-Field DEC-Field12010101 Mohawk River in West Schuyler 07/26/2012 0800 Specific Conductance 418 umhos/cm DEC-Field DEC-Field12010101 Mohawk River in West Schuyler 07/26/2012 0800 pH 7.4 SU DEC-Field DEC-Field12010101 Mohawk River in West Schuyler 07/26/2012 0800 Temperature 23.4 Deg C. DEC-Field DEC-Field12010101 Mohawk River in West Schuyler 07/26/2012 0800 Fecal Coliform 800 MPN/100mL SM 18 9221-E Verona Laboratory 12010101 Mohawk River in West Schuyler 07/26/2012 0800 Total Coliform 5,700 CFU/100mL SM 18 9222-B Verona Laboratory 12010101 Mohawk River in West Schuyler 07/26/2012 0800 Stream Flow 350 cfs DEC-Field DEC-Field12010101 Mohawk River in West Schuyler 07/26/2012 0800 Gage Height 11.56 ft DEC-Field DEC-Field12010116 Mohawk River near Oriskany 07/26/2012 0845 Dissolved Oxygen 8.2 mg/L DEC-Field DEC-Field12010116 Mohawk River near Oriskany 07/26/2012 0845 Specific Conductance 236 umhos/cm DEC-Field DEC-Field12010116 Mohawk River near Oriskany 07/26/2012 0845 pH 7.3 SU DEC-Field DEC-Field12010116 Mohawk River near Oriskany 07/26/2012 0845 Temperature 22.2 Deg C. DEC-Field DEC-Field12010116 Mohawk River near Oriskany 07/26/2012 0845 Fecal Coliform 230 MPN/100mL SM 18 9221-E Verona Laboratory 12010116 Mohawk River near Oriskany 07/26/2012 0845 Total Coliform 3,300 CFU/100mL SM 18 9222-B Verona Laboratory 12010101 Mohawk River in West Schuyler 08/06/2012 0815 Dissolved Oxygen 6.6 mg/L DEC-Field DEC-Field12010101 Mohawk River in West Schuyler 08/06/2012 0815 Specific Conductance 449 umhos/cm DEC-Field DEC-Field12010101 Mohawk River in West Schuyler 08/06/2012 0815 pH 7.1 SU DEC-Field DEC-Field12010101 Mohawk River in West Schuyler 08/06/2012 0815 Temperature 25.0 Deg C. DEC-Field DEC-Field12010101 Mohawk River in West Schuyler 08/06/2012 0815 Fecal Coliform 16,000 MPN/100mL SM 18 9221-E Verona Laboratory 12010101 Mohawk River in West Schuyler 08/06/2012 0815 Total Coliform 17,000 CFU/100mL SM 18 9222-B Verona Laboratory 12010101 Mohawk River in West Schuyler 08/06/2012 0815 Stream Flow 514 cfs DEC-Field DEC-Field12010101 Mohawk River in West Schuyler 08/06/2012 0815 Gage Height 11.91 ft DEC-Field DEC-Field12010116 Mohawk River near Oriskany 08/06/2012 0900 Dissolved Oxygen 7.3 mg/L DEC-Field DEC-Field12010116 Mohawk River near Oriskany 08/06/2012 0900 Specific Conductance 239 umhos/cm DEC-Field DEC-Field12010116 Mohawk River near Oriskany 08/06/2012 0900 pH 7.4 SU DEC-Field DEC-Field12010116 Mohawk River near Oriskany 08/06/2012 0900 Temperature 24.0 Deg C. DEC-Field DEC-Field12010116 Mohawk River near Oriskany 08/06/2012 0900 Fecal Coliform 230 MPN/100mL SM 18 9221-E Verona Laboratory 12010116 Mohawk River near Oriskany 08/06/2012 0900 Total Coliform 5,700 CFU/100mL SM 18 9222-B Verona Laboratory

36.
APPENDIX A. MONITORING RESULTS
2012 Upper Mohawk River Coliform Monitoring Project
Station ID Station Name Date Time Parameter Result Units Analytical Method Lab Name 12010101 Mohawk River in West Schuyler 08/09/2012 0800 Dissolved Oxygen 7.3 mg/L DEC-Field DEC-Field12010101 Mohawk River in West Schuyler 08/09/2012 0800 Specific Conductance 468 umhos/cm DEC-Field DEC-Field12010101 Mohawk River in West Schuyler 08/09/2012 0800 pH 7.2 SU DEC-Field DEC-Field12010101 Mohawk River in West Schuyler 08/09/2012 0800 Temperature 24.0 Deg C. DEC-Field DEC-Field12010101 Mohawk River in West Schuyler 08/09/2012 0800 Fecal Coliform 1,300 MPN/100mL SM 18 9221-E Verona Laboratory 12010101 Mohawk River in West Schuyler 08/09/2012 0800 Total Coliform 3,300 CFU/100mL SM 18 9222-B Verona Laboratory 12010101 Mohawk River in West Schuyler 08/09/2012 0800 Stream Flow 302 cfs DEC-Field DEC-Field12010101 Mohawk River in West Schuyler 08/09/2012 0800 Gage Height 11.49 ft DEC-Field DEC-Field12010116 Mohawk River near Oriskany 08/09/2012 0845 Dissolved Oxygen 7.1 mg/L DEC-Field DEC-Field12010116 Mohawk River near Oriskany 08/09/2012 0845 Specific Conductance 213 umhos/cm DEC-Field DEC-Field12010116 Mohawk River near Oriskany 08/09/2012 0845 pH 7.3 SU DEC-Field DEC-Field12010116 Mohawk River near Oriskany 08/09/2012 0845 Temperature 23.0 Deg C. DEC-Field DEC-Field12010116 Mohawk River near Oriskany 08/09/2012 0845 Fecal Coliform 170 MPN/100mL SM 18 9221-E Verona Laboratory 12010116 Mohawk River near Oriskany 08/09/2012 0845 Total Coliform 2,400 CFU/100mL SM 18 9222-B Verona Laboratory 12010101 Mohawk River in West Schuyler 08/16/2012 0800 Dissolved Oxygen 7.5 mg/L DEC-Field DEC-Field12010101 Mohawk River in West Schuyler 08/16/2012 0800 Specific Conductance 455 umhos/cm DEC-Field DEC-Field12010101 Mohawk River in West Schuyler 08/16/2012 0800 pH 7.2 SU DEC-Field DEC-Field12010101 Mohawk River in West Schuyler 08/16/2012 0800 Temperature 22.0 Deg C. DEC-Field DEC-Field12010101 Mohawk River in West Schuyler 08/16/2012 0800 Fecal Coliform 300 MPN/100mL SM 18 9221-E Verona Laboratory 12010101 Mohawk River in West Schuyler 08/16/2012 0800 Total Coliform 3,500 CFU/100mL SM 18 9222-B Verona Laboratory 12010101 Mohawk River in West Schuyler 08/16/2012 0800 Stream Flow 476 cfs DEC-Field DEC-Field12010101 Mohawk River in West Schuyler 08/16/2012 0800 Gage Height 11.83 ft DEC-Field DEC-Field12010116 Mohawk River near Oriskany 08/16/2012 0900 Dissolved Oxygen 7.6 mg/L DEC-Field DEC-Field12010116 Mohawk River near Oriskany 08/16/2012 0900 Specific Conductance 260 umhos/cm DEC-Field DEC-Field12010116 Mohawk River near Oriskany 08/16/2012 0900 pH 7.5 SU DEC-Field DEC-Field12010116 Mohawk River near Oriskany 08/16/2012 0900 Temperature 22.0 Deg C. DEC-Field DEC-Field12010116 Mohawk River near Oriskany 08/16/2012 0900 Fecal Coliform 300 MPN/100mL SM 18 9221-E Verona Laboratory 12010116 Mohawk River near Oriskany 08/16/2012 0900 Total Coliform 2,900 CFU/100mL SM 18 9222-B Verona Laboratory

37.
APPENDIX A. MONITORING RESULTS
2012 Upper Mohawk River Coliform Monitoring Project
Station ID Station Name Date Time Parameter Result Units Analytical Method Lab Name 12010101 Mohawk River in West Schuyler 08/21/2012 0800 Dissolved Oxygen 8.3 mg/L DEC-Field DEC-Field12010101 Mohawk River in West Schuyler 08/21/2012 0800 Specific Conductance 454 umhos/cm DEC-Field DEC-Field12010101 Mohawk River in West Schuyler 08/21/2012 0800 pH 7.2 SU DEC-Field DEC-Field12010101 Mohawk River in West Schuyler 08/21/2012 0800 Temperature 21.2 Deg C. DEC-Field DEC-Field12010101 Mohawk River in West Schuyler 08/21/2012 0800 Fecal Coliform 3,000 MPN/100mL SM 18 9221-E Verona Laboratory 12010101 Mohawk River in West Schuyler 08/21/2012 0800 Total Coliform 3,700 CFU/100mL SM 18 9222-B Verona Laboratory 12010101 Mohawk River in West Schuyler 08/21/2012 0800 Stream Flow 288 cfs DEC-Field DEC-Field12010101 Mohawk River in West Schuyler 08/21/2012 0800 Gage Height 11.47 ft DEC-Field DEC-Field12010116 Mohawk River near Oriskany 08/21/2012 0900 Dissolved Oxygen 8.9 mg/L DEC-Field DEC-Field12010116 Mohawk River near Oriskany 08/21/2012 0900 Specific Conductance 293 umhos/cm DEC-Field DEC-Field12010116 Mohawk River near Oriskany 08/21/2012 0900 pH 7.4 SU DEC-Field DEC-Field12010116 Mohawk River near Oriskany 08/21/2012 0900 Temperature 21.1 Deg C. DEC-Field DEC-Field12010116 Mohawk River near Oriskany 08/21/2012 0900 Fecal Coliform 110 MPN/100mL SM 18 9221-E Verona Laboratory 12010116 Mohawk River near Oriskany 08/21/2012 0900 Total Coliform 2,700 CFU/100mL SM 18 9222-B Verona Laboratory 12010101 Mohawk River in West Schuyler 08/23/2012 0815 Dissolved Oxygen 8.5 mg/L DEC-Field DEC-Field12010101 Mohawk River in West Schuyler 08/23/2012 0815 Specific Conductance 469 umhos/cm DEC-Field DEC-Field12010101 Mohawk River in West Schuyler 08/23/2012 0815 pH 7.1 SU DEC-Field DEC-Field12010101 Mohawk River in West Schuyler 08/23/2012 0815 Temperature 21.3 Deg C. DEC-Field DEC-Field12010101 Mohawk River in West Schuyler 08/23/2012 0815 Fecal Coliform 2,400 MPN/100mL SM 18 9221-E Verona Laboratory 12010101 Mohawk River in West Schuyler 08/23/2012 0815 Total Coliform 2,600 CFU/100mL SM 18 9222-B Verona Laboratory 12010101 Mohawk River in West Schuyler 08/23/2012 0815 Stream Flow 232 cfs DEC-Field DEC-Field12010101 Mohawk River in West Schuyler 08/23/2012 0815 Gage Height 11.39 ft DEC-Field DEC-Field12010116 Mohawk River near Oriskany 08/23/2012 0900 Dissolved Oxygen 8.6 mg/L DEC-Field DEC-Field12010116 Mohawk River near Oriskany 08/23/2012 0900 Specific Conductance 270 umhos/cm DEC-Field DEC-Field12010116 Mohawk River near Oriskany 08/23/2012 0900 pH 7.3 SU DEC-Field DEC-Field12010116 Mohawk River near Oriskany 08/23/2012 0900 Temperature 20.9 Deg C. DEC-Field DEC-Field12010116 Mohawk River near Oriskany 08/23/2012 0900 Fecal Coliform 110 MPN/100mL SM 18 9221-E Verona Laboratory 12010116 Mohawk River near Oriskany 08/23/2012 0900 Total Coliform 2,200 CFU/100mL SM 18 9222-B Verona Laboratory

38.
APPENDIX A. MONITORING RESULTS
2012 Upper Mohawk River Coliform Monitoring Project
Station ID Station Name Date Time Parameter Result Units Analytical Method Lab Name 12010101 Mohawk River in West Schuyler 09/05/2012 0900 Dissolved Oxygen 6.3 mg/L DEC-Field DEC-Field12010101 Mohawk River in West Schuyler 09/05/2012 0900 Specific Conductance 480 umhos/cm DEC-Field DEC-Field12010101 Mohawk River in West Schuyler 09/05/2012 0900 pH 7.1 SU DEC-Field DEC-Field12010101 Mohawk River in West Schuyler 09/05/2012 0900 Temperature 22.3 Deg C. DEC-Field DEC-Field12010101 Mohawk River in West Schuyler 09/05/2012 0900 Fecal Coliform 9,000 MPN/100mL SM 18 9221-E Verona Laboratory 12010101 Mohawk River in West Schuyler 09/05/2012 0900 Total Coliform 11,000 CFU/100mL SM 18 9222-B Verona Laboratory 12010101 Mohawk River in West Schuyler 09/05/2012 0900 Stream Flow 390 cfs DEC-Field DEC-Field12010101 Mohawk River in West Schuyler 09/05/2012 1000 Gage Height 11.64 ft DEC-Field DEC-Field12010116 Mohawk River near Oriskany 09/05/2012 1000 Dissolved Oxygen 7.1 mg/L DEC-Field DEC-Field12010116 Mohawk River near Oriskany 09/05/2012 1000 Specific Conductance 259 umhos/cm DEC-Field DEC-Field12010116 Mohawk River near Oriskany 09/05/2012 1000 pH 7.1 SU DEC-Field DEC-Field12010116 Mohawk River near Oriskany 09/05/2012 1000 Temperature 21.8 Deg C. DEC-Field DEC-Field12010116 Mohawk River near Oriskany 09/05/2012 1000 Fecal Coliform 500 MPN/100mL SM 18 9221-E Verona Laboratory 12010116 Mohawk River near Oriskany 09/05/2012 1000 Total Coliform 2,100 CFU/100mL SM 18 9222-B Verona Laboratory 12010101 Mohawk River in West Schuyler 09/13/2012 0815 Dissolved Oxygen 7.4 mg/L DEC-Field DEC-Field12010101 Mohawk River in West Schuyler 09/13/2012 0815 Specific Conductance 452 umhos/cm DEC-Field DEC-Field12010101 Mohawk River in West Schuyler 09/13/2012 0815 pH 7.4 SU DEC-Field DEC-Field12010101 Mohawk River in West Schuyler 09/13/2012 0815 Temperature 18.4 Deg C. DEC-Field DEC-Field12010101 Mohawk River in West Schuyler 09/13/2012 0815 Fecal Coliform 800 MPN/100mL SM 18 9221-E Verona Laboratory 12010101 Mohawk River in West Schuyler 09/13/2012 0815 Total Coliform 1,900 CFU/100mL SM 18 9222-B Verona Laboratory 12010101 Mohawk River in West Schuyler 09/13/2012 0815 Stream Flow 160 cfs DEC-Field DEC-Field12010101 Mohawk River in West Schuyler 09/13/2012 0815 Gage Height 11.29 ft DEC-Field DEC-Field12010116 Mohawk River near Oriskany 09/13/2012 0900 Dissolved Oxygen 7.5 mg/L DEC-Field DEC-Field12010116 Mohawk River near Oriskany 09/13/2012 0900 Specific Conductance 278 umhos/cm DEC-Field DEC-Field12010116 Mohawk River near Oriskany 09/13/2012 0900 pH 7.5 SU DEC-Field DEC-Field12010116 Mohawk River near Oriskany 09/13/2012 0900 Temperature 18.9 Deg C. DEC-Field DEC-Field12010116 Mohawk River near Oriskany 09/13/2012 0900 Fecal Coliform 500 MPN/100mL SM 18 9221-E Verona Laboratory 12010116 Mohawk River near Oriskany 09/13/2012 0900 Total Coliform 1,500 CFU/100mL SM 18 9222-B Verona Laboratory
39.
APPENDIX A. MONITORING RESULTS
2012 Upper Mohawk River Coliform Monitoring Project
Station ID Station Name Date Time Parameter Result Units Analytical Method Lab Name 12010101 Mohawk River in West Schuyler 09/18/2012 0815 Dissolved Oxygen 7.5 mg/L DEC-Field DEC-Field12010101 Mohawk River in West Schuyler 09/18/2012 0815 Specific Conductance 459 umhos/cm DEC-Field DEC-Field12010101 Mohawk River in West Schuyler 09/18/2012 0815 pH 6.6 SU DEC-Field DEC-Field12010101 Mohawk River in West Schuyler 09/18/2012 0815 Temperature 19.3 Deg C. DEC-Field DEC-Field12010101 Mohawk River in West Schuyler 09/18/2012 0815 Fecal Coliform 170 MPN/100mL SM 18 9221-E Verona Laboratory 12010101 Mohawk River in West Schuyler 09/18/2012 0815 Total Coliform 1,700 CFU/100mL SM 18 9222-B Verona Laboratory 12010101 Mohawk River in West Schuyler 09/18/2012 0815 Stream Flow 225 cfs DEC-Field DEC-Field12010101 Mohawk River in West Schuyler 09/18/2012 0815 Gage Height 11.38 ft DEC-Field DEC-Field12010116 Mohawk River near Oriskany 09/18/2012 0900 Dissolved Oxygen 8.1 mg/L DEC-Field DEC-Field12010116 Mohawk River near Oriskany 09/18/2012 0900 Specific Conductance 276 umhos/cm DEC-Field DEC-Field12010116 Mohawk River near Oriskany 09/18/2012 0900 pH 6.8 SU DEC-Field DEC-Field12010116 Mohawk River near Oriskany 09/18/2012 0900 Temperature 18.0 Deg C. DEC-Field DEC-Field12010116 Mohawk River near Oriskany 09/18/2012 0900 Fecal Coliform 500 MPN/100mL SM 18 9221-E Verona Laboratory 12010116 Mohawk River near Oriskany 09/18/2012 0900 Total Coliform 1,300 CFU/100mL SM 18 9222-B Verona Laboratory 12010101 Mohawk River in West Schuyler 09/21/2012 0800 Dissolved Oxygen 8.8 mg/L DEC-Field DEC-Field12010101 Mohawk River in West Schuyler 09/21/2012 0800 Specific Conductance 451 umhos/cm DEC-Field DEC-Field12010101 Mohawk River in West Schuyler 09/21/2012 0800 pH 6.7 SU DEC-Field DEC-Field12010101 Mohawk River in West Schuyler 09/21/2012 0800 Temperature 17.4 Deg C. DEC-Field DEC-Field12010101 Mohawk River in West Schuyler 09/21/2012 0800 Fecal Coliform 2,400 MPN/100mL SM 18 9221-E Verona Laboratory 12010101 Mohawk River in West Schuyler 09/21/2012 0800 Total Coliform 5,000 CFU/100mL SM 18 9222-B Verona Laboratory 12010101 Mohawk River in West Schuyler 09/21/2012 0800 Stream Flow 323 cfs DEC-Field DEC-Field12010101 Mohawk River in West Schuyler 09/21/2012 0800 Gage Height 11.52 ft DEC-Field DEC-Field12010116 Mohawk River near Oriskany 09/21/2012 0830 Dissolved Oxygen 9.6 mg/L DEC-Field DEC-Field12010116 Mohawk River near Oriskany 09/21/2012 0830 Specific Conductance 271 umhos/cm DEC-Field DEC-Field12010116 Mohawk River near Oriskany 09/21/2012 0830 pH 6.7 SU DEC-Field DEC-Field12010116 Mohawk River near Oriskany 09/21/2012 0830 Temperature 17.2 Deg C. DEC-Field DEC-Field12010116 Mohawk River near Oriskany 09/21/2012 0830 Fecal Coliform 230 MPN/100mL SM 18 9221-E Verona Laboratory 12010116 Mohawk River near Oriskany 09/21/2012 0830 Total Coliform 1,600 CFU/100mL SM 18 9222-B Verona Laboratory
40.
APPENDIX A. MONITORING RESULTS
2012 Upper Mohawk River Coliform Monitoring Project
Station ID Station Name Date Time Parameter Result Units Analytical Method Lab Name 12010101 Mohawk River in West Schuyler 09/25/2012 0815 Dissolved Oxygen 8.5 mg/L DEC-Field DEC-Field12010101 Mohawk River in West Schuyler 09/25/2012 0815 Specific Conductance 486 umhos/cm DEC-Field DEC-Field12010101 Mohawk River in West Schuyler 09/25/2012 0815 pH 6.1 SU DEC-Field DEC-Field12010101 Mohawk River in West Schuyler 09/25/2012 0815 Temperature 15.9 Deg C. DEC-Field DEC-Field12010101 Mohawk River in West Schuyler 09/25/2012 0815 Fecal Coliform 1,700 MPN/100mL SM 18 9221-E Verona Laboratory 12010101 Mohawk River in West Schuyler 09/25/2012 0815 Total Coliform 3,000 CFU/100mL SM 18 9222-B Verona Laboratory 12010101 Mohawk River in West Schuyler 09/25/2012 0815 Stream Flow 281 cfs DEC-Field DEC-Field12010101 Mohawk River in West Schuyler 09/25/2012 0815 Gage Height 11.46 ft DEC-Field DEC-Field12010116 Mohawk River near Oriskany 09/25/2012 0915 Dissolved Oxygen 9.4 mg/L DEC-Field DEC-Field12010116 Mohawk River near Oriskany 09/25/2012 0915 Specific Conductance 273 umhos/cm DEC-Field DEC-Field12010116 Mohawk River near Oriskany 09/25/2012 0915 pH 6.6 SU DEC-Field DEC-Field12010116 Mohawk River near Oriskany 09/25/2012 0915 Temperature 15.7 Deg C. DEC-Field DEC-Field12010116 Mohawk River near Oriskany 09/25/2012 0915 Fecal Coliform 300 MPN/100mL SM 18 9221-E Verona Laboratory 12010116 Mohawk River near Oriskany 09/25/2012 0915 Total Coliform 2,000 CFU/100mL SM 18 9222-B Verona Laboratory 12010101 Mohawk River in West Schuyler 09/27/2012 0800 Dissolved Oxygen 9.4 mg/L DEC-Field DEC-Field12010101 Mohawk River in West Schuyler 09/27/2012 0800 Specific Conductance 470 umhos/cm DEC-Field DEC-Field12010101 Mohawk River in West Schuyler 09/27/2012 0800 pH 7.3 SU DEC-Field DEC-Field12010101 Mohawk River in West Schuyler 09/27/2012 0800 Temperature 16.2 Deg C. DEC-Field DEC-Field12010101 Mohawk River in West Schuyler 09/27/2012 0800 Fecal Coliform 1,100 MPN/100mL SM 18 9221-E Verona Laboratory 12010101 Mohawk River in West Schuyler 09/27/2012 0800 Total Coliform 2,900 CFU/100mL SM 18 9222-B Verona Laboratory 12010101 Mohawk River in West Schuyler 09/27/2012 0800 Stream Flow 430 cfs DEC-Field DEC-Field12010101 Mohawk River in West Schuyler 09/27/2012 0800 Gage Height 11.73 ft DEC-Field DEC-Field12010116 Mohawk River near Oriskany 09/27/2012 0900 Dissolved Oxygen 9.8 mg/L DEC-Field DEC-Field12010116 Mohawk River near Oriskany 09/27/2012 0900 Specific Conductance 285 umhos/cm DEC-Field DEC-Field12010116 Mohawk River near Oriskany 09/27/2012 0900 pH 6.3 SU DEC-Field DEC-Field12010116 Mohawk River near Oriskany 09/27/2012 0900 Temperature 16.6 Deg C. DEC-Field DEC-Field12010116 Mohawk River near Oriskany 09/27/2012 0900 Fecal Coliform 300 MPN/100mL SM 18 9221-E Verona Laboratory 12010116 Mohawk River near Oriskany 09/27/2012 0900 Total Coliform 2,200 CFU/100mL SM 18 9222-B Verona Laboratory