unplanned hospitalizations and readmissions among …txcercit.org/files/manzano091914.pdf ·...
TRANSCRIPT
Unplanned Hospitalizations and
Readmissions among Elderly Patients with GI
Cancer
September 19, 2014
Joanna-Grace M. Manzano, MD Assistant Professor
Department of General Internal Medicine UT MD Anderson Cancer Center
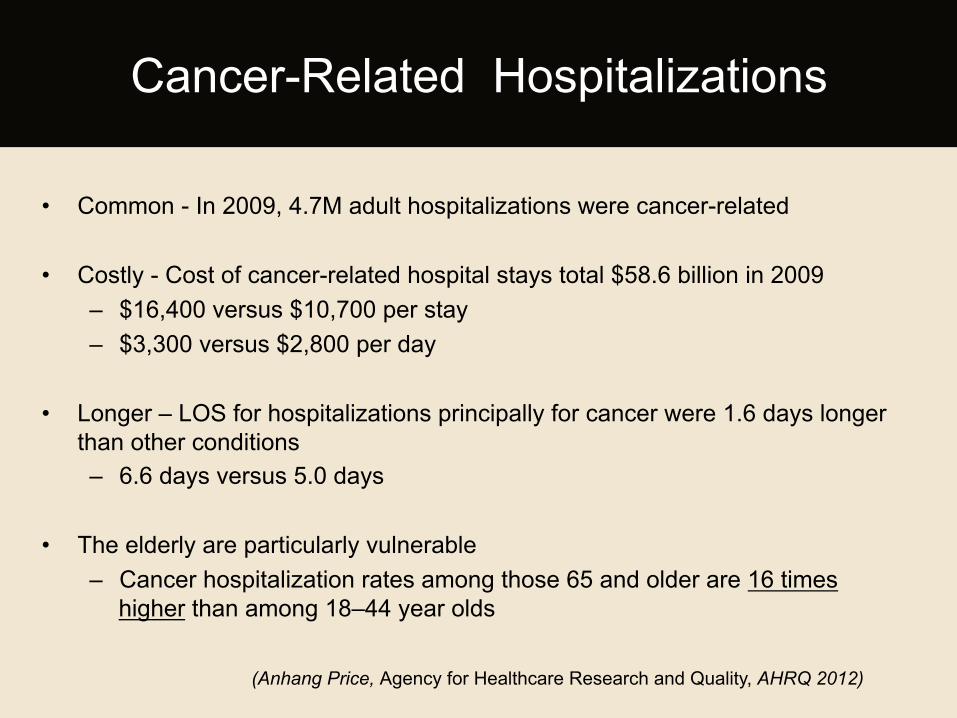
• Common - In 2009, 4.7M adult hospitalizations were cancer-related
• Costly - Cost of cancer-related hospital stays total $58.6 billion in 2009 – $16,400 versus $10,700 per stay – $3,300 versus $2,800 per day
• Longer – LOS for hospitalizations principally for cancer were 1.6 days longer than other conditions – 6.6 days versus 5.0 days
• The elderly are particularly vulnerable – Cancer hospitalization rates among those 65 and older are 16 times
higher than among 18–44 year olds
(Anhang Price, Agency for Healthcare Research and Quality, AHRQ 2012)
Cancer-Related Hospitalizations
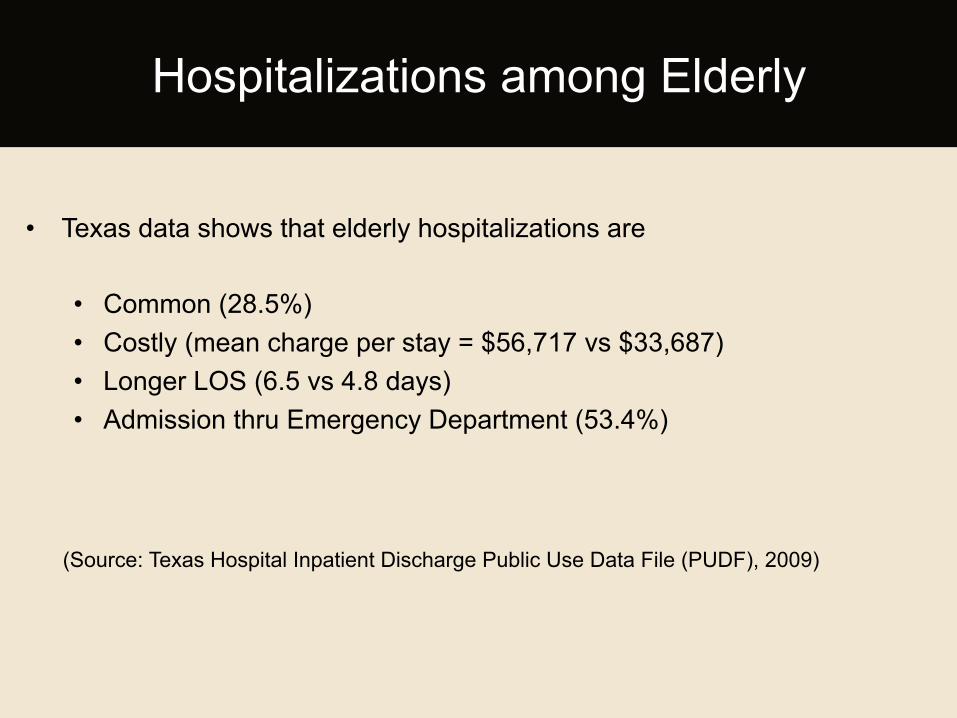
• Texas data shows that elderly hospitalizations are
• Common (28.5%) • Costly (mean charge per stay = $56,717 vs $33,687) • Longer LOS (6.5 vs 4.8 days) • Admission thru Emergency Department (53.4%)
(Source: Texas Hospital Inpatient Discharge Public Use Data File (PUDF), 2009)
Hospitalizations among Elderly
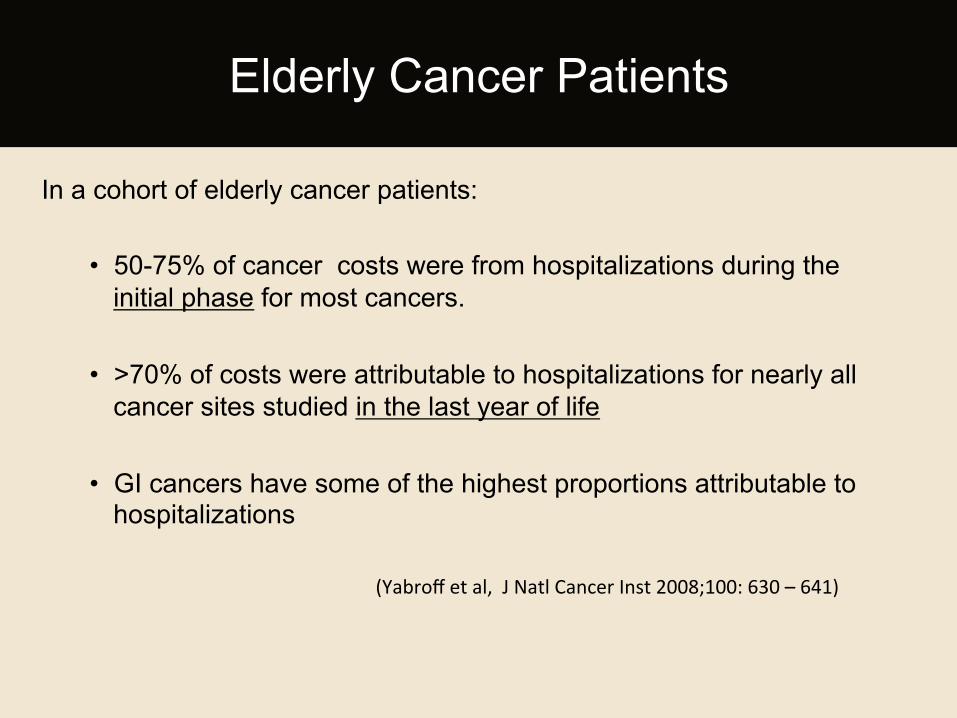
In a cohort of elderly cancer patients: • 50-75% of cancer costs were from hospitalizations during the
initial phase for most cancers.
• >70% of costs were attributable to hospitalizations for nearly all cancer sites studied in the last year of life
• GI cancers have some of the highest proportions attributable to hospitalizations
(Yabroff et al, J Natl Cancer Inst 2008;100: 630 – 641)
Elderly Cancer Patients
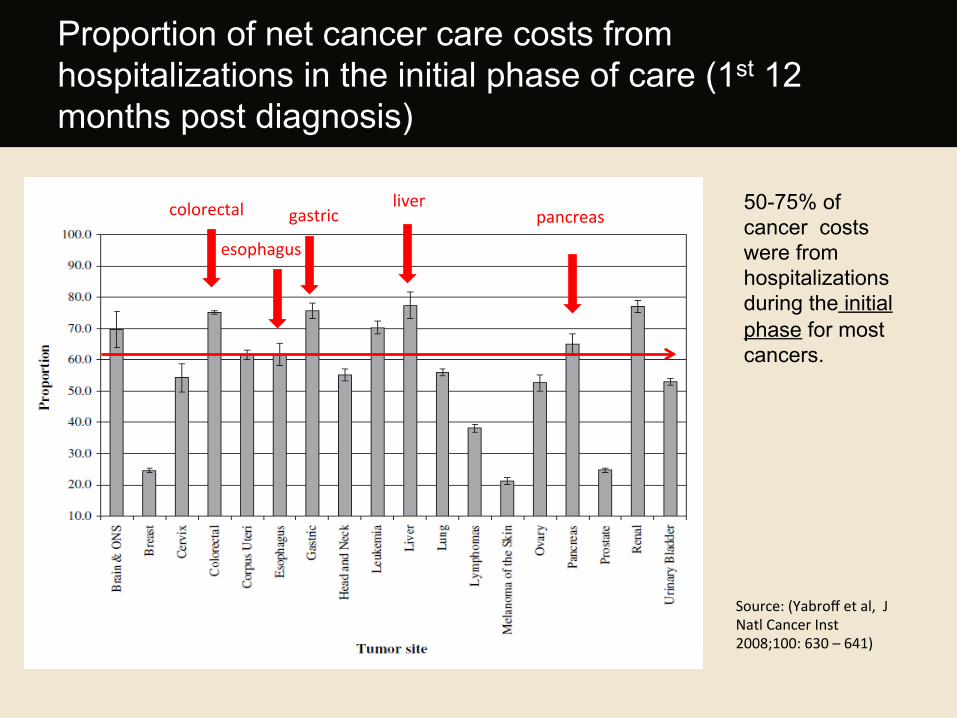
50-75% of cancer costs were from hospitalizations during the initial phase for most cancers.
Proportion of net cancer care costs from hospitalizations in the initial phase of care (1st 12 months post diagnosis)
Source: (Yabroff et al, J Natl Cancer Inst 2008;100: 630 – 641)
colorectal
esophagus
gastric liver
pancreas
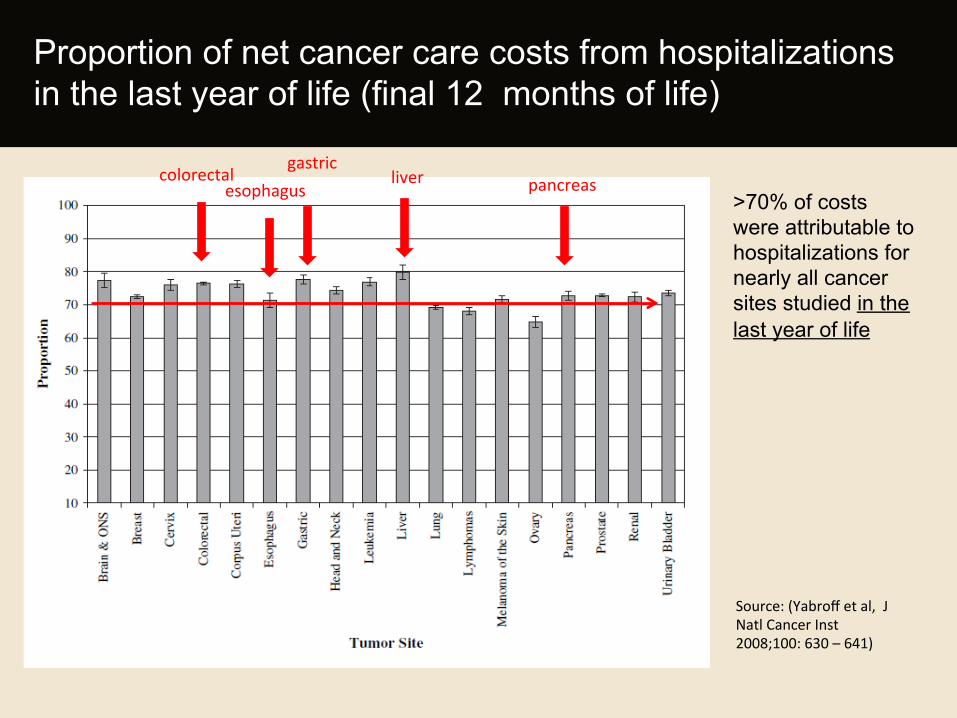
Proportion of net cancer care costs from hospitalizations in the last year of life (final 12 months of life)
colorectal esophagus
gastric liver pancreas
>70% of costs were attributable to hospitalizations for nearly all cancer sites studied in the last year of life
Source: (Yabroff et al, J Natl Cancer Inst 2008;100: 630 – 641)
• What drives the high hospitalization rate among cancer patients?
• Are these hospitalizations planned or unplanned?
• What are the reasons for unplanned hospitalization?
• What are the risk factors for unplanned hospitalization?
Knowledge gap
Patterns and Predictors of Unplanned Hospitalization
in a Population-Based Cohort of Elderly Patients
with GI Cancer

• Dr. Maria E. Suarez-Almazor • Dr. Linda S. Elting • Dr. Ruili Luo • Dr. Marina C. George
Study Team

1. To describe the patterns of unplanned hospitalization among elderly GI cancer patients
2. To identify risk factors for unplanned hospitalizations
among patients with GI cancer
Study Objectives
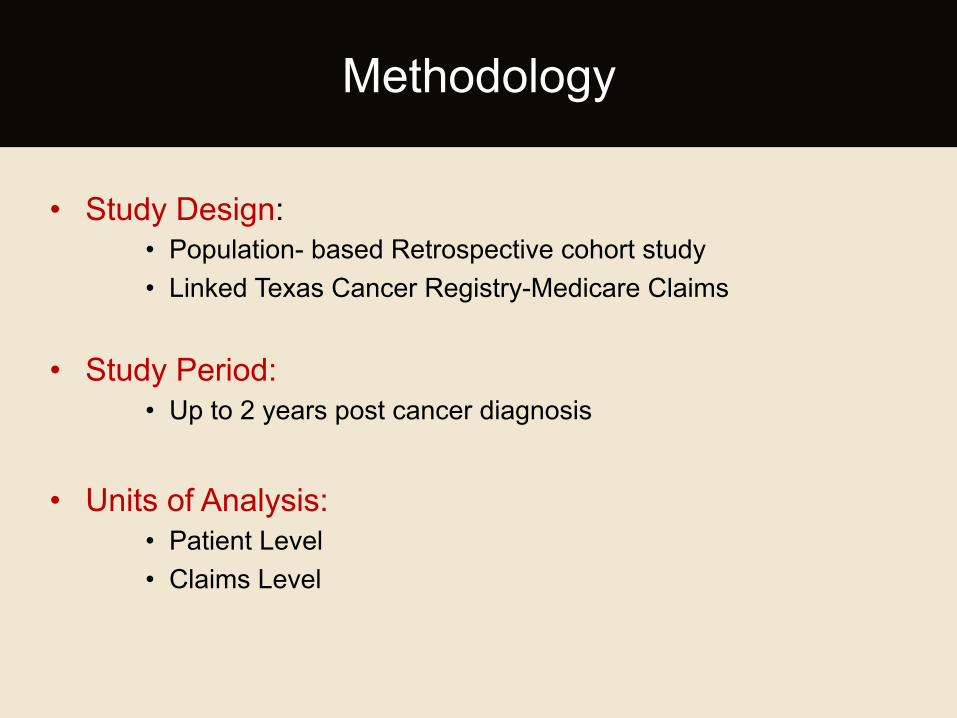
• Study Design: • Population- based Retrospective cohort study • Linked Texas Cancer Registry-Medicare Claims
• Study Period: • Up to 2 years post cancer diagnosis
• Units of Analysis: • Patient Level • Claims Level
Methodology
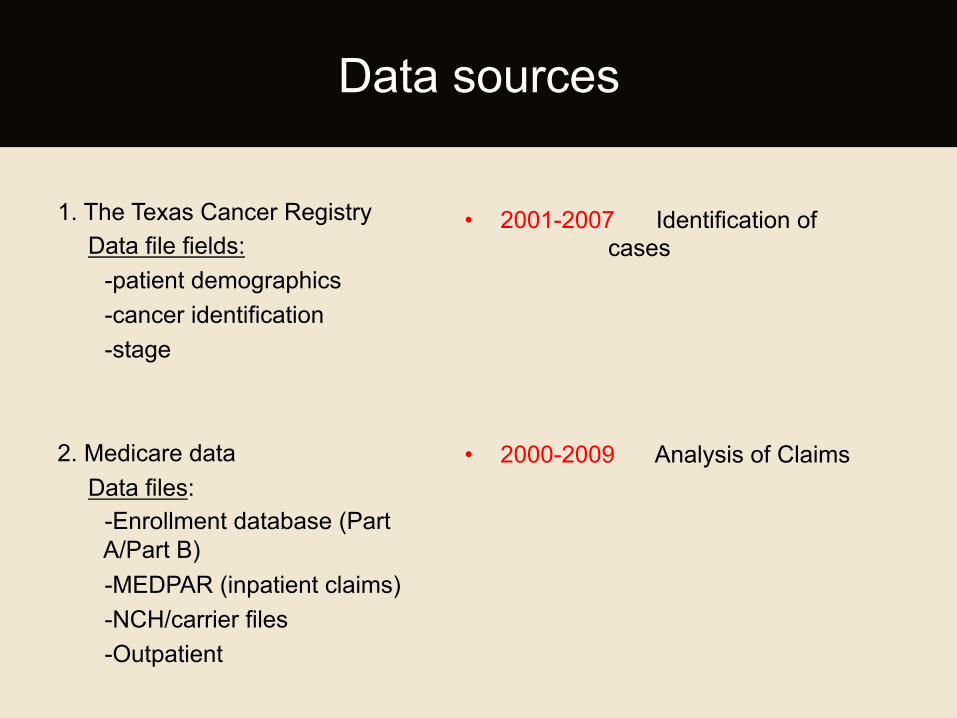
1. The Texas Cancer Registry Data file fields:
-patient demographics -cancer identification -stage
2. Medicare data Data files:
-Enrollment database (Part A/Part B) -MEDPAR (inpatient claims) -NCH/carrier files -Outpatient
• 2001-2007 Identification of cases
• 2000-2009 Analysis of Claims
Data sources
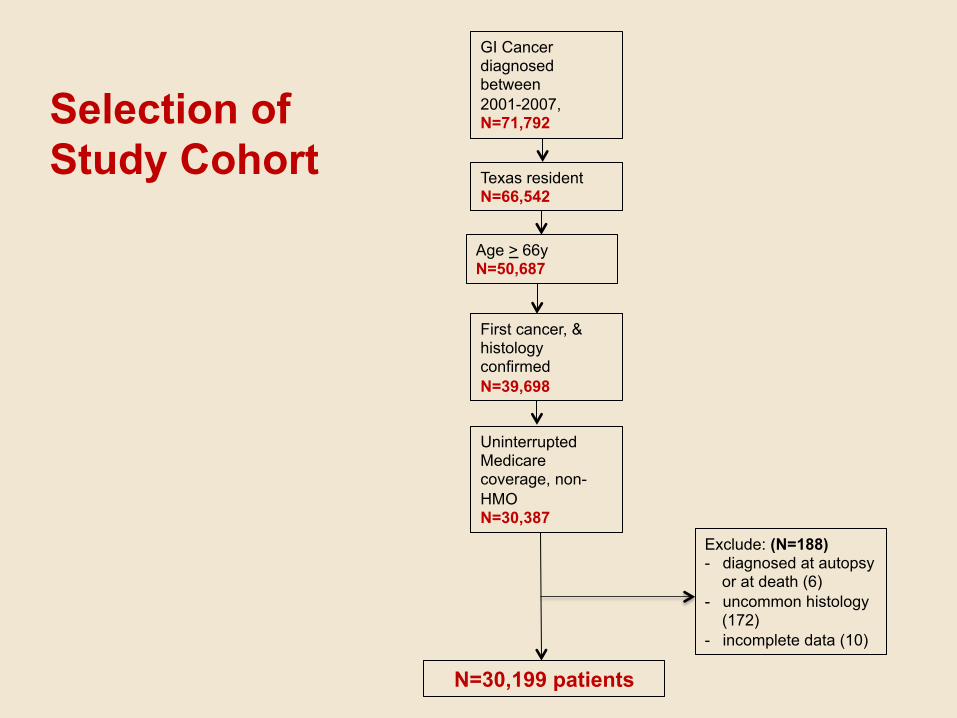
GI Cancer diagnosed between 2001-2007, N=71,792
Age > 66y N=50,687
Uninterrupted Medicare coverage, non-HMO N=30,387
N=30,199 patients
Texas resident N=66,542
First cancer, & histology confirmed N=39,698
Exclude: (N=188) - diagnosed at autopsy
or at death (6) - uncommon histology
(172) - incomplete data (10)
Selection of Study Cohort
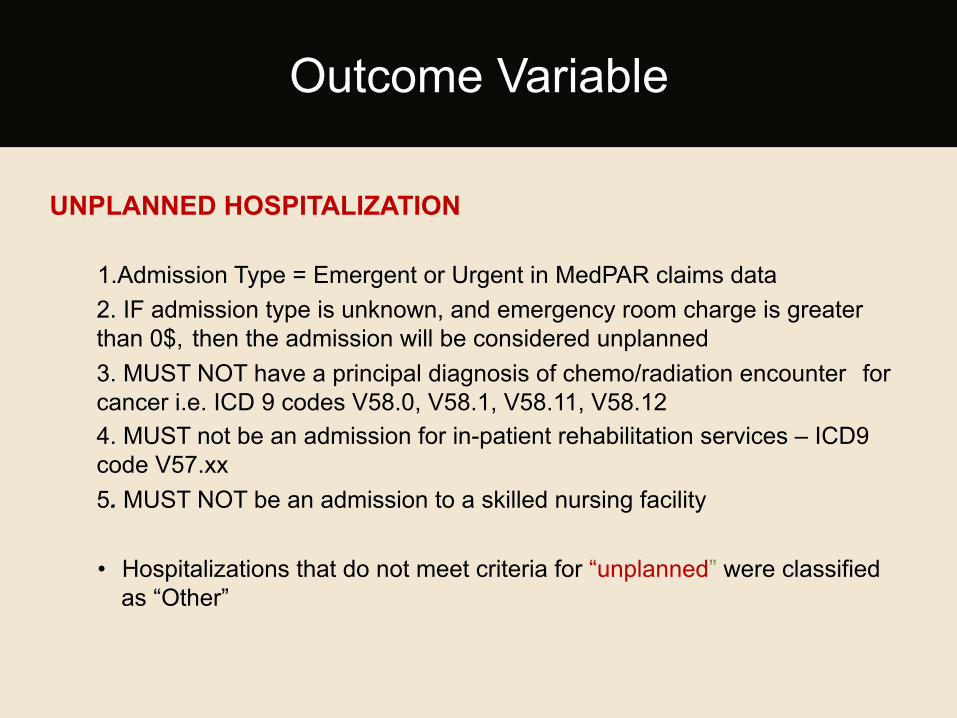
UNPLANNED HOSPITALIZATION
1.Admission Type = Emergent or Urgent in MedPAR claims data 2. IF admission type is unknown, and emergency room charge is greater than 0$, then the admission will be considered unplanned 3. MUST NOT have a principal diagnosis of chemo/radiation encounter for cancer i.e. ICD 9 codes V58.0, V58.1, V58.11, V58.12 4. MUST not be an admission for in-patient rehabilitation services – ICD9 code V57.xx 5. MUST NOT be an admission to a skilled nursing facility
• Hospitalizations that do not meet criteria for “unplanned” were classified
as “Other”
Outcome Variable
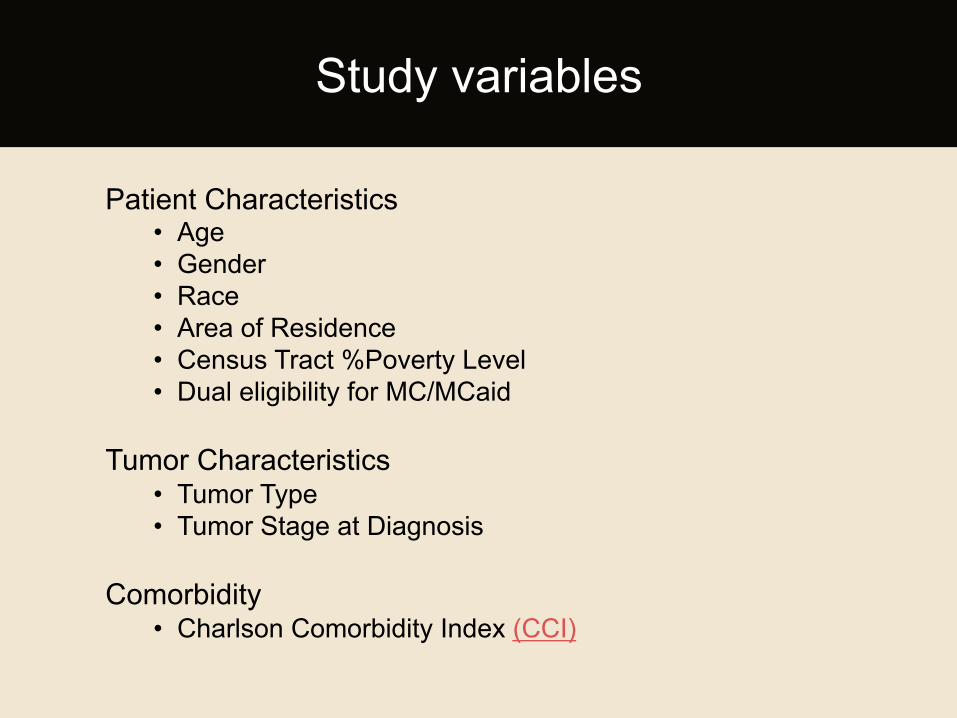
Patient Characteristics
• Age • Gender • Race • Area of Residence • Census Tract %Poverty Level • Dual eligibility for MC/MCaid
Tumor Characteristics • Tumor Type • Tumor Stage at Diagnosis
Comorbidity • Charlson Comorbidity Index (CCI)
Study variables
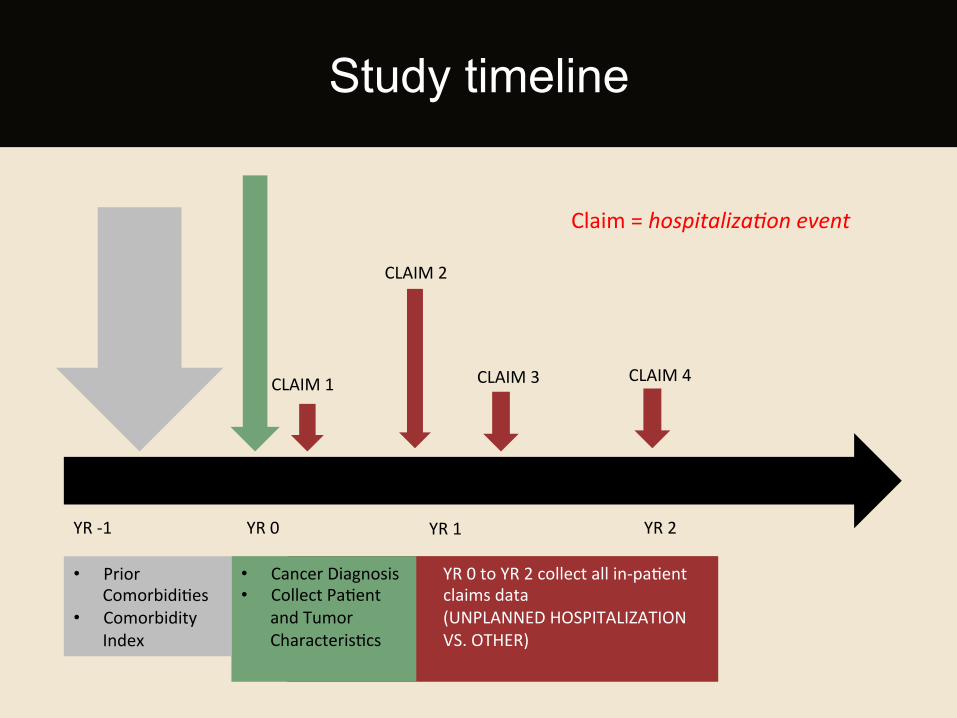
YR 0 to YR 2 collect all in-‐paHent claims data (UNPLANNED HOSPITALIZATION VS. OTHER)
• Cancer Diagnosis • Collect PaHent
and Tumor CharacterisHcs
• Prior ComorbidiHes
• Comorbidity Index
CLAIM 1
CLAIM 2
CLAIM 3 CLAIM 4
YR -‐1 YR 0 YR 1 YR 2
Study timeline
Claim = hospitaliza*on event
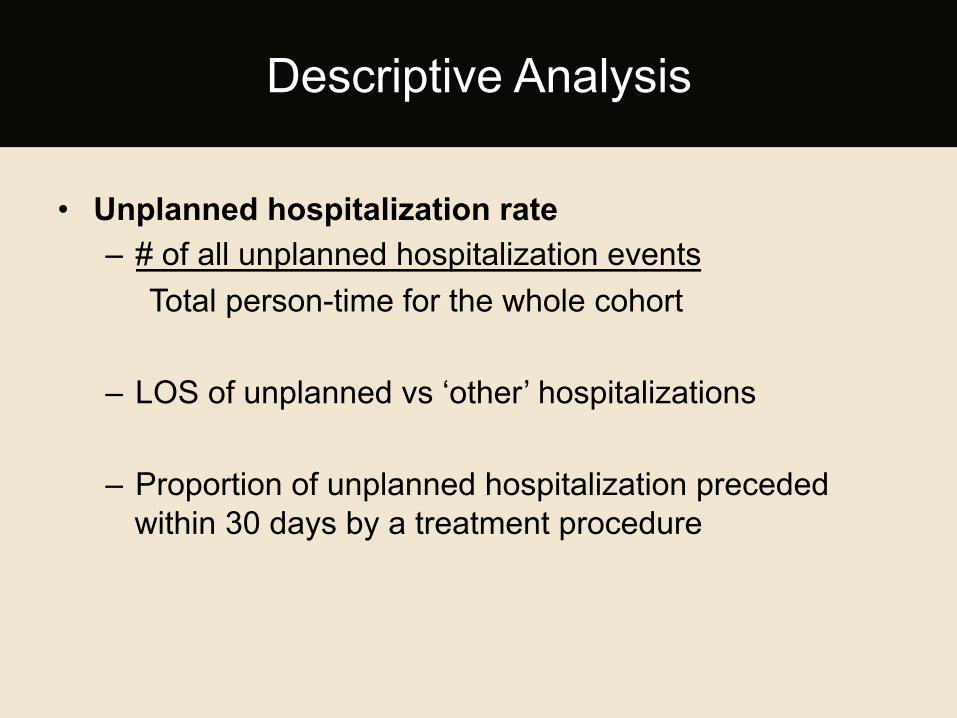
• Unplanned hospitalization rate – # of all unplanned hospitalization events Total person-time for the whole cohort
– LOS of unplanned vs ‘other’ hospitalizations
– Proportion of unplanned hospitalization preceded within 30 days by a treatment procedure
Descriptive Analysis
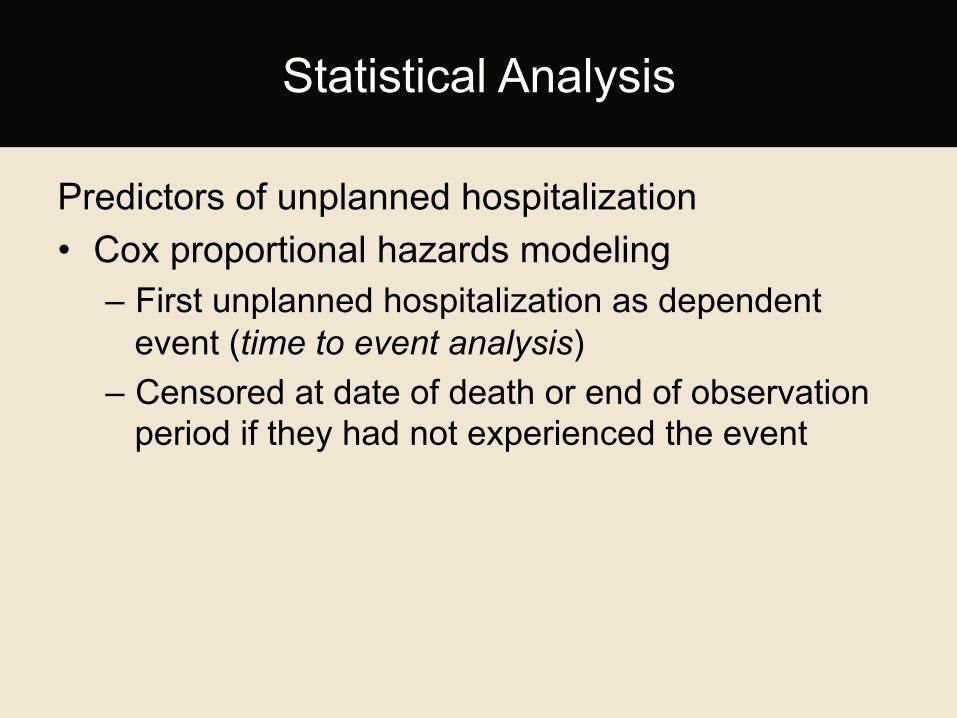
Predictors of unplanned hospitalization • Cox proportional hazards modeling
– First unplanned hospitalization as dependent event (time to event analysis)
– Censored at date of death or end of observation period if they had not experienced the event
Statistical Analysis
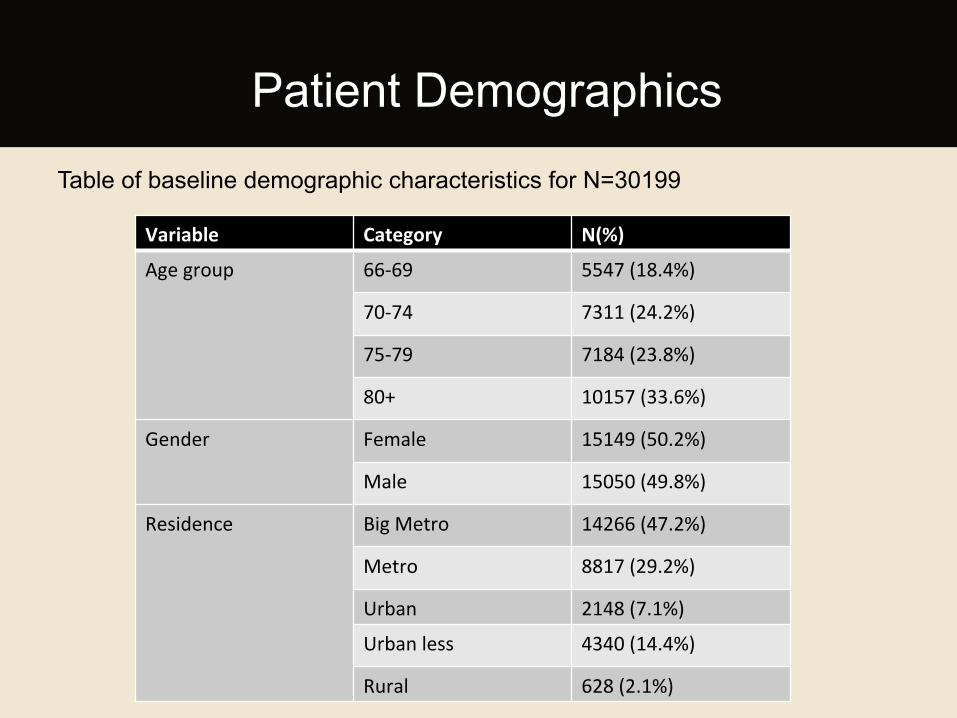
Table of baseline demographic characteristics for N=30199
Patient Demographics
Variable Category N(%)
Age group 66-‐69 5547 (18.4%)
70-‐74 7311 (24.2%)
75-‐79 7184 (23.8%)
80+ 10157 (33.6%)
Gender Female 15149 (50.2%)
Male 15050 (49.8%)
Residence Big Metro 14266 (47.2%)
Metro 8817 (29.2%)
Urban 2148 (7.1%)
Urban less 4340 (14.4%)
Rural 628 (2.1%)
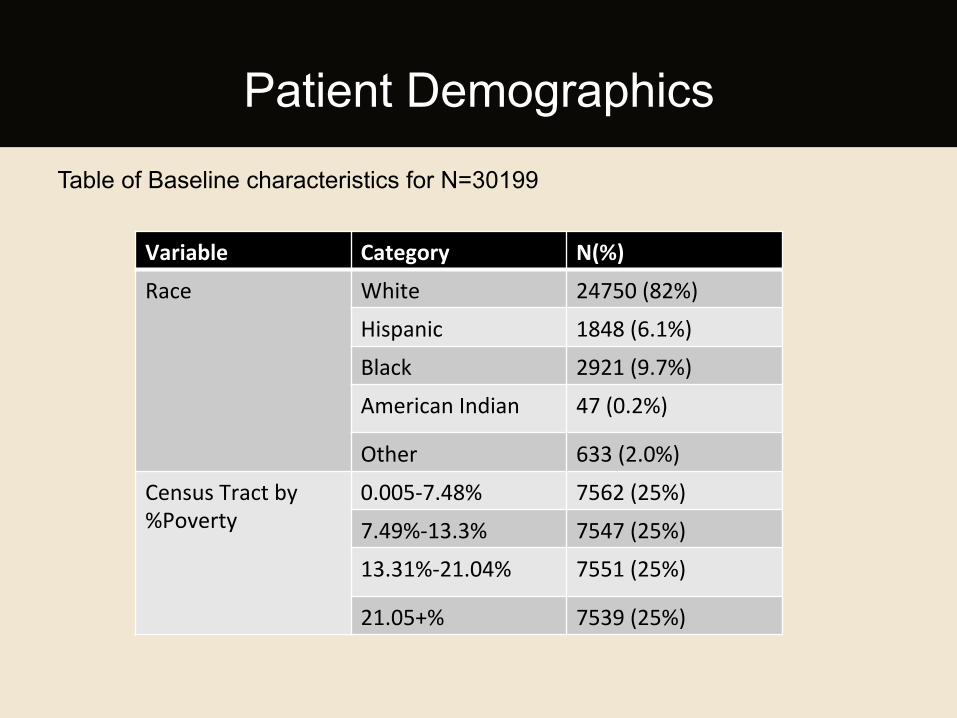
Table of Baseline characteristics for N=30199
Patient Demographics
Variable Category N(%)
Race White 24750 (82%)
Hispanic 1848 (6.1%)
Black 2921 (9.7%)
American Indian 47 (0.2%)
Other 633 (2.0%)
Census Tract by %Poverty
0.005-‐7.48% 7562 (25%)
7.49%-‐13.3% 7547 (25%)
13.31%-‐21.04% 7551 (25%)
21.05+% 7539 (25%)
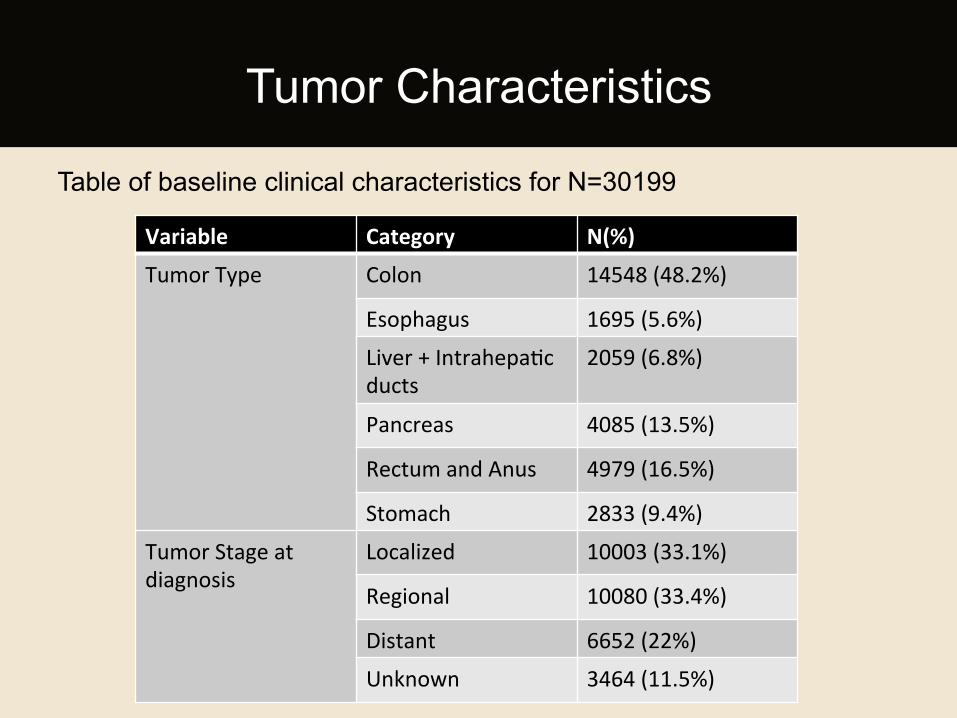
Table of baseline clinical characteristics for N=30199
Tumor Characteristics
Variable Category N(%)
Tumor Type Colon 14548 (48.2%)
Esophagus 1695 (5.6%)
Liver + IntrahepaHc ducts
2059 (6.8%)
Pancreas 4085 (13.5%)
Rectum and Anus 4979 (16.5%)
Stomach 2833 (9.4%)
Tumor Stage at diagnosis
Localized 10003 (33.1%)
Regional 10080 (33.4%)
Distant 6652 (22%)
Unknown 3464 (11.5%)
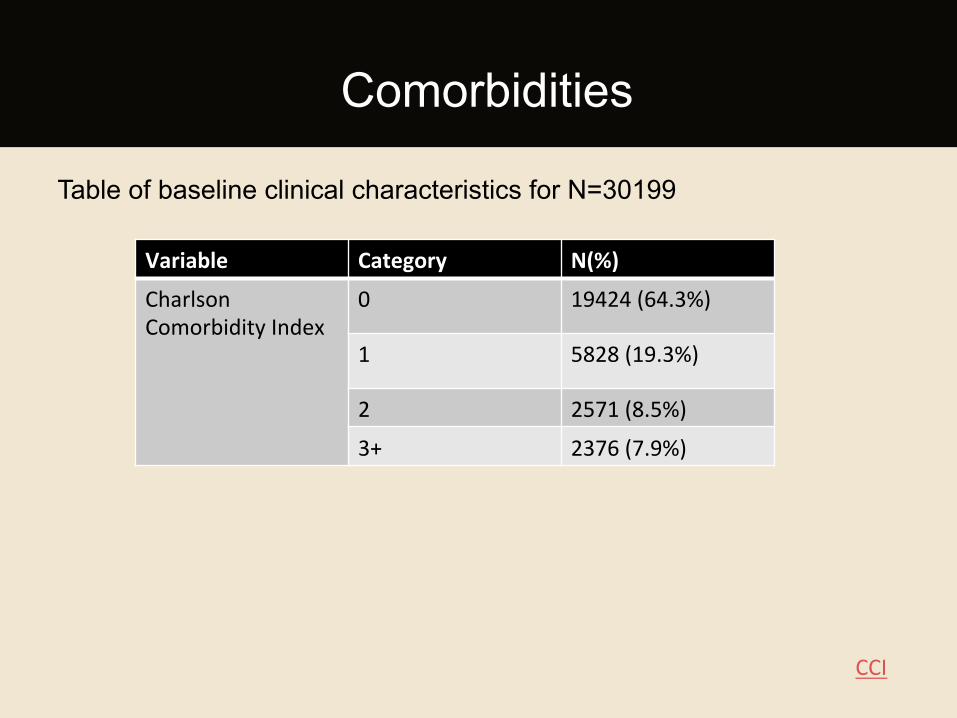
Table of baseline clinical characteristics for N=30199
Comorbidities
Variable Category N(%)
Charlson Comorbidity Index
0 19424 (64.3%)
1 5828 (19.3%)
2 2571 (8.5%)
3+ 2376 (7.9%)
CCI
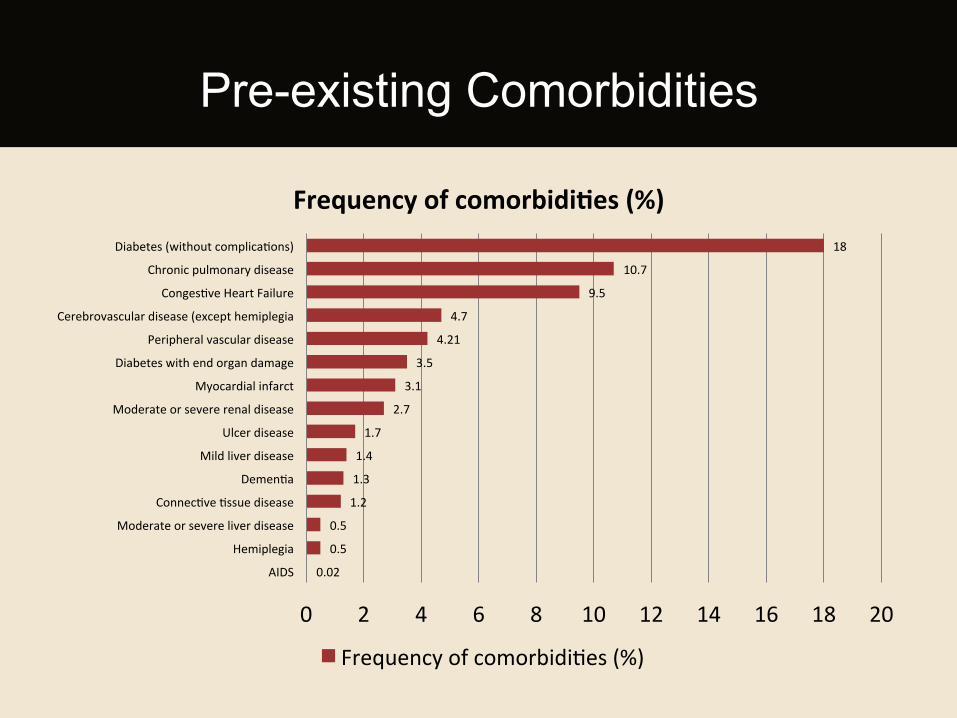
0.02
0.5
0.5
1.2
1.3
1.4
1.7
2.7
3.1
3.5
4.21
4.7
9.5
10.7
18
0 2 4 6 8 10 12 14 16 18 20
AIDS
Hemiplegia
Moderate or severe liver disease
ConnecHve Hssue disease
DemenHa
Mild liver disease
Ulcer disease
Moderate or severe renal disease
Myocardial infarct
Diabetes with end organ damage
Peripheral vascular disease
Cerebrovascular disease (except hemiplegia
CongesHve Heart Failure
Chronic pulmonary disease
Diabetes (without complicaHons)
Frequency of comorbidi:es (%)
Frequency of comorbidiHes (%)
Pre-existing Comorbidities
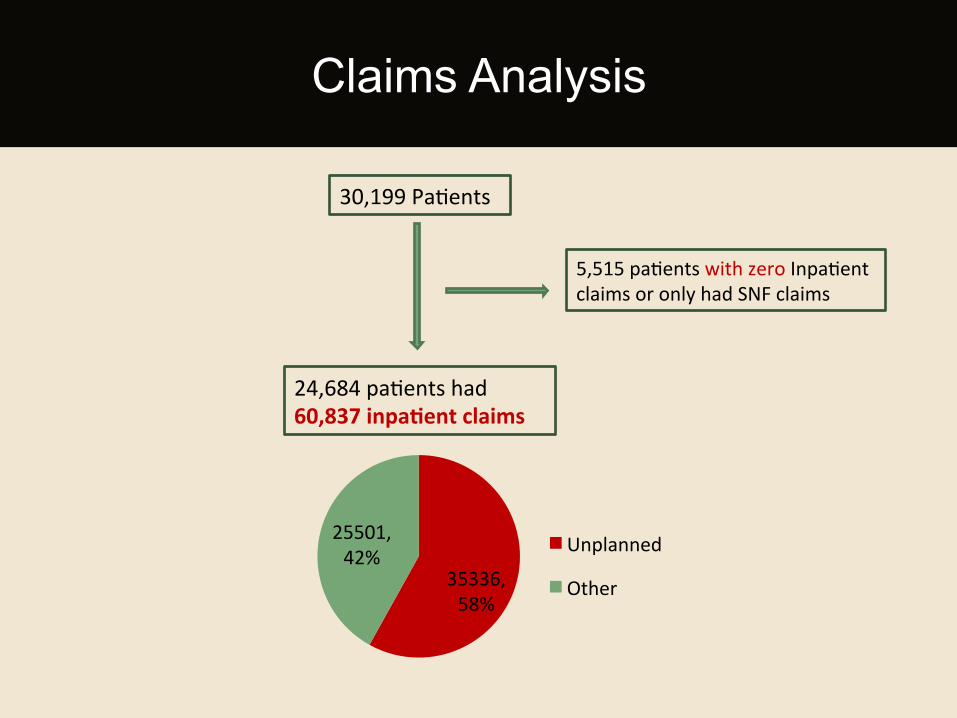
Claims Analysis
30,199 PaHents
24,684 paHents had 60,837 inpa:ent claims
5,515 paHents with zero InpaHent claims or only had SNF claims
35336, 58%
25501, 42% Unplanned
Other
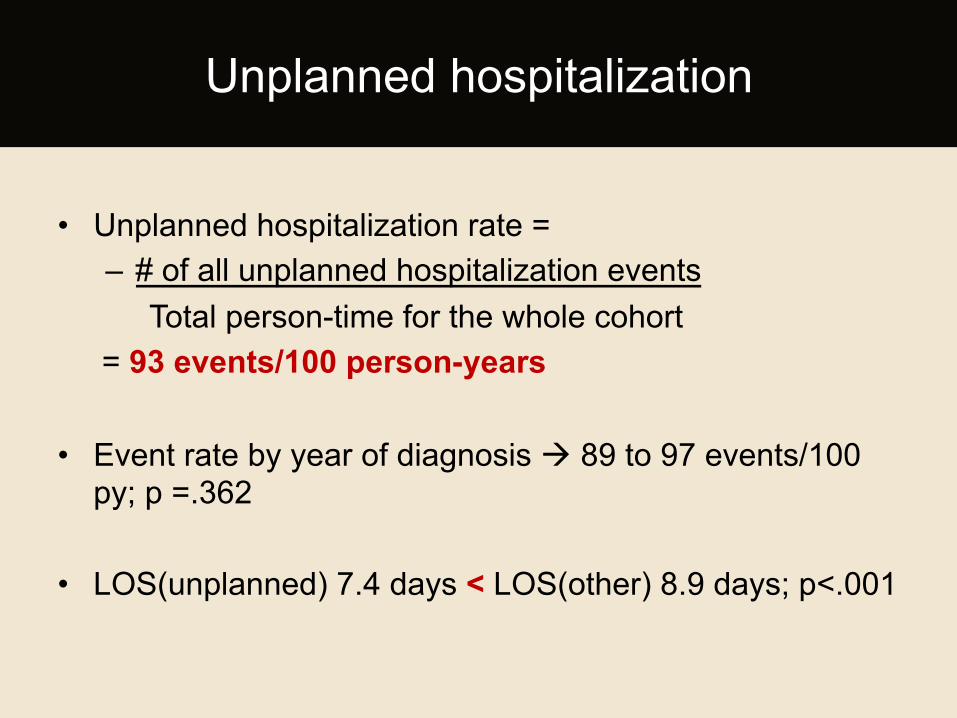
• Unplanned hospitalization rate = – # of all unplanned hospitalization events Total person-time for the whole cohort
= 93 events/100 person-years • Event rate by year of diagnosis à 89 to 97 events/100
py; p =.362
• LOS(unplanned) 7.4 days < LOS(other) 8.9 days; p<.001
Unplanned hospitalization
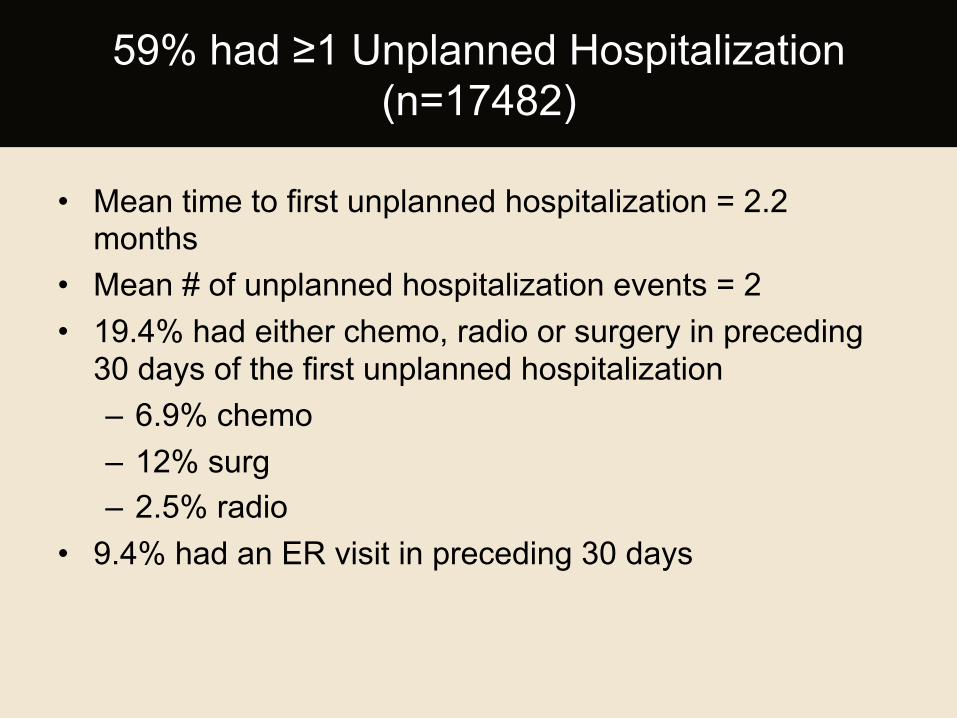
• Mean time to first unplanned hospitalization = 2.2 months
• Mean # of unplanned hospitalization events = 2 • 19.4% had either chemo, radio or surgery in preceding
30 days of the first unplanned hospitalization – 6.9% chemo – 12% surg – 2.5% radio
• 9.4% had an ER visit in preceding 30 days
59% had ≥1 Unplanned Hospitalization (n=17482)
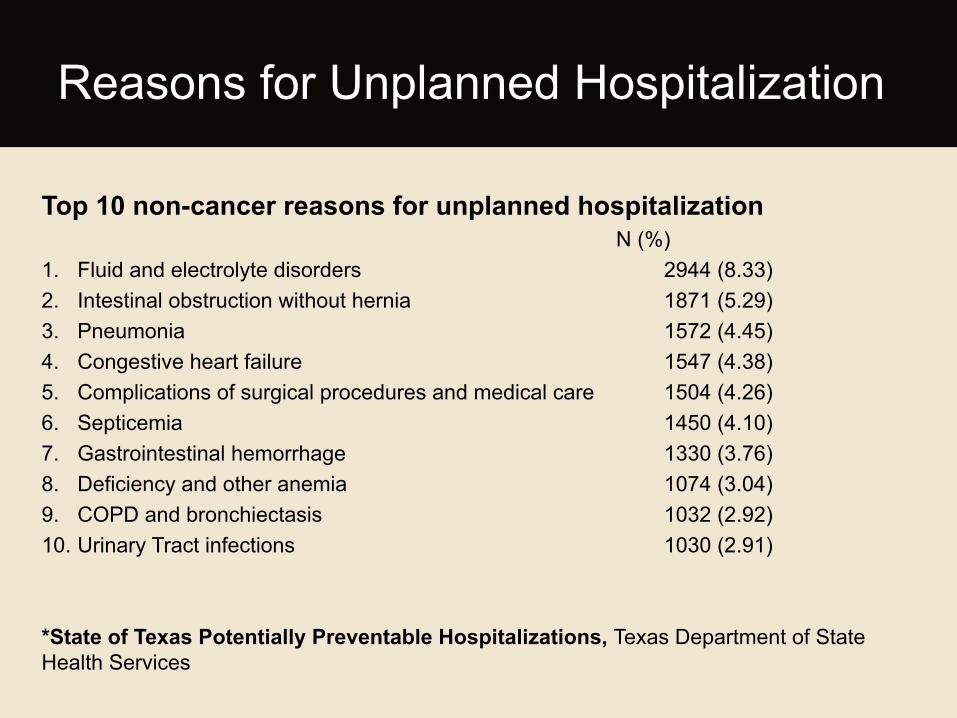
Top 10 non-cancer reasons for unplanned hospitalization N (%)
1. Fluid and electrolyte disorders 2944 (8.33) 2. Intestinal obstruction without hernia 1871 (5.29) 3. Pneumonia 1572 (4.45) 4. Congestive heart failure 1547 (4.38) 5. Complications of surgical procedures and medical care 1504 (4.26) 6. Septicemia 1450 (4.10) 7. Gastrointestinal hemorrhage 1330 (3.76) 8. Deficiency and other anemia 1074 (3.04) 9. COPD and bronchiectasis 1032 (2.92) 10. Urinary Tract infections 1030 (2.91)
*State of Texas Potentially Preventable Hospitalizations, Texas Department of State Health Services
Reasons for Unplanned Hospitalization
Variable
Coefficient Hazard raHo
95% confidence interval p
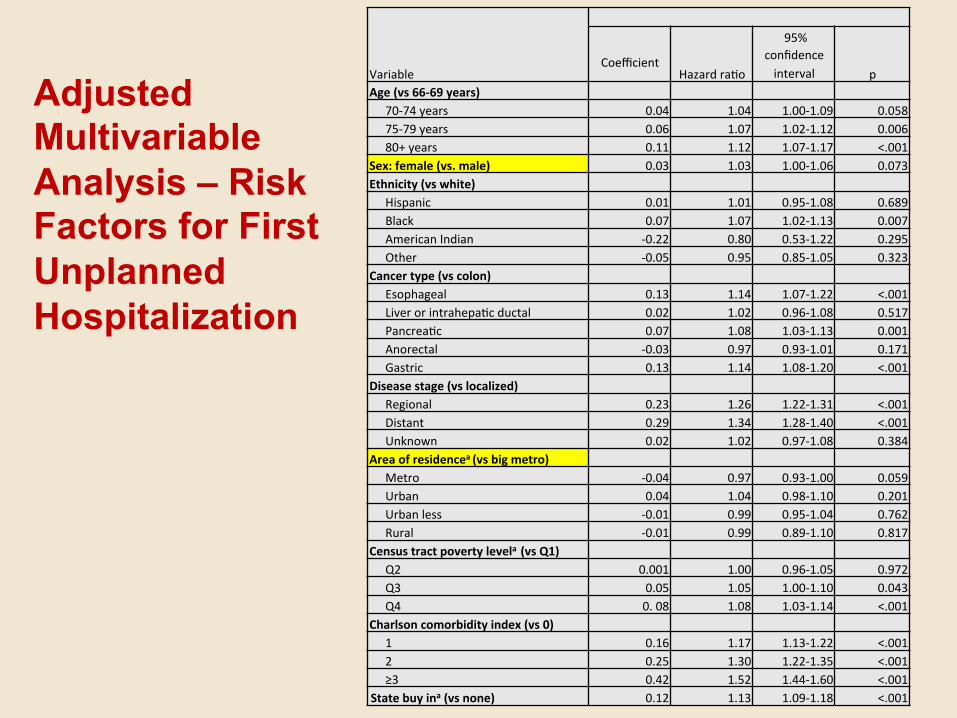
Age (vs 66-‐69 years) 70-‐74 years 0.04 1.04 1.00-‐1.09 0.058 75-‐79 years 0.06 1.07 1.02-‐1.12 0.006 80+ years 0.11 1.12 1.07-‐1.17 <.001
Sex: female (vs. male) 0.03 1.03 1.00-‐1.06 0.073 Ethnicity (vs white)
Hispanic 0.01 1.01 0.95-‐1.08 0.689 Black 0.07 1.07 1.02-‐1.13 0.007 American Indian -‐0.22 0.80 0.53-‐1.22 0.295 Other -‐0.05 0.95 0.85-‐1.05 0.323
Cancer type (vs colon) Esophageal 0.13 1.14 1.07-‐1.22 <.001 Liver or intrahepaHc ductal 0.02 1.02 0.96-‐1.08 0.517 PancreaHc 0.07 1.08 1.03-‐1.13 0.001 Anorectal -‐0.03 0.97 0.93-‐1.01 0.171 Gastric 0.13 1.14 1.08-‐1.20 <.001
Disease stage (vs localized) Regional 0.23 1.26 1.22-‐1.31 <.001 Distant 0.29 1.34 1.28-‐1.40 <.001 Unknown 0.02 1.02 0.97-‐1.08 0.384
Area of residencea (vs big metro) Metro -‐0.04 0.97 0.93-‐1.00 0.059 Urban 0.04 1.04 0.98-‐1.10 0.201 Urban less -‐0.01 0.99 0.95-‐1.04 0.762 Rural -‐0.01 0.99 0.89-‐1.10 0.817
Census tract poverty levela (vs Q1) Q2 0.001 1.00 0.96-‐1.05 0.972 Q3 0.05 1.05 1.00-‐1.10 0.043 Q4 0. 08 1.08 1.03-‐1.14 <.001
Charlson comorbidity index (vs 0) 1 0.16 1.17 1.13-‐1.22 <.001 2 0.25 1.30 1.22-‐1.35 <.001 ≥3 0.42 1.52 1.44-‐1.60 <.001
State buy ina (vs none) 0.12 1.13 1.09-‐1.18 <.001
Adjusted Multivariable Analysis – Risk Factors for First Unplanned Hospitalization
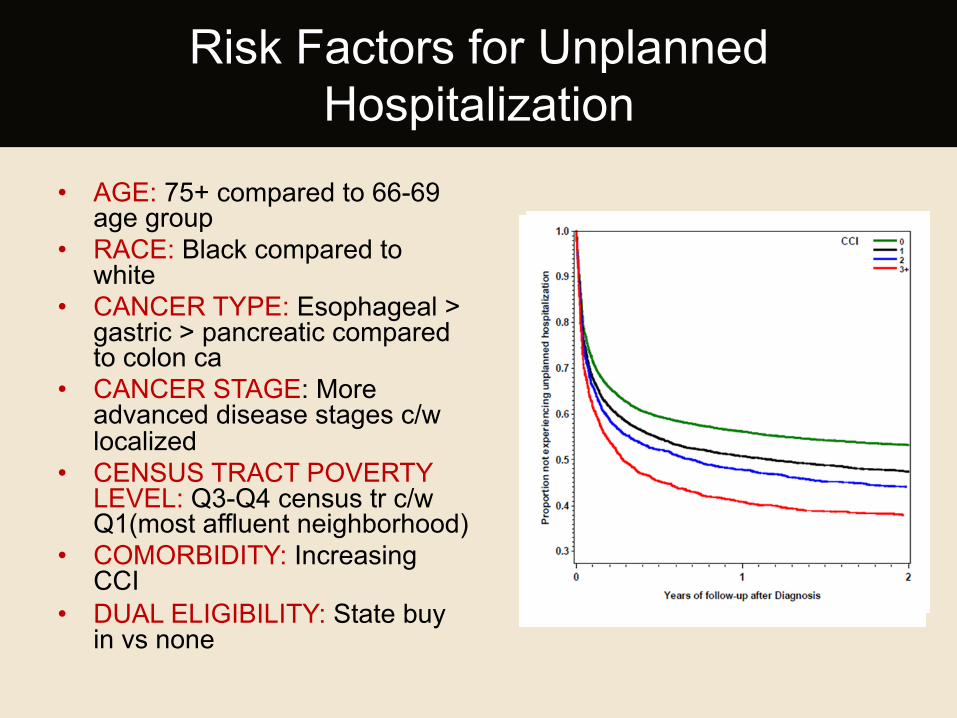
• AGE: 75+ compared to 66-69 age group
• RACE: Black compared to white
• CANCER TYPE: Esophageal > gastric > pancreatic compared to colon ca
• CANCER STAGE: More advanced disease stages c/w localized
• CENSUS TRACT POVERTY LEVEL: Q3-Q4 census tr c/w Q1(most affluent neighborhood)
• COMORBIDITY: Increasing CCI
• DUAL ELIGIBILITY: State buy in vs none
Risk Factors for Unplanned Hospitalization
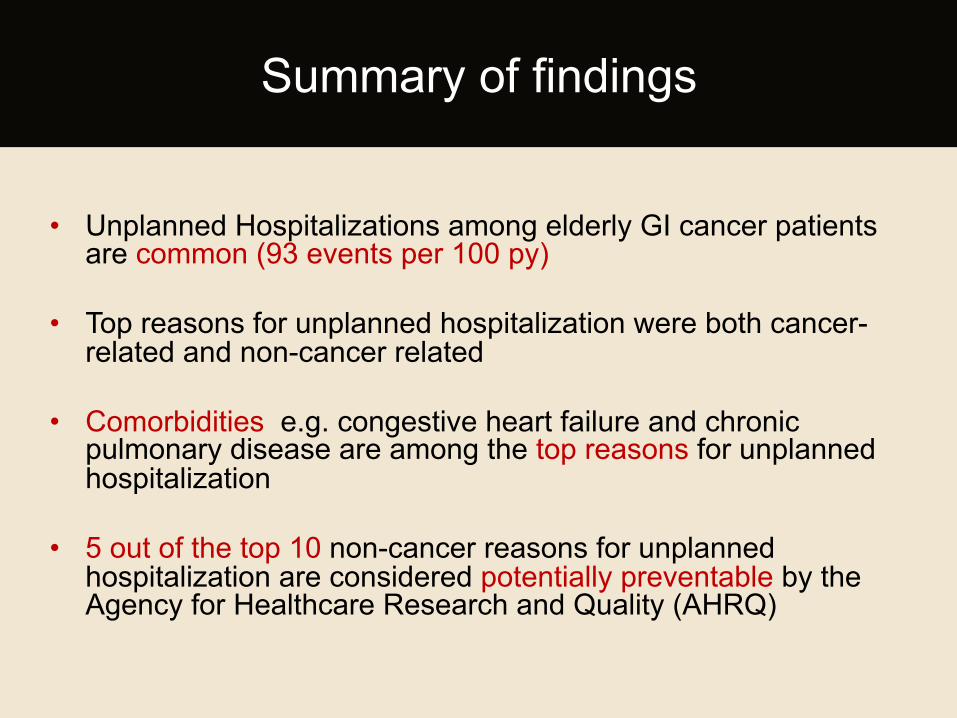
• Unplanned Hospitalizations among elderly GI cancer patients are common (93 events per 100 py)
• Top reasons for unplanned hospitalization were both cancer-related and non-cancer related
• Comorbidities e.g. congestive heart failure and chronic pulmonary disease are among the top reasons for unplanned hospitalization
• 5 out of the top 10 non-cancer reasons for unplanned hospitalization are considered potentially preventable by the Agency for Healthcare Research and Quality (AHRQ)
Summary of findings
Unplanned 30-day Readmissions among Elderly Patients with
Gastrointestinal Cancer
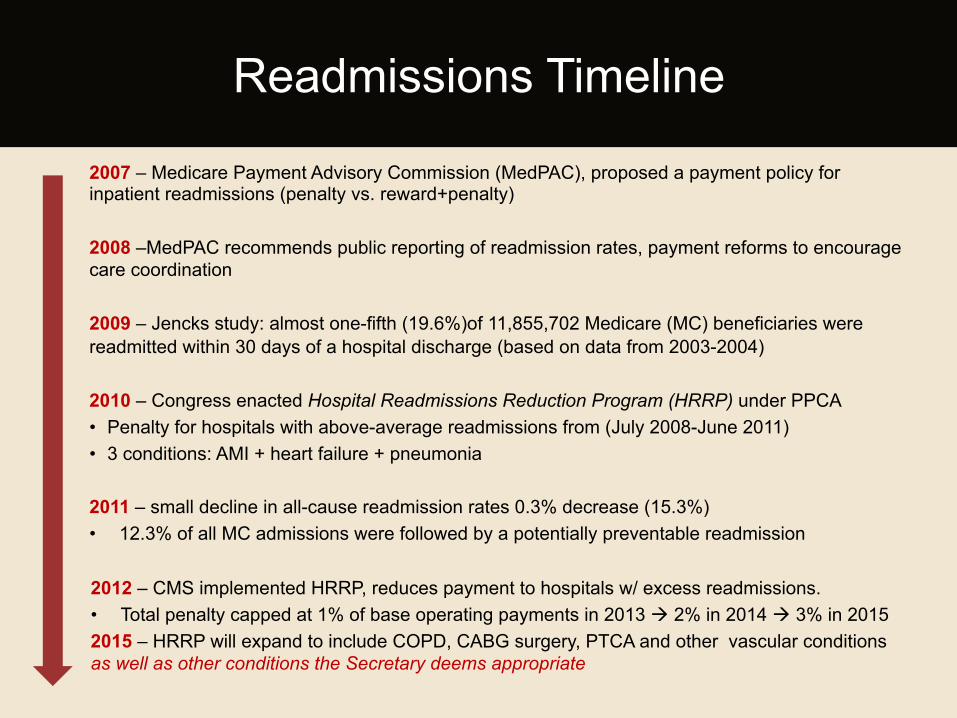
2007 – Medicare Payment Advisory Commission (MedPAC), proposed a payment policy for inpatient readmissions (penalty vs. reward+penalty) 2008 –MedPAC recommends public reporting of readmission rates, payment reforms to encourage care coordination 2009 – Jencks study: almost one-fifth (19.6%)of 11,855,702 Medicare (MC) beneficiaries were readmitted within 30 days of a hospital discharge (based on data from 2003-2004) 2010 – Congress enacted Hospital Readmissions Reduction Program (HRRP) under PPCA • Penalty for hospitals with above-average readmissions from (July 2008-June 2011) • 3 conditions: AMI + heart failure + pneumonia
2011 – small decline in all-cause readmission rates 0.3% decrease (15.3%) • 12.3% of all MC admissions were followed by a potentially preventable readmission
2012 – CMS implemented HRRP, reduces payment to hospitals w/ excess readmissions. • Total penalty capped at 1% of base operating payments in 2013 à 2% in 2014 à 3% in 2015 2015 – HRRP will expand to include COPD, CABG surgery, PTCA and other vascular conditions as well as other conditions the Secretary deems appropriate
Readmissions Timeline
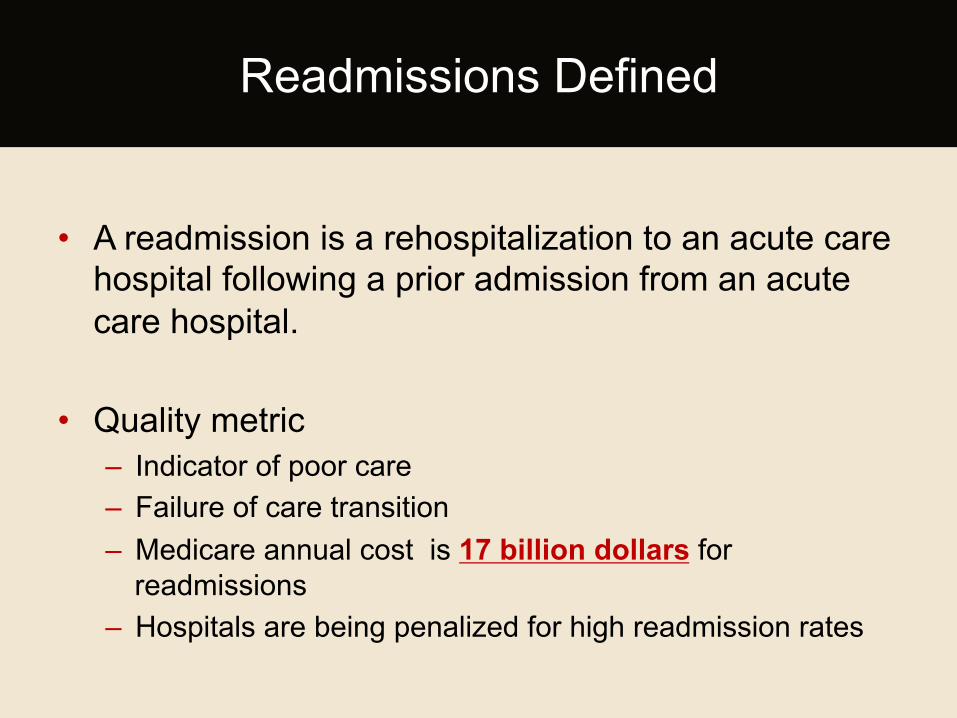
• A readmission is a rehospitalization to an acute care hospital following a prior admission from an acute care hospital.
• Quality metric – Indicator of poor care – Failure of care transition – Medicare annual cost is 17 billion dollars for
readmissions – Hospitals are being penalized for high readmission rates
Readmissions Defined
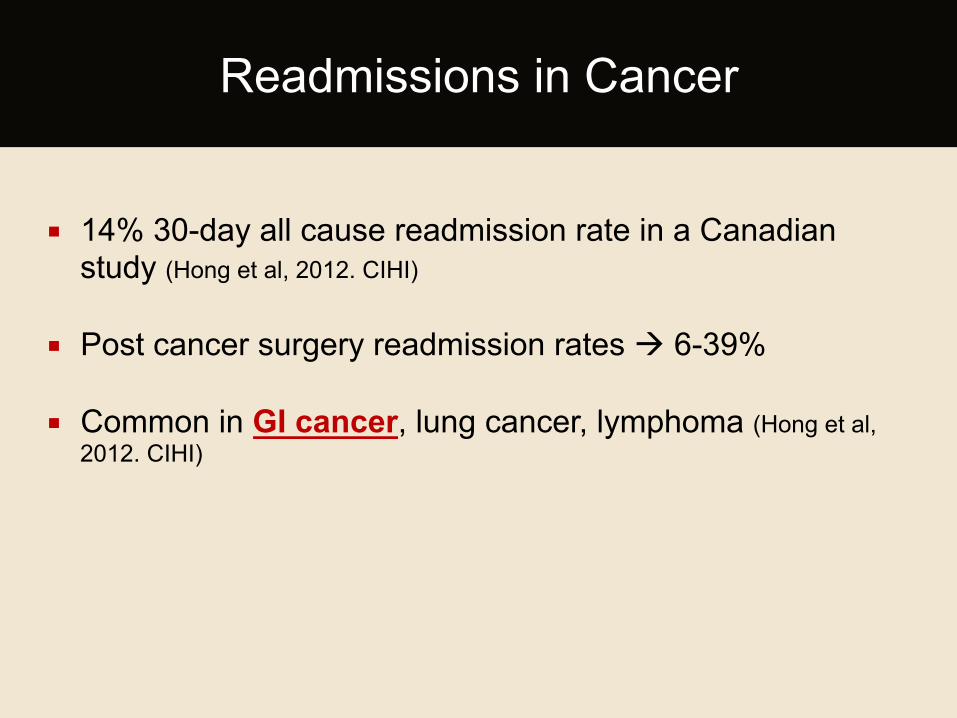
Readmissions in Cancer
¡ 14% 30-day all cause readmission rate in a Canadian study (Hong et al, 2012. CIHI)
¡ Post cancer surgery readmission rates à 6-39%
¡ Common in GI cancer, lung cancer, lymphoma (Hong et al, 2012. CIHI)
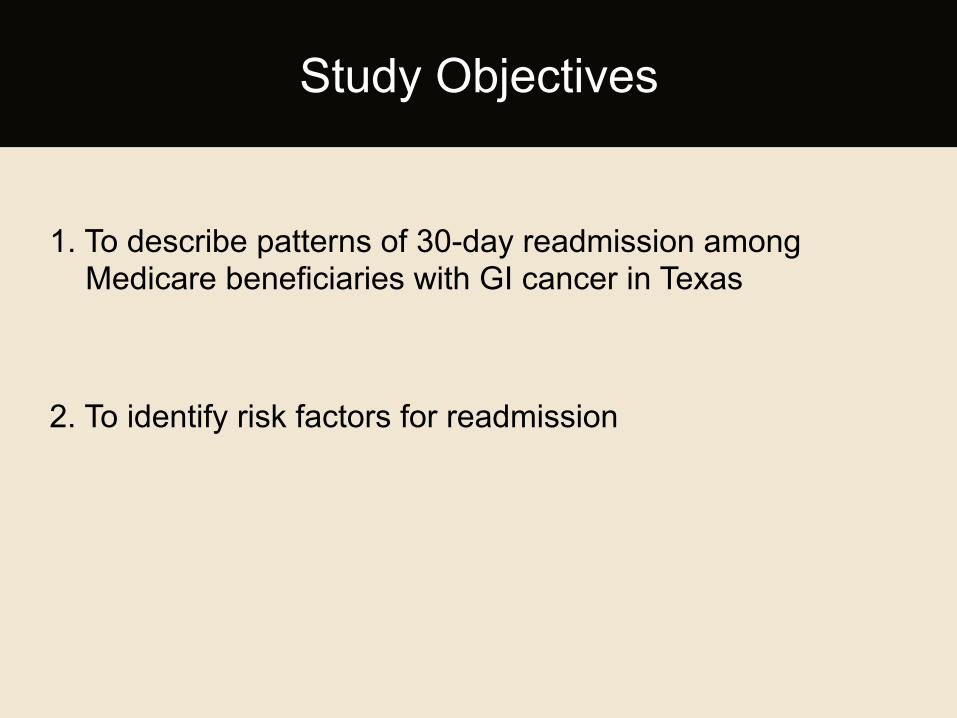
1. To describe patterns of 30-day readmission among Medicare beneficiaries with GI cancer in Texas
2. To identify risk factors for readmission
Study Objectives
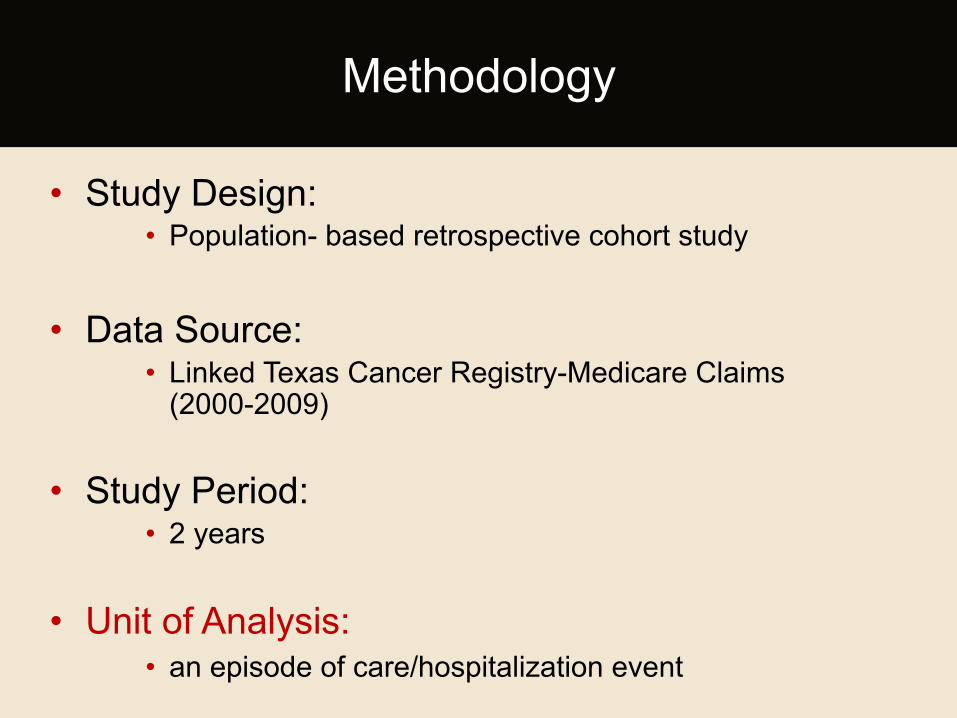
• Study Design: • Population- based retrospective cohort study
• Data Source: • Linked Texas Cancer Registry-Medicare Claims
(2000-2009)
• Study Period: • 2 years
• Unit of Analysis: • an episode of care/hospitalization event
Methodology
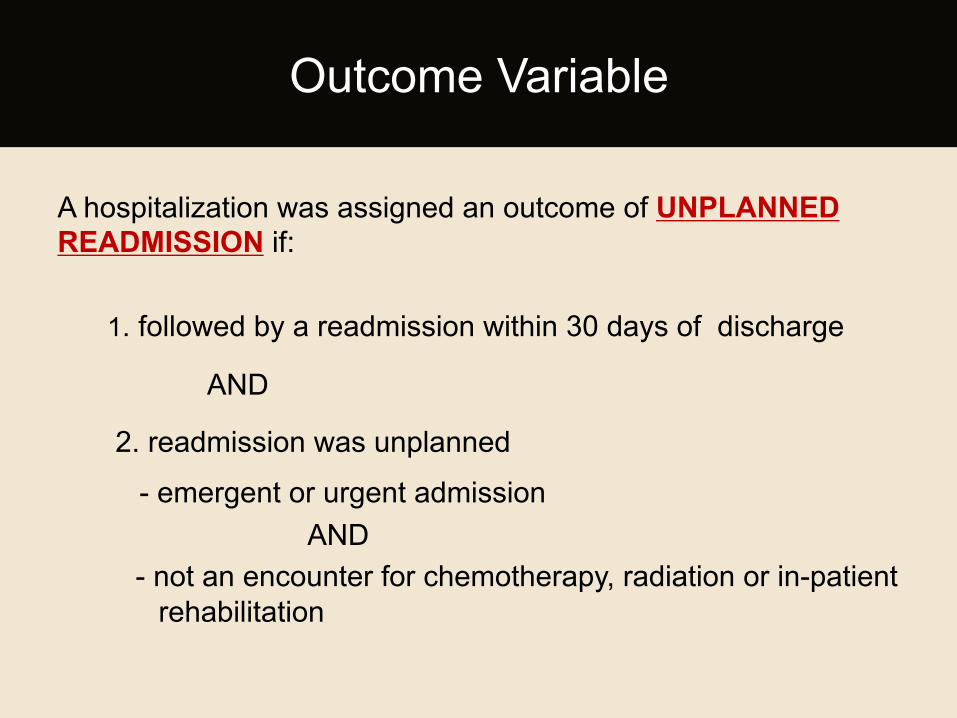
A hospitalization was assigned an outcome of UNPLANNED READMISSION if:
1. followed by a readmission within 30 days of discharge
AND
2. readmission was unplanned
- emergent or urgent admission AND
- not an encounter for chemotherapy, radiation or in-patient rehabilitation
Outcome Variable
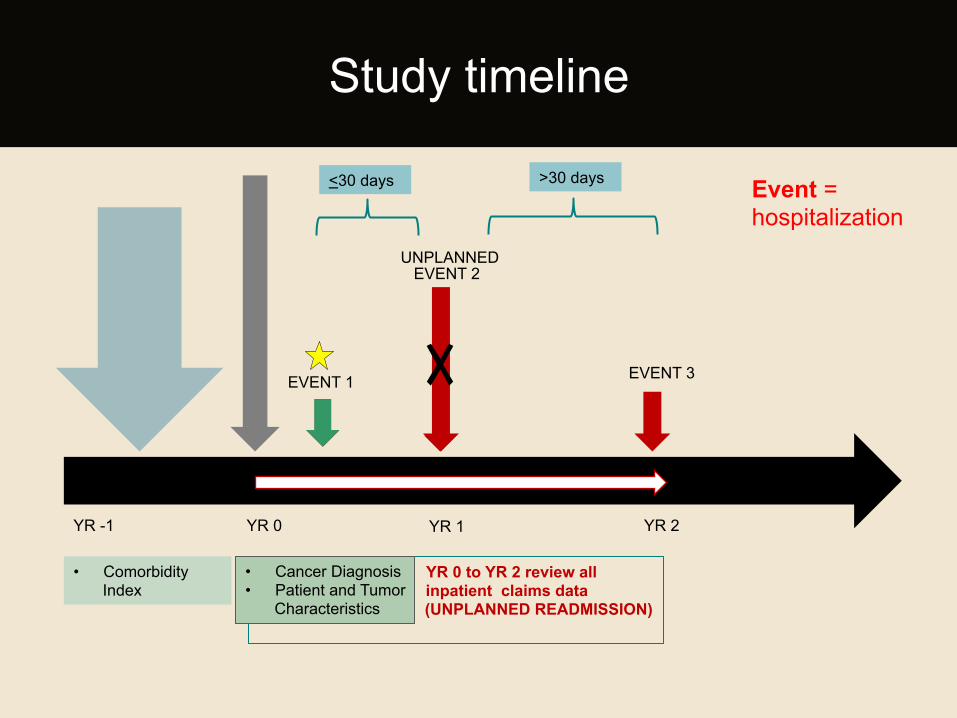
YR 0 to YR 2 review all inpatient claims data
(UNPLANNED READMISSION)
• Cancer Diagnosis • Patient and Tumor
Characteristics
• Comorbidity Index
EVENT 1
EVENT 2
EVENT 3
YR -1 YR 0 YR 1 YR 2
Study timeline
Event = hospitalization
<30 days >30 days
UNPLANNED
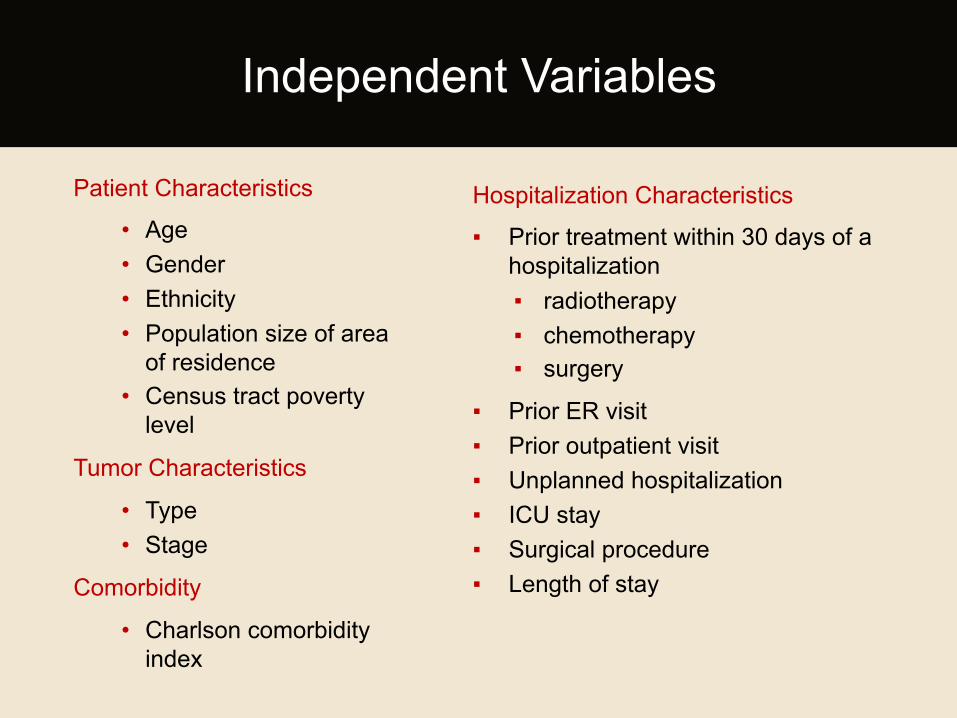
Patient Characteristics
• Age • Gender • Ethnicity • Population size of area
of residence • Census tract poverty
level
Tumor Characteristics
• Type • Stage
Comorbidity
• Charlson comorbidity index
Independent Variables
Hospitalization Characteristics
▪ Prior treatment within 30 days of a hospitalization ▪ radiotherapy ▪ chemotherapy ▪ surgery
▪ Prior ER visit ▪ Prior outpatient visit ▪ Unplanned hospitalization ▪ ICU stay ▪ Surgical procedure ▪ Length of stay
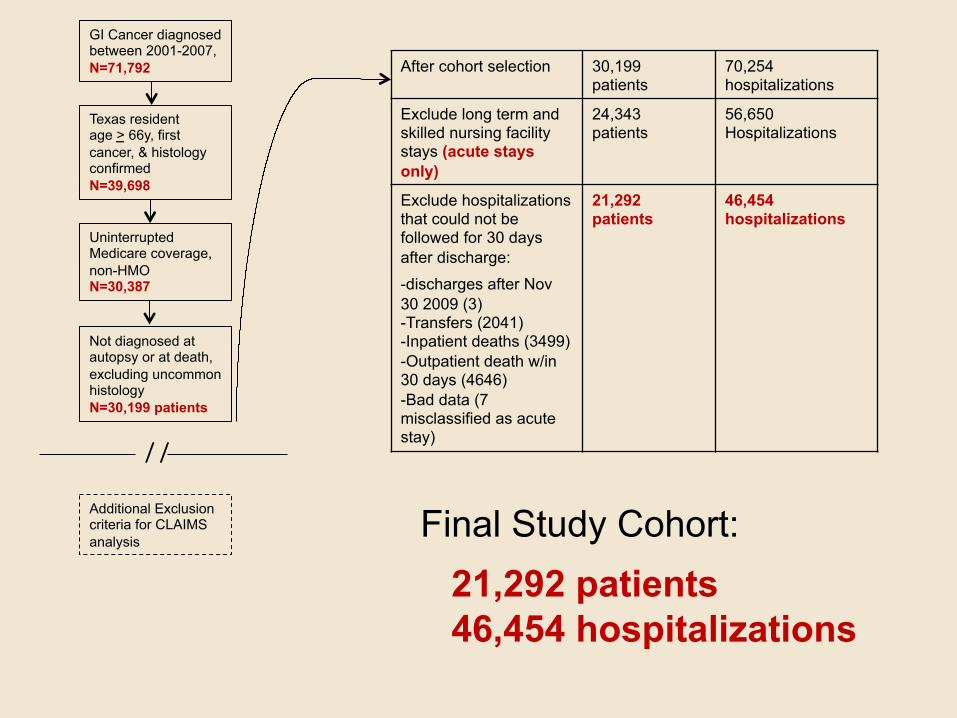
GI Cancer diagnosed between 2001-2007, N=71,792
Texas resident age > 66y, first cancer, & histology confirmed N=39,698
Uninterrupted Medicare coverage, non-HMO N=30,387
Not diagnosed at autopsy or at death, excluding uncommon histology N=30,199 patients
/ /
Additional Exclusion criteria for CLAIMS analysis
Final Study Cohort: 21,292 patients 46,454 hospitalizations
After cohort selection 30,199 patients
70,254 hospitalizations
Exclude long term and skilled nursing facility stays (acute stays only)
24,343 patients
56,650 Hospitalizations
Exclude hospitalizations that could not be followed for 30 days after discharge:
-discharges after Nov 30 2009 (3) -Transfers (2041) -Inpatient deaths (3499) -Outpatient death w/in 30 days (4646) -Bad data (7 misclassified as acute stay)
21,292 patients
46,454 hospitalizations
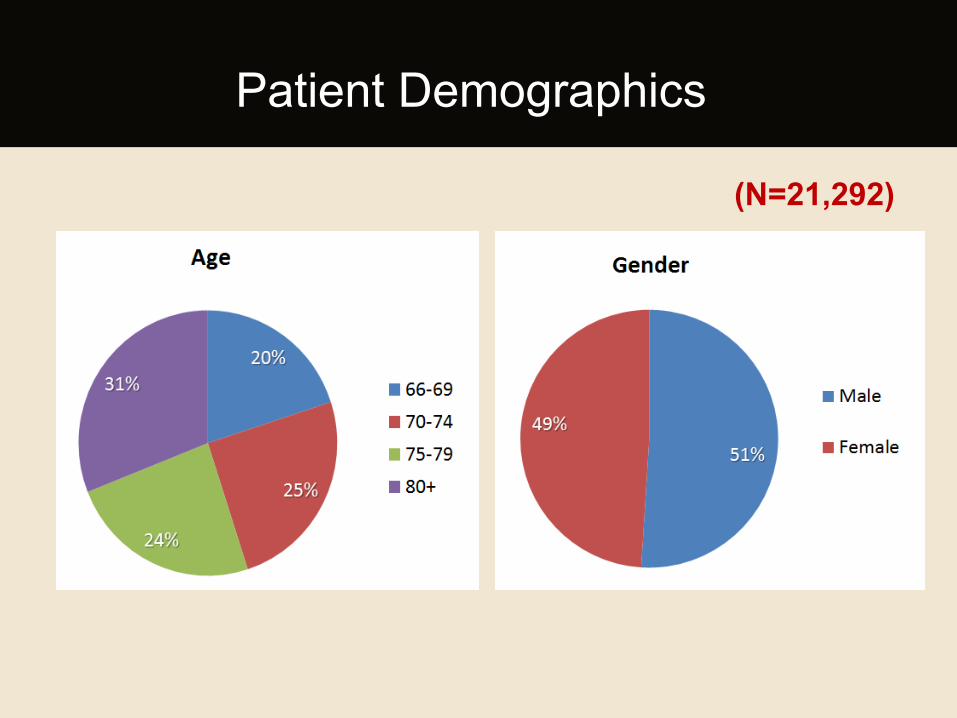
Patient Demographics
(N=21,292)
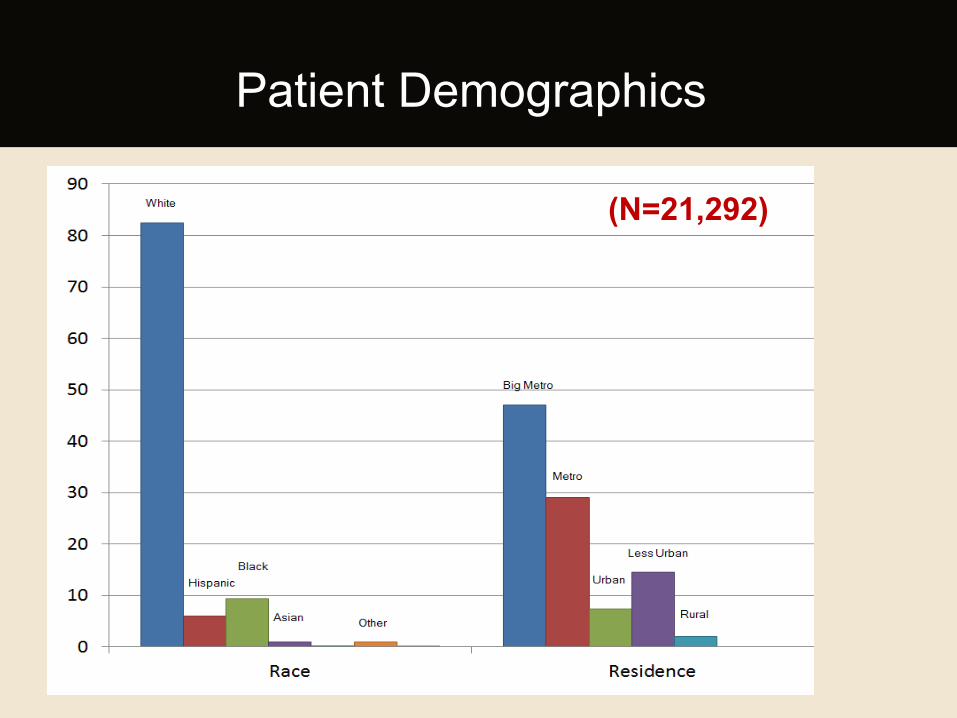
Patient Demographics
(N=21,292)
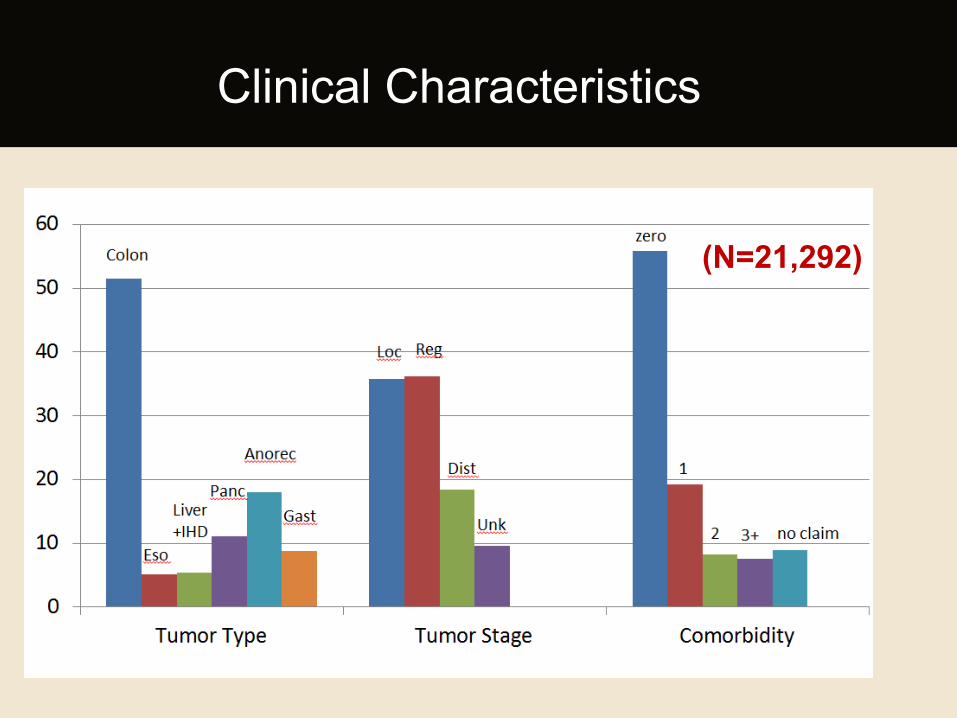
Clinical Characteristics
(N=21,292)
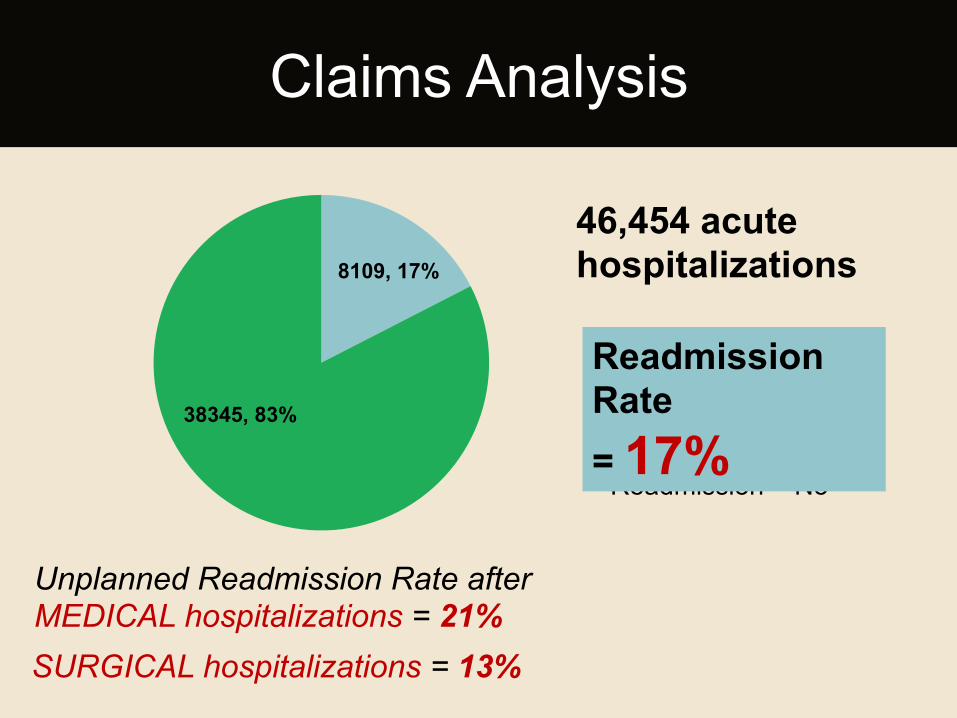
Claims Analysis
8109, 17%
38345, 83%
Unplanned Readmission = Yes
Unplanned Readmission = No
46,454 acute hospitalizations
Readmission Rate = 17%
Unplanned Readmission Rate after MEDICAL hospitalizations = 21%
SURGICAL hospitalizations = 13%
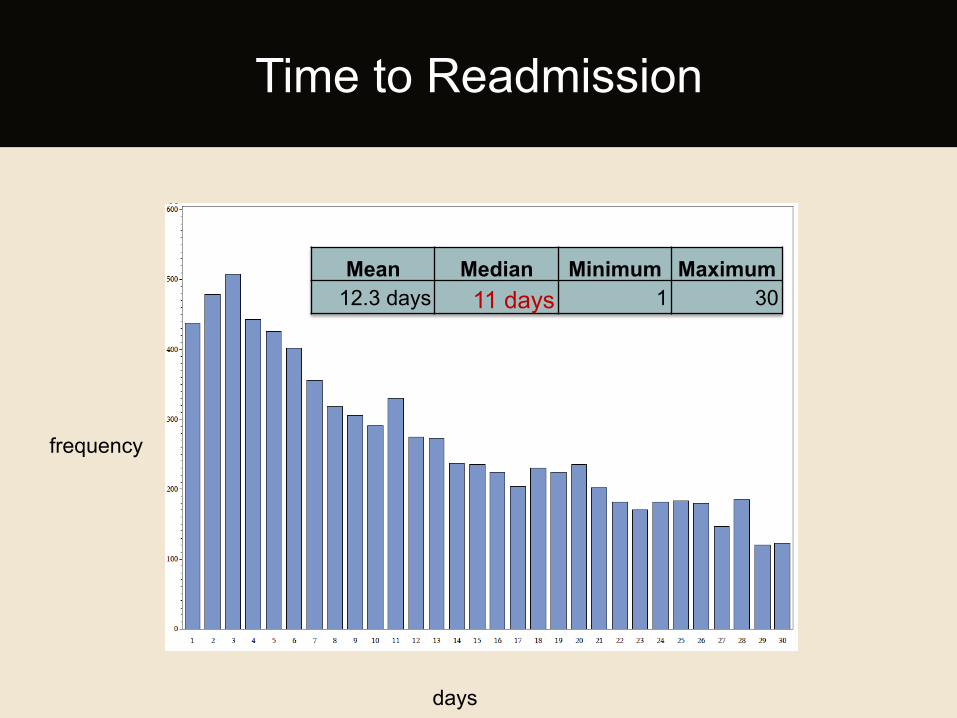
Time to Readmission
Mean Median Minimum Maximum 12.3 days 11 days 1 30
days
frequency
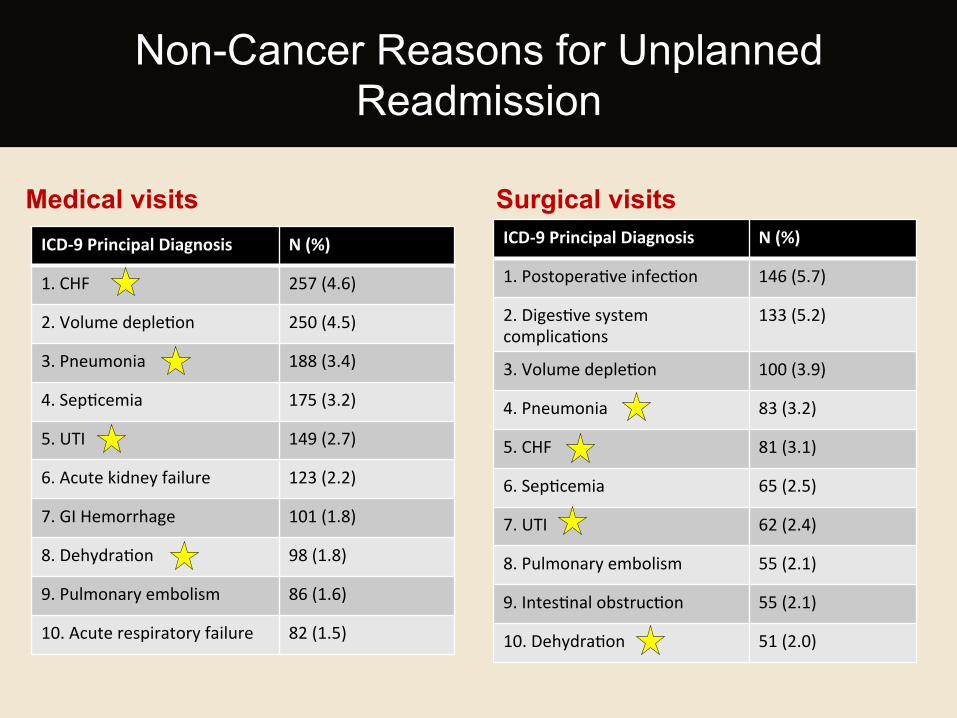
Medical visits ICD-‐9 Principal Diagnosis N (%)
1. CHF 257 (4.6)
2. Volume depleHon 250 (4.5)
3. Pneumonia 188 (3.4)
4. SepHcemia 175 (3.2)
5. UTI 149 (2.7)
6. Acute kidney failure 123 (2.2)
7. GI Hemorrhage 101 (1.8)
8. DehydraHon 98 (1.8)
9. Pulmonary embolism 86 (1.6)
10. Acute respiratory failure 82 (1.5)
Surgical visits ICD-‐9 Principal Diagnosis N (%)
1. PostoperaHve infecHon 146 (5.7)
2. DigesHve system complicaHons
133 (5.2)
3. Volume depleHon 100 (3.9)
4. Pneumonia 83 (3.2)
5. CHF 81 (3.1)
6. SepHcemia 65 (2.5)
7. UTI 62 (2.4)
8. Pulmonary embolism 55 (2.1)
9. IntesHnal obstrucHon 55 (2.1)
10. DehydraHon 51 (2.0)
Non-Cancer Reasons for Unplanned Readmission
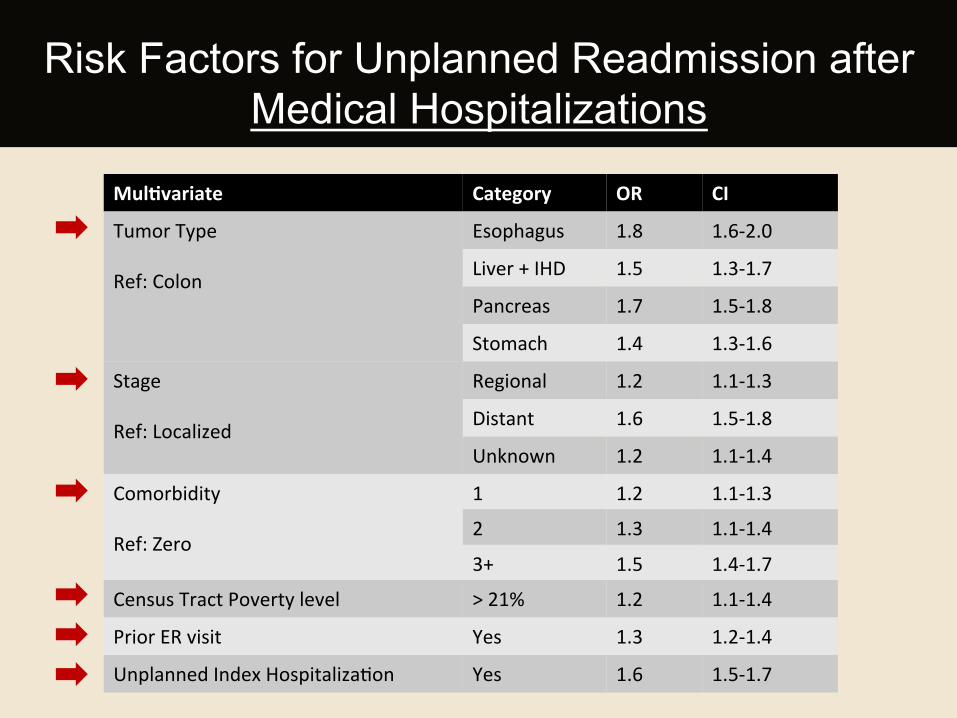
Risk Factors for Unplanned Readmission after Medical Hospitalizations
Mul:variate Category OR CI
Tumor Type Ref: Colon
Esophagus 1.8 1.6-‐2.0
Liver + IHD 1.5 1.3-‐1.7
Pancreas 1.7 1.5-‐1.8
Stomach 1.4 1.3-‐1.6
Stage Ref: Localized
Regional 1.2 1.1-‐1.3
Distant 1.6 1.5-‐1.8
Unknown 1.2 1.1-‐1.4
Comorbidity Ref: Zero
1 1.2 1.1-‐1.3 2 1.3 1.1-‐1.4
3+ 1.5 1.4-‐1.7 Census Tract Poverty level > 21% 1.2 1.1-‐1.4
Prior ER visit Yes 1.3 1.2-‐1.4
Unplanned Index HospitalizaHon Yes 1.6 1.5-‐1.7
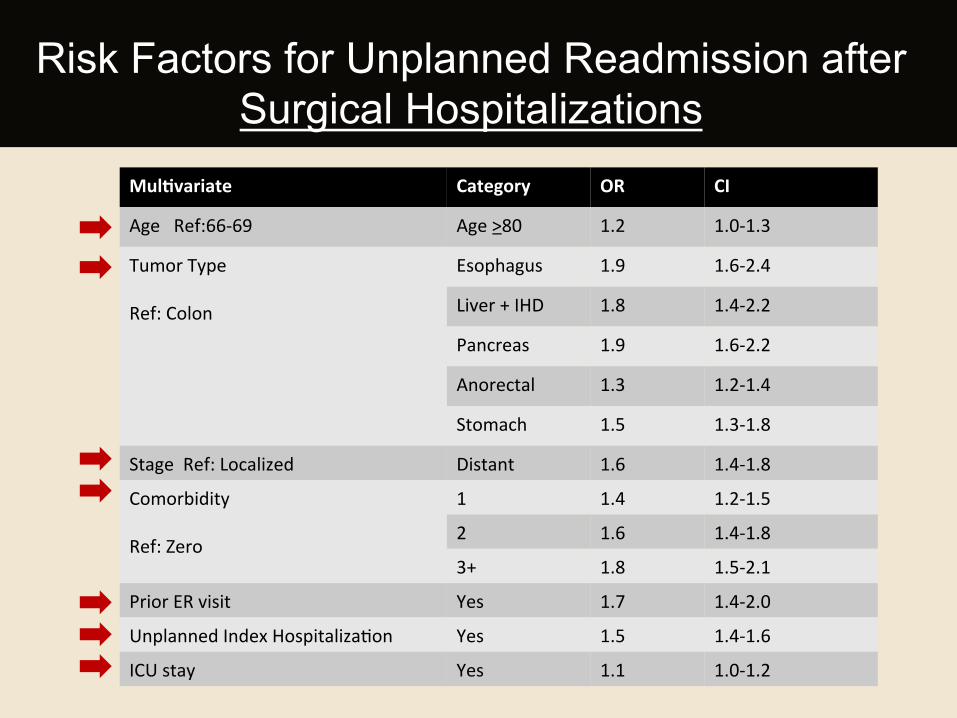
Mul:variate Category OR CI
Age Ref:66-‐69 Age >80 1.2 1.0-‐1.3
Tumor Type Ref: Colon
Esophagus 1.9 1.6-‐2.4
Liver + IHD 1.8 1.4-‐2.2
Pancreas 1.9 1.6-‐2.2
Anorectal 1.3 1.2-‐1.4
Stomach 1.5 1.3-‐1.8
Stage Ref: Localized Distant 1.6 1.4-‐1.8
Comorbidity Ref: Zero
1 1.4 1.2-‐1.5
2 1.6 1.4-‐1.8
3+ 1.8 1.5-‐2.1
Prior ER visit Yes 1.7 1.4-‐2.0
Unplanned Index HospitalizaHon Yes 1.5 1.4-‐1.6
ICU stay Yes 1.1 1.0-‐1.2
Risk Factors for Unplanned Readmission after Surgical Hospitalizations
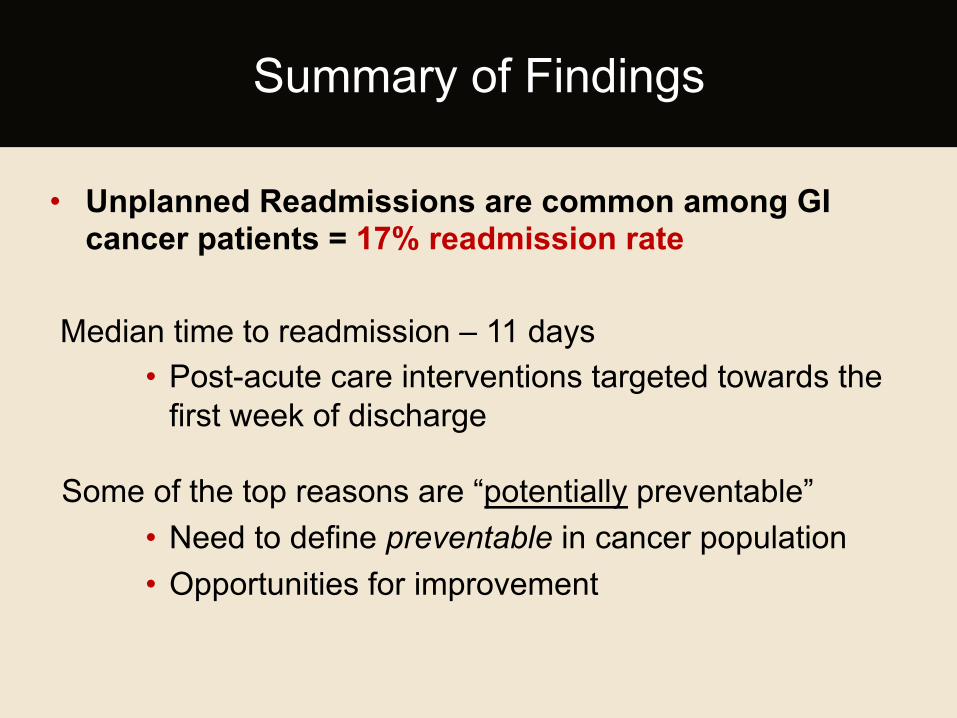
• Unplanned Readmissions are common among GI cancer patients = 17% readmission rate
Median time to readmission – 11 days • Post-acute care interventions targeted towards the
first week of discharge
Some of the top reasons are “potentially preventable” • Need to define preventable in cancer population • Opportunities for improvement
Summary of Findings
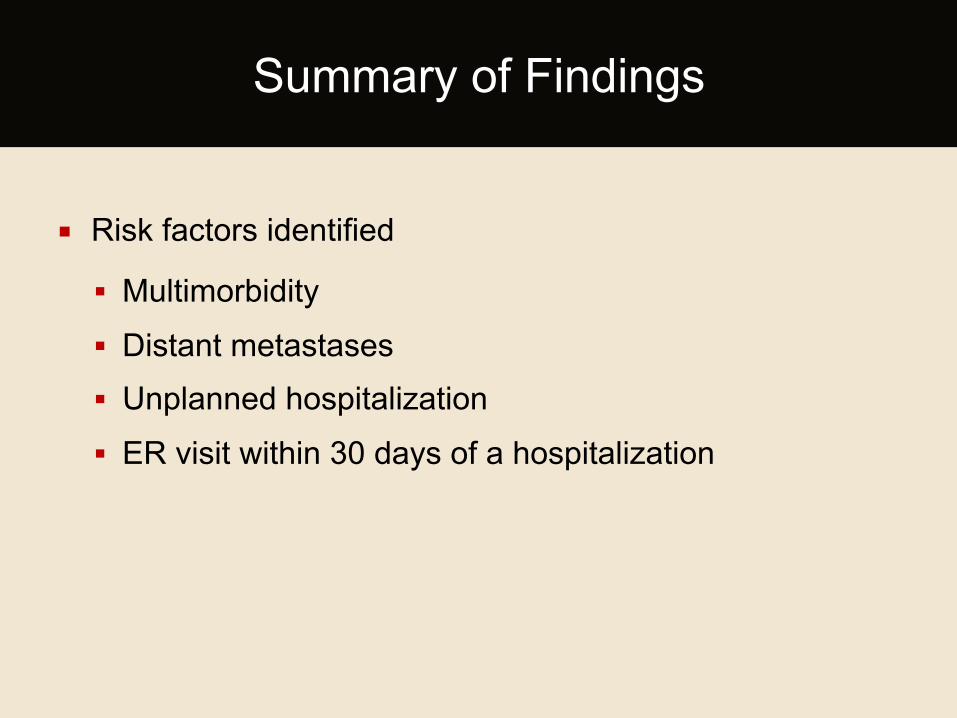
Summary of Findings
¡ Risk factors identified
§ Multimorbidity
§ Distant metastases
§ Unplanned hospitalization
§ ER visit within 30 days of a hospitalization
Unplanned Hospitalizations and
Readmissions among Elderly Patients with GI
Cancer
CONCLUSIONS
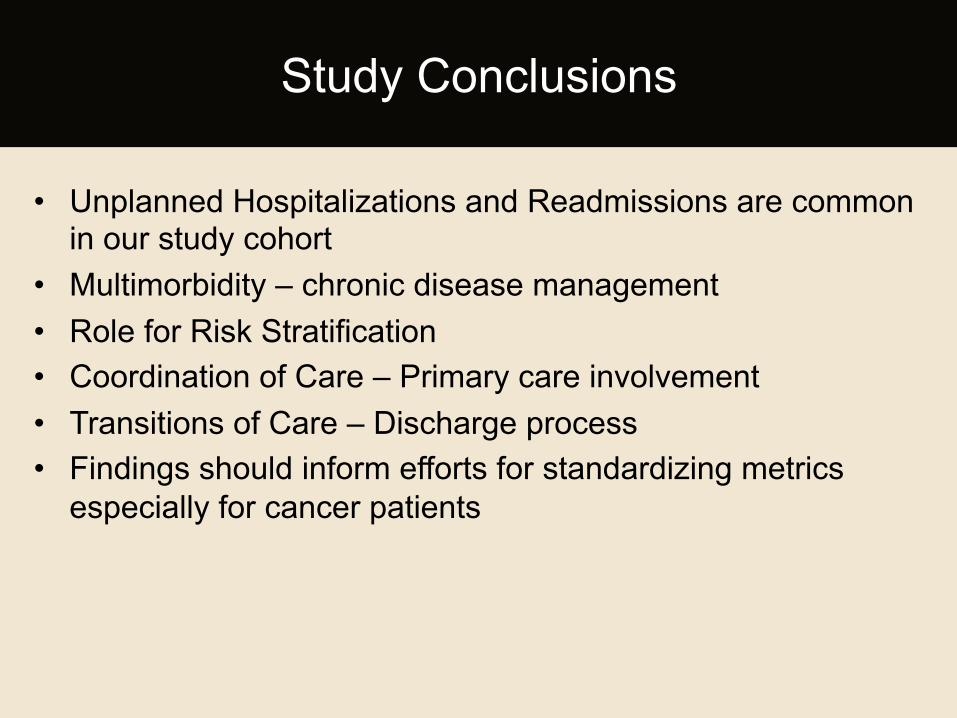
• Unplanned Hospitalizations and Readmissions are common in our study cohort
• Multimorbidity – chronic disease management • Role for Risk Stratification • Coordination of Care – Primary care involvement • Transitions of Care – Discharge process • Findings should inform efforts for standardizing metrics
especially for cancer patients
Study Conclusions
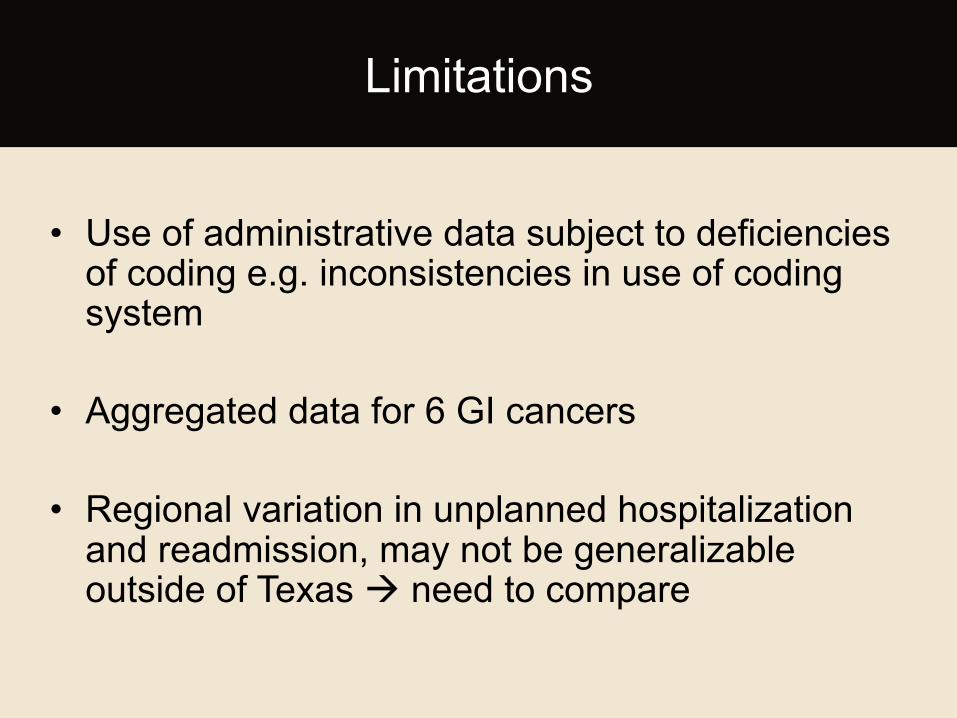
• Use of administrative data subject to deficiencies of coding e.g. inconsistencies in use of coding system
• Aggregated data for 6 GI cancers
• Regional variation in unplanned hospitalization and readmission, may not be generalizable outside of Texas à need to compare
Limitations
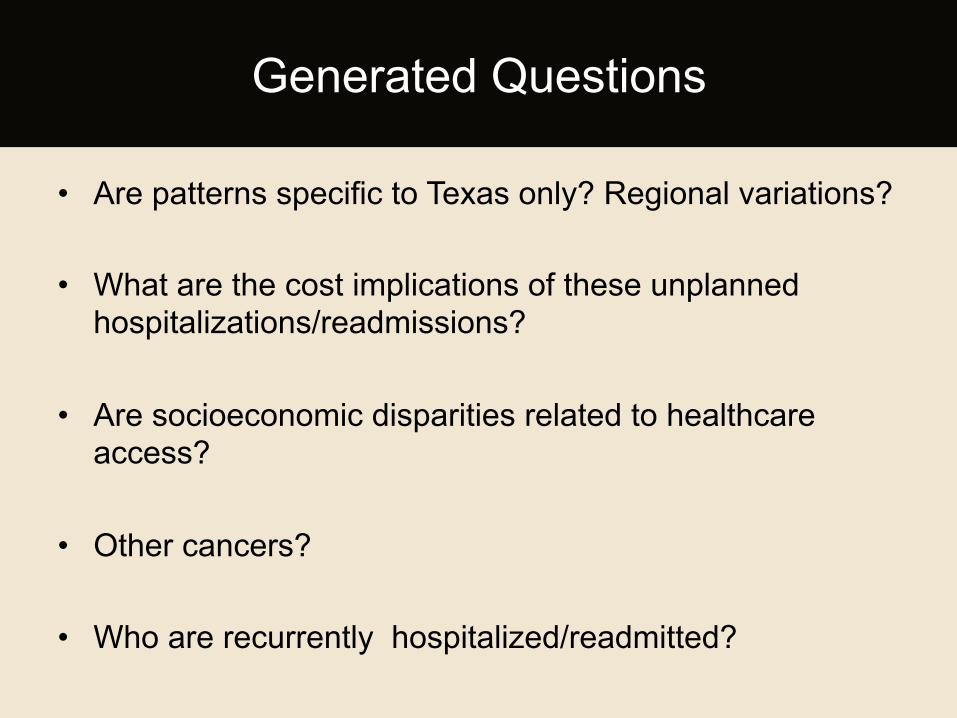
• Are patterns specific to Texas only? Regional variations?
• What are the cost implications of these unplanned hospitalizations/readmissions?
• Are socioeconomic disparities related to healthcare access?
• Other cancers?
• Who are recurrently hospitalized/readmitted?
Generated Questions
Unplanned Hospitalizations and
Readmissions among Elderly Patients with GI
Cancer
NEXT STEPS
• Research Question: What are the risk factors for recurrent unplanned hospitalization among elderly patients with caner?
• Data Source: TCR + SEER-Medicare
• Outcome: Recurrent Hospitalization defined as unplanned hospitalization rate > 1
Research Proposal
• Include cost data • Focus on 1 cancer only? • Explore other variables
– Stents/catheters/ostomies – Outpatient visits/ER visits – Geographic regions
Research Proposal