unlocking europe’s offshore wind potential - - pwc blogs · farms. in japan two offshore wind...
TRANSCRIPT

March 2017
Unlocking Europe’s offshore wind potential
www.pwc.nl
At PwC, our purpose is to build trust in society and solve important problems. We’re a network of firms in 157 countries with more than 223,000 people. At PwC in the Netherlands over 4,700 people work together. We’re committed to delivering quality in assurance, tax and advisory services. Tell us what matters to you and find out more by visiting us at www.pwc.nl.
PricewaterhouseCoopers B.V.Thomas R. Malthusstraat 51066 JR AmsterdamPO Box 903571006 BJ AmsterdamPhone: +31 (0)88 792 00 20Fax: +31 (0)88 792 96 40www.pwc.nl
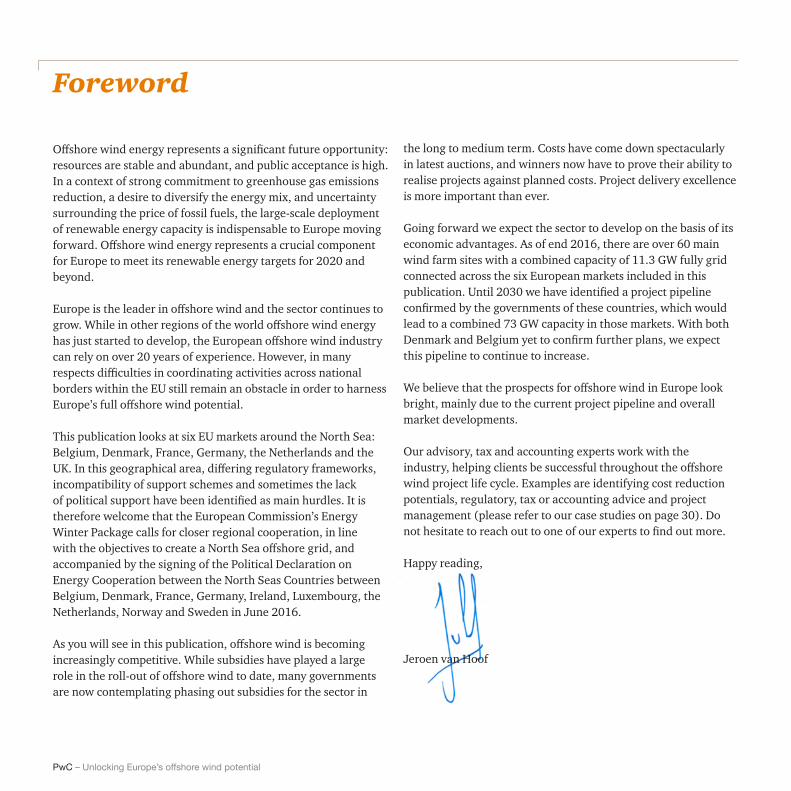
Foreword
Offshore wind energy represents a significant future opportunity: resources are stable and abundant, and public acceptance is high. In a context of strong commitment to greenhouse gas emissions reduction, a desire to diversify the energy mix, and uncertainty surrounding the price of fossil fuels, the large-scale deployment of renewable energy capacity is indispensable to Europe moving forward. Offshore wind energy represents a crucial component for Europe to meet its renewable energy targets for 2020 and beyond.
Europe is the leader in offshore wind and the sector continues to grow. While in other regions of the world offshore wind energy has just started to develop, the European offshore wind industry can rely on over 20 years of experience. However, in many respects difficulties in coordinating activities across national borders within the EU still remain an obstacle in order to harness Europe’s full offshore wind potential.
This publication looks at six EU markets around the North Sea: Belgium, Denmark, France, Germany, the Netherlands and the UK. In this geographical area, differing regulatory frameworks, incompatibility of support schemes and sometimes the lack of political support have been identified as main hurdles. It is therefore welcome that the European Commission’s Energy Winter Package calls for closer regional cooperation, in line with the objectives to create a North Sea offshore grid, and accompanied by the signing of the Political Declaration on Energy Cooperation between the North Seas Countries between Belgium, Denmark, France, Germany, Ireland, Luxembourg, the Netherlands, Norway and Sweden in June 2016.
As you will see in this publication, offshore wind is becoming increasingly competitive. While subsidies have played a large role in the roll-out of offshore wind to date, many governments are now contemplating phasing out subsidies for the sector in
the long to medium term. Costs have come down spectacularly in latest auctions, and winners now have to prove their ability to realise projects against planned costs. Project delivery excellence is more important than ever.
Going forward we expect the sector to develop on the basis of its economic advantages. As of end 2016, there are over 60 main wind farm sites with a combined capacity of 11.3 GW fully grid connected across the six European markets included in this publication. Until 2030 we have identified a project pipeline confirmed by the governments of these countries, which would lead to a combined 73 GW capacity in those markets. With both Denmark and Belgium yet to confirm further plans, we expect this pipeline to continue to increase.
We believe that the prospects for offshore wind in Europe look bright, mainly due to the current project pipeline and overall market developments.
Our advisory, tax and accounting experts work with the industry, helping clients be successful throughout the offshore wind project life cycle. Examples are identifying cost reduction potentials, regulatory, tax or accounting advice and project management (please refer to our case studies on page 30). Do not hesitate to reach out to one of our experts to find out more.
Happy reading,
Jeroen van Hoof
PwC – Unlocking Europe’s offshore wind potential
Table of contents
1. Offshore wind market update 5
2. Market design update in six key European markets 11
3. Our service offerings 31
4. Contact details 41
4 PwC – Unlocking Europe’s offshore wind potential

1. Offshore wind market update – EuropeTwo record years for the European offshore wind market
2015 and 2016 were both record years for offshore wind power in Europe and there are signs that 2017 will be at least as eventful and successful, if not better, than the previous two years. 2015 broke1 the record by far in terms of new capacity that came online: over 3.5 GW in capacity in three main markets – Germany, the Netherlands and the UK. Of this 2.4 GW came online in Germany alone, and was largely due to the delay in grid connections in previous years (as delayed farms finally came online in 2015). The UK and the Netherlands added 1 GW and 129 MW respectively. In 2016 much less capacity was added – just above 600 MW in those same three markets, but a number of consecutive record-breaking tenders in the Netherlands and Denmark mean that there is a very strong project pipeline for the years to come. In this publication we look particularly at six main markets for offshore wind in Europe:
Belgium, Denmark, France, Germany, the Netherlands and the UK. In those markets the cumulative total installed and grid connected capacity at the end of 2016 was over 11 GW. Worldwide, over 14 GW was installed end of 2016, showing the importance of European markets.
The UK still has the largest offshore wind capacity in Europe at 5.1 GW and accounting for 45% of total installed capacity in the six markets that make up this study (please refer to figure 1). In the full calendar year of 2016 Germany took the second place with 34% of installed capacity. Other European markets (not included in this publication), are Sweden, Finland, Ireland, Spain, Norway and Portugal.
5.1 GW25 farms
45%
357 MW3 farms
3%
1.3 GW13 farms
11%
3.9 GW15 farms
34%
712 MW6 farms
6%
0 MW0 farms
% of capacity installed (across the six markets)
UKNetherlands
Denmark
Germany
Belgium
France
Source: PwC data and analysis
Figure 1. Offshore wind capacity across six European markets in 2016
1 Estimates vary across sources due to for example differing commissioning dates. Figures are based on PwC internal data.
5PwC – Unlocking Europe’s offshore wind potential
Outside European watersEurope is still leading with the development and installation of this technology, but in 2016 offshore wind gained momentum also outside of European waters. In the US, the country’s first offshore wind farm, off Block Island, went into commercial operation, and Statoil secured the lease rights for the development of an offshore wind farm off the coast of New York, offering US $42.5 million at the US government’s auction.
In Asia, Taiwan is becoming an attractive market for developers and Japan is gearing up for a boom in offshore wind projects. In Taiwan, Taipower has set ambitious plans, and DONG Energy is planning to build four wind farms. In Japan two offshore wind farms with a combined capacity of 270 MW are being developed, and the city of Kitakyushu will auction 2687 hectares of water area for nearshore wind farms. China is the largest market outside of Europe, but is lagging behind its target for offshore wind power capacity due to technical problems and high costs.
Furthermore, in 2016 Russia got onto the offshore wind map with the recent agreement between China’s Sinomec and the region of Karelia, under which the construction of a 60 MW offshore wind farm will start as early as 2017.
Worldwide, capital spending commitments to offshore wind hit US $29.9 billion in 2016, up 40% on the previous year.
Bigger and betterIn 2016, not only did offshore wind grow in terms of capacity, but also in terms of size of components and the wind farms themselves. Last year saw the go-ahead for the largest offshore wind project to date, DONG Energy’s 1.2 GW Horn Sea array off the UK coast. Seajacks Scylla, the world’s largest offshore wind jack-up vessel, installed the world’s heaviest monopile at the German Veja Mate site, while the world’s most powerful wind turbine was installed at the Burbo Bank Extension site in the UK. Furthermore, the world’s longest blade and the largest wind turbine gearbox were also introduced on the market in 2016. We expect that technological improvements will continue to be a driver in the years to come as larger windmills mean greater capacity and reliability, and as the potential at sea levels greater than 50 metres are developed.
Decommissioning beginsAt the same time as new capacity is being installed the first decommissioning projects in offshore wind also began in 2016. In Sweden, Vattenfall dismantled five wind turbines with a total capacity of 10 MW which made up the Yttre Stengrund wind farm in Kalmar Sund, and DONG Energy announced that it is preparing to decommission Vindeby, the world’s first offshore wind farm in Denmark. Nuon, decommissioned four offshore wind turbines that made up the Lely offshore wind farm in the Netherlands. The 10 MW Beatrice demonstration wind farm in the UK, and the German 5 MW Hooksiel projects were also dismantled in 2016.
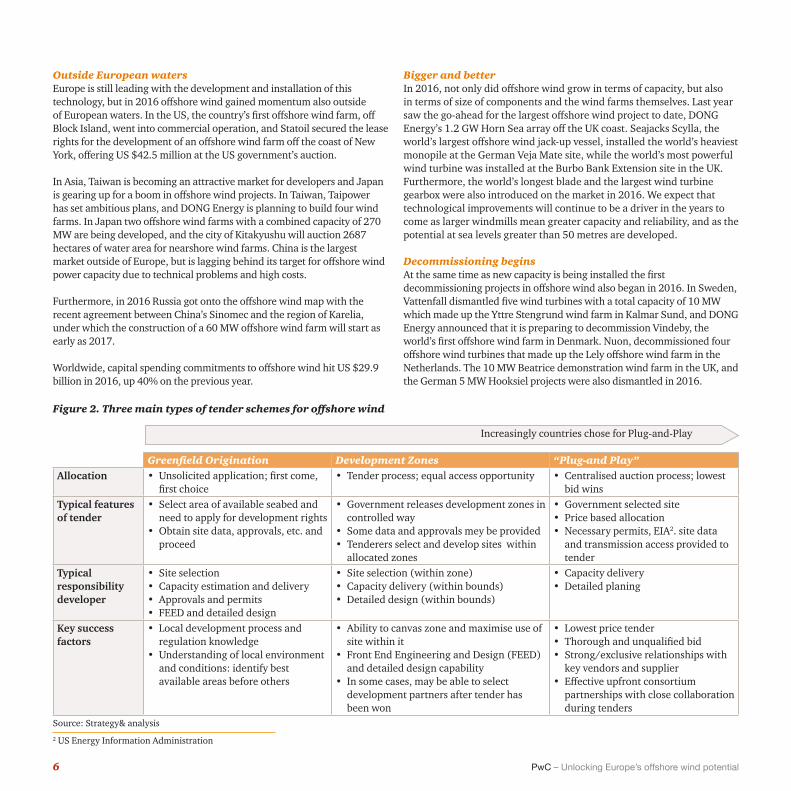
Figure 2. Three main types of tender schemes for offshore wind
Greenfield Origination Development Zones “Plug-and Play”Allocation • Unsolicited application; first come,
first choice• Tender process; equal access opportunity • Centralised auction process; lowest
bid winsTypical features of tender
• Select area of available seabed and need to apply for development rights
• Obtain site data, approvals, etc. and proceed
• Government releases development zones in controlled way
• Some data and approvals mey be provided• Tenderers select and develop sites within
allocated zones
• Government selected site• Price based allocation• Necessary permits, EIA2. site data
and transmission access provided to tender
Typical responsibility developer
• Site selection• Capacity estimation and delivery• Approvals and permits• FEED and detailed design
• Site selection (within zone)• Capacity delivery (within bounds)• Detailed design (within bounds)
• Capacity delivery• Detailed planing
Key success factors
• Local development process and regulation knowledge
• Understanding of local environment and conditions: identify best available areas before others
• Ability to canvas zone and maximise use of site within it
• Front End Engineering and Design (FEED) and detailed design capability
• In some cases, may be able to select development partners after tender has been won
• Lowest price tender• Thorough and unqualified bid• Strong/exclusive relationships with
key vendors and supplier• Effective upfront consortium
partnerships with close collaboration during tenders
2 US Energy Information Administration
Increasingly countries chose for Plug-and-Play
Source: Strategy& analysis
6 PwC – Unlocking Europe’s offshore wind potential

The future for offshore wind looks bright
Recent years have seen a change in the way most countries award subsidies for offshore wind, driven by the need to increase competition and push down costs of offshore wind. A number of European countries that support offshore wind, like Denmark and the Netherlands, now use competitive tenders in which companies bid for offshore sites. In those systems, permits are granted simultaneously (what we refer to as a “plug-and-play” model, please see figure 2) which lowers developing time and costs. Germany is in the process of changing to a tender based system as well, with an interim system in place for projects commissioned in the transition years 2021-2025. For projects commissioned after 2026 a competitive tender system will be in place.
Rapid cost reduction Offshore wind has been on a strong cost reduction pathway in the past years. This is supported by four consecutive bids in Denmark and the Netherlands in the latter part of 2016. In July DONG Energy won a bid to develop the Borssele 1 and 2 sites with a bid price of 7.27 cent per kWh, and in December a Dutch consortium consisting of Shell, Van Oord, Eneco and Mitsubishi/DGE won the bid for the Borssele 3 and 4 with a bid price of 5.45 cent per kWh. In more shallow waters Vattenfall won a bid for the near-shore Danish Vesterhav Syd and Vesterhav Nord at 6.4 cent per kWh in September. And they won a bid for the off-shore Kriegers Flak sites in the Danish Baltic Sea at 4.99 cent per kWh in November 2016. 3
Also in the UK, the cost of producing electricity from offshore wind farms has fallen drastically. The sector has seen an overall cost reduction of 32% in the past four years, as offshore wind costs fell to an average of £97 per MWh in the 2015-2016 financial year (from £142 per MWh four years earlier). This puts the cost of offshore wind close to that of new nuclear plants. As a comparison the government contract awarded to EDF for its Hinkley C reactor project was at £92.50 per MWh. The steep decrease in costs also means that the industry will meet the government’s target for cost reduction four years ahead of plan.
Both the rollout of competitive tender schemes, and improved economics, resulting from bigger turbine sizes and better construction know-how have supported recent cost reductions. Additionally, the decline in commodity prices (most notably steel), as well as low interest rates have given cost reduction a further push. The latter external factors may of course turn out less favourable in the future, but we believe that the structural changes in the cost of offshore wind will outbalance this effect. In 2015, compared to 2010 levels, only 7.5% of the cost reduction potential for offshore wind originated from of external factors such as those mentioned above.4
A strong project pipelineThe record breaking developments in offshore wind in the past two years show that the technology has taken huge strides in terms of cost-effectiveness. This proves its reliability and performance in becoming a competitive alternative to conventional energy sources. As the industry matures and the trust in offshore wind as a cost competitive technology increases, we foresee an increase in government support across Europe, and thus for the pipeline of projects to grow. In fact some governments (most notably Germany and the Netherlands) have already announced a project pipeline post 2020, due to the favourable conditions outlined above. According to our assessment of confirmed and planned projects,
3 All prices are excluding grid connection 4 See TKI Wind op Zee, (2015): http://tki-windopzee.nl/files/2015-10/151028-tki-offshore-wind-cost-reduction-final-stc.pdf, for more details.
Figure 4. Confirmed capacity in operation and planned capacity until 2030MW
Figure 3. Bid price offshore wind (excluding grid connection costs) €/MWh
Denmark
in operation pipeline
Belgium
2016 - Borssele 1+2
France
2015 - Horns Rev III
103.072.7 64.0 49.9 54.5
Netherlands Germany
2016 - Kriegers Flak
Vester Syd and Nord
Total
2016 - Borssele 3+4
UK
15,039
11,175
3,864
30,889
25,805
5,084
73,421
62,138
11,283
2,6511,385
1.266
2,2721,560
71211,457
11,100
35711,113
11,113
0
Source: PwC analysis
Source: PwC analysis
7PwC – Unlocking Europe’s offshore wind potential
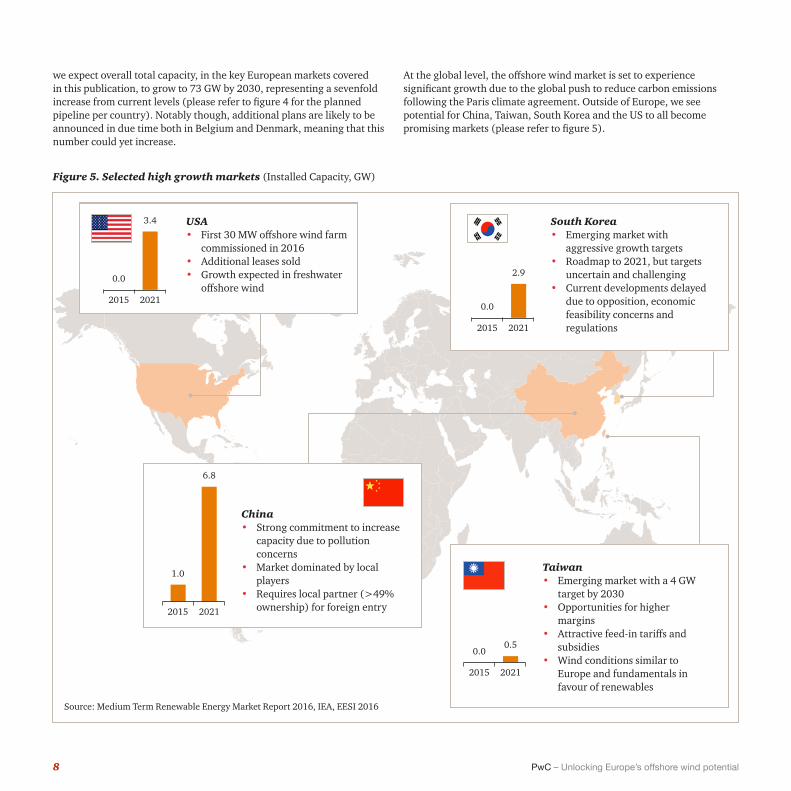
Figure 5. Selected high growth markets (Installed Capacity, GW)
2015 2021
3.4
0.0
2015 2021
0.50.0
2015 2021
2.9
0.0
2015 2021
6.8
1.0
we expect overall total capacity, in the key European markets covered in this publication, to grow to 73 GW by 2030, representing a sevenfold increase from current levels (please refer to figure 4 for the planned pipeline per country). Notably though, additional plans are likely to be announced in due time both in Belgium and Denmark, meaning that this number could yet increase.
At the global level, the offshore wind market is set to experience significant growth due to the global push to reduce carbon emissions following the Paris climate agreement. Outside of Europe, we see potential for China, Taiwan, South Korea and the US to all become promising markets (please refer to figure 5).
USA• First 30 MW offshore wind farm
commissioned in 2016• Additional leases sold• Growth expected in freshwater
offshore wind
China• Strong commitment to increase
capacity due to pollution concerns
• Market dominated by local players
• Requires local partner (>49% ownership) for foreign entry
South Korea• Emerging market with
aggressive growth targets• Roadmap to 2021, but targets
uncertain and challenging• Current developments delayed
due to opposition, economic feasibility concerns and regulations
Taiwan• Emerging market with a 4 GW
target by 2030• Opportunities for higher
margins• Attractive feed-in tariffs and
subsidies• Wind conditions similar to
Europe and fundamentals in favour of renewables
Source: Medium Term Renewable Energy Market Report 2016, IEA, EESI 2016
8 PwC – Unlocking Europe’s offshore wind potential
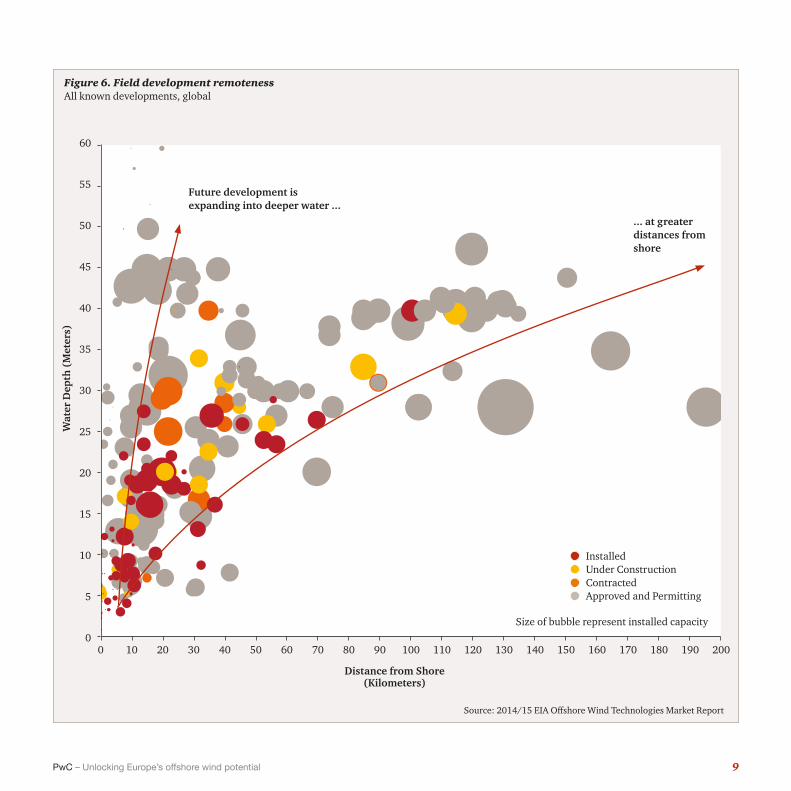
Figure 6. Field development remoteness All known developments, global
Wat
er D
epth
(M
eter
s)
Distance from Shore (Kilometers)
Source: 2014/15 EIA Offshore Wind Technologies Market Report
60
55
50
45
40
35
30
25
20
15
10
5
0200190150100 180140905020 17013070 804010 160110 12060300
Future development is expanding into deeper water ...
... at greater distances from shore
InstalledUnder ConstructionContractedApproved and Permitting
Size of bubble represent installed capacity
9PwC – Unlocking Europe’s offshore wind potential
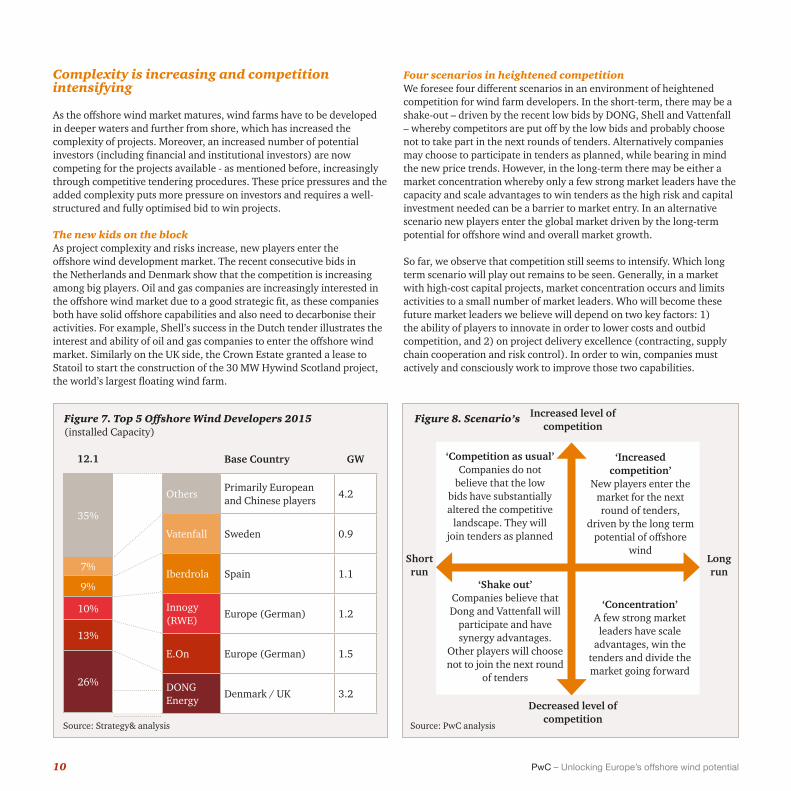
Complexity is increasing and competition intensifying
As the offshore wind market matures, wind farms have to be developed in deeper waters and further from shore, which has increased the complexity of projects. Moreover, an increased number of potential investors (including financial and institutional investors) are now competing for the projects available - as mentioned before, increasingly through competitive tendering procedures. These price pressures and the added complexity puts more pressure on investors and requires a well-structured and fully optimised bid to win projects.
The new kids on the blockAs project complexity and risks increase, new players enter the offshore wind development market. The recent consecutive bids in the Netherlands and Denmark show that the competition is increasing among big players. Oil and gas companies are increasingly interested in the offshore wind market due to a good strategic fit, as these companies both have solid offshore capabilities and also need to decarbonise their activities. For example, Shell’s success in the Dutch tender illustrates the interest and ability of oil and gas companies to enter the offshore wind market. Similarly on the UK side, the Crown Estate granted a lease to Statoil to start the construction of the 30 MW Hywind Scotland project, the world’s largest floating wind farm.
Four scenarios in heightened competitionWe foresee four different scenarios in an environment of heightened competition for wind farm developers. In the short-term, there may be a shake-out – driven by the recent low bids by DONG, Shell and Vattenfall – whereby competitors are put off by the low bids and probably choose not to take part in the next rounds of tenders. Alternatively companies may choose to participate in tenders as planned, while bearing in mind the new price trends. However, in the long-term there may be either a market concentration whereby only a few strong market leaders have the capacity and scale advantages to win tenders as the high risk and capital investment needed can be a barrier to market entry. In an alternative scenario new players enter the global market driven by the long-term potential for offshore wind and overall market growth.
So far, we observe that competition still seems to intensify. Which long term scenario will play out remains to be seen. Generally, in a market with high-cost capital projects, market concentration occurs and limits activities to a small number of market leaders. Who will become these future market leaders we believe will depend on two key factors: 1) the ability of players to innovate in order to lower costs and outbid competition, and 2) on project delivery excellence (contracting, supply chain cooperation and risk control). In order to win, companies must actively and consciously work to improve those two capabilities.
Increased level of competition
Short run
Decreased level of competition
Long run
‘Competition as usual’Companies do not
believe that the low bids have substantially altered the competitive
landscape. They will join tenders as planned
‘Shake out’Companies believe that Dong and Vattenfall will
participate and have synergy advantages.
Other players will choose not to join the next round
of tenders
‘Increased competition’
New players enter the market for the next round of tenders,
driven by the long term potential of offshore
wind
‘Concentration’A few strong market
leaders have scale advantages, win the
tenders and divide the market going forward
Figure 7. Top 5 Offshore Wind Developers 2015 (installed Capacity)
Figure 8. Scenario’s
Base Country GW
OthersPrimarily European and Chinese players
4.2
Vatenfall Sweden 0.9
Iberdrola Spain 1.1
Innogy (RWE)
Europe (German) 1.2
E.On Europe (German) 1.5
DONG Energy
Denmark / UK 3.2
35%
7%
9%
10%
13%
26%
12.1
Source: Strategy& analysis Source: PwC analysis
10 PwC – Unlocking Europe’s offshore wind potential

2. Market design update in six key European markets
In this publication we look particularly at six main markets for offshore wind in Europe: Belgium, Denmark, France, Germany, the Netherlands and the UK. In those markets the cumulative total installed and grid connected capacity at the end of 2016 was over 11 GW. For each market we describe the key market developments and the pipeline of projects. Until 2030 we have identified a project pipeline confirmed by the governments of these countries, which would add a combined 73 GW capacity in those markets. With both Denmark and Belgium yet to confirm further plans, we expect this pipeline to continue to increase.
11PwC – Unlocking Europe’s offshore wind potential
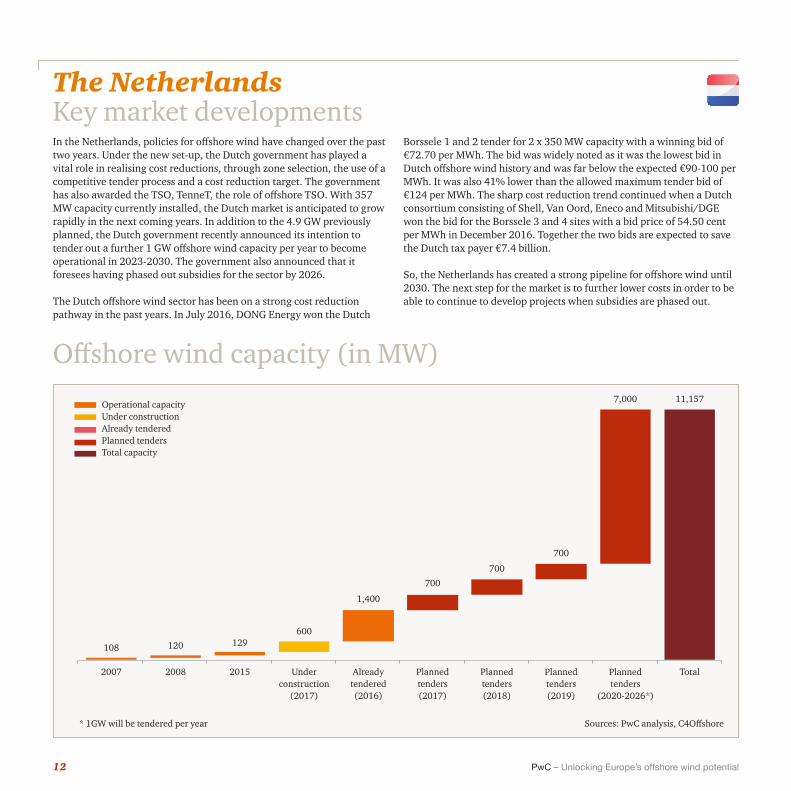
Offshore wind capacity (in MW)
2007
108
2008
120
2015
129600
Operational capacity Under construction Already tendered Planned tenders Total capacity
Already tendered (2016)
Planned tenders (2018)
Planned tenders (2017)
Planned tenders (2019)
Planned tenders
(2020-2026*)
Under construction
(2017)
1,400
700
700
700
Total
11,1577,000
The NetherlandsKey market developmentsIn the Netherlands, policies for offshore wind have changed over the past two years. Under the new set-up, the Dutch government has played a vital role in realising cost reductions, through zone selection, the use of a competitive tender process and a cost reduction target. The government has also awarded the TSO, TenneT, the role of offshore TSO. With 357 MW capacity currently installed, the Dutch market is anticipated to grow rapidly in the next coming years. In addition to the 4.9 GW previously planned, the Dutch government recently announced its intention to tender out a further 1 GW offshore wind capacity per year to become operational in 2023-2030. The government also announced that it foresees having phased out subsidies for the sector by 2026.
The Dutch offshore wind sector has been on a strong cost reduction pathway in the past years. In July 2016, DONG Energy won the Dutch
Borssele 1 and 2 tender for 2 x 350 MW capacity with a winning bid of €72.70 per MWh. The bid was widely noted as it was the lowest bid in Dutch offshore wind history and was far below the expected €90-100 per MWh. It was also 41% lower than the allowed maximum tender bid of €124 per MWh. The sharp cost reduction trend continued when a Dutch consortium consisting of Shell, Van Oord, Eneco and Mitsubishi/DGE won the bid for the Borssele 3 and 4 sites with a bid price of 54.50 cent per MWh in December 2016. Together the two bids are expected to save the Dutch tax payer €7.4 billion.
So, the Netherlands has created a strong pipeline for offshore wind until 2030. The next step for the market is to further lower costs in order to be able to continue to develop projects when subsidies are phased out.
Sources: PwC analysis, C4Offshore* 1GW will be tendered per year
12 PwC – Unlocking Europe’s offshore wind potential
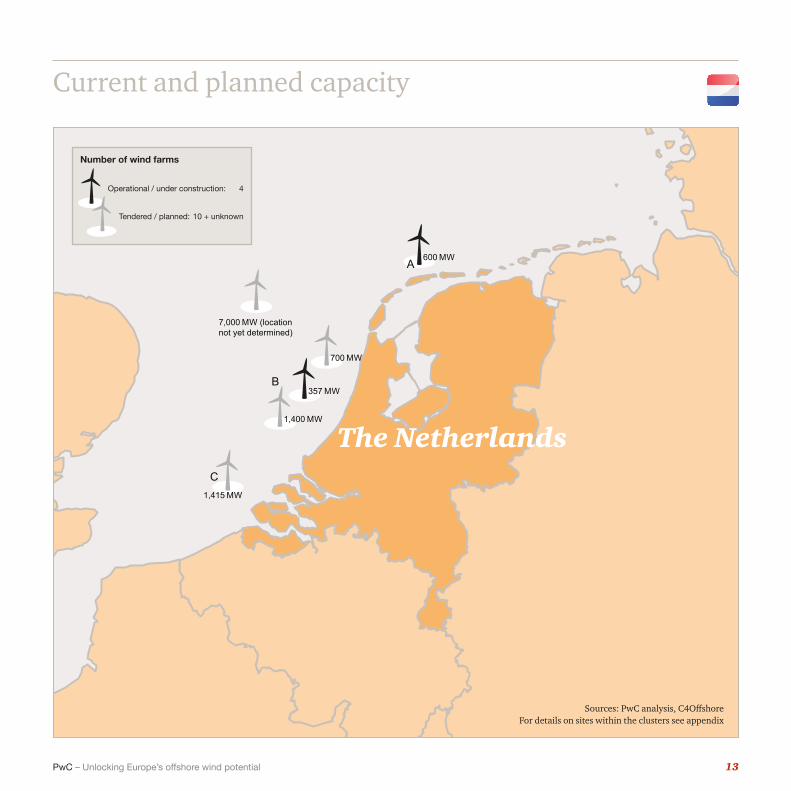
600 MWA
357 MWB
1,400 MW
C1,415 MW
700 MW
7,000 MW (locationnot yet determined)
Current and planned capacity
Number of wind farms
The Netherlands
Sources: PwC analysis, C4OffshoreFor details on sites within the clusters see appendix
Operational / under construction: 4
Tendered / planned: 10 + unknown
13PwC – Unlocking Europe’s offshore wind potential
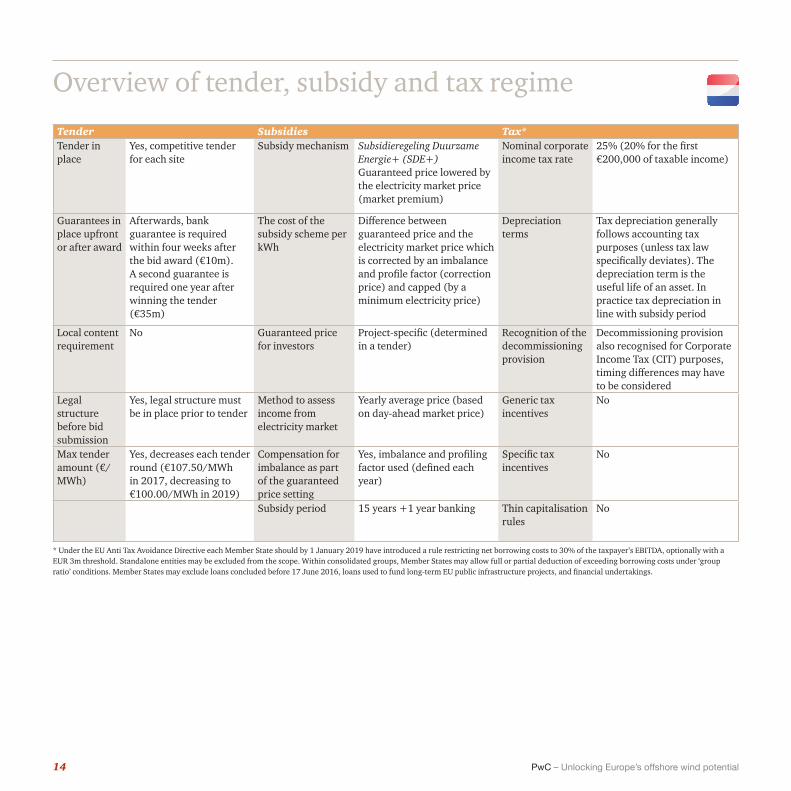
Overview of tender, subsidy and tax regime
Tender Subsidies Tax*Tender in place
Yes, competitive tender for each site
Subsidy mechanism Subsidieregeling Duurzame Energie+ (SDE+) Guaranteed price lowered by the electricity market price (market premium)
Nominal corporate income tax rate
25% (20% for the first €200,000 of taxable income)
Guarantees in place upfront or after award
Afterwards, bank guarantee is required within four weeks after the bid award (€10m). A second guarantee is required one year after winning the tender (€35m)
The cost of the subsidy scheme per kWh
Difference between guaranteed price and the electricity market price which is corrected by an imbalance and profile factor (correction price) and capped (by a minimum electricity price)
Depreciation terms
Tax depreciation generally follows accounting tax purposes (unless tax law specifically deviates). The depreciation term is the useful life of an asset. In practice tax depreciation in line with subsidy period
Local content requirement
No Guaranteed price for investors
Project-specific (determined in a tender)
Recognition of the decommissioning provision
Decommissioning provision also recognised for Corporate Income Tax (CIT) purposes, timing differences may have to be considered
Legal structure before bid submission
Yes, legal structure must be in place prior to tender
Method to assess income from electricity market
Yearly average price (based on day-ahead market price)
Generic tax incentives
No
Max tender amount (€/MWh)
Yes, decreases each tender round (€107.50/MWh in 2017, decreasing to €100.00/MWh in 2019)
Compensation for imbalance as part of the guaranteed price setting
Yes, imbalance and profiling factor used (defined each year)
Specific tax incentives
No
Subsidy period 15 years +1 year banking Thin capitalisation rules
No
* Under the EU Anti Tax Avoidance Directive each Member State should by 1 January 2019 have introduced a rule restricting net borrowing costs to 30% of the taxpayer’s EBITDA, optionally with a EUR 3m threshold. Standalone entities may be excluded from the scope. Within consolidated groups, Member States may allow full or partial deduction of exceeding borrowing costs under ‘group ratio’ conditions. Member States may exclude loans concluded before 17 June 2016, loans used to fund long-term EU public infrastructure projects, and financial undertakings.
14 PwC – Unlocking Europe’s offshore wind potential
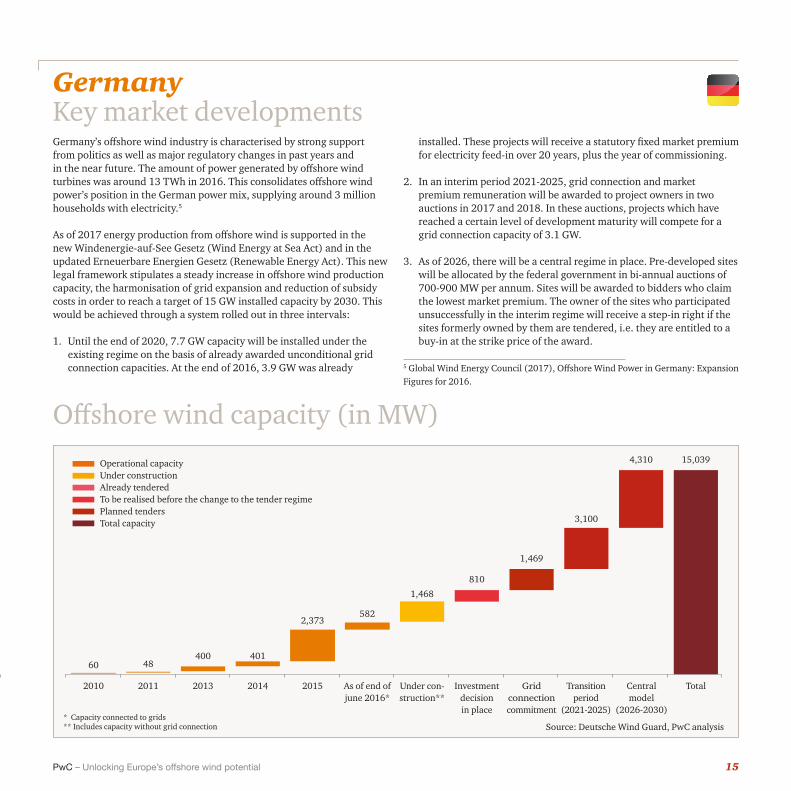
Offshore wind capacity (in MW)
2013 20142010 2011 2015 As of end of june 2016*
Investment decision in place
Grid connection commitment
Central model
(2026-2030)
Transition period
(2021-2025)
TotalUnder con-struction**
48401400
60
2,373582
1,468
810
1,469
3,100
4,310 15,039
* Capacity connected to grids** Includes capacity without grid connection
GermanyKey market developmentsGermany’s offshore wind industry is characterised by strong support from politics as well as major regulatory changes in past years and in the near future. The amount of power generated by offshore wind turbines was around 13 TWh in 2016. This consolidates offshore wind power’s position in the German power mix, supplying around 3 million households with electricity.5
As of 2017 energy production from offshore wind is supported in the new Windenergie-auf-See Gesetz (Wind Energy at Sea Act) and in the updated Erneuerbare Energien Gesetz (Renewable Energy Act). This new legal framework stipulates a steady increase in offshore wind production capacity, the harmonisation of grid expansion and reduction of subsidy costs in order to reach a target of 15 GW installed capacity by 2030. This would be achieved through a system rolled out in three intervals:
1. Until the end of 2020, 7.7 GW capacity will be installed under the existing regime on the basis of already awarded unconditional grid connection capacities. At the end of 2016, 3.9 GW was already
installed. These projects will receive a statutory fixed market premium for electricity feed-in over 20 years, plus the year of commissioning.
2. In an interim period 2021-2025, grid connection and market premium remuneration will be awarded to project owners in two auctions in 2017 and 2018. In these auctions, projects which have reached a certain level of development maturity will compete for a grid connection capacity of 3.1 GW.
3. As of 2026, there will be a central regime in place. Pre-developed sites will be allocated by the federal government in bi-annual auctions of 700-900 MW per annum. Sites will be awarded to bidders who claim the lowest market premium. The owner of the sites who participated unsuccessfully in the interim regime will receive a step-in right if the sites formerly owned by them are tendered, i.e. they are entitled to a buy-in at the strike price of the award.
Source: Deutsche Wind Guard, PwC analysis
5 Global Wind Energy Council (2017), Offshore Wind Power in Germany: Expansion Figures for 2016.
Operational capacity Under construction Already tenderedTo be realised before the change to the tender regimePlanned tenders Total capacity
15PwC – Unlocking Europe’s offshore wind potential
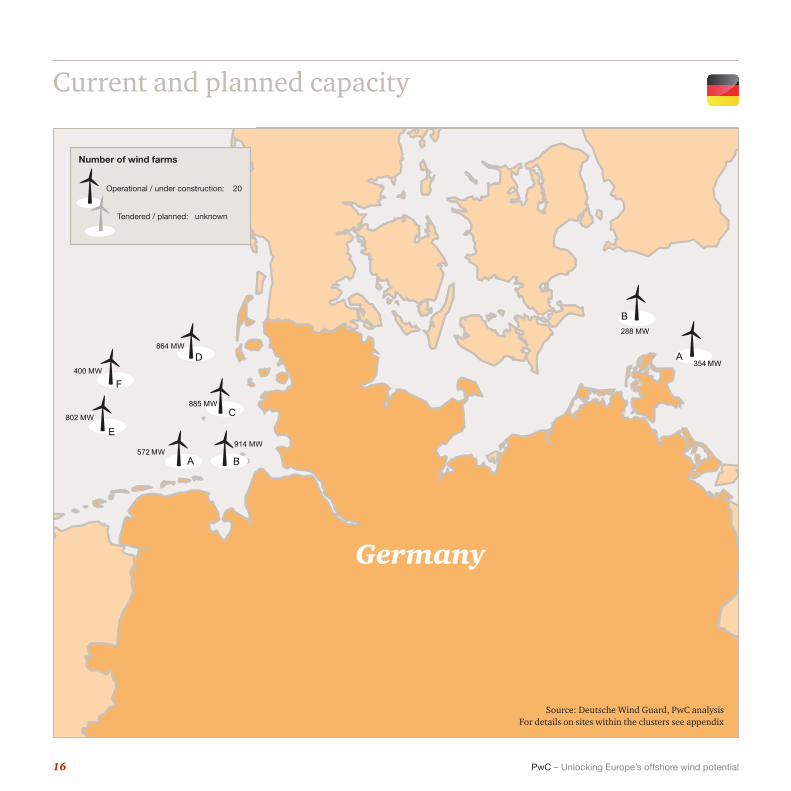
Current and planned capacity
914 MW
885 MW
802 MW
354 MW
288 MW
864 MW
572 MWBA
E
400 MW
F
D
C
B
A
Germany
Source: Deutsche Wind Guard, PwC analysisFor details on sites within the clusters see appendix
Number of wind farms
Operational / under construction: 20
Tendered / planned: unknown
16 PwC – Unlocking Europe’s offshore wind potential

Overview of tender, subsidy and tax regime
Tender Subsidies Tax*Tender in place • Current regime (until end of
2020): no tender• Transition period (2021-
2025): yes, auctions in 2017 and 2018 will award capacity of eligible projects
• Centralised regime (as of 2026): yes, auctions for 700-900 MW per annum
Subsidy mechanism
Market premium model:• Until end of 2020:
Statutory fixed tariff• As of 2021: Fixed
tariff according to tender award
Nominal corporate income tax rate
15% Corporate Income Tax (CIT) plus Solidarity Surcharge of 5.5% thereon (together 15.825%) and Trade Tax (TT) at a rate depending on where the business in located, usually around 14%
Guarantees in place upfront or after award
Current regime: noInterim regime: yes, upfront guarantee of €100,000/MWCentralised regime: yes, upfront guarantee of €200,000/MW
The cost of the subsidy scheme per kWh
Difference between the fixed tariff and the electricity market price
Depreciation terms
Useful lifetime of the depreciable assets (generator, cabling, substation) 16 years.Straight line depreciation with accelerated depreciation regime available (up to 20% in the year of acquisition and the four following years)
Local content requirement
No Guaranteed price for investors
Until 2021: yesAs of 2021: “Awarded tender price”
Recognition of the decommissioning provision
Decommissioning provision also recognised for CIT and TT purposes, timing differences may have to be considered
Legal structure before bid submission
Yes:Transition period: bidder (SPV) has to be owner of an “eligible project”Centralized regime: bidder (SPV)
Method to assess income from electricity market
Monthly average market price for energy source “wind energy offshore” of EPEX Spot SE / Paris
Generic tax incentives available for offshore wind
No
Max tender amount (€/MWh)
Interim regime: €120/MWhCentralized regime: minimum amount of 2018 auction within interim regime. Individual amount can be fixed by Federal Grid Agency
Compensation for imbalance as part of the guaranteed price setting
95% compensation of losses (if < 1% of annual earnings)100% compensation of losses (for losses above 1% of annual earnings)
Specific tax incentives for offshore wind
No
Subsidy period 20 years + year of commissioning
Thin capitalisation rules
No thin capitalisation rules as such; their substitute is the 'interest limitation' to, basically, 30% of EBITDA
* Under the EU Anti Tax Avoidance Directive each Member State should by 1 January 2019 have introduced a rule restricting net borrowing costs to 30% of the taxpayer’s EBITDA, optionally with a EUR 3m threshold. Standalone entities may be excluded from the scope. Within consolidated groups, Member States may allow full or partial deduction of exceeding borrowing costs under ‘group ratio’ conditions. Member States may exclude loans concluded before 17 June 2016, loans used to fund long-term EU public infrastructure projects, and financial undertakings.
Source: PwC analysis
17PwC – Unlocking Europe’s offshore wind potential

BelgiumKey market developments
Offshore wind capacity (in MW)
The Belgian government has decided to phase out nuclear energy and to develop the country’s renewable energy sources (RES). In line with EU objectives, the government supports the development of RES and aims to have a share of 13% of RES in the gross final energy consumption by 2020. Offshore wind plays a key role in the country’s National Renewable Energy Action Plan (NREAP). Over half of the electricity produced by wind farms is planned to be produced offshore on the North Sea in Belgium.
However, the increase in offshore wind capacity has stalled recently and the 2020 target of 2 GW expressed in the NREAP will not be met. Until 2017, the present capacity of 712 MW will not increase, as the 2008 economic crisis made investment more difficult and brought several local actors into financial turmoil. In 2015, wind energy (on- and offshore) made up 8.2% of electricity production in Belgium.
A discussion between industrial consumers, mainly led by energy intensive companies, and investors on the adequate level of support for
offshore wind through green certificates,6 led to a subsidy system reform in early 2014. A new and less generous framework was approved by the government in June 2016. This alters some of the subsidy scheme specifications for the next two wind farms to be built (Rentel and Norther). For the three remaining concessions (Seastar, Northwester 2 and Mermaid) the subsidy scheme will be specified in the future.
As a result of the recent price trends in Dutch waters close to the Dutch-Belgian maritime border, the Belgian government is under further pressure to cut subsidies for the sector. In a recent study, the federal regulator CREG corrected the LCOE of DONG’s winning bid for various local market conditions in the Belgian context, resulting in an estimated LCOE between €76 and €84 per MWh. This is considerably lower than the subsidy level committed to two offshore wind projects last year (at €129.8 and €124 per MWh).
6 The industrial consumers found the subsidy scheme too generous, while the investors preferred a more generous scheme.
2009
30
2010
165
2012
184
OperationalUnder construction Already grantedTotal capacity
2013
117
2014
216
Under construction
(2017)
165
Total
2,272
Already granted
1,395
18 PwC – Unlocking Europe’s offshore wind potential

2846 MW1936 MW
110 MW
108 MW
885 MW272 MW
1202 MW3605 MW 50 MW 735 MW
5 MW
288 MW
345 MW
864 MW864 MW
B
A
C
D
E
G
F H
I
J
K
108 MW
4035 MW
877 MW1,395 MW
A
Current and planned capacity
Belgium
Sources: C4 Offshore, PwC analysis For details on sites within the clusters see appendix
Number of wind farms
Operational / under construction: 7
Granted: 5
19PwC – Unlocking Europe’s offshore wind potential
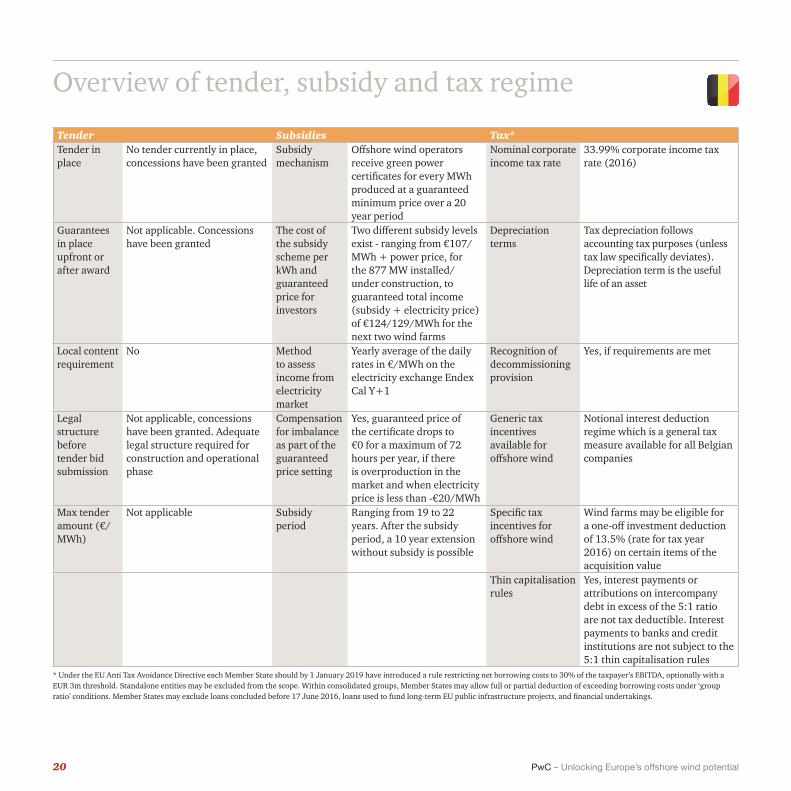
Overview of tender, subsidy and tax regime
Tender Subsidies Tax* Tender in place
No tender currently in place, concessions have been granted
Subsidy mechanism
Offshore wind operators receive green power certificates for every MWh produced at a guaranteed minimum price over a 20 year period
Nominal corporate income tax rate
33.99% corporate income tax rate (2016)
Guarantees in place upfront or after award
Not applicable. Concessions have been granted
The cost of the subsidy scheme per kWh and guaranteed price for investors
Two different subsidy levels exist - ranging from €107/MWh + power price, for the 877 MW installed/under construction, to guaranteed total income (subsidy + electricity price) of €124/129/MWh for the next two wind farms
Depreciation terms
Tax depreciation follows accounting tax purposes (unless tax law specifically deviates). Depreciation term is the useful life of an asset
Local content requirement
No Method to assess income from electricity market
Yearly average of the daily rates in €/MWh on the electricity exchange Endex Cal Y+1
Recognition of decommissioning provision
Yes, if requirements are met
Legal structure before tender bid submission
Not applicable, concessions have been granted. Adequate legal structure required for construction and operational phase
Compensation for imbalance as part of the guaranteed price setting
Yes, guaranteed price of the certificate drops to €0 for a maximum of 72 hours per year, if there is overproduction in the market and when electricity price is less than -€20/MWh
Generic tax incentives available for offshore wind
Notional interest deduction regime which is a general tax measure available for all Belgian companies
Max tender amount (€/MWh)
Not applicable Subsidy period
Ranging from 19 to 22 years. After the subsidy period, a 10 year extension without subsidy is possible
Specific tax incentives for offshore wind
Wind farms may be eligible for a one-off investment deduction of 13.5% (rate for tax year 2016) on certain items of the acquisition value
Thin capitalisation rules
Yes, interest payments or attributions on intercompany debt in excess of the 5:1 ratio are not tax deductible. Interest payments to banks and credit institutions are not subject to the 5:1 thin capitalisation rules
* Under the EU Anti Tax Avoidance Directive each Member State should by 1 January 2019 have introduced a rule restricting net borrowing costs to 30% of the taxpayer’s EBITDA, optionally with a EUR 3m threshold. Standalone entities may be excluded from the scope. Within consolidated groups, Member States may allow full or partial deduction of exceeding borrowing costs under ‘group ratio’ conditions. Member States may exclude loans concluded before 17 June 2016, loans used to fund long-term EU public infrastructure projects, and financial undertakings.
20 PwC – Unlocking Europe’s offshore wind potential

Offshore wind capacity (in MW)
70
Under construction (2017)
2016
3,540
TotalPlanned tenders (location unknown)
Planned tenders (location determined)
Already tendered
11,1137,037
527
Operational capacity Under construction Already tendered Planned tenders Total capacity
FranceKey market developmentsThere is currently no installed capacity in France, but in many respects, France is an ideal country for wind energy with marine territories on the English Channel, Atlantic Ocean and Mediterranean Sea. As an indication of this potential, the Syndicat des Energies Renouvelables, estimates France’s long-term offshore wind potential to be 90 TWh per annum.
So far, six offshore wind farms, totalling 3 GW, have been tendered in two rounds of tenders in 2012 and 2014. These projects are now in the design phase or will soon start construction, and the first one is expected to come online in 2021. A third round of tenders was launched in December 2016 in Dunkirk through a new procedure called ‘competitive dialogue’ to select potential developers and refine the best suited area (capacity estimated around 400-500 MW). Another similar tender is expected near Oléron Island in the spring 2017. Moreover, the first tender for floating offshore wind pilot farms has given the go-ahead for four pilot projects of 24 MW each.
In 2015, France adopted a new Energy Transition Law, which lays out a roadmap for transforming the French energy model. Beyond measures to ease the consenting process, the new law includes a target for 40% of the country’s electricity to come from renewable energy sources by 2030. This means doubling the share of renewables in the French energy mix. The new energy plan includes objectives for installed or tendered offshore wind power between 3 GW-9 GW, and between 100 MW-1,000 MW, for floating offshore wind power and other marine renewables.
The most important challenges faced by the French offshore wind sector is the unstable regulatory environment, the need for cost reduction, defining areas for offshore wind development due to conflicting interests over maritime areas, and increased competition in the market.
Sources: C4 Offshore, PwC analysis* This includes other marine energies like floating wind power (the best case 2023 target of 2000 MW also contains some hydrokinetic capacity)
21PwC – Unlocking Europe’s offshore wind potential

Current and planned capacity
2846 MW1936 MW
110 MW
108 MW
885 MW272 MW
1202 MW3605 MW 50 MW 735 MW
5 MW
288 MW
345 MW
864 MW864 MW
B
A
C
D
E
G
F H
I
J
K
108 MW
4035 MW
2,000 MW2 MW
C
627 MW5 MW
D
1,944 MWA
496 MWB
+ ca 7,037 MWTargeted but not
yet allocatedgeographically
France
Sources: C4 Offshore, PwC analysis For details on sites within the clusters see appendix
Number of wind farms
Operational / under construction: 42
Tendered / planned: 21 + unknown
22 PwC – Unlocking Europe’s offshore wind potential

Overview of tender, subsidy and tax regime
Tender Subsidies Tax* Tender in place
Yes Subsidy mechanism
Feed-in tariff Nominal corporate income tax rate
33⅓ %, excluding 3.3% social contribution and exceptional contribution on profits
Guarantees in place upfront or after award
After bid award: (i) For design and preliminary works, 15 days after the bid award(ii) For construction and operation, before submitting the allowance file for assessment
The cost of the subsidy scheme per kWh
Guaranteed price (feed-in tariff, depending on tender round, location and bid)
Depreciation terms
Tax depreciation follows accounting tax purposes (unless tax law specifically deviates)Depreciation term is useful lifeSome parts may be eligible for tax declining balance depreciations
Local content requirement
Yes (installation of equipment factory and/or increased capacity in the national territory)
Guaranteed price for investors
Project-specific, now between €0.14/kWh and €0.22/kWh
Recognition of the decommissioning provision
Yes, this provision should be adjusted yearly. Specific accounting and tax regulations apply
Legal structure before bid submission
Yes, usually as a consortium Method to assess income from electricity market
Not applicable Generic tax incentives available for offshore wind
No
Max tender amount (€/MWh)
Yes, capped and incentive bid assessment with decreasing feed-in tariff
Compensation for imbalance as part of the guaranteed price setting
No Specific tax incentives for offshore wind
No
Subsidy period
20 years Additional contributions on offshore wind energy
Public maritime domain occupancy fee (€1,000 per turbine + €1 per meter of power connection cable + €6,000 per MW installed).Special tax on offshore wind turbines (2016 amount: €15,471 per MW installed). 3% annual tax on French buildings (3% of the foundations value)
Thin capitalisation rules
Yes, however the thin capitalisation rules do not apply to interest payable by banks and credit institutions
* Under the EU Anti Tax Avoidance Directive each Member State should by 1 January 2019 have introduced a rule restricting net borrowing costs to 30% of the taxpayer’s EBITDA, optionally with a EUR 3m threshold. Standalone entities may be excluded from the scope. Within consolidated groups, Member States may allow full or partial deduction of exceeding borrowing costs under ‘group ratio’ conditions. Member States may exclude loans concluded before 17 June 2016, loans used to fund long-term EU public infrastructure projects, and financial undertakings.
23PwC – Unlocking Europe’s offshore wind potential
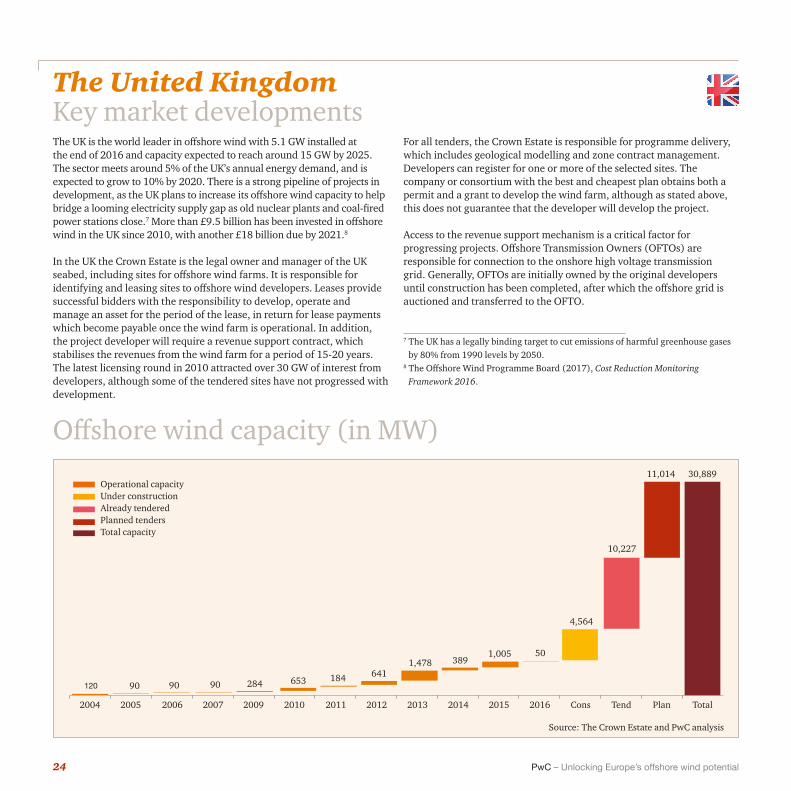
Offshore wind capacity (in MW)
20112006 20092004 20122007 20102005 2013 2014 2015 2016 Cons Tend Plan Total
65390 284120184
90641
90
1,478 3891,005 50
4,564
10,227
11,014 30,889
The United KingdomKey market developmentsThe UK is the world leader in offshore wind with 5.1 GW installed at the end of 2016 and capacity expected to reach around 15 GW by 2025. The sector meets around 5% of the UK’s annual energy demand, and is expected to grow to 10% by 2020. There is a strong pipeline of projects in development, as the UK plans to increase its offshore wind capacity to help bridge a looming electricity supply gap as old nuclear plants and coal-fired power stations close.7 More than £9.5 billion has been invested in offshore wind in the UK since 2010, with another £18 billion due by 2021.8
In the UK the Crown Estate is the legal owner and manager of the UK seabed, including sites for offshore wind farms. It is responsible for identifying and leasing sites to offshore wind developers. Leases provide successful bidders with the responsibility to develop, operate and manage an asset for the period of the lease, in return for lease payments which become payable once the wind farm is operational. In addition, the project developer will require a revenue support contract, which stabilises the revenues from the wind farm for a period of 15-20 years. The latest licensing round in 2010 attracted over 30 GW of interest from developers, although some of the tendered sites have not progressed with development.
For all tenders, the Crown Estate is responsible for programme delivery, which includes geological modelling and zone contract management. Developers can register for one or more of the selected sites. The company or consortium with the best and cheapest plan obtains both a permit and a grant to develop the wind farm, although as stated above, this does not guarantee that the developer will develop the project.
Access to the revenue support mechanism is a critical factor for progressing projects. Offshore Transmission Owners (OFTOs) are responsible for connection to the onshore high voltage transmission grid. Generally, OFTOs are initially owned by the original developers until construction has been completed, after which the offshore grid is auctioned and transferred to the OFTO.
Source: The Crown Estate and PwC analysis
7 The UK has a legally binding target to cut emissions of harmful greenhouse gases by 80% from 1990 levels by 2050.
8 The Offshore Wind Programme Board (2017), Cost Reduction Monitoring Framework 2016.
Operational capacity Under construction Already tendered Planned tenders Total capacity
24 PwC – Unlocking Europe’s offshore wind potential
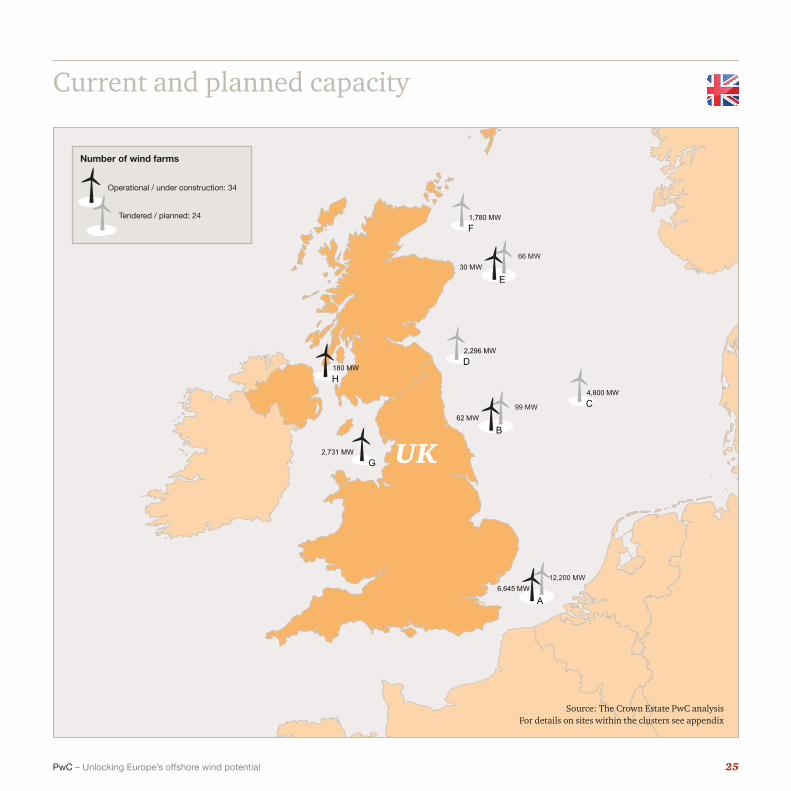
Current and planned capacity
2,296 MW
6,645 MW12,200 MW
D
1,780 MW F
180 MW H
2,731 MW G
4,800 MW C
A
62 MW99 MW
B
30 MW66 MW
E
UK
Source: The Crown Estate PwC analysis For details on sites within the clusters see appendix
Number of wind farms
Operational / under construction: 34
Tendered / planned: 24
25PwC – Unlocking Europe’s offshore wind potential

Tender Subsidies Tax* Tender in place
Yes, the last subsidy tender was in 2015. The next one is expected in 2017 for delivery post 2020
Subsidy mechanism
Renewable Obligation Certificates (ROCs) – a green certificate machanism – is available until March 2018 Contracts for Difference (CfDs) – pays developers a pre-agreed price (strike price) for 15 yearsCfDs will replace ROCs as the primary support mechanism from April 2017
Nominal corporate income tax rate
20% (however the rate is set to reduce to 19% in 2017 and 17% in 2020)
Guarantees in place upfront or after award
Not applicable The cost of the subsidy scheme per kWh
For CfDs the price payable is determined through a tender process. The level of subsidy is determined by the difference between the strike price and the half-hourly electricity price
Depreciation terms
Capital allowances may be deducted - 18% calculated on a reducing-balance basis for assets with a useful economic life less than 25 years, or 8% for assets with a useful economic life of 25 years or more
Local content requirement
Yes for schemes over 300 MW under CfD
Guaranteed price for investors
Under the CfD, the strike price offered to successful projects will be equal to the lower of the clearing price for the relevant delivery year, and the relevant Administrative Strike Price. The clearing price for each delivery year is set at the strike price bid of the last accepted (marginal) bid in that year
Recognition of the decommissioning provision
Commercially, additions to a decommissioning provision are recognised on an accrual basis. However, for tax purposes tax relief is only available when the provision is utilised at the end of the asset life, when relief can be difficult to obtain in practice due to lack of profits in the final periods
Legal structure before bid submission
Not applicable Method to assess income from electricity market
A combination of the actual market price in every half hour of generation plus the difference payment
Generic tax incentives available for offshore wind
No
Max tender amount (£/MWh)
The government will control costs by capping offshore wind strike prices at £105/MWh (2011-12 prices), falling to £85/MWh for projects commissioning by 2026
Compensation for imbalance as part of the guaranteed price setting
Not applicable Specific tax incentives for offshore wind
No
Subsidy period 20 years for ROCs and 15 years for CfDs
Thin capitalisation rules
No, but HMRC have announced new interest deductibility rules in line with the OECD BEPS action 4 recommendations
* Under the EU Anti Tax Avoidance Directive each Member State should by 1 January 2019 have introduced a rule restricting net borrowing costs to 30% of the taxpayer’s EBITDA, optionally with a EUR 3m threshold. Standalone entities may be excluded from the scope. Within consolidated groups, Member States may allow full or partial deduction of exceeding borrowing costs under ‘group ratio’ conditions. Member States may exclude loans concluded before 17 June 2016, loans used to fund long-term EU public infrastructure projects, and financial undertakings.Source: The Crown Estate
Overview of tender, subsidy and tax regime
26 PwC – Unlocking Europe’s offshore wind potential

Offshore wind capacity (in MW)
Denmark has the longest history with offshore wind turbines in the world. The first wind farm was established in 1991 at Vindeby in the southern part of Denmark. Denmark has 1.3 GW capacity installed and when Horns Rev 3 and Krieger’s Flak will be finalised in 2021 another 1 GW will be added. In addition, a call for tender to develop 350 MW near-shore wind power was recently concluded.
The conditions for offshore wind farms are defined in the Promotion of Renewable Energy Act. Offshore wind turbines can be installed following two different procedures: a government tender procedure run by the Danish Energy Agency or an open-door procedure. For both procedures, the project developer must obtain three licenses: 1) a license to carry out preliminary investigations, 2) a license to establish the offshore
wind turbines (only given if preliminary investigations show that the project is compatible with the relevant interests at sea) and 3) a license to exploit wind power for a given number of years, and an approval for electricity production. Once the three licenses have been obtained an Environmental Impact Assessment is mandatory to continue the works.
In the government tender procedure, the Danish Energy Agency announces a tender for an offshore wind project of a specific size within a specifically defined geographical area. In the open-door procedure, the project developer takes the initiative to establish an offshore wind farm of a chosen size in a specific area. This is done by submitting an unsolicited application for a license to carry out preliminary investigations in the given area.
DenmarkKey market developments
20021995 20032001 2009 2010 2011 2013 Under constr. (2017)
Under constr. (2018)
Planned tenders
total
405
168
206 28
416 4
400 28
406
950 2,651
Sources: C4 Offshore and PwC analysis
Operational capacity Under construction Already tendered Planned tenders Total capacity
27PwC – Unlocking Europe’s offshore wind potential
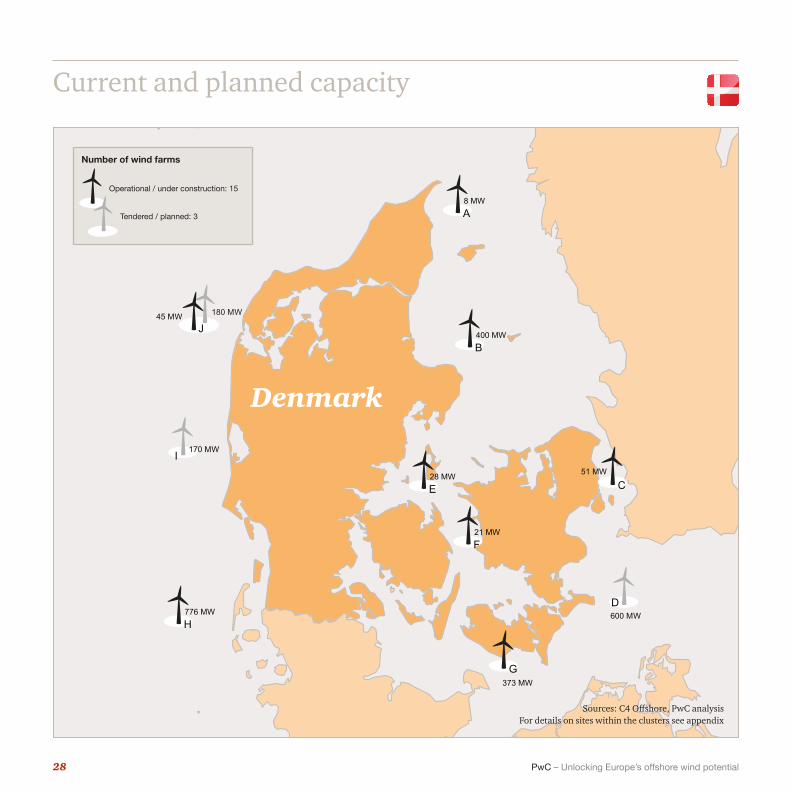
8 MW
600 MW
180 MW45 MW
A
400 MW B
28 MW E
21 MW F
373 MW G
776 MW H
51 MW
C
J
D
170 MWI
Denmark
Current and planned capacity
Sources: C4 Offshore, PwC analysis For details on sites within the clusters see appendix
Number of wind farms
Operational / under construction: 15
Tendered / planned: 3
28 PwC – Unlocking Europe’s offshore wind potential

Overview of tender, subsidy and tax regime
Tender Subsidies Tax* Tender in place
Yes + an open door procedure. Open door has less advantageous financial terms. No large scale project has been developed in the open door system
Subsidy mechanism
Tender: feed-in premium (Public Service Obligations (PSO)). Open door: set subsidy per kWh, tapering off above a market price of 33 øre/kWh
Nominal corporate income tax rate
22%
Guarantees in place upfront or after award
State guarantee for bank loans. However, only for groups of local citizens and only in open door procedure
The cost of the subsidy scheme per kWh
Tender system: the difference between the guaranteed price and electricity market price. Open door: 25 øre/kWh, tapering off on a 1:1 basis at a market price above 33 øre/kWh (=guaranteed price of 58 øre/ kWh)
Depreciation terms
Wind farms are usually depreciated with up to 25%. However, special rules apply to wind farms acquired after the income year 2013 with a capacity exceeding 1 MW. They, can only be depreciated with up to 15%
Local content requirement
No Guaranteed price for investors
Project-specific (determined in an auction)
Recognition of the decommissioning provision
For tax purposes, there is no recognition of the decommissioning provision or any additions hereto
Legal structure before bid submission
No Method to assess income from electricity market
Tender: Hourly spot price in the relevant area. Open door: Weighted monthly average
Generic tax incentives available for offshore wind
Not applicable
Max tender amount (DKK/MWh)
Project specific, if any Compensation for imbalance as part of the guaranteed price setting
Tenders: loss due to a reduction or halt in production ordered by the TSO is compensated at guaranteed rate for lost production (first 25 years) Separate imbalance compensation of 1.8 øre/kWh in open door and older wind farms
Specific tax incentives for offshore wind
Not applicable
Subsidy period
Tender: 20 years and also a set amount of power, project specific, normally corresponding to 50,000 hours of production at full capacity (e.g. 20 TWh for a 400 MW park). Open door: formula combining 6,600 hours of full load plus 5.6 MWh per m2 of wing area (swept area)
Thin capitalisation rules
Danish resident companies and Danish branches of foreign companies are subject to three sets of restrictions, each of which may seriously limit or disallow Danish tax deduction for financing costs. The rules are: 1) Thin capitalization, 2) Asset-based rule and 3) the EBIT rule
* Under the EU Anti Tax Avoidance Directive each Member State should by 1 January 2019 have introduced a rule restricting net borrowing costs to 30% of the taxpayer’s EBITDA, optionally with a EUR 3m threshold. Standalone entities may be excluded from the scope. Within consolidated groups, Member States may allow full or partial deduction of exceeding borrowing costs under ‘group ratio’ conditions. Member States may exclude loans concluded before 17 June 2016, loans used to fund long-term EU public infrastructure projects, and financial undertakings.
29PwC – Unlocking Europe’s offshore wind potential

3. Our service offerings
Three examples from our different territories will give you an idea of the range of services PwC can offer you.
Cost reductionPwC collaborated with DNV-GL and Ecofys to identify the cost reduction potential for offshore wind energy in the Netherlands for TKI Wind op Zee
The Dutch government has set a 40% cost reduction target for offshore wind by 2020, compared to 2010. The Knowledge and Innovation Platform for Offshore Wind (TKI Wind op Zee) wanted to know the options for cost reduction for offshore wind in the Netherlands in order to determine if the government’s target was feasible. Several cost reduction studies for offshore wind have been conducted in North-West Europe, of which one study in the UK was performed by PwC, but none had previously been done for the Netherlands.
In order to identify options for cost reduction, PwC performed market interviews, conducted workshops and studied the literature. Three
main areas for cost reduction were found: technology, finance and market & supply chain. Due to the specific regulatory regime and local circumstances, new cost reduction options applied, compared to previous studies.
When combining the different options for cost reduction, the total cost reduction potential in the Netherlands from 2010 to 2020 was assessed at 46% - i.e. higher than the government’s target. This included only the cost reduction options that lead to a greater than 1% decrease of the levelised cost of electricity (LCoE) and excluded changes in external effects (like interest rates and commodity prices). Technological innovations have the largest cost reduction potential at 27%, market and supply chain developments 19% and financing options 14%.
PwC also found some key steps for all market participants to take, in order to reach the 2020 target but also in order to position offshore wind as a competitive energy source compared to fossil fuel based power generation by 2030.
30 PwC – Unlocking Europe’s offshore wind potential
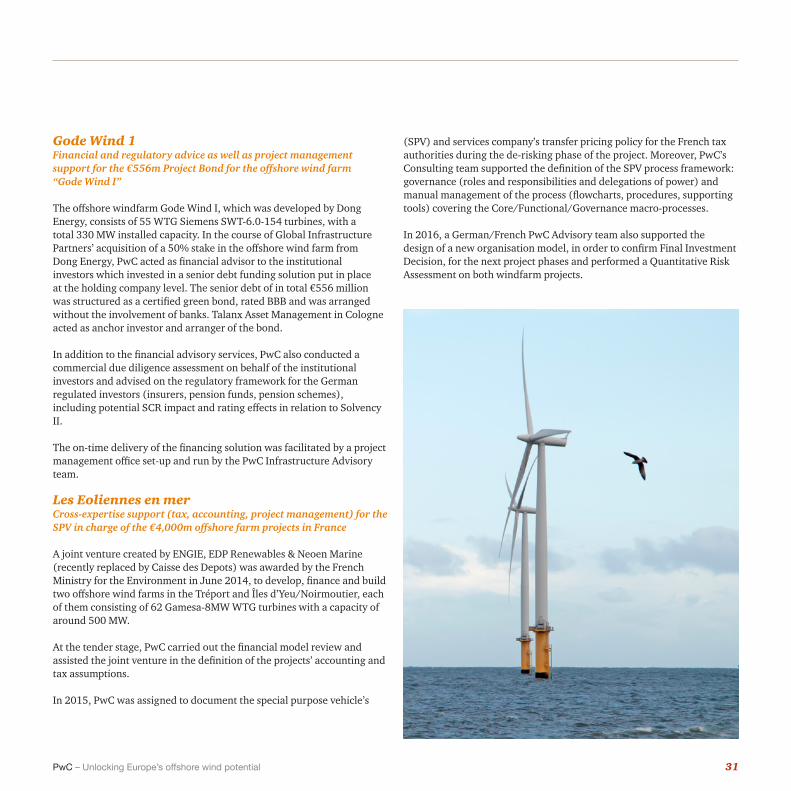
Gode Wind 1 Financial and regulatory advice as well as project management support for the €556m Project Bond for the offshore wind farm “Gode Wind I”
The offshore windfarm Gode Wind I, which was developed by Dong Energy, consists of 55 WTG Siemens SWT-6.0-154 turbines, with a total 330 MW installed capacity. In the course of Global Infrastructure Partners’ acquisition of a 50% stake in the offshore wind farm from Dong Energy, PwC acted as financial advisor to the institutional investors which invested in a senior debt funding solution put in place at the holding company level. The senior debt of in total €556 million was structured as a certified green bond, rated BBB and was arranged without the involvement of banks. Talanx Asset Management in Cologne acted as anchor investor and arranger of the bond.
In addition to the financial advisory services, PwC also conducted a commercial due diligence assessment on behalf of the institutional investors and advised on the regulatory framework for the German regulated investors (insurers, pension funds, pension schemes), including potential SCR impact and rating effects in relation to Solvency II.
The on-time delivery of the financing solution was facilitated by a project management office set-up and run by the PwC Infrastructure Advisory team.
Les Eoliennes en merCross-expertise support (tax, accounting, project management) for the SPV in charge of the €4,000m offshore farm projects in France
A joint venture created by ENGIE, EDP Renewables & Neoen Marine (recently replaced by Caisse des Depots) was awarded by the French Ministry for the Environment in June 2014, to develop, finance and build two offshore wind farms in the Tréport and Îles d’Yeu/Noirmoutier, each of them consisting of 62 Gamesa-8MW WTG turbines with a capacity of around 500 MW.
At the tender stage, PwC carried out the financial model review and assisted the joint venture in the definition of the projects’ accounting and tax assumptions.
In 2015, PwC was assigned to document the special purpose vehicle’s
(SPV) and services company’s transfer pricing policy for the French tax authorities during the de-risking phase of the project. Moreover, PwC’s Consulting team supported the definition of the SPV process framework: governance (roles and responsibilities and delegations of power) and manual management of the process (flowcharts, procedures, supporting tools) covering the Core/Functional/Governance macro-processes.
In 2016, a German/French PwC Advisory team also supported the design of a new organisation model, in order to confirm Final Investment Decision, for the next project phases and performed a Quantitative Risk Assessment on both windfarm projects.
31PwC – Unlocking Europe’s offshore wind potential
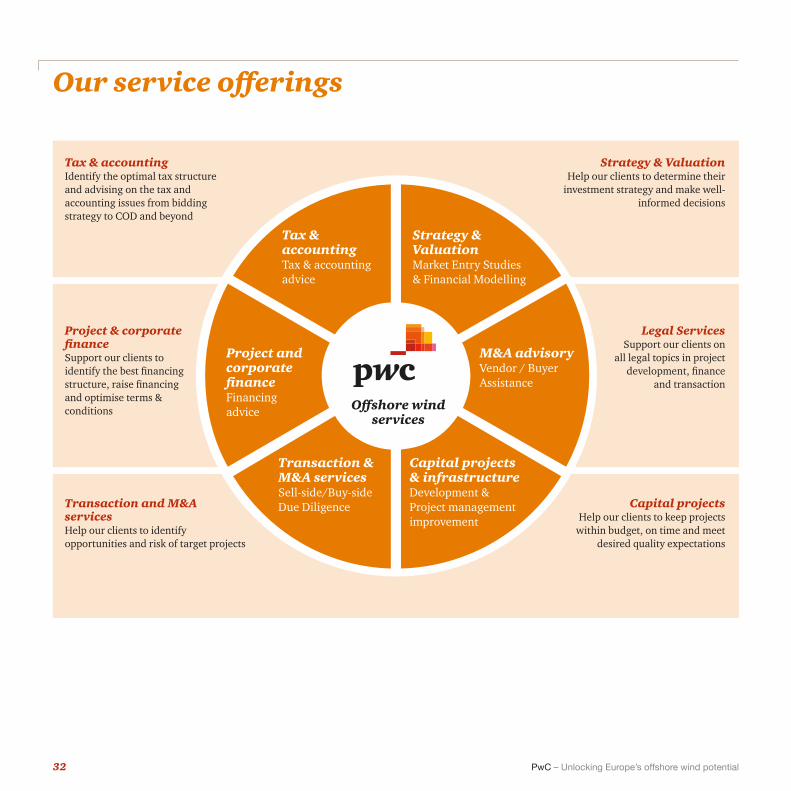
Our service offerings
Tax & accountingIdentify the optimal tax structure and advising on the tax and accounting issues from bidding strategy to COD and beyond
Strategy & ValuationHelp our clients to determine their
investment strategy and make well-informed decisions
Strategy & ValuationMarket Entry Studies & Financial Modelling
Tax & accountingTax & accounting advice
Transaction and M&A servicesHelp our clients to identify opportunities and risk of target projects
Capital projectsHelp our clients to keep projects
within budget, on time and meet desired quality expectations
Capital projects & infrastructureDevelopment & Project management improvement
Transaction & M&A servicesSell-side/Buy-sideDue Diligence
Project & corporate financeSupport our clients to identify the best financing structure, raise financing and optimise terms & conditions
Legal ServicesSupport our clients on
all legal topics in project development, finance
and transaction
M&A advisoryVendor / Buyer Assistance
Project and corporate financeFinancing advice Offshore wind
services
32 PwC – Unlocking Europe’s offshore wind potential

What we offer How we can help you
Tax & accounting Tax and accounting impact
• Assisting in the tax and accounting aspects of a bid strategy• Assess potential tax liabilities and exposures of existing projects• Provide insight into the tax and accounting impact of the acquisition on the financial
statements• Structure the transaction to optimise net cash flows• Obtaining certainty in advance from local tax authorities • Providing tax assistance in relation to documentation of the project• Ensure that tax/accounting compliance requirements are met throughout the deal
Strategy & valuation
Market entry study & Deal modelling
• Identify offshore wind markets that may be interesting for you, taking into account your corporate strategy
• Assess attractiveness based on analysis of current and future development of target markets• Build a financial model to forecast the future cash flow, taking into account CAPEX for new
offshore wind farms• Specify assumption for key parameters like wind production or wholesale power prices. We
have an in-house market model to simulate the electricity price• Assess uncertainties in cash flows• Advise an optimal bidding strategy to maximise the win chance, while minimising the
winner’s curse
Project & corporate finance
Debt advisory • Explore different options for financing layers for your investment (i.e. from mezzanine and junior debt to private placements, ECA debt and senior bank debt)
• Develop optimal financing structure, by translating the equity case into a bankable business case
• Reach out to potential lenders (banks, pension funds, insurance companies, ECA’s, government institutions) to create a competitive playing field
• Coordinate legal transaction documentation phase
Legal Services Support on legal topics
• Support our clients on all legal topics in project development, finance and transaction• Project-based specialist legal advice and ongoing general counsel support• Full range of services, including both buy- and sell-side due diligence; deal execution and
data room management
Transaction and M&A services
Buyer assistance and Buy-side due diligence
• Request, collect and analyse relevant information from the owner of the project• Review the business plan and challenge underlying assumptions (incl. financial, legal and tax
issues) • Prepare management report of our key findings and provide our view on potential risks and
opportunities of the target offshore wind project • Identify individual (existing and new) offshore wind projects that may be of interest to you• Determine attractiveness of these projects and make a short list• Assess the latest status and future planning of the projects • Reach out to the owners to assess the willingness to divest
Capital projects & infrastructure
Project Management
• Assess maturity and gain fast overview on potential weaknesses and provide improvement measures
• Enhance main business performance indicators by building key success factors which can greatly improve the way project owners and contractors manage their projects
33PwC – Unlocking Europe’s offshore wind potential
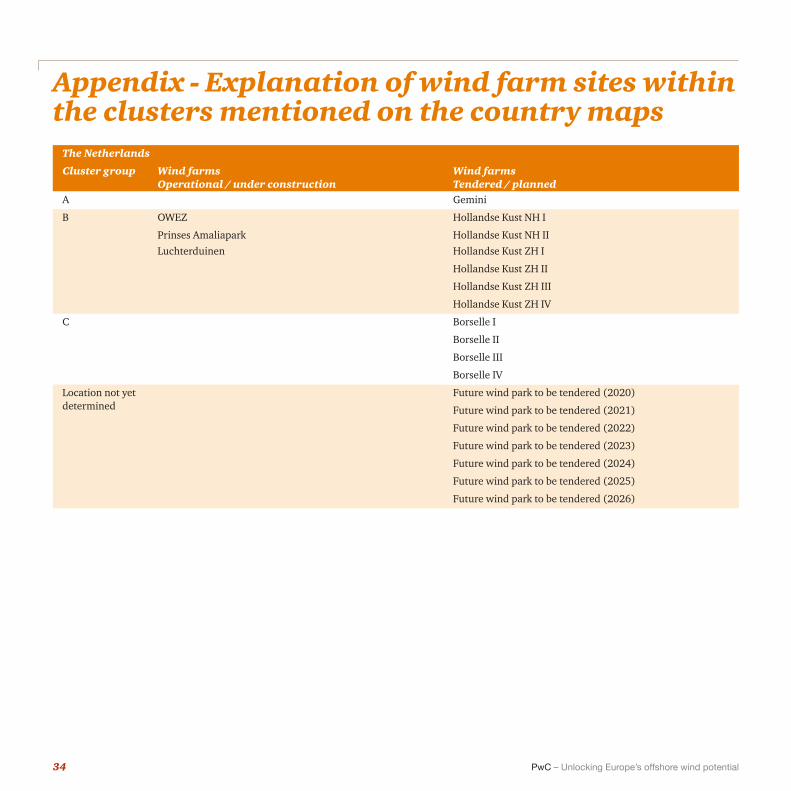
Appendix - Explanation of wind farm sites within the clusters mentioned on the country maps
The Netherlands
Cluster group Wind farms Operational / under construction
Wind farms Tendered / planned
A Gemini
B OWEZ Hollandse Kust NH I
Prinses Amaliapark Hollandse Kust NH II Luchterduinen Hollandse Kust ZH I
Hollandse Kust ZH II
Hollandse Kust ZH III
Hollandse Kust ZH IV
C Borselle I
Borselle II
Borselle III
Borselle IV
Location not yet determined
Future wind park to be tendered (2020)
Future wind park to be tendered (2021)
Future wind park to be tendered (2022)
Future wind park to be tendered (2023)
Future wind park to be tendered (2024)
Future wind park to be tendered (2025)
Future wind park to be tendered (2026)
34 PwC – Unlocking Europe’s offshore wind potential
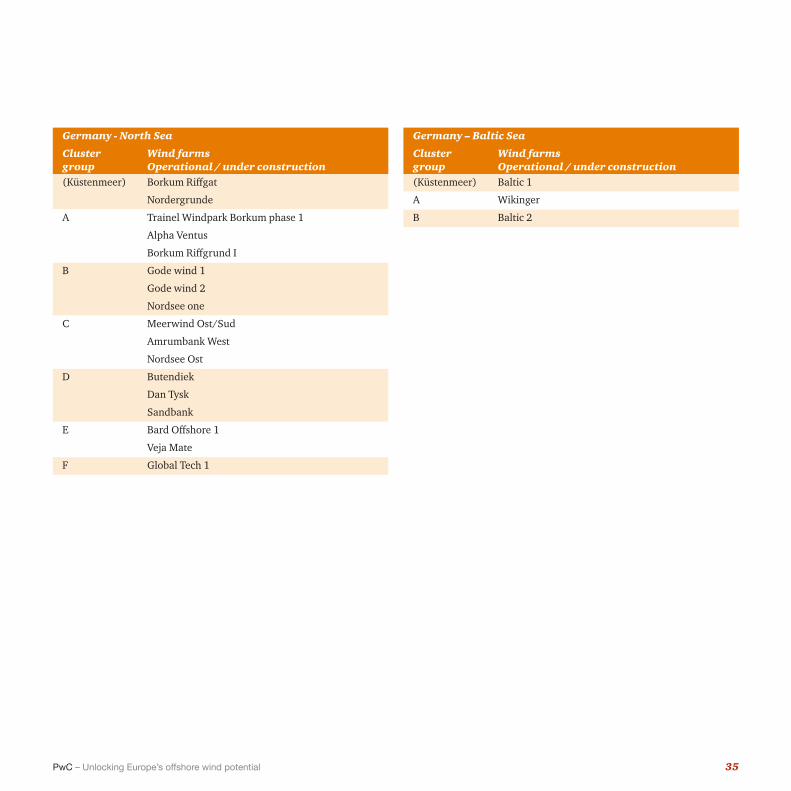
Germany - North Sea
Cluster group
Wind farms Operational / under construction
(Küstenmeer) Borkum Riffgat
Nordergrunde
A Trainel Windpark Borkum phase 1
Alpha Ventus
Borkum Riffgrund I
B Gode wind 1
Gode wind 2
Nordsee one
C Meerwind Ost/Sud
Amrumbank West
Nordsee Ost
D Butendiek
Dan Tysk
Sandbank
E Bard Offshore 1
Veja Mate
F Global Tech 1
Germany – Baltic Sea
Cluster group
Wind farms Operational / under construction
(Küstenmeer) Baltic 1
A Wikinger
B Baltic 2
35PwC – Unlocking Europe’s offshore wind potential
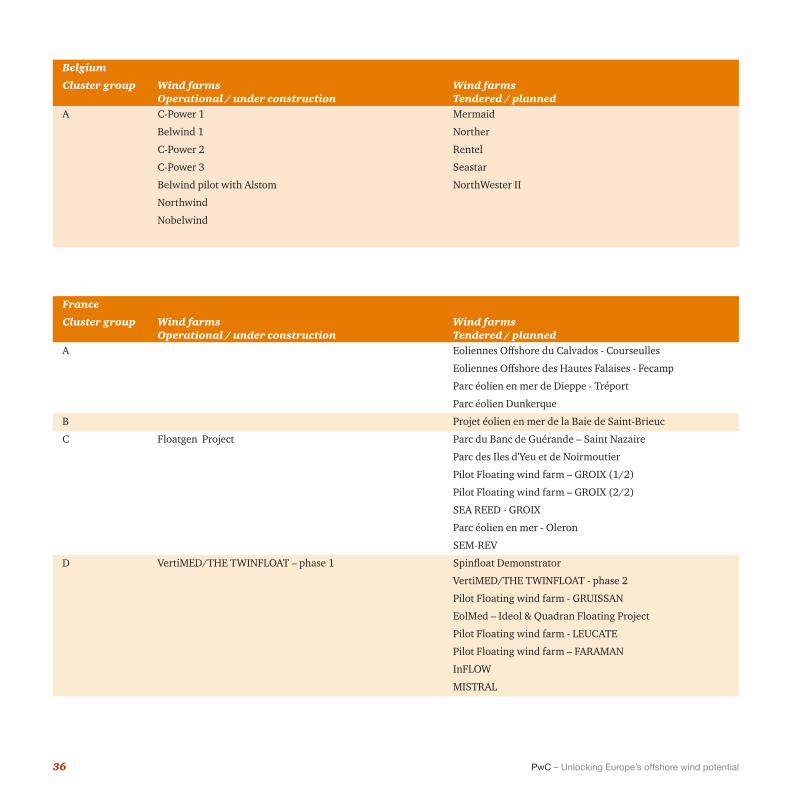
France
Cluster group Wind farms Operational / under construction
Wind farms Tendered / planned
A Eoliennes Offshore du Calvados - Courseulles
Eoliennes Offshore des Hautes Falaises - Fecamp
Parc éolien en mer de Dieppe - Tréport
Parc éolien Dunkerque
B Projet éolien en mer de la Baie de Saint-Brieuc
C Floatgen Project Parc du Banc de Guérande – Saint Nazaire
Parc des Iles d'Yeu et de Noirmoutier
Pilot Floating wind farm – GROIX (1/2)
Pilot Floating wind farm – GROIX (2/2)
SEA REED - GROIX
Parc éolien en mer - Oleron
SEM-REV
D VertiMED/THE TWINFLOAT – phase 1 Spinfloat Demonstrator
VertiMED/THE TWINFLOAT - phase 2
Pilot Floating wind farm - GRUISSAN
EolMed – Ideol & Quadran Floating Project
Pilot Floating wind farm - LEUCATE
Pilot Floating wind farm – FARAMAN
InFLOW
MISTRAL
Belgium
Cluster group Wind farms Operational / under construction
Wind farms Tendered / planned
A C-Power 1 Mermaid
Belwind 1 Norther
C-Power 2 Rentel
C-Power 3 Seastar
Belwind pilot with Alstom NorthWester II
Northwind
Nobelwind
36 PwC – Unlocking Europe’s offshore wind potential
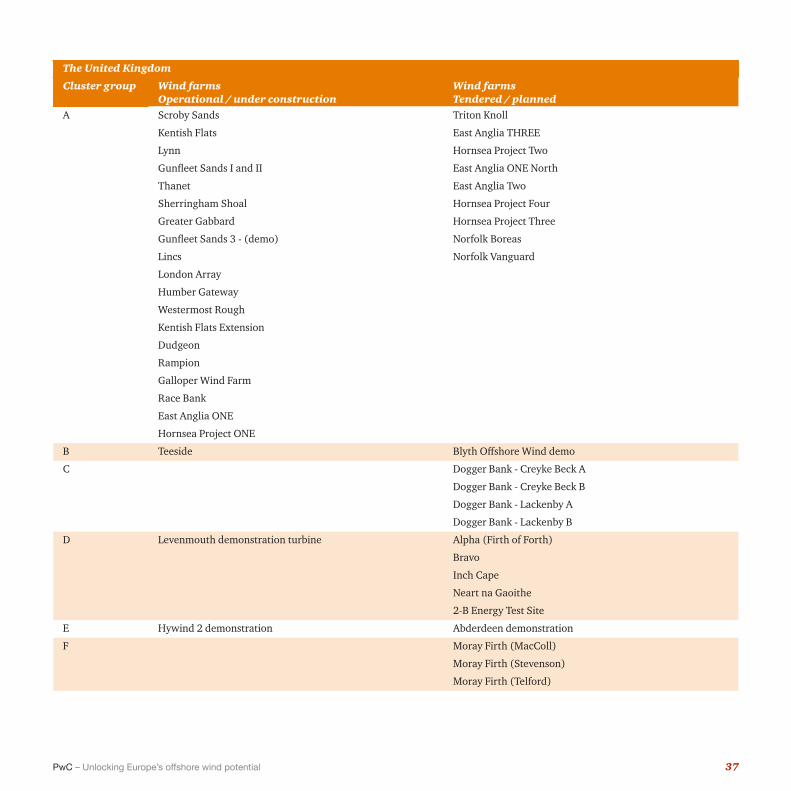
The United Kingdom
Cluster group Wind farms Operational / under construction
Wind farms Tendered / planned
A Scroby Sands Triton Knoll
Kentish Flats East Anglia THREE
Lynn Hornsea Project Two
Gunfleet Sands I and II East Anglia ONE North
Thanet East Anglia Two
Sherringham Shoal Hornsea Project Four
Greater Gabbard Hornsea Project Three
Gunfleet Sands 3 - (demo) Norfolk Boreas
Lincs Norfolk Vanguard
London Array
Humber Gateway
Westermost Rough
Kentish Flats Extension
Dudgeon
Rampion
Galloper Wind Farm
Race Bank
East Anglia ONE
Hornsea Project ONE
B Teeside Blyth Offshore Wind demo
C Dogger Bank - Creyke Beck A
Dogger Bank - Creyke Beck B
Dogger Bank - Lackenby A
Dogger Bank - Lackenby B
D Levenmouth demonstration turbine Alpha (Firth of Forth)
Bravo
Inch Cape
Neart na Gaoithe
2-B Energy Test Site
E Hywind 2 demonstration Abderdeen demonstration
F Moray Firth (MacColl)
Moray Firth (Stevenson)
Moray Firth (Telford)
37PwC – Unlocking Europe’s offshore wind potential
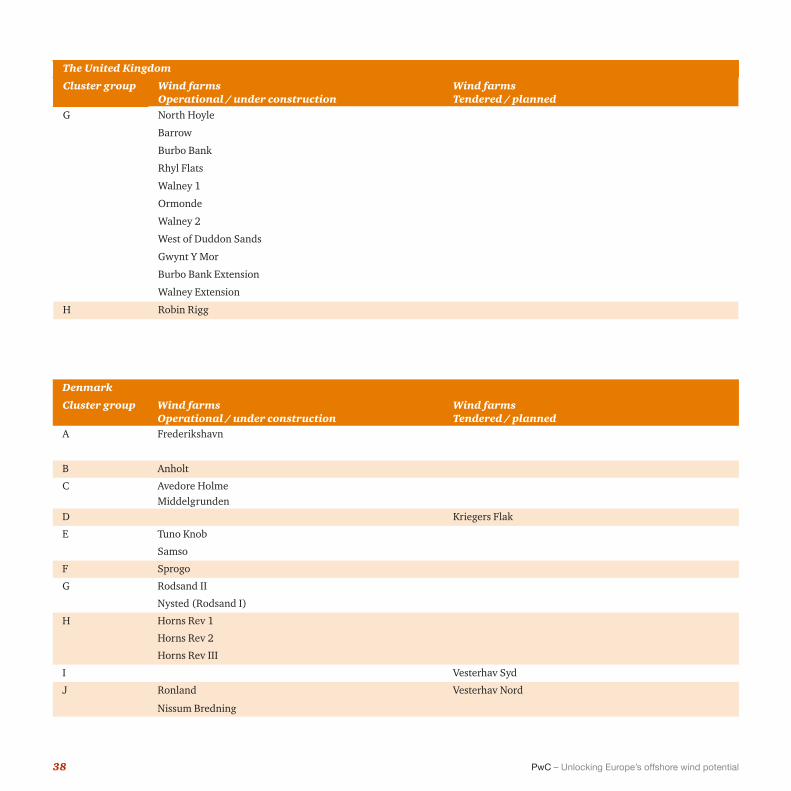
The United Kingdom
Cluster group Wind farms Operational / under construction
Wind farms Tendered / planned
G North Hoyle
Barrow
Burbo Bank
Rhyl Flats
Walney 1
Ormonde
Walney 2
West of Duddon Sands
Gwynt Y Mor
Burbo Bank Extension
Walney Extension
H Robin Rigg
Denmark
Cluster group Wind farms Operational / under construction
Wind farms Tendered / planned
A Frederikshavn
B Anholt
C Avedore Holme Middelgrunden
D Kriegers Flak
E Tuno Knob
Samso
F Sprogo
G Rodsand II
Nysted (Rodsand I)
H Horns Rev 1
Horns Rev 2
Horns Rev III
I Vesterhav Syd
J Ronland Vesterhav Nord
Nissum Bredning
38 PwC – Unlocking Europe’s offshore wind potential
References
Reports and articlesANP XTRA (2017), Halvering subsidies wind op zee in de maak: Regering pakt oversubsidiëring aanDeutsche Wind Guard (2016), Factsheet Year 2015FLOW (2016), Dutch research project shows costs offshore wind can be reduced 40% in ten yearsGlobal Wind Energy Council (2016), Global Wind Report, Annual market Update 2015Global Wind Energy Council (2017), Offshore Wind Power in Germany: Expansion Figures for 2016OffshoreWIND.biz (2017), Denmark Mulling Offshore Wind Subsidies CutThe Offshore Wind Programme Board (2017), Cost Reduction Monitoring Framework 2016
Websites:4C Offshore (2016): www.4coffshore.comCommissie voor de Regulering van de Elektriciteit en het Gas, BelgiumDeutsche Wind GuardEuropean CommissionEurostatFrench Department of EnergyGreensolver (2016): http://greensolver.net/en/OffshoreWIND.biz (2016 and 2017), website: www.offshorewind.bizScottish Enterprise (2016): www.scottish-enterprise.com/industry-support/renewable-energyThe Crown Estate (2016), website: www.thecrownestate.co.uk/energy-minerals-and-infrastructure/offshore-wind-energy/our-portfolio/project-details/
39PwC – Unlocking Europe’s offshore wind potential

The Netherlands:Dorine HelmerPwC | Senior ManagerTel: +31 (0)887926502 Mobile: +31 (0)612217022Email: [email protected]
Niels MullerPwC | Tax Director | Energy, Utilities & MiningTel: +31 (0)887926051 Mobile: +31 (0)651600861Email: [email protected]
Germany:Oliver Moss PwC Advisory FinancingTel: +494063781734 Mobile: +4915114806123 Email: [email protected]
Oliver Kunert PwC | Rechtsanwalt | Senior ManagerTel: +494063781294 Mobile: +491791451162 Email: [email protected]
UKRonan O’ReganDirector, StrategyTel: +44 (0)2078044259Mobile: +44 (0) 7720 805 603Email: [email protected]
Chris GreenPartner, Tax - PwC UK | Renewable Energy LeaderTel +44 (0)161 2452339Mobile +44 (0) 7802918128Email: [email protected]
Jeroen van HoofEnergy leader PwC EMEA+31 (0)88 792 13 [email protected]
Jan Willem VelthuijsenChief Economist PwC Europe+31 (0)88 792 [email protected]
France Pascale JeanPwC | PartnerTel: + 33 1 56571159 Mobile: +33 674447911Email: [email protected]
Alexis BossutPwC | DirectorTel: +33 156577201 Mobile: +33 676985597Email: [email protected]
Denmark:Søren Jesper HansenPwC | Tax partnerHead of International Tax ServicesTel: +45 39453320 Mobile: +45 20304794Email: [email protected]
Tobias SteinøPwC | DirectorTel: +45 39459449 Mobile: +4540223426Email: [email protected]
Belgium: Luc Vercruyssen Energy & Utilities Director Tel: +32(0)479 913180 Email: [email protected]
Aart GeensEnergy & Utilities Manager Tel: +31(0)473 85 37 15 Email: [email protected]
Country contacts
Key contacts
4. Contacts
40 PwC – Unlocking Europe’s offshore wind potential


© 2017 PricewaterhouseCoopers B.V. (KvK 34180289). All rights reservedPwC refers to the PwC network and/or one or more of its member firms, each of which is a separate legal entity. Please see www.pwc.com/structure for further details.