university of oxford water management strategy · university of oxford water management strategy...
TRANSCRIPT

University of Oxford Water Management Strategy
January 2011
Date: 17/12/10
Version number: 3
Owner: Philip Pike, Acting Head of Environmental Sustainability
Approval route: 1. Sustainability Team
2. Sustainability Steering Group
Approval Status: Approved

ii University of Oxford Water Management Strategy

iii University of Oxford Water Management Strategy
AECOM Quality Assurance
Prepared by: Checked by:
Jack Shepherd
Senior Consultant
Kevin Couling
Associate Director
Beaufort House, 94/96 Newhall Street, Birmingham, B3 1PB
Telephone: 0121 262 1900 Website: http://www.aecom.com
Job No 60102301
This document is confidential and the copyright of AECOM Limited. Any unauthorised
reproduction or usage by any person other than the addressee is strictly prohibited.
Disclaimer
This document has been prepared by AECOM Limited (“AECOM”) for sole use of the client entity
detailed above (the “Client”) in accordance with generally accepted consultancy principles, the budget
for fees and the terms of reference agreed between AECOM and the Client. Any information provided
by third parties and referred to herein has not been checked or verified by AECOM, unless otherwise
expressly stated in the document. No third party may rely upon this document without the prior and
express written agreement of AECOM.”

iv University of Oxford Water Management Strategy
Executive Summary
Introduction
This document explores how the University uses water, outlines its approach to managing water
use and sets targets for water use reduction. This strategy is intended to sit alongside the other
strategies which together make up the University‟s overall sustainability strategy, namely:
carbon management strategy;
zero waste strategy;
sustainable travel plan;
sustainable procurement strategy;
biodiversity strategy; and
the University is hoping to compile a Sustainable Buildings Design Philosophy.
The scope of this strategy does not include the Colleges. However, the University works closely
with the Colleges to address many areas of common initiative, including sustainability.
Drivers
Using water purchased from the local utility supplier results in CO2 emissions from the energy used to abstract it, to treat it for drinking, to deliver it to the point of use, and to treat the waste water so it can be discharged. The University‟s CO2 emissions from potable water consumed and waste water treated in 2009/10 were calculated to be 385 tonnes of CO2 (tCO2), 0.5% of the University‟s total.
1
CO2 emissions from water use are categorised by the Greenhouse Gas Protocol as scope three
emissions. The Higher Education Funding Council for England (HEFCE) currently only require
institutions to set a CO2 reduction target for scope one and two emissions. Similarly, the carbon
emissions legislation to which the University is subject, namely the Carbon Reduction
Commitment Energy Efficiency Scheme and the European Union‟s Emissions Trading Scheme
only currently regulate scope one and two emissions. However, HEFCE do state that Institutions
are encouraged to measure a baseline for scope three emissions and in the longer term they will
expect these to be included in the University‟s carbon management strategy.
Of course, the environmental impacts of water use are broader than just associated CO2
emissions. In terms of relative water stress, the South East of England is classed as „serious‟ by
the Environment Agency, to the extent that Thames Water is considering constructing a new
reservoir near Abingdon, which would have a major impact on local community and ecosystems.
Therefore, as a major water user in the area, the University has a responsibility to minimise its
use.
Clearly, buying water from the local utility company also has a cost attached to it. In 2009/10, water accounted for 5.4% of the University‟s total spend on utilities (over £540,000). Measures are outlined in this strategy that have been estimated to deliver a saving of £45,000 with further opportunities for which insufficient information is available to allow for quantification, but which are likely to represent significantly higher savings.
Methodology
The information in this strategy was gathered from three sources, as outlined below.
Overall water use data for each building was compiled by Philip Pike (Energy Manager and
acting Head of Environmental Sustainability) and Jonathan Walford (Assistant Energy
Conservation Engineer) from Estates Services, collated from bills and meter readings.
A series of building audits of the University‟s 10 top water using buildings was undertaken.
1 The figure of 385tCO2 from the University‟s potable water consumed and waste water treated in 2009/10
does not include water used at Graduate Accommodation sites.

v University of Oxford Water Management Strategy
An email survey of the University‟s Building Managers and Departmental Administrators was
performed.
Individual buildings‟ performance was considered with recourse to the Building Research
Establishment‟s Environmental Assessment Method (BREEAM).
Targets
The trajectory of the University‟s water use over the past five years has not followed that of its
Gross Internal Area (GIA). Since 2004/5, the University‟s GIA has increased by 10% and its
energy use has increased by 23%, whereas its water use has decreased by 20%. This is thought
to be principally due to an overall reduction in the water intensity of scientific research at the
University. However, there is evidence that the water efficiency of the University‟s sanitary fittings
is increasing as fittings are replaced or renovated, with 13% of the taps for which evidence was
provided having aerators fitted to reduce the flow rate.
The University‟s water use has decreased by an average of 2.2% per year for the past 10 years.
It is considered that, as a minimum, the target for water management should be to maintain this
trajectory for the next five years. This will require focussed effort to reduce water use, as the
scale of opportunities for water use reduction is likely to be greatly reduced.
Therefore, the target for the University‟s water use should be for water use to decrease by 11%
by 2014/15 against 2009/10 levels (347,364m3), meaning that absolute potable water purchased
in 2014/15 should be no more than 310,000m3.
Opportunities Identified
There are significant opportunities for reducing the amount of water that the University buys from
the utility supplier, many of which have payback periods of less than two years. The initiatives
identified include the following:
repairing, maintaining and fitting meters on the University‟s rainwater harvesting systems;
establishing systems to capture and recycle „greywater‟ (waste water that is suitable for uses
such as for flushing WCs and irrigation);
fitting flush volume reduction devices on WCs;
fitting tap flow rate restrictors;
calibrating percussion tap timers so they deliver 1.5l per operation;
devising solutions for preventing limescale build-up on taps which impedes the functioning of
some water saving devices over time;
fitting urinal control devices;
rationalising the University‟s use of purified water;
installing half-hourly water meters to identify leaks;
benchmarking water use across the University to be able to prioritise buildings with water use
levels above a certain threshold; and
spreading experience of successful water efficiency interventions at the University.

6
Contents
1. Introduction ............................................................................................................................... 7
1.1. Purpose and scope ............................................................................................................ 7 1.2. Background ........................................................................................................................ 7 1.3. Drivers for water management ........................................................................................... 8
2. Targets .................................................................................................................................... 12 3. Baseline .................................................................................................................................. 13
3.1. The contribution water makes to the University‟s carbon emissions ............................... 13 3.2. Historical water use .......................................................................................................... 14 3.3. Analysis of water use by Division ..................................................................................... 16
4. Methodology ............................................................................................................................ 18 4.1. The Building Research Establishment‟s Environmental Assessment Method ................ 18 4.2. Building audits .................................................................................................................. 18 4.3. Email Survey .................................................................................................................... 20
5. Measures in place to reduce water use .................................................................................. 21 5.1. Rainwater harvesting infrastructure ................................................................................. 21 5.2. Irrigation ........................................................................................................................... 21 5.3. BREEAM .......................................................................................................................... 21
6. Results .................................................................................................................................... 23 6.1. Introduction....................................................................................................................... 23 6.2. Laboratory-related water use ........................................................................................... 23 6.3. Sanitary fittings ................................................................................................................. 29
7. Implementation plan ................................................................................................................ 36 7.1. Recommended actions to reduce water use.................................................................... 36 7.2. Monitoring and Reporting ................................................................................................. 40 7.3. Financing .......................................................................................................................... 41 7.4. Suggested timeline ........................................................................................................... 42
Appendix I: full calculations of opportunities identified .................... Error! Bookmark not defined. Appendix II: email survey ................................................................. Error! Bookmark not defined. Appendix III: email survey results .................................................... Error! Bookmark not defined.

7
1. Introduction
1.1. Purpose and scope
This document explores how the University uses water, and outlines its approach to managing water use. This strategy is intended to sit alongside the
University‟s other strategies which together make up the University‟s overall sustainability strategy. The other strategies include:
carbon management strategy;
zero waste strategy;
sustainable travel plan;
sustainable procurement strategy;
biodiversity strategy; and
the University is hoping to compile a Sustainable Buildings Design Philosophy
The scope of this strategy does not include the Colleges. However, the University works closely with the Colleges to address many areas of common
initiative, including sustainability.
1.2. Background
In August, 2009, AECOM was commissioned to assist the University in designing a strategy to address the management of its environmental impacts. The
commissioning of this work resulted from a combination both of statutory drivers and the desire amongst the University population to take an increasingly
strategic approach to sustainability. The work so far has consisted of two phases, which are described below.
Phase 1: Sustainability baseline report
The output of Phase 1 of this process was a Sustainability Baseline Report focussing on the following:
compilation of a robust data set of the University‟s energy use, CO2 emissions, water use, and waste generation in 2008/9, to serve as a baseline;
assessing key statutory and voluntary drivers for the University in relation to reducing energy use and CO2 emissions; and
engaging with key stakeholders across the University to understand their aspirations with regard to sustainability, as well as their views on key barriers
and opportunities in relation to reducing CO2 emissions from energy.
Phase 2: Carbon management strategy
Phase 2 of the work, of which this document is the result, involved developing a Carbon Management Strategy for the University that meets the
requirements of HEFCE and sets out a strategy for meeting the University‟s own objectives in this area. This document was prepared in close consultation
with the University‟s Sustainability Team, signed off by the Head of Estates and the Pro Vice Chancellor for Planning and Resources and approved by the
Sustainability Steering Group, Buildings and Estates Sub Committee, Planning and Resources Allocation Committee and Council.
The main elements of Phase 2 are outlined below.

8
Compilation and verification of the opportunities available to the University to reduce CO2 emissions, covering:
– technical/infrastructural interventions to reduce demand;
– behavioural interventions to reduce demand; and
– technical/infrastructural interventions to reduce the CO2 intensity of the energy that the University uses („supply-side‟ interventions).
Presentation of the three opportunity types alongside each other in a Marginal Abatement Cost Curve, allowing for the lowest cost combination of
measures to achieve different levels of CO2 reduction to be identified and thus for the University to make a decision on targets for reduction in CO2
emissions.
Designing a strategy to deliver the target CO2 reduction chosen by the University in the most cost-effective manner.
Phase 3: Sustainable Water Management Strategy and Zero Waste Strategy
Phase 3 of the work, of which this document is an element, involved developing strategies outlining measures to reduce the environmental impact of the
University‟s waste stream and to reduce the amount of potable water the University uses.
The main elements of this stage include:
surveys of the University‟s top 10 waste generating buildings and of the top 10 water using buildings;
email survey of all building managers ;
opportunity identification; and
target setting.
Alongside these two full strategies, AECOM has compiled the frameworks of strategies covering:
sustainable travel;
sustainable procurement; and
biodiversity.
1.3. Drivers for water management
1.3.1. The environmental impact of water use
Water and carbon emissions
The principal environmental impacts of water use are in the energy used to extract it, to treat it for drinking, to deliver it to the point of use, and to treat the waste water so it can be discharged. The University‟s CO2 emissions from potable water consumed and waste water treated in 2009/10 were calculated to be 385tCO2
2 (0.5% of the University‟s total).
2 The figure of 385tCO2 from the University‟s potable water consumed and waste water treated in 2009/10 does not include water used at Graduate Accommodation sites.

9
The accepted best practice approach to carbon management is the World Resource Institute‟s Greenhouse Gas Protocol (GHGP), recommended by
DEFRA (2009) 3 and by HEFCE
4. The GHGP outlines the approach that organisations should take to managing their CO2 emissions. Central to this is the
categorisation of the carbon emissions that result from an organisation‟s activities into three scopes; these scopes are numbered in order of the priority with
which it is recommended an organisation address calculating and reducing their emissions, and are set out in Table 1 below.
Table 1: Scopes of Carbon Emissions under the Greenhouse Gas Protocol
Description Examples
Scope 1 Direct Emissions
Direct emissions occur from sources that are owned or controlled by the organisation
Direct fuel and energy use (e.g. gas
or oil)
Transport fuel used in institutions‟
own fleet vehicles
Scope 2 Indirect Emissions
Emissions from the generation of purchased electricity consumed by the organisation
Purchased electricity
Scope 3 Other Indirect Emissions
Emissions which are a consequence of the activities of the organisation but occur from sources not owned or controlled by the organisation
Water
Waste
Procurement
Commuting (both staff and students)
Land based staff business travel
Staff business air travel
The reason for the categorisation into scopes is that the majority of greenhouse gas emissions will be an organisation‟s scope one and two emissions. The
emissions generated by the University‟s procurement are the scope one and two emissions of the companies that manufacture and distribute the goods or
provide the services, and are therefore primarily the responsibility of those companies.
HEFCE currently only require institutions to set a carbon reduction target for scope one and two emissions. Similarly, the carbon emissions legislation to
which the University is subject, namely the Carbon Reduction Commitment Energy Efficiency Scheme and the European Union‟s Emissions Trading
Scheme only currently regulate scope one and two emissions.
However, HEFCE do state that Institutions are encouraged to measure a baseline for scope three emissions and in the longer term they will expect these to
be included in the University‟s carbon management strategy.
3 Guidance on how to measure and report your greenhouse gas emissions DEFRA September 2009, accessed on 12/8/09 at
http://www.defra.gov.uk/environment/business/reporting/pdf/ghg-guidance.pdf
4 Carbon management strategies and plans: a guide to good practice, HEFCE, January, 2010 (amended September 2010)

10
Water Scarcity
In terms of relative water stress, the South East of England is classed as „serious‟ by the Environment Agency, to the extent that Thames Water is
considering constructing a new 10km2 reservoir near Abingdon; a clear illustration of the knock-on effects of increased water use. The reservoir would need
to have embankments 25m high in some places to contain the water, having considerable impact on the local landscape and surrounding villages.
Therefore, as a major water user in the area, the University has a responsibility to minimise its use of this scarce resource.
1.3.2. Legislative and fiscal drivers
Whilst it is unlikely that external requirements for targets for water use will be in place in the near future, the University considers water use management an
essential component of addressing its environmental impacts in line with its Environmental Sustainability Policy 2008. 5
5 The Environmental Sustainability Policy 2008 is available on the University‟s website http://www.admin.ox.ac.uk/estates/environment/envpol08.pdf

11
1.3.3. Water costs
As can be seen in Figure 1 below, whilst buying water from the University‟s utility provider and discharging effluent/sewage has been estimated to contribute
only 0.5% to the University‟s carbon emissions, it accounts for 5.39% of the total spend on electricity, gas, oil and water, costing over £540,000. In the
coming five years, the cost of purchasing water is expected to increase by 1.4% per year, according to OFWAT, and effluent/sewage costs are expected to
increase more steeply.
Figure 1: Total University spend on utilities in 2009/10. Water spend includes discharging effluent/sewage.
1.3.4. Reputational risk
The University press office receives many queries from student journalists and private individuals asking about the University‟s environmental performance,
often requesting information under the Freedom of Information Act. There is a reputational risk if the University does not take steps to proactively manage its
environmental impacts and communicate challenges and achievements to staff and students. The Sustainability Team reports on the environmental impacts
of the University to various internal and external bodies – which also include reporting on water consumption in the University.
Gas22.11%
Oil0.35%
Electricity72.16%
Water5.39%
Total utility spend 2009/10
Total:£10,027,000

12
2. Targets
As outlined in section 3.2, the University‟s water use has decreased by an average of 2.2% per year for the past 10 years, which is a commendable
achievement. It is considered that, as a minimum, the target for water management should be to maintain this trajectory for the next five years. This will
require focussed effort to reduce water use, as the scale of opportunities for water use reduction is likely to be greatly reduced.
Therefore, the target for the University‟s water use should be for water use to decrease by 11% by 2014/15 against 2009/10 levels (which were 347,364m3),
meaning that absolute potable water purchased in 2014/15 should be no more than 310,000m3.

13
3. Baseline
This section presents recent and historical data on overall water use at the University, and in the different Divisions.
3.1. The contribution water makes to the University’s carbon emissions
Figure 2: University CO2 emissions resulting from consumption of electricity, natural gas, heating oil, fuel in owned-vehicles, fuel for work-related air travel 6 and water
7 in
2008/9. These CO2 emissions are classed as scope three (see section 1.3.1 above for more on scopes of emission).
As stated above, the CO2 emissions from the energy used in extraction, treatment and delivery of water, and treatment of effluent (scope three emissions)
were calculated to be 385 tonnes of CO2 in 2009/10, 0.5% of the University‟s total. This is illustrated in Figure 2.
6 There is some uncertainty around work-related air travel data, see Sustainability Baseline Report of the University of Oxford for more information.
7 This includes CO2 emissions from potable water consumed and waste water treated.
Electricity 68.05%
Gas 23.81%
Oil 0.17%
Water 0.44%
Vehicles 0.45%
Air Travel 7.08%
Total 87,597
tonnes of scope three CO2

14
3.2. Historical water use
Figure 3: the University‟s annual water use dating back to 2000/1
As can be seen in Figure 3 and Figure 4, the trajectory of the University‟s water use has not followed that of its Gross Internal Area (GIA). Since 2004/5, the
University‟s GIA has increased by 10% and its energy use has increased by 23%, whereas its water use has decreased by 20%.
0
100
200
300
400
500
600
2000/1 2001/2 2002/3 2003/4 2004/5 2005/6 2006/7 2007/8 2008/9 2009/10
Wate
r co
nsu
mp
tio
n (
1,0
00s o
f m
3)

15
Figure 4: annual data of the Gross Internal Area of the University‟s estate, dating back to 2004/5
This divergence between water use and energy/space is likely to be explained by a reduction in the water intensity of laboratory research at the University.
For further exploration of this dynamic, please see section 6.2 Laboratory-related water use.
0
100
200
300
400
500
600
2004/5 2005/6 2006/7 2007/8 2008/9 2009/10
Gro
ss I
nte
rnal
Are
a (
1,0
00s o
f m
2)

16
3.3. Analysis of water use by Division
Figure 5 shows the University‟s water use by Division in 2008/9, totalling approximately 370,000m.
Figure 5: Total water use of the University (370,254m3) in 2008/9 broken down by Division.
Water use patterns do not closely follow those of energy use. Whereas the Medical Sciences Division was responsible for 45.6% of all stationary related CO2 emissions in 2008/9, Figure 5 shows that it accounts for 32% of water use, with MPLS accounting for 41%.
ASUC (4.5%)
Social Sciences
(5.9%)
Admin (7.5%)
MPLS (44.6%)Humanities
(1.9%)
Medical Sciences (34.9%)
Continuing Education
(0.6%)

17
Figure 6: Cubic metres (m3) of water used per square metre of net internal area in 2008/9.
Figure 6 and Figure 7 suggest that MPLS‟s activities are the most water-intensive, followed by the Medical Sciences Division. See the next section for an
exploration of why these Divisions are such heavy water users.
Figure 7: Cubic metres (m3) of water used per full-time equivalent staff member in 2008/9.
0.0
0.2
0.4
0.6
0.8
1.0
1.2
1.4
1.6
1.8
2.0
ASUC Social Sciences
Admin MPLS Humanities Medical Sciences
Continuing Education
0
10
20
30
40
50
60
70
80
90
ASUC Social Sciences
Admin MPLS Humanities Medical Sciences
Continuing Education

18
4. Methodology
The information in this strategy was gathered from three sources, outlined below.
Overall water use data for each building was compiled by Philip Pike (Energy Manager and acting Head of Environmental Sustainability) and Jonathan
Walford (Assistant Energy Conservation Engineer) from Estates Services, collated from bills and meter readings.
A series of building audits of the University‟s 10 top water using buildings.
An email survey of the University‟s Building Managers and Departmental Administrators.
Individual buildings‟ performance was assessed with recourse to the Building Research Establishment‟s Environmental Assessment Method.
4.1. The Building Research Establishment’s Environmental Assessment Method
Criteria for establishing how sustainable the University‟s approach to water use is were taken from the Building Research Establishment‟s Environmental
Assessment Method (BREEAM). BREEAM is a method for assessing how sustainable a new building or refurbishment is, therefore it is not entirely
applicable for assessing existing building stock, but has been used as a guide.
It is University policy that all new capital projects (and refurbishments of above £1m) are required to achieve BREEAM „Excellent‟, which will present a
significant challenge to design teams. The achievement of BREEAM Excellent will mean that new buildings will use significantly less water and energy.
Reference is made throughout this document to the requirements of the latest version (2008 Issue: 4.0) of the Assessor‟s Guidance for BREEAM Education,
which includes specific requirements for higher education institutions.
BREEAM does not assess the following water uses, as they are considered to be specified depending on the particular operational purpose, therefore, they
are also excluded from consideration in this strategy:
Kitchen taps;
Cleaners‟ sink taps;
External taps;
Process taps in laboratory areas but not bench taps (which should be included);
Scrub-up taps;
Decontamination showers; and
Taps dedicated to Health and Safety, e.g. eye washing.
4.2. Building audits
To compile the information in this report, the 10 highest water using buildings in the University were audited. These were short audits, with two buildings
being audited in one day. The audits focussed on two areas of water use; the laboratories and the sanitary facilities in the washrooms. Information was
provided by facilities managers and maintenance staff and through measurements of flow rates and cistern sizes.
19
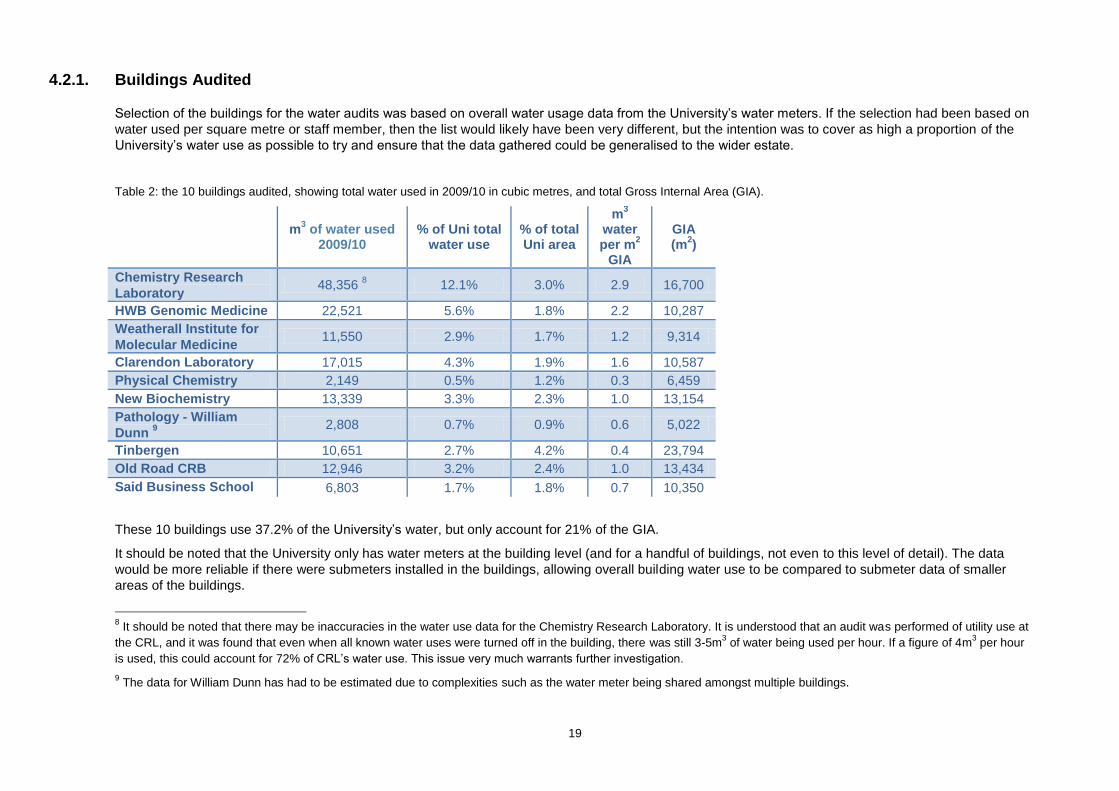
4.2.1. Buildings Audited
Selection of the buildings for the water audits was based on overall water usage data from the University‟s water meters. If the selection had been based on
water used per square metre or staff member, then the list would likely have been very different, but the intention was to cover as high a proportion of the
University‟s water use as possible to try and ensure that the data gathered could be generalised to the wider estate.
Table 2: the 10 buildings audited, showing total water used in 2009/10 in cubic metres, and total Gross Internal Area (GIA).
m
3 of water used
2009/10 % of Uni total
water use % of total Uni area
m3
water per m
2
GIA
GIA (m
2)
Chemistry Research
Laboratory 48,356
8 12.1% 3.0% 2.9 16,700
HWB Genomic Medicine 22,521 5.6% 1.8% 2.2 10,287
Weatherall Institute for
Molecular Medicine 11,550 2.9% 1.7% 1.2 9,314
Clarendon Laboratory 17,015 4.3% 1.9% 1.6 10,587
Physical Chemistry 2,149 0.5% 1.2% 0.3 6,459
New Biochemistry 13,339 3.3% 2.3% 1.0 13,154
Pathology - William
Dunn 9
2,808 0.7% 0.9% 0.6 5,022
Tinbergen 10,651 2.7% 4.2% 0.4 23,794
Old Road CRB 12,946 3.2% 2.4% 1.0 13,434
Said Business School 6,803 1.7% 1.8% 0.7 10,350
These 10 buildings use 37.2% of the University‟s water, but only account for 21% of the GIA.
It should be noted that the University only has water meters at the building level (and for a handful of buildings, not even to this level of detail). The data
would be more reliable if there were submeters installed in the buildings, allowing overall building water use to be compared to submeter data of smaller
areas of the buildings.
8 It should be noted that there may be inaccuracies in the water use data for the Chemistry Research Laboratory. It is understood that an audit was performed of utility use at
the CRL, and it was found that even when all known water uses were turned off in the building, there was still 3-5m3 of water being used per hour. If a figure of 4m
3 per hour
is used, this could account for 72% of CRL‟s water use. This issue very much warrants further investigation.
9 The data for William Dunn has had to be estimated due to complexities such as the water meter being shared amongst multiple buildings.
20
Similarly, the University has only a few enabled half-hourly water meters, which allow understanding of how a building uses water at each time of the day
(this is as opposed to standard meters that can only tell you how much water has been used since the last time the meter was read). Widely installing half-
hourly water meters connected to a building management system would be particularly useful in identifying leaks, as they make out-of-hours water use
visible, as well as other irregularities.
4.3. Email Survey
An email survey was sent out to all of the University‟s Building Managers and Departmental Administrators asking questions regarding their buildings‟
laboratory and sanitary water use; responses were received for 27 of the University‟s buildings. The full survey is provided in Appendix II, and the results in
Appendix III. Many of the questions asked respondents to make estimates based on their knowledge of the building; therefore there may be some
inaccuracies in the data.
21
5. Measures in place to reduce water use
The water intensity of the University‟s operations is decreasing year on year, and overall water use has fallen 20% in the last six years. As discussed in
section 6.2, this is thought to be principally due to an overall reduction in the water intensity of scientific research at the University.
There is evidence that the water efficiency of the University‟s sanitary fittings is increasing as fittings are replaced or renovated, with 13% of the taps for
which evidence was provided having aerators fitted to reduce the flow rate.
5.1. Rainwater harvesting infrastructure
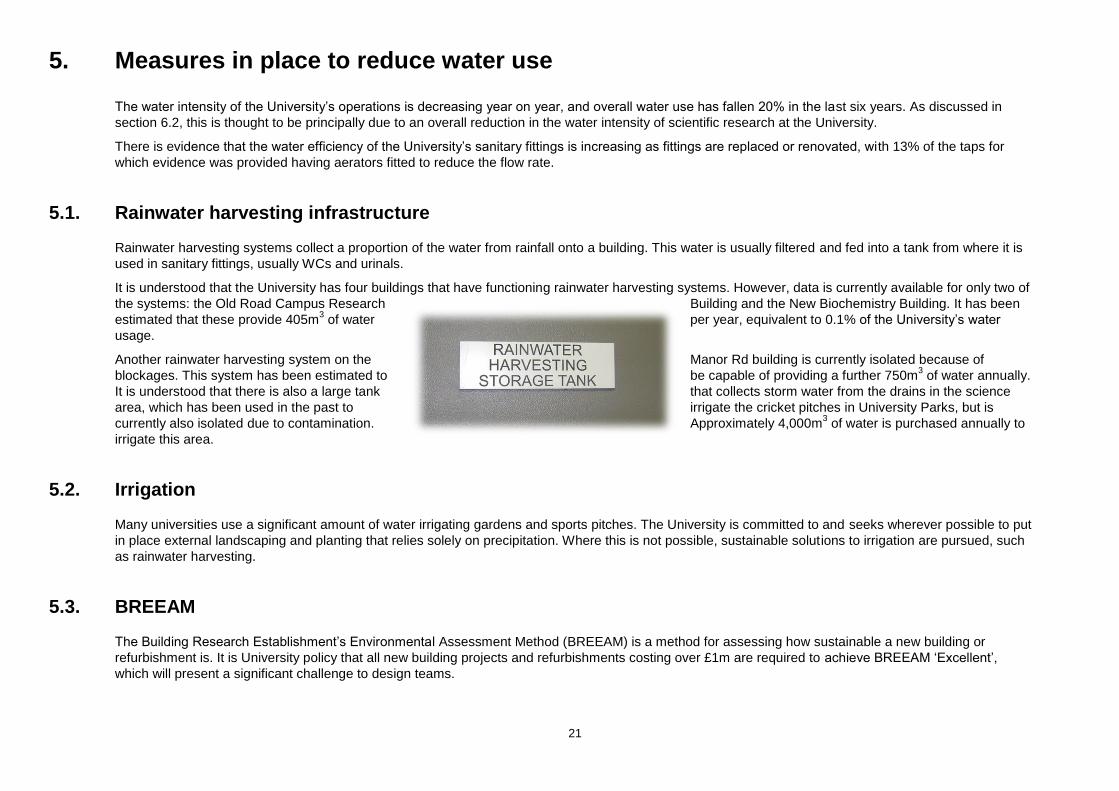
Rainwater harvesting systems collect a proportion of the water from rainfall onto a building. This water is usually filtered and fed into a tank from where it is
used in sanitary fittings, usually WCs and urinals.
It is understood that the University has four buildings that have functioning rainwater harvesting systems. However, data is currently available for only two of
the systems: the Old Road Campus Research Building and the New Biochemistry Building. It has been
estimated that these provide 405m3 of water per year, equivalent to 0.1% of the University‟s water
usage.
Another rainwater harvesting system on the Manor Rd building is currently isolated because of
blockages. This system has been estimated to be capable of providing a further 750m3 of water annually.
It is understood that there is also a large tank that collects storm water from the drains in the science
area, which has been used in the past to irrigate the cricket pitches in University Parks, but is
currently also isolated due to contamination. Approximately 4,000m3 of water is purchased annually to
irrigate this area.
5.2. Irrigation
Many universities use a significant amount of water irrigating gardens and sports pitches. The University is committed to and seeks wherever possible to put
in place external landscaping and planting that relies solely on precipitation. Where this is not possible, sustainable solutions to irrigation are pursued, such
as rainwater harvesting.
5.3. BREEAM
The Building Research Establishment‟s Environmental Assessment Method (BREEAM) is a method for assessing how sustainable a new building or
refurbishment is. It is University policy that all new building projects and refurbishments costing over £1m are required to achieve BREEAM „Excellent‟,
which will present a significant challenge to design teams.

22
The achievement of BREEAM Excellent will mean that new buildings will use significantly less water and energy, as well as many other effects which will
result in a sustainable building, in a broad sense of the word. The University‟s policy of targeting BREEAM „Excellent‟ for all new buildings will deliver
reductions in the water intensity of the University‟s operations, through achieving credits for measures such as:
Water efficient sanitary fittings;
Rainwater harvesting systems and greywater recycling systems;
Leak detection;
Water submetering;
Presence detectors controlling the water supplies to washrooms; and
Water efficient irrigation practices.
23
6. Results
6.1. Introduction
This section presents the results of the desktop investigations, the site audits and the email survey.
6.2. Laboratory-related water use
The scale of research activity at Oxford is substantial, involving more than 70 departments, the Colleges, over 1,600 academic staff, more than 3,500
contract researchers, and around 3,600 graduate research students. The University‟s top 10 water-using spaces are almost all laboratories, although only
14.3% of the University‟s floor area is classified as laboratory space (50 buildings out of a total of 220 buildings have laboratories). The one building on the
list at which laboratory research is not undertaken is the Saïd Business School. This may be explained by the size of the school and the nature of the
patterns of use, which are unique at the University due to the intensive nature of the courses run there, and the fact that the late-opening state-of-the-art
library is popular with students across the University. The School also has large kitchen facilities.
The 10 buildings audited use 37.2% of the University‟s water, but only account for 21% of the GIA. This is due to the extent of laboratory research
undertaken in these spaces, as laboratory research is much more water intensive than other forms of research. The research undertaken in the University‟s
laboratories can be broadly split, for our purposes, into physical/chemical and biological, each type of research having its own dynamics of water use. The
principal opportunities identified for increasing the efficiency of water use in physical/chemical laboratory research is in water used for cooling; for biological
laboratories, the key area of focus identified is in the use of the various forms of purified water. The following sections consider opportunities in these areas
of water use.
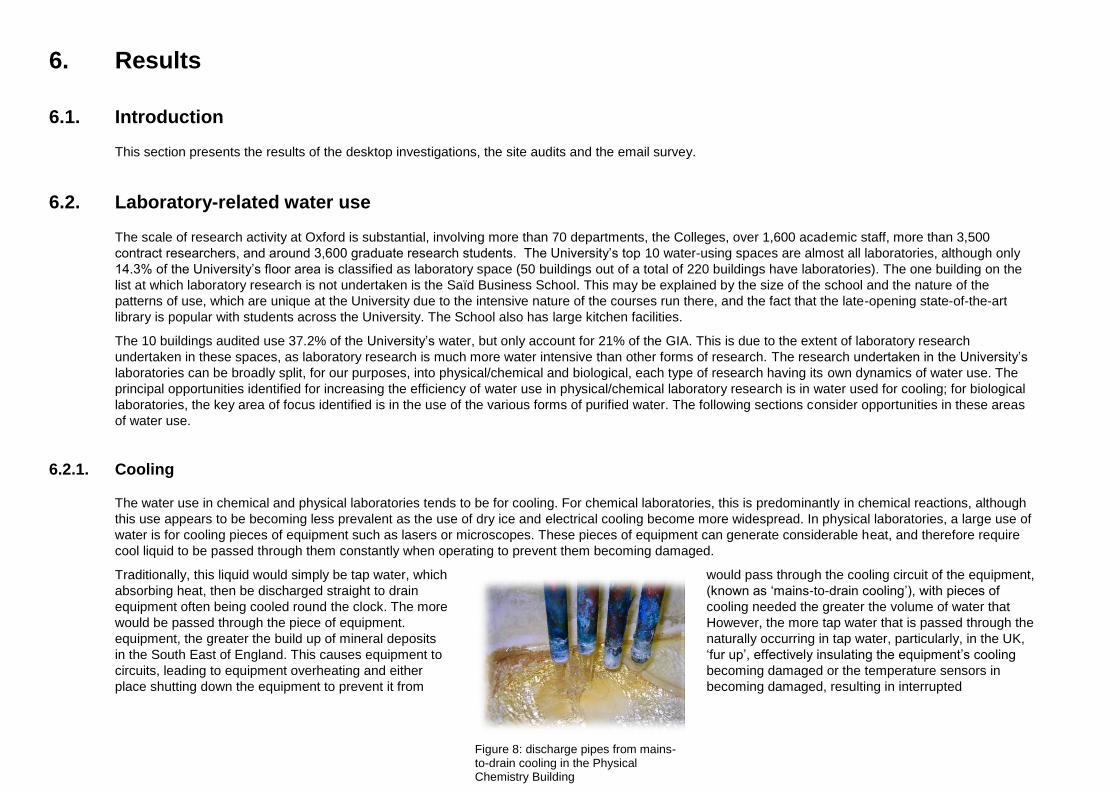
6.2.1. Cooling
The water use in chemical and physical laboratories tends to be for cooling. For chemical laboratories, this is predominantly in chemical reactions, although
this use appears to be becoming less prevalent as the use of dry ice and electrical cooling become more widespread. In physical laboratories, a large use of
water is for cooling pieces of equipment such as lasers or microscopes. These pieces of equipment can generate considerable heat, and therefore require
cool liquid to be passed through them constantly when operating to prevent them becoming damaged.
Traditionally, this liquid would simply be tap water, which would pass through the cooling circuit of the equipment,
absorbing heat, then be discharged straight to drain (known as „mains-to-drain cooling‟), with pieces of
equipment often being cooled round the clock. The more cooling needed the greater the volume of water that
would be passed through the piece of equipment. However, the more tap water that is passed through the
equipment, the greater the build up of mineral deposits naturally occurring in tap water, particularly, in the UK,
in the South East of England. This causes equipment to „fur up‟, effectively insulating the equipment‟s cooling
circuits, leading to equipment overheating and either becoming damaged or the temperature sensors in
place shutting down the equipment to prevent it from becoming damaged, resulting in interrupted
Figure 8: discharge pipes from mains-to-drain cooling in the Physical Chemistry Building

24
experiments, damaged equipment and the loss of precious data.
To address the need for additional cooling, chillers are increasingly being used to provide pre-cooled liquid to the cooling circuits of research equipment.
This liquid is then often re-circulated into the chiller to be cooled again, meaning that no water is wasted in the process. More modern laboratories tend to be
built with a central cooling „main‟, a chiller unit that cools water which is then distributed to the different pieces of equipment and returned to the chiller in
much the same way that a common central heating system works. These central chillers often also provide cooling for the air conditioning system. This is
just one of the examples of ways in which the water efficiency of laboratory research at the University is increasing. Some facilities managers also reported
that laboratory users are becoming more conscious of water wastage, and therefore are not leaving mains-to-drain cooled equipment running over night or
at weekends as frequently as they used to.
However, the University‟s building portfolio consists of wide range of ages of building, and some of the older buildings that have limited process cooling, or
none at all, are still using significant amounts of water for mains-to-drain cooling. A water efficiency audit was performed in 2006 by Thames Water on the
University‟s Clarendon Laboratory; this audit estimated that 80% of the 35,000m3 that the Clarendon Laboratory was using annually was for mains-to-drain
cooling, at a cost of £25,000 per year.
Since 2006, the absolute amount of water used by the Clarendon Laboratory has decreased by 49%; this is due both to an overall decrease in the amount of
research that is being undertaken at the Laboratory and to the installation of increased process cooling capacity via a centralised cooling system. However,
approximately 15 pieces of equipment were encountered on the day of the audit with mains-to-drain cooling operating.
In the responses to the email surveys, 43% of the responses for buildings in which laboratory research is undertaken (8 buildings in total) estimated that the
highest water use in their building was for cooling, and 13% estimated it was the second highest. For the question “at an estimate, how many pieces of
research equipment are there in the building (that are used at least once a month on average) that are cooled mains-to-drain water?” the average was 2.6
pieces of equipment, and 14% of these buildings were stated not to have a cooling loop.
Opportunity considered: flow restrictors
To reduce water used in cooling, there two main approaches that merit consideration. One approach would be to try to ensure that those pieces of
equipment that have mains-to-drain cooling only use the amount of water required, with the use of flow restrictors being placed on the water supplies. This
approach is premised on the volume of the water supplies to the equipment being sometimes more than is necessary. The Thames Water Audit mentioned
above stated that the average cooling water flow rate discharging to drain at the Clarendon Laboratory was found to be 12L/min, 10
and that this could be
reduced by up to 60% by restricting the amount of water going through the equipment to only that needed.
When, during the audits, facilities managers were asked about the potential for fitting flow rate restrictors to the supply pipes to equipment, a common reply
was that they receive regular requests from researchers to increase the amount of water going through their equipment, because it has been overheating
and the researchers have lost results as a consequence.
10
In the audit of Clarendon Laboratory performed for this report, access was not available to any of the discharge pipes on mains-to-drain cooled research equipment, so the
figure from the Thames Water audit of 12L/min cannot be verified. However, two such discharge pipes were accessed during the audit of Physical Chemistry, and the flow
rates of these were found to be 1.7L/min and 1.2L/min, considerably less than the average stated in the Thames Water Audit or 12L/min

25
In the email survey, the following question was asked: "how many of the pieces of equipment that are cooled using once-through mains water do you think
could potentially have flow rate restrictors fitted?", only one piece of equipment was identified. Respondents were given the opportunity to elaborate, and
responses included:
We currently employ a chilled water recirculating system and if we have to utilise the mains to drain approach we do so at a restricted rate already.
None of the equipment would benefit from this as they are sensitive electron microscopes and thus have control set by the users dependent upon the
requirement.
Also, many of the buildings that were identified as having mains-to-drain cooling are older buildings that are due to be demolished or refurbished in the near
future.
Opportunity considered: extending cooling mains
The second approach considered to reducing the amount of water that is used in mains-to-drain cooling is that of extending the cooling mains in the building
to provide the equipment with water that is cooled in a central unit. The obvious barrier to this solution is cost; retrofitting such a system would be a complex
and expensive means of addressing this issue. In the email survey, the following question was asked “Do you think there is scope at the building to extend
the cooling loop to provide cooling for more pieces of equipment, or to put in place a central or local process cooling system(s)?" two respondents answered
yes, and six answered no.
Considering this information, undertaking an initiative to retrofit flow rate restrictors in the buildings may not be recommendable. The issue of reducing the
amount of water that the University uses in mains-to-drain cooling may be most cost-effectively addressed through the processes of procuring new buildings
and refurbishments, ensuring that cooling mains are installed wherever the predicted cooling requirements of the building dictate.
It should be noted that, whilst mains-to-drain cooling is very wasteful in terms of water use, it generates a very small amount of CO2 when compared to
mechanical cooling systems, which are also capital intensive to buy and install, and require significantly more maintenance than mains-to-drain cooling. So,
this is a point at which a broader view of sustainability should be taken, considering water, energy and cost together. Similarly, some of the facilities
managers interviewed as part of the building audits stated that the water companies charge them a reduced rate on the effluent from their building due to
how dilute the effluent is. This effectively functions as a driver not to increase the water efficiency of their processes. However, mains-to-drain cooling can
certainly not be considered good practice water management.
6.2.2. Pure water
Tap water, whilst safe for drinking contains levels of mineral and organic contaminants meaning that further purification is needed for many laboratory
applications. This would traditionally have been achieved through energy-intensive processes such as distillation, but Reverse Osmosis (RO) is the most
commonly used process today, being significantly less water and energy intensive. RO is essentially a filtration process using a very fine membrane to
remove particulates and bacteria from water.
Two of the larger uses of RO water in the University are for glass washing and sterilisation.
26
Glass washing: the biological laboratories use a considerable amount of glass utensils, all of which are washed in glass washers that have one or more
rinse cycles that use just RO water, to ensure the glass is as free from contaminants as possible. The rinse cycles in the University‟s glass washers
were found to use up to 40 litres of RO water per rinse.
Sterilisation: a large proportion of the waste that comes out of biological laboratories needs to be sterilised before it can be sent for disposal. Similarly,
many of the utensils used in the laboratories require sterilisation between uses. This sterilisation is commonly done in an „autoclave‟, which subjects the
material to high-pressure high temperature steam. Many of the University‟s autoclaves run on RO water to prevent the steam jets becoming blocked with
mineral and organic deposits.
For many research purposes, the RO process does not provide water of sufficient purity and the water undergoes a further purification process called de-
ionisation (also known as „demineralisation‟ or „polishing‟), which passes the water through ion exchange resins which bind to and filter out the mineral salts,
reducing the water‟s electrolytic conductivity.
Across the University there are a broad range of configurations of water purification equipment, ranging from large central reverse osmosis units with
polishers at the point of use to small bench-top units that perform the whole process. Manufacturers of purification equipment have stated that the types of
water purification equipment in place at the University generate an average of 3-4 litres of waste water for every litre of RO water generated. Depending on
the type of equipment used, the polishing process may also generate further waste water, but the proportions vary.
Many of the more modern RO systems recover the waste water and feed it back through the process, reducing the waste water generated by up to 70%,
however this level of recovery is only possible on the larger central RO units, the potential for recovery on smaller bench top units is much less.
Opportunity considered: recycling purification waste water
There is the potential for waste water from water purification processes can be used in a building‟s water recycling system (see section 5.1) for flushing in
the washrooms. An estimated 19,985m3 of waste water is generated across the University each year producing pure water,
11 equivalent to eight Olympic-
size swimming pools. If all this water were used for flushing toilets, displacing the use of tap water, the financial saving would be approximately £34,000 per
year, based on current prices.
No evidence has been found however from other organisations of waste water from water purification processes being used in such a way. Therefore, some
form of investigation will have to be undertaken to establish whether the properties of this waste water, and the resulting implications for the University‟s
sanitary systems, impede its use in this way. If the decision is taken to proceed with such a system, a trial installation should be used to gather data to
inform the decision for further roll out.
11
During the audits attempts were made to gather data on the amount of purified water being used at the sites, however, no metered data was encountered. Similarly, when,
in the email survey, “Do you have any means of estimating the amount of reverse osmosis or de-ionised water that the building uses? (Please clarify and make estimates
where possible)” none of the respondents were able to make an estimate.
The estimate above was made in the following way: the Henry Wellcome Building for Genomic Medicine (HWBGM) used 24,210m3 of tap water in 2008/9, which, allowing for
340 days a year, is 71m3 per day. One technician at HWBGM felt he was able to make a reasonably accurate estimate of usage: 3m
3 of RO water per day. If, as stated
above, 3.5m3 of waste water is generated for every m
3 of reverse osmosis water, then the total amount of water that is 'wasted' in this way is 3,570m
3 per year, or 15% of all
their water use. Total annual water use for Medical Sciences in 2008/9 was 135,530m3, 15% of this is 19,985m
3.

27
Opportunities for recycling waste water from the purification process are limited, as a large proportion of the University‟s water purification takes place in
small bench top units spread throughout the laboratories. Retrofitting a system to capture this dispersed water source would be considerably capital
intensive. However, one instance has been identified in which a large central water purification unit is located next to the building‟s rainwater recycling
tank (see section 5.1). Investigations should be undertaken to establish the feasibility and cost of feeding the waste water generated by this unit into the
tank.
More generally, the University should try to ensure that the opportunities presented by new buildings to put in place systems that feed waste water from
purification processes into the rainwater recycling system are taken wherever possible. A key factor in achieving this is having large central RO systems
in the plant rooms, rather than smaller systems dispersed throughout the laboratories. This will not only allow waste water to be fed into a water
recycling system, but also affords the possibility of procuring RO systems with greater rates of water recovery.

28
Opportunity considered: rationalisation of water purification provision
Discussions with various facilities managers and maintenance staff suggested that there may be a lack of clarity around exactly what the purity needs of
some types of equipment are. If equipment is being supplied with water at a higher purity than is required, then this represents wastage of water and energy;
particularly in the cases of large users of purified water, such as glass washers and autoclaves (mentioned above). When, during the building audits,
members of the University‟s maintenance staff were questioned about whether instead of RO water, less water intensive softened water could be used in a
particular autoclave, a definitive answer could not always be provided. This may represent a significant opportunity for reducing water use.
A full audit should be undertaken of the University‟s autoclaves and glass washers, to identify instances in which unnecessarily pure water is being used and
action taken to match the level of purity to the need. This audit may indicate the need to replace a proportion of the University‟s purification equipment. If this
is the case, the process of procuring this equipment should be managed very carefully to ensure that the system installed gives the lowest lifetime costs,
considering energy and water usage as well as maintenance costs. This is particularly pertinent where laboratories are carrying out their own distillation,
which is a water and energy intensive process. Indeed, such a procurement process should be followed whenever water purification equipment is
purchased, particularly large pieces of equipment. To this end, a specification should be drawn up outlining how to minimise lifetime costs when procuring
such equipment and the Purchasing Department should use this to guide in their decision making. This specification should also indicate that waste water
from water purification processes should be recycled (for example for WC flushing) wherever possible.

29
6.3. Sanitary fittings
6.3.1. Introduction
This section considers the taps, WCs and urinals in the washrooms across the University. The University has a building portfolio which spans a wide range
of ages of building and therefore a wide range of sanitary fittings. Older sanitary fittings tend to be much less water efficient than modern fittings, which
generally have smaller cisterns and lower tap flow rates.
The following sections consider the water efficiency of the University‟s sanitary fittings using the data gathered by the site audits and the email survey.

30
6.3.2. Tap flow rate
BREEAM credits are awarded for fitting taps that have a maximum flow rate of no more than 6L/min. During the site visits, the flow rate was measured of a
sample of the taps in the buildings, and the results are presented below.
Figure 9: the maximum flow rate of the cold taps in the buildings audited. 12
Figure 9 and Figure 10 show that only 5% of all taps measured met the requirements of BREEAM of having a maximum flow rate of less than 6L/min, and
many had a maximum flow rate that is considerably higher. It is worth noting that the maximum flow rate of taps may not be an entirely reliable indicator of
the amount of water being used, especially for the particularly high flow rates, because these taps are unlikely to be used at maximum flow rate due to
issues such as splashing.
12
In each building audited, the maximum flow rate of a sample of the taps was measured, and the average flow rate for the building was applied to all the taps in the building.
A proportion of the taps are „mixer‟ taps, with only one tap for hot and cold water. In these cases, the taps have been counted as if there were separate taps for hot and cold.
0
20
40
60
80
100
120
1-2 2-3 3-4 4-5 5-6 6-7 7-8 8-9 9-10 10-11 11-12 12+
Nu
mb
er o
f T
aps
Litres per minute

31
Figure 10: the maximum flow rate of the hot taps in the buildings audited. 12
BREEAM credits are also available for having taps with a mechanism that will turn them off after an amount of time, such as push-taps (pictured). 15% of
the buildings audited had push button taps in the washrooms, and 9% of the taps for which responses to the email survey were received were push-taps.
6.3.3. WC flush volume
BREEAM credits are awarded to a development in which all WCs have an „effective flush volume‟ of 4.5 litres or less („effective flush volume‟ accounts for
the water savings of dual flush systems13
). Figure 11 below shows that a wide range of flush volumes was encountered in the building audits, 26% were
under the 4.5L BREEAM requirement, and can thus be considered water efficient.
13
„Dual flush systems‟ are devices that have the facility to provide lower flush volume for liquids and higher flush volume for solids and paper
0
20
40
60
80
100
120
1-2 2-3 3-4 4-5 5-6 6-7 7-8 8-9 9-10 10-11 11-12 12+
Nu
mb
er
of
Tap
s
Litres per minute

32
Figure 11: the effective flush volumes of the WCs in the buildings audited. 14
23% of the buildings audited had dual flush toilets and 13% of the WCs in the email survey were dual-flush. However, for BREEAM ratings to be achieved,
the WCs would need to have guidance on display instructing the user on the appropriate operation of the flushing device, and none of the buildings audited
had such guidance.
6.3.4. Urinals
BREEAM awards credits for installing urinals that are either:
Fitted with individual presence detectors that operate the flushing control after each use; or
Ultra low flush or waterless urinals. 15
None of the urinals encountered on the building audits were either of these types. However, it is understood that the „Ecocube‟ device (a bacterial odour
control system) has been successfully trialled in some of the University‟s urinals, leading to the flushes being turned off altogether, resulting in significant
water savings with no need to change the sanitary fittings. Data from this initiative should be collated into a case study and made widely available at the
University.
14
In each building audited, the effective flush volume of a sample of the WCs was measured, and the average for the building has been applied to all the WCs in the building.
15 Waterless urinals use a trap insert filled with a sealant liquid instead of water. The sealant floats on top of the urine collected in the U-bend, preventing odours from being
released.
0
10
20
30
40
50
60
70
4.5
or
less
4.5
-5
.5
5.5
-6
.5
6.5
-7
.5
7.5
-8
.5
8.5
-9
.5
9.5
-1
0.5
10
.5 -
11
.5
11
.5 -
12
.5
Nu
mb
er
of
WC
s
Litres per flush

33
Another indicator of the relative water efficiency of urinals is whether they have a shut off device. Traditionally, urinal cisterns were controlled by a simple
ballcock mechanism, which discharges the flush when the cistern is full; the regularity of the flushes was controlled by the speed that the cistern filled, and
the cistern would generally fill and flush all the time, including times when the urinal is not used, such as at night and weekends, unless the water supply
was turned off manually.
Various mechanisms have been introduced to control the flow of urinals, using triggers such as light, sound, use of the taps or timing mechanisms. 25% of
the buildings audited that had urinals did not have any such device, and the facilities managers confirmed that the supplies to these urinals are never turned
off. What is more, 51% of the urinals for which responses to the email survey were received were stated to have no such device. It should be noted that the
introduction of devices such as these brings with it extra costs in the form of increased maintenance burdens.
It was not possible in the limits of these building audits to gain access to the urinal cisterns to measure the size of each individual flush, but a range of sizes
of urinal cistern were encountered.
A surprising finding of the building audits is that two of the 10 buildings surveyed had no urinals at all, both of which were newer buildings, which is likely to
result in a sanitary system with comparatively lower water efficiency than that of a building with a mixture of WCs and modern urinals. The sample size of
the audits is not big enough to establish whether or not this is a trend, but if it is, it may result from drivers such as capital cost and pressures on space.
6.3.5. Opinions of water efficient sanitary fittings
It may be worth noting that a significant number of building users and facility managers, both in discussions in the site audits and in the email survey,
expressed dissatisfaction in their experience of water efficient sanitary fittings. Complaints included:
pipe blockages in WC and urinal systems and the cost and time involved in unblocking them, which has led to some low flush WCs being replaced with
normal WCs;
increased maintenance and replacement costs; and
water in handwashing sinks not getting hot.

34
6.3.6. Opportunities to reduce water use presented by sanitary fittings
Opportunities for reducing the amount of water used by the University‟s sanitary fittings are outlined in this section. See Appendix I for full calculations.
Taps
The taps in the 10 buildings audited were found to have a broad range of flow rates. BREEAM awards credits for taps that have a maximum flow rate of less
than six litres per minute; maximum flow rates of up to 25 litres per minute were found in the University‟s buildings. Flow rate restrictors can be retrofitted to
many of the types of tap found at the University at a low cost. Based on the sample of flow rates measured in the audits, an estimated cost of the opportunity
is as presented below, based on 60% of the University‟s taps having flow rate restrictors fitted.
Opportunity Estimated potential annual
water savings 16
Approximate Estimated Capital Cost Approximate
Payback Per unit University total
Fit flow rate restrictors to 60% of taps with a flow rate of
over 6L/min 8,000m
3 £12,000
17 £10 £22,000 2 years
Note that it has been assumed in this calculation that these taps are used at two-thirds of their maximum flow rate, and any flow rates over 12L/min were
rounded down to 12L/min, as it was not considered that the taps would be used at these more extreme flow rates.
WCs
BREEAM awards credits for fitting WCs that have a flush volume of less than 4.5 litres. 80% of the WCs measured as part of the building audits were found
to have a flush volume of over 6 litres. Simple devices are available that can be placed in WC cisterns to reduce the volume of each flush by one litre. The
opportunity outlined below is based on putting such devices into 80% of the University‟s WCs.
Opportunity Estimated potential annual
water savings
Approximate Estimated Capital Cost Approximate
Payback Per unit University total
Put one „save-a-flush‟ device in 80% of the University‟s 16,000m3 18
£25,000 £7 £11,000 0.5 years
16
Note that estimated potential annual water savings are based on 2008/9 utility prices. In the coming five years, the cost of purchasing water is expected to increase by
1.4% per year, and effluent/sewage costs are expected to increase more steeply.
17 Please note that the figure used in this strategy for £ saved per m
3 of water saved was £1.55/m
3, which was calculated by taking the figure for total water spend and
dividing it by total water used.
18 This is based on putting one „save-a-flush‟ device in each WC cistern that is over 6L. It also assumes that 25% of the potential WC cisterns are inaccessible, or
incompatible for another reason.

35
WC cisterns
Urinals
Most modern washrooms are fitted with devices (often known as „cistermisers‟) that ensure that the urinals only fill and flush when they are triggered by
proximity, sound or use of other facilities in the washroom. The email survey results suggest that 49% of the University‟s urinals do not have such devices.
The average fill rate of urinals is 0.0108m3 per hour.
19 The opportunity identified below is based on the potential savings from restricting 49% of the
University‟s urinals to only filling and flushing for eight hours a day, six days a week.
Opportunity Estimated potential annual
water savings
Approximate Estimated Capital Cost Approximate
Payback Per unit University total
Fit „cistermisers‟ to 49% of the University‟s washrooms 9,500m3 £15,000 £500 £22,000 2 years
19
Average fill rate of urinals of 0.0108m3 per hour was taken from the Chartered Institute of Building Services Engineers Guide B, table B4.21. In the few urinals for which
flow rates were able to be measured in the building audits, flow rates over 3 times that high were found. Therefore, the payback period for this initiative may in reality be
significantly shorter than outlined here.

36
7. Implementation plan
7.1. Recommended actions to reduce water use
7.1.1. Rainwater harvesting and greywater recycling infrastructure
Rainwater harvesting systems collect a proportion of the water from rainfall onto a building; this water is usually filtered and fed into a tank from where it is
used in sanitary fittings, usually WCs and urinals. Greywater is wastewater generated from activities such as laundry, dishwashing, and bathing, which can
be recycled for uses including flushing urinals and WCs.
The University has some rainwater harvesting systems, but currently has no greywater recycling infrastructure in place. The University policy of achieving
BREEAM „Excellent‟ on all new buildings and refurbishments over £1m may result in an increase in rainwater harvesting and greywater recycling
infrastructure, as BREEAM credits are awarded for such systems.
Rainwater harvesting
As outlined in section 5.1, a significant amount of the University‟s rainwater harvesting infrastructure is not currently operational (mainly due to
contamination or blockages). The Manor Road Building has a system that has been estimated to have the potential of providing approximately 750m3 per
year, representing a saving in water costs of approximately £1,000. Roughly 4,000m3 is used annually to irrigate the cricket pitches in University Parks; if we
assume that the currently non-operational rainwater harvesting system there could meet 50% of this need, this could represent a saving in the region of
£3,000 per year.
It is understood that responsibilities for maintaining water recycling infrastructure are somewhat of a grey area, falling between the Department and Estates
Services. Clarifying these responsibilities is likely to facilitate the repair and maintenance of these systems. What is more, the extent of the problems that the
University is having with its rainwater harvesting infrastructure suggests that it would be beneficial for Estates Services to have a specification for such
systems that must be followed when new infrastructure is installed to ensure that similar problems are avoided in the future.
Greywater recycling
A significant opportunity for greywater recycling is presented by the swimming pool at the University‟s Iffley Road Sports Centre. Swimming pools have
filters that must be rinsed periodically; this rinsing process uses a large volume of water that is discharged to drain. However, this water is generally of
sufficient quality to be recycled for flushing urinals and WCs, and such systems are becoming more and more common in sports centres.
It is estimated that approximately 550m3 of rinse water is generated at the Iffley Road Sports Centre each year, representing a potential saving of £800 per
year if this water were recycled. If investigation proves that retrofitting such a system in the Sports Centre is impractical, measures to increase the water

37
efficiency of the rinsing process should be investigated, ideally coinciding with maintenance and/or refurbishment of the swimming pool or filter rinsing
system. Consideration should also be given to incorporating rinse water recycling into plans for new sports facilities where possible.
Significant opportunities for recycling greywater are presented by the use of purified water. For example, the RO unit in the plant room of the New
Biochemistry building is located adjacent to the rainwater harvesting tank. Investigation should be undertaken to establish the feasibility of feeding the waste
water from the RO unit into the tank, and more broadly into similar opportunities across the University for recycling waste water from purification processes.
Similarly, when designing new laboratories that will use significant amounts of purified water, the University should investigate the opportunities to install
large central purification units linked into water recycling infrastructure, and Estates Services should hold a standard specification for such systems.
7.1.2. Sanitary Facility Opportunities
The opportunities identified for improving the water efficiency of the sanitary facilities across the University have short payback periods, and there may be
government funding available from organisations such as ADSM. 20
These organisations should be engaged to establish what resources are available.
Flush Volume Reduction Devices
Following the opportunity identified in section 6.3.6, it is recommended that the installation of simple flush volume restriction devices be trialled in some of
the University‟s buildings to establish the practicality of fitting such devices and to establish the effect on water use. The buildings chosen should ideally
have the following characteristics:
No plans for refurbishment or demolition within the next five years
Accessible WC cisterns
WC cisterns with an effective flushing volume of over six litres
A reliable water meter and several years of historical water use data as a baseline
Ideally, the building would not have large water uses such as laboratories or large catering facilities, which may greatly affect the water use if their usage
volumes fluctuate
The building should also have had a stable level of occupancy during the time covered by the historical water data, and occupancy levels should be
predicted to remain stable for the period of the trial; or there must be reliable occupancy data available, so water use data can be normalised.
Once the buildings are chosen, the devices should be fitted and the water use levels monitored for a year. At this stage, the facility manager and/or other
relevant stakeholders should be approached to collect feedback on whether any problems were caused by the devices.
At this stage, the effectiveness of the measure can be assessed, and, if deemed to be successful, a business case can be drawn up for implementing the
devices more widely.
20
http://www.adsm.com/AquaFund.html See section 7.3 for more information.

38
Tap flow rate restrictors
The procedure followed for establishing the practicality and efficacy of retrofitting flow rate restrictors on taps should be similar to that for the flush volume
reduction devices outlined above. However, it should ideally not be in the same buildings, to allow the effects of the respective measures to be examined in
isolation. If the same building is used, trialling of the different measures should be staggered. In regards choosing the building, aside from the relevant
characteristics above, the building‟s taps should have a maximum flow rate as high as possible, and certainly above seven litres per minute.
Urinal control devices
This section considers the water saving opportunity of fitting „cistermiser‟-type devices in washrooms with urinals in to ensure that they only flush during
times that the washroom is in use, avoiding unnecessary flushing overnight and at weekends, as discussed in section 6.3.6. It is not felt that such a measure
would need to be trialled first, as the amount of water saved can be relatively accurately predicted. However, devices should be fitted that are fully
adjustable, to ensure that the flushing rates can be increased should any problems arise such as blockages or odour.
The results from the survey and audits should be used as a basis for identifying and prioritising buildings to have the devices fitted. The buildings chosen
should have a high number of urinals without control devices.
7.1.3. Rationalisation of purified water use
Discussions with various facilities managers and maintenance staff suggested that there may be a lack of clarity around exactly what the purity needs of
some types of equipment are. If equipment is being supplied with water at a higher purity than is required, then this represents wastage of water and energy;
particularly in the cases of large users of purified water, such as glass washers and autoclaves (discussed in section 6.2.2). When, during the building
audits, members of the University‟s maintenance staff were questioned about whether instead of RO water, less water intensive softened water could be
used in a particular autoclave, a definitive answer could not always be provided. This may represent a significant opportunity for reducing water use.
A full audit should be undertaken of the University‟s autoclaves and glass washers, to identify instances in which unnecessarily pure water is being used and
take actions to match the level of purity to the need. This audit may indicate the need to replace a proportion of the University‟s purification equipment. If this
is the case, the process of procuring this equipment should be managed very carefully to ensure that the system installed gives the lowest lifetime costs,
considering energy and water usage as well as maintenance costs. This is particularly pertinent where laboratories are carrying out their own distillation,
which is a water and energy intensive process. Indeed, such a procurement process should be followed whenever water purification equipment is
purchased, particularly large pieces of equipment. To this end, a specification should be drawn up outlining how to minimise lifetime costs when procuring
such equipment and the Purchasing Department should use this to guide in their decision making. This specification should also indicate that waste water
from water purification processes should be recycled (for example for WC flushing) wherever possible.

39
7.1.4. Water data
Half-hourly meters
Half hourly metered data allows understanding of how a building uses water at each time of the day (this is as opposed to standard meters that can only tell
you how much water has been used since the last time the meter was read). Such meters are particularly useful in identifying leaks, as they make out-of-
hours water use visible, as well as other irregularities in water use. This is particularly true if the meters are linked into a Building Management System
(BMS), which would allow the building‟s water use to be monitored remotely rather than having to go to the meter to collect the data. Cambridge University
announced in 2005 that a system such as this at their buildings helped them to achieve savings of more than £500,000 a year. 21
Several of the newer
laboratories at the University have water meters connected to the BMS; however the data is often inaccurate and/or rarely monitored.
It is recommended that, as a minimum, the University‟s top 10 water-using buildings should have BMS-linked half-hourly water meters that are appropriately
commissioned and the data on them monitored. . Increasingly, the meters that utility companies fit have the capability to produce half-hourly data, but this
capability is either not enabled, or the data is not captured.
Therefore, it is recommended that the water meters in place in the University‟s top 10 water-using buildings are assessed to establish whether or not they
would need to be replaced or just linked in to the University‟s BMS, and therefore establish a cost for generating and capturing this half-hourly data at the
target buildings. With this system in place, efforts to identify water wastage could be much more focussed.
Benchmarking laboratory water use
As installing half-hourly water meters in all of the University‟s buildings is likely not to prove to be cost-effective, a less expensive but cruder method for
identifying buildings that may be using water inefficiently (due to leaks or other issues) would be to try to establish benchmarks for water use for the different
kinds of space that the University has. This could be a desktop activity, using data available from the University‟s Information Management Team. Such a
process could generate benchmarks such as: any building with a water usage of over Xm3 per m
2 of floor area, with a % of floor area that is laboratory of
less than X% should be investigated to establish why water use is so high.
7.1.5. Spreading best practice
Taking effective action to reduce the University‟s water use is difficult without reliable and relevant data, and some of the most reliable and relevant available
to the University is that which it generates itself. Therefore, case study data from trialling initiatives of all kinds to reduce potable water use should be
considered of a premium, and all efforts should be made to ensure that such data is collected robustly. Case study data should be made available to other
Departments and facilities managers on the University‟s website, and its availability should be publicised.
Data is already available on the „Ecocube‟ initiative (see section 6.3.4) which has resulted in significant reductions in water use in the University‟s urinals;
this should be a priority here.
21
http://www.admin.cam.ac.uk/news/dp/2005040402 'Green Gowns' for cutting waste 6 April 2005, accessed November 2010.

40
Regular attendance should be established of members of the Sustainability Team at forums for the University‟s facilities managers, the objectives including:
present results of the audits and the survey;
make facilities managers aware of the University‟s water management targets;
establish enthusiasm for water management;
gather data on experience of implementing water efficiency measures;
gather input into a standard rainwater harvesting system; and
establish whether there is any need for guidance or training in any aspects of water management for facilities managers.
7.2. Monitoring and Reporting
Sustainability governance
Whilst ultimate responsibility for ensuring the delivery of the objectives in the Implementation Plan set out in this water management strategy lies with the
Pro-Vice-Chancellor for Planning and Resources, the Plan will be delivered by the University‟s Sustainability Team. The Sustainability Team is based in
Estates Services and reports to the Director of Estates, and it currently consists of the following people:
Jenny Ekelund: Head of Environmental Sustainability (currently on maternity leave)
Philip Pike: Energy Manager and Acting Head of Environmental Sustainability
Jonathan Walford: Assistant Energy Conservation Engineer
Kate Aydin: Sustainable Development & Waste Management Officer
Ed Wigzell: Sustainable Travel Officer
The Sustainability Team report once a term to the Sustainability Steering Group (SSG); the SSG reports on the University‟s progress towards sustainability
objectives, and acts as an expert panel and high-level strategic group to advise on policy. SSG Reports to:
the Buildings and Estates Sub-Committee;
the Planning and Resource Allocation Committee of Council.
The Chair of the SSG is Professor Anthony Monaco, Pro-Vice-Chancellor for Planning and Resources. The Group is also attended by Professor Roger
Ainsworth, Master of St Catherine‟s College and chair of BESC; the Director of Estates; and Philip Pike, Acting Head of Environmental Sustainability.
The SSG is also advised by the Environment Panel, the purpose of which is to provide a practical forum for the exchange of information and discussion of
matters relevant to the implementation and development of the University's Environmental Sustainability Policy. The Panel's membership has
representation from each academic division, the Safety Office, the Conference of Colleges and the student body and liaises closely with the Sustainability
Team.

41
7.3. Financing
There is currently no budget for measures to reduce the amount of water that the University purchases. It is recommended that the University, via the
Planning Resource and Allocation Committee (PRAC) and its Capital Steering Group (CSG) should create a budgetary envelope for measures to reduce the
amount of potable water purchased, similar in nature to a major capital project, into which bids for specific projects could be made. It is recommended that
this budget allocation should be in the region of £25,000 (excluding VAT) for the initial investigation work and pilot projects.
The size of the budgetary envelope required could be greatly reduced through successful engagement with an organisation that supports and finances water
efficiency improvements. One such organisation, for example, is ADSM, who run the Aquafund scheme. Aquafund is a Government financed scheme
whereby ADSM would provide a grant for and installing water-saving measures at the University. ASDM would then keep 50% of the savings that the
University makes from the measures, until the grant is repaid. Taking advantage of a scheme such as Aquafund (of which there are others) would provide
benefits such as:
reduced effect on cash flows;
reduced financial risk;
reduced delivery burden for University staff; and
installation expertise and advice from ADSM staff.
It is recommended that a range of such organisations are engaged with in order to establish which scheme best suits the University‟s needs. This process
should be started as soon as possible.

42
7.4. Suggested timeline
Q2
Ref Activity
Ja
n/2
01
1
Fe
b/2
01
1
Ma
r/2
01
1
Ap
r/2
01
1
Ma
y/2
01
1
Ju
n/2
01
1
Ju
l/2
01
1
Au
g/2
01
1
Se
p/2
01
1
Oct/2
01
1
No
v/2
01
1
De
c/2
01
1
Ja
n/2
01
2
Fe
b/2
01
2
Ma
r/2
01
2
Ap
r/2
01
2
Ma
y/2
01
2
Ju
n/2
01
2
Ju
l/2
01
2
Au
g/2
01
2
Se
p/2
01
2
Oct/2
01
2
No
v/2
01
2
De
c/2
01
2
Ja
n/2
01
3
Fe
b/2
01
3
Ma
r/2
01
3
Ap
r/2
01
3
Ma
y/2
01
3
Ju
n/2
01
3
Ju
l/2
01
3
Au
g/2
01
3
Se
p/2
01
3
Oct/2
01
3
No
v/2
01
3
De
c/2
01
3
Ja
n/2
01
4
Fe
b/2
01
4
Ma
r/2
01
4
Ap
r/2
01
4
Ma
y/2
01
4
Ju
n/2
01
4
Ju
l/2
01
4
Au
g/2
01
4
Se
p/2
01
4
Oct/2
01
4
No
v/2
01
4
De
c/2
01
4
Ja
n/2
01
5
Fe
b/2
01
5
Ma
r/2
01
5
Ap
r/2
01
5
Ma
y/2
01
5
Ju
n/2
01
5
Ju
l/2
01
5
Au
g/2
01
5
Se
p/2
01
5
Oct/2
01
5
No
v/2
01
5
De
c/2
01
5
1 Prepare & present Strategy to SSG
2 Establish level of external funding available for water efficiency initiatives
3 Define and agree budgetary envelope
4 Flush volume restriction devices trial
4.1 Identify buildings for trial
4.2 Install devices and run trial
4.3 Compile data on water use before and after
4.4 Compile feedback on any problems
4.5 Evaluate success of devices
4.6 Prepare business case for wider roll out and submit bid for finance, if appropriate.
4.7 Roll out across University, if appropriate
5 Tap flow rate restrictors trial
5.1 Identify buildings for trial
5.2 Install tap flow rate restrictors and run trial
5.3 Compile data on water use before and after
5.4 Compile feedback on any problems
5.5 Evaluate success of initiative
5.6 Prepare business case for wider roll out and submit bid for finance, if appropriate
5.7 Roll out across University, if appropriate
6 Urinal control devices
6.1 Identify and prioritise buildings to have devices fitted
5.2 Prepare business case for installation of devices and submit bid for finance
5.3 Install devices
7 Half-hourly meters
7.1 Establish the functionality of the water meters on the University's top 10 water-using buildings
7.2 Prepare and submit bid for finance
7.3 Install meters
7.4 Comission meters and monitor data
7.5 Compile benchmarks for water use
7.8 Compare buildings that aren't on half hourly meters to the benchmarks
7.6 Investigate unusual water use and take actions to minimise wasteage
8 Rainwater harvesting
8.1 Establish responsibilities for maintenance and repair of rainwater harvesting infrastructure
8.2 Cost bringing University Parks system and the Manor Rd system back on line
8.3 Prepare and submit bid for finance
8.4 Commission work
8.5 Cost drawing up a specification for future procurement of rainwater harvesting systems
8.6 Prepare and submit bid for finance
8.7 Commission work
9 Rationalisation of purified water use
9.1 Audit of the University‟s purified water use
9.2 Draw up a specification for the procurement of water purification equipment
9.3 Actions to rationalise purified water use
10 Greywater recycling
10.1 Cost connecting the waste water from the RO unit in New Biochemistry to the rainwater harvesting tank
10.2 Prepare and submit bid for finance
10.3 Commission/undertake the work
10.4 Establish the feasibility/cost of recycling rinse water at the Iffley Road Sports Centre
10.5 If appropriate, prepare and submit bid for finance
2015/62010 / 11 2011 / 12 2012 / 13
Q1 Q2 Q3 Q4 Q1 Q2 Q3 Q4 Q1
2013/14
Q3 Q4
2014/15
Q3 Q4Q2 Q1 Q2 Q3 Q4 Q1 Q2

43