university of michigan gerald r. ford school of public policy measuring and understanding poverty...
Post on 19-Dec-2015
219 views
TRANSCRIPT
UNIVERSITY OF MICHIGANGERALD R. FORD SCHOOL OF PUBLIC POLICY
Measuring and Understanding Poverty
Sheldon DanzigerNational Poverty Center
Gerald R. Ford School of Public PolicyUniversity of Michigan
June 24, 2008
For Background, see S. Danziger, “Fighting Poverty Revisited” Focus, Newsletter of the Institute for Research on Poverty, Vol.25, No.1, Spring-Summer 2007 and R. Blank, “How to Improve Poverty Measurement in the United States,” Journal of Policy Analysis and Management, Vol. 27, No. 2, 2008.
www.npc.umich.edu
Overview
1. Brief survey of key issues in measuring poverty—is poverty as measured by the Census Bureau too high or too low?
2. Brief review of economic and public policy factors that have affected the trend in poverty since the War on poverty—why is official poverty rate the same today as in 1973?
3. Prospects for reducing poverty
What is Poverty in a Rich Country?“Poverty is an inherently vague concept, and developing a poverty
measure requires a number of relatively arbitrary assumptions.”
“Living in poverty” suggests that a family has so little income that they are unable to purchase the things that we as a society think they need for a minimally decent life. In the U.S., this typically means more than merely escaping starvation; it means being able to purchase the goods and services that are necessary to afford adequate and stable housing, to find and hold a job, to participate as a citizen in the community, to keep oneself and one’s family reasonably healthy, and to provide the things that one’s children need to participate effectively in school.”
R. Blank, 2007
Official Poverty Measure (Orshansky)Threshold: based on 1955 economy food plan;
adjusted only for inflation using consumer price index, not for increased real living standards
Income Concept: Annual Money Income (noncash transfers & taxes not counted because they were not common in mid-1960s)
Family Size & Composition: equivalence scale based on food needs for a 1969 mix of family sizes & types; does not recognize cohabitation
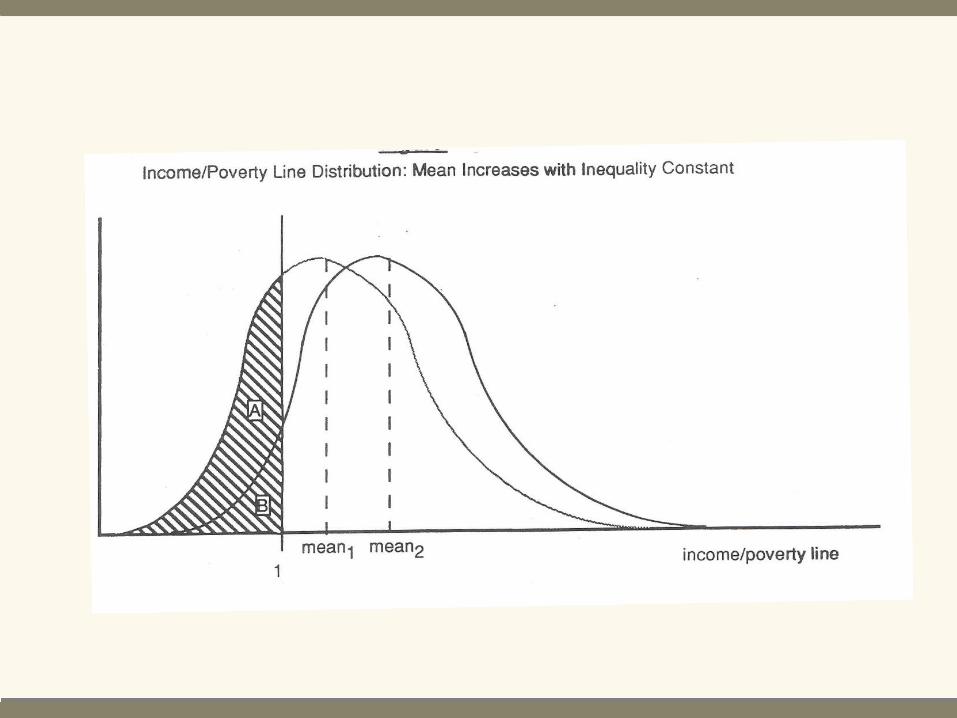
If income of each family doubles, the official rate will fall because some families will be raised above the fixed poverty line
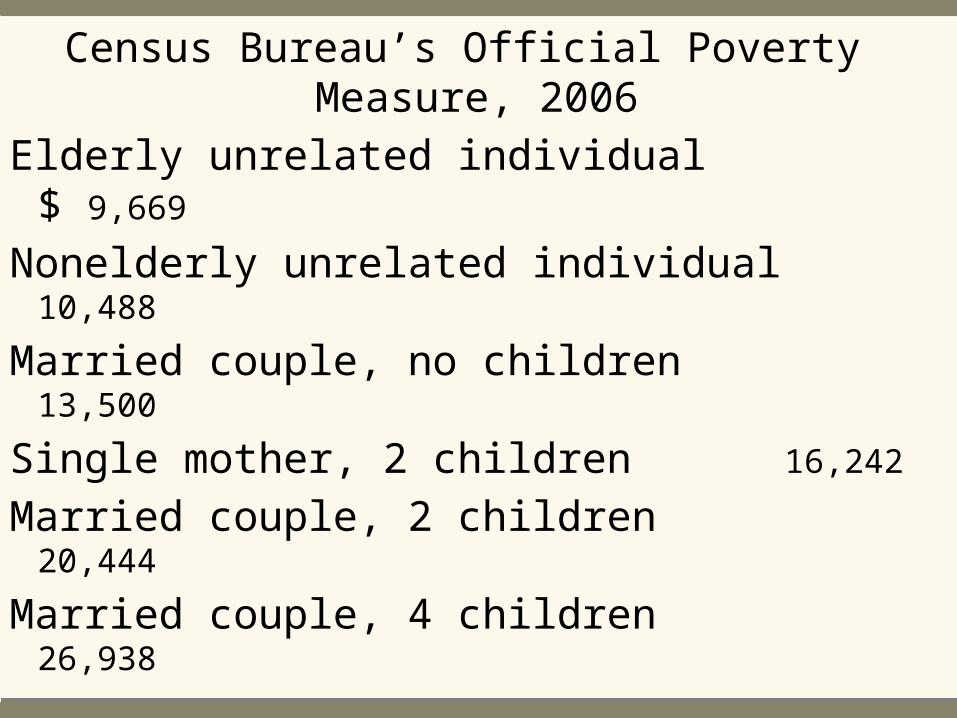
Census Bureau’s Official Poverty Measure, 2006
Elderly unrelated individual $ 9,669
Nonelderly unrelated individual 10,488
Married couple, no children 13,500
Single mother, 2 children 16,242
Married couple, 2 children 20,444
Married couple, 4 children 26,938
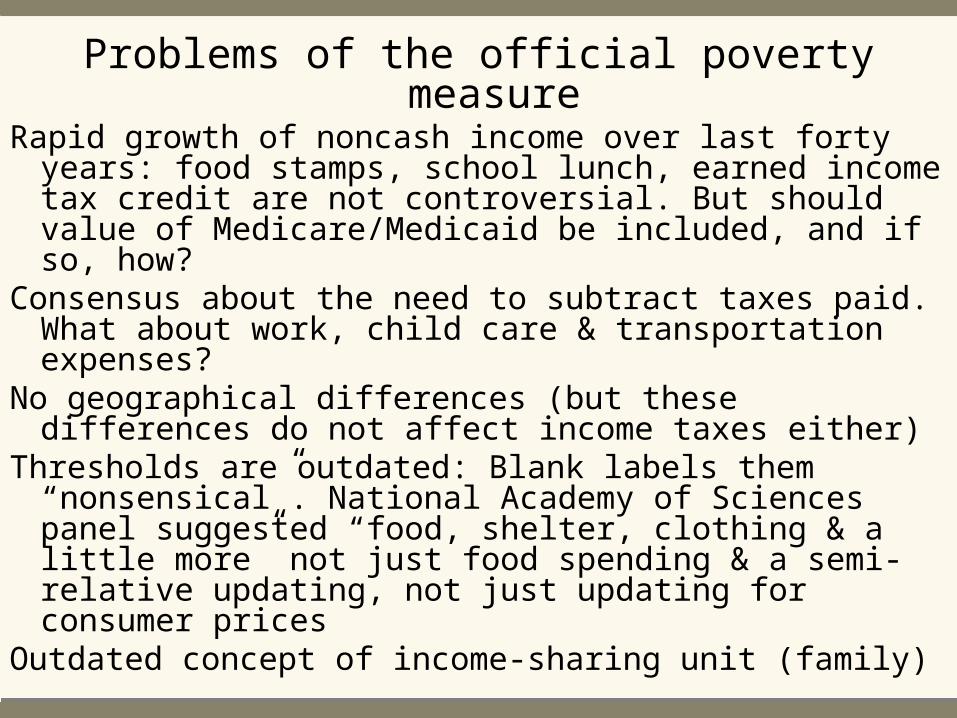
Problems of the official poverty measureRapid growth of noncash income over last forty years:
food stamps, school lunch, earned income tax credit are not controversial. But should value of Medicare/Medicaid be included, and if so, how?
Consensus about the need to subtract taxes paid. What about work, child care & transportation expenses?
No geographical differences (but these differences do not affect income taxes either)
Thresholds are outdated: Blank labels them “nonsensical”. National Academy of Sciences panel suggested “food, shelter, clothing & a little more” not just food spending & a semi-relative updating, not just updating for consumer prices
Outdated concept of income-sharing unit (family)
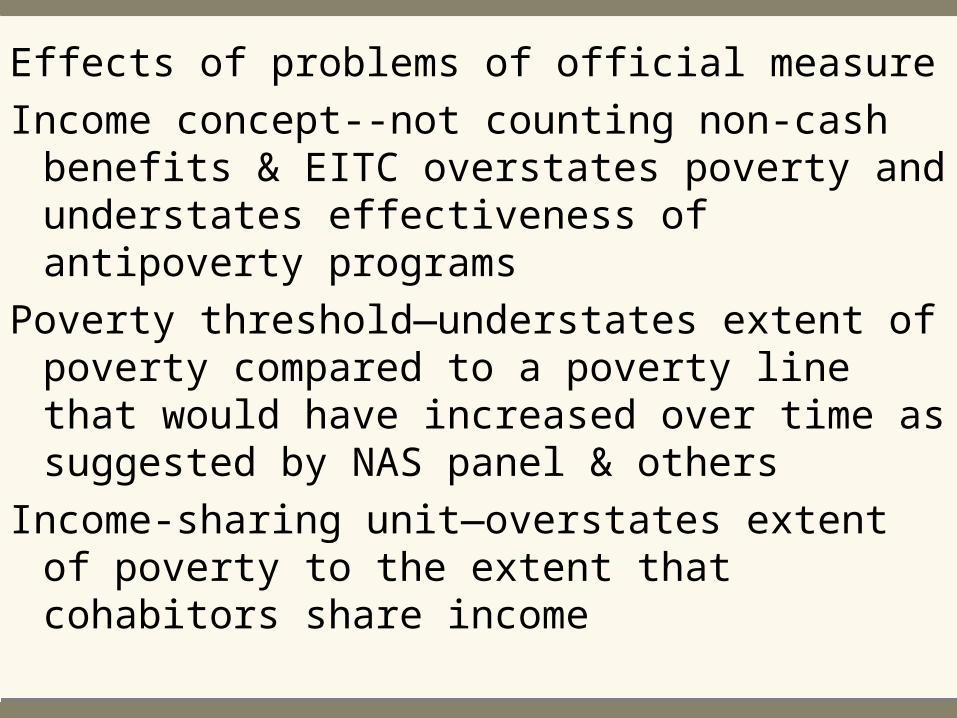
Effects of problems of official measure
Income concept--not counting non-cash benefits & EITC overstates poverty and understates effectiveness of antipoverty programs
Poverty threshold—understates extent of poverty compared to a poverty line that would have increased over time as suggested by NAS panel & others
Income-sharing unit—overstates extent of poverty to the extent that cohabitors share income
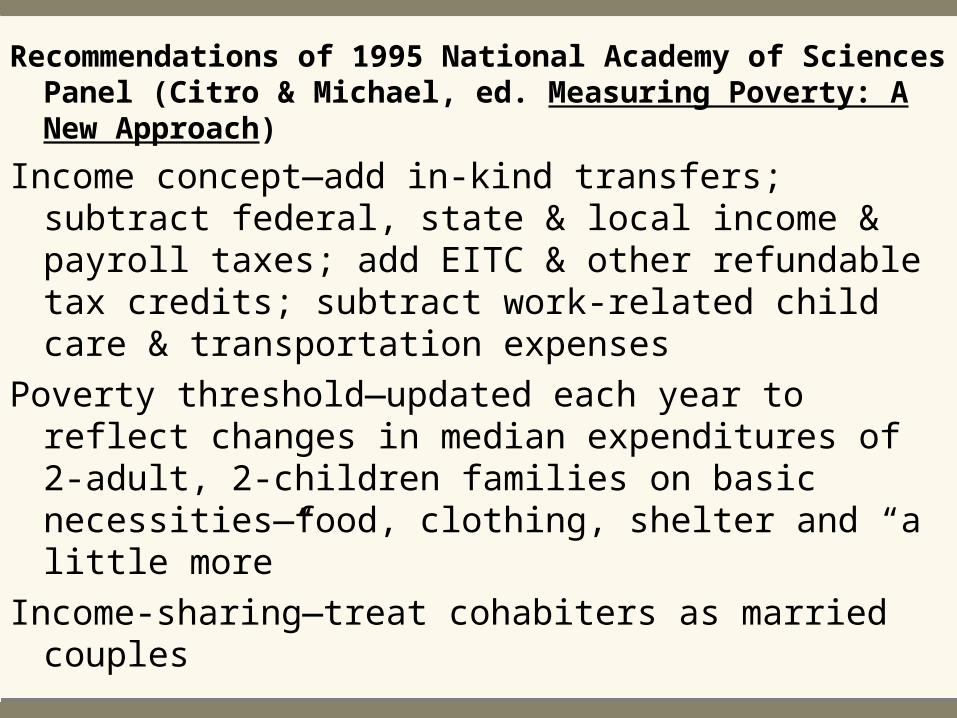
Recommendations of 1995 National Academy of Sciences Panel (Citro & Michael, ed. Measuring Poverty: A New Approach)
Income concept—add in-kind transfers; subtract federal, state & local income & payroll taxes; add EITC & other refundable tax credits; subtract work-related child care & transportation expenses
Poverty threshold—updated each year to reflect changes in median expenditures of 2-adult, 2-children families on basic necessities—food, clothing, shelter and “a little more”
Income-sharing—treat cohabiters as married couples
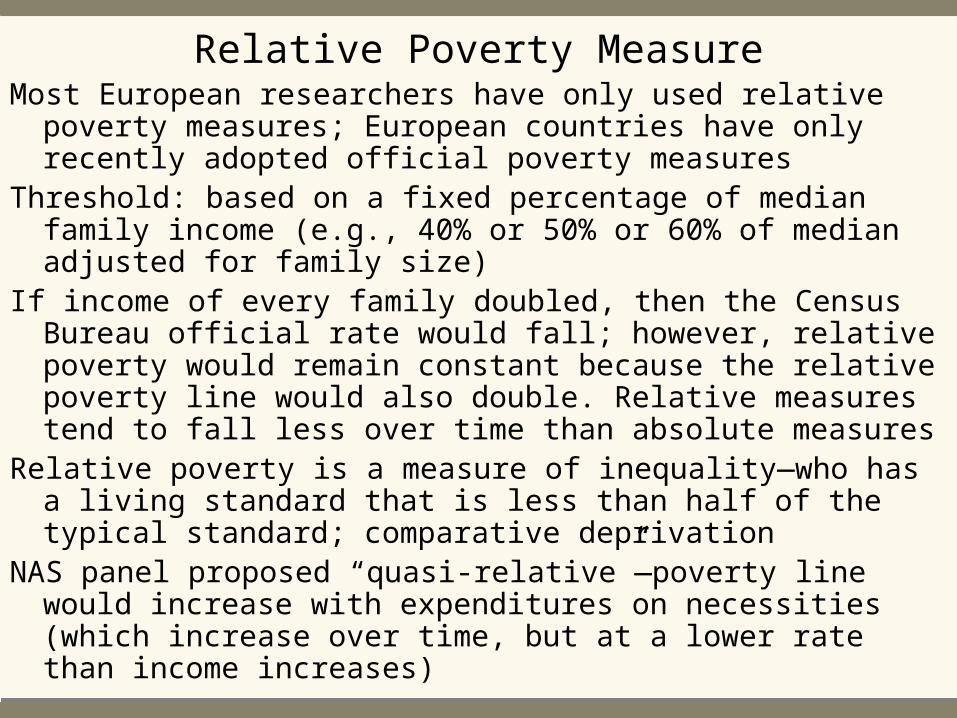
Relative Poverty Measure Most European researchers have only used relative poverty
measures; European countries have only recently adopted official poverty measures
Threshold: based on a fixed percentage of median family income (e.g., 40% or 50% or 60% of median adjusted for family size)
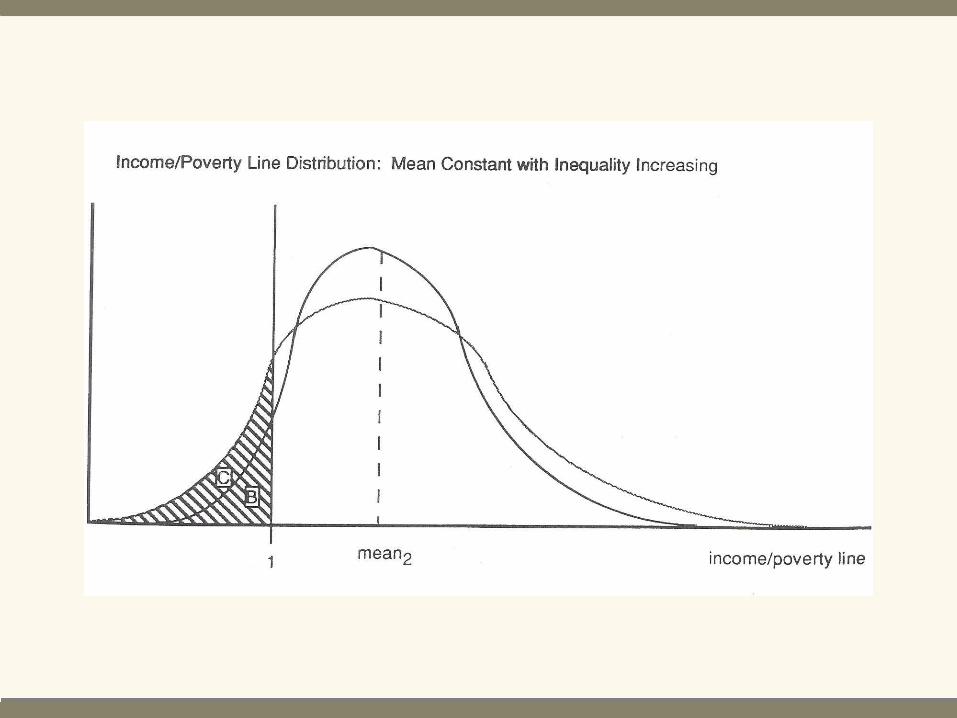
If income of every family doubled, then the Census Bureau official rate would fall; however, relative poverty would remain constant because the relative poverty line would also double. Relative measures tend to fall less over time than absolute measures
Relative poverty is a measure of inequality—who has a living standard that is less than half of the typical standard; comparative deprivation
NAS panel proposed “quasi-relative”—poverty line would increase with expenditures on necessities (which increase over time, but at a lower rate than income increases)
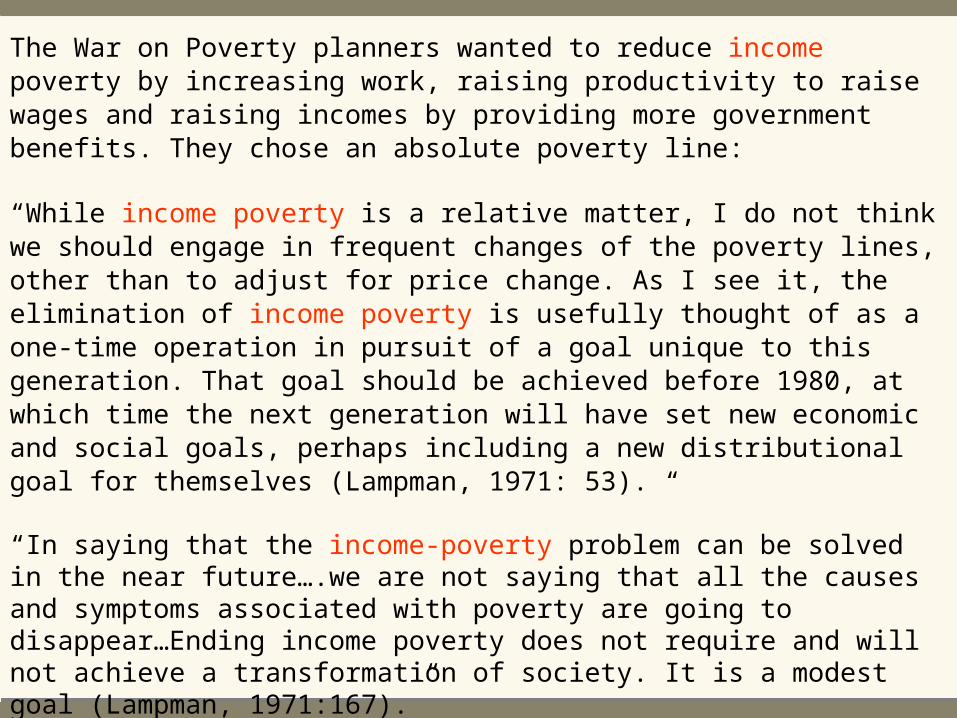
The War on Poverty planners wanted to reduce income poverty by increasing work, raising productivity to raise wages and raising incomes by providing more government benefits. They chose an absolute poverty line:
“While income poverty is a relative matter, I do not think we should engage in frequent changes of the poverty lines, other than to adjust for price change. As I see it, the elimination of income poverty is usefully thought of as a one-time operation in pursuit of a goal unique to this generation. That goal should be achieved before 1980, at which time the next generation will have set new economic and social goals, perhaps including a new distributional goal for themselves (Lampman, 1971: 53). “
“In saying that the income-poverty problem can be solved in the near future….we are not saying that all the causes and symptoms associated with poverty are going to disappear…Ending income poverty does not require and will not achieve a transformation of society. It is a modest goal (Lampman, 1971:167).”
Lampman does not say that the line should never be changed, only that it should be infrequently changed, perhaps, once a generation. Most analysts would consider it reasonable to change the line after 40 years!
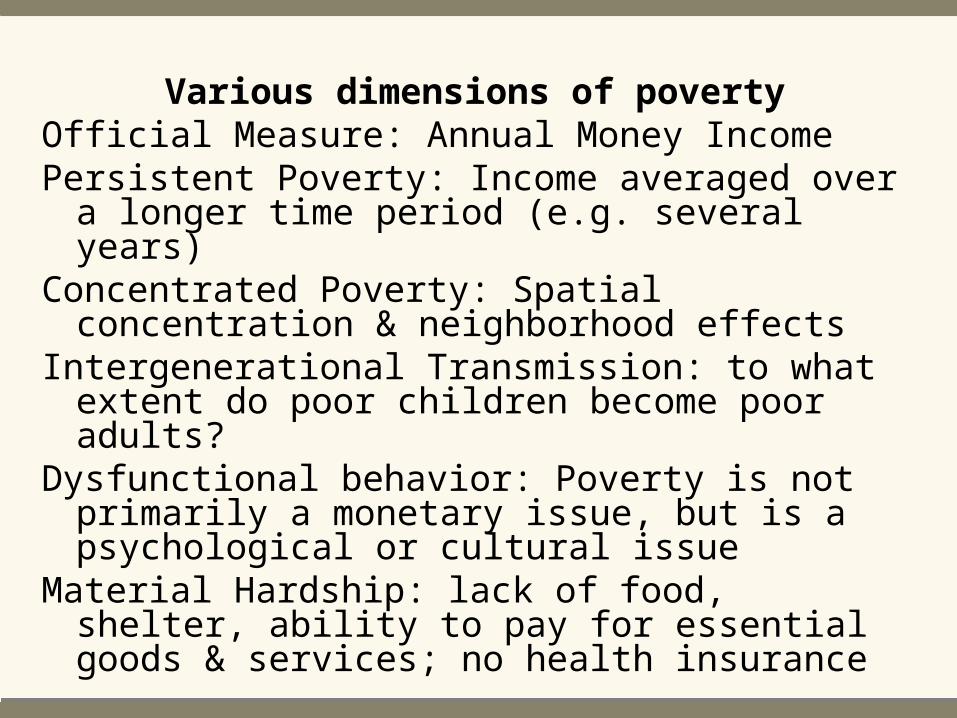
Various dimensions of poverty Official Measure: Annual Money IncomePersistent Poverty: Income averaged over a longer
time period (e.g. several years)Concentrated Poverty: Spatial concentration &
neighborhood effectsIntergenerational Transmission: to what extent do
poor children become poor adults?Dysfunctional behavior: Poverty is not primarily a
monetary issue, but is a psychological or cultural issue
Material Hardship: lack of food, shelter, ability to pay for essential goods & services; no health insurance
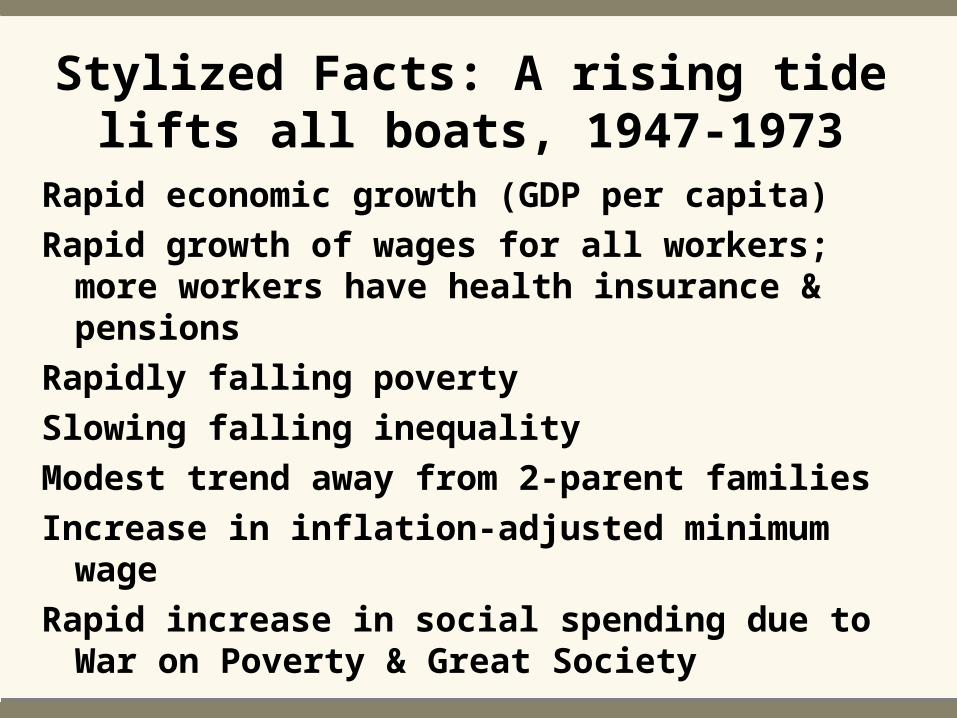
Stylized Facts: A rising tide lifts all boats, 1947-1973
Rapid economic growth (GDP per capita)
Rapid growth of wages for all workers; more workers have health insurance & pensions
Rapidly falling poverty
Slowing falling inequality
Modest trend away from 2-parent families
Increase in inflation-adjusted minimum wage
Rapid increase in social spending due to War on Poverty & Great Society
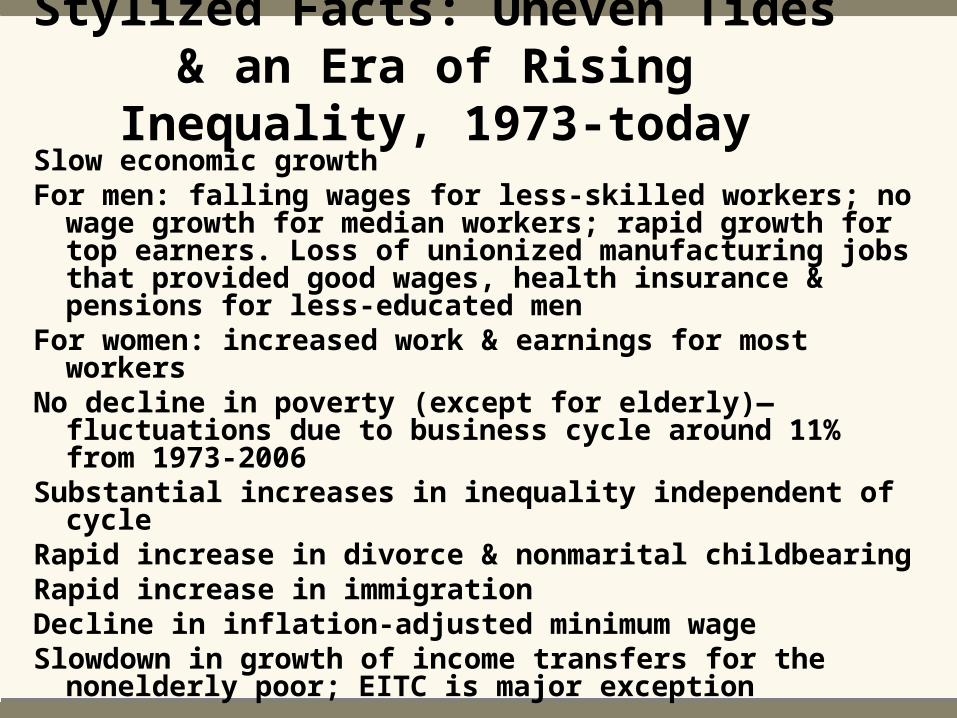
Stylized Facts: Uneven Tides & an Era of Rising Inequality, 1973-todaySlow economic growthFor men: falling wages for less-skilled workers; no wage
growth for median workers; rapid growth for top earners. Loss of unionized manufacturing jobs that provided good wages, health insurance & pensions for less-educated men
For women: increased work & earnings for most workersNo decline in poverty (except for elderly)—fluctuations
due to business cycle around 11% from 1973-2006 Substantial increases in inequality independent of cycleRapid increase in divorce & nonmarital childbearingRapid increase in immigrationDecline in inflation-adjusted minimum wageSlowdown in growth of income transfers for the
nonelderly poor; EITC is major exception
0
5
10
15
20
25
30
35
1959 1964 1969 1974 1979 1984 1989 1994 1999 2004Year
25% Above Official Line
Official Line (Cash Income)
Alternative (Cash + non cash - tax + tax credit)
31.1
15.8
20.3 20.0
17.1
22.4
11.1
15.2 15.1
12.7
9.112.0
8.6
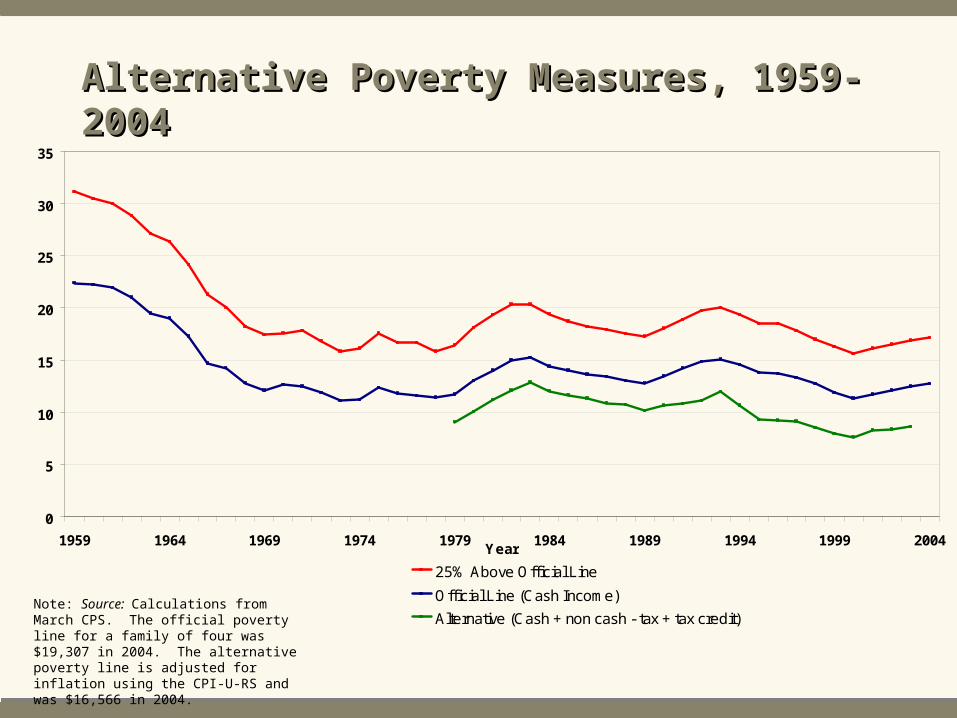
Alternative Poverty Measures, 1959-2004Alternative Poverty Measures, 1959-2004
Note: Source: Calculations from March CPS. The official poverty line for a family of four was $19,307 in 2004. The alternative poverty line is adjusted for inflation using the CPI-U-RS and was $16,566 in 2004.
Poverty did not decline after 1973 even though the economy grew slowly, Why? A critique that has been dominant since the early 1980s is that government programs themselves were responsible for persisting poverty by discouraging work and encouraging family breakup.
In 1964, the famous War on Poverty was declared. And a funny thing happened. Poverty, as measured by dependency, stopped shrinking and actually began to grow worse. I guess you could say “Poverty won the War.” Poverty won, in part, because instead of helping the poor, government programs ruptured the bonds holding poor families together (President Reagan, Radio address, February 15, 1986.)
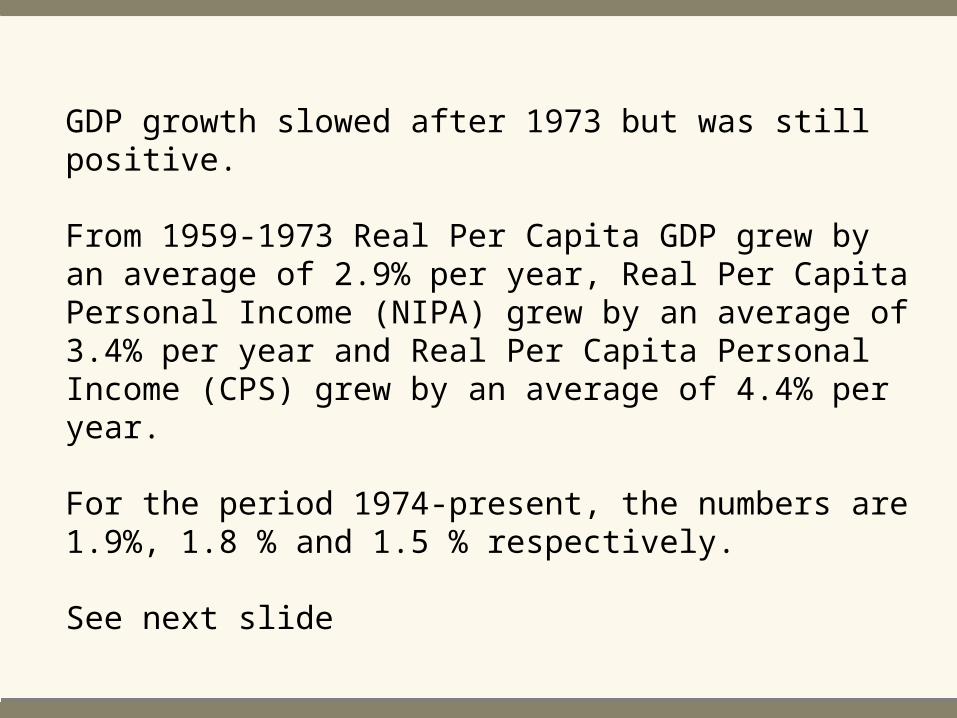
GDP growth slowed after 1973 but was still positive.
From 1959-1973 Real Per Capita GDP grew by an average of 2.9% per year, Real Per Capita Personal Income (NIPA) grew by an average of 3.4% per year and Real Per Capita Personal Income (CPS) grew by an average of 4.4% per year.
For the period 1974-present, the numbers are 1.9%, 1.8 % and 1.5 % respectively.
See next slide
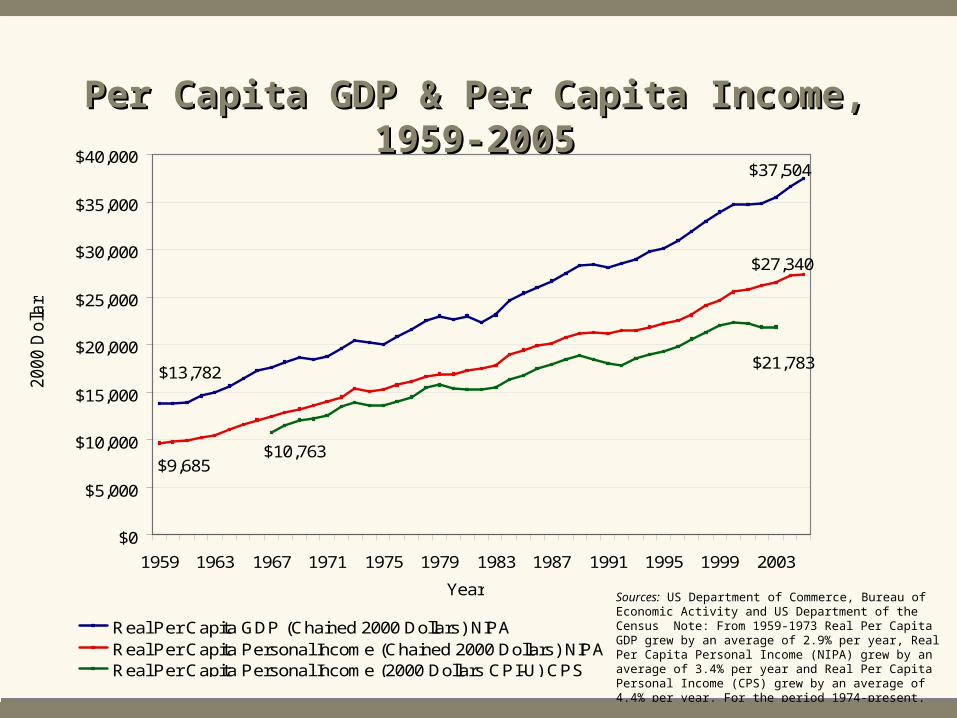
Per Capita GDP & Per Capita Income, 1959-2005Per Capita GDP & Per Capita Income, 1959-2005
Sources: US Department of Commerce, Bureau of Economic Activity and US Department of the Census Note: From 1959-1973 Real Per Capita GDP grew by an average of 2.9% per year, Real Per Capita Personal Income (NIPA) grew by an average of 3.4% per year and Real Per Capita Personal Income (CPS) grew by an average of 4.4% per year. For the period 1974-present, the numbers are 1.9%, 1.8 % and 1.5 % respectively.
$37,504
$13,782
$9,685
$27,340
$10,763
$21,783
$0
$5,000
$10,000
$15,000
$20,000
$25,000
$30,000
$35,000
$40,000
1959 1963 1967 1971 1975 1979 1983 1987 1991 1995 1999 2003
Year
2000 D
olla
rs
Real Per Capita GDP (Chained 2000 Dollars) NIPAReal Per Capita Personal Income (Chained 2000 Dollars) NIPAReal Per Capita Personal Income (2000 Dollars CPI-U) CPS
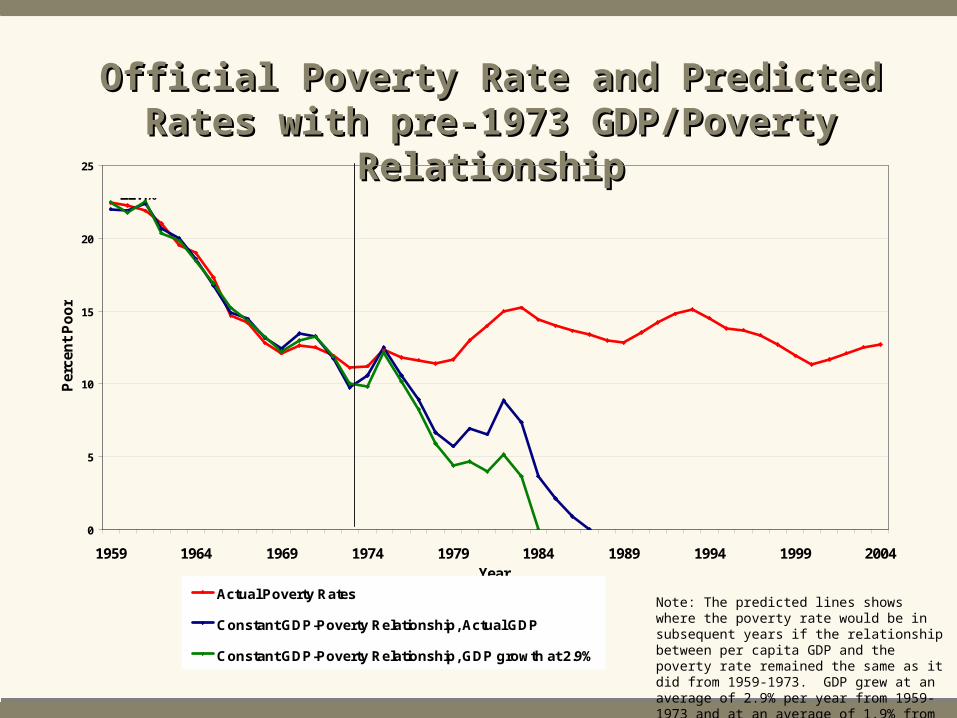
Note: The predicted lines shows where the poverty rate would be in subsequent years if the relationship between per capita GDP and the poverty rate remained the same as it did from 1959-1973. GDP grew at an average of 2.9% per year from 1959-1973 and at an average of 1.9% from 1973-2004
Official Poverty Rate and Predicted Rates with Official Poverty Rate and Predicted Rates with pre-1973 GDP/Poverty Relationshippre-1973 GDP/Poverty Relationship
0
5
10
15
20
25
1959 1964 1969 1974 1979 1984 1989 1994 1999 2004Year
Per
cen
t P
oo
r
Actual Poverty Rates
Constant GDP-Poverty Relationship, Actual GDP
Constant GDP-Poverty Relationship, GDP growth at 2.9%
22.4%
12.7%
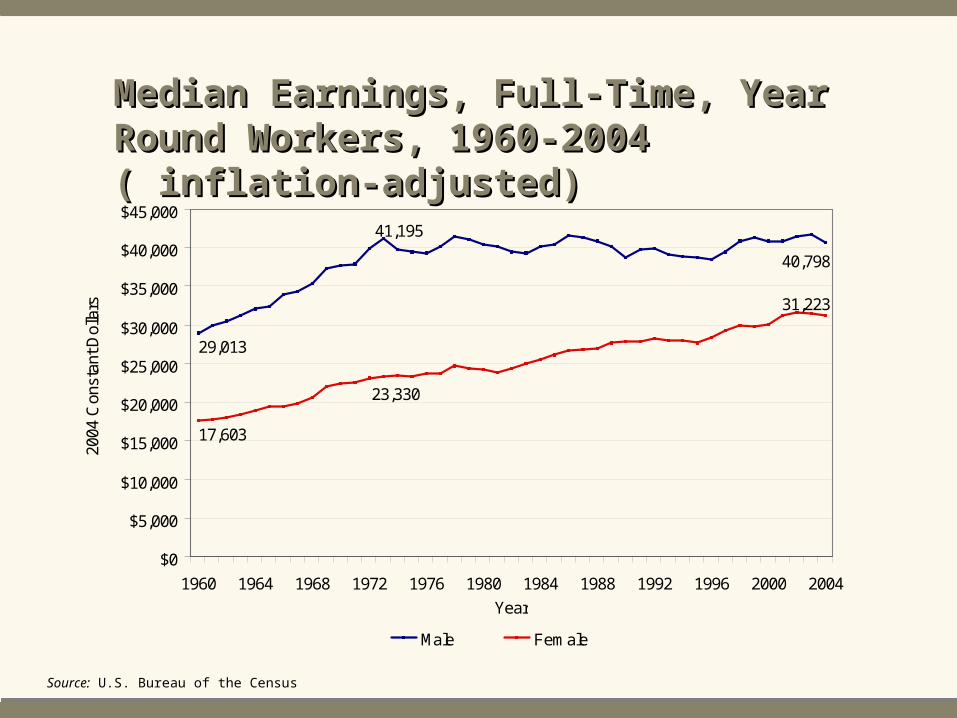
Median Earnings, Full-Time, Year Round Median Earnings, Full-Time, Year Round Workers, 1960-2004 ( inflation-adjusted)Workers, 1960-2004 ( inflation-adjusted)
Source: U.S. Bureau of the Census
29,013
40,798
41,195
31,223
17,603
23,330
$0
$5,000
$10,000
$15,000
$20,000
$25,000
$30,000
$35,000
$40,000
$45,000
1960 1964 1968 1972 1976 1980 1984 1988 1992 1996 2000 2004
Year
2004
Con
stan
t Dol
lars
Male Female
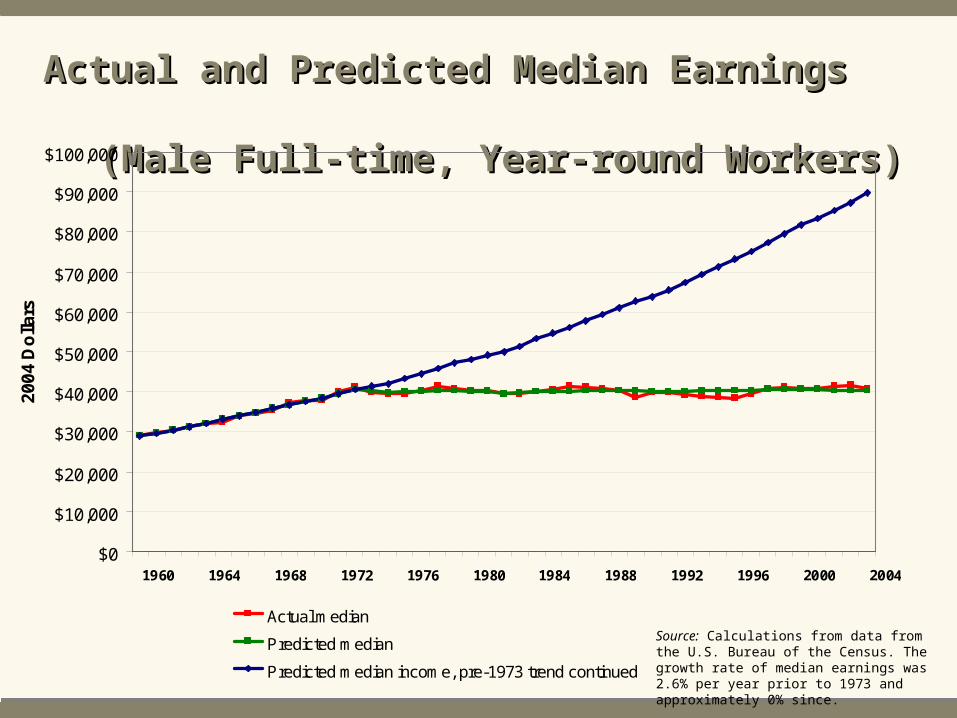
Actual and Predicted Median Earnings Actual and Predicted Median Earnings (Male Full-time, Year-round (Male Full-time, Year-round
Workers)Workers)
Source: Calculations from data from the U.S. Bureau of the Census. The growth rate of median earnings was 2.6% per year prior to 1973 and approximately 0% since.
$0
$10,000
$20,000
$30,000
$40,000
$50,000
$60,000
$70,000
$80,000
$90,000
$100,000
1960 1964 1968 1972 1976 1980 1984 1988 1992 1996 2000 2004
20
04
Do
llars
Actual median
Predicted median
Predicted median income, pre-1973 trend continued
$89,916
$41,195 $40,798
$40,326$40,527
$28,904
$29,013
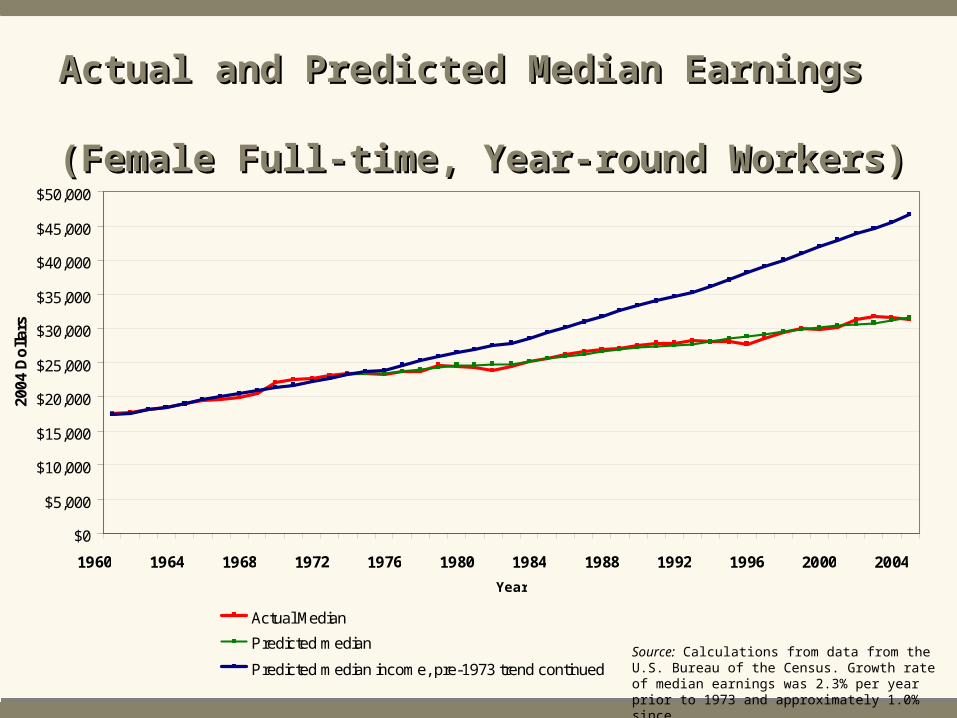
Actual and Predicted Median Earnings Actual and Predicted Median Earnings (Female Full-time, Year-round (Female Full-time, Year-round
Workers)Workers)
Source: Calculations from data from the U.S. Bureau of the Census. Growth rate of median earnings was 2.3% per year prior to 1973 and approximately 1.0% since.
$0
$5,000
$10,000
$15,000
$20,000
$25,000
$30,000
$35,000
$40,000
$45,000
$50,000
1960 1964 1968 1972 1976 1980 1984 1988 1992 1996 2000 2004
Year
2004
Do
llars
Actual Median
Predicted median
Predicted median income, pre-1973 trend continued
$17,318
$23,330
$23,286
$48,688
$31,477
$31,223
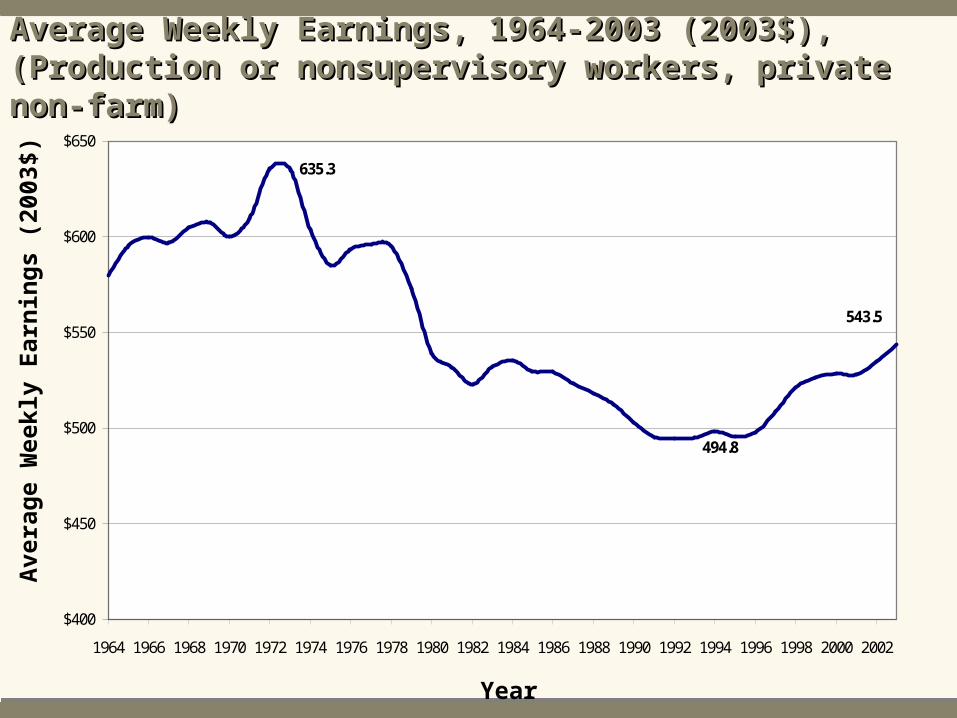
Average Weekly Earnings, 1964-2003 (2003$), Average Weekly Earnings, 1964-2003 (2003$), (Production or nonsupervisory workers, private non-farm)(Production or nonsupervisory workers, private non-farm)
Ave
rag
e W
eekly
Earn
ing
s (2
003$)
Year
543.5
494.8
635.3
$400
$450
$500
$550
$600
$650
1964 1966 1968 1970 1972 1974 1976 1978 1980 1982 1984 1986 1988 1990 1992 1994 1996 1998 2000 2002
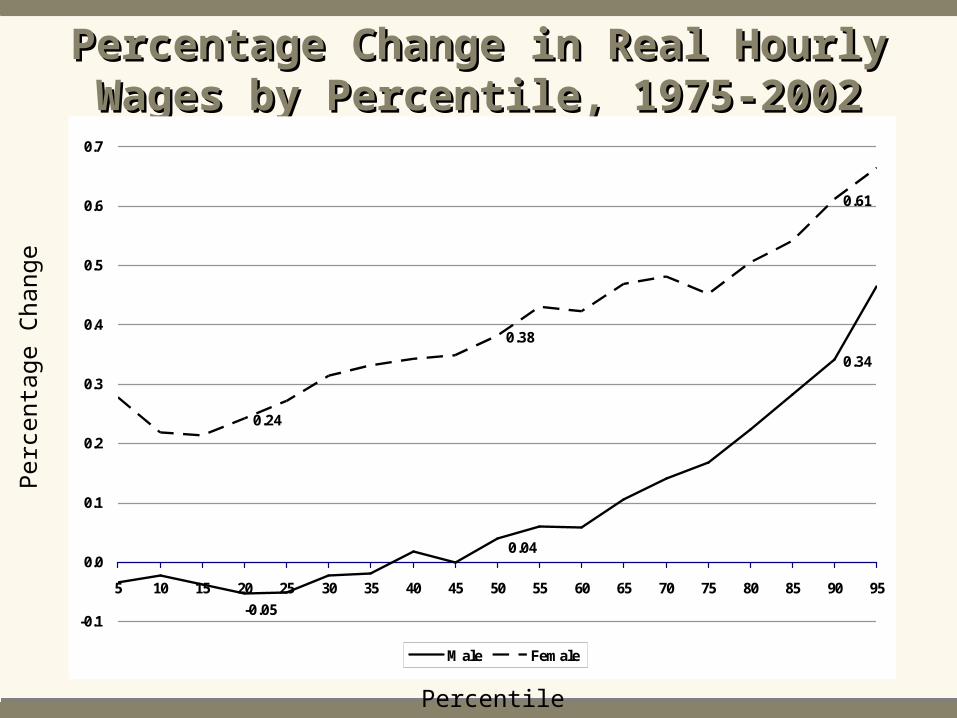
Percentage Change in Real Hourly Percentage Change in Real Hourly Wages by Percentile, 1975-2002Wages by Percentile, 1975-2002
Perc
en
tag
e C
han
ge
Percentile
0.34
0.04
-0.05
0.61
0.38
0.24
-0.1
0.0
0.1
0.2
0.3
0.4
0.5
0.6
0.7
5 10 15 20 25 30 35 40 45 50 55 60 65 70 75 80 85 90 95
Male Female
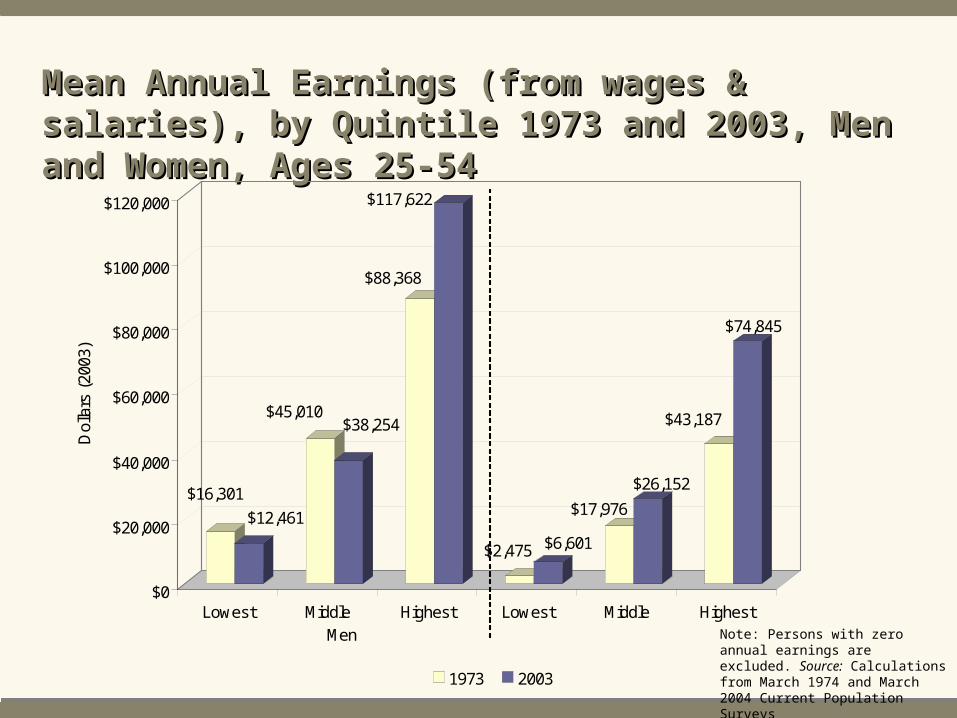
Mean Annual Earnings (from wages & salaries), by Mean Annual Earnings (from wages & salaries), by Quintile 1973 and 2003, Men and Women, Ages 25-54Quintile 1973 and 2003, Men and Women, Ages 25-54
Note: Persons with zero annual earnings are excluded. Source: Calculations from March 1974 and March 2004 Current Population Surveys
$16,301
$12,461
$45,010$38,254
$88,368
$117,622
$2,475 $6,601
$17,976
$26,152
$43,187
$74,845
$0
$20,000
$40,000
$60,000
$80,000
$100,000
$120,000
Dol
lars
(20
03)
Lowest Middle Highest Lowest Middle Highest
1973 2003
Men Women
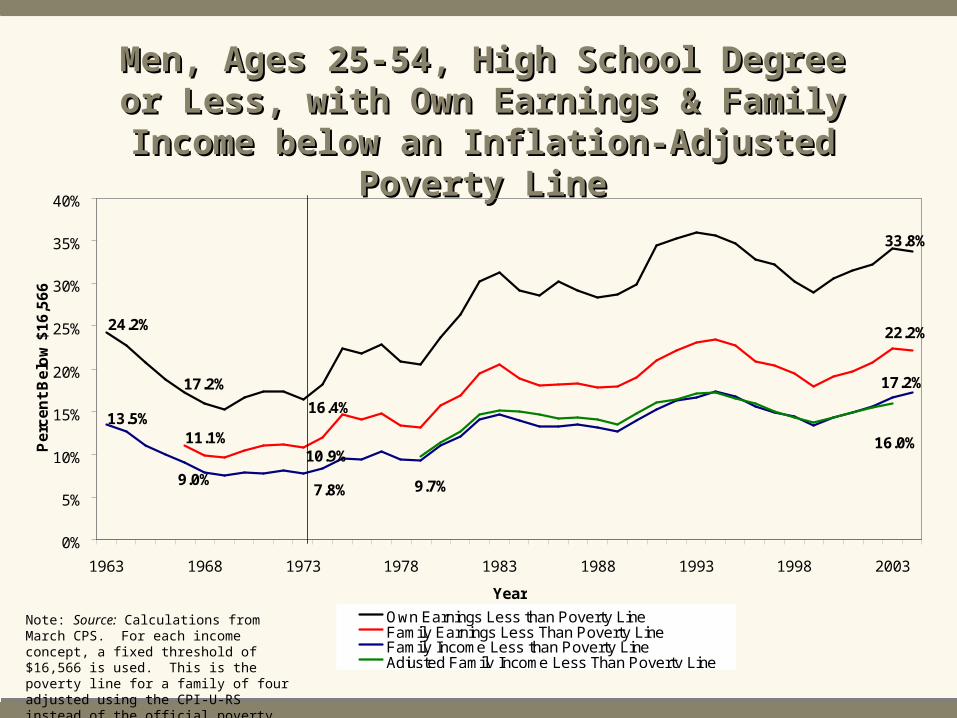
Men, Ages 25-54, High School Degree or Less, Men, Ages 25-54, High School Degree or Less, with Own Earnings & Family Income below an with Own Earnings & Family Income below an
Inflation-Adjusted Poverty LineInflation-Adjusted Poverty Line
Note: Source: Calculations from March CPS. For each income concept, a fixed threshold of $16,566 is used. This is the poverty line for a family of four adjusted using the CPI-U-RS instead of the official poverty line.
24.2%
33.8%
16.4%
17.2%
10.9%
22.2%
11.1%13.5%
17.2%
7.8%9.0% 9.7%
16.0%
0%
5%
10%
15%
20%
25%
30%
35%
40%
1963 1968 1973 1978 1983 1988 1993 1998 2003
Year
Pe
rce
nt
Be
low
$1
6,5
66
Own Earnings Less than Poverty LineFamily Earnings Less Than Poverty LineFamily Income Less than Poverty LineAdjusted Family Income Less Than Poverty Line
The Political Will that Motivated the War on Poverty has been Absent for 30 years in the U.S.
According to President Johnson (1964):
“Americans today enjoy the highest standard of living in the history of mankind. But for nearly a fifth of our fellow citizens, this is a hollow achievement. They often live without hope, below minimum standards of decency.
We cannot and need not wait for the gradual growth of the economy to lift this forgotten fifth of our nation above the Poverty line. We know what must be done, and this Nation of abundance can surely afford to do it.
Today, as in the past, higher employment and speedier economic growth are
the cornerstones of a concerted attack on poverty...But general prosperity
and growth leave untouched many of the roots of human poverty.”
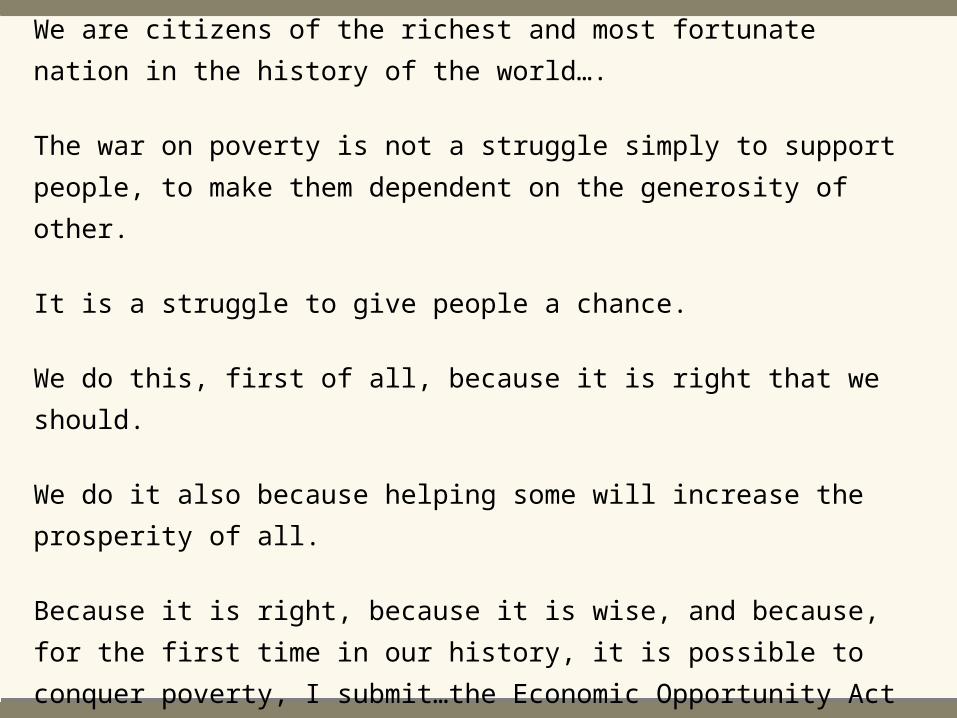
We are citizens of the richest and most fortunate nation in the history of the
world….
The war on poverty is not a struggle simply to support people, to make
them dependent on the generosity of other.
It is a struggle to give people a chance.
We do this, first of all, because it is right that we should.
We do it also because helping some will increase the prosperity of all.
Because it is right, because it is wise, and because, for the first time in our
history, it is possible to conquer poverty, I submit…the Economic
Opportunity Act of 1964 (Johnson, March 16, 1964).
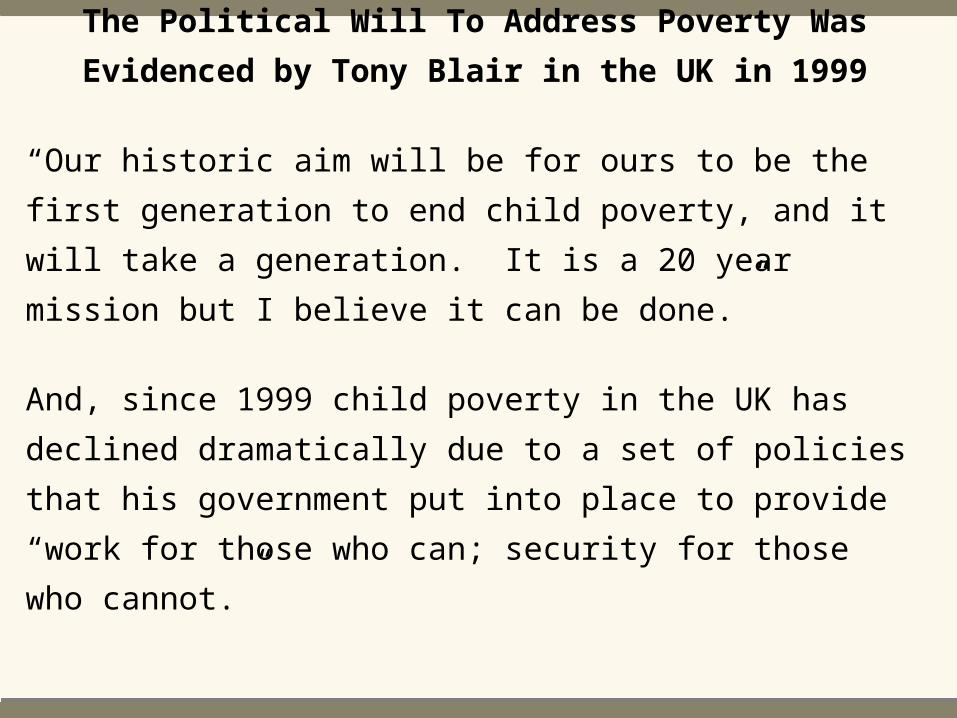
The Political Will To Address Poverty Was Evidenced by
Tony Blair in the UK in 1999
“Our historic aim will be for ours to be the first generation to
end child poverty, and it will take a generation. It is a 20 year
mission but I believe it can be done.”
And, since 1999 child poverty in the UK has declined
dramatically due to a set of policies that his government put
into place to provide “work for those who can; security for those
who cannot.”
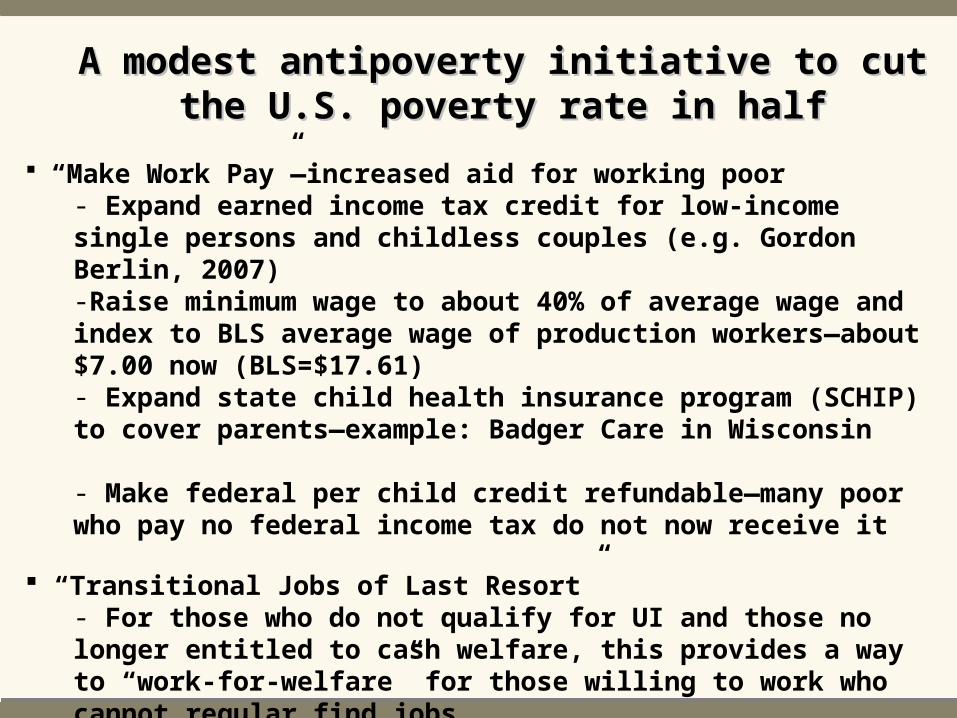
“Make Work Pay”—increased aid for working poor- Expand earned income tax credit for low-income single persons and childless couples (e.g. Gordon Berlin, 2007)-Raise minimum wage to about 40% of average wage and index to BLS average wage of production workers—about $7.00 now (BLS=$17.61)- Expand state child health insurance program (SCHIP) to cover parents—example: Badger Care in Wisconsin- Make federal per child credit refundable—many poor who pay no federal income tax do not now receive it
“Transitional Jobs of Last Resort” - For those who do not qualify for UI and those no longer entitled to cash welfare, this provides a way to “work-for-welfare” for those willing to work who cannot regular find jobs
A modest antipoverty initiative to cut the U.S. A modest antipoverty initiative to cut the U.S. poverty rate in halfpoverty rate in half