university of groningen work functioning abma, femke · colofon this study was conducted within the...
TRANSCRIPT
University of Groningen
Work functioningAbma, Femke
IMPORTANT NOTE: You are advised to consult the publisher's version (publisher's PDF) if you wish to cite fromit. Please check the document version below.
Document VersionPublisher's PDF, also known as Version of record
Publication date:2012
Link to publication in University of Groningen/UMCG research database
Citation for published version (APA):Abma, F. I. (2012). Work functioning: development and evaluation of a measurement tool Groningen: s.n.
CopyrightOther than for strictly personal use, it is not permitted to download or to forward/distribute the text or part of it without the consent of theauthor(s) and/or copyright holder(s), unless the work is under an open content license (like Creative Commons).
Take-down policyIf you believe that this document breaches copyright please contact us providing details, and we will remove access to the work immediatelyand investigate your claim.
Downloaded from the University of Groningen/UMCG research database (Pure): http://www.rug.nl/research/portal. For technical reasons thenumber of authors shown on this cover page is limited to 10 maximum.
Download date: 08-06-2018
Work Functioning: Development and Evaluation of a Measurement Tool
Femke Abma

Colofon
This study was conducted within the Research Institute SHARE of the Graduate School of Medical Sciences, University Medical Center Groningen, University of Groningen and under the auspices of the research program Public Health Research (PHR).The study was financially supported by Stichting Instituut Gak and University Medical Center Groningen, University of Groningen.The printing of this thesis was financially supported by the Graduate School of Medical Sciences, Research Institute SHARE, University Medical Center Groningen (UMCG), and the University of Groningen.
Lay-out & print: Simone Vinke, Ridderprint BV, Ridderkerk, the NetherlandsCover : Rutger Maris, Femke Abma and Nikki Vermeulen
Abma, FI. Work functioning: Development and evaluation of a measurement tool.ISBN: 978-90-367-5773-7ISBN: 978-90-367-5774-4 (Ebook)© Femke Abma, 2012

RIJKSUNIVERSITEIT GRONINGEN
Work Functioning: Development and Evaluation of a Measurement Tool
Proefschrift
ter verkrijging van het doctoraat in deMedische Wetenschappen
aan de Rijksuniversiteit Groningenop gezag van de
Rector Magnificus, dr. E. Sterken,in het openbaar te verdedigen op
woensdag 31 oktober 2012om 14.30 uur
door
Femke Ietsje Abmageboren op 2 oktober 1983
te Schiermonnikoog

Promotores: Prof. dr. J.J.L. van der Klink Prof. dr. U. Bültmann
Beoordelingscommissie: Prof. dr. F.J.H. van Dijk Prof. dr. H.C.W. de Vet Prof. dr. N.W. van Yperen

Paranimfen: Iris Arends Melanie Bus

Contents
Chapter 1 Introduction 9
Chapter 2 Workers With Health Problems: Three Perspectives on Functioning At Work 19
Chapter 3 Evaluation of the measurement properties of self-reported 35 health-related work functioning instruments among workers with common mental disorders
Chapter 4 The cross-cultural adaptation of the Work Role Functioning 65 Questionnaire to Dutch
Chapter 5 The Work Role Functioning Questionnaire 2.0 (Dutch version): 79 Examination of its Reliability, Validity and Responsiveness in the general working population
Chapter 6 Prognostic factors for successful work functioning 105
Chapter 7 General Discussion 119
Summary 131 Samenvatting 137 Appendix: WRFQ 2.0 145 SHARE and previous dissertations 149 Dankwoord 153 Curriculum Vitae 157


Chapter 1
Introduction

Introduction
11
1Introduction
In recent years, a change in the attention of occupational health care in the Netherlands from return to work towards stay at work has occurred. The shift towards stay at work requires new interventions and measures to assess effectiveness. This has led to the establishment of a large research program “Preventive Occupational Health Care” from Stichting Instituut Gak [1]. This research program aims to increase knowledge of preventive occupational health care and to provide evidence-based knowledge for screening, diagnosis and interventions. The results presented in this thesis are based on one study in this program: “Tools for Two. Optimizing work functioning: New diagnostic instruments for concerted action by Occupational Health Care and Human Resources Management”. The thesis develops the evidence base for a generic instrument that evaluates health-related work functioning to facilitate actions towards sustainable functioning at work, work participation and work reintegration. The instrument should be used in collaborated actions between the worker, occupational health professionals, and human resources professionals (HRM)/supervisors to support preventive and maintenance actions to help workers to stay at work.
Background
In Europe, the percentage of the working age population with a longstanding health problem or disability (including mental health problems) varies between 5.8% (Romania) and 32.2% (Finland). In the Netherlands 25.4% have long-standing health problems or disability [2]. Due to demographic, political and social changes, i.e., the ageing workforce, a shift from a work compensation model to a work participation model, the increase of retirement age and advances in medical treatment, more workers are likely participate in the labour force with a health problem that may interfere with their ability to accomplish their work [3]. To date, little is known about how these workers are functioning at work. In addition, given the expected labor force shortages, the challenge is to help workers stay at work in a healthy, productive and sustainable way. In the Netherlands, sickness absence – and the reduction of sickness absence – has received much attention in the past decades in both occupational health research and practice. Sickness absence is a costly problem for both the individual and society. Several measures and regulations were introduced in the Dutch social security system to reduce the costs of sickness absence and to promote early return to work after a period of sickness absence. The Gatekeeper Improvement Act (WVP) was introduced in 2002 to improve the return to work efforts and to prevent long term sickness absence and filing a long term disability claim [4]. During the first two years of sickness absence, wages are paid by the employer and both the employer and employee are responsible for undertaking activities aimed at return to work (RTW). If, after this two year period, no return to work is achieved, the employee can apply for long term disability benefits. In 2005, the Work Capacity
Chapter 1
12
Act (WIA) [5] was introduced to replace the Work Disability Act (WAO) [6]. This new act focusses on what a worker is able to do instead of what he should be compensated for and participation in work is promoted. With these changes, the Dutch social security system shifted from a focus on return to work to stay at work. In the Netherlands, instruments are needed that can identify workers at risk for sickness absence and help workers stay at work in a healthy and sustainable way. To date, no validated instruments are available for the Dutch context.
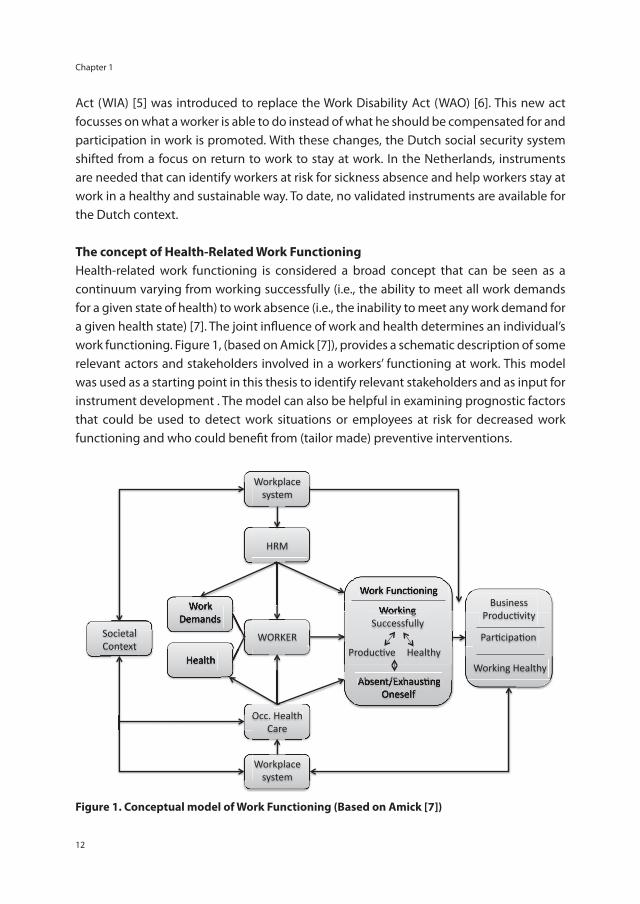
The concept of Health-Related Work FunctioningHealth-related work functioning is considered a broad concept that can be seen as a continuum varying from working successfully (i.e., the ability to meet all work demands for a given state of health) to work absence (i.e., the inability to meet any work demand for a given health state) [7]. The joint infl uence of work and health determines an individual’s work functioning. Figure 1, (based on Amick [7]), provides a schematic description of some relevant actors and stakeholders involved in a workers’ functioning at work. This model was used as a starting point in this thesis to identify relevant stakeholders and as input for instrument development . The model can also be helpful in examining prognostic factors that could be used to detect work situations or employees at risk for decreased work functioning and who could benefi t from (tailor made) preventive interventions.
Workplace system
HRM
WORKER
Occ. Health Care
Workplace system
Work Demands
Health
Societal Context
Business ProducAvity
ParAcipaAon
Working Healthy
Work FuncAoning
Working Successfully
ProducAve ProducAve ProducAve Healthy
Absent/ExhausAng Oneself
Care
Work FuncAoning
Working Work Demands
Societal
HealthContext
Work
. Health
Absent/ExhausAng Oneself
Figure 1. Conceptual model of Work Functioning (Based on Amick [7])
Introduction
13
1Next to the worker, there are two stakeholders from two different systems involved when looking at functioning at work with a health problem: human resources managers (HRM) and occupational health care professionals. HRM and supervisors are confronted with the consequences of health-related functioning at work. For instance if job accommodations are needed, it is the HRM and supervisors’ responsibility to facilitate the worker to stay at work or return to work [8]. Another important stakeholder is the occupational health professional, e.g. occupational therapists, occupational physicians, occupational psychologists, social workers and case managers. In the Netherlands, this professional is mainly the occupational physician (OP). According to OP guidelines, OPs have a case-management role and it is their task to guide workers on sick leave back to work and to facilitate healthy and sustainable work functioning [9,10].
Working Successfully The concept of work functioning as a continuum from working successfully to work absence provides professionals with a framework to help workers stay at work in a healthy and productive way. It is important that successful work functioning is achieved in a healthy and productive way, without exhausting oneself. To achieve successful work functioning, professionals should monitor a workers’ work functioning and take (preventive) actions if needed. The term (sickness) presenteeism is often used for ‘working while sick’, in contrast to the broad concept of work functioning [11,12]. A recent Swedish study [13] showed that absenteeism and presenteeism are not alternatives, but are positively related. Sickness absence of 1–7 days during a 12-month period more than doubled the odds of also having sickness presenteeism of more than 8 days during the same 12-month period. Thus, presenteeism only reflects a small part of the continuum from working successfully to work absence. If signs of reduced work functioning are detected in an early stage, actions can be initiated to prevent a further decrease in work functioning and help the worker to stay at work.
Measuring health-related work functioning: An overviewTo measure the influence of health on functioning at work, validated instruments are needed. Several self-reported instruments have been developed to measure the influence of health on functioning at work (for reviews see for example:[7,14-19]). When measuring work functioning, two types of instruments can be distinguished. The first type deals with the economic consequences of health conditions, such as self-reported loss of productivity on the job. The second type deals with the reported limitations to meet the work demands [7]. In addition, instruments with a single global rating of a workers’ overall work performance are available, as are generic multiple item instruments that try to cover the job demands of a broad variety of occupations. Various job specific or disease specific work functioning instruments are available. Below, some of the instruments will
Chapter 1
14
be introduced; first, two instruments that use single global rating items (HPQ and WPAI), then four multiple item instruments (EWPS, SPS, WLQ and WRFQ), and finally, three health and/or job specific instruments (WALS, LEAPS and NWFQ).
Single global rating instruments Both the Health and Productivity Questionnaire (HPQ) [20] and the Work Productivity and Activity Impairment Questionnaire (WPAI) [21] are instruments that try to capture lost performance or work impairment, measured with a combination of time off work (absenteeism) and overall work performance, with single global rating items. The underlying assumption is that workers are able to provide an indication of their overall work performance, combining all relevant aspects in one overall item. However, this requires memory priming and is a cognitive challenge for the worker. The HPQ therefore includes several memory priming items. The WPAI does not have these memory priming questions and thus contains less items. In addition to work impairment, an item about impairment in daily activities is included [21].
Multiple item instrumentsThe Endicott Work Productivity Scale (EWPS) [22], the Stanford Presenteeism Scale (SPS) [23], the Work Limitations Questionnaire (WLQ) [24] and the Work Role Functioning Questionnaire (WRFQ) [14] are multiple item, generic instruments, designed to measure the degree to which (chronic) health problems (both mental and physical) interfere with the ability to perform job roles (on a demand-level e.g. “work limitations”). These instruments aim to capture the job demands of a broad variety of jobs, with the possible limitation that not all demands are applicable to all respondents and others demands might be missing. The WLQ and WRFQ provide an overall work functioning score, but also include several domains of work functioning (i.e. time scheduling demands, physical demands, output demands, mental and social or interpersonal demands). Scores can be calculated for the subscales. This implies that it is possible to both create a score for the overall concept of work functioning and to provide scores for the underlying subscales.
Health and/or job specific instruments Several health specific and/or job specific instruments are available. For example, the Workplace Activity Limitations Scale (WALS) [25], which measures limitations experienced while performing workplace activities, is specially intended for arthritis populations, while the Lam Employment Absence and Productivity Scale (LEAPS) is a multiple item instrument specifically designed for a clinically depressed population [26]. The newly developed Nurses Work Functioning Questionnaire (NWFQ) is a 50-item self-report instrument specifically developed for nurses and allied health professionals with common mental disorders [27]. The seven subscales of the NWFQ measure impairments in work functioning due to common mental disorders.
Introduction
15
1Field of ApplicabilityWhen professionals and researchers want to measure work functioning, evidence-based decisions should be made about which instrument to use. To select appropriate instruments for use in practice and research the measurement properties (e.g. reliability, validity, and responsiveness) must be evaluated. In addition, the purpose for use defines which instrument to choose. De Vet et al. [28] (p34) describe three important purposes of instruments: diagnosis (or discriminative ability), evaluation (for example of a therapy) and prediction of future course. When translated to functioning at work, an instrument is needed to diagnose (reduced) work functioning, to monitor abilities to accomplish the work role and to evaluate interventions designed to improve work functioning [7,14]. In addition, an instrument to predict future course of functioning at work is needed. Because these different purposes require different measurement properties, combining all purposes in one instrument poses a challenge. If, for example, the instrument is used for diagnostic or prognostic research, the reliability of an instrument is very important, and if the aim is to evaluate an intervention, the instrument should be able to detect change over time for which parameters of measurement error provide important information [28] (p123). Depending on instrument design and layout and the appropriate selection of the items, one instrument can be suitable for multiple purposes. Systematic reviews on measurement properties can provide the evidence needed for the instrument selection. To conduct an evidence synthesis, a systematic quality assessment is crucial because the results of poor quality studies may be biased [29]. Unfortunately, for instruments that evaluate the effects of health on work functioning no gold standard is available, nor is there a point of reference for ‘optimal’ work functioning.
Objectives of the thesis The overall aim of this thesis is to develop a generic instrument that evaluates health-related work functioning to help facilitate sustainable functioning at work, work participation and work reintegration in case of health problems. These health problems can either be chronic or temporary. To date, no validated instrument is available for the Dutch context. The intent is to develop a generic instrument suitable for the general working population and a large variety of occupations. The instrument should also facilitate engagement between occupational health professionals, human resources managers (HRM)/supervisors and the worker regarding preventive actions to help workers to stay at work.
This overall aim has been translated into five research objectives, divided into two main themes:1. Exploration of the concept of health-related work functioning and the development/cross-cultural translation of an instrument:- To explore functioning at work with health problems (including three stakeholder
Chapter 1
16
perspectives) in a qualitative way to provide insight in the concept of health-related work functioning and to explore if and how this can be measured.
- To identify existing instruments and their measurement properties. - To develop a new instrument (or translate and adapt an existing instrument) for use in
the Dutch context.
2. Validation and adaptation of the instrument:- To validate and adapt the new instrument for use in the Dutch context.- To identify prognostic factors related with work functioning over time.
Outline of the thesisThe main aim is to develop and validate an instrument to evaluate functioning at work in relation to health. This first chapter is a general introduction providing the societal background and introducing the concept of health-related work functioning. To start the exploration of the concept of health-related work functioning and if and how the concept can be measured, a focus group study was conducted. Three focus group meetings were organized with the three main stakeholder groups: workers with a health problem, occupational physicians, and HRM/supervisors. The findings are presented in chapter 2. Chapter 3 describes the result of a systematic review that was conducted to identify existing health-related work functioning instruments and to get insight in their measurement properties in a population with common mental disorders. The cross-cultural adaptation process of the Work Role Functioning Questionnaire (WRFQ) to Dutch is described in chapter 4. After the translation and adaptation, a validation study was conducted in the general working population to examine the measurement properties of the translated instrument, which is part of the second theme of this thesis. Chapter 5 presents the results regarding the reliability, validity and responsiveness. The construct validity is explored by means of hypotheses testing in which the relationship of work functioning with other constructs (health status, job content, work ability, work productivity, work engagement) is examined. Chapter 6 reports on the baseline factors associated with (successful) work functioning at three months follow-up. In the general discussion, chapter 7, an overview of the main findings is provided and the results are discussed. In addition, general implications for the future use of the instrument in both occupational health research and practice and recommendations for future research are provided.
Introduction
17
1References
1. van Dijk FJ, Schaufeli WB. Preventieve Bedrijfsgezondheidszorg. Onderzoeksprogramma ten behoeve van de Stichting Instituut Gak. 2007.
2. Dupré D, Karjalainen A. Eurostat, Statistics in focus: Employment of disabled people in Europe in 2002, Eurostat theme 3: population and social conditions. 2003.
3. Jagger C, Gillies C, Moscone F, Cambois E, Van OH, Nusselder W, et al. Inequalities in healthy life years in the 25 countries of the European Union in 2005: a cross-national meta-regression analysis. Lancet 2008; 372:2124-31.
4. Wet Verbetering Poortwachter (Gatekeeper Improvement Act). 2002.
5. Wet werk en inkomen naar arbeidsvermogen (Work Capacity Act). 2005.
6. Wet op de arbeidsongeschiktheidsverzekering (Work Disability Act). 1966.
7. Amick BC,III, Gimeno D. Measuring Work Outcomes with a focus on Health-Related Work Productivity Loss. In: Wittink H, Carr D, editors. Pain Management: Evidence, Outcomes, and Quality of Life: A Sourcebook. Amsterdam: Elsevier; 2008. p. 329-343.
8. Haafkens JA, Kopnina H, Meerman MG, van Dijk FJ. Facilitating job retention for chronically ill employees: perspectives of line managers and human resource managers. BMC Health Serv Res 2011; 11:104.
9. Noordik E, Nieuwenhuijsen K, Varekamp I, van der Klink JJ, van Dijk FJ. Exploring the return-to-work process for workers partially returned to work and partially on long-term sick leave due to common mental disorders: a qualitative study. Disabil Rehabil 2010 [Epub ahead of print].doi: 10.3109/09638288.2010.541547 .
10. NVAB, the Netherlands Society of Occupational Medicine. Available at: http://nvab.artsennet.nl/.
11. Aronsson G, Gustafsson K, Dallner M. Sick but yet at work. An empirical study of sickness presenteeism. J Epidemiol Community Health 2000; 54:502-9.
12. Johns G. Presenteeism in the workplace: A review and research agenda. Journal of Organizational Behavior 2010:519-42.
13. Leineweber C, Westerlund H, Hagberg J, Svedberg P, Alexanderson K. Sickness presenteeism is more than an alternative to sickness absence: results from the population-based SLOSH study. Int Arch Occup Environ Health 2012.
14. Amick BC,III, Lerner D, Rogers WH, Rooney T, Katz JN. A review of health-related work outcome measures and their uses, and recommended measures. Spine 2000; 25:3152-60.
15. Beaton DE, Tang K, Gignac MA, Lacaille D, Badley EM, Anis AH, et al. Reliability, validity, and responsiveness of five at-work productivity measures in patients with rheumatoid arthritis or osteoarthritis. Arthritis Care & Research 2010; 62:28-37.
16. Lofland JH, Pizzi L, Frick KD. A review of health-related workplace productivity loss instruments. Pharmacoeconomics 2004; 22:165-84.
17. Prasad M, Wahlqvist P, Shikiar R, Shih YC. A review of self-report instruments measuring health-related work productivity: a patient-reported outcomes perspective. Pharmacoeconomics 2004; 22:225-44.
18. Williams RM, Schmuck G, Allwood S, Sanchez M, Shea R, Wark G. Psychometric Evaluation of Health-Related Work Outcome Measures For Musculoskeletal Disorders : A Systematic Review. Journal of Occupational Rehabilitation 2007; 17:504-21.
19. Nieuwenhuijsen K, Franche RL, van Dijk FJ. Work Functioning Measurement: Tools for Occupational Mental Health Research. J Occup Environ Med 2010.
Chapter 1
18
20. Kessler RC, Barber C, Beck A, Berglund P, Cleary PD, McKenas D, et al. The World Health Organization Health and Work Performance Questionnaire (HPQ). J Occup Environ Med 2003; 45:156-74.
21. Reilly MC, Zbrozek AS, Dukes EM. The validity and reproducibility of a work productivity and activity impairment instrument. Pharmacoeconomics 1993; 4:353-65.
22. Endicott J, Nee J. Endicott Work Productivity Scale (EWPS): a new measure to assess treatment effects. Psychopharmacol Bull 1997; 33:13-6.
23. Koopman C, Pelletier KR, Murray JF, Sharda CE, Berger ML, Turpin RS, et al. Stanford presenteeism scale: health status and employee productivity. J Occup Environ Med 2002; 44:14-20.
24. Lerner D, Amick BC,III, Rogers WH, Malspeis S, Bungay K, Cynn D. The Work Limitations Questionnaire. Med Care 2001; 39:72-85.
25. Gignac MA, Badley EM, Lacaille D, Cott CC, Adam P, Anis AH. Managing arthritis and employment: making arthritis-related work changes as a means of adaptation. Arthritis Rheum 2004; 51:909-16.
26. Lam RW, Michalak EE, Yatham LN. A new clinical rating scale for work absence and productivity: validation in patients with major depressive disorder. BMC Psychiatry 2009; 9:78.
27. Gartner FR, Nieuwenhuijsen K, van Dijk FJ, Sluiter JK. Psychometric properties of the Nurses Work Functioning Questionnaire (NWFQ). PLoS One 2011; 6:e26565.
28. de Vet HCW, Terwee CB, Mokkink LB, Knol DL. Measurement in medicine. A practical guide. 1st ed. Cambridge: University Press, 2011.
29. Mokkink LB, Terwee CB, Patrick DL, Alonso J, Stratford PW, Knol DL, et al. The COSMIN checklist for assessing the methodological quality of studies on measurement properties of health status measurement instruments: an international Delphi study. Qual Life Res 2010; 19:539-49.
Chapter 2
Workers With Health Problems: Three Perspectives on Functioning At Work
F.I. AbmaU. BültmannI. Varekamp
J.J.L. van der Klink
Accepted for publication in Disability and Rehabilitation, May 2012 (epub ahead of print)

Chapter 2
20
Abstract
Purpose: Our aims were 1) to explore why it is that one worker with a health problem is able to stay at work while the other is not, 2) to identify signals for decreased functioning at work, and 3) to explore if and how this can be measured.
Method: We conducted three focus groups: with workers with a health problem, occupational physicians, and human resources manager/supervisors.
Results: Individual differences in coping strategies, motivation, believes, attitudes, and values were mentioned. All three groups reported that the supervisor is the key figure in the functioning at work of workers with health problems. The supervisor can facilitate the work accommodation of workers and help optimizing functioning at work. The identified signals might contribute to the development of an instrument. Conditions for use were suggested, i.e. a ‘safe’ setting.
Conclusions: This focus group study provided insight in why it is that one worker is able to stay at work while the other is not, according to the opinions of three different groups. Although all three groups reported that the supervisor is the key figure in the functioning at work of workers with health problems, there are differences between how the three stakeholders perceive the situation.
Keywords: work functioning, supervisor, occupational decision, return to work, occupational health care
Workers With Health Problems: Three Perspectives on Functioning At Work
21
2
Introduction
The increase of retirement age and the decrease of possibilities for an early retirement will increase the participation of older workers and workers with health problems in the workforce [1]. It is likely that the health of these workers will have an influence on their functioning at work [2].
From the literature we know that a health condition can have an impact on functioning at work in several ways. For example, ill health can limit work functioning as is shown by Munir et al. [3]. They studied the effect of a variety of chronic conditions on work limitations and work adjustments. For many health conditions it were generic symptoms like fatigue that resulted in work limitations [3]. Haslam et al. [4] studied the effect of anxiety and depression in the workplace on the individual and the organization. They found that mostly symptoms and medication were responsible for an impairment in work performance, sometimes resulting in accidents at work. Moreover, the authors also found that stigma and a lack of understanding of anxiety and depression in the workplace might contribute to impaired work performance. Tveito et al. [5] identified workplace challenges for workers with low back pain and the self-management strategies workers develop to continue working despite their pain.
Instruments are available that measure the impact of health on work functioning. Two types can be distinguished. Instruments that assess overall work performance, with single global rating items (for example the Health and Productivity Questionnaire (HPQ) [6] and the Work Productivity and Activity Impairment Questionnaire (WPAI) [7]); and generic multiple item instruments, designed to measure the degree to which chronic health problems (both mental and physical) interfere with the ability to perform job roles (for example the Endicott Work Productivity Scale (EWPS) [8], the Work Limitations Questionnaire (WLQ) [9] and the Work Role Functioning Questionnaire (WRFQ) [10,11]).”
Although most studies on functioning at work with a health problem show only the perspective of the worker, it is important to take the views of different actors with a stake in the problem into account when looking at functioning at work with a health problem. Human resources managers (HRM) and supervisors have to manage the impact of a workers’ health condition on the functioning at work. The responsibilities of employers concerning return to work might vary between countries, but HRM and supervisors are faced with the consequences of stay at work and health problems in the workplace. As Haafkens et al. [12] reported, it is part of the HRM/supervisors responsibility to facilitate the worker with a health problem in the workplace. It is often the supervisor who is first confronted with the needs for work accommodations of workers with a health problem. Together with the HRM, supervisors have valuable knowledge about and experience with the daily functioning at work of workers with a health problem.
Chapter 2
22
Another important stakeholder is the occupational health professional. In many countries the occupational health professional has a case-management role, which includes the guidance of the worker during the process of return to work. This role can be fulfilled by several occupational health professionals, e.g. occupational therapists, occupational physicians, occupational psychologists, social workers and case managers. In the Netherlands, it is mostly the occupational physician (OP). According to OP guidelines OPs have a case-management role and it is their task to guide workers on sick leave back to work and to prevent (recurrent) sick leave while at work [13].
Hence, the perspectives of professionals on the organizational level and the occupational health care level are also of great interest. The knowledge and experience of these professionals are valuable to get a better understanding of functioning at work with a health problem. Other perspectives are important because they can complement each other. Together they can provide directions for the management of workers with health problems at work and actions to optimize work functioning.
Our aims were 1) to explore why it is that one worker is able to stay at work, while the other is not, 2) to identify signals for decreased functioning at work, and 3) to explore if and how work functioning can be measured. All three aims are explored from the perspectives of three groups: workers with one or more health problem(s), occupational physicians and HRM/supervisors. A focus group approach was used to address these study aims.
Methods
Focus Group Method We used the focus group method. A focus group is a group discussion, designed to gather information and share perspectives without the pressure to reach consensus [14,15]. An important benefit from a group discussion is that participants interact and a group discussions yield extra information. Three focus groups were conducted with respectively workers, occupational physicians, and HRM/supervisors. The focus groups were held in a conference room in a university medical center in the northern part of the Netherlands. Prior to the group discussion, participants were asked to fill out a short questionnaire on socio-demographics (gender, age, educational level) and work characteristics (job, sector, job tenure). All participants signed an informed consent. The participants in the worker group received a small incentive after the focus group. An interview schedule tailored to each group was developed. Each focus group lasted approximately 90 minutes. The discussions were led by an experienced professional moderator.
Workers With Health Problems: Three Perspectives on Functioning At Work
23
2
Inclusion criteria and recruitmentThe inclusion criteria for the three groups were:
- Workers working more than 12 hrs per week with one or more health problem(s)- Occupational physicians guiding workers with health problems- HRM and supervisors managing workers with health problems
Several recruitment techniques were used. Participants were recruited via occupational physicians in professional network, and leaflets left in outpatient clinics, GP waiting rooms and pharmacies. Every eligible person who could attend the meeting was invited. Recruitment stopped when a minimum of six and a maximum of ten persons agreed to participate. No patients of the participating occupational physicians were recruited for the worker group.
Data AnalysisTo get a better understanding of the concept of health-related work functioning and the assessment we asked three main questions in the three groups: 1) Why is it that one worker is able to stay at work, while the other is not able to
stay at work? 2) What are signals for decreased functioning at work? 3) Is it meaningful to measure functioning at work? Why and how?
For the data analysis, we used the qualitative description method as described by Sandelowski [16]. All focus groups were taped, transcribed verbatim, and thematically analyzed. The first phase was to listen to the tapes several times to get an overview of the scope and to become familiar with the data. To answer the three research questions, we thematically coded and analyzed the transcripts using the key questions addressed, supplemented (or refined) with concepts that arose in the group discussions. No computer-assisted qualitative data analysis was used since there were only three group discussions. Each transcript was coded by two independent reviewers labeling fragments with codes. In an iterative process we compared, contrasted, refined and grouped the codes into themes, to help the analysis. During this process we used audit trail to ensure that the themes reflected the actual data and were not the interpretation of ourselves [17]. That is, we frequently went back to the original transcripts and notes made by the researchers during the focus groups to ensure that the codes reflected the actual data. After the initial coding of the transcripts three authors reviewed all codes and themes and reached consensus. The data under each theme were summarized and quotes were used to illustrate the themes. The identified themes are illustrated in the text for each group with quotes from the participants.
Chapter 2
24
Results
ParticipantsSeven workers with health problems, six occupational physicians, one occupational psychologist, and five HRM/supervisors participated in the focus groups. One OP and one worker, who agreed to participate, did not attend the focus group
All workers reported one or more health problems: hearing problems (1), diabetes (1), thyroid disease (3), asthma (1), arthritis (1), rheumatoid arthritis (3), chronic uveitis (autoimmune illness) (1), and psychiatric disorders (2). The mean age of the workers was 47 years (SD=14.4). They worked for an average of 25.1 hours (SD=8.0) per week in a variety of jobs (e.g. social work, administrative work, health care work). Five workers finished higher level education, three finished middle level education.
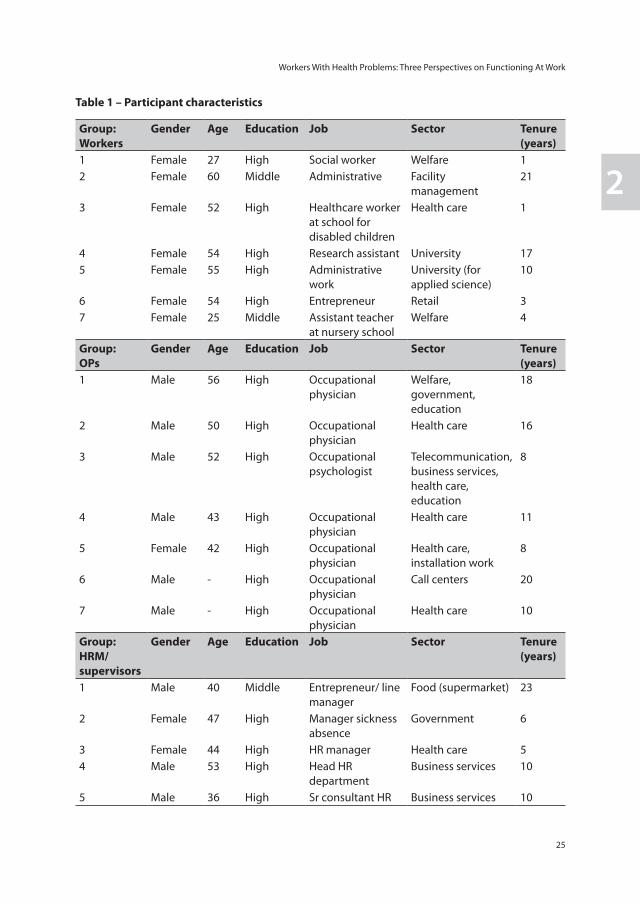
The occupational physicians’ were on average 49 years (SD=6.0). Although three OPs worked in several sectors, five worked mainly in a health care setting (hospital). Job tenure was 12.2 years (SD=4.6). All OPs finished higher education. The mean age of the HRM/supervisors was 44 years (SD=6.5), job tenure was 10.8 years (SD=7.2). All but one finished a higher education, one finished middle level. They worked in business services, health care, government or as entrepreneur in food (supermarket). Table 1 provides an overview of the participant characteristics.
WorkersStay at work. Workers reported that they sometimes found it hard to combine working with their health problems and set limits for themselves when to stop: “I’m crossing my borders. If I have an infection of some sort I keep working, while I know it would be better to stay home and take my rest.” (Worker 5).
Beliefs and attitudes towards illness were also reported by the workers as reasons for staying at work. They do not want to be labeled as ‘the ill worker’. Several workers admitted that they did not mention their health problems during their job interview:
“I don’t look ‘unhealthy’, although I am very ‘unhealthy’. People do not see it, and that is my attitude I guess. . . . Of course, you do not want people to see an illness when they look at you.” (Worker 6)
Several workers noted that they really liked their work and were very motivated to continue to work despite their health problems. For some this was not possible, which they regretted deeply.
Workers With Health Problems: Three Perspectives on Functioning At Work
25
2
Table 1 – Participant characteristics
Group:Workers
Gender Age Education Job Sector Tenure (years)
1 Female 27 High Social worker Welfare 12 Female 60 Middle Administrative Facility
management21
3 Female 52 High Healthcare worker at school for disabled children
Health care 1
4 Female 54 High Research assistant University 175 Female 55 High Administrative
work University (for applied science)
10
6 Female 54 High Entrepreneur Retail 37 Female 25 Middle Assistant teacher
at nursery schoolWelfare 4
Group: OPs
Gender Age Education Job Sector Tenure (years)
1 Male 56 High Occupational physician
Welfare, government, education
18
2 Male 50 High Occupational physician
Health care 16
3 Male 52 High Occupational psychologist
Telecommunication, business services, health care, education
8
4 Male 43 High Occupational physician
Health care 11
5 Female 42 High Occupational physician
Health care, installation work
8
6 Male - High Occupational physician
Call centers 20
7 Male - High Occupational physician
Health care 10
Group: HRM/ supervisors
Gender Age Education Job Sector Tenure (years)
1 Male 40 Middle Entrepreneur/ line manager
Food (supermarket) 23
2 Female 47 High Manager sickness absence
Government 6
3 Female 44 High HR manager Health care 54 Male 53 High Head HR
departmentBusiness services 10
5 Male 36 High Sr consultant HR Business services 10
Chapter 2
26
Support from a supervisor was seen as very important. For example, is he or she able to communicate with a worker, can he or she create a ‘safe’ and open situation for a dialogue:
“I had a supervisor who called me aside when I was not feeling well and asked me what was wrong. She gave me the opportunity to share what I wanted to share. If I told what was wrong, my supervisor made it a shared problem and gave me advice. . . .By doing that [calling me aside], she also made it safe. From that moment on I went to her to talk, even earlier. We had a little chat for 10 minutes, and everything was fine. That way you can handle more. . . . It is very important [that a supervisor can create a ‘safe’ situation].” (Worker 5)
“It is very important that it is safe. When it is not safe it is only a disadvantage that you have opened up. I’m very cautious with revealing my signals. In the past, after my illness started, I was very open about the signals. But it went wrong several times. . . . In my experience it is not safe, especially with mental or psychiatric diseases.” (Worker 4)
Also support from colleagues was experienced as important. Colleagues are often the first to notice changes in how a worker with a health problem is functioning at work and sometimes even take over tasks without being asked: “My colleagues are very considerate about me, they do everything for me. Even certain things I should do, but can not do anymore, they do it for me.” (Worker 2)
Finally, the support from the occupational physician was stated. Workers noted that the OP can provide help and assist in how to function at work with a health problem.
A job that matches the needs and capacities of a worker can also help facilitate the worker to continue and stay at work, even if there is a health problem. Also the possibilities for work accommodations are mentioned. The workers explained that a good fit, the ability to adjust the work pace, working hours and tasks according to their needs and capacities, was helpful in order to be able to function well and stay at work: “I believe it depends on the type of job. For me, I work for an employer, but I am free to schedule my work hours. That depends on the nature of the job.” (Worker 1)
Signals. Workers described that work functioning was well if they felt “well rested”, “have no pain”, and could “find a balance”.
Measuring Work Functioning. When asked if it would be useful to measure how they are functioning at work, the workers were talking about an instrument to use as a mirror to provide them direct feedback on their work functioning. Several conditions for use of such an instrument were discussed. There was no consensus in the worker group regarding the user of the instrument i.e. who should provide (give) the instrument to the worker.
Workers With Health Problems: Three Perspectives on Functioning At Work
27
2
The workers referred to the OP, colleagues, supervisor, friends/family, and themselves – without consensus among the workers. Moreover, several modes of administration were discussed: self-assessment on paper or via internet, again without consensus. Workers did agree that a ‘safe, confident and open’ environment is a necessary condition for the use of such an instrument.
Occupational PhysiciansStay at work. One OP remarks that the diagnosis per se is not predictive of a worker’s functioning at work, rather work functioning depends on how the worker deals with the diagnosis: “The phenomenon of diagnosis alone is not predictive of how people cope with [a health problem]. This depends on the individual.” (OP 1) The OP continues that workers develop strategies to cope with their health and its impact on the way they function at work: “Somehow they [the workers] mentally arrange something that allows them to continue working with their health problem.” Some other OPs agree that they see big differences between individuals.
OPs noticed that workers who have work high on their list of priorities and are motivated to work are more likely to continue to work or quickly return to work despite their (remaining) health problems: “In the end it is the motivation of a worker, or as OP 1 said, it is the priority work has . . . that determines if the worker returns to work easy.” (OP 4) Communicating with the worker is also an essential condition for staying at work and good functioning at work.
The OPs noted that the leadership style and role of a supervisor can influence whether a worker stays at work and how he/she functions at work. A supervisor with a person-oriented leadership style is better able to keep a worker at work in comparison with supervisors without person orientation:
“There are supervisors who see their employees as numbers, to put it impolite. They think that everyone has to perform in the same way. There are also supervisors who are able to view the employee as an individual, with strengths and weaknesses. When a supervisor has a person-oriented leadership style, you see it is easier for a worker to stay at work.” (OP 6)
OPs also view themselves as an important source of support to help a worker stay at work. Unfortunately they are not always able to perform this role and have to focus on sickness absence and return to work. They would like to act in a more preventive role and look at the employability of a worker who has a health problem. They want to guide the worker at work and give advice about the content and amount of work that would be suitable for the situation:
Chapter 2
28
“The problem is that workers who continue to work with a chronic health problem can develop a disbalance [between work and private life]. At that point, it might be disadvantageous for them to stay at work, while they do not view this as problematic. In my opinion this is a problem for us as OP. The workers come to see us when it is already too late. We want them to benefit from our expertise at an earlier moment.” (OP 7)
The OPs notice that the type of job and the fit between the job and the individual is of influence to whether a worker is able to continue to work. For example, working in a team, job tasks, replacement by any other worker, or that their work is on hold when absent and has to be completed after return to work.
Finally, OPs believe that the organizational culture has a major influence on work functioning of workers and stay at work behavior. OPs mentioned that they experience large cultural differences between departments and organizations:
“It depends on the organization. If the organization wants to operate at a proactive or excellent level, it is seen as positive that you [the OP] are able to keep the worker at work. In that sense it is determined by culture.” (OP 5)
Signals. Possible signals of reduced work functioning were seen as changes in behavior: “compensating hours”, “not taking all vacation days”, “frequency of absenteeism”, “emotional instability”, “being easily agitated”, and “quality of work”.
Measuring Work Functioning. When asked if it would be useful to have a tool that can measure how a worker is functioning at work with a health problem, the OPs explained that the instrument could be used as a detection instrument for workers who are at risk for absenteeism, who might need an intervention to stay at work. They would also like an instrument that can follow these workers over time, to monitor them and to indicate for interventions when necessary. The instrument should therefore be able to “pick up relevant signals”, “identify workers at risk”, “monitor health-related work functioning over time”, and “show directions for interventions”. The OPs viewed the measurement of work functioning as a task for the supervisor or the workers themselves.
HRM/SupervisorsStay at work. HRM/supervisors pointed out that the worker’s beliefs, attitudes, norms and values are of great influence if a worker stays at work or calls in sick: “It is mainly the attitude of the worker. Is he [the worker] focused on his own employability, what he still can do, or is he thinking negatively i.e. about the things he can not do anymore.” (HRM/supervisor 2)
Workers With Health Problems: Three Perspectives on Functioning At Work
29
2
The attributed value or meaning of work influences the decision to stay at work and how a worker is functioning with a health problem. If they have a high motivation to work, they are more likely to be at work and stay at work. Often work gives them ‘meaning’, they ‘belong’ to something: “They are my highest motivated workers; they become part of a group.” (HRM/supervisor 6) The HRM/supervisors also reported goal orientation of workers influencing work functioning. Workers who set high goals for themselves, for example in their careers, are less likely to report sick and more likely to stay at work: “Some workers are very preoccupied with career paths. They will think twice before calling in sick.” (HRM/supervisor 5)
The HRM/supervisors mentioned an important role for the supervisor in helping workers functioning at work. They did acknowledge that sometimes it is difficult for the supervisor to contact a worker who is absent or is not functioning as he or she should due to his or her health problems and discuss the problems. They believe that the OP can be helpful in supporting the supervisor how to manage workers with a health problem in a day-to-day setting: “The OP can say that this worker cannot work, but he should also explain to me what I can do, as supervisor.” (HRM/supervisor 3)HRM/supervisors also believe that the organizational policies and culture has a major influence on how workers function at work and whether or not they call in sick. They sometimes experience large cultural differences between departments and organizations.
Signals. Possible signals of reduced work functioning were seen as changes in behavior: “loss of attention”, “working slower”, “leaving early”, the “work output”, and “complaints from customers or colleagues”.
Measuring work functioning. When asked if it would be useful to have a tool that can measure how a worker is functioning at work with a health problem, the HRM/supervisors did not agree. Some wanted an instrument to help them communicate with the worker, for instance as a starting point for a dialogue. Others did not feel the need to measure this with a new instrument.
Discussion
To our best knowledge this is the first focus group study to take three stakeholder perspectives into account, when looking at functioning at work of workers with a health problem. The results of this focus group study provided insight in differences between workers’ decision to stay at work and in differences between how the three stakeholders perceive the situation. For example the workers tend to focus on their health and on their working conditions, while the HRM/supervisors and OPs also take the workers motivation, the attributed value of work, and the organizational culture into account. The role of the
Chapter 2
30
supervisor was viewed as important in all three groups for managing and optimizing work functioning given a health problem and providing the conditions to help the worker stay at work. The participants also provided ‘signals’ for decreased work functioning, which might contribute to the development of a new instrument to measure work functioning. Existing instruments are readily available that try to capture several of the identified signals. For example, several instruments that deal with the reported limitations to meet the work demands and overall job performance (e.g. WLQ [9], WRFQ [10,11], HPQ [6] or WPAI [7]). Conditions for use of such an instrument were suggested.
It is interesting to note, that when exploring functioning at work with a health problem and identifying signals of reduced functioning, HRM/supervisors found it difficult not to discuss absenteeism and how to act when a worker is on sick leave or returns to work, while the OPs and workers were discussing work functioning as a broader construct, with workers not necessarily being absent from work due to their health problem. Although socio-political changes in the Netherlands are creating a paradigm shift from a compensation model towards a participation model and facilitating early return to work, HRM/supervisors still consider sickness absence management very important. This might be a result of the focus on sickness absence management in the Netherlands in previous years. Managing workers with a health problem at work is not seen as their main focus, notwithstanding the fact that more and more workers will be at work with health problems. A shift towards participation is needed to let these workers stay at work in a sustainable way.
The OPs mentioned that the diagnosis per se was not seen as a predictor of functioning at work with a health problem. The way workers cope with their situation was viewed as more important than the diagnosis. This is in line with results form a study by Löfgren et al. [18] among working woman with fibromyalgia. They described several strategies workers developed to manage work, social life and their symptoms. Work was considered as meaningful and workers had high motivation to keep on working. In this study too, work motivation and the meaning of work were identified as important attributors to stay at work.
The importance of support has also been identified in other studies. For example, Tveito et al. [5] found that workers with pain could better manage their pain at the workplace when they experienced support at the workplace. Munir et al. [19] found a relationship between line manager support and the self-managing behaviors at work and workers’ self-efficacy in making work adjustments to better manage their chronic illness at work. They also found an influence of occupational health support on self-efficacy for making work adjustments. Yarker et al. [20] identified the importance of support from occupational health, line managers and colleagues in a group of cancer survivors during their return to work, although not everyone experienced this support. The authors also discuss a wear-off effect of support; even though the side effects and symptoms
Workers With Health Problems: Three Perspectives on Functioning At Work
31
2
were still there, support started to wear-off over time. Shaw et al. [21] identified in an interview study the importance of the supervisor to prevent work disability after injury. By accommodating the worker at work, communicating with the worker and providing support, the supervisor can play an important role in aiding the worker to stay at work.
Stigma and disclosure in the workplace was discussed in an interview study among patients with bipolar disorder [22]. In that study, participants stated that they felt that stigma relating to bipolar disorder had negative consequences for their career and disclosure often resulted in a disrupted relationship with colleagues. In the current article, participants stated that for disclosure a safe an open environment is necessary.
In Yarker et al. [20] workers stated that the communication between occupational health and line managers was often poor. In this study both the OPs and HRM/supervisors identified the importance of good communication between occupational health and HRM/supervisors.
This article showed that a good person-work fit and the availability of work accommodations are necessary for staying at work and functioning well at work, despite a health problem. The ability to adjust work tasks or modify duties can be beneficial to accomplish a good fit. Earlier studies have also proven the value of work accommodations in keeping workers stay at work with a health problem or maybe even prevent sickness absence [23-26].
The impact of organizational policies and culture is supported by results from earlier studies as well. In an interview study with both managers and employees [20] participants mentioned that organizational policies could provide guidance and support for both the worker and manager during return to work, for example by allowing to return on reduced hours or duties. In a study with line managers and HRM, the HRM identified the need for a good company policy and a culture of trust, openness and communication as very important for a sustained employability for chronically ill workers [12].
In all three groups, the possible benefits for measuring work functioning were discussed. All signals are considered equally important, as they reflect the three perspectives. No consensus could be reached between and within the three participant groups about the user of the instrument and the mode of administration of the instrument. However, the workers were clear on the condition for use of an instrument in a “safe and open environment”. This safe setting can be provided within the confidentiality of the occupational physicians’ office, but might also be created within the relationship between worker and HRM/supervisor. In addition, workers mentioned the use of this instrument as a mirror to reflect on their situation, while HRM/supervisors and OPs would like to see it as a tool to collect and share information and, if possible, to help workers to stay at work. These aims are not necessary in conflict with each other, as long as the conditions for use are taken into consideration.
Chapter 2
32
Strengths and LimitationsA strength of this focus group study is the inclusion of different perspectives. Not only the worker was included whose health might affect the functioning at work on a day-to-day basis, but also the HRM/supervisors and occupational health perspective. Therefore, the article reflects the view of three main stakeholder perspectives.
A possible limitation of the study is the limited number of groups. Only one group discussion was conducted for each perspective. Moreover, the worker group comprised only women and most participants had a high educational level. Therefore the result might be difficult to generalize to male workers and workers with a low educational level. In addition, the study was performed with volunteers, which might have led to a selection of participants with a special interest in the topic. For future research it is recommended to include also male workers and workers with a low educational level.
ConclusionThis focus group study provided insight in why it is that one worker is able to stay at work while the other is not, according to the opinions of three different groups. Although all three groups reported that the supervisor is the key figure in the functioning at work of workers with health problems, differences in views of the concept of work functioning between workers, OPs and HRM/supervisors are a point of interest. Participants also identified signals for decreased work functioning, which might contribute to the development of a new instrument to measure work functioning. Direction is provided for the content and conditions for use of an instrument. Overall, the results indicate that an instrument to measure work functioning of workers with a health problem could be helpful for occupational health professionals and HRM/supervisors by monitoring how workers are functioning, to start a dialogue, to share information and provide directions for interventions for helping these workers to stay at-work.
Workers With Health Problems: Three Perspectives on Functioning At Work
33
2
References
1. Black C. Working for a healthier tomorrow. Dame Carol Black’s Review of the health of Britain’s working age population. 2008.
2. Lerner D, Allaire SH, Reisine ST. Work disability resulting from chronic health conditions. J Occup Environ Med 2005; 47:253-64.
3. Munir F, Jones D, Leka S, Griffiths A. Work limitations and employer adjustments for employees with chronic illness. Int J Rehabil Res 2005; 28:111-7.
4. Haslam C, Atkinson S, Brown SS, Haslam RA. Anxiety and depression in the workplace: effects on the individual and organisation (a focus group investigation). J Affect Disord 2005; 88:209-15.
5. Tveito TH, Shaw WS, Huang YH, Nicholas M, Wagner G. Managing pain in the workplace: a focus group study of challenges, strategies and what matters most to workers with low back pain. Disabil Rehabil 2010; 32:2035-45.
6. Kessler RC, Barber C, Beck A, Berglund P, Cleary PD, McKenas D, et al. The World Health Organization Health and Work Performance Questionnaire (HPQ). J Occup Environ Med 2003; 45:156-74.
7. Reilly MC, Zbrozek AS, Dukes EM. The validity and reproducibility of a work productivity and activity impairment instrument. Pharmacoeconomics 1993; 4:353-65.
8. Endicott J, Nee J. Endicott Work Productivity Scale (EWPS): a new measure to assess treatment effects. Psychopharmacol Bull 1997; 33:13-6.
9. Lerner D, Amick BC,III, Rogers WH, Malspeis S, Bungay K, Cynn D. The Work Limitations Questionnaire. Med Care 2001; 39:72-85.
10. Amick BC,III, Lerner D, Rogers WH, Rooney T, Katz JN. A review of health-related work outcome measures and their uses, and recommended measures. Spine 2000; 25:3152-60.
11. Abma FI, Amick BC,3rd, Brouwer S, van der Klink JJL, Bültmann U. The cross-cultural adaptation of the Work Role Functioning Questionnaire to Dutch. Work: Journal of Prevention, Assessment & Rehabilitation In press.
12. Haafkens JA, Kopnina H, Meerman MG, van Dijk FJ. Facilitating job retention for chronically ill employees: perspectives of line managers and human resource managers. BMC Health Serv Res 2011; 11:104.
13. Noordik E, Nieuwenhuijsen K, Varekamp I, van der Klink JJ, van Dijk FJ. Exploring the return-to-work process for workers partially returned to work and partially on long-term sick leave due to common mental disorders: a qualitative study. Disabil Rehabil 2010 [Epub ahead of print].doi: 10.3109/09638288.2010.541547 .
14. Krueger RA, Casey MA. Focus groups: a practical guide for applied research. 4th ed. Thousand Oaks: Sage, 2008.
15. Morgan DL, Krueger RA. The focus group kit. Thousand Oaks: Sage, 1998.
16. Sandelowski M. Whatever happened to qualitative description? Res Nurs Health 2000; 23:334-40.
17. Kuper A, Lingard L, Levinson W. Critically appraising qualitative research. BMJ 2008; 337:a1035.
18. Lofgren M, Ekholm J, Ohman A. ‘A constant struggle’: successful strategies of women in work despite fibromyalgia. Disabil Rehabil 2006; 28:447-55.
19. Munir F, Randall R, Yarker J, Nielsen K. The influence of employer support on employee management of chronic health conditions at work. J Occup Rehabil 2009; 19:333-44.
20. Yarker J, Munir F, Bains M, Kalawsky K, Haslam C. The role of communication and support in return to work following cancer-related absence. Psychooncology 2010; 19:1078-85.
Chapter 2
34
21. Shaw WS, Robertson MM, Pransky G, McLellan RK. Employee perspectives on the role of supervisors to prevent workplace disability after injuries. J Occup Rehabil 2003; 13:129-42.
22. Michalak EE, Yatham LN, Maxwell V, Hale S, Lam RW. The impact of bipolar disorder upon work functioning: a qualitative analysis. Bipolar Disord 2007; 9:126-43.
23. Krause N, Dasinger LK, Neuhauser F. Modified work and return to work: A review of the literature. J Occup Rehabil 1998; 8:113.
24. van Duijn M, Burdorf A. Influence of modified work on recurrence of sick leave due to musculoskeletal complaints. J Rehabil Med 2008; 40:576-81.
25. Coole C, Watson PJ, Drummond A. Low back pain patients’ experiences of work modifications; a qualitative study. BMC Musculoskelet Disord 2010; 11:277.
26. Varekamp I, van Dijk FJ. Workplace problems and solutions for employees with chronic diseases. Occup Med (Lond) 2010; 60:287-93.
Chapter 3
Evaluation of the measurement properties of self-reported health-related work functioning instruments among
workers with common mental disorders
F.I. AbmaJ.J.L. van der Klink
C.B. TerweeB.C. Amick IIIU. Bültmann
Scand J Work Environ Health 2012;38(1):5-18
Chapter 3
36
Abstract
Objectives: During the past decade, common mental disorders (CMD) have emerged as a major public and occupational health problem in many countries. Several instruments have been developed to measure the influence of health on functioning at work. To select appropriate instruments for use in occupational health practice and research, the measurement properties (eg, reliability, validity, responsiveness) must be evaluated. The objective of this study is to appraise critically and compare the measurement properties of self-reported health-related work functioning instruments among workers with CMD.
Methods: A systematic review was performed searching three electronic databases. Papers were included that: (i) mainly focused on the development and/or evaluation of the measurement properties of a self-reported health-related work functioning instrument; (ii) were conducted in a CMD population; and (iii) were fulltext original papers. Quality appraisal was performed using the COSMIN checklist.
Results: Five papers evaluating measurement properties of five self-reported health-related work functioning instruments in CMD populations were included. There is little evidence available for the measurement properties of the identified instruments in this population, mainly due to low methodological quality of the included studies.
Conclusions: The available evidence on measurement properties is based on studies of poor-to-fair methodological quality. Information on a number of measurement properties, such as measurement error, content validity, and cross-cultural validity is still lacking. Therefore, no evidence-based decisions and recommendations can be made for the use of health-related work functioning instruments. Studies of high methodological quality are needed to properly assess the existing instruments’ measurement properties.
Keywords: mental health, presenteeism, psychometrics, validation.
Measurement properties of work functioning instruments – A systematic review
37
3
Introduction
During the past decade, common mental disorders (CMD), such as depressive, anxiety, and adjustment disorders, have emerged as a major public and occupational health problem in many countries. On the societal level, CMD contribute to productivity loss, sickness absence, early retirement, and work disability [1-6]. On the individual level, CMD cause not only suffering, but also have a negative impact on social relationships, social and work functioning [6]. Several studies have shown a relationship between CMD and work performance [7,8], and it has been estimated that the costs of lost productivity at work for CMD are much higher than those for absenteeism [7,9-11]. In the field of occupational health practice and research, instruments are needed to assess lost productivity at work, monitor abilities to accomplish the work role, and evaluate interventions designed to improve work functioning [12,13]. Several self-reported questionnaires have been developed to measure the influence of health on functioning at work (for reviews see for example [12,14-19]). The joint influence of work and health determines an individual’s work functioning. Two aspects of work functioning can be described. The first category deals with the economic consequences of health conditions, such as self-reported loss of productivity on the job. The second category deals with the reported limitations to meet work demands [13]. Recently, a review by Nieuwenhuijsen et al. [20] provided a narrative overview of work functioning in CMD populations, including instruments, dimensions of work functioning, and measurement properties. In this review, a systematic assessment of the methodological quality of the validation studies has not been performed. However, to conduct an evidence synthesis, a systematic quality assessment is crucial because the results of poor quality studies may be biased [21]. Practitioners and researchers should make evidence-based decisions on which instrument to use. To select appropriate instruments for use in occupational health practice and research, the measurement properties (eg, reliability, validity, responsiveness) must be evaluated. If, for example, these instruments are used to evaluate interventions, it is important to know whether the instrument is able to detect changes over time. The synthesized evidence provided in systematic reviews on measurement properties should be used for the selection of instruments. A recent review of the measurement properties of health-related work functioning instruments in populations with musculoskeletal disorders included a quality assessment, but a validated quality assessment tool was not used [19]. This review focuses on the measurement properties of self-reported health-related work functioning instruments in CMD populations. Most of these instruments are designed for a broader population, but many are also used in CMD populations. However, the evidence for this use remains unclear. Therefore, the objective of this study was to appraise critically and compare the measurement properties of the identified self-reported health-related work functioning instruments in CMD populations.
Chapter 3
38
Methods
Search strategyThe following electronic databases were searched: Embase, PsycInfo (EBSCOhost), and MEDLINE (PubMed). The search strategy consisted of search terms for the following characteristics, combined with “AND”: (i) construct of interest (health-related work functioning); (ii) target population (CMD); and (iii) studies on measurement properties. Some examples of search terms that were used include: work performance, work functioning, work limitations, mental disorders, anxiety disorders, depressive disorder, adjustment disorder. The complete search strategy can be found in appendix 1. To identify studies on measurement properties in PubMed, we used a sensitive filter specially designed for identifying studies on measurement properties of patient-reported outcomes [22]. This filter was adapted for searches in PsycInfo and Embase. No restrictions were made on the year of publication or language. Names of the retrieved instruments were used for further searches in the databases. Reference lists were screened to identify additional relevant studies.
Selection criteriaHealth-related work functioning instruments measure the influence of health on functioning at work. These types of instruments ask the respondent to rate the influence of his/her health status on his/her work functioning. Health-related work functioning is the ability of a worker to accomplish work demands given his or her state of health. In this review, we included instruments that both evaluate health-related work functioning and are from the worker’s perspective (ie, self-reported). Instruments based on a single item, those measuring absenteeism only, or those whose work definitions included house and school work in addition to (paid) work were excluded. Papers were included that: (i) mainly focused on the development and/or evaluation of the measurement properties of a self-reported health-related work functioning instrument; (ii) were conducted in a population with CMD (including: depressive, anxiety, and adjustment disorders; diagnoses based on validated questionnaires, diagnostic interviews, or Diagnostic and Statistical Manual of Mental Disorders (DSM) criteria); (iii) were fulltext original papers (case studies, abstracts, letters to the editor, book chapters, conference proceedings, and unpublished papers were excluded). More severe psychiatric disorders, such as bipolar depression, psychosis, and schizophrenia were excluded.Two independent reviewers screened titles and abstracts using the inclusion criteria. If there was any doubt as to whether the paper met the criteria, consensus was reached among the reviewers. Two independent reviewers reviewed the fulltext papers for inclusion. If necessary, a third independent reviewer was consulted.
Measurement properties of work functioning instruments – A systematic review
39
3
Measurement propertiesFor the critical appraisal of the measurement properties, the COSMIN taxonomy was used (COnsensus-based Standards for the selection of health status Measurement INstruments). The COSMIN taxonomy was developed to provide an overview of the relevant measurement properties for health-related patient-reported outcomes and is based on international consensus [21,23]. According to the taxonomy, the measurement properties cover three quality domains: reliability, validity, and responsiveness [23]. In addition, the interpretability of results is described.Reliability is the extent to which scores for individuals who have not changed are the same for repeated measurement under several conditions [eg, using different sets of items from the same questionnaire (internal consistency); over time (test-retest); by different persons on the same occasion (inter-rater); or by the same persons on different occasions (intra-rater)] [23]. The reliability domain contains the following measurement properties: (i) internal consistency: the degree of interrelatedness among the items (expressed by Cronbach’s α or Kuder-Richardson Formula (KR-20) [21,23]; when internal consistency is relevant, factor analysis or principal component analysis should be applied to determine whether the items form one or more than one scale [24]; (ii) reliability: the proportion of the total variance in the measurements that reflects the “true” differences among individuals, including test-retest, inter- and intra-observer reliability [this aspect is reflected by the intraclass correlation coefficient (ICC) or Cohen’s κ] [23,25]; (iii) measurement error: the systematic and random error of an individual’s score that is not attributed to true changes in the construct to be measured, expressed by the standard error of measurement (SEM). The SEM can be converted into the smallest detectable change (SDC) [26]. Changes exceeding the SDC can be labelled as change beyond measurement error. Another approach is to calculate the limits of agreement (LoA) [27]. For determining the adequacy of measurement error, the SDC and/or LoA is related to the minimal important change (MIC) [28].Validity is described as the degree to which an instrument measures the construct(s) it purports to measure [23]. The validity domain contains three measurement properties: (i) content validity: the degree to which the content of the instrument is an adequate representative of the construct to be measured (including face validity). Content validity is an assessment of whether all items are relevant for the construct, aim and target population, and if no important items are missing (preferably by the target group) [29]; (ii) construct validity, which is divided into three aspects: (a) structural validity: the degree the instrument scores are an adequate reflection of the construct’s dimensionality. Factor analysis should be performed to confirm the number of subscales present; (b) hypotheses testing: the degree to which the instrument scores are consistent with hypotheses based on the assumption that the instrument validly measures the construct. Many different
Chapter 3
40
hypotheses can be formulated and tested (eg, the extent scores on a particular instrument relate to scores on other instruments or expected differences in scores between “known” groups. It is important in hypotheses testing to state hypotheses a priori, clearly indicating both direction and magnitude of the correlation or difference [29]. For example, higher correlations are expected with similar constructs and variables, and lower correlations with dissimilar constructs and variables; (c) cross-cultural validity: the degree to which the performance of the items on a translated or culturally adapted instrument are an adequate reflection of the performance of the items of the original version of the instrument; (iii) criterion validity: the degree to which the scores of an instrument are an adequate reflection of a “gold standard”. Since no real gold standard is available for measuring health-related work functioning we will not evaluate criterion validity [29].Responsiveness is described as the ability of an instrument to detect change over time in the construct to be measured [23]. The responsiveness domain is considered an aspect of validity in a longitudinal context [29]. Therefore, appropriate measures to evaluate responsiveness are the same as those for hypotheses testing and criterion validity. The only difference here is that hypotheses should focus on the change score of an instrument. Another approach is to determine the area under the receiver operator characteristic curve (AUC).Interpretability is the degree to which one can assign qualitative meaning – that is clinical or commonly understood connotations – to an instrument’s quantitative scores or change in scores [23]. Investigators should provide information about clinically meaningful differences in scores between subgroups, floor and ceiling effects, and MIC. Although interpretability is not a measurement property, it is considered to be an important characteristic of an instrument.
Data extraction and description of the instrumentsTwo independent reviewers performed the data extraction. The retrieved instruments are described based on the information in original publications and the papers included in the review. The content, domains, target population, number of items, response options, and time to administer are presented [23]. The measurement properties are presented as studied in the included papers.
Quality assessmentAssessing the quality of the included studies (on the measurement properties of the instruments) is an essential step of a systematic review of measurement properties. If the quality of a study is appropriate, the results are valid and the measurement instrument can be a useful tool in clinical practice or research. However, when the quality of a study is inadequate, the results cannot be trusted and the quality of the measurement instrument under study remains unclear. The methodological quality assessment was conducted
Measurement properties of work functioning instruments – A systematic review
41
3
using the COSMIN checklist [21]. The COSMIN checklist is used to rate the quality of studies on one or more of the nine measurement properties (internal consistency, reliability, measurement error, content validity, structural validity, hypothesis testing, cross-cultural validity, criterion validity, and responsiveness) and the quality of studies on interpretability. For each study on a measurement property, the methodological quality for that particular measurement property is rated by a series of items on a 4-point rating scale (poor, fair, good, excellent), which is an additional feature of the COSMIN checklist [30]. These items rate for example the used sample sizes, the description of used comparator measures, how missing items were handled, and whether the used methods and statistics were appropriate. Per measurement property, an overall score for the methodological quality of a paper is determined by taking the lowest rating of any of the items per measurement property (poor to excellent). For example, if no description of the comparator instruments is provided for hypotheses testing, this item is rated “poor”. Even though all others items for hypotheses testing may be rated “excellent”, the methodological quality for hypotheses testing is rated “poor”. To rate the results of the measurement properties as positive, negative, or indeterminate, criteria were used based on Terwee et al. [24]. The criteria are presented in appendix 2. For example, for internal consistency, a positive (+) rating is given if Cronbach’s α is ≥0.70, a negative (-) rating is given for <0.70, and an indeterminate (?) rating is given if no Cronbach’s α is presented.Two independent reviewers performed an assessment of methodological quality per paper. When two reviewers disagreed, there was a discussion to reach consensus. If necessary, a third reviewer made the decision.
Best evidence synthesisA best evidence synthesis for each instrument was performed to summarize the total body of evidence for each measurement property, taking into account the number of studies, the quality of the studies, and the consistency of their results. Therefore, for each instrument, the rating of the methodological quality is combined with the rating of the measurement properties. The following criteria were used: a strong level of evidence (+++ or −−−) = consistent findings in multiple studies of good methodological quality or in one study of excellent methodological quality; a moderate level of evidence (++ or −−) = consistent findings in multiple studies of fair methodological quality or in one study of good methodological quality; a limited level of evidence (+ or −) = one study of fair methodological quality; and conflicting level of evidence (+/−) = conflicting findings. When there were only studies of poor methodological quality, unknown level of evidence (?) was noted.
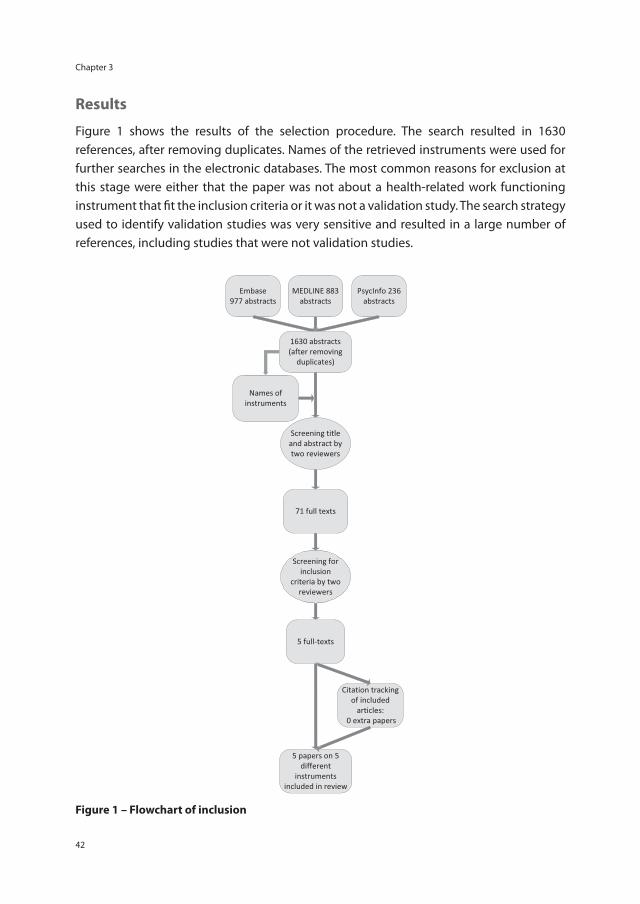
Chapter 3
42
Results
Figure 1 shows the results of the selection procedure. The search resulted in 1630 references, after removing duplicates. Names of the retrieved instruments were used for further searches in the electronic databases. The most common reasons for exclusion at this stage were either that the paper was not about a health-related work functioning instrument that fi t the inclusion criteria or it was not a validation study. The search strategy used to identify validation studies was very sensitive and resulted in a large number of references, including studies that were not validation studies.
Figure 1 – Flowchart of inclusion
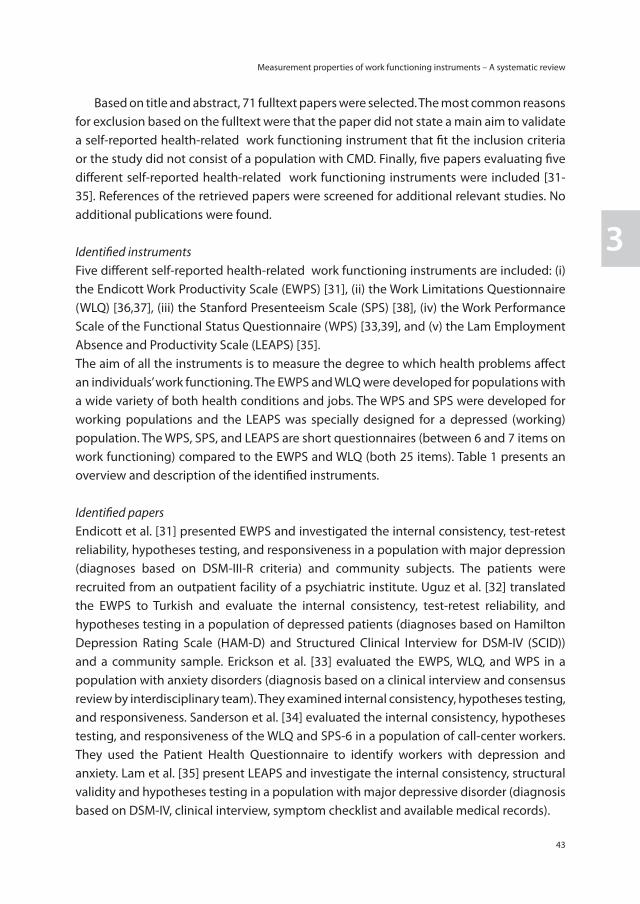
Measurement properties of work functioning instruments – A systematic review
43
3
Based on title and abstract, 71 fulltext papers were selected. The most common reasons for exclusion based on the fulltext were that the paper did not state a main aim to validate a self-reported health-related work functioning instrument that fit the inclusion criteria or the study did not consist of a population with CMD. Finally, five papers evaluating five different self-reported health-related work functioning instruments were included [31-35]. References of the retrieved papers were screened for additional relevant studies. No additional publications were found.
Identified instrumentsFive different self-reported health-related work functioning instruments are included: (i) the Endicott Work Productivity Scale (EWPS) [31], (ii) the Work Limitations Questionnaire (WLQ) [36,37], (iii) the Stanford Presenteeism Scale (SPS) [38], (iv) the Work Performance Scale of the Functional Status Questionnaire (WPS) [33,39], and (v) the Lam Employment Absence and Productivity Scale (LEAPS) [35].The aim of all the instruments is to measure the degree to which health problems affect an individuals’ work functioning. The EWPS and WLQ were developed for populations with a wide variety of both health conditions and jobs. The WPS and SPS were developed for working populations and the LEAPS was specially designed for a depressed (working) population. The WPS, SPS, and LEAPS are short questionnaires (between 6 and 7 items on work functioning) compared to the EWPS and WLQ (both 25 items). Table 1 presents an overview and description of the identified instruments.
Identified papersEndicott et al. [31] presented EWPS and investigated the internal consistency, test-retest reliability, hypotheses testing, and responsiveness in a population with major depression (diagnoses based on DSM-III-R criteria) and community subjects. The patients were recruited from an outpatient facility of a psychiatric institute. Uguz et al. [32] translated the EWPS to Turkish and evaluate the internal consistency, test-retest reliability, and hypotheses testing in a population of depressed patients (diagnoses based on Hamilton Depression Rating Scale (HAM-D) and Structured Clinical Interview for DSM-IV (SCID)) and a community sample. Erickson et al. [33] evaluated the EWPS, WLQ, and WPS in a population with anxiety disorders (diagnosis based on a clinical interview and consensus review by interdisciplinary team). They examined internal consistency, hypotheses testing, and responsiveness. Sanderson et al. [34] evaluated the internal consistency, hypotheses testing, and responsiveness of the WLQ and SPS-6 in a population of call-center workers. They used the Patient Health Questionnaire to identify workers with depression and anxiety. Lam et al. [35] present LEAPS and investigate the internal consistency, structural validity and hypotheses testing in a population with major depressive disorder (diagnosis based on DSM-IV, clinical interview, symptom checklist and available medical records).
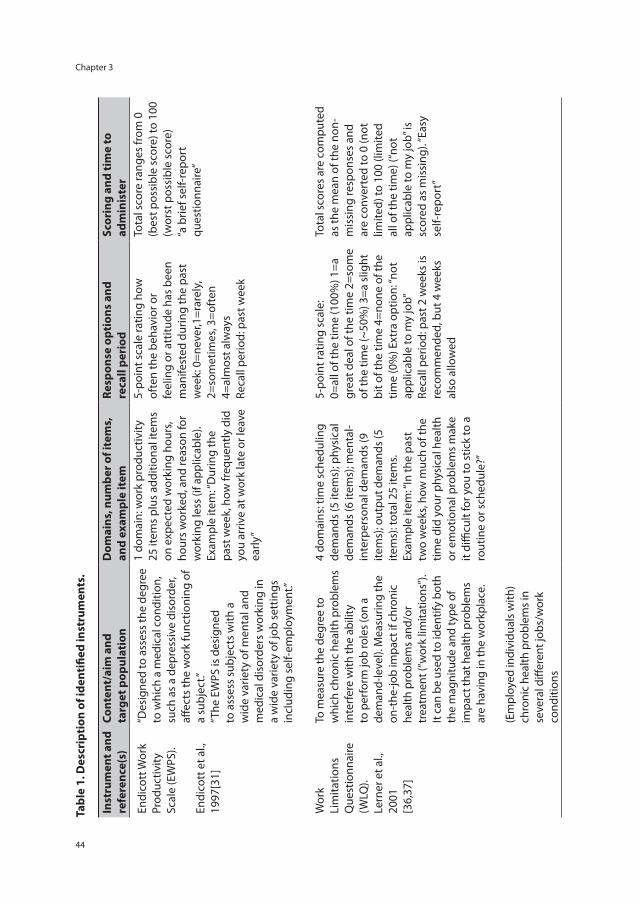
Chapter 3
44
Tabl
e 1.
Des
crip
tion
of i
dent
ified
inst
rum
ents
.
Inst
rum
ent a
nd
refe
renc
e(s)
Cont
ent/
aim
and
ta
rget
pop
ulat
ion
Dom
ains
, num
ber o
f ite
ms,
an
d ex
ampl
e it
emRe
spon
se o
ptio
ns a
nd
reca
ll pe
riod
Scor
ing
and
tim
e to
ad
min
iste
r
Endi
cott
Wor
k Pr
oduc
tivity
Sc
ale
(EW
PS).
Endi
cott
et a
l.,
1997
[31]
“Des
igne
d to
ass
ess t
he d
egre
e to
whi
ch a
med
ical
con
ditio
n,
such
as
a de
pres
sive
dis
orde
r, aff
ects
the
wor
k fu
nctio
ning
of
a su
bjec
t.”
“The
EW
PS is
des
igne
d to
ass
ess
subj
ects
with
a
wid
e va
riety
of m
enta
l and
m
edic
al d
isor
ders
wor
king
in
a w
ide
varie
ty o
f job
set
tings
in
clud
ing
self-
empl
oym
ent.”
1 do
mai
n: w
ork
prod
uctiv
ity
25 it
ems
plus
add
ition
al it
ems
on e
xpec
ted
wor
king
hou
rs,
hour
s w
orke
d, a
nd re
ason
for
wor
king
less
(if a
pplic
able
).
Exam
ple
item
: “D
urin
g th
e pa
st w
eek,
how
freq
uent
ly d
id
you
arriv
e at
wor
k la
te o
r lea
ve
early
”
5-po
int s
cale
ratin
g ho
w
ofte
n th
e be
havi
or o
r fe
elin
g or
att
itude
has
bee
n m
anife
sted
dur
ing
the
past
w
eek:
0=n
ever
,1=r
arel
y,
2=so
met
imes
, 3=o
ften
4=
alm
ost a
lway
s Re
call
perio
d: p
ast w
eek
Tota
l sco
re ra
nges
from
0
(bes
t pos
sibl
e sc
ore)
to 1
00
(wor
st p
ossi
ble
scor
e)
“a b
rief s
elf-r
epor
t qu
estio
nnai
re”
Wor
k Li
mita
tions
Q
uest
ionn
aire
(W
LQ).
Lern
er e
t al.,
20
01
[36,
37]
To m
easu
re th
e de
gree
to
whi
ch c
hron
ic h
ealth
pro
blem
s in
terf
ere
with
the
abili
ty
to p
erfo
rm jo
b ro
les (
on a
de
man
d-le
vel).
Mea
surin
g th
e on
-the
-job
impa
ct if
chr
onic
he
alth
pro
blem
s and
/or
trea
tmen
t (“w
ork
limita
tions
”).
It ca
n be
use
d to
iden
tify
both
th
e m
agni
tude
and
type
of
impa
ct th
at h
ealth
pro
blem
s ar
e ha
ving
in th
e w
orkp
lace
. (E
mpl
oyed
indi
vidu
als w
ith)
chro
nic
heal
th p
robl
ems i
n se
vera
l diff
eren
t job
s/w
ork
cond
ition
s
4 do
mai
ns: t
ime
sche
dulin
g de
man
ds (5
item
s); p
hysi
cal
dem
ands
(6 it
ems)
; men
tal-
inte
rper
sona
l dem
ands
(9
item
s); o
utpu
t dem
ands
(5
item
s): t
otal
25
item
s. Ex
ampl
e ite
m: “
In th
e pa
st
two
wee
ks, h
ow m
uch
of th
e tim
e di
d yo
ur p
hysi
cal h
ealth
or
em
otio
nal p
robl
ems
mak
e it
diffi
cult
for y
ou to
stic
k to
a
rout
ine
or s
ched
ule?
”
5-po
int r
atin
g sc
ale:
0=
all o
f the
tim
e (1
00%
) 1=a
gr
eat d
eal o
f the
tim
e 2=
som
e of
the
time
(~50
%) 3
=a s
light
bi
t of t
he ti
me
4=no
ne o
f the
tim
e (0
%) E
xtra
opt
ion:
“not
ap
plic
able
to m
y jo
b”
Reca
ll pe
riod:
pas
t 2 w
eeks
is
reco
mm
ende
d, b
ut 4
wee
ks
also
allo
wed
Tota
l sco
res
are
com
pute
d as
the
mea
n of
the
non-
m
issi
ng re
spon
ses
and
are
conv
erte
d to
0 (n
ot
limite
d) to
100
(lim
ited
all o
f the
tim
e) (“
not
appl
icab
le to
my
job”
is
scor
ed a
s m
issi
ng).
“Eas
y se
lf-re
port
”
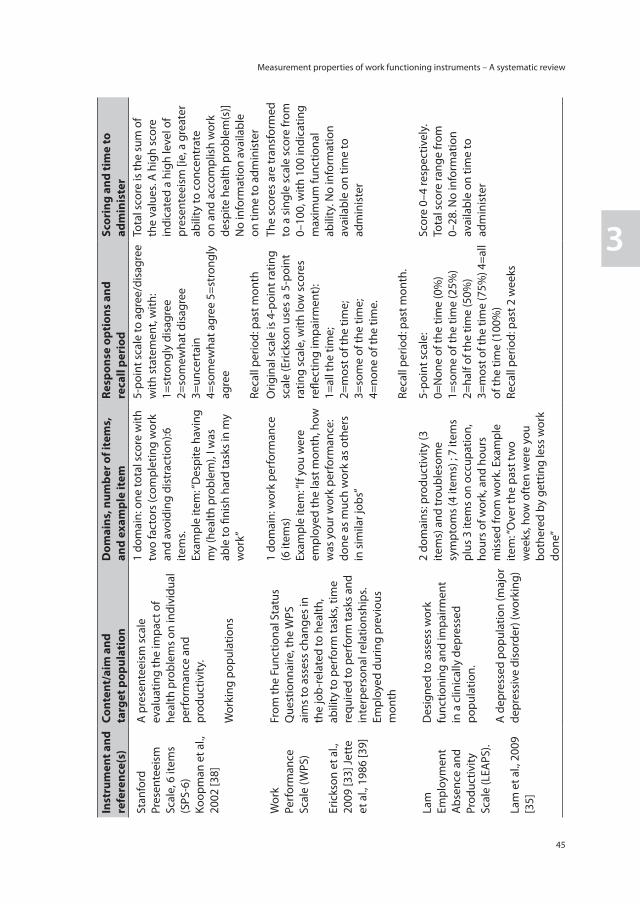
Measurement properties of work functioning instruments – A systematic review
45
3
Inst
rum
ent a
nd
refe
renc
e(s)
Cont
ent/
aim
and
ta
rget
pop
ulat
ion
Dom
ains
, num
ber o
f ite
ms,
an
d ex
ampl
e it
emRe
spon
se o
ptio
ns a
nd
reca
ll pe
riod
Scor
ing
and
tim
e to
ad
min
iste
r
Stan
ford
Pr
esen
teei
sm
Scal
e, 6
item
s (S
PS-6
)Ko
opm
an e
t al.,
20
02 [3
8]
A p
rese
ntee
ism
sca
le
eval
uatin
g th
e im
pact
of
heal
th p
robl
ems
on in
divi
dual
pe
rfor
man
ce a
nd
prod
uctiv
ity.
Wor
king
pop
ulat
ions
1 do
mai
n: o
ne to
tal s
core
with
tw
o fa
ctor
s (c
ompl
etin
g w
ork
and
avoi
ding
dis
trac
tion)
:6
item
s.
Exam
ple
item
: “D
espi
te h
avin
g m
y (h
ealth
pro
blem
), I w
as
able
to fi
nish
har
d ta
sks
in m
y w
ork”
5-po
int s
cale
to a
gree
/dis
agre
e w
ith s
tate
men
t, w
ith:
1=st
rong
ly d
isag
ree
2=so
mew
hat d
isag
ree
3=un
cert
ain
4=so
mew
hat a
gree
5=s
tron
gly
agre
e
Reca
ll pe
riod:
pas
t mon
th
Tota
l sco
re is
the
sum
of
the
valu
es. A
hig
h sc
ore
indi
cate
d a
high
leve
l of
pres
ente
eism
[ie,
a g
reat
er
abili
ty to
con
cent
rate
on
and
acc
ompl
ish
wor
k de
spite
hea
lth p
robl
em(s
)] N
o in
form
atio
n av
aila
ble
on ti
me
to a
dmin
iste
r
Wor
k Pe
rfor
man
ce
Scal
e (W
PS)
Eric
kson
et a
l.,
2009
[33]
Jett
e et
al.,
198
6 [3
9]
From
the
Func
tiona
l Sta
tus
Que
stio
nnai
re, t
he W
PS
aim
s to
ass
ess
chan
ges
in
the
job-
rela
ted
to h
ealth
, ab
ility
to p
erfo
rm ta
sks,
time
requ
ired
to p
erfo
rm ta
sks
and
inte
rper
sona
l rel
atio
nshi
ps.
Empl
oyed
dur
ing
prev
ious
m
onth
1 do
mai
n: w
ork
perf
orm
ance
(6
item
s)
Exam
ple
item
: “If
you
wer
e em
ploy
ed th
e la
st m
onth
, how
w
as y
our w
ork
perf
orm
ance
: do
ne a
s m
uch
wor
k as
oth
ers
in s
imila
r job
s”
Orig
inal
sca
le is
4-p
oint
ratin
g sc
ale
(Eric
kson
use
s a
5-po
int
ratin
g sc
ale,
with
low
sco
res
refle
ctin
g im
pairm
ent)
: 1=
all t
he ti
me;
2=
mos
t of t
he ti
me;
3=
som
e of
the
time;
4=
none
of t
he ti
me.
Re
call
perio
d: p
ast m
onth
.
The
scor
es a
re tr
ansf
orm
ed
to a
sin
gle
scal
e sc
ore
from
0–
100,
with
100
indi
catin
g m
axim
um fu
nctio
nal
abili
ty. N
o in
form
atio
n av
aila
ble
on ti
me
to
adm
inis
ter
Lam
Em
ploy
men
t A
bsen
ce a
nd
Prod
uctiv
ity
Scal
e (L
EAPS
).
Lam
et a
l., 2
009
[35]
Des
igne
d to
ass
ess
wor
k
func
tioni
ng a
nd im
pairm
ent
in a
clin
ical
ly d
epre
ssed
po
pula
tion.
A
dep
ress
ed p
opul
atio
n (m
ajor
de
pres
sive
dis
orde
r) (w
orki
ng)
2 do
mai
ns: p
rodu
ctiv
ity (3
ite
ms)
and
trou
bles
ome
sym
ptom
s (4
item
s) ;
7 ite
ms
plus
3 it
ems
on o
ccup
atio
n,
hour
s of
wor
k, a
nd h
ours
m
isse
d fr
om w
ork.
Exa
mpl
e ite
m: “
Ove
r the
pas
t tw
o w
eeks
, how
oft
en w
ere
you
both
ered
by
gett
ing
less
wor
k do
ne”
5-po
int s
cale
: 0=
Non
e of
the
time
(0%
) 1=
som
e of
the
time
(25%
) 2=
half
of th
e tim
e (5
0%)
3=m
ost o
f the
tim
e (7
5%) 4
=all
of th
e tim
e (1
00%
)Re
call
perio
d: p
ast 2
wee
ks
Scor
e 0–
4 re
spec
tivel
y.
Tota
l sco
re ra
nge
from
0–
28. N
o in
form
atio
n av
aila
ble
on ti
me
to
adm
inis
ter
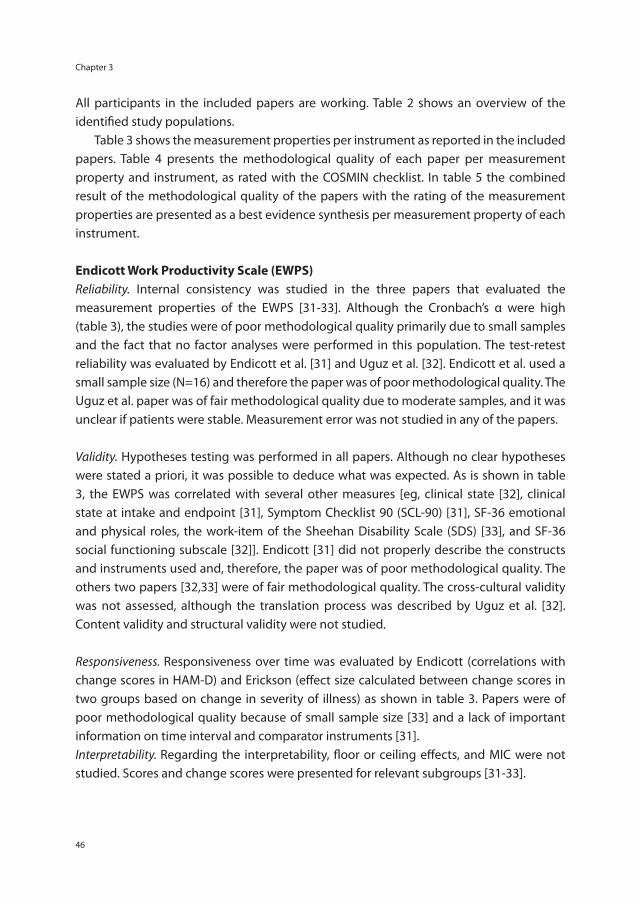
Chapter 3
46
All participants in the included papers are working. Table 2 shows an overview of the identified study populations. Table 3 shows the measurement properties per instrument as reported in the included papers. Table 4 presents the methodological quality of each paper per measurement property and instrument, as rated with the COSMIN checklist. In table 5 the combined result of the methodological quality of the papers with the rating of the measurement properties are presented as a best evidence synthesis per measurement property of each instrument.
Endicott Work Productivity Scale (EWPS)Reliability. Internal consistency was studied in the three papers that evaluated the measurement properties of the EWPS [31-33]. Although the Cronbach’s α were high (table 3), the studies were of poor methodological quality primarily due to small samples and the fact that no factor analyses were performed in this population. The test-retest reliability was evaluated by Endicott et al. [31] and Uguz et al. [32]. Endicott et al. used a small sample size (N=16) and therefore the paper was of poor methodological quality. The Uguz et al. paper was of fair methodological quality due to moderate samples, and it was unclear if patients were stable. Measurement error was not studied in any of the papers.
Validity. Hypotheses testing was performed in all papers. Although no clear hypotheses were stated a priori, it was possible to deduce what was expected. As is shown in table 3, the EWPS was correlated with several other measures [eg, clinical state [32], clinical state at intake and endpoint [31], Symptom Checklist 90 (SCL-90) [31], SF-36 emotional and physical roles, the work-item of the Sheehan Disability Scale (SDS) [33], and SF-36 social functioning subscale [32]]. Endicott [31] did not properly describe the constructs and instruments used and, therefore, the paper was of poor methodological quality. The others two papers [32,33] were of fair methodological quality. The cross-cultural validity was not assessed, although the translation process was described by Uguz et al. [32]. Content validity and structural validity were not studied.
Responsiveness. Responsiveness over time was evaluated by Endicott (correlations with change scores in HAM-D) and Erickson (effect size calculated between change scores in two groups based on change in severity of illness) as shown in table 3. Papers were of poor methodological quality because of small sample size [33] and a lack of important information on time interval and comparator instruments [31].Interpretability. Regarding the interpretability, floor or ceiling effects, and MIC were not studied. Scores and change scores were presented for relevant subgroups [31-33].

Measurement properties of work functioning instruments – A systematic review
47
3
Best evidence synthesis. The evidence synthesis for the EWPS (table 5) resulted in unknown evidence (?) for internal consistency; unknown evidence (?) for reliability (test-retest); limited positive evidence (+) for hypotheses testing (two studies of fair methodological quality and 75% of the results are in accordance with hypotheses); and unknown evidence (?) for responsiveness (two studies of poor methodological quality and one with limited positive evidence).
Work Limitations Questionnaire (WLQ)Reliability. Internal consistency was studied by Sanderson et al. [34] and Erickson et al. [33]. Although Cronbach’s α’s were high in both studies (table 3), Sanderson et al. reported no information on performed factor analysis and therefore the paper was of poor methodological quality. The Erickson et al. paper was of fair methodological quality because the authors only refer to a study that performed factor analyses. Test-retest and measurement error were not studied in either paper.
Validity. Both studies performed hypotheses testing. Although Erickson did not state clear a-priori hypotheses, it was possible to deduce what was expected. As is shown in Table 3, the WLQ was correlated to several other measures [eg, SF-36 emotional and physical roles, the work-item of the SDS [33]] and comparisons between severity groups were made [33,34]. Sanderson used small patient groups for the comparison and therefore the paper was of poor methodological quality. Erickson reported little information on the expectations and comparator instruments and therefore the paper was of fair methodological quality. The content validity, structural validity and cross-cultural validity were not studied.
Responsiveness. To evaluate responsiveness, Sanderson et al. compared the WLQ scores by symptom status at baseline, 6 months, and change scores between four groups. Erickson et al. calculated effect sizes between change scores in two groups based on change in severity of illness (table 3).
Interpretability. Neither floor nor ceiling effects nor MIC were studied; however scores and change scores were presented for relevant subgroups [33,34].
Best evidence synthesis. Evidence synthesis of the WLQ (table 5) resulted in limited positive evidence (+) for internal consistency (two studies with poor and fair methodological quality and Cronbach’s α >0.80); limited positive evidence (+) for hypotheses testing (two studies with poor and fair methodological quality and 75% of the results were in accordance with hypotheses); and unknown evidence (?) for responsiveness based on two studies with poor methodological quality.
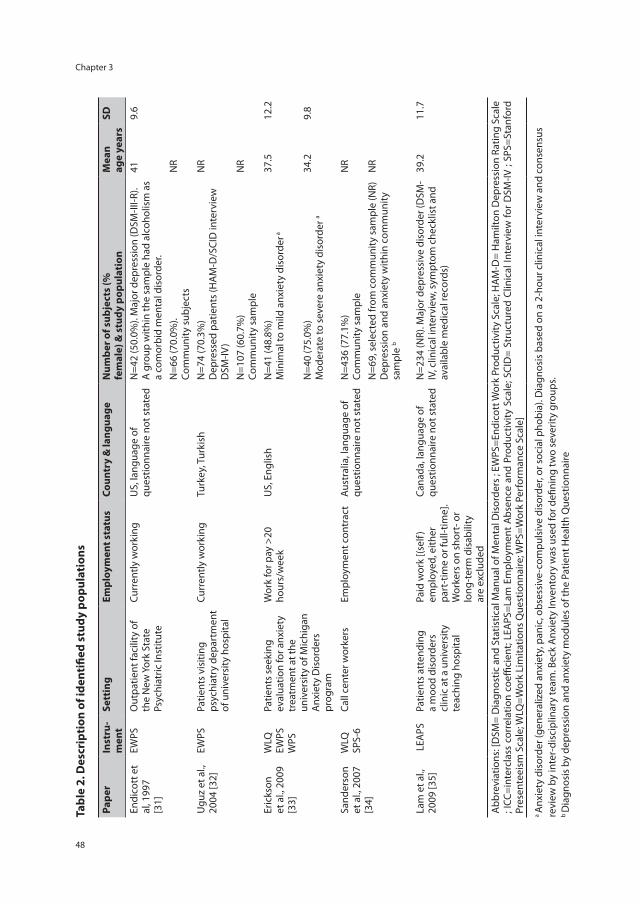
Chapter 3
48
Tabl
e 2.
Des
crip
tion
of i
dent
ified
stu
dy p
opul
atio
ns
Pape
r In
stru
-m
ent
Sett
ing
Empl
oym
ent s
tatu
sCo
untr
y &
lang
uage
Num
ber o
f sub
ject
s (%
fe
mal
e) &
stu
dy p
opul
atio
nM
ean
age
year
s SD
Endi
cott
et
al, 1
997
[31]
EWPS
Out
patie
nt fa
cilit
y of
th
e N
ew Y
ork
Stat
e Ps
ychi
atric
Inst
itute
Curr
ently
wor
king
US,
lang
uage
of
ques
tionn
aire
not
sta
ted
N=4
2 (5
0.0%
). M
ajor
dep
ress
ion
(DSM
-III-R
). A
gro
up w
ithin
the
sam
ple
had
alco
holis
m a
s a
com
orbi
d m
enta
l dis
orde
r.
41
9.6
N=6
6 (7
0.0%
).
Com
mun
ity s
ubje
cts
NR
Ugu
z et
al.,
20
04 [3
2]EW
PSPa
tient
s vi
sitin
g ps
ychi
atry
dep
artm
ent
of u
nive
rsity
hos
pita
l
Curr
ently
wor
king
Turk
ey, T
urki
shN
=74
(70.
3%)
Dep
ress
ed p
atie
nts
(HA
M-D
/SCI
D in
terv
iew
D
SM-IV
)
NR
N=1
07 (6
0.7%
) Co
mm
unity
sam
ple
NR
Eric
kson
et
al.,
200
9 [3
3]
WLQ
EW
PS
WPS
Patie
nts
seek
ing
eval
uatio
n fo
r anx
iety
tr
eatm
ent a
t the
un
iver
sity
of M
ichi
gan
Anx
iety
Dis
orde
rs
prog
ram
Wor
k fo
r pay
>20
ho
urs/
wee
kU
S, E
nglis
hN
=41
(48.
8%)
Min
imal
to m
ild a
nxie
ty d
isor
der a
37.5
12
.2
N=4
0 (7
5.0%
) M
oder
ate
to s
ever
e an
xiet
y di
sord
er a
34.2
9.
8
Sand
erso
n et
al.,
200
7 [3
4]
WLQ
SP
S-6
Call
cent
er w
orke
rsEm
ploy
men
t con
trac
tAu
stra
lia, l
angu
age
of
ques
tionn
aire
not
sta
ted
N=4
36 (7
7.1%
) Co
mm
unity
sam
ple
NR
N=6
9, s
elec
ted
from
com
mun
ity s
ampl
e (N
R)
Dep
ress
ion
and
anxi
ety
with
in c
omm
unity
sa
mpl
e b
NR
Lam
et a
l.,
2009
[35]
LEA
PSPa
tient
s at
tend
ing
a m
ood
diso
rder
s cl
inic
at a
uni
vers
ity
teac
hing
hos
pita
l
Paid
wor
k [(s
elf)
empl
oyed
, eith
er
part
-tim
e or
full-
time]
. W
orke
rs o
n sh
ort-
or
long
-ter
m d
isab
ility
ar
e ex
clud
ed
Cana
da, l
angu
age
of
ques
tionn
aire
not
sta
ted
N=2
34 (N
R). M
ajor
dep
ress
ive
diso
rder
(DSM
-IV
, clin
ical
inte
rvie
w, s
ympt
om c
heck
list a
nd
avai
labl
e m
edic
al re
cord
s)
39.2
11
.7
Abb
revi
atio
ns: [
DSM
= D
iagn
ostic
and
Sta
tistic
al M
anua
l of M
enta
l Dis
orde
rs ;
EWPS
=End
icot
t Wor
k Pr
oduc
tivity
Sca
le; H
AM
-D=
Ham
ilton
Dep
ress
ion
Ratin
g Sc
ale
; ICC
=int
ercl
ass
corr
elat
ion
coeffi
cien
t; LE
APS
=Lam
Em
ploy
men
t A
bsen
ce a
nd P
rodu
ctiv
ity S
cale
; SCI
D=
Stru
ctur
ed C
linic
al In
terv
iew
for
DSM
-IV ;
SPS=
Stan
ford
Pr
esen
teei
sm S
cale
; WLQ
=Wor
k Li
mita
tions
Que
stio
nnai
re; W
PS=W
ork
Perf
orm
ance
Sca
le]
a A
nxie
ty d
isor
der (
gene
raliz
ed a
nxie
ty, p
anic
, obs
essi
ve-c
ompu
lsiv
e di
sord
er, o
r soc
ial p
hobi
a). D
iagn
osis
bas
ed o
n a
2-ho
ur c
linic
al in
terv
iew
and
con
sens
us
revi
ew b
y in
ter-
disc
iplin
ary
team
. Bec
k A
nxie
ty In
vent
ory
was
use
d fo
r defi
ning
two
seve
rity
grou
ps.
b D
iagn
osis
by
depr
essi
on a
nd a
nxie
ty m
odul
es o
f the
Pat
ient
Hea
lth Q
uest
ionn
aire
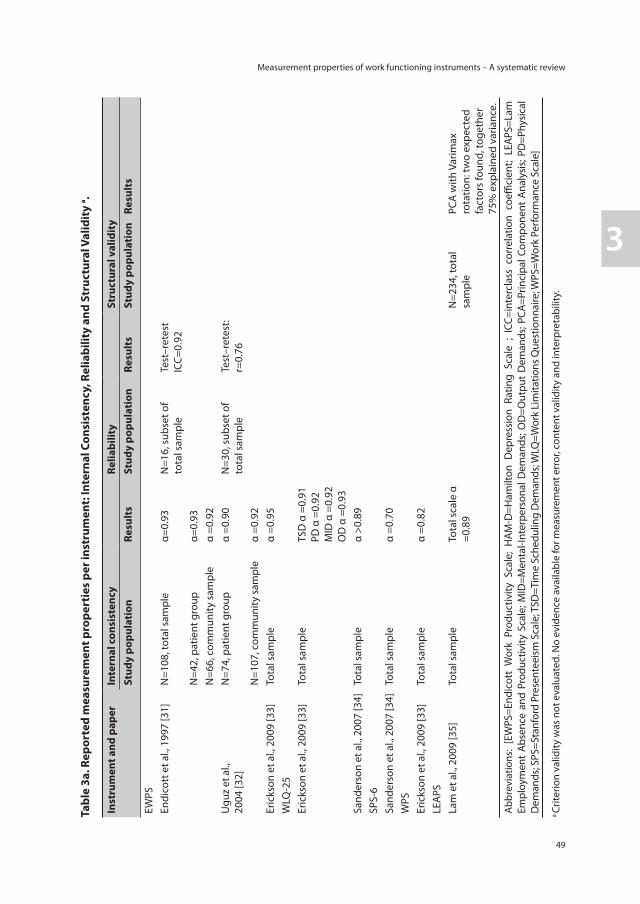
Measurement properties of work functioning instruments – A systematic review
49
3
Tabl
e 3a
. Rep
orte
d m
easu
rem
ent p
rope
rtie
s pe
r ins
trum
ent:
Inte
rnal
Con
sist
ency
, Rel
iabi
lity
and
Stru
ctur
al V
alid
ity
a .
Inst
rum
ent a
nd p
aper
Inte
rnal
con
sist
ency
Relia
bilit
ySt
ruct
ural
val
idit
ySt
udy
popu
lati
onRe
sult
s St
udy
popu
lati
onRe
sult
s St
udy
popu
lati
onRe
sult
s
EWPS
En
dico
tt e
t al.,
199
7 [3
1]N
=108
, tot
al s
ampl
eα=
0.93
N=1
6, s
ubse
t of
tota
l sam
ple
Test
–ret
est
ICC=
0.92
N=4
2, p
atie
nt g
roup
α=
0.93
N=6
6, c
omm
unity
sam
ple
α =0
.92
Ugu
z et
al.,
20
04 [3
2]N
=74,
pat
ient
gro
up
α =0
.90
N=3
0, s
ubse
t of
tota
l sam
ple
Test
–ret
est:
r=0.
76N
=107
, com
mun
ity s
ampl
eα
=0.9
2Er
icks
on e
t al.,
200
9 [3
3]To
tal s
ampl
eα
=0.9
5W
LQ-2
5 Er
icks
on e
t al.,
200
9 [3
3]To
tal s
ampl
eTS
D α
=0.
91
PD α
=0.
92
MID
α =
0.92
O
D α
=0.
93Sa
nder
son
et a
l., 2
007
[34]
Tota
l sam
ple
α >0
.89
SPS-
6 Sa
nder
son
et a
l., 2
007
[34]
Tota
l sam
ple
α =0
.70
WPS
Er
icks
on e
t al.,
200
9 [3
3]To
tal s
ampl
eα
=0.8
2LE
APS
Lam
et a
l., 2
009
[35]
Tota
l sam
ple
Tota
l sca
le α
=0
.89
N=2
34, t
otal
sa
mpl
ePC
A w
ith V
arim
ax
rota
tion:
two
expe
cted
fa
ctor
s fo
und,
toge
ther
75
% e
xpla
ined
var
ianc
e.A
bbre
viat
ions
: [E
WPS
=End
icot
t W
ork
Prod
uctiv
ity S
cale
; H
AM-D
=Ham
ilton
Dep
ress
ion
Ratin
g Sc
ale
; IC
C=in
terc
lass
cor
rela
tion
coeffi
cien
t; LE
APS
=Lam
Em
ploy
men
t Ab
senc
e an
d Pr
oduc
tivity
Sca
le; M
ID=M
enta
l-Int
erpe
rson
al D
eman
ds; O
D=O
utpu
t D
eman
ds; P
CA=P
rinci
pal C
ompo
nent
Ana
lysi
s; PD
=Phy
sica
l D
eman
ds; S
PS=S
tanf
ord
Pres
ente
eism
Sca
le; T
SD=T
ime
Sche
dulin
g D
eman
ds; W
LQ=W
ork
Lim
itatio
ns Q
uest
ionn
aire
; WPS
=Wor
k Pe
rfor
man
ce S
cale
]
a Cr
iterio
n va
lidity
was
not
eva
luat
ed. N
o ev
iden
ce a
vaila
ble
for m
easu
rem
ent e
rror
, con
tent
val
idity
and
inte
rpre
tabi
lity.

Chapter 3
50
Tabl
e 3b
. Rep
orte
d m
easu
rem
ent p
rope
rtie
s per
inst
rum
ent:
Hyp
othe
ses T
estin
g an
d Re
spon
sive
ness
a.
Inst
rum
ent
and
pape
rH
ypot
hese
s te
stin
gRe
spon
sive
ness
Stud
y po
pula
tion
Resu
lts
Stud
y po
pula
tion
Resu
lts
EWPS
Endi
cott
et a
l.,
1997
[31]
N=4
2, m
ajor
de
pres
sion
gro
upIn
take
: Cor
rela
tions
with
HA
M-D
(r=0
.27)
and
Glo
bal C
linic
al In
dex
of
seve
rity
(r=0
.42)
Endp
oint
: Cor
rela
tions
with
HA
M-D
(r=0
.61)
, GCI
(r=0
.46)
, and
SCL
-90
(r=0
.50)
Patie
nt g
roup
Corr
elat
ions
cha
nge
scor
e w
ith H
AM
-D
r=0.
29
N=6
6, c
omm
unity
sam
ple
Inta
ke: C
orre
latio
ns w
ith Z
imm
erm
an to
tal s
core
(r=0
.57)
and
SCL
-90
(r=0
.55)
Tota
l sam
ple
Patie
nts
had
high
er E
WPS
sco
res
than
com
mun
ity s
ampl
e at
bot
h in
take
and
end
poin
t.
Ugu
z et
al.,
20
04 [3
2]N
=74,
dep
ress
ion
grou
pCo
mpa
rison
of s
core
s w
ith H
amilt
on d
epre
ssio
n sc
ale
(r=0
.52)
, SF-
36
soci
al fu
nctio
ning
sub
scal
e (r
=-0.
43),
clin
ical
glo
bal i
mpr
essi
on
seve
rity
scal
e (r
=0.6
4)
N=1
81, t
otal
sam
ple
(dep
ress
ion
grou
p an
d co
ntro
l gro
up)
Sign
ifica
nt d
iffer
ence
bet
wee
n pa
tient
gro
up a
nd c
ontr
ol g
roup
(m
ean
diffe
renc
e 24
poi
nts)
Eric
kson
et a
l.,
2009
[33]
N=7
6, a
nxie
ty
diso
rder
gro
upCo
rrel
atio
n (r
) with
SF-
36 ‘r
ole-
emot
iona
l’: -0
.63,
SF
-36
‘role
-phy
sica
l’: -0
.23
and
SDS-
wor
k ite
m 0
.63
N=3
8 Pe
rcei
ved
impr
oved
se
verit
y of
illn
ess
N=1
2 Pe
rcei
ved
no c
hang
e or
w
orse
ning
sev
erity
of i
llnes
sTw
o ch
ange
in s
ever
ity o
f ill
ness
gro
ups b
ased
on
glob
al
impr
ovem
ent s
cale
(CG
I-I)
Gro
up c
ompa
rison
s of
ch
ange
sco
res
over
12
wee
k: m
ean
chan
ge/S
D,
P-va
lue:
No
sign
ifica
nt
diffe
renc
es. E
ffect
siz
e 0.
71.
N=4
1 m
inim
al-t
o-m
ild a
nxie
ty; N
=40
mod
erat
e-to
-sev
ere
anxi
ety.
Tw
o se
verit
y of
illn
ess
grou
ps b
ased
on
Beck
A
nxie
ty In
vent
ory
Gro
up c
ompa
rison
s on
mea
n/SD
, P-v
alue
and
effe
ct s
ize:
hig
her
scor
es fo
r sev
ere
anxi
ety
grou
p,
effec
t siz
e -0
.45.
WLQ
-25
Eric
kson
et a
l.,
2009
[33]
N=7
6, a
nxie
ty
diso
rder
gro
upCo
rrel
atio
n (r
) of s
ubsc
ales
with
: (i)
SF-
36 ro
le-p
hysi
cal:
TSD
=-0.
24, O
D=-
0.26
, PD
=-0.
19, M
ID=-
0.24
; (ii
) SF-
36 ro
le-e
mot
iona
l: TS
D=-
0.69
, OD
=-0.
65,
PD=-
0.23
, MID
=-0.
74;
(iii)
SDS-
wor
k ite
m: T
SD=0
.56,
OD
=0.6
2, P
D=0
.16,
MID
=0.6
5
N=3
8 Pe
rcei
ved
impr
oved
se
verit
y of
illn
ess
N=1
2 Pe
rcei
ved
no c
hang
e or
w
orse
ning
sev
erity
of i
llnes
sTw
o ch
ange
in s
ever
ity o
f ill
ness
gro
ups
base
d on
G
loba
l Im
prov
emen
t Sca
le
(CG
I-I)
Per s
ubsc
ale
grou
p co
mpa
rison
s of
cha
nge
scor
es o
ver 1
2 w
eek:
m
ean
chan
ge/S
D, P
va
lue:
Mix
ed re
sults
. Eff
ect s
izes
:TS
D=-
0.35
O
D=-
0.86
PD
=-0.
01
MID
=-1.
03

Measurement properties of work functioning instruments – A systematic review
51
3
Inst
rum
ent
and
pape
rH
ypot
hese
s te
stin
gRe
spon
sive
ness
Stud
y po
pula
tion
Resu
lts
Stud
y po
pula
tion
Resu
lts
Sand
erso
n et
al
., 20
07 [3
4]N
=363
: No
de
pres
sive
syn
drom
eN
=69:
Any
de
pres
sive
syn
drom
eN
=24:
Min
or
depr
essi
ve s
yndr
ome
N=2
5: M
ajor
de
pres
sive
syn
drom
e
Per s
ubsc
ale
grou
p co
mpa
rison
s: n
o de
pres
sive
sy
ndro
me,
min
or d
epre
ssiv
e sy
ndro
me,
and
maj
or
depr
essi
ve s
yndr
ome
on m
ean
and
SD.
TSD
: (i)
any
vers
us n
o sy
ndro
me;
B=1
7.4,
SE=
2.6,
P<0
.000
1. G
roup
w
ithou
t dep
ress
ion/
anxi
ety
had
lo
wer
mea
n th
an g
roup
with
any
(les
s lim
itatio
ns);
(ii
) min
or v
ersu
s no
syn
drom
e; B
=12.
3, S
E= 3
.8 P
=0.0
10. G
roup
w
ithou
t dep
ress
ion/
anxi
ety
had
low
er m
ean
than
gro
up w
ith m
inor
; (ii
i) m
ajor
ver
sus
no s
yndr
ome;
B=1
3.6,
SE=
4.8,
P=0
.019
. Gro
up
with
out d
epre
ssio
n/an
xiet
y ha
d lo
wer
mea
n th
an g
roup
with
min
orO
D: (
i) an
y ve
rsus
no
synd
rom
e; B
=18.
0, S
E=2.
8, P
<0.0
001.
Gro
up
with
out d
epre
ssio
n/an
xiet
y ha
d lo
wer
mea
n th
an g
roup
with
any
; (ii)
m
inor
ver
sus n
o sy
ndro
me;
B=1
2.0,
SE=
3.1,
P=0
.004
. Gro
up w
ithou
t de
pres
sion/
anxi
ety
had
low
er m
ean
than
gro
up w
ith m
inor
; (iii
) m
ajor
ver
sus n
o sy
ndro
me;
B=1
6.6,
SE=
3.8,
P=0
.002
. Gro
up w
ithou
t de
pres
sion/
anxi
ety
had
low
er m
ean
than
gro
up w
ith m
inor
PD: (
i) An
y ve
rsus
no
synd
rom
e; B
=12.
5, S
E=1.
2, P
<0.0
001.
Gro
up
with
out d
epre
ssio
n/an
xiet
y ha
d lo
wer
mea
n th
an g
roup
with
any
; (ii)
m
inor
ver
sus n
o sy
ndro
me;
B=1
4.5,
SE=
3.3
P=0.
002.
Gro
up w
ithou
t de
pres
sion/
anxi
ety
had
low
er m
ean
than
gro
up w
ith m
inor
; (iii
) maj
or
vers
us n
o sy
ndro
me;
B=-
4.2,
SE=
3.0,
P=0
.20.
Gro
up w
ithou
t dep
ress
ion/
anxi
ety
had
low
er m
ean
than
gro
up w
ith m
inor
MID
: (i)
any
vers
us n
o sy
ndro
me;
B=1
7.7,
SE=
1.9,
P<0
.000
1. G
roup
w
ithou
t dep
ress
ion/
anxi
ety
had
low
er m
ean
than
gro
up w
ith a
ny; (
ii)
min
or v
ersu
s no
synd
rom
e; B
=10.
5, S
E=2.
4, P
=0.0
02. G
roup
with
out
depr
essio
n/an
xiet
y ha
d lo
wer
mea
n th
an g
roup
with
min
or; (
iii)
maj
or v
ersu
s no
synd
rom
e; B
=17.
5, S
E=3.
6, P
=0.0
009.
Gro
up w
ithou
t de
pres
sion/
anxi
ety
had
low
er m
ean
than
gro
up w
ith m
inor
.
N=1
74: R
emai
ned
sym
ptom
fr
ee
N=2
1: O
nset
of s
yndr
ome
at
6 m
onth
sN
=20
Synd
rom
e re
mitt
ed a
t 6
mon
ths
N=1
6 Sy
ndro
me
pers
iste
d at
si
x m
onth
s
Per s
ubsc
ale
grou
p
com
paris
ons
in
pres
ente
eism
sc
ores
(mea
n/sd
) by
depr
essi
on/a
nxie
ty
synd
rom
e st
atus
at
base
line,
6 m
onth
s an
d ch
ange
sco
re:
Mix
ed re
sults
, ne
vert
hele
ss m
ost a
re
in th
e
expe
cted
dire
ctio
n.
N=4
27: t
otal
sa
mpl
e (c
all
cent
re w
orke
rs)
A li
near
regr
essi
on m
odel
is a
pplie
d: R
elat
ions
hips
of s
ubsc
ales
with
sp
ecifi
c D
SM-IV
dep
ress
ion
sym
ptom
s at
bas
elin
e ev
alua
ted
in a
re
gres
sion
mod
el: m
ixed
resu
lts
SPS-
6
Sand
erso
n et
al
., 20
07 [3
4]N
=363
: No
depr
essi
ve s
yndr
ome
N=6
9: A
ny d
epre
ssiv
e sy
ndro
me
N=2
4: M
inor
dep
ress
ive
synd
rom
eN
=25:
Maj
or d
epre
ssiv
e sy
ndro
me
Gro
up c
ompa
rison
s: n
o de
pres
sive
syn
drom
e, m
inor
dep
ress
ive
synd
rom
e, a
nd m
ajor
dep
ress
ive
synd
rom
e ar
e on
mea
n an
d SD
. (i)
any
vers
us n
o sy
ndro
me;
B=-
3.8,
SE=
0.4,
P<0
.000
1. G
roup
with
out
depr
essi
on/a
nxie
ty h
ad h
ighe
r mea
n th
an g
roup
with
any
(bet
ter
func
tioni
ng; (
ii) m
inor
ver
sus
no s
yndr
ome;
B=-
3.1,
SE=
0.8,
P=0
.004
. G
roup
with
out d
epre
ssio
n/an
xiet
y ha
d hi
gher
mea
n th
an g
roup
w
ith m
inor
; (iii
) maj
or v
ersu
s no
syn
drom
e; B
=-1.
1, S
E=0.
9, P
=0.2
5.
Gro
up w
ithou
t dep
ress
ion/
anxi
ety
had
high
er m
ean
than
gro
up
with
min
or.
N=1
74: R
emai
ned
sym
ptom
fr
ee
N=2
1: O
nset
of s
yndr
ome
at
6 m
onth
sN
=20
Synd
rom
e re
mitt
ed a
t 6
mon
ths
N=1
6 Sy
ndro
me
pers
iste
d at
si
x m
onth
s
Gro
up c
ompa
rison
s in
pr
esen
teei
sm s
core
s (m
ean/
SD) b
y de
pres
-si
on/a
nxie
ty s
yndr
ome
stat
us a
t bas
elin
e, 6
m
onth
s an
d ch
ange
sc
ore.
Alm
ost a
ll re
sults
ar
e in
the
expe
cted
di
rect
ion,
alth
ough
not
al
l lar
ge d
iffer
ence
s/si
g-ni
fican
t diff
eren
ces.
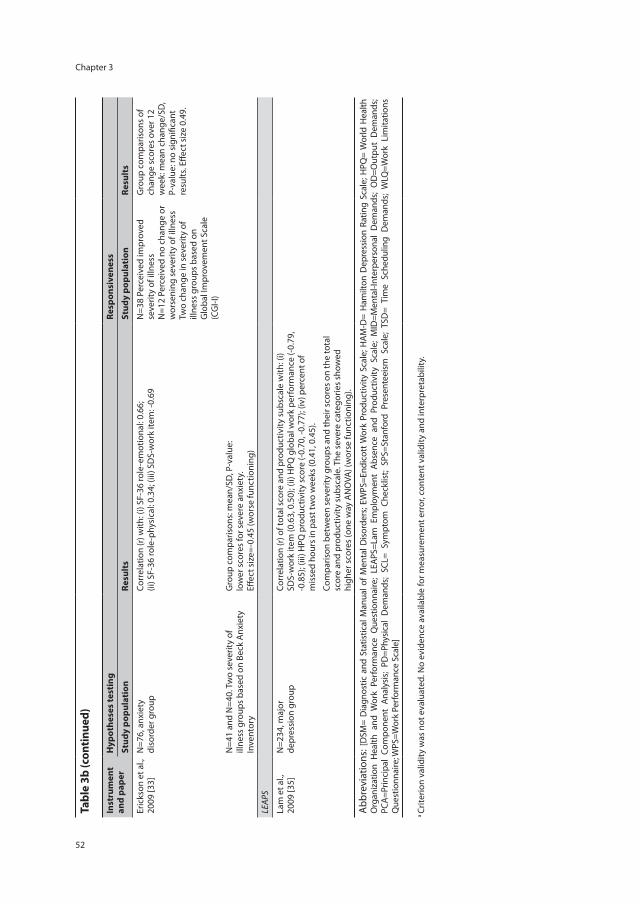
Chapter 3
52
Tabl
e 3b
(con
tinue
d)
Inst
rum
ent
and
pape
rH
ypot
hese
s te
stin
gRe
spon
sive
ness
Stud
y po
pula
tion
Resu
lts
Stud
y po
pula
tion
Resu
lts
Eric
kson
et a
l.,
2009
[33]
N=7
6, a
nxie
ty
diso
rder
gro
upCo
rrel
atio
n (r
) with
: (i)
SF-3
6 ro
le-e
mot
iona
l: 0.
66;
(ii) S
F-36
role
-phy
sica
l: 0.
34; (
iii) S
DS-
wor
k ite
m: -
0.69
N=3
8 Pe
rcei
ved
impr
oved
se
verit
y of
illn
ess
N=1
2 Pe
rcei
ved
no c
hang
e or
w
orse
ning
sev
erity
of i
llnes
sTw
o ch
ange
in s
ever
ity o
f ill
ness
gro
ups
base
d on
G
loba
l Im
prov
emen
t Sca
le
(CG
I-I)
Gro
up c
ompa
rison
s of
ch
ange
sco
res
over
12
wee
k: m
ean
chan
ge/S
D,
P-va
lue:
no
sign
ifica
nt
resu
lts. E
ffect
siz
e 0.
49.
N=4
1 an
d N
=40.
Tw
o se
verit
y of
ill
ness
gro
ups
base
d on
Bec
k A
nxie
ty
Inve
ntor
y
Gro
up c
ompa
rison
s: m
ean/
SD, P
-val
ue:
low
er s
core
s fo
r sev
ere
anxi
ety.
Eff
ect s
ize=
-0.4
5 (w
orse
func
tioni
ng)
LEA
PS
Lam
et a
l.,
2009
[35]
N=2
34, m
ajor
de
pres
sion
gro
upCo
rrel
atio
n (r
) of t
otal
sco
re a
nd p
rodu
ctiv
ity s
ubsc
ale
with
: (i)
SDS-
wor
k ite
m (0
.63,
0.5
0); (
ii) H
PQ g
loba
l wor
k pe
rfor
man
ce (-
0.79
, -0
.85)
; (iii
) HPQ
pro
duct
ivity
sco
re (-
0.70
, -0.
77);
(iv) p
erce
nt o
f m
isse
d ho
urs
in p
ast t
wo
wee
ks (0
.41,
0.4
5).
Com
paris
on b
etw
een
seve
rity
grou
ps a
nd th
eir s
core
s on
the
tota
l sc
ore
and
prod
uctiv
ity s
ubsc
ale.
The
sev
ere
cate
gorie
s sh
owed
hi
gher
sco
res
(one
way
AN
OVA
) (w
orse
func
tioni
ng).
Abb
revi
atio
ns: [
DSM
= D
iagn
ostic
and
Sta
tistic
al M
anua
l of M
enta
l Dis
orde
rs; E
WPS
=End
icot
t Wor
k Pr
oduc
tivity
Sca
le; H
AM-D
= H
amilt
on D
epre
ssio
n Ra
ting
Scal
e; H
PQ=
Wor
ld H
ealth
O
rgan
izat
ion
Hea
lth a
nd W
ork
Perf
orm
ance
Que
stio
nnai
re;
LEA
PS=L
am E
mpl
oym
ent
Abse
nce
and
Prod
uctiv
ity S
cale
; M
ID=M
enta
l-Int
erpe
rson
al D
eman
ds;
OD
=Out
put
Dem
ands
; PC
A=P
rinci
pal
Com
pone
nt A
naly
sis;
PD=P
hysi
cal
Dem
ands
; SC
L= S
ympt
om C
heck
list;
SPS=
Stan
ford
Pre
sent
eeis
m S
cale
; TS
D=
Tim
e Sc
hedu
ling
Dem
ands
; W
LQ=W
ork
Lim
itatio
ns
Que
stio
nnai
re; W
PS=W
ork
Perf
orm
ance
Sca
le]
a Cr
iterio
n va
lidity
was
not
eva
luat
ed. N
o ev
iden
ce a
vaila
ble
for m
easu
rem
ent e
rror
, con
tent
val
idity
and
inte
rpre
tabi
lity.
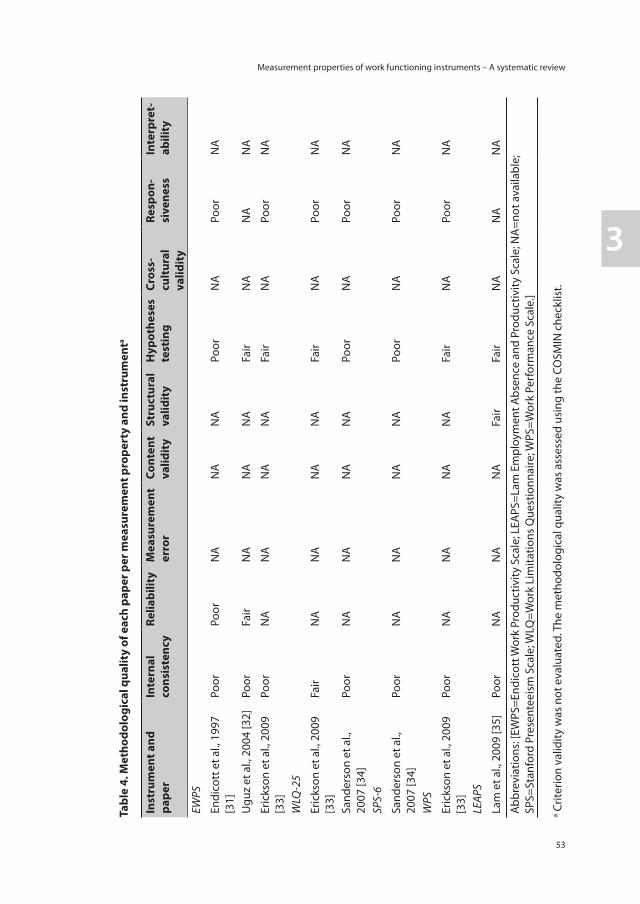
Measurement properties of work functioning instruments – A systematic review
53
3
Tabl
e 4.
Met
hodo
logi
cal q
ualit
y of
eac
h pa
per p
er m
easu
rem
ent p
rope
rty
and
inst
rum
enta
Inst
rum
ent a
nd
pape
rIn
tern
al
cons
iste
ncy
Relia
bilit
yM
easu
rem
ent
erro
rCo
nten
t va
lidit
ySt
ruct
ural
va
lidit
yH
ypot
hese
s te
stin
gCr
oss-
cult
ural
va
lidit
y
Resp
on-
sive
ness
Inte
rpre
t-ab
ility
EWPS
Endi
cott
et a
l., 1
997
[31]
Poor
Poor
NA
NA
NA
Poor
NA
Poor
NA
Ugu
z et
al.,
200
4 [3
2]Po
orFa
irN
AN
AN
AFa
irN
AN
AN
A
Eric
kson
et a
l., 2
009
[33]
Poor
NA
NA
NA
NA
Fair
NA
Poor
NA
WLQ
-25
Eric
kson
et a
l., 2
009
[33]
Fair
NA
NA
NA
NA
Fair
NA
Poor
NA
Sand
erso
n et
al.,
20
07 [3
4]Po
orN
AN
AN
AN
APo
orN
APo
orN
A
SPS-
6
Sand
erso
n et
al.,
20
07 [3
4]Po
orN
AN
AN
AN
APo
orN
APo
orN
A
WPS
Eric
kson
et a
l., 2
009
[33]
Poor
NA
NA
NA
NA
Fair
NA
Poor
NA
LEA
PS
Lam
et a
l., 2
009
[35]
Poor
NA
NA
NA
Fair
Fair
NA
NA
NA
Abb
revi
atio
ns: [
EWPS
=End
icot
t Wor
k Pr
oduc
tivity
Sca
le; L
EAPS
=Lam
Em
ploy
men
t Abs
ence
and
Pro
duct
ivity
Sca
le; N
A=n
ot a
vaila
ble;
SP
S=St
anfo
rd P
rese
ntee
ism
Sca
le; W
LQ=W
ork
Lim
itatio
ns Q
uest
ionn
aire
; WPS
=Wor
k Pe
rfor
man
ce S
cale
.]
a Crit
erio
n va
lidity
was
not
eva
luat
ed. T
he m
etho
dolo
gica
l qua
lity
was
ass
esse
d us
ing
the
COSM
IN c
heck
list.
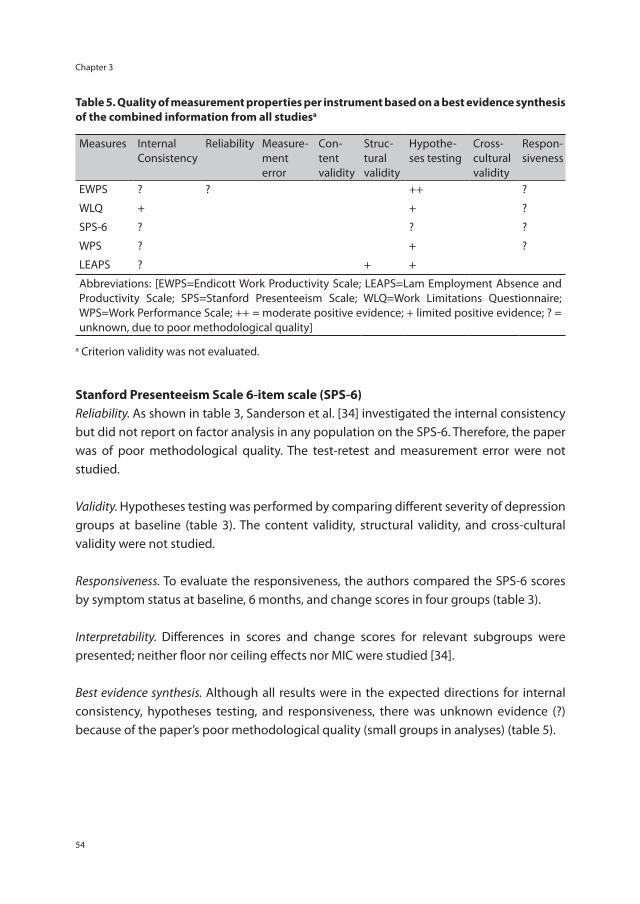
Chapter 3
54
Table 5. Quality of measurement properties per instrument based on a best evidence synthesis of the combined information from all studiesa
Measures Internal Consistency
Reliability Measure-ment error
Con-tent validity
Struc-tural validity
Hypothe-ses testing
Cross-cultural validity
Respon-siveness
EWPS ? ? ++ ?
WLQ + + ?
SPS-6 ? ? ?
WPS ? + ?
LEAPS ? + +
Abbreviations: [EWPS=Endicott Work Productivity Scale; LEAPS=Lam Employment Absence and Productivity Scale; SPS=Stanford Presenteeism Scale; WLQ=Work Limitations Questionnaire; WPS=Work Performance Scale; ++ = moderate positive evidence; + limited positive evidence; ? = unknown, due to poor methodological quality]
a Criterion validity was not evaluated.
Stanford Presenteeism Scale 6-item scale (SPS-6)Reliability. As shown in table 3, Sanderson et al. [34] investigated the internal consistency but did not report on factor analysis in any population on the SPS-6. Therefore, the paper was of poor methodological quality. The test-retest and measurement error were not studied.
Validity. Hypotheses testing was performed by comparing different severity of depression groups at baseline (table 3). The content validity, structural validity, and cross-cultural validity were not studied.
Responsiveness. To evaluate the responsiveness, the authors compared the SPS-6 scores by symptom status at baseline, 6 months, and change scores in four groups (table 3).
Interpretability. Differences in scores and change scores for relevant subgroups were presented; neither floor nor ceiling effects nor MIC were studied [34].
Best evidence synthesis. Although all results were in the expected directions for internal consistency, hypotheses testing, and responsiveness, there was unknown evidence (?) because of the paper’s poor methodological quality (small groups in analyses) (table 5).
Measurement properties of work functioning instruments – A systematic review
55
3
Work Performance Scale (WPS)Reliability. As shown in table 3, Erickson et al. [33] evaluated the internal consistency but did not report on factor analysis in any population on the WPS. Therefore, the paper was of poor methodological quality. The test-retest and measurement error were not studied.
Validity. Hypotheses testing was performed by correlating the WPS to several other measures (eg, SF-36 emotional and physical roles, the work-item of the SDS) and a comparison between two severity groups was made (table 3). No clear a priori hypotheses were stated and little information was reported on comparator instruments. Therefore, the paper was of fair methodological quality. The content validity, structural validity, and cross-cultural validity were not studied.
Responsiveness. The responsiveness was evaluated by an effect size between change scores in two groups based on change in severity of illness (table 3).
Interpretability. Differences in scores and change scores for relevant subgroups were presented; no floor or ceiling effects and MIC were studied [33].
Best evidence synthesis. Because of the poor methodological quality (small sample sizes), there was unknown evidence (?) for the internal consistency and responsiveness of the WPS (table 5). For hypotheses testing limited positive evidence (+) was found.
Lam Employment Absence and Productivity Scale (LEAPS)Reliability. Lam et al. [35] presented a new instrument, LEAPS, and investigated the internal consistency of the total scale (table 3). However, no Cronbach’s α of the subscales were available, therefore the paper was of poor methodological quality.
Validity. Structural validity was studied by performing a factor analysis (Principal Component Analysis with varimax rotation). The authors did not report how missing items were handled, resulting in fair methodological quality. Hypotheses testing was performed by correlating the LEAPS to several other measures (eg, the SDS work-item, HPQ global work performance, HPQ productivity score, and % missed hours at work in past two weeks) and a comparison between five severity groups was made (table 3). Little information was provided on the a priori expectations and used comparator instruments and therefore the paper was of fair methodological quality.
Responsiveness. This domain was not studied.

Chapter 3
56
Interpretability. Neither floor nor ceiling effects nor MIC were studied [35].
Best evidence synthesis. Due to the poor methodological quality, there was unknown evidence (?) for the internal consistency of the LEAPS (table 5). For structural validity and responsiveness, limited positive evidence (+) was found (fair methodological quality and positive results).
Discussion
This systematic review was conducted to identify the measurement properties of self-reported health-related work functioning instruments among workers with common mental disorders, taking the methodological quality of the studies into account in a best evidence synthesis. Five papers reporting on the measurement properties of five self-reported health-related work functioning instruments were included. The results show that there is little evidence available for the measurement properties of the identified instruments in this population, mainly due to the poor-to-fair methodological quality of the included studies. None of the five identified instruments showed satisfactory results for all measurement properties. The internal consistency of all instruments was evaluated (all Cronbach’s α >0.70), as was construct validity by means of hypotheses testing: comparison of severity groups and correlations with other constructs. Test-retest reliability was only studied for the EWPS, in both the English [31] and Turkish [32] versions, with positive result. Although responsiveness was evaluated for four out of five instruments (EWPS, WLQ, SPS-6, and WPS), the results are difficult to interpret due to small sample sizes and inappropriate methods [31,33,34]. Structural validity was evaluated for the LEAPS only [35]. Measurement error, content validity, cross-cultural validity, and interpretability were either not studied or not adequately described in the included studies. Larger, well-designed validation studies in CMD populations are needed to provide more evidence for the measurement properties of health-related work functioning instruments. In particular, large validation studies that include several of these instruments, in order to evaluate and compare the measurement properties, are needed. Although the overall evidence for the measurement properties for all instruments is low, this does not imply that the instruments do not have good measurement properties. For example, the reported Cronbach’s α of all instruments and subscales were >0.70, but for most instruments no factor analysis was performed in the study population to assess the unidimensionality. If there is no evidence that the scales are unidimensional, the Cronbach’s α cannot be properly interpreted [40]. Moreover, the focus of this review is on CMD populations, while the instruments also have been used and validated in other populations [12,14-19]. For example, the SPS-6, and the WLQ-16 were included among
Measurement properties of work functioning instruments – A systematic review
57
3
other instruments in a validation study performed among workers with shoulder or elbow disorders [18] and the WLQ-25, EWPS, and SPS-6 were included among other instruments in a validation study of a rheumatoid arthritis and osteoarthritis population [15]. All instruments showed satisfactory measurement properties. The overall methodological quality of the included studies was poor to fair. Several reasons were found for these low ratings: often very small sample sizes were used in the analyses, especially in subgroup analyses. When validating instruments by means of hypotheses testing, it is important to formulate clear (a priori) hypotheses, stating the direction and magnitude of expected correlations or mean differences. In the present review, only Sanderson [34] and Lam [35] formulated hypotheses in their papers. Another reason for poor methodological quality was the lack of information. For example, studies failed to report on how missing items were handled, time intervals for test-retest and responsiveness were not stated, and comparative instruments used in hypotheses testing were not described. The evidence synthesis was performed per measurement property for each instrument to categorize the total body of evidence. It has to be noted, that if there is no evidence available, no rating can be made. This is different from unknown evidence (?), which is based on studies of poor methodological quality. All included papers focused on workers and all included health-related work functioning instruments were designed for use in working populations, often addressing a wide range of health conditions. Most identified papers included study populations in a clinical setting, ie, most participants were recruited in healthcare settings. One paper recruited in a workplace setting [34]. Different instruments and classifications were used to diagnose CMD. Caution is needed before generalizing the results to the day-to-day practice of occupational physicians, who may use these instruments to monitor work functioning of workers with CMD in a workplace setting. An asset of this study is that it used a rather strict set of inclusion criteria for self-reported health-related work functioning instruments. Papers were only included if they clearly stated that their aim was to validate a specific instrument. Moreover, instruments were only included if they were self-reported and evaluated work functioning or effectiveness on the job. Instruments based on a single item, those measuring absenteeism only, or those whose work definitions included house and school work were excluded. A recent review showed that there are more work functioning instruments used in CMD populations than the five included in this review [20]. It might therefore be possible that, due to these strict set of inclusion criteria, instruments or papers were excluded that are also of interest for this population. However, because of our strict focus, this review provides a clear overview of the available evidence in this field and reveals gaps in knowledge. The COSMIN taxonomy and checklist were chosen for the critical appraisal of the measurement properties [21,23,29,30]. The taxonomy was developed to provide an overview of the relevant measurement properties for health-related patient-reported
Chapter 3
58
outcomes, and is based on international consensus [23]. The COSMIN taxonomy might contribute to a better understanding and less ambiguity in the terminology and definitions used in validation studies. The COSMIN checklist provided a structured procedure for the evaluation of the methodological quality of studies on measurement properties. Although the COSMIN-checklist-based evaluation revealed that studies had poor-to-fair methodological quality, this does not imply that the instruments do not have good measurement properties. The current systematic review had a narrow set of inclusion criteria with a structured procedure for the quality assessment. The results clearly indicate that there is a need for more and better validation studies in CMD populations for health-related work functioning instruments. The COSMIN checklist may be used as a guide for designing methodologically sound validation studies.
Concluding remarksThis systematic review provides an overview of the available evidence on the measurement properties of health-related work functioning instruments in CMD populations. Most evidence is limited, with the construct validity – by means of hypothesis testing – having the highest level of evidence for all instruments. Information on a number of measurement properties, such as measurement error, content validity, and cross-cultural validity is still lacking. Also information on interpretability of the instruments is mostly lacking. Therefore, no evidence-based decisions and/or recommendations can be made for the use of health-related work functioning instruments in CMD populations. For now, in determining which instrument to employ, users will have to base their decisions on the content of the instrument, the purpose of use, and the target population, in addition to the little evidence available. Studies of high methodological quality are needed to properly assess the existing instruments’ measurement properties. We recommend using the COSMIN checklist in the design of these studies.
Acknowledgements
The authors would like to thank Minne Yildrim for her help with translating and assessing Uguz et al. [32].
Measurement properties of work functioning instruments – A systematic review
59
3
References
1. Henderson M, Glozier N, Holland Elliott K. Long term sickness absence. BMJ 2005; 330:802-3.
2. Bültmann U, Rugulies R, Lund T, Christensen KB, Labriola M, Burr H. Depressive symptoms and the risk of long-term sickness absence: a prospective study among 4747 employees in Denmark. Soc Psychiatry Psychiatr Epidemiol 2006; 41:875-80.
3. Karpansalo M, Kauhanen J, Lakka TA, Manninen P, Kaplan GA, Salonen JT. Depression and early retirement: prospective population based study in middle aged men. J Epidemiol Community Health 2005; 59:70-4.
4. Goetzel RZ, Hawkins K, Ozminkowski RJ, Wang S. The health and productivity cost burden of the “top 10” physical and mental health conditions affecting six large U.S. employers in 1999. J Occup Environ Med 2003; 45:5-14.
5. Laitinen-Krispijn S, Bijl RV. Mental disorders and employee sickness absence: the NEMESIS study. Netherlands Mental Health Survey and Incidence Study. Soc Psychiatry Psychiatr Epidemiol 2000; 35:71-7.
6. Hirschfeld RM, Montgomery SA, Keller MB, Kasper S, Schatzberg AF, Moller HJ, et al. Social functioning in depression: a review. J Clin Psychiatry 2000; 61:268-75.
7. Lerner D, Henke RM. What does research tell us about depression, job performance, and work productivity? J Occup Environ Med 2008; 50:401-10.
8. Sanderson K, Andrews G. Common mental disorders in the workforce: recent findings from descriptive and social epidemiology. Can J Psychiatry 2006; 51:63-75.
9. Loeppke R, Taitel M, Haufle V, Parry T, Kessler RC, Jinnett K. Health and productivity as a business strategy: a multiemployer study. J Occup Environ Med 2009; 51:411-28.
10. Goetzel RZ, Long SR, Ozminkowski RJ, Hawkins K, Wang S, Lynch W. Health, absence, disability, and presenteeism cost estimates of certain physical and mental health conditions affecting U.S. employers. J Occup Environ Med 2004; 46:398-412.
11. Collins JJ, Baase CM, Sharda CE, Ozminkowski RJ, Nicholson S, Billotti GM, et al. The assessment of chronic health conditions on work performance, absence, and total economic impact for employers. J Occup Environ Med 2005; 47:547-57.
12. Amick BC,III, Lerner D, Rogers WH, Rooney T, Katz JN. A review of health-related work outcome measures and their uses, and recommended measures. Spine 2000; 25:3152-60.
13. Amick BC,III, Gimeno D. Measuring Work Outcomes with a focus on Health-Related Work Productivity Loss. In: Wittink H, Carr D, editors. Pain Management: Evidence, Outcomes, and Quality of Life: A Sourcebook. Amsterdam: Elsevier; 2008. p. 329-343.
14. Loeppke R, Hymel PA, Lofland JH, Pizzi LT, Konicki DL, Anstadt GW, et al. Health-related workplace productivity measurement: general and migraine-specific recommendations from the ACOEM Expert Panel. J Occup Environ Med 2003; 45:349-59.
15. Beaton DE, Tang K, Gignac MA, Lacaille D, Badley EM, Anis AH, et al. Reliability, validity, and responsiveness of five at-work productivity measures in patients with rheumatoid arthritis or osteoarthritis. Arthritis Care Res 2010; 62:28-37.
16. Lofland JH, Pizzi L, Frick KD. A review of health-related workplace productivity loss instruments. Pharmacoeconomics 2004; 22:165-84.
17. Prasad M, Wahlqvist P, Shikiar R, Shih YC. A review of self-report instruments measuring health-related work productivity: a patient-reported outcomes perspective. Pharmacoeconomics 2004; 22:225-44.
18. Tang K, Pitts S, Solway S, Beaton D. Comparison of the psychometric properties of four at-work disability measures in workers with shoulder or elbow disorders. J Occup Rehabil 2009; 19:142-54.
Chapter 3
60
19. Williams RM, Schmuck G, Allwood S, Sanchez M, Shea R, Wark G. Psychometric Evaluation of Health-Related Work Outcome Measures For Musculoskeletal Disorders : A Systematic Review. J Occup Rehabil 2007; 17:504-21.
20. Nieuwenhuijsen K, Franche RL, van Dijk FJ. Work functioning measurement: tools for occupational mental health research. J Occup Environ Med 2010; 52:778-90.
21. Mokkink LB, Terwee CB, Patrick DL, Alonso J, Stratford PW, Knol DL, et al. The COSMIN checklist for assessing the methodological quality of studies on measurement properties of health status measurement instruments: an international Delphi study. Qual Life Res 2010; 19:539-49.
22. Terwee CB, Jansma EP, Riphagen II, de Vet HC. Development of a methodological PubMed search filter for finding studies on measurement properties of measurement instruments. Qual Life Res 2009; 18:1115-23.
23. Mokkink LB, Terwee CB, Patrick DL, Alonso J, Stratford PW, Knol DL, et al. The COSMIN study reached international consensus on taxonomy, terminology, and definitions of measurement properties for health-related patient-reported outcomes. J Clin Epidemiol 2010; 63:737-45.
24. Terwee CB, Bot SD, de Boer MR, van der Windt DA, Knol DL, Dekker J, et al. Quality criteria were proposed for measurement properties of health status questionnaires. J Clin Epidemiol 2007; 60:34-42.
25. Streiner DL, Norman GR. Health measurement scales: a practical guide to their development and use. 3rd ed. New York: Oxford University Press, 2003.
26. de Vet HC, Terwee CB, Knol DL, Bouter LM. When to use agreement versus reliability measures. J Clin Epidemiol 2006; 59:1033-9.
27. Bland JM, Altman DG. Statistical methods for assessing agreement between two methods of clinical measurement. Lancet 1986; 1:307-10.
28. Terwee CB, Roorda LD, Knol DL, de Boer MR, de Vet HC. Linking measurement error to minimal important change of patient-reported outcomes. J Clin Epidemiol 2009; 62:1062-7.
29. Mokkink LB, Terwee CB, Knol DL, Stratford PW, Alonso J, Patrick DL, et al. The COSMIN checklist for evaluating the methodological quality of studies on measurement properties: a clarification of its content. BMC Med Res Methodol 2010; 10:22.
30. Terwee CB, Mokkink LB, Knol DL, Ostelo RW, Bouter LM, de Vet HC. Rating the methodological quality in systematic reviews of studies on measurement properties: a scoring system for the COSMIN checklist. Qual Life Res 2011.
31. Endicott J, Nee J. Endicott Work Productivity Scale (EWPS): a new measure to assess treatment effects. Psychopharmacol Bull 1997; 33:13-6.
32. Uguz S, Inanc BY, Yerlikaya EE, Aydin H. Reliability and validity of Turkish form of Endicott Work Productivity Scale. Turk Psikiyatri Derg 2004; 15:209-14.
33. Erickson SR, Guthrie S, Vanetten-Lee M, Himle J, Hoffman J, Santos SF, et al. Severity of anxiety and work-related outcomes of patients with anxiety disorders. Depress Anxiety 2009; 26:1165-71.
34. Sanderson K, Tilse E, Nicholson J, Oldenburg B, Graves N. Which presenteeism measures are more sensitive to depression and anxiety? J Affect Disord 2007; 101:65-74.
35. Lam RW, Michalak EE, Yatham LN. A new clinical rating scale for work absence and productivity: validation in patients with major depressive disorder. BMC Psychiatry 2009; 9:78.
36. Lerner D, Amick BC,III, Rogers WH, Malspeis S, Bungay K, Cynn D. The Work Limitations Questionnaire. Med Care 2001; 39:72-85.
37. Lerner D, Amick BC, Lee JC, Rooney T, Rogers WH, Chang H, et al. Relationship of Employee-Reported Work Limitations to Work Productivity. Med Care 2003; 41:649-59.
Measurement properties of work functioning instruments – A systematic review
61
3
38. Koopman C, Pelletier KR, Murray JF, Sharda CE, Berger ML, Turpin RS, et al. Stanford presenteeism scale: health status and employee productivity. J Occup Environ Med 2002; 44:14-20.
39. Jette AM, Davies AR, Cleary PD, Calkins DR, Rubenstein LV, Fink A, et al. The Functional Status Questionnaire: reliability and validity when used in primary care. J Gen Intern Med 1986; 1:143-9.
40. Cortina JM. What is coefficient alpha? An examination of theory and applications. J Appl Psychol 1993; 78:98-104.
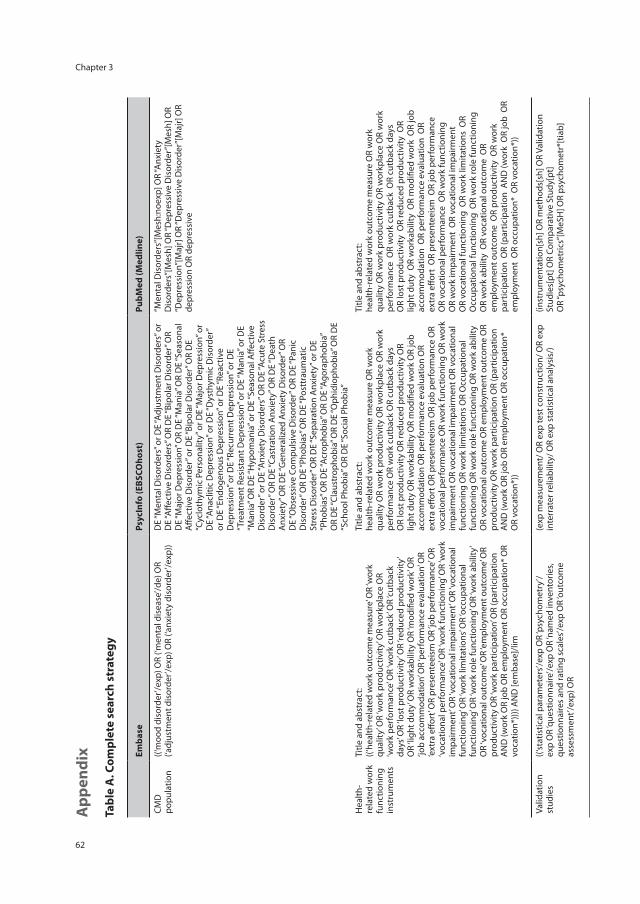
Chapter 3
62
App
endi
x
Tabl
e A
. Com
plet
e se
arch
str
ateg
y
Emba
se
Psyc
Info
(EBS
COho
st)
PubM
ed (M
edlin
e)
CMD
po
pula
tion
((‘m
ood
diso
rder
’/exp
) OR
(‘men
tal d
isea
se’/d
e) O
R (‘a
djus
tmen
t dis
orde
r’/ex
p) O
R (‘a
nxie
ty d
isor
der’/
exp)
) D
E “M
enta
l Dis
orde
rs” o
r DE
“Adj
ustm
ent D
isor
ders
” or
DE
“Affe
ctiv
e D
isor
ders
” OR
DE
“Bip
olar
Dis
orde
r” O
R D
E “M
ajor
Dep
ress
ion”
OR
DE
“Man
ia” O
R D
E “S
easo
nal
Affe
ctiv
e D
isor
der”
or D
E “B
ipol
ar D
isor
der”
OR
DE
“Cyc
loth
ymic
Per
sona
lity”
or D
E “M
ajor
Dep
ress
ion”
or
DE
“Ana
cliti
c D
epre
ssio
n” o
r DE
“Dys
thym
ic D
isor
der”
or
DE
“End
ogen
ous
Dep
ress
ion”
or D
E “R
eact
ive
Dep
ress
ion”
or D
E “R
ecur
rent
Dep
ress
ion”
or D
E “T
reat
men
t Res
ista
nt D
epre
ssio
n” o
r DE
“Man
ia” o
r DE
“Man
ia” O
R D
E “H
ypom
ania
” or D
E “S
easo
nal A
ffect
ive
Dis
orde
r” o
r DE
“Anx
iety
Dis
orde
rs” O
R D
E “A
cute
Str
ess
Dis
orde
r” O
R D
E “C
astr
atio
n A
nxie
ty” O
R D
E “D
eath
A
nxie
ty” O
R D
E “G
ener
aliz
ed A
nxie
ty D
isor
der”
OR
DE
“Obs
essi
ve C
ompu
lsiv
e D
isor
der”
OR
DE
“Pan
ic
Dis
orde
r” O
R D
E “P
hobi
as” O
R D
E “P
ostt
raum
atic
St
ress
Dis
orde
r” O
R D
E “S
epar
atio
n A
nxie
ty” o
r DE
“Pho
bias
” OR
DE
“Acr
opho
bia”
OR
DE
“Ago
raph
obia
” O
R D
E “C
laus
trop
hobi
a” O
R D
E “O
phid
ioph
obia
” OR
DE
“Sch
ool P
hobi
a” O
R D
E “S
ocia
l Pho
bia”
“Men
tal D
isor
ders
”[M
esh:
noex
p] O
R “A
nxie
ty
Dis
orde
rs”[
Mes
h] O
R “D
epre
ssiv
e D
isor
der”
[Mes
h] O
R “D
epre
ssio
n”[M
ajr]
OR
“Dep
ress
ive
Dis
orde
r”[M
ajr]
OR
depr
essi
on O
R de
pres
sive
Hea
lth-
rela
ted
wor
k fu
nctio
ning
in
stru
men
ts
Title
and
abs
trac
t:((‘
heal
th-r
elat
ed w
ork
outc
ome
mea
sure
’ OR
‘wor
k qu
ality
’ OR
‘wor
k pr
oduc
tivity
’ OR
wor
kpla
ce O
R ‘w
ork
perf
orm
ance
’ OR
‘wor
k cu
tbac
k’ O
R ‘cu
tbac
k da
ys’ O
R ‘lo
st p
rodu
ctiv
ity’ O
R ‘re
duce
d pr
oduc
tivity
’ O
R ‘li
ght d
uty’
OR
wor
kabi
lity
OR
‘mod
ified
wor
k’ O
R ‘jo
b ac
com
mod
atio
n’ O
R ‘p
erfo
rman
ce e
valu
atio
n’ O
R ‘e
xtra
effo
rt’ O
R pr
esen
teei
sm O
R ‘jo
b pe
rfor
man
ce’ O
R ‘v
ocat
iona
l per
form
ance
’ OR
‘wor
k fu
nctio
ning
’ OR
‘wor
k im
pairm
ent’
OR
‘voc
atio
nal i
mpa
irmen
t’ O
R ‘v
ocat
iona
l fu
nctio
ning
’ OR
‘wor
k lim
itatio
ns’ O
R ‘o
ccup
atio
nal
func
tioni
ng’ O
R ‘w
ork
role
func
tioni
ng’ O
R ‘w
ork
abili
ty’
OR
‘voc
atio
nal o
utco
me’
OR
‘em
ploy
men
t out
com
e’ O
R pr
oduc
tivity
OR
‘wor
k pa
rtic
ipat
ion’
OR
(par
ticip
atio
n A
ND
(wor
k O
R jo
b O
R em
ploy
men
t OR
occu
patio
n* O
R vo
catio
n*)))
) AN
D [e
mba
se]/
lim
Title
and
abs
trac
t:he
alth
-rel
ated
wor
k ou
tcom
e m
easu
re O
R w
ork
qual
ity O
R w
ork
prod
uctiv
ity O
R w
orkp
lace
OR
wor
k pe
rfor
man
ce O
R w
ork
cutb
ack
OR
cutb
ack
days
O
R lo
st p
rodu
ctiv
ity O
R re
duce
d pr
oduc
tivity
OR
light
dut
y O
R w
orka
bilit
y O
R m
odifi
ed w
ork
OR
job
acco
mm
odat
ion
OR
perf
orm
ance
eva
luat
ion
OR
extr
a eff
ort O
R pr
esen
teei
sm O
R jo
b pe
rfor
man
ce O
R vo
catio
nal p
erfo
rman
ce O
R w
ork
func
tioni
ng O
R w
ork
impa
irmen
t OR
voca
tiona
l im
pairm
ent O
R vo
catio
nal
func
tioni
ng O
R w
ork
limita
tions
OR
Occ
upat
iona
l fu
nctio
ning
OR
wor
k ro
le fu
nctio
ning
OR
wor
k ab
ility
O
R vo
catio
nal o
utco
me
OR
empl
oym
ent o
utco
me
OR
prod
uctiv
ity O
R w
ork
part
icip
atio
n O
R (p
artic
ipat
ion
AN
D (w
ork
OR
job
OR
empl
oym
ent O
R oc
cupa
tion*
O
R vo
catio
n*))
Title
and
abs
trac
t:he
alth
-rel
ated
wor
k ou
tcom
e m
easu
re O
R w
ork
qual
ity O
R w
ork
prod
uctiv
ity O
R w
orkp
lace
OR
wor
k pe
rfor
man
ce O
R w
ork
cutb
ack
OR
cutb
ack
days
O
R lo
st p
rodu
ctiv
ity O
R re
duce
d pr
oduc
tivity
OR
light
dut
y O
R w
orka
bilit
y O
R m
odifi
ed w
ork
OR
job
acco
mm
odat
ion
OR
perf
orm
ance
eva
luat
ion
OR
extr
a eff
ort
OR
pres
ente
eism
OR
job
perf
orm
ance
O
R vo
catio
nal p
erfo
rman
ce O
R w
ork
func
tioni
ng
OR
wor
k im
pairm
ent
OR
voca
tiona
l im
pairm
ent
OR
voca
tiona
l fun
ctio
ning
OR
wor
k lim
itatio
ns O
R O
ccup
atio
nal f
unct
ioni
ng O
R w
ork
role
func
tioni
ng
OR
wor
k ab
ility
OR
voca
tiona
l out
com
e O
R em
ploy
men
t out
com
e O
R pr
oduc
tivity
OR
wor
k pa
rtic
ipat
ion
OR
(par
ticip
atio
n A
ND
(wor
k O
R jo
b O
R em
ploy
men
t O
R oc
cupa
tion*
OR
voca
tion*
))
Valid
atio
n st
udie
s((‘
stat
istic
al p
aram
eter
s’/ex
p O
R ‘p
sych
omet
ry’/
exp
OR
‘que
stio
nnai
re’/e
xp O
R ‘n
amed
inve
ntor
ies,
ques
tionn
aire
s an
d ra
ting
scal
es’/e
xp O
R ‘o
utco
me
asse
ssm
ent’/
exp)
OR
Title
and
abs
trac
t:((r
epro
duci
b* O
R ps
ycho
met
r* O
R cl
inim
etr*
OR
clin
omet
r* O
R ‘it
em s
elec
tion’
OR
‘item
redu
ctio
n’ O
R ‘o
bser
ver v
aria
tion
relia
bilit
y’ O
R va
lid*
OR
coeffi
cien
t O
R ‘in
tern
al c
onsi
sten
cy’ O
R (c
ronb
ach*
AN
D (a
lpha
OR
alph
as))
OR
‘item
cor
rela
tion’
OR
‘item
cor
rela
tions
’ OR
‘item
sel
ectio
n’ O
R ‘it
em s
elec
tions
’ OR
‘item
redu
ctio
n’
OR
‘item
redu
ctio
ns’ O
R ag
reem
ent O
R pr
ecis
ion
OR
impr
ecis
ion
OR
‘pre
cise
val
ues’
OR
‘test
rete
st’ O
R (t
est
AN
D re
test
) OR
(rel
iab*
AN
D (t
est O
R re
test
)) O
R st
abili
ty
OR
inte
rrat
er O
R ‘in
ter r
ater
’ OR
intr
arat
er O
R ‘in
tra
rate
r’ O
R in
tert
este
r OR
‘inte
r tes
ter’
OR
intr
ates
ter O
R ‘in
tra
test
er’ O
R in
tero
bser
ver O
R ‘in
ter o
bser
ver’
OR
intr
aobs
erve
r OR
‘intr
a ob
serv
er’ O
R in
tert
echn
icia
n O
R ‘in
ter t
echn
icia
n’ O
R in
trat
echn
icia
n O
R ‘in
tra
tech
nici
an’
OR
inte
rexa
min
er O
R ‘in
ter e
xam
iner
’ OR
intr
aexa
min
er
OR
‘intr
a ex
amin
er’ O
R in
tera
ssay
OR
‘inte
r ass
ay’ O
R in
traa
ssay
(exp
mea
sure
men
t/ O
R ex
p te
st c
onst
ruct
ion/
OR
exp
inte
rrat
er re
liabi
lity/
OR
exp
stat
istic
al a
naly
sis/
)
Title
and
abs
trac
t:re
prod
ucib
* O
R ps
ycho
met
r* O
R cl
inim
etr*
OR
clin
omet
r* O
R ite
m s
elec
tion
OR
item
redu
ctio
n O
R ob
serv
er v
aria
tion
relia
b* O
R va
lid*
OR
coeffi
cien
t OR
inte
rnal
con
sist
ency
OR
(cro
nbac
h* A
ND
(alp
ha O
R al
phas
)) O
R ite
m c
orre
latio
n O
R ite
m c
orre
latio
ns O
R ite
m s
elec
tion
OR
item
sel
ectio
ns O
R ite
m re
duct
ion
OR
item
redu
ctio
ns O
R ag
reem
ent O
R pr
ecis
ion
OR
impr
ecis
ion
OR
prec
ise
valu
es O
R te
st-r
etes
t OR
(tes
t A
ND
rete
st )
OR
(relia
b* A
ND
(tes
t OR
rete
st ))
OR
stab
ility
OR
inte
rrat
er O
R in
ter-
rate
r OR
intr
arat
er O
R in
tra-
rate
r OR
inte
rtes
ter O
R in
ter-
test
er O
R in
trat
este
r O
R in
tra-
test
er O
R in
tero
bser
ver O
R in
ter-
obse
rver
OR
intr
aobs
erve
r OR
intr
a-ob
serv
er O
R in
tert
echn
icia
n O
R in
ter-
tech
nici
an O
R in
trat
echn
icia
n O
R in
tra-
tech
nici
an
OR
inte
rexa
min
er O
R in
ter-
exam
iner
OR
intr
aexa
min
er
OR
intr
a-ex
amin
er O
R in
tera
ssay
OR
inte
r-as
say
OR
intr
aass
ay O
R in
tra-
assa
y O
R in
terin
divi
dual
OR
inte
r-in
divi
dual
OR
intr
aind
ivid
ual O
R in
tra-
indi
vidu
al O
R in
terp
artic
ipan
t OR
inte
r-pa
rtic
ipan
t
(inst
rum
enta
tion[
sh] O
R m
etho
ds[s
h] O
R Va
lidat
ion
Stud
ies[
pt] O
R Co
mpa
rativ
e St
udy[
pt]
OR
“psy
chom
etric
s”[M
eSH
] OR
psyc
hom
etr*
[tia
b]
OR
clin
imet
r*[t
w] O
R cl
inom
etr*
[tw
] OR
“out
com
e as
sess
men
t (he
alth
car
e)”[
MeS
H] O
R ou
tcom
e as
sess
men
t[tia
b] O
R ou
tcom
e m
easu
re*[
tw]
OR
“obs
erve
r var
iatio
n”[M
eSH
] OR
obse
rver
va
riatio
n[tia
b] O
R “H
ealth
Sta
tus
Indi
cato
rs”[
Mes
h] O
R “r
epro
duci
bilit
y of
resu
lts”[
MeS
H] O
R re
prod
ucib
*[tia
b]
OR
“dis
crim
inan
t ana
lysi
s”[M
eSH
] OR
Title
and
abs
trac
t:re
liab*
OR
unre
liab*
OR
valid
* O
R co
effici
ent O
R ho
mog
enei
ty O
R ho
mog
eneo
us O
R “in
tern
al
cons
iste
ncy”
OR
(cro
nbac
h* A
ND
(alp
ha O
R al
phas
)) O
R (it
em A
ND
(cor
rela
tion*
OR
sele
ctio
n*
OR
redu
ctio
n*))
OR
agre
emen
t OR
prec
isio
n O
R im
prec
isio
n O
R “p
reci
se v
alue
s” O
R te
st-r
etes
t OR
(tes
t AN
D re
test
) OR
(relia
b* A
ND
(tes
t OR
rete
st))
OR
stab
ility
OR
inte
rrat
er O
R in
ter-
rate
r OR
intr
arat
er O
R in
tra-
rate
r OR
inte
rtes
ter O
R in
ter-
test
er O
R in
trat
este
r O
R in
tra-
test
er O
R in
tero
bser
ver O
R in
ter-
obse
rver
OR
intr
aobs
erve
r OR
intr
a-ob
serv
er O
R in
tert
echn
icia
n O
R in
ter-
tech
nici
an O
R in
trat
echn
icia
n
OR
‘intr
a as
say’
OR
inte
rindi
vidu
al O
R ‘in
ter i
ndiv
idua
l’ OR
intr
aind
ivid
ual O
R ‘in
tra
indi
vidu
al’ O
R in
terp
artic
ipan
t OR
‘inte
r par
ticip
ant’
OR
intr
apar
ticip
ant O
R ‘in
tra
part
icip
ant’
OR
kapp
a O
R ka
ppas
OR
‘coeffi
cien
t of v
aria
tion’
OR
repe
atab
* O
R ((r
eplic
ab*
OR
repe
ated
) AN
D (m
easu
re
OR
mea
sure
s OR
findi
ngs O
R re
sult
OR
resu
lts O
R te
st O
R te
sts)
) OR
gene
raliz
a* O
R ge
nera
lisa*
OR
conc
orda
nce
OR
(intr
acla
ss A
ND
cor
rela
tion*
) OR
disc
rimin
ativ
e O
R ‘k
now
n gr
oup’
OR
‘fact
or a
naly
sis’
OR
‘fact
or a
naly
ses’
OR
‘fact
or st
ruct
ure’
OR
‘fact
or st
ruct
ures
’ OR
dim
ensi
onal
ity
OR
subs
cale
* O
R ‘m
ultit
rait
scal
ing
anal
ysis’
OR
‘mul
titra
it sc
alin
g an
alys
es’ O
R ‘it
em d
iscr
imin
ant’
OR
‘inte
rsca
le
corr
elat
ion’
OR
‘inte
rsca
le c
orre
latio
ns’ O
R ((e
rror
OR
erro
rs) A
ND
(mea
sure
* O
R co
rrel
at*
OR
eval
uat*
OR
accu
racy
OR
accu
rate
OR
prec
isio
n O
R m
ean)
) OR
‘indi
vidu
al v
aria
bilit
y’ O
R ‘in
terv
al v
aria
bilit
y’ O
R ‘ra
te
varia
bilit
y’ O
R ‘v
aria
bilit
y an
alys
is’ O
R (u
ncer
tain
ty A
ND
(m
easu
rem
ent O
R m
easu
ring)
) OR
‘stan
dard
err
or o
f m
easu
rem
ent’
OR
sens
itiv*
OR
resp
onsi
ve*
OR
(lim
it A
ND
det
ectio
n) O
R ‘m
inim
al d
etec
tabl
e co
ncen
trat
ion’
O
R in
terp
reta
b* O
R (s
mal
l* A
ND
(rea
l OR
dete
ctab
le)
AN
D (c
hang
e O
R di
ffere
nce)
) OR
‘mea
ning
ful c
hang
e’ O
R ‘m
inim
al im
port
ant c
hang
e’ O
R ‘m
inim
al im
port
ant
diffe
renc
e’ O
R ‘m
inim
ally
impo
rtan
t cha
nge’
OR
‘min
imal
ly
impo
rtan
t diff
eren
ce’ O
R ‘m
inim
al d
etec
tabl
e ch
ange
’ OR
‘min
imal
det
ecta
ble
diffe
renc
e’ O
R ‘m
inim
ally
det
ecta
ble
chan
ge’ O
R ‘m
inim
ally
det
ecta
ble
diffe
renc
e’ O
R ‘m
inim
al
real
cha
nge’
OR
‘min
imal
real
diff
eren
ce’ O
R ‘m
inim
ally
real
ch
ange
’ OR
‘min
imal
ly re
al d
iffer
ence
’ OR
‘ceili
ng e
ffect
’ O
R ‘fl
oor e
ffect
’ OR
‘item
resp
onse
mod
el’ O
R irt
OR
rasc
h O
R ‘d
iffer
entia
l ite
m fu
nctio
ning
’ OR
dif O
R ‘co
mpu
ter
adap
tive
test
ing’
OR
‘item
ban
k’ O
R ‘cr
oss-
cultu
ral
equi
vale
nce’
)))
OR
intr
apar
ticip
ant O
R in
tra-
part
icip
ant O
R ka
ppa
OR
kapp
a’s O
R ka
ppas
OR
coeffi
cien
t of v
aria
tion
OR
repe
atab
* O
R ((r
eplic
ab*
OR
repe
ated
) A
ND
(mea
sure
O
R m
easu
res
OR
findi
ngs
OR
resu
lt O
R re
sults
OR
test
OR
test
s ))
OR
gene
raliz
a* O
R ge
nera
lisa*
OR
conc
orda
nce
OR
(intr
acla
ss A
ND
cor
rela
tion*
) O
R di
scrim
inat
ive
OR
know
n gr
oup
OR
fact
or a
naly
sis
OR
fact
or a
naly
ses
OR
fact
or s
truc
ture
OR
fact
or s
truc
ture
s O
R di
men
sion
ality
OR
subs
cale
* O
R m
ultit
rait
scal
ing
anal
ysis
OR
mul
titra
it sc
alin
g an
alys
es O
R ite
m
disc
rimin
ant O
R in
ters
cale
cor
rela
tion
OR
inte
rsca
le
corr
elat
ions
OR
((err
or O
R er
rors
) A
ND
(mea
sure
* O
R co
rrel
at*
OR
eval
uat*
OR
accu
racy
OR
accu
rate
O
R pr
ecis
ion
OR
mea
n ))
OR
indi
vidu
al v
aria
bilit
y O
R in
terv
al v
aria
bilit
y O
R ra
te v
aria
bilit
y O
R va
riabi
lity
anal
ysis
OR
(unc
erta
inty
AN
D (m
easu
rem
ent O
R m
easu
ring
)) O
R st
anda
rd e
rror
of m
easu
rem
ent O
R se
nsiti
v* O
R re
spon
sive
* O
R (li
mit
AN
D d
etec
tion
) OR
min
imal
det
ecta
ble
conc
entr
atio
n O
R in
terp
reta
b*
OR
(sm
all*
AN
D (r
eal O
R de
tect
able
) A
ND
(cha
nge
OR
diffe
renc
e ))
OR
mea
ning
ful c
hang
e O
R m
inim
al
impo
rtan
t cha
nge
OR
min
imal
impo
rtan
t diff
eren
ce
OR
min
imal
ly im
port
ant c
hang
e O
R m
inim
ally
im
port
ant d
iffer
ence
OR
min
imal
det
ecta
ble
chan
ge
OR
min
imal
det
ecta
ble
diffe
renc
e O
R m
inim
ally
de
tect
able
cha
nge
OR
min
imal
ly d
etec
tabl
e di
ffere
nce
OR
min
imal
real
cha
nge
OR
min
imal
real
diff
eren
ce O
R m
inim
ally
real
cha
nge
OR
min
imal
ly re
al d
iffer
ence
OR
ceili
ng e
ffect
OR
floor
effe
ct O
R Ite
m re
spon
se m
odel
O
R IR
T O
R Ra
sch
OR
Diff
eren
tial i
tem
func
tioni
ng O
R D
IF O
R co
mpu
ter a
dapt
ive
test
ing
OR
item
ban
k O
R cr
oss-
cultu
ral e
quiv
alen
ce
OR
intr
a-te
chni
cian
OR
inte
rexa
min
er O
R in
ter-
exam
iner
OR
intr
aexa
min
er O
R in
tra-
exam
iner
OR
inte
rass
ay O
R in
ter-
assa
y O
R in
traa
ssay
OR
intr
a-as
say
OR
inte
rindi
vidu
al O
R in
ter-
indi
vidu
al O
R in
trai
ndiv
idua
l OR
intr
a-in
divi
dual
OR
inte
rpar
ticip
ant
OR
inte
r-pa
rtic
ipan
t OR
intr
apar
ticip
ant O
R in
tra-
part
icip
ant O
R ka
ppa
OR
kapp
a’s O
R ka
ppas
OR
repe
atab
* O
R ((r
eplic
ab*
OR
repe
ated
) AN
D (m
easu
re
OR
mea
sure
s O
R fin
ding
s O
R re
sult
OR
resu
lts O
R te
st O
R te
sts)
) OR
gene
raliz
a* O
R ge
nera
lisa*
OR
conc
orda
nce
OR
(intr
acla
ss A
ND
cor
rela
tion*
) OR
disc
rimin
ativ
e O
R “k
now
n gr
oup”
OR
fact
or a
naly
sis
OR
fact
or a
naly
ses
OR
dim
ensi
on*
OR
subs
cale
* O
R (m
ultit
rait
AN
D s
calin
g A
ND
(ana
lysi
s O
R an
alys
es))
OR
item
dis
crim
inan
t OR
inte
rsca
le c
orre
latio
n* O
R er
ror
OR
erro
rs O
R “in
divi
dual
var
iabi
lity”
OR
(var
iabi
lity
AN
D (a
naly
sis
OR
valu
es))
OR
(unc
erta
inty
AN
D
(mea
sure
men
t OR
mea
surin
g)) O
R “s
tand
ard
erro
r of
mea
sure
men
t” O
R se
nsiti
v* O
R re
spon
sive
* O
R ((m
inim
al O
R m
inim
ally
OR
clin
ical
OR
clin
ical
ly) A
ND
(im
port
ant O
R si
gnifi
cant
OR
dete
ctab
le) A
ND
(cha
nge
OR
diffe
renc
e)) O
R (s
mal
l* A
ND
(rea
l OR
dete
ctab
le)
AN
D (c
hang
e O
R di
ffere
nce)
) OR
mea
ning
ful c
hang
e O
R “c
eilin
g eff
ect”
OR
“floo
r effe
ct” O
R “I
tem
resp
onse
m
odel
” OR
IRT
OR
Rasc
h O
R “D
iffer
entia
l ite
m
func
tioni
ng” O
R D
IF O
R “c
ompu
ter a
dapt
ive
test
ing”
O
R “it
em b
ank”
OR
“cro
ss-c
ultu
ral e
quiv
alen
ce”)
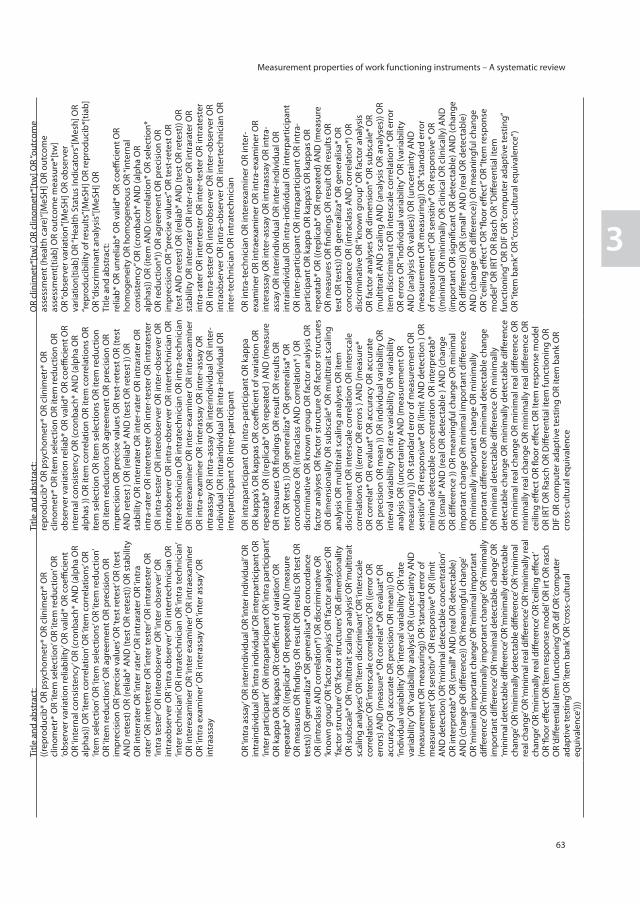
Measurement properties of work functioning instruments – A systematic review
63
3
App
endi
x
Tabl
e A
. Com
plet
e se
arch
str
ateg
y
Emba
se
Psyc
Info
(EBS
COho
st)
PubM
ed (M
edlin
e)
CMD
po
pula
tion
((‘m
ood
diso
rder
’/exp
) OR
(‘men
tal d
isea
se’/d
e) O
R (‘a
djus
tmen
t dis
orde
r’/ex
p) O
R (‘a
nxie
ty d
isor
der’/
exp)
) D
E “M
enta
l Dis
orde
rs” o
r DE
“Adj
ustm
ent D
isor
ders
” or
DE
“Affe
ctiv
e D
isor
ders
” OR
DE
“Bip
olar
Dis
orde
r” O
R D
E “M
ajor
Dep
ress
ion”
OR
DE
“Man
ia” O
R D
E “S
easo
nal
Affe
ctiv
e D
isor
der”
or D
E “B
ipol
ar D
isor
der”
OR
DE
“Cyc
loth
ymic
Per
sona
lity”
or D
E “M
ajor
Dep
ress
ion”
or
DE
“Ana
cliti
c D
epre
ssio
n” o
r DE
“Dys
thym
ic D
isor
der”
or
DE
“End
ogen
ous
Dep
ress
ion”
or D
E “R
eact
ive
Dep
ress
ion”
or D
E “R
ecur
rent
Dep
ress
ion”
or D
E “T
reat
men
t Res
ista
nt D
epre
ssio
n” o
r DE
“Man
ia” o
r DE
“Man
ia” O
R D
E “H
ypom
ania
” or D
E “S
easo
nal A
ffect
ive
Dis
orde
r” o
r DE
“Anx
iety
Dis
orde
rs” O
R D
E “A
cute
Str
ess
Dis
orde
r” O
R D
E “C
astr
atio
n A
nxie
ty” O
R D
E “D
eath
A
nxie
ty” O
R D
E “G
ener
aliz
ed A
nxie
ty D
isor
der”
OR
DE
“Obs
essi
ve C
ompu
lsiv
e D
isor
der”
OR
DE
“Pan
ic
Dis
orde
r” O
R D
E “P
hobi
as” O
R D
E “P
ostt
raum
atic
St
ress
Dis
orde
r” O
R D
E “S
epar
atio
n A
nxie
ty” o
r DE
“Pho
bias
” OR
DE
“Acr
opho
bia”
OR
DE
“Ago
raph
obia
” O
R D
E “C
laus
trop
hobi
a” O
R D
E “O
phid
ioph
obia
” OR
DE
“Sch
ool P
hobi
a” O
R D
E “S
ocia
l Pho
bia”
“Men
tal D
isor
ders
”[M
esh:
noex
p] O
R “A
nxie
ty
Dis
orde
rs”[
Mes
h] O
R “D
epre
ssiv
e D
isor
der”
[Mes
h] O
R “D
epre
ssio
n”[M
ajr]
OR
“Dep
ress
ive
Dis
orde
r”[M
ajr]
OR
depr
essi
on O
R de
pres
sive
Hea
lth-
rela
ted
wor
k fu
nctio
ning
in
stru
men
ts
Title
and
abs
trac
t:((‘
heal
th-r
elat
ed w
ork
outc
ome
mea
sure
’ OR
‘wor
k qu
ality
’ OR
‘wor
k pr
oduc
tivity
’ OR
wor
kpla
ce O
R ‘w
ork
perf
orm
ance
’ OR
‘wor
k cu
tbac
k’ O
R ‘cu
tbac
k da
ys’ O
R ‘lo
st p
rodu
ctiv
ity’ O
R ‘re
duce
d pr
oduc
tivity
’ O
R ‘li
ght d
uty’
OR
wor
kabi
lity
OR
‘mod
ified
wor
k’ O
R ‘jo
b ac
com
mod
atio
n’ O
R ‘p
erfo
rman
ce e
valu
atio
n’ O
R ‘e
xtra
effo
rt’ O
R pr
esen
teei
sm O
R ‘jo
b pe
rfor
man
ce’ O
R ‘v
ocat
iona
l per
form
ance
’ OR
‘wor
k fu
nctio
ning
’ OR
‘wor
k im
pairm
ent’
OR
‘voc
atio
nal i
mpa
irmen
t’ O
R ‘v
ocat
iona
l fu
nctio
ning
’ OR
‘wor
k lim
itatio
ns’ O
R ‘o
ccup
atio
nal
func
tioni
ng’ O
R ‘w
ork
role
func
tioni
ng’ O
R ‘w
ork
abili
ty’
OR
‘voc
atio
nal o
utco
me’
OR
‘em
ploy
men
t out
com
e’ O
R pr
oduc
tivity
OR
‘wor
k pa
rtic
ipat
ion’
OR
(par
ticip
atio
n A
ND
(wor
k O
R jo
b O
R em
ploy
men
t OR
occu
patio
n* O
R vo
catio
n*)))
) AN
D [e
mba
se]/
lim
Title
and
abs
trac
t:he
alth
-rel
ated
wor
k ou
tcom
e m
easu
re O
R w
ork
qual
ity O
R w
ork
prod
uctiv
ity O
R w
orkp
lace
OR
wor
k pe
rfor
man
ce O
R w
ork
cutb
ack
OR
cutb
ack
days
O
R lo
st p
rodu
ctiv
ity O
R re
duce
d pr
oduc
tivity
OR
light
dut
y O
R w
orka
bilit
y O
R m
odifi
ed w
ork
OR
job
acco
mm
odat
ion
OR
perf
orm
ance
eva
luat
ion
OR
extr
a eff
ort O
R pr
esen
teei
sm O
R jo
b pe
rfor
man
ce O
R vo
catio
nal p
erfo
rman
ce O
R w
ork
func
tioni
ng O
R w
ork
impa
irmen
t OR
voca
tiona
l im
pairm
ent O
R vo
catio
nal
func
tioni
ng O
R w
ork
limita
tions
OR
Occ
upat
iona
l fu
nctio
ning
OR
wor
k ro
le fu
nctio
ning
OR
wor
k ab
ility
O
R vo
catio
nal o
utco
me
OR
empl
oym
ent o
utco
me
OR
prod
uctiv
ity O
R w
ork
part
icip
atio
n O
R (p
artic
ipat
ion
AN
D (w
ork
OR
job
OR
empl
oym
ent O
R oc
cupa
tion*
O
R vo
catio
n*))
Title
and
abs
trac
t:he
alth
-rel
ated
wor
k ou
tcom
e m
easu
re O
R w
ork
qual
ity O
R w
ork
prod
uctiv
ity O
R w
orkp
lace
OR
wor
k pe
rfor
man
ce O
R w
ork
cutb
ack
OR
cutb
ack
days
O
R lo
st p
rodu
ctiv
ity O
R re
duce
d pr
oduc
tivity
OR
light
dut
y O
R w
orka
bilit
y O
R m
odifi
ed w
ork
OR
job
acco
mm
odat
ion
OR
perf
orm
ance
eva
luat
ion
OR
extr
a eff
ort
OR
pres
ente
eism
OR
job
perf
orm
ance
O
R vo
catio
nal p
erfo
rman
ce O
R w
ork
func
tioni
ng
OR
wor
k im
pairm
ent
OR
voca
tiona
l im
pairm
ent
OR
voca
tiona
l fun
ctio
ning
OR
wor
k lim
itatio
ns O
R O
ccup
atio
nal f
unct
ioni
ng O
R w
ork
role
func
tioni
ng
OR
wor
k ab
ility
OR
voca
tiona
l out
com
e O
R em
ploy
men
t out
com
e O
R pr
oduc
tivity
OR
wor
k pa
rtic
ipat
ion
OR
(par
ticip
atio
n A
ND
(wor
k O
R jo
b O
R em
ploy
men
t O
R oc
cupa
tion*
OR
voca
tion*
))
Valid
atio
n st
udie
s((‘
stat
istic
al p
aram
eter
s’/ex
p O
R ‘p
sych
omet
ry’/
exp
OR
‘que
stio
nnai
re’/e
xp O
R ‘n
amed
inve
ntor
ies,
ques
tionn
aire
s an
d ra
ting
scal
es’/e
xp O
R ‘o
utco
me
asse
ssm
ent’/
exp)
OR
Title
and
abs
trac
t:((r
epro
duci
b* O
R ps
ycho
met
r* O
R cl
inim
etr*
OR
clin
omet
r* O
R ‘it
em s
elec
tion’
OR
‘item
redu
ctio
n’ O
R ‘o
bser
ver v
aria
tion
relia
bilit
y’ O
R va
lid*
OR
coeffi
cien
t O
R ‘in
tern
al c
onsi
sten
cy’ O
R (c
ronb
ach*
AN
D (a
lpha
OR
alph
as))
OR
‘item
cor
rela
tion’
OR
‘item
cor
rela
tions
’ OR
‘item
sel
ectio
n’ O
R ‘it
em s
elec
tions
’ OR
‘item
redu
ctio
n’
OR
‘item
redu
ctio
ns’ O
R ag
reem
ent O
R pr
ecis
ion
OR
impr
ecis
ion
OR
‘pre
cise
val
ues’
OR
‘test
rete
st’ O
R (t
est
AN
D re
test
) OR
(rel
iab*
AN
D (t
est O
R re
test
)) O
R st
abili
ty
OR
inte
rrat
er O
R ‘in
ter r
ater
’ OR
intr
arat
er O
R ‘in
tra
rate
r’ O
R in
tert
este
r OR
‘inte
r tes
ter’
OR
intr
ates
ter O
R ‘in
tra
test
er’ O
R in
tero
bser
ver O
R ‘in
ter o
bser
ver’
OR
intr
aobs
erve
r OR
‘intr
a ob
serv
er’ O
R in
tert
echn
icia
n O
R ‘in
ter t
echn
icia
n’ O
R in
trat
echn
icia
n O
R ‘in
tra
tech
nici
an’
OR
inte
rexa
min
er O
R ‘in
ter e
xam
iner
’ OR
intr
aexa
min
er
OR
‘intr
a ex
amin
er’ O
R in
tera
ssay
OR
‘inte
r ass
ay’ O
R in
traa
ssay
(exp
mea
sure
men
t/ O
R ex
p te
st c
onst
ruct
ion/
OR
exp
inte
rrat
er re
liabi
lity/
OR
exp
stat
istic
al a
naly
sis/
)
Title
and
abs
trac
t:re
prod
ucib
* O
R ps
ycho
met
r* O
R cl
inim
etr*
OR
clin
omet
r* O
R ite
m s
elec
tion
OR
item
redu
ctio
n O
R ob
serv
er v
aria
tion
relia
b* O
R va
lid*
OR
coeffi
cien
t OR
inte
rnal
con
sist
ency
OR
(cro
nbac
h* A
ND
(alp
ha O
R al
phas
)) O
R ite
m c
orre
latio
n O
R ite
m c
orre
latio
ns O
R ite
m s
elec
tion
OR
item
sel
ectio
ns O
R ite
m re
duct
ion
OR
item
redu
ctio
ns O
R ag
reem
ent O
R pr
ecis
ion
OR
impr
ecis
ion
OR
prec
ise
valu
es O
R te
st-r
etes
t OR
(tes
t A
ND
rete
st )
OR
(relia
b* A
ND
(tes
t OR
rete
st ))
OR
stab
ility
OR
inte
rrat
er O
R in
ter-
rate
r OR
intr
arat
er O
R in
tra-
rate
r OR
inte
rtes
ter O
R in
ter-
test
er O
R in
trat
este
r O
R in
tra-
test
er O
R in
tero
bser
ver O
R in
ter-
obse
rver
OR
intr
aobs
erve
r OR
intr
a-ob
serv
er O
R in
tert
echn
icia
n O
R in
ter-
tech
nici
an O
R in
trat
echn
icia
n O
R in
tra-
tech
nici
an
OR
inte
rexa
min
er O
R in
ter-
exam
iner
OR
intr
aexa
min
er
OR
intr
a-ex
amin
er O
R in
tera
ssay
OR
inte
r-as
say
OR
intr
aass
ay O
R in
tra-
assa
y O
R in
terin
divi
dual
OR
inte
r-in
divi
dual
OR
intr
aind
ivid
ual O
R in
tra-
indi
vidu
al O
R in
terp
artic
ipan
t OR
inte
r-pa
rtic
ipan
t
(inst
rum
enta
tion[
sh] O
R m
etho
ds[s
h] O
R Va
lidat
ion
Stud
ies[
pt] O
R Co
mpa
rativ
e St
udy[
pt]
OR
“psy
chom
etric
s”[M
eSH
] OR
psyc
hom
etr*
[tia
b]
OR
clin
imet
r*[t
w] O
R cl
inom
etr*
[tw
] OR
“out
com
e as
sess
men
t (he
alth
car
e)”[
MeS
H] O
R ou
tcom
e as
sess
men
t[tia
b] O
R ou
tcom
e m
easu
re*[
tw]
OR
“obs
erve
r var
iatio
n”[M
eSH
] OR
obse
rver
va
riatio
n[tia
b] O
R “H
ealth
Sta
tus
Indi
cato
rs”[
Mes
h] O
R “r
epro
duci
bilit
y of
resu
lts”[
MeS
H] O
R re
prod
ucib
*[tia
b]
OR
“dis
crim
inan
t ana
lysi
s”[M
eSH
] OR
Title
and
abs
trac
t:re
liab*
OR
unre
liab*
OR
valid
* O
R co
effici
ent O
R ho
mog
enei
ty O
R ho
mog
eneo
us O
R “in
tern
al
cons
iste
ncy”
OR
(cro
nbac
h* A
ND
(alp
ha O
R al
phas
)) O
R (it
em A
ND
(cor
rela
tion*
OR
sele
ctio
n*
OR
redu
ctio
n*))
OR
agre
emen
t OR
prec
isio
n O
R im
prec
isio
n O
R “p
reci
se v
alue
s” O
R te
st-r
etes
t OR
(tes
t AN
D re
test
) OR
(relia
b* A
ND
(tes
t OR
rete
st))
OR
stab
ility
OR
inte
rrat
er O
R in
ter-
rate
r OR
intr
arat
er O
R in
tra-
rate
r OR
inte
rtes
ter O
R in
ter-
test
er O
R in
trat
este
r O
R in
tra-
test
er O
R in
tero
bser
ver O
R in
ter-
obse
rver
OR
intr
aobs
erve
r OR
intr
a-ob
serv
er O
R in
tert
echn
icia
n O
R in
ter-
tech
nici
an O
R in
trat
echn
icia
n
OR
‘intr
a as
say’
OR
inte
rindi
vidu
al O
R ‘in
ter i
ndiv
idua
l’ OR
intr
aind
ivid
ual O
R ‘in
tra
indi
vidu
al’ O
R in
terp
artic
ipan
t OR
‘inte
r par
ticip
ant’
OR
intr
apar
ticip
ant O
R ‘in
tra
part
icip
ant’
OR
kapp
a O
R ka
ppas
OR
‘coeffi
cien
t of v
aria
tion’
OR
repe
atab
* O
R ((r
eplic
ab*
OR
repe
ated
) AN
D (m
easu
re
OR
mea
sure
s OR
findi
ngs O
R re
sult
OR
resu
lts O
R te
st O
R te
sts)
) OR
gene
raliz
a* O
R ge
nera
lisa*
OR
conc
orda
nce
OR
(intr
acla
ss A
ND
cor
rela
tion*
) OR
disc
rimin
ativ
e O
R ‘k
now
n gr
oup’
OR
‘fact
or a
naly
sis’
OR
‘fact
or a
naly
ses’
OR
‘fact
or st
ruct
ure’
OR
‘fact
or st
ruct
ures
’ OR
dim
ensi
onal
ity
OR
subs
cale
* O
R ‘m
ultit
rait
scal
ing
anal
ysis’
OR
‘mul
titra
it sc
alin
g an
alys
es’ O
R ‘it
em d
iscr
imin
ant’
OR
‘inte
rsca
le
corr
elat
ion’
OR
‘inte
rsca
le c
orre
latio
ns’ O
R ((e
rror
OR
erro
rs) A
ND
(mea
sure
* O
R co
rrel
at*
OR
eval
uat*
OR
accu
racy
OR
accu
rate
OR
prec
isio
n O
R m
ean)
) OR
‘indi
vidu
al v
aria
bilit
y’ O
R ‘in
terv
al v
aria
bilit
y’ O
R ‘ra
te
varia
bilit
y’ O
R ‘v
aria
bilit
y an
alys
is’ O
R (u
ncer
tain
ty A
ND
(m
easu
rem
ent O
R m
easu
ring)
) OR
‘stan
dard
err
or o
f m
easu
rem
ent’
OR
sens
itiv*
OR
resp
onsi
ve*
OR
(lim
it A
ND
det
ectio
n) O
R ‘m
inim
al d
etec
tabl
e co
ncen
trat
ion’
O
R in
terp
reta
b* O
R (s
mal
l* A
ND
(rea
l OR
dete
ctab
le)
AN
D (c
hang
e O
R di
ffere
nce)
) OR
‘mea
ning
ful c
hang
e’ O
R ‘m
inim
al im
port
ant c
hang
e’ O
R ‘m
inim
al im
port
ant
diffe
renc
e’ O
R ‘m
inim
ally
impo
rtan
t cha
nge’
OR
‘min
imal
ly
impo
rtan
t diff
eren
ce’ O
R ‘m
inim
al d
etec
tabl
e ch
ange
’ OR
‘min
imal
det
ecta
ble
diffe
renc
e’ O
R ‘m
inim
ally
det
ecta
ble
chan
ge’ O
R ‘m
inim
ally
det
ecta
ble
diffe
renc
e’ O
R ‘m
inim
al
real
cha
nge’
OR
‘min
imal
real
diff
eren
ce’ O
R ‘m
inim
ally
real
ch
ange
’ OR
‘min
imal
ly re
al d
iffer
ence
’ OR
‘ceili
ng e
ffect
’ O
R ‘fl
oor e
ffect
’ OR
‘item
resp
onse
mod
el’ O
R irt
OR
rasc
h O
R ‘d
iffer
entia
l ite
m fu
nctio
ning
’ OR
dif O
R ‘co
mpu
ter
adap
tive
test
ing’
OR
‘item
ban
k’ O
R ‘cr
oss-
cultu
ral
equi
vale
nce’
)))
OR
intr
apar
ticip
ant O
R in
tra-
part
icip
ant O
R ka
ppa
OR
kapp
a’s O
R ka
ppas
OR
coeffi
cien
t of v
aria
tion
OR
repe
atab
* O
R ((r
eplic
ab*
OR
repe
ated
) A
ND
(mea
sure
O
R m
easu
res
OR
findi
ngs
OR
resu
lt O
R re
sults
OR
test
OR
test
s ))
OR
gene
raliz
a* O
R ge
nera
lisa*
OR
conc
orda
nce
OR
(intr
acla
ss A
ND
cor
rela
tion*
) O
R di
scrim
inat
ive
OR
know
n gr
oup
OR
fact
or a
naly
sis
OR
fact
or a
naly
ses
OR
fact
or s
truc
ture
OR
fact
or s
truc
ture
s O
R di
men
sion
ality
OR
subs
cale
* O
R m
ultit
rait
scal
ing
anal
ysis
OR
mul
titra
it sc
alin
g an
alys
es O
R ite
m
disc
rimin
ant O
R in
ters
cale
cor
rela
tion
OR
inte
rsca
le
corr
elat
ions
OR
((err
or O
R er
rors
) A
ND
(mea
sure
* O
R co
rrel
at*
OR
eval
uat*
OR
accu
racy
OR
accu
rate
O
R pr
ecis
ion
OR
mea
n ))
OR
indi
vidu
al v
aria
bilit
y O
R in
terv
al v
aria
bilit
y O
R ra
te v
aria
bilit
y O
R va
riabi
lity
anal
ysis
OR
(unc
erta
inty
AN
D (m
easu
rem
ent O
R m
easu
ring
)) O
R st
anda
rd e
rror
of m
easu
rem
ent O
R se
nsiti
v* O
R re
spon
sive
* O
R (li
mit
AN
D d
etec
tion
) OR
min
imal
det
ecta
ble
conc
entr
atio
n O
R in
terp
reta
b*
OR
(sm
all*
AN
D (r
eal O
R de
tect
able
) A
ND
(cha
nge
OR
diffe
renc
e ))
OR
mea
ning
ful c
hang
e O
R m
inim
al
impo
rtan
t cha
nge
OR
min
imal
impo
rtan
t diff
eren
ce
OR
min
imal
ly im
port
ant c
hang
e O
R m
inim
ally
im
port
ant d
iffer
ence
OR
min
imal
det
ecta
ble
chan
ge
OR
min
imal
det
ecta
ble
diffe
renc
e O
R m
inim
ally
de
tect
able
cha
nge
OR
min
imal
ly d
etec
tabl
e di
ffere
nce
OR
min
imal
real
cha
nge
OR
min
imal
real
diff
eren
ce O
R m
inim
ally
real
cha
nge
OR
min
imal
ly re
al d
iffer
ence
OR
ceili
ng e
ffect
OR
floor
effe
ct O
R Ite
m re
spon
se m
odel
O
R IR
T O
R Ra
sch
OR
Diff
eren
tial i
tem
func
tioni
ng O
R D
IF O
R co
mpu
ter a
dapt
ive
test
ing
OR
item
ban
k O
R cr
oss-
cultu
ral e
quiv
alen
ce
OR
intr
a-te
chni
cian
OR
inte
rexa
min
er O
R in
ter-
exam
iner
OR
intr
aexa
min
er O
R in
tra-
exam
iner
OR
inte
rass
ay O
R in
ter-
assa
y O
R in
traa
ssay
OR
intr
a-as
say
OR
inte
rindi
vidu
al O
R in
ter-
indi
vidu
al O
R in
trai
ndiv
idua
l OR
intr
a-in
divi
dual
OR
inte
rpar
ticip
ant
OR
inte
r-pa
rtic
ipan
t OR
intr
apar
ticip
ant O
R in
tra-
part
icip
ant O
R ka
ppa
OR
kapp
a’s O
R ka
ppas
OR
repe
atab
* O
R ((r
eplic
ab*
OR
repe
ated
) AN
D (m
easu
re
OR
mea
sure
s O
R fin
ding
s O
R re
sult
OR
resu
lts O
R te
st O
R te
sts)
) OR
gene
raliz
a* O
R ge
nera
lisa*
OR
conc
orda
nce
OR
(intr
acla
ss A
ND
cor
rela
tion*
) OR
disc
rimin
ativ
e O
R “k
now
n gr
oup”
OR
fact
or a
naly
sis
OR
fact
or a
naly
ses
OR
dim
ensi
on*
OR
subs
cale
* O
R (m
ultit
rait
AN
D s
calin
g A
ND
(ana
lysi
s O
R an
alys
es))
OR
item
dis
crim
inan
t OR
inte
rsca
le c
orre
latio
n* O
R er
ror
OR
erro
rs O
R “in
divi
dual
var
iabi
lity”
OR
(var
iabi
lity
AN
D (a
naly
sis
OR
valu
es))
OR
(unc
erta
inty
AN
D
(mea
sure
men
t OR
mea
surin
g)) O
R “s
tand
ard
erro
r of
mea
sure
men
t” O
R se
nsiti
v* O
R re
spon
sive
* O
R ((m
inim
al O
R m
inim
ally
OR
clin
ical
OR
clin
ical
ly) A
ND
(im
port
ant O
R si
gnifi
cant
OR
dete
ctab
le) A
ND
(cha
nge
OR
diffe
renc
e)) O
R (s
mal
l* A
ND
(rea
l OR
dete
ctab
le)
AN
D (c
hang
e O
R di
ffere
nce)
) OR
mea
ning
ful c
hang
e O
R “c
eilin
g eff
ect”
OR
“floo
r effe
ct” O
R “I
tem
resp
onse
m
odel
” OR
IRT
OR
Rasc
h O
R “D
iffer
entia
l ite
m
func
tioni
ng” O
R D
IF O
R “c
ompu
ter a
dapt
ive
test
ing”
O
R “it
em b
ank”
OR
“cro
ss-c
ultu
ral e
quiv
alen
ce”)
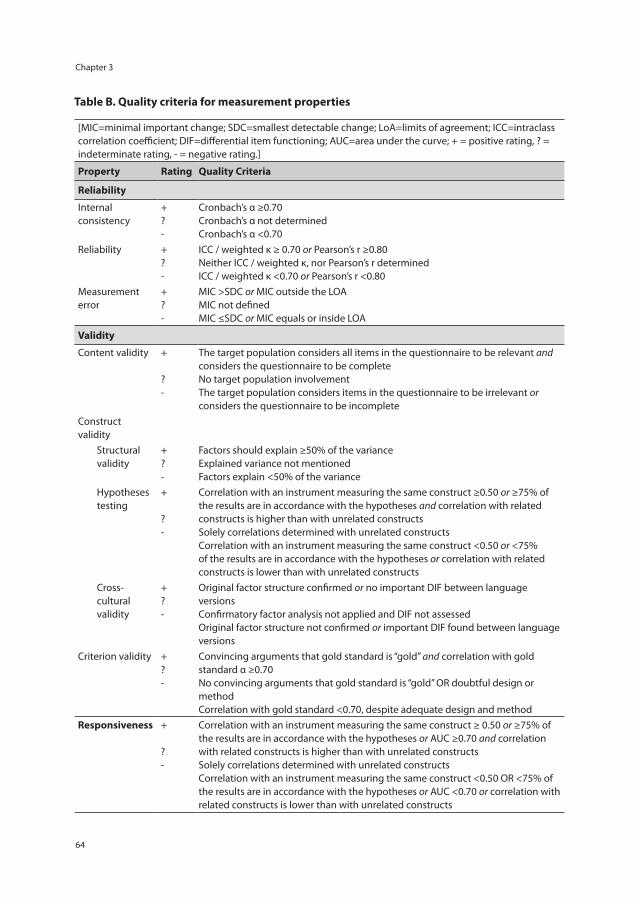
Chapter 3
64
Table B. Quality criteria for measurement properties
[MIC=minimal important change; SDC=smallest detectable change; LoA=limits of agreement; ICC=intraclass correlation coefficient; DIF=differential item functioning; AUC=area under the curve; + = positive rating, ? = indeterminate rating, - = negative rating.]
Property Rating Quality Criteria
Reliability
Internal consistency
+ ? -
Cronbach’s α ≥0.70 Cronbach’s α not determined Cronbach’s α <0.70
Reliability + ? -
ICC / weighted κ ≥ 0.70 or Pearson’s r ≥0.80 Neither ICC / weighted κ, nor Pearson’s r determined ICC / weighted κ <0.70 or Pearson’s r <0.80
Measurement error
+ ? -
MIC >SDC or MIC outside the LOA MIC not defined MIC ≤SDC or MIC equals or inside LOA
Validity
Content validity + ? -
The target population considers all items in the questionnaire to be relevant and considers the questionnaire to be complete No target population involvement The target population considers items in the questionnaire to be irrelevant or considers the questionnaire to be incomplete
Construct validity
Structural validity
+ ? -
Factors should explain ≥50% of the variance Explained variance not mentioned Factors explain <50% of the variance
Hypotheses testing
+ ? -
Correlation with an instrument measuring the same construct ≥0.50 or ≥75% of the results are in accordance with the hypotheses and correlation with related constructs is higher than with unrelated constructs Solely correlations determined with unrelated constructs Correlation with an instrument measuring the same construct <0.50 or <75% of the results are in accordance with the hypotheses or correlation with related constructs is lower than with unrelated constructs
Cross-cultural validity
+ ? -
Original factor structure confirmed or no important DIF between language versions Confirmatory factor analysis not applied and DIF not assessed Original factor structure not confirmed or important DIF found between language versions
Criterion validity + ? -
Convincing arguments that gold standard is “gold” and correlation with gold standard α ≥0.70 No convincing arguments that gold standard is “gold” OR doubtful design or method Correlation with gold standard <0.70, despite adequate design and method
Responsiveness +
? -
Correlation with an instrument measuring the same construct ≥ 0.50 or ≥75% of the results are in accordance with the hypotheses or AUC ≥0.70 and correlation with related constructs is higher than with unrelated constructs Solely correlations determined with unrelated constructs Correlation with an instrument measuring the same construct <0.50 OR <75% of the results are in accordance with the hypotheses or AUC <0.70 or correlation with related constructs is lower than with unrelated constructs
Chapter 4
The cross-cultural adaptation of the Work Role Functioning Questionnaire to Dutch
F.I. AbmaB.C. Amick III
S. BrouwerJ.J.L. van der Klink
U. Bültmann
Accepted for publication in Work: Journal of Prevention, Assessment & Rehabilitation, June 2012 (epub ahead of print)
Chapter 4
66
Abstract
Objective: The study objectives were to perform a cross-cultural adaptation of the Work Role Functioning Questionnaire, a health-related work outcome measure, into Dutch and to assess the questionnaire’s reliability and validity in the Dutch context (WRFQ-DV).
Methods: The WRFQ translation and adaptation were conducted using a systematic approach with the following steps: forward translation, synthesis, back-translation, consolidation of translations with expert committee, and pre-testing. To evaluate the comprehensibility, usability, applicability and completeness of the translated questionnaire, a total of 40 interviews with workers with a health problem (duration > one month) were performed.
Results: The questionnaire translation was conducted without major difficulties. During the process, questionnaire instructions were modified and 5 items reformulated based on the participants’ responses. Participants were positive on the comprehensibility, usability, applicability and completeness of the questionnaire, and also made suggestions for the further development of the WRFQ-DV. Furthermore, the study shows promising results concerning the psychometric properties of the WRFQ-DV (e.g. Cronbach’s alphas for the subscales between 0.70 and 0.91, and good content validity).
Conclusions: The results indicate that the cross-cultural adaptation of the WRFQ-DV was successful and that the psychometric properties of the translated version are promising.
Keywords: psychometrics, validation, work outcome measure, health condition
The cross-cultural adaptation of the Work Role Functioning Questionnaire to Dutch
67
4
Introduction
In Europe, the percentage of the working age population with a longstanding health problem or disability (including mental health problems) varies between 5.8% (Romania) and 32.2% (Finland). In the Netherlands, this percentage is 25.4% [1]. Due to demographic, political and social changes, i.e., the ageing workforce, a shift from a workers’ compensation model to a work participation model, the increase of retirement age and advances in medical treatment, more persons will likely participate in the labour force with a health problem that may interfere with their ability to accomplish their work [2]. Along with the focus of occupational health research and practice on work disability prevention, the promotion of a sustainable working life attracts more and more attention. Instruments are needed to evaluate interventions aimed at work rehabilitation and the management and prevention of work (dis)ability, and to monitor how health problems impact on work functioning. In the US, instruments have been developed in the 90s, such as the Work Role Functioning Questionnaire (WRFQ), the Work Limitations Questionnaire (WLQ) and the Work Limitations-26 (WL-26) - all based on the same item pool [3-5]. In the Netherlands, no native or cross-culturally adapted health-related work outcome measure is available and validated to assess the impact of a health problem on work functioning. Because of possible cultural differences in work and health, instruments need to be systematically translated, adapted and validated for its use in other cultural contexts. Guillemin and Beaton [6,7] provide guidelines for the cross-cultural adaptation of questionnaires The approach consists of six steps: forward translation, synthesis, back translation, expert committee review, pre-testing and the formulation of the definitive translated version. Recently, the WRFQ has been successfully cross-culturally translated and adapted for use in other cultural contexts than the US, i.e. the translation to Canadian French [8] and Brazilian Portuguese [9]. The study objectives are a) to perform a cross-cultural translation and adaptation of the Work Role Functioning Questionnaire to Dutch and b) to assess the reliability and validity of the pre-final questionnaire in a pre-test.
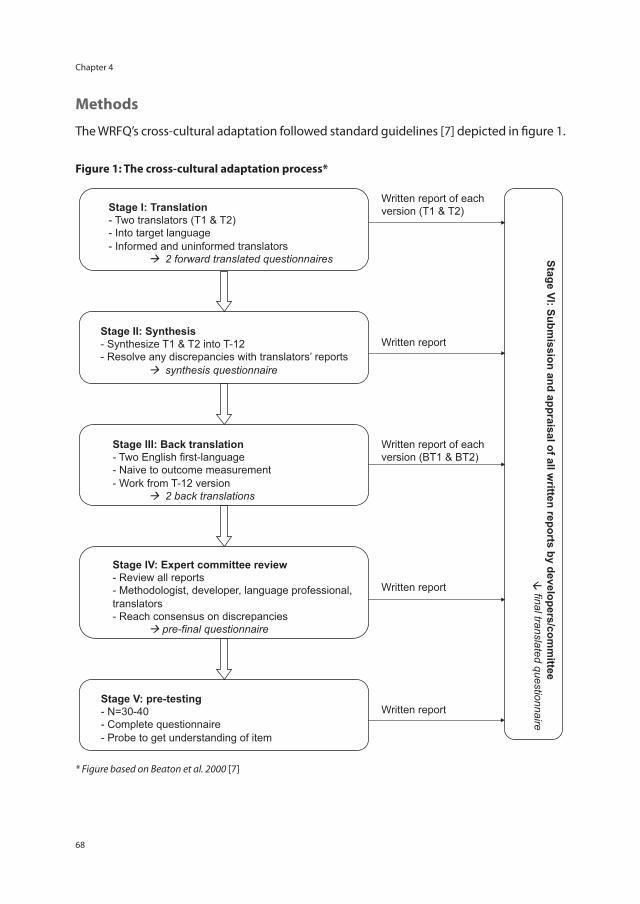
Chapter 4
68
Methods
The WRFQ’s cross-cultural adaptation followed standard guidelines [7] depicted in figure 1.
Figure 1: The cross-cultural adaptation process*
Stage I: Translation - Two translators (T1 & T2) - Into target language - Informed and uninformed translators
2 forward translated questionnaires
Stage II: Synthesis - Synthesize T1 & T2 into T-12 - Resolve any discrepancies with translators’ reports
synthesis questionnaire
Stage III: Back translation - Two English first-language - Naive to outcome measurement - Work from T-12 version
2 back translations
Stage IV: Expert committee review - Review all reports - Methodologist, developer, language professional, translators - Reach consensus on discrepancies
pre-final questionnaire
Stage V: pre-testing - N=30-40 - Complete questionnaire - Probe to get understanding of item
Stage VI: Submission and appraisal of all w
ritten reports by developers/comm
ittee
final translated questionnaire
Written report of each version (T1 & T2)
Written report
Written report of each version (BT1 & BT2)
Written report
Written report
* Figure based on Beaton et al. 2000 [7]
The cross-cultural adaptation of the Work Role Functioning Questionnaire to Dutch
69
4
The cross-cultural adaptationForward translationThe forward translation of questionnaire items and instructions was performed by four independent translators. Of the four translators two were of the research team and the other two were professional and bilingual translators. While the former were aware of the concepts being measured and had previous experience translating questionnaires, the latter had no medical background or knowledge about the WRFQ’s concepts.
Synthesis of the translationsTo obtain a common Dutch version, the translated questionnaires were compared. When differences in translation were observed, translators and research team members were required to reach consensus. A synthesis questionnaire was developed and a synthesis report was written on the process used, problems experienced and how they were resolved.
Back translationThe synthesis questionnaire was back-translated into English by two other professional, bilingual translators who worked independently from each other. Translators were unfamiliar to the questionnaire concepts and had no medical background. The back translation facilitates examining whether the translation led to semantic or conceptual differences.
Expert committeeTo consolidate all the translated versions into a pre-final questionnaire, an expert committee was formed. This multidisciplinary expert committee consisted of a methodologist, (occupational) health professionals, and language professionals. Discrepancies between the original and translated versions were identified and discussed. According to the guidelines [6,7], semantic, idiomatic, experiential and conceptual equivalences were evaluated. Consensus was reached and a pre-final questionnaire was obtained. Again, a synthesis report was written on the process, the problems and how they were resolved.
Pre-testTo evaluate the equivalence and comprehensibility of the translated version a pre-test was performed. A total of 40 participants were included in the pre-test. Inclusion criteria were: the presence of a health problem (minimum duration one month), currently working (8 hours or more), aged 18-65 years and able to read and understand the Dutch language. Workers were identified by their occupational physician and then invited to participate. After completing the WRFQ, a short interview was conducted with each participant. The interview aimed to identify the participants’ opinion on the questionnaire’s usability,
Chapter 4
70
applicability, and completeness. Directly after completing the questionnaire, participants were asked several questions about the wording of the instructions and items, the lay-out, their overall impression of the questionnaire and whether they missed any aspects of their work functioning. All interview data were discussed in the research team and collaboratively decisions were made whether changes in the questionnaire were necessary. The interviews were conducted at the University or at an Occupational Health Service. The length of the interview was on average 30 minutes, including questionnaire completion.
Work Role Functioning QuestionnaireThe WRFQ measures the perceived difficulties in meeting work demands among employees given their physical health or emotional problems [3,10]. The questionnaire consists of 27 items, divided into five subscales: work scheduling demands, physical demands, mental demands, social demands, and output demands. The first two columns of Table 1 show all items and subscales of the original English version. The recall period is 4 weeks and the response options range on a five point scale from 0=difficult all the time (100%), 1=difficult most of the time, 2=difficult half of the time (50%), 3=difficult some of the time, 4=difficult none of the time (0%). Another response option ‘Does not apply to my job’ has been added to enable employees to answer, even though a particular demand is not part of their job. Subscale scores are summed up separately by adding the answers in the subscale, divided by the number of items and then multiplied with 25 to obtain percentages between 0 (difficult all the time) and 100 (difficult none of the time). The scores on ‘Does not apply to my job’ were transformed to missing values. Subscales with greater than 20% missing data are set to missing. Subscales that had more than 20% missing scores or ‘Does not apply to my job’ scores were excluded from the analysis [10].
Evaluation of the psychometric properties of the pre-final questionnaireDescriptive statistics were used to explore the data (mean, SD, median, range) and the socio-demographic characteristics of the participants. Data were analyzed using SPSS 16 [11].
Scale and item internal consistency Scale mean scores and standard deviations were calculated. To evaluate the internal consistency, Cronbach’s alphas were calculated per subscale [12]. An alpha of >0.70 was considered satisfactory. Item-to-subscale and item-to-total correlations were calculated to evaluate the fit of the item within the subscale and the total score. Moreover, scores on the questionnaires were examined with respect to missing items, distribution of item response scores, and floor and ceiling effects. Floor and ceiling effects were considered present if values exceeded the 15% norm [13].
The cross-cultural adaptation of the Work Role Functioning Questionnaire to Dutch
71
4
ValidityThe face validity of the Dutch WRFQ was evaluated by the members of the expert committee throughout the cross-cultural adaptation process and through qualitative analysis of the comments provided by the participants of the pre-test.
Results
Cross-cultural adaptation processThe forward translation of the WRFQ was conducted and some challenging idiomatic issues were encountered in the translations of item 2 (‘get going easily’), item 23 (‘train of thought’), and item 26 (‘control your temper’). Item 14 (‘pounds’) was reformulated to kilograms. Moreover, the single response statement (‘Difficult’) located at the top of the item list was found to be insufficient. The research team discussed the items in more detail with the professional translators and approached the original author for clarifications regarding the conceptual meaning of these items as well as the formulation of the response statement. Following the back translation process, some discrepancies between the forward and back translations were observed. These discrepancies pertained to the instructions and the idiomatic equivalence of several items, e.g., item 2 (‘get going easily’), item 6 (‘workload’), item 12 (‘you have done what you are capable of doing’), item 24 (‘use your eyes’), and item 26 (‘control your temper’). A pre-final questionnaire was produced, in which the instructions were somewhat extended (‘I find it difficult to …’) and items 2, 6, 12, 14, 23, 24 and 26 were revised or reformulated to reach equivalence between the original and the Dutch versions. Table 1 shows the original items of the WRFQ with the items that showed difficulties in translation marked.
Pre-testThe pre-final WRFQ questionnaire was administered to 40 workers (n=25 women and n=15 men), with a mean age of 49.2 (SD 8.8) years, and who worked on average 27 (SD 9.0) hours per week. More detailed socio-demographic information is shown in Table 2.
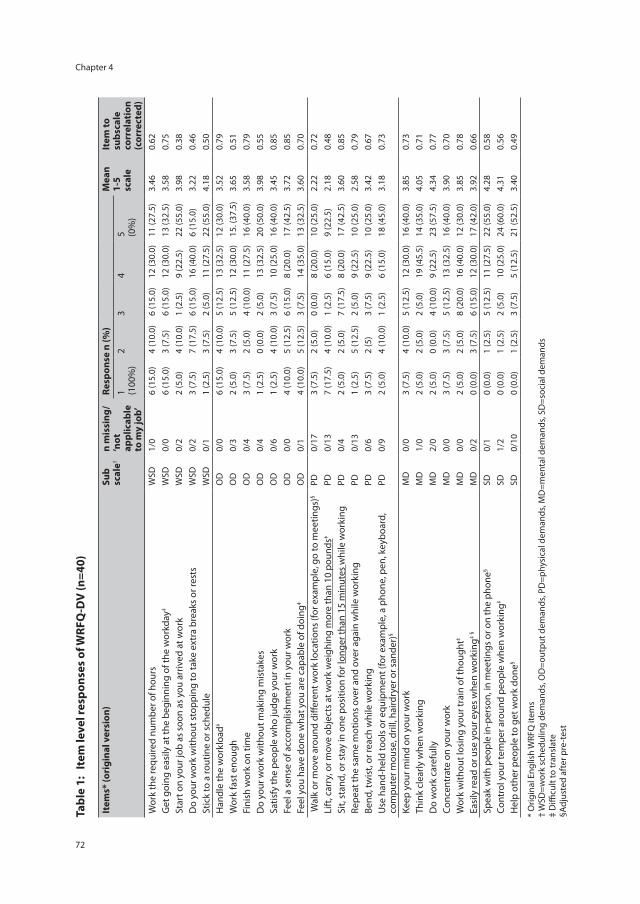
Chapter 4
72
Tabl
e 1:
Ite
m le
vel r
espo
nses
of W
RFQ
-DV
(n=4
0)
Item
s* (o
rigi
nal v
ersi
on)
Sub
scal
e†n
mis
sing
/ ‘n
ot
appl
icab
le
to m
y jo
b’
Resp
onse
n (%
)M
ean
1-5
scal
e
Item
to
subs
cale
co
rrel
atio
n (c
orre
cted
)
1 (100
%)
23
45 (0
%)
Wor
k th
e re
quire
d nu
mbe
r of h
ours
W
SD1/
06
(15.
0)4
(10.
0)6
(15.
0)12
(30.
0)11
(27.
5)3.
460.
62
Get
goi
ng e
asily
at t
he b
egin
ning
of t
he w
orkd
ay‡
WSD
0/0
6 (1
5.0)
3 (7
.5)
6 (1
5.0)
12 (3
0.0)
13 (3
2.5)
3.58
0.75
Star
t on
your
job
as s
oon
as y
ou a
rriv
ed a
t wor
k W
SD0/
22
(5.0
)4
(10.
0)1
(2.5
)9
(22.
5)22
(55.
0)3.
980.
38
Do
your
wor
k w
ithou
t sto
ppin
g to
take
ext
ra b
reak
s or
rest
sW
SD0/
23
(7.5
)7
(17.
5)6
(15.
0)16
(40.
0)6
(15.
0)3.
220.
46
Stic
k to
a ro
utin
e or
sch
edul
eW
SD0/
11
(2.5
)3
(7.5
)2
(5.0
)11
(27.
5)22
(55.
0)4.
180.
50
Han
dle
the
wor
kloa
d‡O
D0/
06
(15.
0)4
(10.
0)5
(12.
5)13
(32.
5)12
(30.
0)3.
520.
79
Wor
k fa
st e
noug
hO
D0/
32
(5.0
)3
(7.5
)5
(12.
5)12
(30.
0)15
. (37
.5)
3.65
0.51
Fini
sh w
ork
on ti
me
OD
0/4
3 (7
.5)
2 (5
.0)
4 (1
0.0)
11 (2
7.5)
16 (4
0.0)
3.58
0.79
Do
your
wor
k w
ithou
t mak
ing
mis
take
sO
D0/
41
(2.5
)0
(0.0
)2
(5.0
)13
(32.
5)20
(50.
0)3.
980.
55
Satis
fy th
e pe
ople
who
judg
e yo
ur w
ork
OD
0/6
1 (2
.5)
4 (1
0.0)
3 (7
.5)
10 (2
5.0)
16 (4
0.0)
3.45
0.85
Feel
a s
ense
of a
ccom
plis
hmen
t in
your
wor
kO
D0/
04
(10.
0)5
(12.
5)6
(15.
0)8
(20.
0)17
(42.
5)3.
720.
85
Feel
you
hav
e do
ne w
hat y
ou a
re c
apab
le o
f doi
ng‡
OD
0/1
4 (1
0.0)
5 (1
2.5)
3 (7
.5)
14 (3
5.0)
13 (3
2.5)
3.60
0.70
Wal
k or
mov
e ar
ound
diff
eren
t wor
k lo
catio
ns (f
or e
xam
ple,
go
to m
eetin
gs)§
PD0/
173
(7.5
)2
(5.0
)0
(0.0
)8
(20.
0)10
(25.
0)2.
220.
72
Lift
, car
ry, o
r mov
e ob
ject
s at
wor
k w
eigh
ing
mor
e th
an 1
0 po
unds
‡PD
0/13
7
(17.
5)4
(10.
0)1
(2.5
)6
(15.
0)9
(22.
5)2.
180.
48
Sit,
stan
d, o
r sta
y in
one
pos
ition
for l
onge
r tha
n 15
min
utes
whi
le w
orki
ngPD
0/4
2 (5
.0)
2 (5
.0)
7 (1
7.5)
8 (2
0.0)
17 (4
2.5)
3.60
0.85
Repe
at th
e sa
me
mot
ions
ove
r and
ove
r aga
in w
hile
wor
king
PD0/
131
(2.5
)5
(12.
5)2
(5.0
)9
(22.
5)10
(25.
0)2.
580.
79
Bend
, tw
ist,
or re
ach
whi
le w
orki
ngPD
0/6
3 (7
.5)
2 (5
)3
(7.5
)9
(22.
5)10
(25.
0)3.
420.
67
Use
han
d-he
ld to
ols
or e
quip
men
t (fo
r exa
mpl
e, a
pho
ne, p
en, k
eybo
ard,
co
mpu
ter m
ouse
, dril
l, ha
irdry
er o
r san
der)
§PD
0/9
2 (5
.0)
4 (1
0.0)
1 (2
.5)
6 (1
5.0)
18 (4
5.0)
3.18
0.73
Keep
you
r min
d on
you
r wor
kM
D0/
03
(7.5
)4
(10.
0)5
(12.
5)12
(30.
0)16
(40.
0)3.
850.
73
Thin
k cl
early
whe
n w
orki
ngM
D1/
02
(5.0
)2
(5.0
)2
(5.0
)19
(45.
5)14
(35.
0)4.
050.
71
Do
wor
k ca
refu
llyM
D2/
02
(5.0
)0
(0.0
)4
(10.
0)9
(22.
5)23
(57.
5)4.
340.
77
Conc
entr
ate
on y
our w
ork
MD
0/0
3 (7
.5)
3 (7
.5)
5 (1
2.5)
13 (3
2.5)
16 (4
0.0)
3.90
0.70
Wor
k w
ithou
t los
ing
your
trai
n of
thou
ght‡
MD
0/0
2 (5
.0)
2 (5
.0)
8 (2
0.0)
16 (4
0.0)
12 (3
0.0)
3.85
0.78
Easi
ly re
ad o
r use
you
r eye
s w
hen
wor
king
‡ §
MD
0/2
0 (0
.0)
3 (7
.5)
6 (1
5.0)
12 (3
0.0)
17 (4
2.0)
3.92
0.66
Spea
k w
ith p
eopl
e in
-per
son,
in m
eetin
gs o
r on
the
phon
e§SD
0/1
0 (0
.0)
1 (2
.5)
5 (1
2.5)
11 (2
7.5)
22 (5
5.0)
4.28
0.58
Cont
rol y
our t
empe
r aro
und
peop
le w
hen
wor
king
‡SD
1/2
0 (0
.0)
1 (2
.5)
2 (5
.0)
10 (2
5.0)
24 (6
0.0)
4.31
0.56
Hel
p ot
her p
eopl
e to
get
wor
k do
ne§
SD0/
100
(0.0
)1
(2.5
)3
(7.5
)5
(12.
5)21
(52.
5)3.
400.
49
* O
rigin
al E
nglis
h W
RFQ
item
s †
WSD
=wor
k sc
hedu
ling
dem
ands
, OD
=out
put d
eman
ds, P
D=p
hysi
cal d
eman
ds, M
D=m
enta
l dem
ands
, SD
=soc
ial d
eman
ds‡
Diffi
cult
to tr
ansl
ate
§Adj
uste
d af
ter p
re-t
est
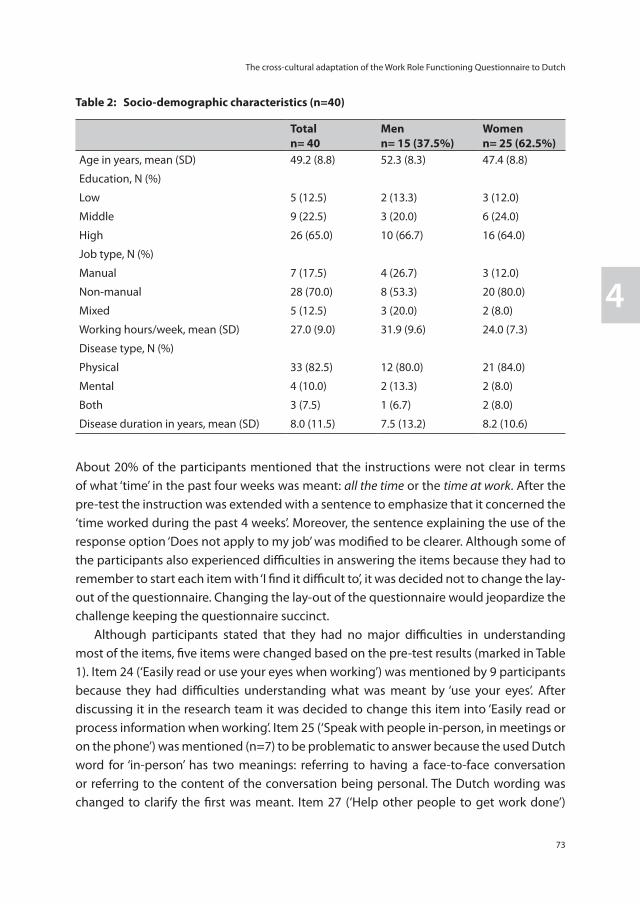
The cross-cultural adaptation of the Work Role Functioning Questionnaire to Dutch
73
4
Tabl
e 1:
Ite
m le
vel r
espo
nses
of W
RFQ
-DV
(n=4
0)
Item
s* (o
rigi
nal v
ersi
on)
Sub
scal
e†n
mis
sing
/ ‘n
ot
appl
icab
le
to m
y jo
b’
Resp
onse
n (%
)M
ean
1-5
scal
e
Item
to
subs
cale
co
rrel
atio
n (c
orre
cted
)
1 (100
%)
23
45 (0
%)
Wor
k th
e re
quire
d nu
mbe
r of h
ours
W
SD1/
06
(15.
0)4
(10.
0)6
(15.
0)12
(30.
0)11
(27.
5)3.
460.
62
Get
goi
ng e
asily
at t
he b
egin
ning
of t
he w
orkd
ay‡
WSD
0/0
6 (1
5.0)
3 (7
.5)
6 (1
5.0)
12 (3
0.0)
13 (3
2.5)
3.58
0.75
Star
t on
your
job
as s
oon
as y
ou a
rriv
ed a
t wor
k W
SD0/
22
(5.0
)4
(10.
0)1
(2.5
)9
(22.
5)22
(55.
0)3.
980.
38
Do
your
wor
k w
ithou
t sto
ppin
g to
take
ext
ra b
reak
s or
rest
sW
SD0/
23
(7.5
)7
(17.
5)6
(15.
0)16
(40.
0)6
(15.
0)3.
220.
46
Stic
k to
a ro
utin
e or
sch
edul
eW
SD0/
11
(2.5
)3
(7.5
)2
(5.0
)11
(27.
5)22
(55.
0)4.
180.
50
Han
dle
the
wor
kloa
d‡O
D0/
06
(15.
0)4
(10.
0)5
(12.
5)13
(32.
5)12
(30.
0)3.
520.
79
Wor
k fa
st e
noug
hO
D0/
32
(5.0
)3
(7.5
)5
(12.
5)12
(30.
0)15
. (37
.5)
3.65
0.51
Fini
sh w
ork
on ti
me
OD
0/4
3 (7
.5)
2 (5
.0)
4 (1
0.0)
11 (2
7.5)
16 (4
0.0)
3.58
0.79
Do
your
wor
k w
ithou
t mak
ing
mis
take
sO
D0/
41
(2.5
)0
(0.0
)2
(5.0
)13
(32.
5)20
(50.
0)3.
980.
55
Satis
fy th
e pe
ople
who
judg
e yo
ur w
ork
OD
0/6
1 (2
.5)
4 (1
0.0)
3 (7
.5)
10 (2
5.0)
16 (4
0.0)
3.45
0.85
Feel
a s
ense
of a
ccom
plis
hmen
t in
your
wor
kO
D0/
04
(10.
0)5
(12.
5)6
(15.
0)8
(20.
0)17
(42.
5)3.
720.
85
Feel
you
hav
e do
ne w
hat y
ou a
re c
apab
le o
f doi
ng‡
OD
0/1
4 (1
0.0)
5 (1
2.5)
3 (7
.5)
14 (3
5.0)
13 (3
2.5)
3.60
0.70
Wal
k or
mov
e ar
ound
diff
eren
t wor
k lo
catio
ns (f
or e
xam
ple,
go
to m
eetin
gs)§
PD0/
173
(7.5
)2
(5.0
)0
(0.0
)8
(20.
0)10
(25.
0)2.
220.
72
Lift
, car
ry, o
r mov
e ob
ject
s at
wor
k w
eigh
ing
mor
e th
an 1
0 po
unds
‡PD
0/13
7
(17.
5)4
(10.
0)1
(2.5
)6
(15.
0)9
(22.
5)2.
180.
48
Sit,
stan
d, o
r sta
y in
one
pos
ition
for l
onge
r tha
n 15
min
utes
whi
le w
orki
ngPD
0/4
2 (5
.0)
2 (5
.0)
7 (1
7.5)
8 (2
0.0)
17 (4
2.5)
3.60
0.85
Repe
at th
e sa
me
mot
ions
ove
r and
ove
r aga
in w
hile
wor
king
PD0/
131
(2.5
)5
(12.
5)2
(5.0
)9
(22.
5)10
(25.
0)2.
580.
79
Bend
, tw
ist,
or re
ach
whi
le w
orki
ngPD
0/6
3 (7
.5)
2 (5
)3
(7.5
)9
(22.
5)10
(25.
0)3.
420.
67
Use
han
d-he
ld to
ols
or e
quip
men
t (fo
r exa
mpl
e, a
pho
ne, p
en, k
eybo
ard,
co
mpu
ter m
ouse
, dril
l, ha
irdry
er o
r san
der)
§PD
0/9
2 (5
.0)
4 (1
0.0)
1 (2
.5)
6 (1
5.0)
18 (4
5.0)
3.18
0.73
Keep
you
r min
d on
you
r wor
kM
D0/
03
(7.5
)4
(10.
0)5
(12.
5)12
(30.
0)16
(40.
0)3.
850.
73
Thin
k cl
early
whe
n w
orki
ngM
D1/
02
(5.0
)2
(5.0
)2
(5.0
)19
(45.
5)14
(35.
0)4.
050.
71
Do
wor
k ca
refu
llyM
D2/
02
(5.0
)0
(0.0
)4
(10.
0)9
(22.
5)23
(57.
5)4.
340.
77
Conc
entr
ate
on y
our w
ork
MD
0/0
3 (7
.5)
3 (7
.5)
5 (1
2.5)
13 (3
2.5)
16 (4
0.0)
3.90
0.70
Wor
k w
ithou
t los
ing
your
trai
n of
thou
ght‡
MD
0/0
2 (5
.0)
2 (5
.0)
8 (2
0.0)
16 (4
0.0)
12 (3
0.0)
3.85
0.78
Easi
ly re
ad o
r use
you
r eye
s w
hen
wor
king
‡ §
MD
0/2
0 (0
.0)
3 (7
.5)
6 (1
5.0)
12 (3
0.0)
17 (4
2.0)
3.92
0.66
Spea
k w
ith p
eopl
e in
-per
son,
in m
eetin
gs o
r on
the
phon
e§SD
0/1
0 (0
.0)
1 (2
.5)
5 (1
2.5)
11 (2
7.5)
22 (5
5.0)
4.28
0.58
Cont
rol y
our t
empe
r aro
und
peop
le w
hen
wor
king
‡SD
1/2
0 (0
.0)
1 (2
.5)
2 (5
.0)
10 (2
5.0)
24 (6
0.0)
4.31
0.56
Hel
p ot
her p
eopl
e to
get
wor
k do
ne§
SD0/
100
(0.0
)1
(2.5
)3
(7.5
)5
(12.
5)21
(52.
5)3.
400.
49
* O
rigin
al E
nglis
h W
RFQ
item
s †
WSD
=wor
k sc
hedu
ling
dem
ands
, OD
=out
put d
eman
ds, P
D=p
hysi
cal d
eman
ds, M
D=m
enta
l dem
ands
, SD
=soc
ial d
eman
ds‡
Diffi
cult
to tr
ansl
ate
§Adj
uste
d af
ter p
re-t
est
Table 2: Socio-demographic characteristics (n=40)
Totaln= 40
Menn= 15 (37.5%)
Womenn= 25 (62.5%)
Age in years, mean (SD) 49.2 (8.8) 52.3 (8.3) 47.4 (8.8)
Education, N (%)
Low 5 (12.5) 2 (13.3) 3 (12.0)
Middle 9 (22.5) 3 (20.0) 6 (24.0)
High 26 (65.0) 10 (66.7) 16 (64.0)
Job type, N (%)
Manual 7 (17.5) 4 (26.7) 3 (12.0)
Non-manual 28 (70.0) 8 (53.3) 20 (80.0)
Mixed 5 (12.5) 3 (20.0) 2 (8.0)
Working hours/week, mean (SD) 27.0 (9.0) 31.9 (9.6) 24.0 (7.3)
Disease type, N (%)
Physical 33 (82.5) 12 (80.0) 21 (84.0)
Mental 4 (10.0) 2 (13.3) 2 (8.0)
Both 3 (7.5) 1 (6.7) 2 (8.0)
Disease duration in years, mean (SD) 8.0 (11.5) 7.5 (13.2) 8.2 (10.6)
About 20% of the participants mentioned that the instructions were not clear in terms of what ‘time’ in the past four weeks was meant: all the time or the time at work. After the pre-test the instruction was extended with a sentence to emphasize that it concerned the ‘time worked during the past 4 weeks’. Moreover, the sentence explaining the use of the response option ‘Does not apply to my job’ was modified to be clearer. Although some of the participants also experienced difficulties in answering the items because they had to remember to start each item with ‘I find it difficult to’, it was decided not to change the lay-out of the questionnaire. Changing the lay-out of the questionnaire would jeopardize the challenge keeping the questionnaire succinct. Although participants stated that they had no major difficulties in understanding most of the items, five items were changed based on the pre-test results (marked in Table 1). Item 24 (‘Easily read or use your eyes when working’) was mentioned by 9 participants because they had difficulties understanding what was meant by ‘use your eyes’. After discussing it in the research team it was decided to change this item into ‘Easily read or process information when working’. Item 25 (‘Speak with people in-person, in meetings or on the phone’) was mentioned (n=7) to be problematic to answer because the used Dutch word for ‘in-person’ has two meanings: referring to having a face-to-face conversation or referring to the content of the conversation being personal. The Dutch wording was changed to clarify the first was meant. Item 27 (‘Help other people to get work done’)
Chapter 4
74
(n=3) was also rephrased because of high responses on ‘Does not apply to my job’. Items 13 (‘Walk or move around different work locations (for example, go to meetings)’) (n=5) and 18 (‘Use hand-held tools or equipment (for example, a phone, pen, keyboard, computer mouse, drill, hairdryer or sander)’) (n=7) were difficult to complete. Participants answered ‘Does not apply to my job’ because the provided examples did not match with their work. The example in item 13 was left out and the examples in item 18 re-ordered. Although 7 to 9 participants also mentioned having some difficulties with the following items, the research team decided after discussion not to change the items 1(‘Work the required number of hours’), 2 (‘Get going easily at the beginning of a workday’), 10 (‘Satisfy the people who judge your work’) and 14 (‘Lift, carry, or move objects at work weighing more than 10 pounds’). When asked, a total of 85% of the participants found it useful to complete the questionnaire. The main reasons mentioned were that the questionnaire provides insight in their situation, and can be viewed as a starting point for a conversation with a professional (e.g., occupational physician, supervisor/line manager). Participants who did not find the WRFQ useful to complete reported 1) the questionnaire had no added value at this point, but it could have had added value earlier in their situation, 2) they already had a clear picture of their functioning at work, and 3) completing the questionnaire did not change their situation. All participants were satisfied with the length of the questionnaire. About 85% of the participants reported that they would like to complete the WRFQ again, mainly to compare their scores and to monitor their work functioning. With respect to the completeness of the WRFQ, 77.5% of the participants stated that the questionnaire was complete. However, almost all participants had suggestions to expand the questionnaire to gain a full overview of their functioning at work. Suggestions made for addition concerned the communication about the disease with co-workers and supervisor/line manager, the influence of work on their health, their life next to work, how to handle work intensification, and how to deal with work accommodations.
Evaluation of the psychometric properties of the translated versionScale and item internal consistency Table 3 shows the mean scores per subscale, with higher scores indicating higher work functioning. The social demands scale has the highest scale scores (87.5, SD 15.5) and the physical demands scale the lowest (61.1, SD 24.9). The proportion of scores at ceiling was lowest for the work scheduling demands scale (2.5%) and highest for the social demands scale (32.5%), which exceeded the 15% norm [13]. No participant scored the lowest score of limited all the time on a subscale. Items with the highest scores of ‘Does not apply to my job’ were item 13 (‘Walk or move around work locations’), item 14 (‘Lifting objects more than 10 pounds’) and item 16 (‘Repetition of same movements’) of the physical demands subscale and item 27 (‘Helping others’) of the social demands subscale. The response rate
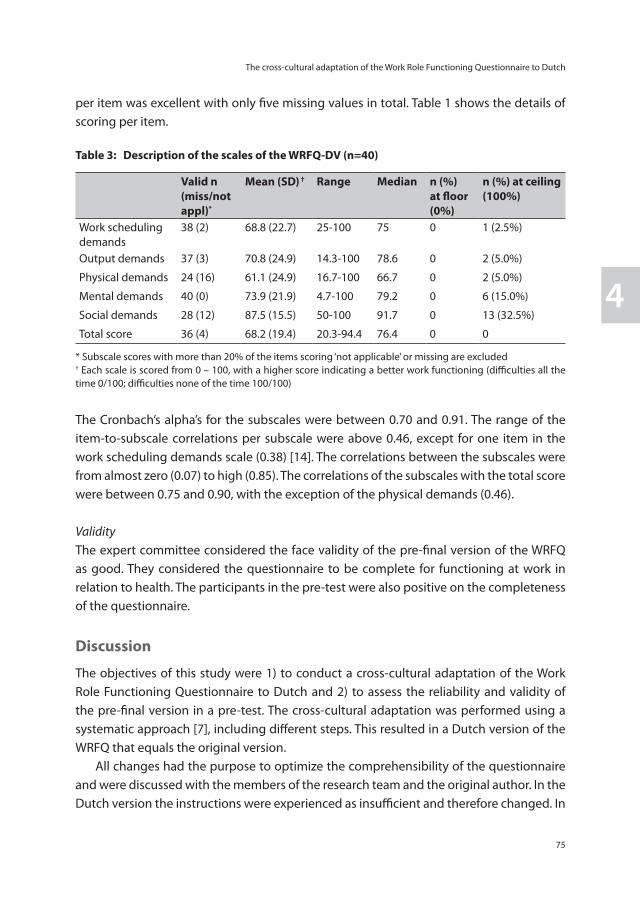
The cross-cultural adaptation of the Work Role Functioning Questionnaire to Dutch
75
4
per item was excellent with only five missing values in total. Table 1 shows the details of scoring per item.
Table 3: Description of the scales of the WRFQ-DV (n=40)
Valid n(miss/not appl)*
Mean (SD) † Range Median n (%) at floor (0%)
n (%) at ceiling (100%)
Work scheduling demands
38 (2) 68.8 (22.7) 25-100 75 0 1 (2.5%)
Output demands 37 (3) 70.8 (24.9) 14.3-100 78.6 0 2 (5.0%)
Physical demands 24 (16) 61.1 (24.9) 16.7-100 66.7 0 2 (5.0%)
Mental demands 40 (0) 73.9 (21.9) 4.7-100 79.2 0 6 (15.0%)
Social demands 28 (12) 87.5 (15.5) 50-100 91.7 0 13 (32.5%)
Total score 36 (4) 68.2 (19.4) 20.3-94.4 76.4 0 0
* Subscale scores with more than 20% of the items scoring ‘not applicable’ or missing are excluded† Each scale is scored from 0 – 100, with a higher score indicating a better work functioning (difficulties all the time 0/100; difficulties none of the time 100/100)
The Cronbach’s alpha’s for the subscales were between 0.70 and 0.91. The range of the item-to-subscale correlations per subscale were above 0.46, except for one item in the work scheduling demands scale (0.38) [14]. The correlations between the subscales were from almost zero (0.07) to high (0.85). The correlations of the subscales with the total score were between 0.75 and 0.90, with the exception of the physical demands (0.46).
ValidityThe expert committee considered the face validity of the pre-final version of the WRFQ as good. They considered the questionnaire to be complete for functioning at work in relation to health. The participants in the pre-test were also positive on the completeness of the questionnaire.
Discussion
The objectives of this study were 1) to conduct a cross-cultural adaptation of the Work Role Functioning Questionnaire to Dutch and 2) to assess the reliability and validity of the pre-final version in a pre-test. The cross-cultural adaptation was performed using a systematic approach [7], including different steps. This resulted in a Dutch version of the WRFQ that equals the original version. All changes had the purpose to optimize the comprehensibility of the questionnaire and were discussed with the members of the research team and the original author. In the Dutch version the instructions were experienced as insufficient and therefore changed. In
Chapter 4
76
the Canadian French and Brazilian Portuguese versions the instructions were also changed [8,9]. Although Gallasch et al [9] changed the lay-out of the questionnaire (include the expression ‘difficult’ in each statement), the Dutch version retained the original lay-out. Several items proved difficult to translate and others were changed based on the pre-test. Some overlap is visible with the item translation to Canadian French. For example Durand describes difficulties translating items 2, 6, and 26 and they also removed the examples in the items 13 and 18 based on their pre-test results [8]. Participants’ scores in the pre-test were rather high, indicating little difficulties in performing job demands. The absence of floor and ceiling scores (< 15% with the exception of the social demands subscale) indicates the ability of the questionnaire to distinguish between high and low scores [13] in populations of workers with a health condition, which provides evidence for the content validity. The use of the ‘Does not apply to my job’ response option was relatively high for the physical demands subscale. An explanation could be that the items in this subscale are more relevant for participants with physical jobs and that our sample consisted of a highly educated sample with most non-manual jobs. Similar results were also found in previous studies [8,9]. Although both the expert committee and the participants evaluated the Dutch version as complete, several suggestions were made to extend the questionnaire. For example the domain of emotional demands in work and communication with colleagues and supervisors/line managers about the disease were mentioned. Future research should be directed towards the exploration of additional items or domains reflecting today’s work. The results suggest that the Dutch version of the WRFQ has good acceptability and psychometric properties. The internal consistency was good, all subscales had a Cronbach’s alpha higher than 0.70. Similar results were obtained with other cross-culturally adapted versions of the WRFQ studies [8,9]. A limitation of the present study is that a majority of the participants in the pre-test had a rather high educational level and had non-manual jobs when compared to the Dutch population [15]. This might pose some limitations for the generalizability of the results to lower educated workers and manual workers. More research in larger and more heterogeneous samples is needed to examine the psychometric properties in more detail (e.g. test-retest, responsiveness and validity).
Conclusion
The cross-cultural adaptation process was completed without major difficulties. The translated version of the WRFQ shows promising results with respect to the psychometric properties. This study shows that the WRFQ-DV, a health-related work outcome measure, can be of benefit to researchers and professionals in the field of work disability prevention and rehabilitation. The questionnaire provides valuable information on a persons work functioning.
The cross-cultural adaptation of the Work Role Functioning Questionnaire to Dutch
77
4
References
1. Dupré D, Karjalainen A (2003) Eurostat, Statistics in focus: Employment of disabled people in Europe in 2002, Eurostat theme 3: population and social conditions.
2. Jagger C, Gillies C, Moscone F, Cambois E, Van OH, Nusselder W, Robine JM (2008) Inequalities in healthy life years in the 25 countries of the European Union in 2005: a cross-national meta-regression analysis. Lancet 372(9656), 2124-2131.
3. Amick BC,III, Lerner D, Rogers WH, Rooney T, Katz JN (2000) A review of health-related work outcome measures and their uses, and recommended measures. Spine 25(24), 3152-3160.
4. Lerner D, Amick BC,III, Rogers WH, Malspeis S, Bungay K, Cynn D (2001) The Work Limitations Questionnaire. Med.Care 39(1), 72-85.
5. Lerner DJ, Amick III BC, Malspeis S, Rogers WH (2000) A national survey of health-related work limitations among employed persons in the United States. Disability and rehabilitation: an international, multidisciplinary journal 22(5), 225-232.
6. Guillemin F, Bombardier C, Beaton D (1993) Cross-cultural adaptation of health-related quality of life measures: literature review and proposed guidelines. J.Clin.Epidemiol. 46(12), 1417-1432.
7. Beaton DE, Bombardier C, Guillemin F, Ferraz MB (2000) Guidelines for the process of cross-cultural adaptation of self-report measures. Spine 25(24), 3186-3191.
8. Durand MJ, Vachon B, Hong QN, Imbeau D, Amick BC,III, Loisel P (2004) The cross-cultural adaptation of the Work Role Functioning Questionnaire in Canadian French. Int.J.Rehabil.Res. 27(4), 261-268.
9. Gallasch CH, Alexandre NMC, Amick B (2007) Cross-cultural Adaptation, Reliability, and Validity of the Work Role Functioning Questionnaire to Brazilian Portuguese. Journal of Occupational Rehabilitation 17(4), 701-711.
10. Amick BC,III, Habeck RV, Ossmann J, Fossel AH, Keller R, Katz JN (2004) Predictors of successful work role functioning after carpal tunnel release surgery. Journal of Occupational and Environmental Medicine 46(5), 490-500.
11. SPSS (2007) Statistical Package for Social Sciences 16.0 (SPSS).
12. Cronbach LJ (1951) Coefficient alpha and the internal structure of tests. Psychometrika 16, 297-334.
13. Terwee CB, Bot SD, de Boer MR, van der Windt DA, Knol DL, Dekker J, Bouter LM, de Vet HC (2007) Quality criteria were proposed for measurement properties of health status questionnaires. J.Clin.Epidemiol. 60(1), 34-42.
14. Streiner DL, Norman GR. (2008) Health measurement scales: a practical guide to their development and use. Oxford: Oxford University Press.
15. Statline database. Statistics Netherlands. Available at: http://statline.cbs.nl/StatWeb, [Accessed December 2009].

Chapter 5
The Work Role Functioning Questionnaire 2.0 (Dutch version): Examination of its Reliability, Validity and Responsiveness in the general working population
F.I. AbmaJ.J.L. van der Klink
U. Bültmann
Accepted for publication in Journal of Occupational Rehabilitation, July 2012 (epub ahead of print)
Chapter 5
80
Abstract
Purpose: The promotion of a sustainable, healthy and productive working life attracts more and more attention. Recently the Work Role Functioning Questionnaire (WRFQ) has been cross-culturally translated and adapted to Dutch. This questionnaire aims to measure the health-related work functioning of workers with health problems. The aim of this study is to evaluate the reliability, validity (including five new items) and responsiveness of the WRFQ 2.0 in the working population.
Methods: A longitudinal study was conducted among workers. The reliability (internal consistency, test-retest reliability, measurement error), validity (structural validity-factor analysis, construct validity by means of hypotheses testing) and responsiveness of the WRFQ 2.0 were evaluated.
Results: A total of N=553 workers completed the survey. The final WRFQ 2.0 has four subscales and showed very good internal consistency, moderate test-retest reliability, good construct validity and moderate responsiveness in the working population. The WRFQ was able to distinguish between groups with different levels of mental health, physical health, fatigue and need for recovery. A moderate correlation was found between WRFQ and related constructs respectively work ability and work productivity. A weak relationship was found with general self-rated health, work engagement and work involvement.
Conclusion: The WRFQ 2.0 is a reliable and valid instrument to measure health-related work functioning in the working population. Further validation in larger samples is recommended, especially for test-retest reliability, responsiveness and the questionnaire’s ability to predict the future course of health-related work functioning.
Keywords: measurement properties, validation, questionnaire, work functioning
The Work Role Functioning Questionnaire 2.0: Reliability, Validity and Responsiveness
81
5
Introduction
Along with the focus of occupational health research and practice on work disability prevention, the promotion of a sustainable, healthy and productive working life attracts more and more attention. In view of the expected shortages in the labor force and demographic changes, the challenge is to help workers stay at work in a healthy and productive way. However, valid measurement of the impact of health on work functioning is an important research challenge [1]. In line with this, measurement tools are needed that go beyond the simple dichotomy of working versus non-working, but that assess how workers function at work. Measuring work functioning can provide valuable information for both practitioners and researchers. Instruments that measure work functioning can be used to evaluate interventions aimed at work rehabilitation and the management and prevention of work (dis)ability, and to monitor how health problems impact on work functioning [2]. Health-related work functioning can be seen as a continuum that varies from working successfully (i.e., the ability to meet all work demands for a given state of health) to work absence (i.e., the inability to meet all work demands given a state of health) [3]. The joint influence of work and health determines an individual’s work functioning. Multiple self-reported questionnaires have been developed to measure the impact of health on work functioning. Overviews of existing questionnaires are provided in several reviews [2,4-12]. These questionnaires can be used to evaluate lost productivity at work, to monitor abilities to accomplish the work role and evaluate interventions designed to improve work functioning [2]. Recently, one of these questionnaires, the Work Role Functioning Questionnaire (WRFQ), has been successfully cross-culturally translated and adapted for use in other cultural contexts than the US, i.e. translations to Canadian French [13], Brazilian Portuguese [14] and Dutch [15]. The Work Role Functioning Questionnaire (WRFQ) was used because it is a generic instrument developed to represent a broad variety of both job demands and health problems. In addition, the WRFQ is freely available in the literature for professionals and researchers. No published data is available for the original 27 item WRFQ, but the translated versions have shown good measurement properties in workers with musculoskeletal disorders [13,14] and workers with chronic conditions [15]. During the interviews conducted as part of the pre-test during the cross-cultural adaptation to Dutch [15], participants were asked whether they missed any elements of their work in the questionnaire. Based on the participants suggestions and a literature search, five new items were formulated to reflect the changes in the nature of work in recent decades: multi-tasking, development of complementary skills, and increased delegation and autonomy of workers [16]. This requires that the worker has the flexibility to adapt to these changes, is flexible to multi-task and prioritize, therefore work demands flexibility.
Chapter 5
82
Hence, five new items addressing these aspects were developed and added to the original items. Before using an instrument, it is important to evaluate the measurement properties (e.g., reliability, validity, responsiveness) [17]. In addition, a recent review on the measurement properties of health-related work functioning instruments showed the need for more and better validation studies [4]. To date, little is known about the measurement properties of the Work Role Functioning Questionnaire 2.0. In addition, little is known about the relationship of this questionnaire and other constructs such as health status and job characteristics. A question to be addressed is as to whether the WRFQ is able to distinguish between groups with a different health status, or groups with different job demands. If the instrument is to be used as a detection instrument to identify workers with decreased work functioning, it should be able to differentiate between these groups. It is also interesting to investigate the correlation between the WRFQ scores and a comparator instrument, such as the Endicott Work Productivity Scale [18]. If both instruments measure a related construct, it can be expected that the scores of both instruments have a high correlation. The relationship with other related constructs such as work ability, work engagement, and work involvement are of interest to explore. Therefore, the aim of this study is to evaluate the reliability, structural validity (including the five new items), construct validity (by means of hypotheses testing) and responsiveness of the WRFQ 2.0 in the general working population. The COnsensus-based Standards for the selection of health status Measurement INstruments (COSMIN) taxonomy was used in the design of the study [19-21].
Methods
ProceduresA longitudinal survey was conducted among workers. Two versions of the baseline questionnaire were available, a short version (completion in approximately 10 minutes) and an extended version (completion in approximately 30 minutes). Participants were recruited from several companies and organizations in diverse work settings in the Netherlands, and via multiple approaches. Two companies provided the researchers the opportunity to distribute paper versions of the survey during work hours, one company provided email addresses of their workers (extended version). Another group of participants was reached by an advertisement in a regional newspaper and flyers that were distributed in a local hospital (extended version). One organization distributed an email to participants of their regular mailing list with a link to the online survey (short version). One organization provided home addresses of their participants to send an invitation letter to participate in the study. In this letter, a link to the online survey and a password was provided (short version). These participant were also invited to complete a
The Work Role Functioning Questionnaire 2.0: Reliability, Validity and Responsiveness
83
5
follow-up survey after one week. Participants received no incentive for their participation. Participants who completed the extended version were invited to provide their (email) address to receive a follow-up survey at three months.
ParticipantsThe inclusion criteria were 1) aged between 18 and 64 years, 2) working at least 12 hours per week (in the past four weeks). Exclusion criteria were 1) not able to read and understand Dutch (the language of the questionnaire), 2) being pregnant or 3) having plans to stop working within six months (for example due to retirement). As for ethical standards, in this study we adhered to the Declaration of Helsinki and the guidelines of the association of universities in the Netherlands [22]. According to the medical ethics committee of the University Medical Center Groningen no ethical approval was necessary. Participation in the study was voluntary, all participants provided informed consent, and answers were processed anonymously.
MeasuresWork Functioning. The Work Role Functioning Questionnaire (WRFQ) measures the perceived difficulties in meeting work demands among employees given their physical health or emotional problems [2,3,15,23].The original questionnaire consists of 27 items, divided into five subscales: work scheduling demands, physical demands, mental demands, social demands, and output demands. The recall period is 4 weeks and the response options range on a five-point scale from 0=difficult all the time (100%), 1=difficult most of the time, 2=difficult half of the time (50%), 3=difficult some of the time, 4=difficult none of the time (0%). There is a response option ‘Does not apply to my job’. Subscale scores are summed up separately by adding the answers in the subscale, divided by the number of items and then multiplied with 25 to obtain percentages between 0 and 100, with higher scores indicating better work functioning. The scores on ‘Does not apply to my job’ were transformed to missing values. If more than 20% or more items were missing, the score was set to missing. For the 2.0 version, five new items were formulated based on the cross-cultural adaptation to Dutch [15] and included in the questionnaire to test the reliability and validity. The WRFQ 2.0 version consists of 27 items, divided into four subscales: work scheduling & output demands (WSOD), physical demands (PD), mental & social demands (MSD), and flexibility demands (FD), comprising the new items.
Work Productivity. The Dutch version of the Endicott Work Productivity Scale (EWPS) was used to measure a related construct to work functioning with a comparable self-report instrument [18]. The EWPS consists of 25 items and each item is rated on a five-point scale (0=Never, 1=Rarely, 2=Sometimes, 3=Often, and 4=Almost always). The total score ranges from 0 (best possible score) to 100 (worst possible score) and is calculated by using the
Chapter 5
84
sum of the items divided by the number of items that were scored and multiplied by 25. No more than 1/3 of missing items are allowed. Information for the measurement properties of the Dutch version is lacking. However, data are available for the original version [18] (Cronbach’s alpha =0.93) and a Turkish translation in a common mental disorder setting [4].
General Health. The Short Form-12 is a 12-item health status questionnaire, with a physical component summary score (PCS-12) and a mental component summary score (MCS-12) [24]. The 12 items were scored and transformed according to the standard procedure [25]. The scores were transformed to a mean of 50 and a standard deviation of 10 in the general US population, with higher scores reflecting better health. In an overall question participants were asked “In general, how would you rate your health?” with the response categories “very good”, “good”, “fair”, “poor” or “very poor”. The component scores were dichotomized at the population means (50). Fatigue. Fatigue was measured by the ‘subjective experience of fatigue’ subscale of the Checklist Individual Strength (CIS-8) [26,27]. This 8-item subscale was designed to measure general severity of fatigue. The items were scored on a seven-point scale (1=yes, that is true to 7=no that is not true), with low scores indicating low fatigue. The CIS asks respondents about how they felt in the past two weeks. A total score was calculated by summing the items (reversed if necessary) and has a Cronbach’s alpha (α) of 0.88 [26]. The total score was divided into tertiles.
Need for Recovery. Need for recovery was measured with the Need for Recovery (NFR) subscale of the Dutch questionnaire on Perception and Judgment of Work (VBBA) [28,29]. The scale consists of 11 dichotomous items (yes/no) about the short-term effects of a day of work. The total score has a range from 0 to 100 with a higher score indicating higher need for recovery (α=0.88). The total score was divided into tertiles.
Job Content. The Dutch version of the Job Content Questionnaire (JCQ) was used to measure the job characteristics [30-33]. Hypotheses were formulated for two domains: Psychological job Demands (α=0.67) and Decision Latitude (α =0.77) (Skill Discretion + Decision Authority). Items were scored on a four-point scale (1=totally disagree to 4=totally agree). Scale scores were divided into tertiles.
Work ability. Three single items of the Work Ability Index (WAI) [34] were included in the survey. The first single item is the overall item “current work ability compared with the life-time best”, with a possible score of 0=completely unable to work to 10=work ability at its best. A recent study showed that the overall single item highly correlates with the total
The Work Role Functioning Questionnaire 2.0: Reliability, Validity and Responsiveness
85
5
work ability score (in a population of women on long term sick leave) [35]. Two other items were included that measure the work ability in relation to the respectively physical and mental demands of the job, with a possible score of 1=very poor to 5=very good.
Work Engagement. The 9-item version of the Utrecht Work Engagement Scale (UWES) was used to measure work engagement [36-38]. Work engagement is considered to be the antipode of burnout and is defined as a positive, fulfilling work-related state of mind that is characterized by vigor, dedication, and absorption [37]. The items were rated on a seven-point scale from 0=never to 6=always. A total score was calculated by taking the mean of all items (α=0.93).
Work Involvement. The Work Involvement Scale (WIS) was used to measure the importance of work and values about the goodness of work [39]. This 6-item scale was rated on a four-point scale (1=totally agree to 4=totally disagree). A total score was calculated by taking the weight mean of all items. A high score indicates a high work involvement.
Sociodemographics. Participant provided information about age, gender, income, job type and their current work status.
Statistical analysisAll analyses were performed with SPSS software (SPSS. Version 18.0.3 Chicago, IL; 2010).
Structural validity. Five new items were added to the original 27 items. Exploratory factor analyses (EFA) were performed to explore the new subscale structure, using principal component analysis (PCA) with varimax rotation and pairwise deletion. A combination of the scree plot, eigenvalues, factor loadings and interpretation of the factors was used to decide on the number of factors. A set of decision rules was formulated in order to reduce the number of items [40]. Items were explored for factor loading on its own factor (good if >0.5), other factors (good if <0.3), the inter-correlation of items was explored (ideal between >0.2 and <0.8), item-to-total correlation (ideal between 0.3-0.9), Cronbach’s alphas and alpha-if-item-deleted (ideal between 0.7-0.9). If an item could not meet at least two of these criteria it was considered a candidate for exclusion. Before excluding an item the contribution of the item to the conceptual model was discussed. If an item was viewed as important to the construct, it was kept.
Reliability. Cronbach’s alpha coefficients were calculated for each subscale of the WRFQ and the total score (ideal between 0.70-0.95 [40]). For test-retest reliability, a subsample recruited in one organization received a second questionnaire after one week. For these participants the intra-class correlation coefficient (ICC) was calculated for test-retest
Chapter 5
86
reliability (ideal >0.7 on group level and >0.9 on individual level [41]) and the standard error of measurement (SEM) was calculated for measurement error. The ICC and SEM analyses were performed on a stable subgroup that completed the questionnaire twice in similar conditions, with a one week interval [42]. The single measure ICC (agreement two-way random model) and SEM= SDdiff/√2 were calculated.
Description of the questionnaire. The WRFQ 2.0 mean scores, standard deviations (SD), range, % at floor/ceiling were presented for the total score and subscales. Floor and ceiling effects were considered if more than 15% of the participant reported the lowest or highest scores [42]. Participants scores were presented by health status and job type.
Construct validity by means of hypotheses testing. The construct validity was studied by means of hypotheses testing, stating the expected correlation or differences. Correlations between constructs are calculated using Pearson’s correlation coefficient r (<0.4=’weak’, 0.4-0.7=’moderate’, >0.7=’strong’). Differences between two groups were tested by means of t-tests, differences between multiple groups were tested using ANOVA. The following hypotheses were formulated:
Hypotheses: 1. A moderate to strong correlation was expected between the WRFQ and EWPS.2. A moderate correlation was hypothesized between WRFQ and general health. Workers
with lower health were expected to show lower work functioning than workers who report a better general health.
3. Workers with low MCS score were expected to show lower work functioning than workers with high MCS, especially for the WSOD, MSD, and FD scales.
4. Workers with low PCS were expected to show lower work functioning than workers with high PCS, especially for the PD scale.
5. It was hypothesized that workers with high levels of fatigue score lower work functioning than workers with low level of fatigue.
6. It was hypothesized that workers with high need for recovery (NFR) score lower work functioning than workers with low NFR.
7. It was hypothesized that workers with high decision latitude score better work functioning than workers with low decision latitude.
8. It was hypothesized that workers with high psychological job demands show lower work functioning than workers with low psychological job demands.
9. It was hypothesized that workers with poor-fair health and manual job have the lowest scores on the physical demands.
10. A recent study showed that age is related with work outcomes, e.g. work ability, problems while working due to ageing, barriers to perform work due to ageing
The Work Role Functioning Questionnaire 2.0: Reliability, Validity and Responsiveness
87
5
problems and support needed to stay at work [43]. Older workers reported decreased work outcomes. Therefore, it was hypothesized that older workers show lower work functioning than younger workers.
Construct validity by exploratory analyses. Exploratory analyses were performed to examine the relationship between the WRFQ and other constructs without pre-defined hypotheses: The correlations between the UWES and the WRFQ, between the WIS and the WRFQ, the overall work ability item and the WRFQ, and the mental and physical demand items of the WAI and the WRFQ were examined. Differences in WRFQ scores were explored for different job types (manual vs. non-manual jobs). In addition, participants were divided into having manual work, non-manual work, or both, based on their job. To create four groups, participants were divided into two health groups for each job type, dichotomizing the overall SF-12 general health question (‘good-excellent’ vs ‘poor-fair’ health). These four groups are compared to explore the WRFQ scores.
Responsiveness. Participants who agreed to receive a follow-up survey, completed a second questionnaire after three months. Two global perceived effect (GPE) questions and the change score for work ability were used to evaluate responsiveness. Change in health was assessed with a single item asking respondents to rate their change in health (both physical and mental) compared to baseline (-5 = much worse, 0 = no change, 5 = much better). Respondents were dichotomized in two ways: those who deteriorated (-5- -1) versus all others and those who improved (1 - 5) vs all others. Change in job performance was assessed with a single item asking respondents to rate their change in job performance compared to baseline (-5 = much worse, 0 = no change, 5 = much better). Respondents were dichotomized in two ways: those who deteriorated (-5- -1) versus all others and those who improved (1 - 5) versus all others. Change in work ability was assessed as the difference in the self-rated work ability measured on a 0-10 scale at baseline and 3 month follow-up. Again, respondents were dichotomized in two ways: those who deteriorated (-10- -1) versus all others and those who improved (1 - 10) versus all others. The mean change, SD of change and standardized response mean (SRM = mean change divided by SDchange) and Cohen’s effect sizes (ES = mean change scores divided by the SDbaseline) were calculated for the WRFQ 2.0 subscales and total score for each group (changed versus not changed). It was hypothesized that respondents who rate a positive/negative change in health, job performance or work ability will also have a positive/negative change in their WRFQ 2.0 score. Correlations between the change score of each subscale and the total scale to both global measures of change (health and job performance) and the work ability change score were calculated. Correlations around 0.2-0.3 were hypothesized, because it was expected that a large part of the participants will show no change and based on results in earlier studies with similar questionnaires [5].

Chapter 5
88
Results
Sample characteristicsA total of N=560 participants completed the WRFQ 2.0 and were included in the analyses. After a quality check, N=7 participants were excluded because they reported that response anchors were missing for a group of items in the online questionnaire, leaving a final set of N=553 participants. All of them were at work and almost 90% reported a good to excellent health measured with the general health question (SF-12). A total of N=275 participants completed an extended version of the questionnaire. Table 1 shows the sample characteristics. Compared to the general working population in the Netherlands, females were underrepresented [44]. The distribution of education is fairly representative for the Dutch working population, although the current sample comprises slightly more higher educated workers.
Table 1 – Sample description
Total Male Female
N=553 N=388 (70.2%) N=165 (29.8%)Age in years, mean (SD) 45.1 (10.6) 45.1 (10.5) 45.2 (10.8)
Education, N (%)
Low 77 (13.9%) 75 (19.3%) 2 (1.2%)
Middle 215 (38.9%) 164 (42.3%) 51 (30.9%)
High 247 (44.7%) 140 (36.1%) 107 (64.8%)
Main wage earner, N (%)
Yes 410 (74.1%) 340 (87.6%) 70 (42.4%)
No 69 (12.5%) 15 (3.9%) 54 (32.7%)
Equal with partner 69 (12.5%) 30 (7.7%) 39 (23.6%)
Job type, N (%)
Manual 156 (28.2%) 156 (40.2%) 0 (0.0%)
Non-manual 257 (46.5%) 179 (46.1%) 78 (47.3%)
Both manual and non-manual 5 (0.9%) 3 (0.8%) 2 (1.2%)
Unknown 135 (24.4%) 50 (12.9%) 85 (51.5%)
Working hours/week, mean (SD) 38.4 (8.6) 40.3 (7.8) 33.7 (8.7)
WAI overall-item*, mean (SD)(scale 0-10)
7.6 (1.5) 7.8 (1.4) 7.3 (1.8)
WAI physical demands*, mean (SD)(scale 1-5)
2.4 (1.3) 2.2 (1.2) 2.8 (1.6)
WAI mental demands*, mean (SD)(scale 1-5)
2.3 (1.1) 2.1 (1.0) 2.8 (1.3)

The Work Role Functioning Questionnaire 2.0: Reliability, Validity and Responsiveness
89
5
Total Male Female
N=553 N=388 (70.2%) N=165 (29.8%)SF-12 1 overall item*
Very good N (%) 152 (27.7%) 106 (27.6) 46 (27.9)
Good N (%) 281 (51.2) 196 (51.0) 85 (51.5)
Fair N (%) 55 (10.0%) 37 (9.6) 18 (10.9)
Poor N (%) 3 (0.5) 2 (0.5) 1 (0.6)
Total Male Female
Extended survey N=275 (N=211) (N=64)EWPS, mean (SD) ‡
(Scale 0-100) 17.3 (10.1) 17.1 (10.0) 18.1 (10.6)
Need for Recovery, mean (SD)(scale 0-100)
26.4 (28.7) 26.2 (28.9) 27.1 (28.0)
Fatigue (CIS-8), mean (SD)(Scale 7-56)
20.3 (10.6) 19.6 (10.5) 22.5 (10.7)
SF-12 1 overall item†
Excellent N (%) 46 (16.7%) 33 (15.9%) 13 (20.3%)
Very good N (%) 98 (35.6%) 75 (36.2%) 23 (35.9%)
Good N (%) 106 (38.5%) 80 (38.6%) 26 (40.6%)
Fair N (%) 21 (7.6%) 19 (9.2%) 2 (3.1%)
Poor N (%) 0 (0.0%) 0 (0.0%) 0 (0.0%)
SF-12 Mental Comp.Summary, mean (SD) §
51.5 (7.8) 51.9 (7.5) 50.1 (8.4)
SF-12 Physical Comp.Summary, mean (SD) §
52.0 (6.1) 51.9 (6.2) 52.6 (5.9)
JCQ Decision latitude, mean (SD)(scale 24-96)
72.6 (9.8) 72.4 (10.0) 73.5 (9.3)
JCQ Psychological job demands, mean (SD) (scale 12-48)
30.8 (5.3) 30.2 (5.2) 32.1 (5.4)
WIS, mean (SD)(scale 1-4)
11.0 (3.0) 11.2 (3.1) 10.3 (2.6)
UWES, mean (SD)(scale 0-6)
4.2 (1.2) 4.2 (1.2) 4.3 (1.1)
* Single item question, The number of respondents may vary due to missing values.‡0= best possible score – 100= worst possible score§Scale mean is 50Abbreviations: WRFQ 2.0=Work Role Functioning Questionnaire 2.0, WAI=Work Ability Index, EWPS=Endicott work productivity scale, JCQ=job content questionnaire, WIS=work involvement scale, UWES=Utrecht work engagement scale
Chapter 5
90
Structural ValidityAll 32 items were included in an EFA. A combination of the scree plot, eigenvalues >1, factor loadings and interpretation of the factors revealed a four factor model. In order to reduce the number of items, additional analyses were performed. Items 1 and 27 were removed because they loaded lower than 0.50 on their own factor and higher than 0.30 on another factor. Item 20 was removed because it correlated higher than 0.8 with each other and other items in their factor, items 22 and 23 were kept based on their contribution to the construct. Although there were correlations lower than 0.2 for items 14-17 with three other items (9, 11 and new3), it was decided to keep these items based on construct considerations. Cronbach’s alphas were calculated for each factor. Finally, based on alpha-if-item-deleted, items 6 and 13 were deleted from its factor, resulting in a final item set of 27 items divided over four factors. The final results of the factor analyses are presented in Table 2. The new subscales are work scheduling & output demands (WSOD), physical demands (PD), mental & social demands (MSD), and flexibility demands (FD) comprising the new items.
ReliabilityCronbach’s alphas were calculated for each subscale and the total scale to explore the internal consistency. All alphas were high (0.91-0.96). The statistical software SPSS uses listwise deletion for calculating alphas. Therefore the analyses were also performed in Stata, but no large differences were found. Table 3 presents the results based on SPSS.For the calculation of the ICC scores, a subsample completed the questionnaire twice with a one week interval. Participants that reported being absent from work in the past four weeks were excluded from the analyses, leaving a subsample of N=113. For the WRFQ 2.0 total score an ICC of 0.66 (95%CI: 0.54-0.76) was calculated. The ICCs for the subscales were respectively: WSOD=0.63; PD=0.82; MSD=0.61 and FD=0.29. The standard error of measurement (SEM) for the WRFQ 2.0 total score was 7.89. The SEMs for the subscales were respectively: WSOD=13.22; PD=7.51; MSD=8.69 and FD=14.94. A scatterplot revealed large change scores on the new items for a small number of participants (N=6 with a change score ≥75). The missing anchors could have caused a reversed scoring, producing large change scores. Exploration of the data without these outliers revealed a much higher ICC for this scale (and total scale), closer to the ICCs of the other scales.
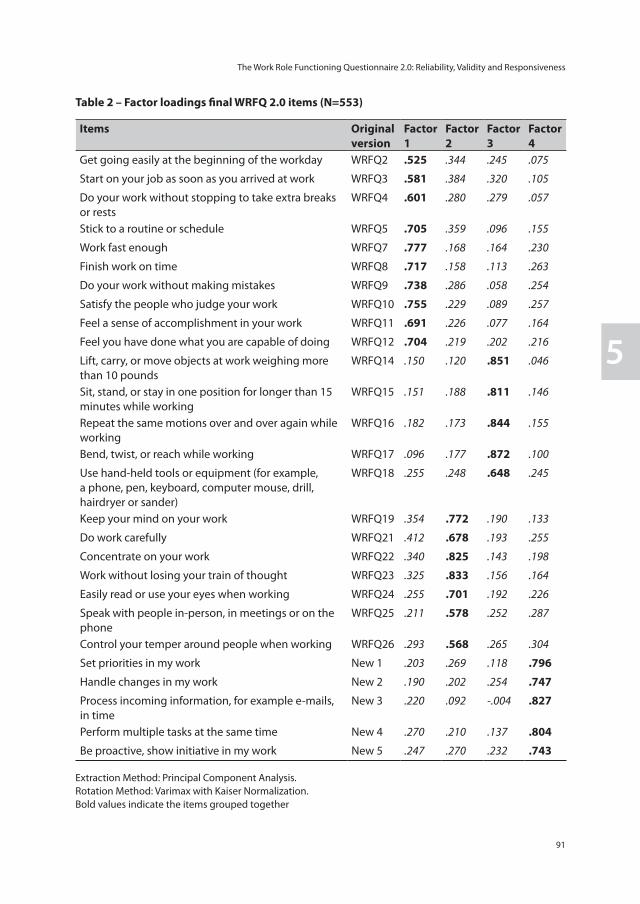
The Work Role Functioning Questionnaire 2.0: Reliability, Validity and Responsiveness
91
5
Table 2 – Factor loadings final WRFQ 2.0 items (N=553)
Items Original version
Factor 1
Factor 2
Factor 3
Factor 4
Get going easily at the beginning of the workday WRFQ2 .525 .344 .245 .075
Start on your job as soon as you arrived at work WRFQ3 .581 .384 .320 .105
Do your work without stopping to take extra breaks or rests
WRFQ4 .601 .280 .279 .057
Stick to a routine or schedule WRFQ5 .705 .359 .096 .155
Work fast enough WRFQ7 .777 .168 .164 .230
Finish work on time WRFQ8 .717 .158 .113 .263
Do your work without making mistakes WRFQ9 .738 .286 .058 .254
Satisfy the people who judge your work WRFQ10 .755 .229 .089 .257
Feel a sense of accomplishment in your work WRFQ11 .691 .226 .077 .164
Feel you have done what you are capable of doing WRFQ12 .704 .219 .202 .216
Lift, carry, or move objects at work weighing more than 10 pounds
WRFQ14 .150 .120 .851 .046
Sit, stand, or stay in one position for longer than 15 minutes while working
WRFQ15 .151 .188 .811 .146
Repeat the same motions over and over again while working
WRFQ16 .182 .173 .844 .155
Bend, twist, or reach while working WRFQ17 .096 .177 .872 .100
Use hand-held tools or equipment (for example, a phone, pen, keyboard, computer mouse, drill, hairdryer or sander)
WRFQ18 .255 .248 .648 .245
Keep your mind on your work WRFQ19 .354 .772 .190 .133
Do work carefully WRFQ21 .412 .678 .193 .255
Concentrate on your work WRFQ22 .340 .825 .143 .198
Work without losing your train of thought WRFQ23 .325 .833 .156 .164
Easily read or use your eyes when working WRFQ24 .255 .701 .192 .226
Speak with people in-person, in meetings or on the phone
WRFQ25 .211 .578 .252 .287
Control your temper around people when working WRFQ26 .293 .568 .265 .304
Set priorities in my work New 1 .203 .269 .118 .796
Handle changes in my work New 2 .190 .202 .254 .747
Process incoming information, for example e-mails, in time
New 3 .220 .092 -.004 .827
Perform multiple tasks at the same time New 4 .270 .210 .137 .804
Be proactive, show initiative in my work New 5 .247 .270 .232 .743
Extraction Method: Principal Component Analysis. Rotation Method: Varimax with Kaiser Normalization.Bold values indicate the items grouped together
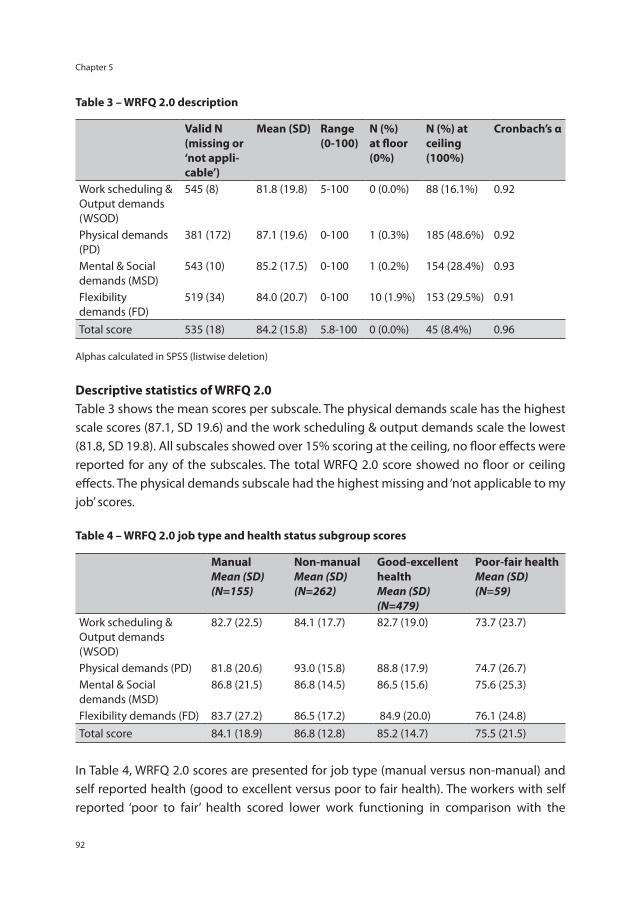
Chapter 5
92
Table 3 – WRFQ 2.0 description
Valid N (missing or ‘not appli-cable’)
Mean (SD) Range (0-100)
N (%) at floor (0%)
N (%) at ceiling (100%)
Cronbach’s α
Work scheduling & Output demands (WSOD)
545 (8) 81.8 (19.8) 5-100 0 (0.0%) 88 (16.1%) 0.92
Physical demands (PD)
381 (172) 87.1 (19.6) 0-100 1 (0.3%) 185 (48.6%) 0.92
Mental & Social demands (MSD)
543 (10) 85.2 (17.5) 0-100 1 (0.2%) 154 (28.4%) 0.93
Flexibility demands (FD)
519 (34) 84.0 (20.7) 0-100 10 (1.9%) 153 (29.5%) 0.91
Total score 535 (18) 84.2 (15.8) 5.8-100 0 (0.0%) 45 (8.4%) 0.96
Alphas calculated in SPSS (listwise deletion)
Descriptive statistics of WRFQ 2.0Table 3 shows the mean scores per subscale. The physical demands scale has the highest scale scores (87.1, SD 19.6) and the work scheduling & output demands scale the lowest (81.8, SD 19.8). All subscales showed over 15% scoring at the ceiling, no floor effects were reported for any of the subscales. The total WRFQ 2.0 score showed no floor or ceiling effects. The physical demands subscale had the highest missing and ‘not applicable to my job’ scores. Table 4 – WRFQ 2.0 job type and health status subgroup scores
Manual Mean (SD)(N=155)
Non-manual Mean (SD) (N=262)
Good-excellent healthMean (SD) (N=479)
Poor-fair health Mean (SD) (N=59)
Work scheduling & Output demands (WSOD)
82.7 (22.5) 84.1 (17.7) 82.7 (19.0) 73.7 (23.7)
Physical demands (PD) 81.8 (20.6) 93.0 (15.8) 88.8 (17.9) 74.7 (26.7)Mental & Social demands (MSD)
86.8 (21.5) 86.8 (14.5) 86.5 (15.6) 75.6 (25.3)
Flexibility demands (FD) 83.7 (27.2) 86.5 (17.2) 84.9 (20.0) 76.1 (24.8) Total score 84.1 (18.9) 86.8 (12.8) 85.2 (14.7) 75.5 (21.5)
In Table 4, WRFQ 2.0 scores are presented for job type (manual versus non-manual) and self reported health (good to excellent versus poor to fair health). The workers with self reported ‘poor to fair’ health scored lower work functioning in comparison with the
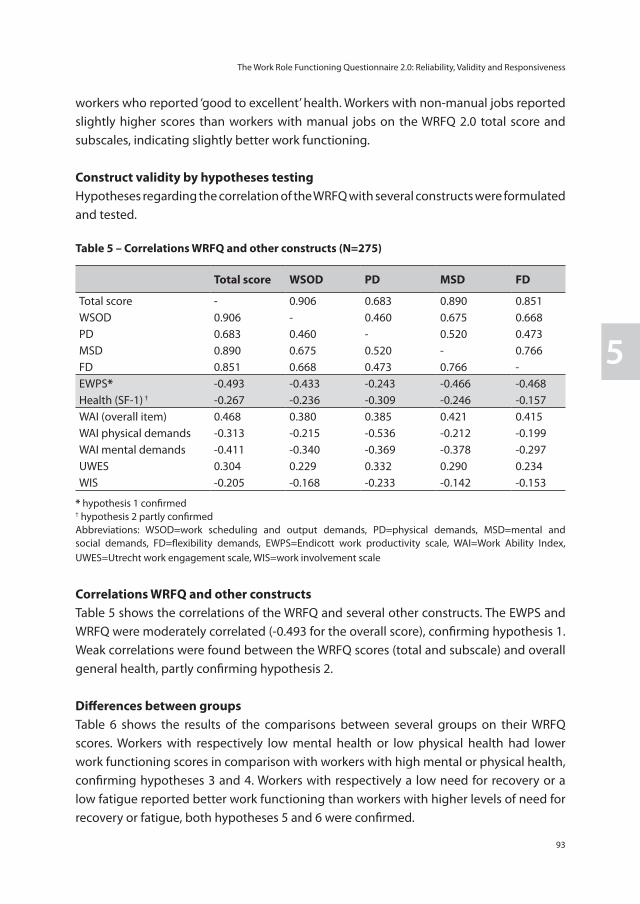
The Work Role Functioning Questionnaire 2.0: Reliability, Validity and Responsiveness
93
5
workers who reported ‘good to excellent’ health. Workers with non-manual jobs reported slightly higher scores than workers with manual jobs on the WRFQ 2.0 total score and subscales, indicating slightly better work functioning.
Construct validity by hypotheses testingHypotheses regarding the correlation of the WRFQ with several constructs were formulated and tested.
Table 5 – Correlations WRFQ and other constructs (N=275)
Total score WSOD PD MSD FD
Total score - 0.906 0.683 0.890 0.851WSOD 0.906 - 0.460 0.675 0.668PD 0.683 0.460 - 0.520 0.473MSD 0.890 0.675 0.520 - 0.766FD 0.851 0.668 0.473 0.766 -EWPS* -0.493 -0.433 -0.243 -0.466 -0.468Health (SF-1) † -0.267 -0.236 -0.309 -0.246 -0.157WAI (overall item) 0.468 0.380 0.385 0.421 0.415WAI physical demands -0.313 -0.215 -0.536 -0.212 -0.199WAI mental demands -0.411 -0.340 -0.369 -0.378 -0.297UWES 0.304 0.229 0.332 0.290 0.234WIS -0.205 -0.168 -0.233 -0.142 -0.153
* hypothesis 1 confirmed† hypothesis 2 partly confirmedAbbreviations: WSOD=work scheduling and output demands, PD=physical demands, MSD=mental and social demands, FD=flexibility demands, EWPS=Endicott work productivity scale, WAI=Work Ability Index, UWES=Utrecht work engagement scale, WIS=work involvement scale
Correlations WRFQ and other constructsTable 5 shows the correlations of the WRFQ and several other constructs. The EWPS and WRFQ were moderately correlated (-0.493 for the overall score), confirming hypothesis 1. Weak correlations were found between the WRFQ scores (total and subscale) and overall general health, partly confirming hypothesis 2.
Differences between groupsTable 6 shows the results of the comparisons between several groups on their WRFQ scores. Workers with respectively low mental health or low physical health had lower work functioning scores in comparison with workers with high mental or physical health, confirming hypotheses 3 and 4. Workers with respectively a low need for recovery or a low fatigue reported better work functioning than workers with higher levels of need for recovery or fatigue, both hypotheses 5 and 6 were confirmed.
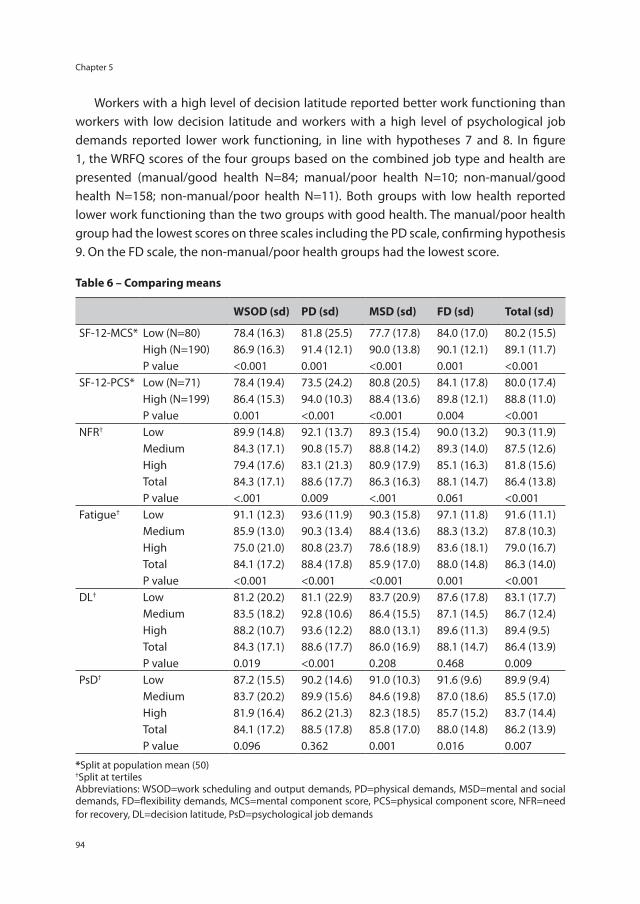
Chapter 5
94
Workers with a high level of decision latitude reported better work functioning than workers with low decision latitude and workers with a high level of psychological job demands reported lower work functioning, in line with hypotheses 7 and 8. In figure 1, the WRFQ scores of the four groups based on the combined job type and health are presented (manual/good health N=84; manual/poor health N=10; non-manual/good health N=158; non-manual/poor health N=11). Both groups with low health reported lower work functioning than the two groups with good health. The manual/poor health group had the lowest scores on three scales including the PD scale, confirming hypothesis 9. On the FD scale, the non-manual/poor health groups had the lowest score.
Table 6 – Comparing means
WSOD (sd) PD (sd) MSD (sd) FD (sd) Total (sd)
SF-12-MCS* Low (N=80) 78.4 (16.3) 81.8 (25.5) 77.7 (17.8) 84.0 (17.0) 80.2 (15.5)High (N=190) 86.9 (16.3) 91.4 (12.1) 90.0 (13.8) 90.1 (12.1) 89.1 (11.7)P value <0.001 0.001 <0.001 0.001 <0.001
SF-12-PCS* Low (N=71) 78.4 (19.4) 73.5 (24.2) 80.8 (20.5) 84.1 (17.8) 80.0 (17.4)High (N=199) 86.4 (15.3) 94.0 (10.3) 88.4 (13.6) 89.8 (12.1) 88.8 (11.0)P value 0.001 <0.001 <0.001 0.004 <0.001
NFR† Low 89.9 (14.8) 92.1 (13.7) 89.3 (15.4) 90.0 (13.2) 90.3 (11.9)Medium 84.3 (17.1) 90.8 (15.7) 88.8 (14.2) 89.3 (14.0) 87.5 (12.6)High 79.4 (17.6) 83.1 (21.3) 80.9 (17.9) 85.1 (16.3) 81.8 (15.6)Total 84.3 (17.1) 88.6 (17.7) 86.3 (16.3) 88.1 (14.7) 86.4 (13.8)P value <.001 0.009 <.001 0.061 <0.001
Fatigue† Low 91.1 (12.3) 93.6 (11.9) 90.3 (15.8) 97.1 (11.8) 91.6 (11.1)Medium 85.9 (13.0) 90.3 (13.4) 88.4 (13.6) 88.3 (13.2) 87.8 (10.3)High 75.0 (21.0) 80.8 (23.7) 78.6 (18.9) 83.6 (18.1) 79.0 (16.7)Total 84.1 (17.2) 88.4 (17.8) 85.9 (17.0) 88.0 (14.8) 86.3 (14.0)P value <0.001 <0.001 <0.001 0.001 <0.001
DL† Low 81.2 (20.2) 81.1 (22.9) 83.7 (20.9) 87.6 (17.8) 83.1 (17.7)Medium 83.5 (18.2) 92.8 (10.6) 86.4 (15.5) 87.1 (14.5) 86.7 (12.4)High 88.2 (10.7) 93.6 (12.2) 88.0 (13.1) 89.6 (11.3) 89.4 (9.5)Total 84.3 (17.1) 88.6 (17.7) 86.0 (16.9) 88.1 (14.7) 86.4 (13.9)P value 0.019 <0.001 0.208 0.468 0.009
PsD† Low 87.2 (15.5) 90.2 (14.6) 91.0 (10.3) 91.6 (9.6) 89.9 (9.4)Medium 83.7 (20.2) 89.9 (15.6) 84.6 (19.8) 87.0 (18.6) 85.5 (17.0)High 81.9 (16.4) 86.2 (21.3) 82.3 (18.5) 85.7 (15.2) 83.7 (14.4)Total 84.1 (17.2) 88.5 (17.8) 85.8 (17.0) 88.0 (14.8) 86.2 (13.9)P value 0.096 0.362 0.001 0.016 0.007
*Split at population mean (50)†Split at tertilesAbbreviations: WSOD=work scheduling and output demands, PD=physical demands, MSD=mental and social demands, FD=flexibility demands, MCS=mental component score, PCS=physical component score, NFR=need for recovery, DL=decision latitude, PsD=psychological job demands
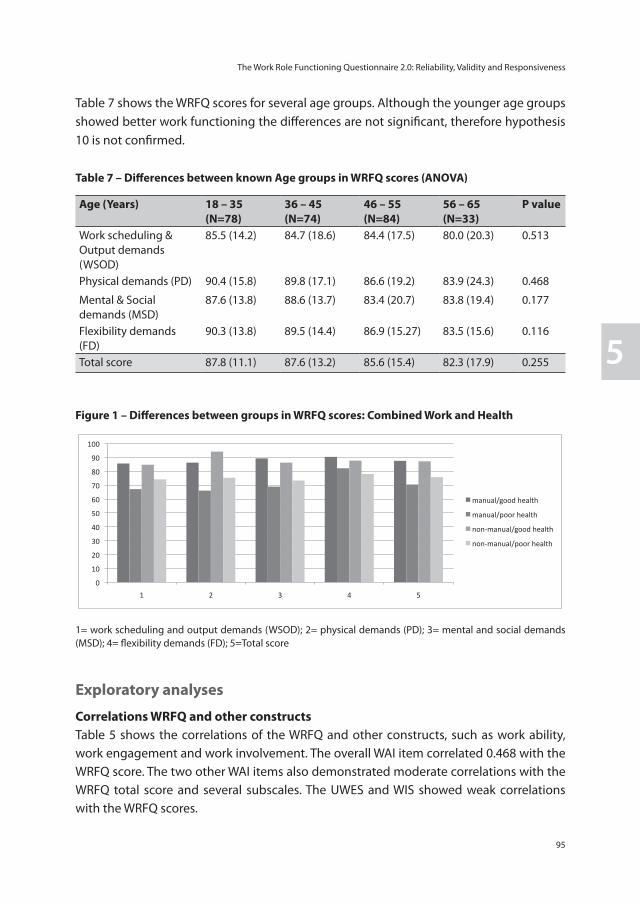
The Work Role Functioning Questionnaire 2.0: Reliability, Validity and Responsiveness
95
5
Table 7 shows the WRFQ scores for several age groups. Although the younger age groups showed better work functioning the differences are not significant, therefore hypothesis 10 is not confirmed.
Table 7 – Differences between known Age groups in WRFQ scores (ANOVA)
Age (Years) 18 – 35 (N=78)
36 – 45(N=74)
46 – 55(N=84)
56 – 65(N=33)
P value
Work scheduling & Output demands (WSOD)
85.5 (14.2) 84.7 (18.6) 84.4 (17.5) 80.0 (20.3) 0.513
Physical demands (PD) 90.4 (15.8) 89.8 (17.1) 86.6 (19.2) 83.9 (24.3) 0.468
Mental & Social demands (MSD)
87.6 (13.8) 88.6 (13.7) 83.4 (20.7) 83.8 (19.4) 0.177
Flexibility demands (FD)
90.3 (13.8) 89.5 (14.4) 86.9 (15.27) 83.5 (15.6) 0.116
Total score 87.8 (11.1) 87.6 (13.2) 85.6 (15.4) 82.3 (17.9) 0.255
Figure 1 – Differences between groups in WRFQ scores: Combined Work and Health
1 2 3 4manual/good health manual/poor health non-manual/good health non-manual/poor health Total
WSOD 85,6589 67,1250 84,7186 74,1477 83,8985
PD 86,2500 66,1111 94,1369 75,3571 88,4876
MSD 89,3141 68,9286 86,2643 73,3766 86,0402
FD 90,4112 82,2222 87,7215 78,0682 87,9134
total 87,4857 70,4667 87,1626 75,7607 86,1306
1=WSOD2=PD3=MSD4=FD5=Total score
0
10
20
30
40
50
60
70
80
90
100
1 2 3 4 5
manual/good health
manual/poor health
non-‐manual/good health
non-‐manual/poor health
1= work scheduling and output demands (WSOD); 2= physical demands (PD); 3= mental and social demands (MSD); 4= flexibility demands (FD); 5=Total score
Exploratory analyses
Correlations WRFQ and other constructsTable 5 shows the correlations of the WRFQ and other constructs, such as work ability, work engagement and work involvement. The overall WAI item correlated 0.468 with the WRFQ score. The two other WAI items also demonstrated moderate correlations with the WRFQ total score and several subscales. The UWES and WIS showed weak correlations with the WRFQ scores.
Chapter 5
96
Differences between groupsA comparison of WRFQ scores for job type (manual vs. non-manual jobs) was made. Only for the physical demands a significant difference was visible, with low scores on the physical demands for workers with a manual job. The other scales showed only small, non-significant differences.
ResponsivenessA total of N=98 participants completed the 3 month follow-up questionnaire. Participants were classified based on the three measures of change. A large majority of the participants reported no change on all three measures of change, resulting in very small groups that reported change. For change in health, a total of 20 participants reported an improvement in health of at least one point. However this was not reflected in the WRFQ 2.0 total change score (-1.20, SD=9.8). The SRM and ES were respectively -0.12 and -0.09. A total of six participants reported a decrease in health of at least one point, which was reflected in the total WRFQ 2.0 total change score of -9.54 (SD=7.5). The SRM and ES were respectively -1.27 and -0.79. The correlation between the WRFQ 2.0 total change score and the GPE health was close to zero (0.01). The same trend is observed for changes in job performance. A total of 17 participants reported an improvement of at least one point, the mean WRFQ 2.0 change score for this group was -2.08 (SD=8.3). The SRM and ES were respectively -0.25 and -0.18. A total of eight participants reported a decrease in job performance of at least one point, which was reflected in the total WRFQ 2.0 change score of -6.26 (SD=12.1). The SRM and ES were respectively -0.53 and -0.27. The correlation between the WRFQ 2.0 change score and the GPE job performance was close to zero (0.03). For change in work ability, a total of 26 participants reported an improvement of at least one point, the mean WRFQ 2.0 change score for this group was 3.32 (SD=10.6). The SRM and ES were respectively 0.31 and 0.20. A total of 30 participants reported a decrease in work ability of at least one point, the mean WRFQ 2.0 change score for this group was -0.861.33 (SD=9.8). The SRM and ES were respectively -0.09 and -0.06. The correlation between the WRFQ 2.0 change score and the GPE work ability was 0.18.
Discussion
The final WRFQ 2.0 is a brief questionnaire that consists of 27 items and scores are easily interpreted as percentages of time on a scale from 0 to 100. The WRFQ 2.0 has four subscales and shows very good internal consistency, moderate test-retest reliability, good construct validity and moderate responsiveness in this working sample. The total score and the subscales show no floor effects, but do show ceiling effects. Ten hypotheses were formulated and tested. A total of 9 hypotheses were (partly) confirmed, providing
The Work Role Functioning Questionnaire 2.0: Reliability, Validity and Responsiveness
97
5
evidence for the construct validity of the WRFQ. Relationships with several other constructs were explored, without pre-defined hypotheses. This provided additional insight into the construct the WRFQ aims to measure. The results show that the WRFQ was able to distinguish between groups with different levels of self-rated general health, mental health, physical health, fatigue, need for recovery and between workers with manual and non-manual jobs. Different levels of decision latitude and psychological job demands showed different scores on the WRFQ in the expected directions, although not all differences were significant. The measurement properties were similar to earlier results with other translated WRFQ versions [13,14]. The main difference is the addition of the new subscale (flexibility demands) developed during the cross-cultural adaptation of the questionnaire to Dutch [15]. The final WRFQ 2.0 was extended with five new items representing new work practices; five original items were removed. These changes also affected the original factor structure, which was adapted in the final version. Earlier versions do not contain this subscale. In the current validation study, the general working population was included. It is a prerequisite to validate a questionnaire in the population in which it will be used and for the intended purposes. Although the questionnaire was originally developed for a population of workers with health problems [2], it is important to validate the questionnaire in the general working population if the WRFQ 2.0 is to be used as a monitoring or surveillance instrument in this population. This, however, may imply that the population is rather healthy. The WRFQ 2.0 showed ceiling effects. This could indicate that the questionnaire is not performing optimal in differentiating between workers with good work functioning. However, it could also be due to the relative healthy population included in this study. Almost 90% of the participants reported a good, very good or excellent self-rated health. In contrast with the participants that reported poor to fair health, a difference of 10 points in the WRFQ 2.0 score was identified, indicating that the questionnaire is able to discriminate between these two groups, especially since the SEM for the total score was a little under 8 points. Further studies comparing other groups, on for example health status, are needed to evaluate the ability of the WRFQ 2.0 to differentiate between groups and establish correlations with other related constructs. The test-retest reliability of the total WRFQ 2.0 score and three subscales were moderate and for the new flexibility demands low. This means that the questionnaire is considered reliable for use on group level. The low scores for the flexibility demands scale might be explained by the fact that for some participants the anchors were not visible. Exploration of the data without outliers revealed ICC scores closer to the ICC of the other scales. It is interesting to note, that the correlation between the WRFQ scores and the general health question of the SF-12 is weak. This may indicate that the WRFQ score is only
Chapter 5
98
marginally determined by health status. However, this may also be due to the relative healthy population included in this study. The WRFQ total score has a moderate correlation with the EWPS [18], a comparable instrument. This indicates that these two questionnaires do measure a related construct, but not the same construct. Although both instruments were designed to measure a broad construct in a broad population, the EWPS is often used in populations with mental health problems [4]. The measurement properties of the EWPS in other populations are not known. The WRFQ total score is also moderately correlated with the overall work ability item of the Work Ability Index [34], measuring the current work ability compared with the life time best. Again, this indicates that the WRFQ is measuring a related, but different construct than work ability. The WRFQ has a weak correlation with work engagement and work involvement, indicating that there is no direct relation between these constructs and work functioning. It might be possible that these motivational constructs serve as moderators. Further longitudinal research is needed to explore the relationships between these constructs. Although a trend was observed with younger workers reporting better work functioning, no significant differences were observed when compared to older workers. These results may indicate that work functioning is not explained by chronologic age. It would be interesting to examine how work functioning is related to other definitions of age, for example by performance based or functional age [45]. This definition of age is operationalized based on individual variations in abilities and functioning. De Vet et al. [40] describe three important uses of instruments: diagnosis (or discriminative ability), evaluation (for example of therapy) and prediction of future course. The current study showed that the WRFQ is able to differentiate between several subgroups (e.g. mental health, physical health, need for recovery, fatigue) indicating the instruments discriminative ability. A prerequisite for evaluative purposes is good responsiveness. Responsiveness was assessed using three global measures of perceived change. Due to the relative stable and healthy population and the lack of an intervention, the number of workers who reported change was very small. A self-rated improvement in health, job performance and work ability was not reflected in the WRFQ 2.0 change scores, which were close to zero. The WRFQ 2.0 performed better in detecting deterioration, especially for changes in health and job performance. It is not surprising that in this relatively healthy sample the WRFQ 2.0 performs better in measuring deterioration than improvement, since a ceiling effect was observed. The observed results could also be due to the low number of participants in the change groups. According to Terwee et al. [17], a sample of at least 30 participants is required for each change group to obtain fair methodological quality, and 50 participants for good quality [17]. A similar method was used in another study to assess responsiveness of health-related work functioning measures [5]. However, it is recommended to include participants who are expected to change over time, for
The Work Role Functioning Questionnaire 2.0: Reliability, Validity and Responsiveness
99
5
example after an intervention. Further research is needed to evaluate the responsiveness of the WRFQ 2.0. This is the first study to evaluate the construct validity of the WRFQ in the general working population. In addition, it is one of the first studies to explore the relationship between the construct of health-related work functioning and other constructs such as health status, job content, work productivity, work ability and work engagement. A relatively healthy population was included. Although the sample sizes in the subgroup analyses were small, the samples were large enough to establish good methodological quality based on the COSMIN checklist [17]. A strength of this study is the systematic approach described by the COSMIN taxonomy.
In sum, the WRFQ 2.0 is a reliable and valid instrument to measure health-related work functioning in the general working population. Almost all hypotheses were confirmed, providing evidence for the construct validity of the Work Role Functioning Questionnaire 2.0 (WRFQ) in the general working population. The WRFQ showed very good measurement properties for use on a group level. More information is needed for its use on the individual level, e.g. for monitoring individuals over time. In addition, further research in larger samples is needed to investigate the ability of the WRFQ to predict the future course of health-related work functioning, test-retest reliability, responsiveness, and to evaluate the measurement properties in other populations (e.g. female workers and workers presenting with chronic health problems).
Chapter 5
100
References
1. Council of the European Union. Council conclusions on healthy and dignified ageing; 2980th employment, social policy, health and consumer affairs council meeting. 2009.
2. Amick BC,III, Lerner D, Rogers WH, Rooney T, Katz JN. A review of health-related work outcome measures and their uses, and recommended measures. Spine 2000; 25:3152-60.
3. Amick BC,III, Gimeno D. Measuring Work Outcomes with a focus on Health-Related Work Productivity Loss. In: Wittink H, Carr D, editors. Pain Management: Evidence, Outcomes, and Quality of Life: A Sourcebook. Amsterdam: Elsevier; 2008. p. 329-343.
4. Abma FI, van der Klink JJ, Terwee CB, Amick Iii BC, Bültmann U. Evaluation of the measurement properties of self-reported health-related work-functioning instruments among workers with common mental disorders. Scand J Work Environ Health 2012; 38:5-18.
5. Beaton DE, Tang K, Gignac MA, Lacaille D, Badley EM, Anis AH, et al. Reliability, validity, and responsiveness of five at-work productivity measures in patients with rheumatoid arthritis or osteoarthritis. Arthritis Care Res (Hoboken) 2010; 62:28-37.
6. Loeppke R, Hymel PA, Lofland JH, Pizzi LT, Konicki DL, Anstadt GW, et al. Health-related workplace productivity measurement: general and migraine-specific recommendations from the ACOEM Expert Panel. J Occup Environ Med 2003; 45:349-59.
7. Lofland JH, Pizzi L, Frick KD. A review of health-related workplace productivity loss instruments. Pharmacoeconomics 2004; 22:165-84.
8. Roy JS, MacDermid JC, Amick BC,3rd, Shannon HS, McMurtry R, Roth JH, et al. Validity and responsiveness of presenteeism scales in chronic work-related upper-extremity disorders. Phys Ther 2011; 91:254-66.
9. Tang K, Escorpizo R, Beaton DE, Bombardier C, Lacaille D, Zhang W, et al. Measuring the impact of arthritis on worker productivity: perspectives, methodologic issues, and contextual factors. J Rheumatol 2011; 38:1776-90.
10. Tang K, Pitts S, Solway S, Beaton D. Comparison of the psychometric properties of four at-work disability measures in workers with shoulder or elbow disorders. J Occup Rehabil 2009; 19:142-54.
11. Williams RM, Schmuck G, Allwood S, Sanchez M, Shea R, Wark G. Psychometric Evaluation of Health-Related Work Outcome Measures For Musculoskeletal Disorders : A Systematic Review. J Occup Rehabil 2007; 17:504-21.
12. Prasad M, Wahlqvist P, Shikiar R, Shih YC. A review of self-report instruments measuring health-related work productivity: a patient-reported outcomes perspective. Pharmacoeconomics 2004; 22:225-44.
13. Durand MJ, Vachon B, Hong QN, Imbeau D, Amick BC,III, Loisel P. The cross-cultural adaptation of the Work Role Functioning Questionnaire in Canadian French. Int J Rehabil Res 2004; 27:261-8.
14. Gallasch CH, Alexandre NMC, Amick B. Cross-cultural Adaptation, Reliability, and Validity of the Work Role Functioning Questionnaire to Brazilian Portuguese. Journal of Occupational Rehabilitation 2007; 17:701-11.
15. Abma FI, Amick BC,3rd, Brouwer S, van der Klink JJL, Bültmann U. The cross-cultural adaptation of the Work Role Functioning Questionnaire to Dutch. Work: Journal of Prevention, Assessment & Rehabilitation. In press.
16. Lindbeck A, Snower DJ. Multitask Learning and the Reorganization of Work: From Tayloristic to Holistic Organization. J Labor Econ 2000; 18:pp. 353-376.
17. Terwee CB, Mokkink LB, Knol DL, Ostelo RW, Bouter LM, de Vet HC. Rating the methodological quality in systematic reviews of studies on measurement properties: a scoring system for the COSMIN checklist. Qual Life Res 2011; 21:651-7.
The Work Role Functioning Questionnaire 2.0: Reliability, Validity and Responsiveness
101
5
18. Endicott J, Nee J. Endicott Work Productivity Scale (EWPS): a new measure to assess treatment effects. Psychopharmacol Bull 1997; 33:13-6.
19. Mokkink LB, Terwee CB, Patrick DL, Alonso J, Stratford PW, Knol DL, et al. The COSMIN study reached international consensus on taxonomy, terminology, and definitions of measurement properties for health-related patient-reported outcomes. J Clin Epidemiol 2010; 63:737-45.
20. Mokkink LB, Terwee CB, Knol DL, Stratford PW, Alonso J, Patrick DL, et al. The COSMIN checklist for evaluating the methodological quality of studies on measurement properties: a clarification of its content. BMC Med Res Methodol 2010; 10:22.
21. Mokkink LB, Terwee CB, Patrick DL, Alonso J, Stratford PW, Knol DL, et al. The COSMIN checklist for assessing the methodological quality of studies on measurement properties of health status measurement instruments: an international Delphi study. Qual Life Res 2010; 19:539-49.
22. VSNU. Gedragscode voor gebruik van persoonsgegevens in wetenschappelijk onderzoek (Code of Behavior for using Personal Data in Scientific Research). : Available at the website of the Association of Universities in the Netherlands: www.vsnu.nl, 2005.
23. Amick BC,III, Habeck RV, Ossmann J, Fossel AH, Keller R, Katz JN. Predictors of successful work role functioning after carpal tunnel release surgery. J Occup Environ Med 2004; 46:490-500.
24. Ware J,Jr, Kosinski M, Keller SD. A 12-Item Short-Form Health Survey: construction of scales and preliminary tests of reliability and validity. Med Care 1996; 34:220-33.
25. Ware JE, Kosinski M, Turner-Bowker DM, Gandek B. How to score version 2 of the SF-12 Health Survey. Lincoln, RI: QualityMetric Incorporated, 2002.
26. Vercoulen JH, Swanink CM, Fennis JF, Galama JM, van der Meer JW, Bleijenberg G. Dimensional assessment of chronic fatigue syndrome. J Psychosom Res 1994; 38:383-92.
27. Beurskens AJ, Bultmann U, Kant I, Vercoulen JH, Bleijenberg G, Swaen GM. Fatigue among working people: validity of a questionnaire measure. Occup Environ Med 2000; 57:353-7.
28. van Veldhoven M, Broersen S. Measurement quality and validity of the “need for recovery scale”. Occup Environ Med 2003; 60 Suppl 1:i3-9.
29. van Veldhoven M, Meijman T. Het meten van psychosociale arbeidsbelasting met een vragenlijst: De Vragenlijst Beleving en Beoordeling van de Arbeid (VBBA). [Questionnaire on Perception and Judgment of Work]. Amsterdam: NIA, 1994.
30. Karasek RA. Job Demands, Job Decision Latitude, and Mental Strain - Implications for Job Redesign. Adm Sci Q 1979; 24:285-308.
31. Reliability and validity of the Dutch version of the Karasek Job Content Questionnaire. Washington, DC: APA/NIOSH Conference on Work, Stress and Health; 1995.
32. Karasek R, Brisson C, Kawakami N, Houtman I, Bongers P, Amick B. The Job Content Questionnaire (JCQ): an instrument for internationally comparative assessments of psychosocial job characteristics. J Occup Health Psychol 1998; 3:322-55.
33. Karasek RA. Job Content Questionnaire and Users’s Guide. Los Angeles: University of Southern California, Department of Industrial and Systems Engineering, 1985.
34. Tuomi K, Ilmarinen J, Jahkola A, Katajarinne L, Tulkki A. Work Ability Index. In: Rautoja S, Pietiläinen R, editors. Finland: K-Print Oy Vantaa, Finnish Institue of Occupational Health; 1998.
35. Ahlstrom L, Grimby-Ekman A, Hagberg M, Dellve L. The work ability index and single-item question: associations with sick leave, symptoms, and health—a prospective study of women on long-term sick leave. Scand J Work Environ Health 2010; 36:404-12.
Chapter 5
102
36. Schaufeli WB, Bakker AB, Salanova M. The Measurement of Work Engagement With a Short Questionnaire: A Cross-National Study. Educational and Psychological Measurement 2006; 66:701-16.
37. Schaufeli WB, Bakker AB. Bevlogenheid: Een begrip gemeten. Gedrag en Organisatie 2004; 17:89-112.
38. Schaufeli WB, Bakker AB. Test manual for the Utrecht Work Engagement Scale. 2003. (Available at http://www.schaufeli.com).
39. Warr P, Cook J, Wall T. Scales for the measurement of some work attitudes and aspects of psychological well-being. Journal of Occupational Psychology 1979; 52:129-48.
40. de Vet HCW, Terwee CB, Mokkink LB, Knol DL. Measurement in medicine. A practical guide. 1st ed. Cambridge: University Press, 2011.
41. Nunnally JC, Bernstein IH. Psychometric theory. New York: McGraw-Hill, 1994.
42. Terwee CB, Bot SD, de Boer MR, van der Windt DA, Knol DL, Dekker J, et al. Quality criteria were proposed for measurement properties of health status questionnaires. J Clin Epidemiol 2007; 60:34-42.
43. Koolhaas W, van der Klink JJ, Groothoff JW, Brouwer S. Towards a sustainable healthy working life: associations between chronological age, functional age and work outcomes. Eur J Public Health 2011; 22:424-9.
44. Statistics Netherlands. StatLine database, Available at: http://statline.cbs.nl/StatWeb. [Accessed June 2012]; .
45. de Lange AH, Taris TW, Jansen PGW, Smulders P, Houtman ILD, Kompier MAJ. Age as a factor in the relation between work and mental health: results from the longitudinal TAS survey. In: Houdmont J, McIntyre S, editors. Occupational Health Psychology: European Perspectives on Research, Education and Practice Maia: ISMAI Publications; 2006. p. 21-45.

The Work Role Functioning Questionnaire 2.0: Reliability, Validity and Responsiveness
103
5

Chapter 6
Prognostic factors for successful work functioning
F.I. AbmaB.C. Amick III
J.J.L. van der Klink U. Bültmann
Submitted
Chapter 6
106
Abstract
Introduction: To help workers to stay at work in a healthy productive and sustainable way and for the development of interventions to prevent reduced work functioning, it is important to have insight in prognostic factors for successful work functioning. The aim of this study is to identify prognostic factors for successful work functioning in a general working population.
Methods: A longitudinal study was conducted among the working population. Work functioning was assessed with the Work Role Functioning Questionnaire 2.0 (WRFQ). The total score was categorized as follows: 0-90; >90 ≤95; and >95-100 (defined as ‘successful work functioning’). Ordinal logistic regression analyses were performed to examine bivariate relationships between potential prognostic factors and the dependent variable (successful work functioning) to identify potential prognostic factors for the multivariate models (p<0.10). A stepwise introduction of the variables was used in the multiple ordinal regression analyses.
Results: Baseline work functioning and work ability were significant prognostic factors for successful work functioning at three month follow-up. No prospective associations were identified for psychological job demands and supervisor social support with successful work functioning.
Discussion: To our knowledge this is the first longitudinal study to identify prognostic factors for successful work functioning in the general working population. High work ability is predictive for future successful work functioning, independent of baseline work functioning.
Keywords: work functioning; occupational epidemiology; working population; job content; prognostic factors
Prognostic factors for successful work functioning
107
6
Introduction
Due to demographic, political and social changes in Western European countries (i.e., the ageing workforce, a shift from a work compensation model to a work participation model, the increase of retirement age and advances in medical treatment) more workers with a health problem that may interfere with their ability to accomplish their work will likely participate in the labour force [1]. In view of the expected labor force shortages, the challenge is to help workers to stay at work in a healthy, productive and sustainable way. Research has shown that health conditions can impact functioning at work in several ways. For example, depressed workers reported greater experienced difficulties in time management, mental, interpersonal and output job demands [2,3]. Other research showed that poor health and more than one health conditions were associated with low work performance [4]. Health-related work functioning (hereafter referred to as work functioning) is a construct developed to assess how workers with health problems are accomplishing their work. Work functioning is determined by the joint influence of work and health and is viewed as a continuum that varies from working successfully (i.e., the ability to meet all work demands for a given state of health) to work absence (i.e., the inability to meet all work demands given a state of health) [5,6]. Work functioning, therefore, goes beyond the dichotomy of being at work versus being absent from work and provides information about a workers’ actual functioning when present at work. To date, longitudinal studies identifying prognostic factors for successful work functioning in the general working population are lacking. Limited evidence is available from studies investigating other constructs or other populations. Wynne-Jones et al. [7] identified factors predicting future work performance (measured with a visual analogue scale for self-rated performance and the Stanford Presenteeism Scale (SPS-6)).The authors found that individuals with increased psychological distress and poor perceived workplace management reported reduced performance. The authors did not find any significant associations between objective workplace characteristics and performance. Another study examined successful return to work in a population recovering from carpal tunnel surgery. The authors identified predictors for successful work functioning after return to work [8] and found baseline work functioning (before surgery), self-efficacy and a supportive organization to be predictive for successful work functioning at six months after return to work. Lerner et al. [9] studied the impact of work stressors on work performance measured with the work limitations questionnaire (WLQ) in a population with depression. They found that decreased depression symptom severity and a change in general physical health were predictive for an improvement in work limitations in one or more of the WLQ scales. To help workers to stay at work in a healthy, productive and sustainable way and for
Chapter 6
108
the development of interventions to prevent reduced work functioning, it is important to have insight in prognostic factors for successful work functioning. Therefore, the study aims to identify prognostic factors, measured at baseline, for successful work functioning at follow-up in a general working population.
MethodsA longitudinal study was conducted among the working population. Participants were recruited via several companies and organizations in various work settings in the Netherlands, via advertisements in a regional newspaper and online. The study consisted of a baseline measurement and a 3-month follow-up measurement. The inclusion criteria were: aged between 18 and 64 years and working at least 12 hours per week (in the past four weeks). Exclusion criteria were: 1) not able to read and understand Dutch (the language of the questionnaire), 2) being pregnant, or 3) having plans to stop working within six months (for example due to retirement). All participants with a WRFQ 2.0 total score at follow-up were included in the analyses (N=98). According to the Medical Ethics Committee of the University Medical Center Groningen no ethical approval was required. All participants provided informed consent.
Dependent variable Work functioning. Work functioning was assessed with the Work Role Functioning Questionnaire (WRFQ) 2.0 [6,10]. The WRFQ 2.0 measures the perceived difficulties in meeting work demands among workers given their physical health or emotional problems. It consists of 27 items, divided into four subscales: work scheduling & output demands, physical demands, mental & social demands, and flexibility demands. In addition, a total score can be calculated. All items have to be answered on a five-point scale from 0=difficult all the time (100%), 1=difficult most of the time, 2=difficult half of the time (50%), 3=difficult some of the time, 4=difficult none of the time (0%). There is a response option ‘Does not apply to my job’. The total score is calculated by adding all answers, dividing by the number of items not missing and then multiplied with 25 to obtain percentages between 0 and 100, with higher scores indicating better work functioning. The scores on ‘Does not apply to my job’ were transformed to missing values. If 20% or more items were missing, the scale score was set to missing. The WRFQ 2.0 scores are positively skewed to the right, both at baseline and 3 month follow-up: baseline mean 86.2, SD 12.2, range 37.5-100; 3 month follow-up mean 87.0, SD 11.1, range 37.5-100. The total score was categorized as follows: 0-90 ‘working, but only able to meet the demands of the job less than 90% of the time’ (N=53); >90 ≤95 ‘good work functioning’ (N=18); and >95-100 ‘successful work functioning’ (N=27). In an earlier study, the cut-off value of 90 was used for successful work functioning [8], however, this was employed in a return to
Prognostic factors for successful work functioning
109
6
work population after carpal tunnel release surgery. To be able to distinguish between good work functioning and successful work functioning the cut-off value was set at >95 for this study.
Independent variablesHealth status. The physical component score (PCS-12) and the mental component score (MCS-12) of the Short Form-12 (SF-12) were measured at baseline [11,12]. The 12 items were scored and transformed to a mean of 50 and a standard deviation of 10, with higher scores reflecting better health (range 0-100). Scores were then dichotomized at the population mean of 50. Fatigue was assessed with the ‘subjective experience of fatigue’ subscale of the Checklist Individual Strength (CIS) [13,14]. This 8-item subscale was designed to measure ‘severity of fatigue’. The items are scored on a seven-point Likert scale (1=yes, that is true to 7=no, that is not true), with low scores indicating low fatigue (range 7-56). This scale was dichotomized at 35, a cut-off value for severe fatigue [13,15,16].Work. Job content was measured with four subscales of the Job Content Questionnaire (JCQ) [17-19], psychological job demands (PsD) (range 12-48), decision latitude (DL) (range 24-96), supervisor social support (SS) (range 0-16) and coworker social support (CS) (range 0-16). The four scales were dichotomized at the median (DL=76;SS=12;CS=12and PsD=32). The 9-item version of the Utrecht Work Engagement Scale (UWES) was included to assess work engagement [20]. Work engagement is described as a positive, fulfilling work-related (persistent) state of mind that is characterized by vigor, dedication and absorption [20]. The items are rated on a seven-point Likert scale from 0=never to 6=always, a total score was calculated by taking the mean of all items [21] (range0-6) and was dichotomized at 4.66 to differentiate between low-moderate and high-very high [21].Work ability. The single item “current work ability compared with the life time best” – with a possible score of 0=completely unable to work to 10=work ability at its best – of the Work Ability Index (WAI) was included as a self-assessed measure of ability to work [22,23]. A correlation of 0.49 was calculated between this item and work functioning in this sample, indicating that although both measures are related they are not measuring the same construct. The score was dichotomized at a WAI score of 8 [23].
CovariatesAge and education level were measured. Education was categorized as high (higher vocational and university), medium (high school and intermediate vocational) and low (lower vocational, elementary school and no finished education).
Statistical analyses. A non-response analysis was performed to identify significant differences in respondents versus non-respondents scores (t-tests). Ordinal logistic regression analyses were performed to examine the bivariate relationships between
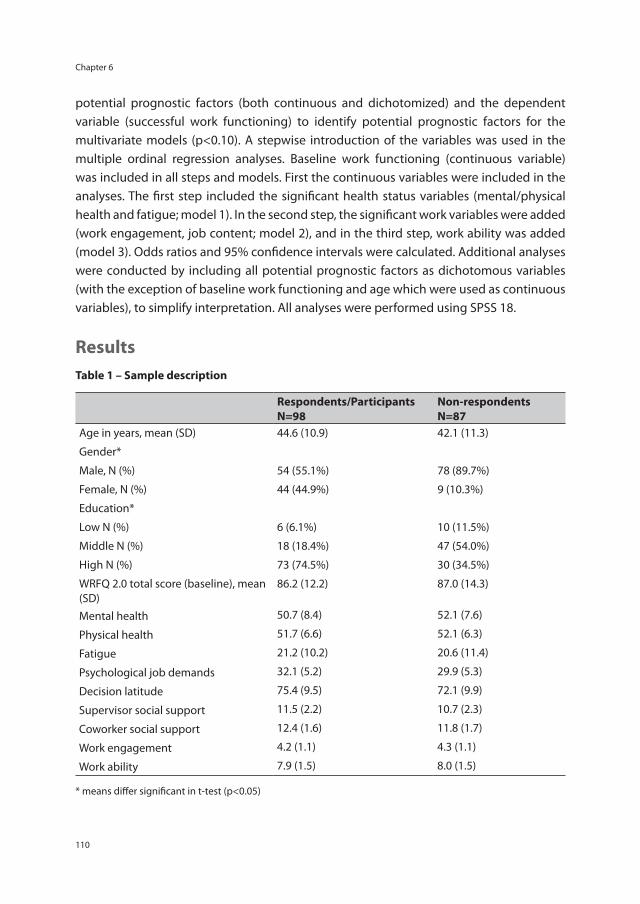
Chapter 6
110
potential prognostic factors (both continuous and dichotomized) and the dependent variable (successful work functioning) to identify potential prognostic factors for the multivariate models (p<0.10). A stepwise introduction of the variables was used in the multiple ordinal regression analyses. Baseline work functioning (continuous variable) was included in all steps and models. First the continuous variables were included in the analyses. The first step included the significant health status variables (mental/physical health and fatigue; model 1). In the second step, the significant work variables were added (work engagement, job content; model 2), and in the third step, work ability was added (model 3). Odds ratios and 95% confidence intervals were calculated. Additional analyses were conducted by including all potential prognostic factors as dichotomous variables (with the exception of baseline work functioning and age which were used as continuous variables), to simplify interpretation. All analyses were performed using SPSS 18.
ResultsTable 1 – Sample description
Respondents/ParticipantsN=98
Non-respondentsN=87
Age in years, mean (SD) 44.6 (10.9) 42.1 (11.3)
Gender*
Male, N (%) 54 (55.1%) 78 (89.7%)
Female, N (%) 44 (44.9%) 9 (10.3%)
Education*
Low N (%) 6 (6.1%) 10 (11.5%)
Middle N (%) 18 (18.4%) 47 (54.0%)
High N (%) 73 (74.5%) 30 (34.5%)
WRFQ 2.0 total score (baseline), mean (SD)
86.2 (12.2) 87.0 (14.3)
Mental health 50.7 (8.4) 52.1 (7.6)
Physical health 51.7 (6.6) 52.1 (6.3)
Fatigue 21.2 (10.2) 20.6 (11.4)
Psychological job demands 32.1 (5.2) 29.9 (5.3)
Decision latitude 75.4 (9.5) 72.1 (9.9)
Supervisor social support 11.5 (2.2) 10.7 (2.3)
Coworker social support 12.4 (1.6) 11.8 (1.7)
Work engagement 4.2 (1.1) 4.3 (1.1)
Work ability 7.9 (1.5) 8.0 (1.5)
* means differ significant in t-test (p<0.05)
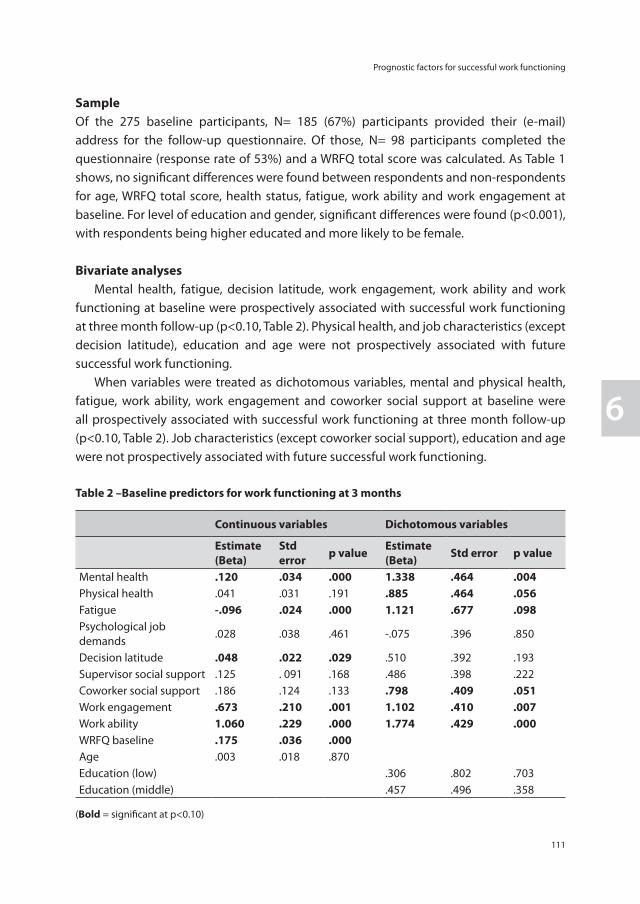
Prognostic factors for successful work functioning
111
6
SampleOf the 275 baseline participants, N= 185 (67%) participants provided their (e-mail) address for the follow-up questionnaire. Of those, N= 98 participants completed the questionnaire (response rate of 53%) and a WRFQ total score was calculated. As Table 1 shows, no significant differences were found between respondents and non-respondents for age, WRFQ total score, health status, fatigue, work ability and work engagement at baseline. For level of education and gender, significant differences were found (p<0.001), with respondents being higher educated and more likely to be female.
Bivariate analyses Mental health, fatigue, decision latitude, work engagement, work ability and work functioning at baseline were prospectively associated with successful work functioning at three month follow-up (p<0.10, Table 2). Physical health, and job characteristics (except decision latitude), education and age were not prospectively associated with future successful work functioning. When variables were treated as dichotomous variables, mental and physical health, fatigue, work ability, work engagement and coworker social support at baseline were all prospectively associated with successful work functioning at three month follow-up (p<0.10, Table 2). Job characteristics (except coworker social support), education and age were not prospectively associated with future successful work functioning.
Table 2 –Baseline predictors for work functioning at 3 months
Continuous variables Dichotomous variables
Estimate (Beta)
Std error p value Estimate
(Beta) Std error p value
Mental health .120 .034 .000 1.338 .464 .004Physical health .041 .031 .191 .885 .464 .056Fatigue -.096 .024 .000 1.121 .677 .098Psychological job demands
.028 .038 .461 -.075 .396 .850
Decision latitude .048 .022 .029 .510 .392 .193Supervisor social support .125 . 091 .168 .486 .398 .222Coworker social support .186 .124 .133 .798 .409 .051Work engagement .673 .210 .001 1.102 .410 .007Work ability 1.060 .229 .000 1.774 .429 .000WRFQ baseline .175 .036 .000Age .003 .018 .870Education (low) .306 .802 .703Education (middle) .457 .496 .358
(Bold = significant at p<0.10)
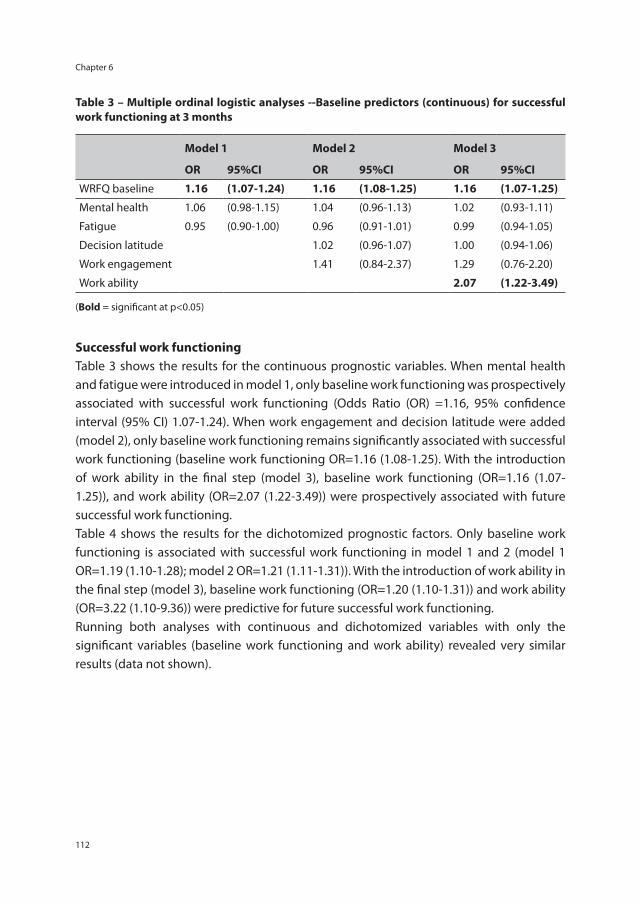
Chapter 6
112
Table 3 – Multiple ordinal logistic analyses --Baseline predictors (continuous) for successful work functioning at 3 months
Model 1 Model 2 Model 3
OR 95%CI OR 95%CI OR 95%CI
WRFQ baseline 1.16 (1.07-1.24) 1.16 (1.08-1.25) 1.16 (1.07-1.25)
Mental health 1.06 (0.98-1.15) 1.04 (0.96-1.13) 1.02 (0.93-1.11)
Fatigue 0.95 (0.90-1.00) 0.96 (0.91-1.01) 0.99 (0.94-1.05)
Decision latitude 1.02 (0.96-1.07) 1.00 (0.94-1.06)
Work engagement 1.41 (0.84-2.37) 1.29 (0.76-2.20)
Work ability 2.07 (1.22-3.49)
(Bold = significant at p<0.05)
Successful work functioning Table 3 shows the results for the continuous prognostic variables. When mental health and fatigue were introduced in model 1, only baseline work functioning was prospectively associated with successful work functioning (Odds Ratio (OR) =1.16, 95% confidence interval (95% CI) 1.07-1.24). When work engagement and decision latitude were added (model 2), only baseline work functioning remains significantly associated with successful work functioning (baseline work functioning OR=1.16 (1.08-1.25). With the introduction of work ability in the final step (model 3), baseline work functioning (OR=1.16 (1.07-1.25)), and work ability (OR=2.07 (1.22-3.49)) were prospectively associated with future successful work functioning.Table 4 shows the results for the dichotomized prognostic factors. Only baseline work functioning is associated with successful work functioning in model 1 and 2 (model 1 OR=1.19 (1.10-1.28); model 2 OR=1.21 (1.11-1.31)). With the introduction of work ability in the final step (model 3), baseline work functioning (OR=1.20 (1.10-1.31)) and work ability (OR=3.22 (1.10-9.36)) were predictive for future successful work functioning.Running both analyses with continuous and dichotomized variables with only the significant variables (baseline work functioning and work ability) revealed very similar results (data not shown).
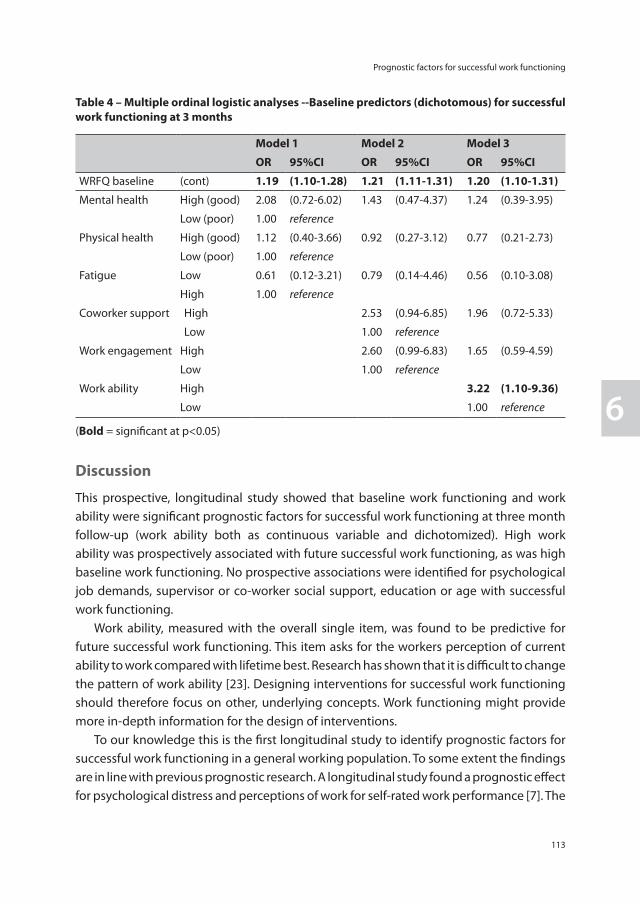
Prognostic factors for successful work functioning
113
6
Table 4 – Multiple ordinal logistic analyses --Baseline predictors (dichotomous) for successful work functioning at 3 months
Model 1 Model 2 Model 3
OR 95%CI OR 95%CI OR 95%CI
WRFQ baseline (cont) 1.19 (1.10-1.28) 1.21 (1.11-1.31) 1.20 (1.10-1.31)
Mental health High (good) 2.08 (0.72-6.02) 1.43 (0.47-4.37) 1.24 (0.39-3.95)
Low (poor) 1.00 reference
Physical health High (good) 1.12 (0.40-3.66) 0.92 (0.27-3.12) 0.77 (0.21-2.73)
Low (poor) 1.00 reference
Fatigue Low 0.61 (0.12-3.21) 0.79 (0.14-4.46) 0.56 (0.10-3.08)
High 1.00 reference
Coworker support High 2.53 (0.94-6.85) 1.96 (0.72-5.33)
Low 1.00 reference
Work engagement High 2.60 (0.99-6.83) 1.65 (0.59-4.59)
Low 1.00 reference
Work ability High 3.22 (1.10-9.36)
Low 1.00 reference
(Bold = significant at p<0.05)
Discussion
This prospective, longitudinal study showed that baseline work functioning and work ability were significant prognostic factors for successful work functioning at three month follow-up (work ability both as continuous variable and dichotomized). High work ability was prospectively associated with future successful work functioning, as was high baseline work functioning. No prospective associations were identified for psychological job demands, supervisor or co-worker social support, education or age with successful work functioning. Work ability, measured with the overall single item, was found to be predictive for future successful work functioning. This item asks for the workers perception of current ability to work compared with lifetime best. Research has shown that it is difficult to change the pattern of work ability [23]. Designing interventions for successful work functioning should therefore focus on other, underlying concepts. Work functioning might provide more in-depth information for the design of interventions. To our knowledge this is the first longitudinal study to identify prognostic factors for successful work functioning in a general working population. To some extent the findings are in line with previous prognostic research. A longitudinal study found a prognostic effect for psychological distress and perceptions of work for self-rated work performance [7]. The
Chapter 6
114
authors did not find an effect for the mental/physical component scores (SF-12), health status measured with the EQ5D, or objective work measures such as contract type, flexible working arrangements or physical job characteristics in a multivariate analysis. A study identifying predictors for successful work functioning after carpal tunnel release surgery [8] also found baseline work functioning (before surgery) to be predictive for successful work functioning at six months after return to work. However, they also identified physical health to be predictive for successful work functioning in their population, which was not predictive in the multivariate analyses in this study with a general working population. In cross sectional research, associations were found between ‘low performance at work’ and age and poor general health [4]. Associations between several work-related factors (among others job content) and ‘low performance at work’ in both bivariate and multivariate analyses were also observed. In the current study, no job content variable was prospectively associated with successful work functioning in the multivariate models. This might suggest that job content influences a workers’ functioning at work, but that this effect attenuates over time. This lack of an association could also be a result of the inclusion of baseline work functioning in the analyses. Amick et al. [8] note that the attenuation of the effect of job content might be due to organizational support. More longitudinal studies with repeated measurements are needed to further study these associations. In the bivariate analyses, fatigue was prospectively associated with successful work functioning. Earlier research has shown the influence of fatigue on work limitations. For example, Hansen et al. [24] studied work limitations in a breast cancer survivor population. They found more work limitations in the breast cancer survivors in comparison to the non-cancer group and fatigue was related to work limitations to a greater degree than in the non-cancer group. Munir et al. [25] studied the effect of a variety of chronic conditions on work limitations and work adjustments and found that for many health conditions it were generic symptoms like fatigue that resulted in work limitations [25]. With respect to the current study, several strengths and limitations have to be addressed. Although a response rate of 53% at follow-up was reasonable for a survey in the working population, the number of participants in the analyses (N=98) was rather low. A non-response analysis showed that there was no difference between the respondents and non-respondents for baseline work functioning. However, differences were found for education and gender. Although no information is available about the influence of education on work functioning scores, a relatively high educated population may have led to a bias in work functioning scores at follow-up. The over representation of higher educated participants might have also led to a lack of variance in other variables such as physical health, fatigue, decision latitude or work engagement. The proportional odds assumption was tested for each model [26]. All tests showed that the assumption was met, though due to small sample sizes the reliability of the test might be questioned.
Prognostic factors for successful work functioning
115
6
A point of interest is the assessment of the independent and dependent variables. Both were measured with self-report measures, which might have resulted in an overestimation of the associations due to shared method variance or shared response biases [27]. In addition, the used cut-off value for successful work functioning needs to be addressed as to date there is no evidence based cut-off value for successful work functioning available. Other studies have used and proposed various values. Amick et al. [8] used the value of >90 for successful work functioning in a population of workers who returned to work after carpal tunnel surgery. Lerner et al. [28] proposed a value of 100 to be a ‘healthy’ norm (WLQ). The use of a cut-off value is always arbitrary and contains judgment [29]. In this study the WRFQ 2.0 scores were positively skewed to the right, both at baseline and 3 month follow-up. To be able to distinguish between good work functioning and successful work functioning for this study the cut-off value was set at >95, including the top 25 percent. Following this issue, various cut-off values were used to dichotomize the independent variables, including median split. Possible consequences of using dichotomized independent variables are loss of information, loss of power and spurious statistical significance [30]. Although the models for the continuous and dichotomized variables varied in terms of included independent variables, no differences were observed in the significant prognostic factors. To our knowledge this is the first longitudinal study to identify prognostic factors for successful work functioning in the general working population. Further research, in larger populations and with repeated measurements, is needed to identify more prognostic factors for successful work functioning and to explore if there are different prognostic factors for various levels of baseline work functioning. With the expected shortages in the labor force and the increase of participation of workers with a health problem, (preventive) interventions are needed to help workers to stay at work in a healthy, productive and sustainable way. Identifying prognostic factors for successful work functioning might help in the development of interventions to improve future work functioning.
Chapter 6
116
References
1. Jagger C, Gillies C, Moscone F, Cambois E, Van OH, Nusselder W, et al. Inequalities in healthy life years in the 25 countries of the European Union in 2005: a cross-national meta-regression analysis. Lancet 2008; 372:2124-31.
2. Lerner D, Henke RM. What does research tell us about depression, job performance, and work productivity? J Occup Environ Med 2008; 50:401-10.
3. Erickson SR, Guthrie S, Vanetten-Lee M, Himle J, Hoffman J, Santos SF, et al. Severity of anxiety and work-related outcomes of patients with anxiety disorders. Depress Anxiety 2009; 26:1165-71.
4. van den Heuvel SG, Geuskens GA, Hooftman WE, Koppes LL, van den Bossche SN. Productivity loss at work; health-related and work-related factors. J Occup Rehabil 2010; 20:331-9.
5. Amick BC,III, Gimeno D. Measuring Work Outcomes with a focus on Health-Related Work Productivity Loss. In: Wittink H, Carr D, editors. Pain Management: Evidence, Outcomes, and Quality of Life: A Sourcebook. Amsterdam: Elsevier; 2008. p. 329-343.
6. Abma FI, van der Klink JJ, Bultmann U. The Work Role Functioning Questionnaire 2.0 (Dutch Version): Examination of its Reliability, Validity and Responsiveness in the General Working Population. J Occup Rehabil 2012.
7. Wynne-Jones G, Buck R, Varnava A, Phillips CJ, Main CJ. Impacts on work performance; what matters 6 months on? Occup Med (Lond) 2011; 61:205-8.
8. Amick BC,III, Habeck RV, Ossmann J, Fossel AH, Keller R, Katz JN. Predictors of successful work role functioning after carpal tunnel release surgery. J Occup Environ Med 2004; 46:490-500.
9. Lerner D, Adler DA, Rogers WH, Chang H, Lapitsky L, McLaughlin T, et al. Work performance of employees with depression: the impact of work stressors. Am J Health Promot 2010; 24:205-13.
10. Abma FI, Amick BC,3rd, Brouwer S, van der Klink JJL, Bültmann U. The cross-cultural adaptation of the Work Role Functioning Questionnaire to Dutch. Work: Journal of Prevention, Assessment & Rehabilitation. In press.
11. Ware J,Jr, Kosinski M, Keller SD. A 12-Item Short-Form Health Survey: construction of scales and preliminary tests of reliability and validity. Med Care 1996; 34:220-33.
12. Ware JE, Kosinski M, Turner-Bowker DM, Gandek B. How to score version 2 of the SF-12 Health Survey. Lincoln, RI: QualityMetric Incorporated, 2002.
13. Vercoulen JH, Swanink CM, Fennis JF, Galama JM, van der Meer JW, Bleijenberg G. Dimensional assessment of chronic fatigue syndrome. J Psychosom Res 1994; 38:383-92.
14. Beurskens AJ, Bultmann U, Kant I, Vercoulen JH, Bleijenberg G, Swaen GM. Fatigue among working people: validity of a questionnaire measure. Occup Environ Med 2000; 57:353-7.
15. Vercoulen JH, Alberts M, Blijenberg G. De Checklist Individual Strength (CIS). Gedragstherapie 1999:31-6.
16. Huibers MJ, Kant IJ, Knottnerus JA, Bleijenberg G, Swaen GM, Kasl SV. Development of the chronic fatigue syndrome in severely fatigued employees: predictors of outcome in the Maastricht cohort study. J Epidemiol Community Health 2004; 58:877-82.
17. Karasek RA. Job Content Questionnaire and Users’s Guide. Los Angeles: University of Southern California, Department of Industrial and Systems Engineering, 1985.
18. Karasek RA. Job demands, job decision latitude, and mental strain: implications for job redesign. Administrative Science Quarterly 1979:285-309.
Prognostic factors for successful work functioning
117
6
19. Reliability and validity of the Dutch version of the Karasek Job Content Questionnaire. Washington, DC: APA/NIOSH Conference on Work, Stress and Health; 1995.
20. Schaufeli WB, Bakker AB, Salanova M. The Measurement of Work Engagement With a Short Questionnaire: A Cross-National Study. Educational and Psychological Measurement 2006; 66:701-16.
21. Schaufeli WB, Bakker AB. Test manual for the Utrecht Work Engagement Scale. 2003. (Available at http://www.schaufeli.com).
22. Tuomi K, Ilmarinen J, Jahkola A, Katajarinne L, Tulkki A. Work Ability Index. In: Rautoja S, Pietiläinen R, editors. Finland: K-Print Oy Vantaa, Finnish Institue of Occupational Health; 1998.
23. Ahlstrom L, Grimby-Ekman A, Hagberg M, Dellve L. The work ability index and single-item question: associations with sick leave, symptoms, and health—a prospective study of women on long-term sick leave. Scand J Work Environ Health 2010; 36:404-12.
24. Hansen JA, Feuerstein M, Calvio LC, Olsen CH. Breast cancer survivors at work. J Occup Environ Med 2008; 50:777-84.
25. Munir F, Jones D, Leka S, Griffiths A. Work limitations and employer adjustments for employees with chronic illness. Int J Rehabil Res 2005; 28:111-7.
26. Lammers J. Categorische data analyse met SPSS: inleiding in loglineaire analysetechnieken. Assen: Koninklijke Van Gorcum, 2007.
27. Amick B, Kasl S. Work Stress. In: McDonald C, editor. Epidemiology of Work Related Diseases London: BMJ Publishing Group; 2000. p. 283-308.
28. Lerner D, Reed JI, Massarotti E, Wester LM, Burke TA. The Work Limitations Questionnaire’s validity and reliability among patients with osteoarthritis. Journal of clinical epidemiology 2002; 55:197-208.
29. Dwyer CA. Cut scores and testing: Statistics, judgment, truth, and error. Psychol Assess 1996; 8:360-2.
30. MacCallum RC, Zhang S, Preacher KJ, Rucker DD. On the practice of dichotomization of quantitative variables. Psychol Methods 2002; 7:19-40.


Chapter 7
General discussion

General discussion
121
7
The overall aim of this thesis was to develop a generic instrument that evaluates work functioning in relation to health for use in the Dutch context. This overall aim has been translated into five research objectives, divided into two main themes:
1. Exploration of the concept of health-related work functioning and the development/cross-cultural translation of an instrument:
- To explore functioning at work with health problems (including three stakeholder perspectives) in a qualitative way to provide insight in the concept of health-related work functioning and to explore if and how this can be measured.
- To identify existing instruments and their measurement properties. - To develop a new instrument (or translate and adapt an existing instrument) for use in
the Dutch context.
2. Validation and adaptation of the instrument:- To validate and adapt the new instrument for use in the Dutch context.- To identify prognostic factors related with successful work functioning over time.
Below the main findings will be discussed within these two themes. Moreover, the strengths and limitations of the research will be discussed. To conclude, implications for translating research to practice and recommendations for future research are provided.
Work functioning concept exploration and instrument developmentTo start the exploration of functioning at work for workers with health problems a qualitative study was conducted, including the perspectives of three main stakeholder groups: the worker (with a health problem), the occupational physician and the HRM/supervisor. Results provided insights into workers’ decision to stay at work and in differences between how the three stakeholders perceive the situation. For example, the workers’ motivation or attributed value of work can vary, which might result in different choices (e.g. to stay at work or to report sick). The supervisor can facilitate job accommodation of workers and help optimizing functioning at work. Participants also identified ‘signals’ for decreased work functioning. For example, ‘changes in behavior’ (OPs), ‘decrease in quality of work’ (both OPs and HRM/supervisors) and ‘working with pain’ (workers) were mentioned. These signals contributed to the development of an instrument to measure work functioning. An important condition for use mentioned by the workers was that the instrument should be administered in a ‘safe’ setting. It is of ultimate importance that all stakeholders should understand what will happen with the results and what possible actions might follow based on completing the questionnaire. The group of workers at work with a common mental disorder (CMD) is increasing [1] and, as is shown in a recent review, health-related work functioning instruments are
Chapter 7
122
frequently used in this population [2]. This (narrative) review only provides an overview, while the available evidence for the use of these instruments in this population remains unclear (e.g. the measurement properties and an assessment of the methodological quality of the validation studies). Since these instruments are frequently used in research without clear evidence, it was decided to focus our systematic review on a common mental disorder (CMD) population. Williams et al. [3] performed a similar review in a population with musculoskeletal disorders, although their methodological assessment was not as rigorous as in our systematic review. Our systematic review showed that the available evidence for the use of the existing instruments is low, mainly due to low methodological quality of the conducted validation studies. Because of this low methodological quality, we simply do not know enough about the measurement properties of the existing instruments to make evidence-based recommendations about which instrument to use. No appropriate work functioning instrument was available for use in the Dutch context. Therefore, it was decided to translate and cross-culturally adapt an existing instrument to Dutch. The Work Role Functioning Questionnaire (WRFQ) was chosen because it is a generic instrument developed to represent a broad variety of both job demands and health problems. The aim and construct of this instrument suited the main thesis aim; to develop a new (or translate an existing) generic instrument to measure functioning at work. In addition, the WRFQ is freely available in the literature for professionals and researchers. During the cross-cultural translation process it was suggested to ‘update’ the WRFQ to reflect the current nature of work. The instrument was developed in the 1990s and is closely related to the Work Limitations Questionnaire (WLQ) [4]. The two instruments are similar, but differ on the next aspects: the WRFQ uses a 4-week recall period (WLQ 2-week); it uses a single response set for all questions with “half the time” the middle category rather than “some of the time” (WLQ) [4], the WRFQ consists of 27 items, the WLQ of 25, and although they are based on the same item pool they do not contain the same items (though there is about 90% overlap). Five new items were formulated for the WRFQ based on suggestions made during the pre-test phase and the focus group meetings and were supported by literature to reflect the changes in the nature of work in the past decades and the ‘new work practices’. This resulted in the Work Role Functioning Questionnaire 2.0 (WRFQ 2.0).
Strengths and limitations in exploring the concept of health-related work functioningIn exploring the concept of health-related work functioning it is important to be comprehensive and embrace more than one perspective. In the focus group study three main stakeholders, i.e. workers with a health problem, occupational physicians, and HRM/supervisors, were included to provide this broad view. However, only one group discussion was conducted with each stakeholder group. The number of focus groups might be too limited to reach ‘saturation’ of the themes and might be a limitation for the generalizability
General discussion
123
7
of the findings. Additional focus groups might reveal new insights and aspects related to the concept, additional signals for reduced work functioning or new opinions on measuring work functioning. Nevertheless, this is the first study to explore this concept including these three stakeholder perspectives and provides valuable information for the field of occupational health. The results were used as input for the choice, development and adaptation of the instrument presented in this thesis. When exploring the literature for existing health-related work functioning instruments and their measurement properties it was interesting to note that there was little evidence available for the use of these instruments. A recent review, showed that there are numerous work functioning instruments used in CMD populations [2], more than included in our systematic review. It might therefore be possible that due to the strict set of inclusion criteria instruments or papers were excluded that are also of interest for this population. However, by its strict focus our review provides a clear overview of the available evidence in this field and reveals gaps in knowledge. The review also showed that studies using these instruments in CMD populations should be interpreted with care. There is no body of evidence that these instruments are appropriate for this population and provide valid and reliable information. In other populations (such as musculoskeletal disorder) no thorough systematic reviews evaluating the body of evidence for use of these instruments have been performed. Therefore, similar reviews in other populations are needed to provide a more credible body of evidence. During the cross-cultural adaptation of the WRFQ to Dutch, a systematic approach was used [5,6]. If measures are to be used across countries, the items must not only be translated linguistically, but also must be adapted culturally to maintain the content validity of the instrument at a conceptual level across different cultures [6]. The guidelines used included recommendations for obtaining semantic, idiomatic, experiential and conceptual equivalence in translation by using back-translation techniques and committee review, pre-testing techniques and re-examining the score weights [5].
Validation and adaptation of the instrumentTo measure health-related functioning at work, validated instruments are needed. To evaluate the measurement properties of the WRFQ 2.0, a longitudinal validation study was conducted. Factor analyses identified the new items on flexibility as an additional subscale in the instrument. Five original items were removed based on the same factor analyses. The test-retest reliability of the total WRFQ 2.0 score and three subscales were moderate and for the new flexibility demands subscale low. Therefore, the instrument is considered reliable for use on the group level and might not be reliable for use on the individual level. Responsiveness was assessed using three measures of global perceived effect: health status, job performance, and work ability. Due to the relative stable and
Chapter 7
124
healthy population the number of workers who reported change, in either one of the global perceived effect measures, was very small. A self-rated improvement in health, job performance and work ability was not reflected in the WRFQ 2.0 change scores, which were close to zero. The WRFQ 2.0 performed better in detecting deterioration, especially for changes in health and job performance. In all, the WRFQ 2.0 appears to be a reliable and valid instrument to measure health-related work functioning in the working population at least on a group level and might be a helpful tool for concerted actions of the worker, occupational health professionals, and HRM/supervisors. Further research is required to support the use of the instrument on an individual level. The WRFQ 2.0 was validated in the rather healthy general working population. If occupational health professionals and/or HRM use the instrument, they will use it in a working population with a broad variety of health problems and job types. Therefore, it is important to have insight in the measurement properties of the instrument and to have norms. Further research is needed to validate the WRFQ 2.0 in other working populations (e.g. specific job types or specific health conditions). Furthermore, efforts should be made to obtain detailed WRFQ 2.0 norms for the Dutch working population. Examination of longitudinal data showed that baseline work functioning and work ability were significant predictors for successful work functioning (total score >95) at three month follow-up. High work ability, measured with the overall item, was found to be predictive for future successful work functioning. This item asks for the workers perception of current ability to work compared with lifetime best. However, research has shown that it is difficult to change the pattern of work ability [24]. Designing interventions for successful work functioning should therefore focus on other, underlying concepts. Work functioning might provide more in-depth information for the design of interventions.
Strengths and limitations in evaluation and adaptation of instrumentThe low scores for the flexibility demands scale might be explained by the fact that there were problems for a small group of participants with the visibility of the answer anchors for these specific items in the online survey (the anchors were not shown on the computer screen for these five items). Data analysis revealed that there were six extreme outliers with a change score of >70. In the second survey, an item was included asking participants about their current health status and work ability. Comparing the answers on the first measurement and the second measurement after one week revealed no large changes for these six participants, indicating that the large change scores might be due to the missing anchors. When these six participant were excluded from the analysis, the data revealed ICC scores for this subscale closer to the ICC of the other subscales. Future research is needed to evaluate the reliability for use on an individual level. Moderate to low results were observed for responsiveness. It is not surprising that in this relatively healthy sample the WRFQ 2.0 performs better in measuring deterioration than improvement, since a clear
General discussion
125
7
ceiling effect was observed. The observed results for responsiveness could also be due to the low number of participants in the change groups (range between 6-26). According to Terwee et al. [7], a sample of at least 30 participants is required for each change group to obtain fair methodological quality, and 50 participants for good quality [7]. Further research is needed to evaluate WRFQ 2.0 responsiveness. It is recommended to include participants who are expected to change over time, for example after an intervention. It is important to be clear on the purpose of use of the instrument, because different purposes require different measurement properties. In line with this, it is important to examine the various measurement properties for each purpose. The present thesis showed that the WRFQ 2.0 is able to differentiate between several subgroups. Workers with poor/fair mental or poor/fair physical health had lower work functioning scores in comparison with workers with good/excellent mental or good/excellent physical health. Workers with respectively a low level of need for recovery or a low level of fatigue reported better work functioning than workers with higher levels of need for recovery or fatigue. These results provide an indication of the WRFQ 2.0’s discriminant ability. In this population, the standard error of measurement (SEM) for the WRFQ 2.0 total score was 7.89 points. This means that for all change scores under 8 points it is not known whether this change is due to a real change or to measurement error. Although the SEM is known, if the instrument is used for diagnosis, more information needs to be added about specific measurement properties. For example, more information about sensitivity and specificity is needed to assess the instruments’ diagnostic accuracy. However, this requires a gold standard, which is not (yet) available for work functioning. A prerequisite for evaluative purposes is good responsiveness. A moderate to low responsiveness was found in the general working population. The small samples limit the assessment of responsiveness and further research in larger samples is needed. In addition, the minimal important change (MIC) has not been determined yet. The MIC provides information about the amount of change that is considered important [8,9]. Therefore researchers and professionals should be cautious when interpreting the results if the instrument is used in diagnostic or evaluative studies. The longitudinal data provided an opportunity to explore possible prognostic factors for successful work functioning. To our knowledge this is the first study to identify prognostic factors for successful work functioning in the general working population. Although a response rate of 53% at follow-up was reasonable for a survey in the working population, the number of participants in the analyses (N=98) was rather low. Further research in larger populations is needed to replicate these findings and explore additional possible prognostic factors for successful work functioning, especially because higher educated participants were overrepresented in this population. In addition, an important issue concerns the assessment of the independent and dependent variables in this study. Both were measured with self-report measures, which might have resulted in an
Chapter 7
126
overestimation of the associations due to shared method variance or shared response biases [10]. In the longitudinal study, a cut-off value of >95 was used for successful work functioning. Using a cut-off value is always arbitrary and contains judgment [11]. No evidence based cut-off value for work functioning is available. Other studies have used and proposed various values. Amick et al. [12] used the value of >90 for successful work functioning in a population of workers who returned to work after carpal tunnel surgery. Lerner et al. [13] proposed a value of 100 to be a ‘healthy’ norm (WLQ). In this study the WRFQ 2.0 scores were positively skewed to the right, both at baseline and 3 month follow-up. To be able to distinguish between good work functioning and successful work functioning for this study the cut-off value was set at >95, including the top 25 percent. Future research should be conducted to further explore possible cut-off values.
Reflections on the WRFQ 2.0Although the WRFQ 2.0 seems to be a reliable and valid instrument to measure health-related work functioning in the Dutch general working population, there are some issues that need to be addressed. An important issue concerns the operationalization of the concept. The WRFQ 2.0 evaluates the ability of the worker to meet work demands in percentage of time. The question is whether this demand driven approach is the most suitable way to measure work functioning in the current and/or future work setting. The instrument was developed in the US during the 1990s and although evaluating work functioning in ‘work demands’ might still be an appropriate approach for a large group of jobs, it can be questioned if this remains the best way to measure work functioning in the future. With the increase of new work practices, with reductions in management levels, jobs that require more multitasking and self-management with increased collective work (team work), and jobs that are subject to rapid changes, workers are confronted with increasing responsibilities in making decisions over their work, not only in their work. Consequently, they have to define their own demands [14]. In future research, it might be interesting to explore other approaches to measuring work functioning, for example by integrating feedback from additional perspectives (e.g. HRM/supervisor, OP, colleagues, subordinates, customers) or by including other performance indicators. In addition, more information is needed about relevant factors for sustainable work functioning. Major questions remain unanswered. When is work functioning successfully, healthy and productive over time? What are the conditions or prerequisites for work functioning to be sustainable in the future? Further research is needed to identify relevant factors and prerequisites for sustainable work functioning. To answer these question, the capability approach from Amartya Sen might provide a helpful framework [15,16]. In this approach the context surrounding the individual is also incorporated, e.g. the activity itself (work), and the context in which work has to take place are both important determinants of
General discussion
127
7
whether individuals can participate in work and of their work functioning. Also an individuals’ attitude and motivation influences whether or not this individual will indeed participate and function at work. More information is needed on which factors are essential and how they facilitate the sustainability of work functioning. Another important issue concerns the applicability or purpose of the instrument. The aim was to develop an instrument that should be applicable in concerted actions of the worker, occupational health professionals, and human resources professionals (HRM)/supervisors. The participants in the focus groups however could not reach consensus about the user of this instrument. The workers referred to the OP, colleagues, supervisor, friends/family, and themselves – without consensus. An important condition for use was mentioned: a ‘safe’ setting. A safe setting can be provided within the confidentiality of the occupational physicians’ office, but might also be created between the worker and HRM/supervisor. It has to be stressed that it should be clear from the start (i.e. before completing the instrument) to all stakeholders what the instrument’s purpose is, what is intended with the outcome and that the outcomes will be handled with care (e.g. ‘safe’). Several possible purposes were mentioned by focus group and pre-test (during the cross-cultural translation process) participants. Several illustrative examples are: to start a conversation about functioning at work with the worker, to monitor a workers’ functioning over time, to identify the need for job accommodation, or to evaluate an intervention.
Implications for research and practiceFor the use of an instrument in research and practice it is important that the instrument is not too long and scores can be easy interpreted. The final WRFQ 2.0 is a brief questionnaire that consists of 27 items and scores are reflected as percentages of work time on a scale from 0 to 100. In addition, the measurement properties are important. The WRFQ 2.0 has four subscales and shows very good internal consistency, moderate test-retest reliability and moderate responsiveness in this working sample. The instrument has been ‘updated’ to reflect the current nature of work. The WRFQ 2.0 might be a helpful tool in the concerted action of occupational health care professionals and human resources professionals. The instrument can be used as a starting point for a conversation between the occupational health care professional, HRM professional and worker about the actual functioning of the worker, without over-medicalizing the situation. In addition, the instrument provides detailed information about which aspects of the jobs demand are difficult to meet for the worker hopefully providing directions for job accommodation. When taking the shift in the Dutch occupational health care setting towards preventive actions in mind, the instrument might also be of value to monitor work functioning and/or show the need for an (early) intervention to help workers stay at work. Based on the validation study results, the instrument is able to detect differences between workers with respectively low and high physical and mental health. For practical applications, it is important for professionals
Chapter 7
128
to take the intended use into consideration and to be careful when interpreting the results if the measurement properties are not known or unclear for that purpose. If, for example, the aim is to evaluate an intervention or diagnose a worker, caution is warranted because the evaluative and diagnostic abilities of the instrument have not fully been examined yet. Therefore, the WRFQ 2.0 is not yet recommended for these purposes and additional research is needed to further examine the measurement properties.
Future researchInstrument validation is an ongoing process. Further validation (and perhaps adaptation) of the WRFQ 2.0 is recommended, preferably in longitudinal studies, in various occupational settings and in groups with various health conditions. Future research should focus on the development of a definition of ‘acceptable’ or ‘optimal’ work functioning. This point of reference will enable professionals and researchers to initiate preventive actions when work functioning decreases. However, what is acceptable also depends on the situation: the nature of the work, the size and culture of the company. Future research should also focus on relationships between work functioning and performance indicators such as work productivity to explore if (reduced) functioning is related to (reduced) work productivity. In addition, interventions to promote and facilitate sustainable work functioning are needed. The challenge of the nearby future is to help as many workers as possible to stay at work in a healthy, productive and sustainable way. The WRFQ 2.0 provides valuable information about current work functioning, and also predicts future work functioning in the short term. However, to achieve sustainable work functioning, more information is needed about relevant factors that can facilitate the necessary conditions for work functioning to be sustainable in the long run. Van der Klink et al. [14]provides a definition of sustainable employability using the capability approach of Amartya Sen [16]. Capability refers to the potential an individual has to achieve valuable functionings in a given environment. It is a normative concept that refers to the individuals’ potential in a specific context, e.g. to have the opportunity “to be able to” achieve valuable functionings. When this is translated to the work context, work is a capability, provided that work is seen as a valuable activity. In this view, to function at work in a sustainable way, it takes more than only a set of personal resources; the broader (work) context, personal values and attitudes towards work that enable the worker to convert resources into (potential) achievements, are also of interest. To accomplish sustainable employability it is important to have or to develop a set of capabilities to base choices on, to achieve alternative options in case of a change in the status-quo (for example due to aging, change in health, or a reorganization). When studying the sustainability of work functioning, it is therefore not only important that a worker has appropriate knowledge and skills and is motivated to function at work, but also that the organizational context facilitates and offers opportunities to perform valuable and valued tasks.
General discussion
129
7
General conclusion
Based on focus groups and systematic literature searches it was decided to cross-culturally translate and adapt an existing work functioning instrument, the Work Role Functioning Questionnaire, to the Dutch context. New items were added to adapt the instrument to the current nature of work. The WRFQ 2.0 appears to be a reliable and valid instrument to measure health-related work functioning in the general working population and might be a helpful tool for concerted actions of the worker, occupational health professionals, and HRM/supervisors. Although further research is needed to validate the instrument, using the instrument might be a first step to take actions towards sustainable work functioning and help workers to stay at work.
Chapter 7
130
References
1. Sanderson K, Andrews G. Common mental disorders in the workforce: recent findings from descriptive and social epidemiology. Can J Psychiatry 2006; 51:63-75.
2. Nieuwenhuijsen K, Franche RL, van Dijk FJ. Work Functioning Measurement: Tools for Occupational Mental Health Research. J Occup Environ Med 2010.
3. Williams RM, Schmuck G, Allwood S, Sanchez M, Shea R, Wark G. Psychometric Evaluation of Health-Related Work Outcome Measures For Musculoskeletal Disorders : A Systematic Review. Journal of Occupational Rehabilitation 2007; 17:504-21.
4. Lerner D, Amick BC,III, Rogers WH, Malspeis S, Bungay K, Cynn D. The Work Limitations Questionnaire. Med Care 2001; 39:72-85.
5. Guillemin F, Bombardier C, Beaton D. Cross-cultural adaptation of health-related quality of life measures: literature review and proposed guidelines. J Clin Epidemiol 1993; 46:1417-32.
6. Beaton DE, Bombardier C, Guillemin F, Ferraz MB. Guidelines for the process of cross-cultural adaptation of self-report measures. Spine 2000; 25:3186-91.
7. Terwee CB, Mokkink LB, Knol DL, Ostelo RW, Bouter LM, de Vet HC. Rating the methodological quality in systematic reviews of studies on measurement properties: a scoring system for the COSMIN checklist. Qual Life Res 2011.
8. de Vet HC, Ostelo RW, Terwee CB, van der Roer N, Knol DL, Beckerman H, et al. Minimally important change determined by a visual method integrating an anchor-based and a distribution-based approach. Qual Life Res 2007; 16:131-42.
9. de Vet HC, Terluin B, Knol DL, Roorda LD, Mokkink LB, Ostelo RW, et al. Three ways to quantify uncertainty in individually applied “minimally important change” values. J Clin Epidemiol 2010; 63:37-45.
10. Amick B, Kasl S. Work Stress. In: McDonald C, editor. Epidemiology of Work Related Diseases London: BMJ Publishing Group; 2000. p. 283-308.
11. Dwyer CA. Cut scores and testing: Statistics, judgment, truth, and error. Psychol Assess 1996; 8:360-2.
12. Amick BC,III, Habeck RV, Ossmann J, Fossel AH, Keller R, Katz JN. Predictors of successful work role functioning after carpal tunnel release surgery. J Occup Environ Med 2004; 46:490-500.
13. Lerner D, Reed JI, Massarotti E, Wester LM, Burke TA. The Work Limitations Questionnaire’s validity and reliability among patients with osteoarthritis. Journal of clinical epidemiology 2002; 55:197-208.
14. van der Klink JJL, Bültmann U, Burdorf A, Schaufeli WB, Zijlstra FRH, Brouwer S, et al. Sustainable employability in older workers, work as value. Gedrag en Organisatie 2011:341-55.
15. Sen AK. Equality of what? In: McMurrin S, editor. The Tanner lectures on human values Salt Lake City: University of Utah Press; 1980. p. 195-220.
16. Robeyns I. The capability approach: A theoretical survey. Journal of human development 2005:93-114.

Summary

Summary
133
S
In recent years, a change in the attention of occupational health care in the Netherlands from return to work towards stay at work has occurred. The shift towards stay at work requires new interventions and measures to assess effectiveness. The thesis describes the development of a generic instrument that evaluates health-related work functioning to facilitate actions towards sustainable functioning at work, work participation and work reintegration. The instrument should be used in collaborated actions between the worker, occupational health professionals, and human resources professionals (HRM)/supervisors to support preventive and maintenance actions to help workers to stay at work. This overall aim has been translated into five research objectives, divided into two main themes (Chapter 1):
1. Exploration of the concept of health-related work functioning and the development/cross-cultural translation of an instrument:
- To explore functioning at work with health problems (including three stakeholder perspectives) in a qualitative way to provide insight in the concept of health-related work functioning and to explore if and how this can be measured.
- To identify existing instruments and their measurement properties. - To develop a new instrument (or translate and adapt an existing instrument) for use in
the Dutch context.
2. Validation and adaptation of the instrument:- To validate and adapt the new instrument for use in the Dutch context.- To identify prognostic factors related with work functioning over time.
Work functioning concept exploration and instrument developmentTo start the exploration of the concept of health-related work functioning and how the concept can be measured, a focus group study was conducted (Chapter 2). Three focus group meetings were organized with the three main stakeholder groups: workers with a health problem, occupational physicians, and HRM/supervisors. Our aims were 1) to explore why it is that one worker with a health problem is able to stay at work while the other is not, 2) to identify signals for decreased functioning at work, and 3) to explore if and how this can be measured. Results provided insights into workers’ decision to stay at work and in differences between how the three stakeholders perceive the situation. For example, the workers’ motivation or attributed value of work can vary, which might result in different choices (e.g. to stay at work or to report sick). The supervisor can facilitate job accommodation of workers and help optimizing functioning at work. Participants also identified ‘signals’ for decreased work functioning. For example, ‘changes in behavior’ (OPs), ‘decrease in quality of work’ (both OPs and HRM/supervisors) and ‘working with pain’ (workers) were mentioned. These signals contributed to the selection and development of an instrument to measure work functioning. An important condition for use mentioned
Summary
134
by the workers was that the instrument should be administered in a ‘safe’ setting. It is of ultimate importance that all stakeholders should understand what will happen with the results and what possible actions might follow based on completing the questionnaire. Chapter 3 describes the result of a systematic review that was conducted to identify existing health-related work functioning instruments and to get insight in their measurement properties in a population with common mental disorders (CMD). Several instruments have been developed to measure the influence of health on functioning at work. To select appropriate instruments for use in occupational health practice and research, the measurement properties (e.g., reliability, validity, responsiveness) must be evaluated. The objective of this systematic review was to critically appraise and compare the measurement properties of self-reported health-related work-functioning instruments among workers with CMD. Five papers evaluating measurement properties of five self-reported health-related work-functioning instruments in CMD populations were included. The systematic review showed that the available evidence for the use of the existing instruments is low, mainly due to low methodological quality of the conducted validation studies. Because of this low methodological quality, we simply do not know enough about the measurement properties of the existing instruments to make evidence-based recommendations about which instrument to use. No appropriate work functioning instrument was available for use in the Dutch context. Therefore, it was decided to translate and cross-culturally adapt an existing instrument to Dutch (Chapter 4). The Work Role Functioning Questionnaire (WRFQ) was chosen because it is a generic instrument developed to represent a broad variety of both job demands and health problems. The aim and construct of this instrument suited the main thesis aim; to develop a new generic instrument to measure functioning at work. The WRFQ translation and adaptation were conducted using a systematic approach with the following steps: forward translation, synthesis, back-translation, consolidation of translations with expert committee, and pre-testing. To evaluate the comprehensibility, usability, applicability and completeness of the translated questionnaire, a total of 40 interviews with workers with a health problem were performed. The questionnaire translation was conducted without major difficulties. During the process, questionnaire instructions were modified and 5 items reformulated based on the participants’ responses. Participants were positive on the comprehensibility, usability, applicability and completeness of the questionnaire, and also made suggestions for the further development of the Dutch WRFQ. Five new items were formulated for the WRFQ based on suggestions during the pre-test phase and the focus group meetings and were supported by literature to reflect the changes in the nature of work in the past decades and the ‘new work practices’. The new items were grouped together in a new subscale called ‘flexibility demands’. This resulted in the Work Role Functioning Questionnaire 2.0 (WRFQ 2.0).
Summary
135
S
Validation and adaptation of the instrumentTo measure health-related functioning at work, validated instruments are needed. To evaluate the measurement properties of the WRFQ 2.0, a longitudinal validation study was conducted. Factor analyses identified the new items on flexibility as an additional subscale in the instrument. Five original items were removed based on the same factor analyses. The reliability, validity and responsiveness were examined in the working population, using the COSMIN checklist in the study design. The internal consistency, test-retest reliability, measurement error, structural validity (factor analysis), construct validity (by means of hypotheses testing) and responsiveness are examined in Chapter 5. A total of N=553 workers completed the survey. The final WRFQ 2.0 has four subscales and preliminary results showed very good internal consistency (α’s 0.91-0.96), moderate test-retest reliability (ICC’s 0.29 to 0.82) and moderate to low responsiveness (SRM -0.09- -1.27) in the general working population. The WRFQ 2.0 can differentiate between workers with high and low self-rated health and between workers with manual and non-manual jobs. A total of N=275 workers completed an extended version of the survey, including multiple other constructs (e.g. health-status, job characteristics, work productivity, work ability). Ten hypotheses were formulated and tested of which nine were (partly) confirmed, providing evidence for the construct validity of the WRFQ 2.0. The WRFQ-2.0 is able to distinguish between groups with high/low levels of mental health, physical health, fatigue and need for recovery. A moderate correlation was found between WRFQ-2.0 and related constructs of work ability (r=0.47) and work productivity (r=0.49) respectively, indicating that it is a related but distinct concept. A weak relationship was found with general self-rated health, work engagement and work involvement. The WRFQ 2.0 appears to be a reliable and valid instrument to measure health-related work functioning in the working population. Further validation in larger samples is recommended, especially for test-retest reliability and responsiveness. To help workers to stay at work in a healthy and sustainable way and for the development of interventions to prevent reduced work functioning, it is important to have insight in prognostic factors for successful work functioning. Therefore, the aim of Chapter 6 is to identify prognostic factors for successful work functioning in a general working population. A longitudinal survey was conducted among the working population. Work functioning was assessed with the Work Role Functioning Questionnaire 2.0 (WRFQ). The total score was categorized as follows: 0-90; >90 ≤95; and >95-100 (the last group was defined as ‘successful work functioning’). Ordinal logistic regression analyses were performed to examine the bivariate relationships between potential prognostic factors and the dependent variable (successful work functioning) to identify potential variables to include in the multivariate models (p<0.10). A stepwise introduction of the variables was used in the multiple ordinal regression analyses. Baseline work functioning and
Summary
136
work ability were significant prospectively associated with successful work functioning at three month follow-up. No prospective associations were identified for psychological job demands, supervisor social support, level of education and age with successful work functioning. To our knowledge this is the first longitudinal study to identify prognostic factors for successful work functioning in the general working population. High work ability, measured with the overall item, was found to be predictive for future successful work functioning. This item asks for the workers perception of current ability to work compared with lifetime best. However, research has shown that it is difficult to change the pattern of work ability. Designing interventions for successful work functioning should therefore focus on other, underlying concepts. Work functioning might provide more in-depth information for the design of interventions.
Discussion and conclusion
Chapter 7 provides an overview of the main findings and a discussion of the results. Based on focus groups and systematic literature searches it was decided to cross-culturally translate and adapt an existing work functioning instrument, the Work Role Functioning Questionnaire, to the Dutch context. New items on flexibility demands were added to adapt the instrument to the current nature of work. The WRFQ 2.0 appears to be a reliable and valid instrument to measure health-related work functioning in the general working population and might be a helpful tool for concerted actions of the worker, occupational health professionals, and HRM/supervisors. The challenge is to help workers stay at work in a healthy, productive and sustainable way. The WRFQ 2.0 provides valuable information about current work functioning. Although further research is needed to validate the instrument, using the instrument might be a first step to take actions towards sustainable work functioning and to help workers to stay at work.

Samenvatting

Samenvatting
139
S
In de afgelopen jaren heeft een verschuiving in focus plaatsgevonden in de bedrijfsgezondheidszorg van terug keer naar werk naar optimaal (blijven) functioneren in werk. Om de effecten van deze verschuiving in focus te evalueren, zijn nieuwe meetinstrumenten nodig. In dit proefschrift wordt de ontwikkeling beschreven van een nieuw generiek meetinstrument dat het aan de gezondheid gerelateerde functioneren in werk in kaart brengt. Het instrument kan ingezet worden in gezamenlijke acties van de werkende, de leidinggevende en professionals uit de bedrijfsgezondheidszorg en human resources management (HRM) om preventieve en duurzame maatregelen te treffen om werkenden te helpen om aan het werk te blijven en om daarmee duurzaam functioneren in werk, arbeidsparticipatie en arbeidsintegratie te bevorderen. Deze algemene doelstelling is vertaald naar vijf onderzoeksdoelstellingen, opgedeeld in twee thema’s (Hoofdstuk 1).
1. Verkenning van het concept van gezondheidsgerelateerd functioneren in werk en de ontwikkeling/cross-culturele vertaling van een instrument:
- Kwalitatief verkennen van functioneren in werk met gezondheidsklachten vanuit het perspectief van drie stakeholdergroepen om inzicht krijgen in het concept van gezondheidsgerelateerd functioneren in werk en om te onderzoeken of en hoe dit concept gemeten kan worden.
- Identificeren van bestaande instrumenten en hun meeteigenschappen. - Ontwikkelen van een nieuw instrument (of het vertalen en aanpassen van een
bestaand instrument) voor gebruik in de Nederlandse context.
2. Validering en aanpassing van het instrument:- Valideren en aanpassen van een nieuw instrument voor gebruik in de Nederlandse
context.- Identificeren van prognostische factoren voor succesvol functioneren in werk.
Verkenning van gezondheidsgerelateerd functioneren in werk en instrument ontwikkelingTen behoeve van de verkenning van het concept functioneren in werk met gezondheidsklachten en om te bepalen hoe dit concept gemeten kan worden is een focusgroep studie uitgevoerd (Hoofdstuk 2). Er zijn drie focusgroep bijeenkomsten georganiseerd met de drie belangrijkste stakeholder groepen: werkenden met gezondheidsklachten, bedrijfsartsen en HRM/leidinggevenden. Onze doelstellingen waren 1) te onderzoeken welke condities bepalen dat de ene werkende met gezondheidsklachten in staat is aan het werk te blijven, terwijl de andere dat niet lukt, 2) signalen te identificeren voor verminderd functioneren in werk, en 3) te onderzoeken of en hoe gezondheidsgerelateerd functioneren in werk gemeten kan worden. De resultaten geven inzicht in de keuzes die werkenden maken om al of niet aan het werk te
Samenvatting
140
blijven en laten zien hoe de drie stakeholder groepen de situatie ervaren. Bijvoorbeeld de motivatie of de toegeschreven waarde aan werk van een werkende kan variëren, wat kan leiden tot verschillende keuzes (bijvoorbeeld om te blijven werken of ziek te melden). De leidinggevende kan faciliteren bij het optimaliseren van functioneren in werk, bijvoorbeeld door aanpassingen aan de werkplek te maken. Deelnemers hebben ook ‘signalen’ voor verminderd functioneren geïdentificeerd. Bijvoorbeeld ‘veranderingen in gedrag’ (bedrijfsartsen), ‘verminderde kwaliteit van werk’ (bedrijfsartsen en HRM/leidinggevenden) en ‘werken met pijn’ (werkenden) werden genoemd. Deze signalen hebben bijgedragen aan de selectie en ontwikkeling van een instrument om gezondheidsgerelateerd functioneren in werk in kaart te brengen. Een belangrijke voorwaarde voor gebruik van een dergelijk instrument, die genoemd werd door de werkenden, was dat het instrument moet worden toegepast in een ‘veilige’ omgeving. Het is uitermate belangrijk dat het voor alle betrokken duidelijk is wat er met de resultaten gebeurt en welke mogelijke acties genomen kunnen worden. Hoofdstuk 3 beschrijft de resultaten van een systematisch literatuuronderzoek, dat werd uitgevoerd om bestaande instrumenten die gezondheidsgerelateerd functioneren in werk meten te identificeren en inzicht te krijgen in hun meeteigenschappen in een populatie met psychische klachten. Om de invloed van gezondheid op het functioneren in werk in kaar te brengen zijn diverse instrumenten ontwikkeld. Voor het maken van een keuze voor het gebruik van een dergelijk instrument in de bedrijfsgezondheidszorg en in onderzoek is het belangrijk dat de meeteigenschappen (betrouwbaarheid, validiteit, responsiviteit) zijn geëvalueerd. Het doel van de literatuurstudie was de meeteigenschappen van bestaande instrumenten te vergelijken en kritisch te evalueren in een populatie van werkenden met psychische klachten. Vijf artikelen werden geïncludeerd waarin de meeteigenschappen van vijf instrumenten (zelfrapportage van de werkenden) werden beschreven. Het literatuuronderzoek liet zien dat de beschikbare informatie voor het gebruik van deze instrumenten erg gering is, voornamelijk vanwege de ondermaatse methodologische kwaliteit van de uitgevoerde valideringsstudies. Vanwege deze lage methodologische kwaliteit is er te weinig betrouwbare informatie bekend om aanbevelingen te kunnen doen voor het gebruik deze instrumenten in praktijk en onderzoek. Voor de Nederlandse context was geen geschikt instrument beschikbaar voor gezondheidsgerelateerd functioneren in werk. Daarom werd besloten een bestaand instrument te vertalen en aan te passen voor de Nederlandse context (Hoofdstuk 4). De Work Role Functioning Questionnaire (WRFQ) werd gekozen omdat dit een generiek instrument is, ontwikkeld voor een breed scala van zowel werksoorten als gezondheidsproblemen. Het doel en de opbouw van het instrument sloten goed aan bij de doelstelling van dit proefschrift, namelijk het ontwikkelen van een generiek instrument om gezondheidsgerelateerd functioneren in werk in kaart te brengen. De
Samenvatting
141
S
vertaling en aanpassing van de WRFQ is uitgevoerd met behulp van een systematische aanpak van vertaling, synthese, terugvertalen, raadplegen van een expertcommissie en een test fase. Om de bruikbaarheid, toepasbaarheid, begrijpelijkheid en volledigheid van het vertaalde instrument te evalueren zijn 40 interviews uitgevoerd met werkenden met gezondheidsklachten. Tijdens het vertaalproces werden op basis van de reacties van de deelnemers de instructie en 5 items aangepast. De deelnemers waren positief over de bruikbaarheid, toepasbaarheid, begrijpelijkheid en volledigheid van het instrument, hoewel ook suggesties werden gedaan voor de verdere ontwikkeling van de Nederlandse WRFQ. Vijf nieuwe items werden geformuleerd op basis van de test fase, resultaten van de focusgroepen en literatuur. Deze items reflecteren de ontwikkelingen in het werk in de afgelopen decennia. De items zijn gegroepeerd in een nieuwe subschaal van het instrument met de naam ‘flexibiliteitstaakeisen’. De vertaling en aanpassing resulteerde in de Work Role Functioning Questionnaire 2.0 (WRFQ 2.0).
Validatie en aanpassing van het instrumentVoor het meten van functioneren in werk gerelateerd aan de gezondheid zijn gevalideerde meetinstrumenten nodig. Om de meeteigenschappen van de WRFQ 2.0 te evalueren is een longitudinale valideringsstudie uitgevoerd. Factoranalyses lieten zien dat de nieuwe items over flexibiliteitstaakeisen samen een nieuwe subschaal vormden. Vijf originele items werden verwijderd op basis van dezelfde factoranalyses. De betrouwbaarheid, validiteit en responsiviteit werden onderzocht in de werkende populatie. De COSMIN checklist is gebruikt bij de opzet van de studie. De interne consistentie, test-hertest betrouwbaarheid, meetfout, structurele validiteit (factoranalyse), construct validiteit (op basis van hypothese toetsing) en responsiviteit worden beschreven in Hoofdstuk 5. In totaal hebben N=553 werkenden de WRFQ 2.0 ingevuld. De definitieve WRFQ 2.0 bestaat uit vier subschalen en de resultaten laten een goede interne consistentie (α’s 0.91-0.96), een matige test-hertest betrouwbaarheid (ICC’s 0.29 to 0.82) en matige tot lage responsiviteit (SRM -0.09- -1.27) zien. De WRFQ 2.0 is in staat om onderscheid te maken tussen werkenden met goede en slechte zelf gerapporteerde gezondheid en tussen werkenden met ‘hoofdwerk’ en ‘handwerk’. Een groep van N=275 werkenden heeft een uitgebreide versie van de vragenlijst ingevuld, waarin naast de WRFQ 2.0 ook andere constructen zijn uitgevraagd (o.a. gezondheidsstatus, werk kenmerken, productiviteit en werkvermogen). Tien hypothesen zijn geformuleerd en getest, waarvan negen (deels) bevestigd werden. Hiermee werd bewijs aangedragen voor de construct validiteit van de WRFQ 2.0. De WRFQ 2.0 is in staat onderscheid te maken tussen werkenden met een goede versus slechte mentale gezondheid, fysieke gezondheid, vermoeidheid en herstelbehoefte. Een middelmatige correlatie werd gevonden tussen de WRFQ 2.0 en gerelateerde constructen werkvermogen (r=0.47) en productiviteit (r=0.49), hetgeen
Samenvatting
142
er op wijst dat het weliswaar gerelateerde constructen zijn, maar dat ze ook van elkaar verschillen. Een zwakke relatie werd gevonden tussen de WRFQ 2.0 en zelf gerapporteerde gezondheidsstatus, werk bevlogenheid en motivatie. De WRFQ 2.0 blijkt een betrouwbaar en valide instrument om gezondheidsgerelateerd functioneren in werk te meten in de werkende populatie. Verdere validering in grotere groepen wordt aanbevolen, met name voor test-hertest betrouwbaarheid en responsiviteit.
Voor het helpen van werkenden op een gezonde en duurzame manier aan het werk te blijven en voor de ontwikkeling van (nieuwe) interventies om verminderd functioneren te voorkomen is het belangrijk inzicht te krijgen in prognostische factoren voor succesvol functioneren in werk. Daarom was het doel van Hoofdstuk 6 prognostische factoren voor succesvol functioneren in werk te identificeren. Hiervoor is een longitudinaal onderzoek onder werkenden uitgevoerd. De uitkomstmaat succesvol functioneren in werk is gemeten met de WRFQ 2.0 op drie maanden na baseline. De totale score werd in drie groepen ingedeeld: 0-90; >90 en ≤95; en >95-100 (de laatste groep werd gedefinieerd als ‘succesvol functioneren in werk’ en bevatte de 25 procent hoogste scores). Ordinale logistische regressie analyse werd uitgevoerd om bivariate relaties tussen potentiele prognostische factoren en de afhankelijke variabele te onderzoeken en daarmee variabelen te identificeren voor de multivariate modellen (p <0.10). De geïdentificeerde variabelen werden stapsgewijs ingevoerd in de multipele ordinale regressie analyse. Baseline functioneren in werk en werkvermogen waren significant geassocieerd met succesvol functioneren in werk drie maanden later. Geen prospectieve associaties werden gevonden tussen de WRFQ en psychologische taakeisen, sociale steun van leidinggevende, opleidingsniveau en leeftijd. Voor zover ons bekend is dit de eerste longitudinale studie naar prognostische factoren voor succesvol functioneren in werk in de werkende populatie. Werkvermogen, gemeten met het generieke item van de work ability index, bleek voorspellend te zijn voor toekomstig functioneren in werk. Het item vraagt deelnemers hun werkvermogen op dit moment een waarde te geven tussen 0 en 10 in vergelijking met hun werkvermogen in de beste periode van hun leven (de beste periode is een 10). Uit onderzoek is echter gebleken dat het moeilijk is om werkvermogen te beïnvloeden. Daarom is het wellicht beter om de focus te leggen op het snijvlak van werktaken en de gezondheid bij de ontwikkeling van nieuwe interventies voor succesvol functioneren in werk. De WRFQ 2.0 kan daarbij handvaten bieden.
Discussie en conclusie
Hoofdstuk 7 geeft een overzicht van de belangrijkste bevindingen en bediscussieert de resultaten. Op basis van focusgroepen en literatuuronderzoek is besloten om een cross-culturele adaptatie naar het Nederlands uit te voeren van een bestaand instrument, de
Samenvatting
143
S
Work Role Functioning Questionnaire. Nieuwe items over flexibiliteitstaakeisen werden ontwikkeld om het instrument aan te passen aan de huidige werkcontext. De WRFQ 2.0 blijkt een betrouwbaar en valide instrument te zijn voor het in kaart brengen van gezondheidsgerelateerd functioneren in werk in de werkende populatie. De WRFQ 2.0 biedt handvaten voor gezamenlijke acties van de werkende, bedrijfsgezondheidszorg professionals en HRM/leidinggevenden en kan daarmee werkenden helpen om op een gezonde, productieve en duurzame manier het werk voort te zetten. Hoewel verder onderzoek nodig is om het instrument verder te valideren, kan het gebruik van het instrument een eerste stap zijn om werkenden te helpen om op een gezonde, productieve en duurzame manier aan het werk te blijven.


Appendix WRFQ 2.0
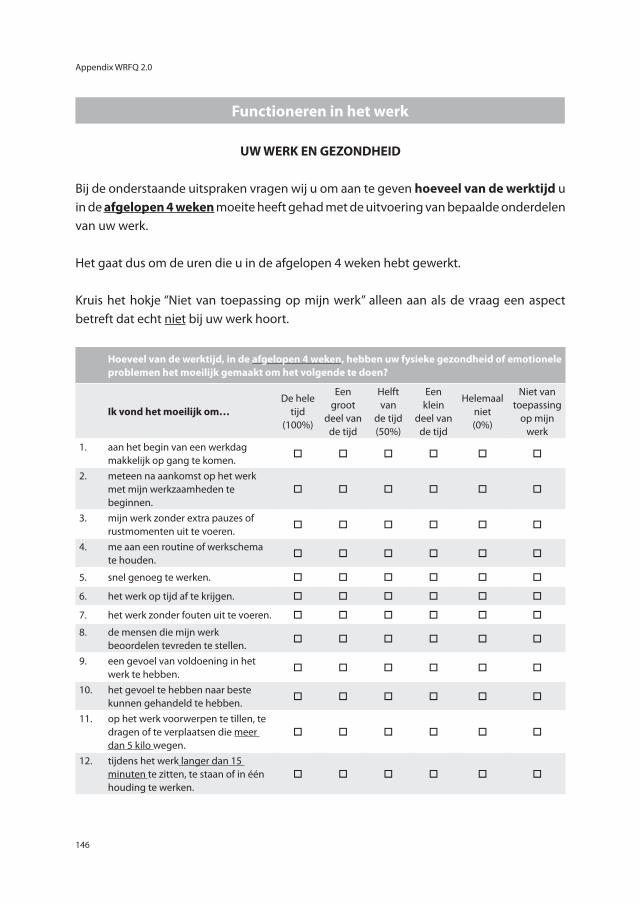
Appendix WRFQ 2.0
146
Functioneren in het werk
UW WERK EN GEZONDHEID
Bij de onderstaande uitspraken vragen wij u om aan te geven hoeveel van de werktijd u in de afgelopen 4 weken moeite heeft gehad met de uitvoering van bepaalde onderdelen van uw werk.
Het gaat dus om de uren die u in de afgelopen 4 weken hebt gewerkt.
Kruis het hokje “Niet van toepassing op mijn werk” alleen aan als de vraag een aspect betreft dat echt niet bij uw werk hoort.
Hoeveel van de werktijd, in de afgelopen 4 weken, hebben uw fysieke gezondheid of emotionele problemen het moeilijk gemaakt om het volgende te doen?
Ik vond het moeilijk om… De hele
tijd (100%)
Een groot
deel van de tijd
Helft van
de tijd (50%)
Een klein
deel van de tijd
Helemaal niet (0%)
Niet van toepassing
op mijn werk
1. aan het begin van een werkdag makkelijk op gang te komen.
o o o o o o
2. meteen na aankomst op het werk met mijn werkzaamheden te beginnen.
o o o o o o
3. mijn werk zonder extra pauzes of rustmomenten uit te voeren.
o o o o o o
4. me aan een routine of werkschema te houden.
o o o o o o
5. snel genoeg te werken. o o o o o o
6. het werk op tijd af te krijgen. o o o o o o
7. het werk zonder fouten uit te voeren. o o o o o o
8. de mensen die mijn werk beoordelen tevreden te stellen.
o o o o o o
9. een gevoel van voldoening in het werk te hebben.
o o o o o o
10. het gevoel te hebben naar beste kunnen gehandeld te hebben.
o o o o o o
11. op het werk voorwerpen te tillen, te dragen of te verplaatsen die meer dan 5 kilo wegen.
o o o o o o
12. tijdens het werk langer dan 15 minuten te zitten, te staan of in één houding te werken.
o o o o o o
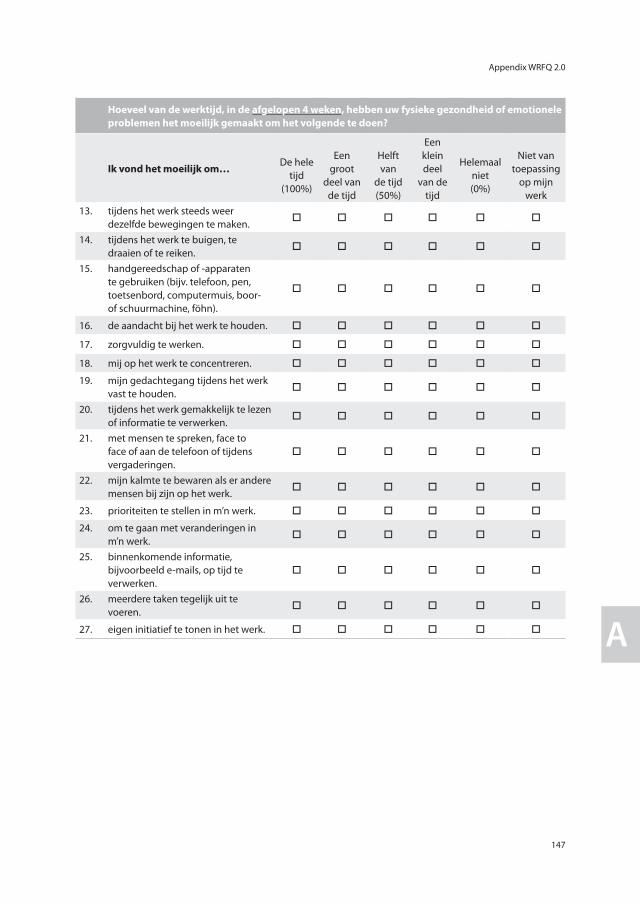
Appendix WRFQ 2.0
147
A
Hoeveel van de werktijd, in de afgelopen 4 weken, hebben uw fysieke gezondheid of emotionele problemen het moeilijk gemaakt om het volgende te doen?
Ik vond het moeilijk om… De hele
tijd (100%)
Een groot
deel van de tijd
Helft van
de tijd (50%)
Een klein deel
van de tijd
Helemaal niet (0%)
Niet van toepassing
op mijn werk
13. tijdens het werk steeds weer dezelfde bewegingen te maken.
o o o o o o
14. tijdens het werk te buigen, te draaien of te reiken.
o o o o o o
15. handgereedschap of -apparaten te gebruiken (bijv. telefoon, pen, toetsenbord, computermuis, boor- of schuurmachine, föhn).
o o o o o o
16. de aandacht bij het werk te houden. o o o o o o
17. zorgvuldig te werken. o o o o o o
18. mij op het werk te concentreren. o o o o o o
19. mijn gedachtegang tijdens het werk vast te houden.
o o o o o o
20. tijdens het werk gemakkelijk te lezen of informatie te verwerken.
o o o o o o
21. met mensen te spreken, face to face of aan de telefoon of tijdens vergaderingen.
o o o o o o
22. mijn kalmte te bewaren als er andere mensen bij zijn op het werk.
o o o o o o
23. prioriteiten te stellen in m’n werk. o o o o o o
24. om te gaan met veranderingen in m’n werk.
o o o o o o
25. binnenkomende informatie, bijvoorbeeld e-mails, op tijd te verwerken.
o o o o o o
26. meerdere taken tegelijk uit te voeren.
o o o o o o
27. eigen initiatief te tonen in het werk. o o o o o o


SHARE and Previous dissertations

Research Institute for Health Research SHARE
151
R
Research Institute for Health Research SHARE
Research Institute for Health Research SHARE
This thesis is published within the Research Institute SHARE of the Graduate School of Medical Sciences (embedded in the University Medical Center Groningen / University of Groningen). More recent theses can be found in the list below.Further information regarding the institute and its research can be obtained from our internetsite: www.rug.nl/share.
((co-)supervisors are between brackets)
2012Schaub-de Jong M. Facilitating reflective learning (prof MA Verkerk, prof J Cohen-Schotanus) Worp H van der. Patellar tendinopathy. Etiology and treatment (prof RL Diercks, dr I van den Akker-Scheek, dr J Zwerver)
Paans N. Patients with hip osteoarthritis. Body weight and life style before and after arthroplasty (prof SK Bulstra, prof K van der Meer, dr M Stevens, dr I van den Akker-Scheek)
Jin L. Unmitigated communion and support providers’ psychological wellbeing (prof M Hagedoorn, prof R Sanderman, prof NW van Yperen) De Heer-Wunderink C. Successful community living: a ‘UTOPIA’? (prof D Wiersma, dr S Sytema, dr E Visser) Härmark L. Web-based intensive monitoring; a patient based pharmacovigilance tool (prof AC van Grootheest, prof JJ de Gier, dr EP van Puijenbroek)
Jaspers M. Prediction of psychosocial problems in adolescents; do early childhood findings of the preventive child healthcare help? (prof SA Reijneveld, dr AF de Winter)
Vegter S. The value of personalized approaches to improve pharmacotherapy in renal disease (prof MJ Postma, prof GJ Navis)
Curtze C. Neuromechanics of movement in lower limb amputees (prof K Postema, prof E Otten, dr AL Hof) Alma MA. Participation of the visually impaired elderly: determinants and intervention (prof ThPBM Suurmeijer, prof JW Groothoff, dr SF van der Mei)
Muijzer A. The assessment of efforts to return to work (prof JW Groothoff, prof JHB Geertzen, dr S Brouwer) Ravera S. Psychotropic medications and traffic safety. Contributions to risk assessment and risk
communication. (prof JJ de Gier, prof LTW de Jong-van den Berg) De Lucia Rolfe E. The epidemiology of abdominal adiposity: validation and application of ultrasonographyy to
estimate visceral and subcutaneous abdominal fat and to identify their early life determinants (prof RP Stolk, prof KK Ong)
Tu HAT. Health economics of new and under-used vaccines in developing countries: state-of-the-art analyses for hepatitis and rotavirus in Vietnam. (prof MJ Postma, prof HJ Woerdenbag)
SHARE and Previous dissertations
152
SHARE and Previous dissertations
Opsteegh L. Return to work after hand injury. (prof CK van der Sluis, prof K Postema, prof JW Groothoff, dr AT Lettinga, dr HA Reinders-Messelink)
Lu W. Effectiveness of long-term follow-up of breast cancer. (prof GH de Bock, prof T Wiggers)
2011Boersma-Jentink J. Risk assessment of antiepileptic drugs in pregnancy
(prof LTW de Jong-van den Berg, prof H Dolk)
Zijlstra W. Metal-on-metal total hip arthroplasty; clinical results, metal ions and bone implications (prof SK Bulstra, dr JJAM van Raay, dr I van den Akker-Scheek)
Zuidersma M. Exploring cardiotoxic effects of post-myocardial depression (prof P de Jonge, prof J Ormel)
Fokkens AS.Structured diabetes care in general practice (prof SA Reijneveld, dr PA Wiegersma)
Lohuizen MT van. Student learning behaviours and clerkship outcomes (prof JBM Kuks, prof J Cohen-Schotanus, prof JCC Borleffs)
Jansen H. Determinants of HbA1c in non-diabetic children and adults (prof RP Stolk)
Reininga IHF. Computer-navigated minimally invasive total hip arthroplasty; effectiveness, clinical outcome and gait performance. (prof SK Bulstra, prof JW Groothoff, dr M Stevens, dr W Zijlstra)
Vehof J. Personalized pharmacotherapy of psychosis; clinical and pharmacogenetic approaches (prof H Snieder, prof RP Stolk, dr H Burger, dr R Bruggeman)
Dorrestijn O. Shoulder complaints; indicence, prevalence, interventions and outcome (prof RL Diercks, prof K van der Meer, dr M Stevens, dr JC Winters)
Lonkhuijzen LRCM van. Delay in safe motherhood (prof PP van den Berg, prof J van Roosmalen, prof AJJA Scherpbier, dr GG Zeeman)
Bartels A. Auridory hallucinations in childhood (prof D Wiersma, prof J van Os, dr JA Jenner)
Qin L. Physical activity and obesity-related metabolic impairments: estimating interaction from an additive model (prof RP Stolk, dr ir E Corpeleijn)
Tomčiková Z. Parental divorce and adolescent excessive drinking: role of parent – adolescent relationship and other social and psychosocial factors. (prof SA Reijneveld, dr JP van Dijk, dr A Madarasova-Geckova)
Mookhoek EJ. Patterns of somatic disease in residential psychiatric patients; surveys of dyspepsia, diabetes and skin disease. (prof AJM Loonen, prof JRBJ Brouwers, prof JEJM Hovens)
Netten JJ van. Use of custom-made orthopaedic shoes (prof K Postema, prof JHB Geertzen, dr MJA Jannink)
Koopmans CM. Management of gestational hypertension and mild pre-eclampsia at term (prof PP van den Berg, prof JG Aarnoudse, prof BWJ Mol, dr MG van Pampus, dr H Groen)
For 2010 and earlier SHARE-theses see our website.

Dankwoord

Dankwoord
155
D
Promoveren doe je niet alleen. In de afgelopen jaren zijn er heel wat mensen betrokken geweest bij dit promotieonderzoek. Vanaf deze plek wil ik iedereen bedanken die betrokken is geweest bij het onderzoek en die dit proefschrift mede mogelijk hebben gemaakt.
Allereerst wil ik iedereen bedanken die belangeloos heeft deelgenomen aan één van de verschillende studies. Daarnaast wil ik iedereen bedanken die de verschillende studies mogelijk hebben gemaakt: o.a. bedrijfsartsen, HRM medewerkers, Stichting Instituut Gak, en de betrokken bedrijven en organisaties: NedTrain Onnen, Hanzehogeschool Groningen, Thales Nederland, Arbouw, Schouten & Nelissen, en Martini Ziekenhuis. Dit onderzoek had niet plaats kunnen vinden zonder uw bijdragen.
Vervolgens wil ik mijn promotoren Prof. dr. J.J.L. van der Klink en Prof. dr. U. Bültmann bedanken voor de inspirerende tijd die ik als promovenda onder hun hoede heb mogen doorbrengen. Beste Jac, bedankt voor je betrokkenheid en inzet bij dit project. Je zat altijd vol goede ideeën en inzichten. Jouw vakkennis en ervaring zijn zeer waardevol gebleken. Ik heb enorm veel zin in onze verdere samenwerking. Beste Ute, ik heb de afgelopen jaren veel van je geleerd, je was en bent een goede mentor. Als ik een vraag had kon ik altijd bij je binnenlopen en je had altijd zeer snelle en constructieve feedback. Ik wil je veel geluk wensen in je nieuwe rol als hoogleraar en hoop in onze toekomstige samenwerking nog veel van je te kunnen leren. Bedankt voor jullie enthousiasme en oprechte interesse in het zowel het onderzoek als in mij. Het was fun om met jullie te werken!
De leden van de leescommissie, Prof. dr. F.J.H. van Dijk, Prof. dr. H.C.W. de Vet en Prof. dr. N.W. van Yperen wil ik hartelijk danken voor het kritisch doorlezen en beoordelen van het proefschrift.
Graag wil ik ook de leden van de begeleidingscommissie hier noemen. Riekie de Vet, Frank van Dijk, Ben Amick, Peter Flach, Rob Gründemann en Jan Schellekens hartelijk bedankt voor de constructieve en gezellige bijeenkomsten. Ik heb veel gehad aan jullie input en kritische blikken vanuit de wetenschap en praktijk en genoten van elke bijeenkomst. Dear Ben, I would like to take this opportunity to thank you very much for your contribution to this study. I have learned a lot from your questions, comments and suggestions. You’ve been a mentor to me.
Sandra, Inge en Caroline, bedankt dat jullie als co-auteurs hebben willen meewerken aan dit proefschrift. Ik heb veel van jullie geleerd.
I would also like to thank all my CIHR Strategic Training Program in Work Disability
Dankwoord
156
Prevention colleagues for our inspiring summer sessions and beyond. Thank you all for this wonderful opportunity!
Alle (oud) collega’s van gezondheidswetenschappen bedankt voor de getoonde belangstelling en de “gezelligheid op de gang” o.a. tijdens de koffie/fruithap pauzes, ook al zit lang niet iedereen (meer) op dezelfde gang. Ook alle statistici en methodologen die me hebben aangehoord en geholpen met de verschillende analyses, bedankt!
Natuurlijk kunnen mijn kamergenoten Iris en Hardy hier niet ontbreken. Ik wil jullie bedanken voor alle gezelligheid en steun op de momenten dat ik het even niet meer zag zitten. Iris, we begonnen tegelijk aan een nieuw project, samen op ontdekkingstocht in de wondere wereld van de wetenschap. Ik heb erg veel aan je gehad in de afgelopen jaren en ben dan ook erg blij dat je m’n paranimf wil zijn.
Anna, bedankt voor alle koffie momentjes, dat ik altijd bij je kon binnenvallen, de momenten dat je bij mij kwam binnenvallen, de leuke plaatjes (die we blijven uitwisselen!) en je optimisme. Jij wist altijd alles in het juiste perspectief te zetten. Ik weet zeker dat de toekomst veel mooie dingen voor jou in petto heeft!
Melanie, ik ben erg blij dat je m’n paranimf wil zijn. Ik wil jou en Eric bedanken voor jullie support en belangstelling in m’n onderzoek, hoewel het ook erg fijn was om het over andere dingen te hebben. We gaan gewoon door met onze ‘sophisticated business ladies lunches’ en alle andere leuke dingen!
De familie Maris – Arend, Wietske, Rimada, Emiel – wil ik bedanken voor jullie steun en interesse in mij en het onderzoek. Natuurlijk ook voor de goede zorgen voor Rutger als ik weer eens op pad was. Bedankt voor alles!
Lieve mam en heit, dat ik hier nu sta heb ik aan jullie te danken. Jullie hebben altijd in mij geloofd en mij gestimuleerd te doen wat ik wil. Bedankt voor alle mogelijkheden en vertrouwen die jullie mij altijd hebben gegeven. Het is kennelijk toch ergens goed gekomen… Jurjen, mijn grote broer, ook jij hebt een grote invloed gehad op waar ik nu sta. Ik wil jou, samen met Julia en jullie aanstaande gezin veel geluk wensen.
En tot slot, lieve Rutger. Bedankt voor alle liefde, vertrouwen en support. Op naar nog vele, vele mooie jaren samen. Kus!

Curriculum Vitae

Curriculum Vitae
159
CV
Femke Abma was born on October 2nd 1983, in Schiermonnikoog, the Netherlands. After graduating from the Maartenscollege (atheneum) in Haren (2002) she studied psychology at the University of Groningen. In 2006 she received her Master’s degree in psychology, with her thesis on “Predictors of successful Return-to-Work. A comparison between long term and short term unemployed.” After her graduation she was employed at the Universi-ty Medical Center Groningen (UMCG), University of Groningen as a junior researcher con-ducting an inventory of interventions and measurement instruments used in Return-To-Work trajectories in The Netherlands. From 2008 to 2012 she worked as a PhD student at the Department of Health Sciences, Community and Occupational Medicine at the UMCG, University of Groningen. Her research was focused on the development and evaluation of a measurement tool to measure health-related work functioning. From 2010 to 2012 she participated in the CIHR Strategic Training Program in Work Disability Prevention, a program with the aim to develop transdisciplinary work disability prevention knowledge, skills and attitudes in Ph.D. students, post-doctoral fellows and young researchers from all over the world whose projects are linked to the WDP field. The WDP program is hosted at the Dalla Lana School of Public Health at the University of Toronto, Canada. Since April 2012 she works as a post-doctoral researcher at the Department of Health Science, Com-munity and Occupational Medicine at the UMCG, University of Groningen. The focus of her research is on sustainable employability.
