university of groningen the kenyan hippo kanga, erustus ...hippopotamus (hippopotamus amphibius...
TRANSCRIPT

University of Groningen
The Kenyan hippoKanga, Erustus Mutembei
IMPORTANT NOTE: You are advised to consult the publisher's version (publisher's PDF) if you wish to cite fromit. Please check the document version below.
Document VersionPublisher's PDF, also known as Version of record
Publication date:2011
Link to publication in University of Groningen/UMCG research database
Citation for published version (APA):Kanga, E. M. (2011). The Kenyan hippo: Population dynamics, impact on riparian vegetation and conflictswith humans. Groningen: s.n.
CopyrightOther than for strictly personal use, it is not permitted to download or to forward/distribute the text or part of it without the consent of theauthor(s) and/or copyright holder(s), unless the work is under an open content license (like Creative Commons).
Take-down policyIf you believe that this document breaches copyright please contact us providing details, and we will remove access to the work immediatelyand investigate your claim.
Downloaded from the University of Groningen/UMCG research database (Pure): http://www.rug.nl/research/portal. For technical reasons thenumber of authors shown on this cover page is limited to 10 maximum.
Download date: 01-03-2020

Cha
pter
tw
o

Human-hippo conflicts in Kenyaduring 1997–2008: Vulnerability ofa megaherbivore to anthropogenicland use changes
Published in Land Use Science (2011), DOI: 10.1080/1747423X.2011.590235
Erustus M. Kanga, Joseph O. Ogutu, Hans-Peter Piepho and Han Olff
2

20 Chapter 2
Rising human population and the associated demand for more land, water
and other natural resources is intensifying conflicts between people and
wildlife worldwide. We investigated the nature, intensity, seasonality,
spatial and temporal patterns in human-hippo conflict incidences reported
from wildlife stations Kenya-wide, over a 12-year period spanning 1997 to
2008. Overall, 4493 human-hippo conflict incidences were recorded, repre-
senting a mean rate of 4.46±0.29 incidences per month. The conflict inci-
dences increased by 1285% from 1997 to 2008, resulting in 937 peak
incidences reported in 2008. Number of conflict incidences differed among
conservation regions, with incidences increasing during severe droughts and
over time. Crop damage was the most commonly reported type of conflict.
Wildlife managers attended to 90% of all reported conflict incidences. Hippo
mortality increased linearly with increasing conflict incidences, portending
a precarious future for hippos outside protected areas of Kenya. This
dramatic rise in human-hippo conflicts is a consequence of fundamental
land use changes around wetlands and riparian-edge habitats.
Abstract

Introduction
Human population growth and demand for more land, water and other naturalresources are intensifying conflicts between people and wildlife worldwide (IUCN2003). Human-wildlife conflicts (HWC) arise from direct and indirect negativeinteractions, leading to economic losses to agriculture through destruction of crops,human fatalities and injuries, depredation of livestock and retaliatory killings ofwildlife (Hill 1997; Siex and Struhsaker 1999; Tourenq et al. 2001; Treves andKaranth 2003). In the African savannas, intensification of land conversion to culti-vation and/or human settlement is a key factor driving people into more directcontacts with wildlife (Sala et al. 2000; Thuiller et al. 2006).
The pattern of increasing conflicts between people and wildlife is evident inKenya (Musau and Strum 1984; Mizutani 1993; Thouless 1994; Kiiru 1995; Sitati etal. 2003; Patterson et al. 2004). Land use changes especially within the pastoralsystems of Kenya, driven by rapid expansion of cultivation, land subdivision andprivatization of land tenure (Kimani and Pickard 1998; Lamprey and Reid 2004;Okello and D’Amour 2008), are largely responsible for the escalating human wildlifeconflicts. As a result, expanding settlements and cultivation are exerting increasingimpacts on the distribution and abundance of wildlife at both the population andcommunity levels (Verlinden 1997; Prins 1992; Serneels and Lambin 2001). Conse-quently, wildlife grazing areas are increasingly dwindling in size, migration corri-dors are being lost or modified and wildlife access to water sources is gettingincreasingly blocked, resulting in elevated human wildlife conflicts and wildlifepopulation declines (Serneels and Lambin 2001; Thuiller et al. 2006). The informa-tion required to understand and potentially to mitigate these conflicts has not beenadequately collated and analyzed in Kenya, especially for the commonhippopotamus (Hippopotamus amphibius Linnaeus 1758), except for an unpub-lished thesis on the Lake Victoria Basin (Post 2000).
Megaherbivores (weighing over 1000 kg, Owen-Smith 1988), such as hippopo-tamus, Elephant (Loxodonta africana Blumenbach 1797), and large carnivores rankamong the most problematic and lie at the heart of human wildlife conflictsbecause they are dangerous to humans. Despite the fact that megaherbivores oftencause major devastation to crops and are often a physical threat to humans, mostresearch has focused only on the elephant and neglected hippopotamus, yet thelatter are involved in numerous conflicts with people in many parts of Africa(Mkanda and Kumchedwa 1997; Eltringham 1999). Nonetheless, substantial infor-mation on human-hippo conflicts is scattered in office files and thus less widelyaccessible.
Hippos differ from other megaherbivores in having a dual requirement of dailyliving space in water and an open grazing range often visited at night (Eltringham1999). This requirement affects the manner in which hippos utilize resources and
21Human-hippo conflicts

survive in areas dominated by high human population densities and continuousland use changes. While most studies on human wildlife conflicts have concludedthat conflicts are intense on the periphery of protected areas (Naughton-Treves1998; Saj et al. 2001), this may not necessarily be true for hippos since they inhabitwetlands that often extend outside protected areas into agricultural landscapes.Being mainly wild grazers (Cerling et al. 2008), hippos destroy crops cultivatedclose to wetlands (Mkanda and Kumchedwa 1997; Eltringham 1999) and pose phys-ical threats to local communities. However, like most other hippo-range states inAfrica, Kenya has done little to evaluate the type, extent and consequences ofhuman-hippo conflicts, even though local communities report numerous com-plaints on hippo damages regularly.
Substantial human-induced environmental changes pose a serious challenge tobiodiversity conservation (Cincotta et al. 2000; Thaxton 2007). It is probable thatsignificant proportions of threatened and vulnerable species of conservationconcern, like the common hippopotamus (Lewison and Oliver 2008), rely on orutilise agricultural landscapes and experience conflicts with humans (Siex andStruhsaker 1999; O’Connell-Rodwell et al. 2000; Tourenq et al. 2001; Green et al.2005). Therefore, to effectively address human wildlife conflicts, it is necessary toconsider both the effects of damage caused by wildlife as well as the impacts ofmitigating actions on the conservation status of target species. We thus investi-gated the nature, intensity, seasonality, spatial and temporal patterns in human-hippo conflicts over a 12-year period spanning 1997 to 2008, to inform decisions onbest-practice management of human-hippo conflicts in Kenya. We also attempted toestablish correlates of the patterns in human-hippo conflicts, using human-wildlifeconflict data collected from a network of 69 wildlife stations and 23 outposts, andinterpret the implications of our findings for hippo conservation and management,in the wake of rising human population pressure on wetland habitats across Kenya.
Materials and Methods
Study areaThe Republic of Kenya (East Africa) lies between latitude 4° N to 4° S and longitude34° E to 41° E, with the equator running approximately through the middle of thecountry. The country covers an area of about 582,646 km2, 8.2% of which comprise22 terrestrial national parks, 4 marine national parks, 28 terrestrial nationalreserves, 6 marine national reserves and 5 national sanctuaries administered by theKenya Wildlife Service. Generally, Kenya’s landuse is largely pastoral in semi-aridzones and agricultural in the moist and humid zones. Rainfall is bimodal in mostparts of the country, with short rains normally occurring during October-Decemberand the long rains during March-June. Kenya experienced extreme El Niño floods
22 Chapter 2

in 1997–1998, mild El Niño floods in 2001–2004 and 2007, and severe droughts in1999–2000, 2005–2006 (Ogutu et al. 2007) and in 2008–2009. Human populationsize in Kenya grew rapidly during the past half century, from 8 million in the 1960sto about 37 million by 2007, at an average annual rate of 2.8% (CBS 2001; Thaxton2007); an increase associated with rising demand for more land for settlements andcultivation, with increased contacts between people and wildlife, especially close towater sources (UNEP 2009).
The Kenya Wildlife Service mandate is to conserve and manage wildlife inKenya, and has therefore stratified the country geographically into ConservationRegions (Figure 2.1), based on broad ecosystems and landscape characteristics forease of biodiversity conservation administration. Wetlands, the main hippopotamushabitats, cover about 2–3% of the country’s surface area and support a substantialproportion of the Kenya’s biodiversity resources. These wetlands are diverse in typeand distribution but face numerous threats, including pollution, cultivation,
23Human-hippo conflicts
N
300 km
Figure 2.1 Map of Kenya, showing conservation regions, protected areas and KWS stations thatreported human-hippo conflicts during 1997–2008.

reclamation for settlements and unsustainable exploitation (Crafter, Njuguna andHoward 1992). Conversion of wetlands to agriculture and the impact of farming onriparian habitats are the main threats to hippopotamus conservation in Kenya,followed by illegal poaching for meat and their canine teeth ivory (Weiler, De-Meulenaer and Vanden-Block 1994; Williamson 2004). Although hippo populationnumbers are known to be declining in most parts of Africa, comparable informationon hippo population trends is still lacking for Kenya (Eltringham 1999; Lewison andOliver 2008; Kanga et al. 2011), despite the fact that human encroachment onwetlands has greatly interfered with hippopotamus ecology and heightened human-hippo conflicts Kenya-wide.
MethodsWe collated information on human-hippo conflict incidences from OccurrenceBooks in which human-wildlife conflict incidences were recorded daily at 69wildlife stations and 23 wildlife outposts Kenya-wide during 1997-2008. Records inthe Occurrence Books are made whenever members of the public reportedcomplaints or Kenya Wildlife Service personnel make field visits in response tocommunities’ distress calls. Conflicts were grouped into crop damage, humanmortality and injury, livestock mortality, hippo mortality and physical threat cate-gories. Conflict incidences that could not be assigned to any of these five categorieswere lumped together as unclassified. Physical threats denoted incidences wherehippos intruded on people, threatened their safety or constrained their free move-ments.
Statistical data analysisWe first stratified the conflicts dataset geographically by conservation regions andthen modelled temporal trends in the number of conflict incidences reported foreach region per year using the zero-inflated negative binomial regression, assuminga negative binomial distribution of conflict incidences. The aim of this modellingwas to smooth climate related inter-annual fluctuations in order to understandseasonal and long term trends over the study period. Further, we modeled temporaltrends in the expected monthly frequencies of conflict incidences in each regionover the 12-year period and accounted for seasonality, using a quadratic montheffect, and regional differences in the incidences. The zero-inflated model wasselected to account for excess or structural zeros in the data arising potentiallyfrom underreporting of actual conflict incidences or random zeros corresponding tozeros expected under the negative binomial probability model. We first establishedthat the data were over-dispersed relative to the Poisson distribution, a baselinemodel for count data, and that the zero-inflated negative binomial model gave abetter fit to the conflict incidences than the zero-inflated Poisson model using theVuong test (Vuong, 1989). We also compared the mean number of conflict incidences
24 Chapter 2

per station per year and per station per month among regions using one-wayANOVA. We regressed the number of conflict incidences summed over all regions onyear and accounted for serial autocorrelation of error terms using the first-orderautoregressive model. However, the model with serial autocorrelation had weakersupport in the data than a model assuming complete independence based on theAkaike Information Criterion (Burnham and Anderson 2002), which we thereforeused for final inference. Finally, we used the negative binomial regression model torelate hippopotamus mortality to the level of conflict incidences in Kenya. Allmodels were fitted in STATA (StataCorp 2001).
Results
Temporal patterns in conflict incidencesA total of 4493 human-hippo conflict incidences were reported between 1997 and2008, corresponding to a mean rate of 4.46±0.29 (1SD) incidences per month. Thehighest number of conflict incidences reported per year was 937 in 2008, repre-senting an increase of 1285% from 41 incidences reported for 1997. Conflict inci-dences were initially low until the severe drought of 1999–2000 after which theincidences rose markedly to over 400 per annum during 2000–2002. Thereafter, thenumber of incidences dropped by more than a half during the high rainfall period of2003–2004. The conflict incidences began to rise again, albeit more graduallyduring the severe drought of 2005–2006, and were distinctly higher than expectedin the drought of 2008. Marked increases in conflict incidences were thus contem-poraneous with severe droughts and conflicts increased significantly linearly overtime (Figure 2.2, LN(conflicts) = –420.86 +0.213×year, p = 0.008).
25Human-hippo conflicts
3.5
4.0
4.5
5.0
5.5
6.0
6.5
7.0
LN (
conf
licts
)
19981996 2000 2002 2004 2006 2008year
R2 = 0.476
Figure 2.2 Trends in human-hippo conflicts in Kenya during 1997–2008 (Upward pointing arrowsindicate dry while downward pointing arrows indicate wet periods).

26 Chapter 2
0
1
2
3
4
5
LN (
conf
licts
+ 1
)
19981996 2000 2002 2004 2006 2008year
11 121month
2 3 4 5 6 7 8 9 10
Wes
tern
0
1
2
3
Nor
ther
n
0
Tsav
o
0
1
2
3
4
Mou
ntai
n
0
Sou
ther
n
0
Cen
tral
0
1
2
3
4
5
Coa
st1
2
3
1
2
3
4
1
2
3
A B
Figure 2.3 Long-term (A) and seasonal (B) trends in human-hippo conflicts in Kenya during1997–2008.

The expected conflict incidences differed significantly among conservationregions (Z = –4.52, p < 0.001), with a significant increase in conflict incidences overtime evident in the Coast (Z = 3.68, p < 0.001), Central Rift (Z = 2.29, p = 0.022),Southern (Z = 2.46, p = 0.024) and Tsavo (Z = 2.72, p = 0.007, Figure 2.3) regions.
Frequency distribution of conflict incidences by regionThe Coast region contributed the highest number of conflict incidences (46%),followed by Western (19%), Southern (12%), Tsavo (10%), Mountain (6%), CentralRift (5%), and Northern (2%) regions (Table 2.1). Multiple pairwise comparisons ofmean conflict incidences per station per year and per station per month across regionsrevealed significant regional distinctions (F6, 6617 = 51.9, p < 0.001, Table 2.2).
27Human-hippo conflicts
Table 2.1 Summary of descriptive statistics of monthly human-hippo conflict incidences in Kenyaduring 1997–2008. STD =1 standard deviation; IQR = Interquartile range; N= Total number ofmonths; TS= Total number of all KWS stations; CS=Number of stations that recorded conflicts.
Region Mean STD Median IQR Min Max N TS CS
Coast 14.2 17.9 6.5 23.5 0 91 144 14 6
Western 5.7 9.0 2 8.5 0 71 144 11 7
Southern 3.9 6.7 1 5 0 32 144 7 6
Tsavo 3.0 4.1 1 5 0 20 144 7 3
Mountain 2.0 3.7 1 2 0 29 144 9 6
Central Rift 1.7 2.8 0 2 0 13 144 11 10
Northern 0.73 1.4 0 1 0 9 144 11 8
Table 2.2 Mean number of human-hippo conflict incidences per station per year and per stationper month in each conservation region in Kenya during 1997–2008, and pairwise comparisons ofregional differences. N1 is the number of stations times the number of years and N2 is the numberof stations times the number of months in the period 1997–2008..
Conservation Station and year Station and month
Region Mean SE N1 Mean† SE N2
Central Rift 2.03 0.48 120 0.17 a 0.02 1440
Coast 28.01 8.62 72 2.33 d 0.26 864
Mountain 3.81 0.89 72 0.32 abc 0.04 864
Northern 0.95 0.27 96 0.08 ab 0.01 1152
Southern 7.72 2.93 72 0.64 c e 0.09 864
Tsavo 11.92 4.01 36 0.99 e 0.13 432
Western 9.77 2.31 84 0.81 e 0.09 1008
†Means with similar letters were not significantly different at P = 0.05

Frequency distribution of conflict incidences by typeThe most widely reported type of hippo conflict was crop damage (62.1%), followedby physical threat (15.0%), hippo mortalities (13.3%), human fatality and injury(3.4%), and livestock mortality (1.1%). The remaining 5.1% were unclassifiedconflict reports. The 745 conflict incidences reported in 2008 and involving bothcrop damage and physical threats suggest that land use changes withinhippopotamus habitats had elevated conflict incidences by 2,659% relative to 27incidences reported in 1997. The temporal distributions of crop damage also variedconsiderably among regions and accounted for 50, 18, 12, 9, 6, 3 and 3% of all theincidences reported for the Coast; Western; Southern; Tsavo; Mountain; CentralRift and Northern regions, respectively.
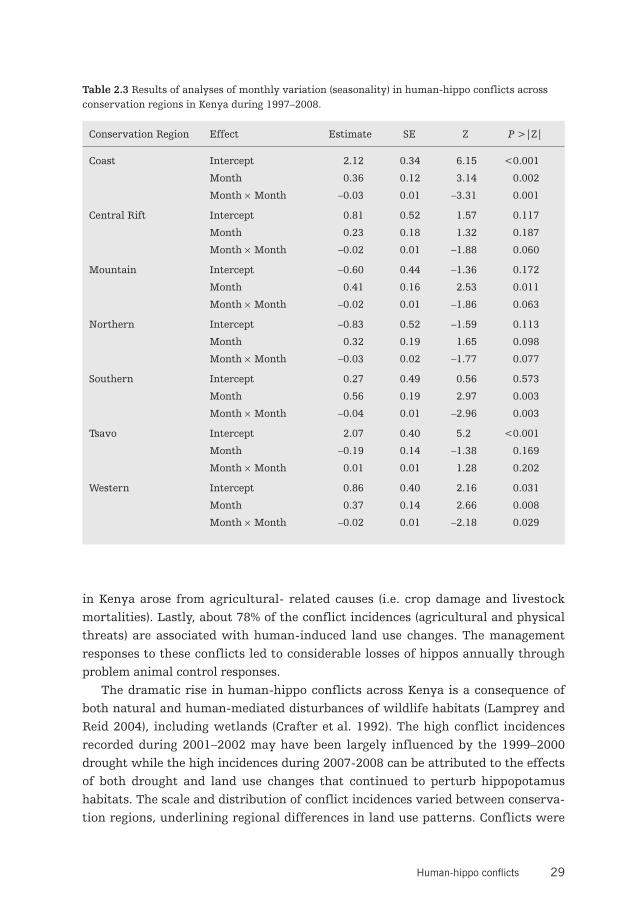
Seasonality in conflict incidencesThere was a significant difference in expected monthly conflict incidences amongregions (Z = 4.73, p < 0.001), implying that the impact of human land use practiceson hippos differed regionally. However, conflict incidences were seasonal in mostregions with a peak generally evident during June-August (Figure 2.3). The season-ality in conflict incidences was significant for the Coast, Mountain, Southern andWestern regions (Table 2.3), and was influenced strongly by seasonal variation incrop damage that accounted for 63% of all the conflict incidences, consistent withreports that hippos ate and trampled on a variety of crops.
Relationship between conflict incidences and hippo mortalityHippo mortalities increased significantly linearly with increasing number ofreported conflicts (R2 = 0.736, Z = 11.90, p < 0.001), implying that elimination ofindividual animals at conflict points through problem animal control is a majorcause of hippo deaths in Kenya. On average, Kenya Wildlife Service attended to 90%of human-hippo conflict incidences over the 12-year period, including 93, 84, 70,89, 89, 92, 87, 94, 94, 98 and 95% of all reported incidences each year from 1997 to2008, respectively.
Discussion
This study revealed four distinct patterns in the spatial and temporal distributionof human-hippo conflict incidences in Kenya. First, conflicts occurred throughoutthe year but with a seasonal peak apparent during the transition from the late-wet(May-June) to the early-dry (June-August) season, a period of crop ripening in mostparts of the country. Second, although conflict incidences occurred in all conserva-tion regions, there was an apparently higher concentration of incidences in theCoast (46%) and Western (19%) regions. Third, about 63% of human-hippo conflicts
28 Chapter 2
in Kenya arose from agricultural- related causes (i.e. crop damage and livestockmortalities). Lastly, about 78% of the conflict incidences (agricultural and physicalthreats) are associated with human-induced land use changes. The managementresponses to these conflicts led to considerable losses of hippos annually throughproblem animal control responses.
The dramatic rise in human-hippo conflicts across Kenya is a consequence ofboth natural and human-mediated disturbances of wildlife habitats (Lamprey andReid 2004), including wetlands (Crafter et al. 1992). The high conflict incidencesrecorded during 2001–2002 may have been largely influenced by the 1999–2000drought while the high incidences during 2007-2008 can be attributed to the effectsof both drought and land use changes that continued to perturb hippopotamushabitats. The scale and distribution of conflict incidences varied between conserva-tion regions, underlining regional differences in land use patterns. Conflicts were
29Human-hippo conflicts
Table 2.3 Results of analyses of monthly variation (seasonality) in human-hippo conflicts acrossconservation regions in Kenya during 1997–2008.
Conservation Region Effect Estimate SE Z P >|Z|
Coast Intercept 2.12 0.34 6.15 <0.001
Month 0.36 0.12 3.14 0.002
Month × Month –0.03 0.01 –3.31 0.001
Central Rift Intercept 0.81 0.52 1.57 0.117
Month 0.23 0.18 1.32 0.187
Month × Month –0.02 0.01 –1.88 0.060
Mountain Intercept –0.60 0.44 –1.36 0.172
Month 0.41 0.16 2.53 0.011
Month × Month –0.02 0.01 –1.86 0.063
Northern Intercept –0.83 0.52 –1.59 0.113
Month 0.32 0.19 1.65 0.098
Month × Month –0.03 0.02 –1.77 0.077
Southern Intercept 0.27 0.49 0.56 0.573
Month 0.56 0.19 2.97 0.003
Month × Month –0.04 0.01 –2.96 0.003
Tsavo Intercept 2.07 0.40 5.2 <0.001
Month –0.19 0.14 –1.38 0.169
Month × Month 0.01 0.01 1.28 0.202
Western Intercept 0.86 0.40 2.16 0.031
Month 0.37 0.14 2.66 0.008
Month × Month –0.02 0.01 –2.18 0.029

high in regions where hippopotamus coexists with high human population densi-ties, particularly in close proximity to major wetlands and rivers. This was true forthe Coastal and Western regions, characterized by high human populations, prac-ticing subsistence crop farming mostly on wetlands and river banks, unlike in theNorthern region where pastoralism is the main economic activity, with minimal orno crop cultivation (UNEP 2009).
Human-hippo conflicts occurred throughout the year in all areas but showed anoverall seasonal pattern, with an annual peak generally during June-August, aperiod of crop ripening in most parts of the country. This pattern is consistent withthe observation that over 63% of all the conflict incidences were related to agricul-ture and is similar to that reported for Malawian hippos (Mkanda and Kumchedwa1997). The probable proximate causes of the observed pattern of human-hippoconflict are linked to increasing human population and the associated increase indemand for agricultural and settlement space, especially in areas close to water,and the fact that hippos, humans and their livestock compete for resources alongwetland margins. In addition, drought and competition with livestock may beforcing hippos to forage further from their daily living space (Field 1970; Lock1972), increasing their probability of contacts with humans. However, it remainsunclear whether the seasonality we observed in hippo conflict incidences reflectsseasonal restrictions in food availability or is simply an opportunistic response togreater availability of an alternative, more nutritious and easily accessible foodtype (Cerling et al. 2008).
Similar to other wildlife species, hippos caused serious socio-economic losses torural Kenyan farmers through crop raids, human mortalities and physical injuries(Mizutani 1993; Butler 2000; Patterson et al. 2004). However, the large number andincreasing incidences of crop damage and physical threats posed by hippos in Kenyaimply possibly greater economic and social consequences to the livelihoods ofaffected communities than those caused by other megaherbivores. These conse-quences are however confounded by the fact that rural communities are increas-ingly using wetlands for multiple cropping agriculture for subsistence and thatsuch crops are more vulnerable to wildlife damage, especially hippopotamus.
The hippopotamus mortalities recorded were highly correlated with the rise inconflict incidences, portending a bleak future for hippos outside protected areas,especially given that no actions are currently being undertaken to stem their perse-cution. Moreover, actual hippo mortalities could have been higher than reported ifinjured hippos wandered off and died later. When faced with increased human-wildlife conflicts in Kenya, wildlife managers commonly react by killing theoffending animals as a problem animal control measure, in the hope of eliminatingthe problem animals. Hippopotamus are easy target in wetlands for such controlmeasures. Thus, unregulated problem animal control can adversely affect theirpopulation status in the long-term, given that there are likely many unrecorded
30 Chapter 2

incidences of systematic poaching of hippos, further aggravating their plight inKenya.
Conclusions and recommendations
Conflicts between people and hippopotamus in Kenya probably cannot be entirelyeliminated but can be mitigated, by discouraging agricultural activities in areaswith high human densities on lands bordering riparian habitats and promotingsustainable use of wetlands, including through wildlife conservation, with theoverall goal of enhancing human wellbeing. Although hippos cause serious damageto crops and physically threaten people, their continued persecution through unreg-ulated problem animal control will drastically reduce their population abundance.If this trend continues unchecked and the conflicts are not well managed,hippopotamus populations in unprotected lands in Kenya may soon become unvi-able. Human-hippo conflicts could be reduced through effective public education,promotion of communal conservancies that provide tourism revenues and landrents directly to communities, selective problem animal control programs andtranslocation of hippo populations in intensively farmed areas. However, given therapidly expanding human population and frequent food shortages linked to recur-rent droughts in Kenya and the fact that riparian-edge areas are often some of thebest for agriculture, successfully balancing the need for national food security andconservation of hippos will undoubtedly require considerable ingenuity andresources. A Kenya-wide distribution and status survey for hippopotamus is neededas a basis for developing effective management and conservation interventions forhippos outside protected areas.
AcknowledgementsWe thank Walter Mususi and Moses Maloba for assistance with the collation of the conflicts
dataset. We also thank the Kenya Wildlife Service for logistical support and for availing the
conflict data. EK was supported by the Netherlands Fellowship Program (NFP) and the
University of Groningen through the Government of Kenya and by the Frankfurt Zoological
Society (FZS).
31Human-hippo conflicts