university of groningen structural effects due to the ... · university of groningen structural...
TRANSCRIPT

University of Groningen
Structural effects due to the incorporation of Ar atoms in the lattice of ZrO2 thin films preparedby ion beam assisted depositionHolgado, J.P.; Escobar Galindo, R.; van Veen, A.; Schut, H.; De Hosson, J.T.M.; Gonzalez-Elipe, A.R.Published in:Nuclear Instruments & Methods in Physics Research Section B-Beam Interactions with Materials and Atoms
DOI:10.1016/S0168-583X(02)00695-X
IMPORTANT NOTE: You are advised to consult the publisher's version (publisher's PDF) if you wish to cite fromit. Please check the document version below.
Document VersionPublisher's PDF, also known as Version of record
Publication date:2002
Link to publication in University of Groningen/UMCG research database
Citation for published version (APA):Holgado, J. P., Escobar Galindo, R., van Veen, A., Schut, H., de Hosson, J. T. M., & Gonzalez-Elipe, A. R.(2002). Structural effects due to the incorporation of Ar atoms in the lattice of ZrO2 thin films prepared byion beam assisted deposition. Nuclear Instruments & Methods in Physics Research Section B-BeamInteractions with Materials and Atoms, 194(3), 333 - 345. [PII S0168-583X(02)00695-X]. DOI:10.1016/S0168-583X(02)00695-X
CopyrightOther than for strictly personal use, it is not permitted to download or to forward/distribute the text or part of it without the consent of theauthor(s) and/or copyright holder(s), unless the work is under an open content license (like Creative Commons).
Take-down policyIf you believe that this document breaches copyright please contact us providing details, and we will remove access to the work immediatelyand investigate your claim.
Downloaded from the University of Groningen/UMCG research database (Pure): http://www.rug.nl/research/portal. For technical reasons thenumber of authors shown on this cover page is limited to 10 maximum.
Download date: 10-02-2018

Structural effects due to the incorporation of Ar atomsin the lattice of ZrO2 thin films prepared by ion beam
assisted deposition
J.P. Holgado a, R. Escobar Galindo b, A. van Veen b, H. Schut b,J.Th.M. de Hosson c, A.R. Gonz�aalez-Elipe a,*
a Instituto de Ciencia de Materiales de Sevilla (CSIC/Universidad de Sevilla) and Dpto. de Qu�ıımica, Inorg�aanica Univ. Sevilla.,Av. Americo Vespucio S/N, E-41092 Sevilla, Spain
b Interfaculty Reactor Institute, Defects in Materials, Delft University of Technology, Mekelweg 15, 2629 JB Delft, The Netherlandsc Materials Science Center, University of Groningen, Nijenborgh 4, 9747 AG Groningen, The Netherlands
Received 4 October 2001; received in revised form 27 January 2002
Abstract
Two sets of ZrO2 thin films have been prepared at room temperature by ion beam induced chemical vapour de-
position and subsequently annealed up to 1323 K. The two sets of samples have been prepared by using either Oþ2 or
mixtures of (Oþ2 þArþ) ions for the decomposition of a volatile metallorganic precursor of zirconium. The structure
and microstructure of these two sets of samples have been determined by means of X-ray diffraction, Fourier transform
infrared spectroscopy and positron beam analysis (PBA). The samples were very compact and dense and had a very
low-surface roughness. After annealing in air at T P 573 K both sets of films were transparent and showed similar
refraction indexes.
For the (Oþ2 þArþ)-ZrO2 thin films it is shown by X-ray photoelectron spectroscopy and Rutherford back scattering
that a certain amount of incorporated Ar (5–6 at.%) remains incorporated within the oxide lattice. No changes were
detected in the amount of incorporated Ar even after annealing at T ¼ 773 K. For higher annealing temperatures(T > 1073 K), the amount of Ar starts to decrease, and at T ¼ 1223 K only residual amounts of Ar (<0.4%) remainwithin the lattice. It has been found that as far as Ar atoms remain incorporated within the ZrO2 network, the
(Oþ2 –Ar
þ)-ZrO2 films present a cubic/tetragonal phase. When the amount of ‘‘embedded’’ Ar decreases, the crystalline
phase reverts to monoclinic, the majority phase observed for the (Oþ2 )-ZrO2 films after any annealing treatments.
The microstructure of the films after different annealing treatments has been investigated by PBA. The presence of
Ar ions and the initial amorphous state of the layers were detected by this technique. An increase of the open volume
was observed after annealing up to 773 K in both sets of samples. For higher annealing temperatures the samples
showed a progressive crystallisation resulting in a decrease of the open volume. During this sintering the samples
without embedded Ar present a higher concentration of open volume defects. After the release of Ar occurs (T P 1223
K) both samples approach to a similar defect free state.
Nuclear Instruments and Methods in Physics Research B 194 (2002) 333–345
www.elsevier.com/locate/nimb
*Corresponding author. Fax: +34-954-460-665.
E-mail address: [email protected] (A.R. Gonz�aalez-Elipe).
0168-583X/02/$ - see front matter � 2002 Elsevier Science B.V. All rights reserved.
PII: S0168-583X(02 )00695-X

The incorporation of Ar within the ZrO2 thin film structure, is proposed as the main factor contributing to the
stabilisation of the cubic/tetragonal phase of ZrO2 at room temperature.
� 2002 Elsevier Science B.V. All rights reserved.
Keywords: Chemical vapour deposition; Ion bombardment; Thin film; Positron annihilation; Phase transformation; Ion assisted
deposition; ZrO2
1. Introduction
Among many other applications, such as opti-cal coatings [1], buffer layers for growing super-conductors [2], heat resistant coatings [3], oxygensensors [5], etc. . . . , ZrO2 thin films have attractedgreat attention because of their properties as ionconductors [4], to be used in the so-called solidoxide fuel cells (SOFCs) [5]. For all these appli-cations, and specially in the case of SOFCs, it isgenerally desirable to obtain the tetragonal orcubic phase of zirconia. It is known that althoughthe tetragonal phase of ZrO2 is unstable at roomtemperature, it can be stabilised by doping withcations such as Y3þ, Ca2þ, etc. [6], or by decreasingthe particle size of the crystalline domains [7]. Thesynthesis of ZrO2 or ZrO2 doped thin films (i.e.ZrO2-M) has been attempted by many differentmethods including spray deposition [8], chemicalvapour deposition (CVD) [9], electron evaporation[10], and other methods [11].Very compact ZrO2ðMÞ thin films can be pre-
pared by ion beam assisted deposition procedures(IBAD) [12] that involve the bombardment ofthe growing film with low-energy ion beams (i.e.generally EP 1000 eV), usually Oþ
2 , Arþ or mix-
tures of both. By these methods, it is very commonto observe the appearance of different crystallo-graphic effects, such as amorphisation or the pref-erential growth of some crystallographic planes[13,14] that are attributed to the influence of thebombardment with low-energy ions [15]. Martin[16] has shown that monoclinic to tetragonal phasetransformations can be induced in ZrO2 thin filmsby bombardment with Arþ ions of relatively lowenergy. For bulk ZrO2 the effect of high-energyArþ bombardment in inducing crystallographictransformations and the stabilisation of the cubic/tetragonal phase is well known [17]. In most cases
an implicit explanation of this type of monoclinicto cubic/tetragonal transformation relies on theassumption that ballistic interactions between theenergetic ions and the target atoms are responsi-ble for the phase change. The results presentedin the present paper do not exactly support suchan explanation based on energetic effects, but ra-ther emphasise the role of Ar embedded withinthe ZrO2 thin film in producing the stabilisationof the cubic/tetragonal phase. We compare thestructural evolution of ZrO2 thin films preparedby ion beam induced chemical vapour deposition(IBICVD) by using either Oþ
2 or mixed Oþ2 þArþ
ion beams. In the latter case the cubic/tetragonalphase is stabilised upon annealing, as long as Aratoms remain incorporated within the thin films.In a previous paper [18] we have studied in detailhow the texture, morphology and optical proper-ties of the resulting films are affected by the use ofArþ ions. The first motivation for the present pa-per is then to highlight how the presence of in-corporated Ar may stabilise the cubic/tetragonalstructure of zirconia acting in a similar way than‘‘doping’’ cations such as Y3þ, Ca2þ, etc. and toprovide an analysis of the evolution of structuraldefects in the samples upon annealing, as deter-mined by positron beam analysis (PBA).
2. Experimental
Thin films have been prepared by IBICVD [19].This method consists of the decomposition of avolatile metallic precursor by means of an ionbeam. Further details about the method as appliedto the synthesis of oxides and nitrides can be foundin previous publications [19–21].Zirconium tetra ter-butoxide, Zr(Obut)4 has
been used as precursor. Typical partial pressure
334 J.P. Holgado et al. / Nucl. Instr. and Meth. in Phys. Res. B 194 (2002) 333–345
during deposition was 4� 10�5 mbar. Oþ2 or mix-
tures of Oþ2 þArþ ions, accelerated to 400 eV,
were supplied by an ‘‘IQP’’ broad ion source.O2 þAr mixtures with a molar ratio 10:1 wereused for preparation of Ar-incorporated samples.A beam current of around 40 lAcm�2 was mea-sured at the sample holder during deposition. Thetotal pressure in the chamber during depositionwas 5� 10�4 mbar. Under these conditions agrowth rate of approximately 2.0 nmmin�1 wasmeasured with a quartz crystal monitor at thesample position.Silicon (1 0 0) wafers and fused quartz have
been used as substrates for preparation of thesamples.X-ray diffraction (XRD) spectra were recorded
by using the Cu Ka radiation with a SiemensD5000 diffractometer. An incidence angle of 0.5�was chosen to increase the sensitivity.IR spectra were obtained with a Nicolet spec-
trometer at 8 cm�1 resolution for samples preparedon Si wafers. The silicon substrate was partiallytransparent to infrared radiation showing a smallfeature at 609 cm�1.Annealing of the samples in air was carried out
in a conventional atmospheric furnace, using alinear heating ramp of 10 Kmin�1. At the end ofthe ramp the selected final temperature was keptfor 3 h followed by cooling down slowly.Rutherford back scattering (RBS) spectra were
recorded with a tandem ion accelerator (Pelletron9SH-2 from NEC) at the Centro Nacional deAceleradores (CNA) in Seville. Alpha particles of2.021 MeV and usual settings of scattering angleand detector geometry were used for recording ofspectra. The data acquisition was done with a totalsample charge of 5 lC. Simulations of composi-tion profiles have been done with the RUMPprogram code [22].X-ray photoelectron spectroscopy (XPS) was
carried out using an ESCALAB 210 spectrometerworking in pass energy constant mode with a valueof 50 eV. The surface concentration of the ele-ments was determined by measuring the peakareas and correcting by the appropriate sensitivityvalues.The PBA was performed using the Delft vari-
able energy positron beam (VEP) [23]. The posi-
trons were injected in the samples with energiesbetween 100 eV and 25 keV. Annihilation of pos-itrons with electrons results, in the center-of-masssystem, in the emision of two collinear photons of511 keV each. In the laboratory frame the non-zero momentum of the positron-electron paircauses an energy shift of the photons. This resultsin a broader energy distribution, called Dopplerbroadening of the annihilation radiation (DBAR)around the 511 keV peak. This broadened energyspectrum is characterised by two parameters: Sand W. The S (shape) parameter is defined as theratio between the central area and the total area ofthe annihilation photopeak. This parameter re-flects the annihilation of positrons with valenceelectrons (low-momentum electrons). In general, ahigh value of S indicates positron annihilation inopen volume defects. If the material allows theformation of a Positronium state (Ps) this willcontribute to the DBAR with a narrow componentbecause of the low-intrinsic moment of the para-positronium. A second useful parameter for theanalysis of DBAR is the W (wing) parameter,which reflects the positron annihilation with high-momentum electrons (core electrons). The W-parameter is sensitive to changes in the chemicalenvironment. Both parameters can be combined inS–W maps with a third variable (e.g. the implan-tation energy, temperature or strain) as a runningparameter. These maps are useful to trace positrontrapping in, e.g., layers as in the samples describedin this work. The data was analysed with thevariable energy positron fit (VEPFIT) program[24]. The samples studied here are modelled by anumber of stacked slabs. Each of these slabs ischaracterised by a thickness (di), Si and Wi pa-rameters, and a positron diffusion length (Li). Themeasured SðEÞ and W ðEÞ as a function of theimplantation energy E, are a sum of the charac-teristic Si and Wi values of the trapping layers(cluster points) weighted by the fraction of posi-trons trapped in each layer fiðEÞ. The spectra wererecorded with a single Ge solid-state detector. Allexperiments were carried out at room temperatureunder a vacuum of about 10�6 Pa. The values of Sand W parameters are normalised with respect tothe S and W values for a crystal Si substrate(SSi ¼ 0:58, WSi ¼ 0:031).
J.P. Holgado et al. / Nucl. Instr. and Meth. in Phys. Res. B 194 (2002) 333–345 335

3. Results
3.1. Chemical composition
The determination of the chemical compositionof the zirconia films was done by XPS and RBS.The photoelectron spectra of both set of samples,prepared by using Oþ
2 or (Oþ2 þArþ) ions, were
typical for a ZrO2 stoichiometry. Besides a carbonpeak, which is easily removed by bombardmentwith Arþ or Oþ
2 (and thus proving that it is due tocontamination by exposure to air), no other con-taminant species were detected at the surface ofsamples. In the case of (Oþ
2 þArþ)-ZrO2 samples,Ar2p and Ar2s peaks could be detected in thephotoelectron spectra of the films. Their intensitieswere equivalent to an atomic percentage of ap-proximately 5–6%, a value that did not changeafter cleaning by sputtering with Oþ
2 ions of 3 keVenergy. The samples were also analysed by RBS toobtain a more precise quantitative determinationof the amount of Ar present in the samples, as wellas an evaluation of the chemical compositionprofile for the whole film thickness. Fig. 1 showsexperimental and theoretically calculated spectra
for the as prepared (Oþ2 þArþ)-ZrO2 and Oþ
2 -ZrO2 samples. The right of this figure shows, in anenlarged scale, the Ar region of some spectracorresponding to (Oþ
2 þArþ)-ZrO2 samples an-nealed at increasing temperatures up to 1423 K. Inthe (Oþ
2 )-ZrO2 and (Oþ2 –Ar
þ)-ZrO2 samples the O/Zr ratio was close to 2.0, although a slightlysmaller ratio (i.e. ffi1.95–2.00) was obtained for theas prepared (Oþ
2 –Arþ)-ZrO2 thin film. For these
samples, Ar (�5–6 at.%) is found to be distributedhomogeneously over the whole film thickness evenafter their annealing at temperatures as high as 873K. After annealing of the samples at T > 773 Kthe concentration of Ar within the film decreases.It is found that at 1073 K only �3% of Ar is stillretained by the thin film, and that a smaller con-centration is observed at its surface. After an-nealing at 1323 K, only a 0.5 at.% of Ar is present,with an even lower concentration at the surface ofthe thin film. These results indicate that annealingtreatments above 1073 K provoke a progressiveloss of the Ar incorporated within the structure ofzirconia films. This loss is more pronouncedfrom the topmost surface layers of the ZrO2 thinfilms.
Fig. 1. Experimental and simulated RBS spectra of the (Oþ2 þArþ)-ZrO2 sample. The inset shows, in an enlarged scale, the region
corresponding to embedded Ar after annealing treatments at indicated temperatures.
336 J.P. Holgado et al. / Nucl. Instr. and Meth. in Phys. Res. B 194 (2002) 333–345
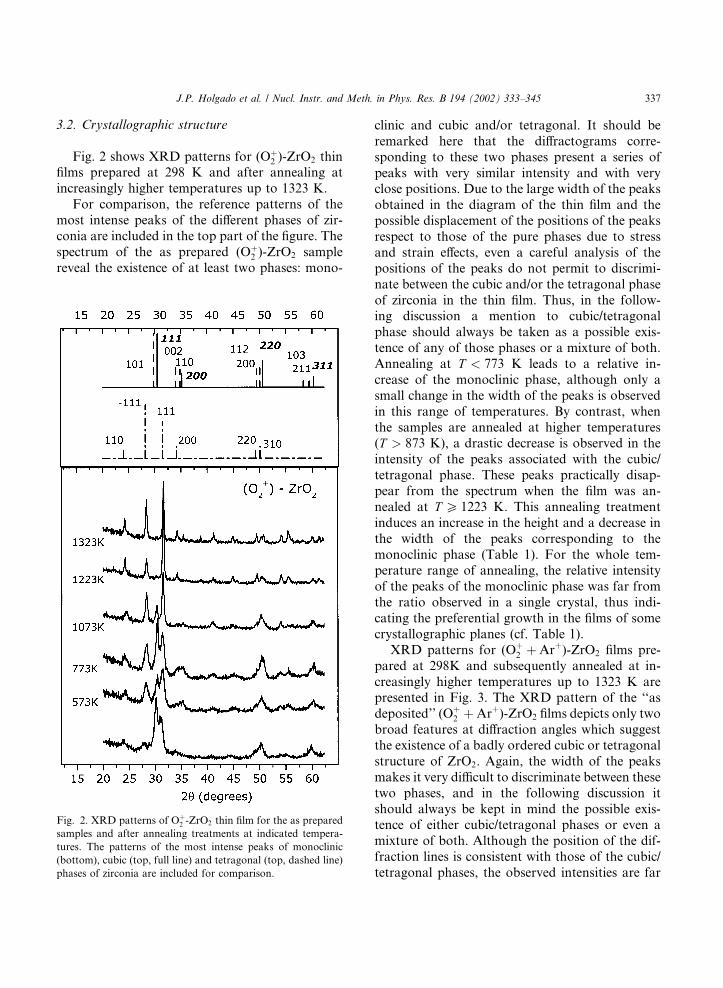
3.2. Crystallographic structure
Fig. 2 shows XRD patterns for (Oþ2 )-ZrO2 thin
films prepared at 298 K and after annealing atincreasingly higher temperatures up to 1323 K.For comparison, the reference patterns of the
most intense peaks of the different phases of zir-conia are included in the top part of the figure. Thespectrum of the as prepared (Oþ
2 )-ZrO2 samplereveal the existence of at least two phases: mono-
clinic and cubic and/or tetragonal. It should beremarked here that the diffractograms corre-sponding to these two phases present a series ofpeaks with very similar intensity and with veryclose positions. Due to the large width of the peaksobtained in the diagram of the thin film and thepossible displacement of the positions of the peaksrespect to those of the pure phases due to stressand strain effects, even a careful analysis of thepositions of the peaks do not permit to discrimi-nate between the cubic and/or the tetragonal phaseof zirconia in the thin film. Thus, in the follow-ing discussion a mention to cubic/tetragonalphase should always be taken as a possible exis-tence of any of those phases or a mixture of both.Annealing at T < 773 K leads to a relative in-crease of the monoclinic phase, although only asmall change in the width of the peaks is observedin this range of temperatures. By contrast, whenthe samples are annealed at higher temperatures(T > 873 K), a drastic decrease is observed in theintensity of the peaks associated with the cubic/tetragonal phase. These peaks practically disap-pear from the spectrum when the film was an-nealed at T P 1223 K. This annealing treatmentinduces an increase in the height and a decrease inthe width of the peaks corresponding to themonoclinic phase (Table 1). For the whole tem-perature range of annealing, the relative intensityof the peaks of the monoclinic phase was far fromthe ratio observed in a single crystal, thus indi-cating the preferential growth in the films of somecrystallographic planes (cf. Table 1).XRD patterns for (Oþ
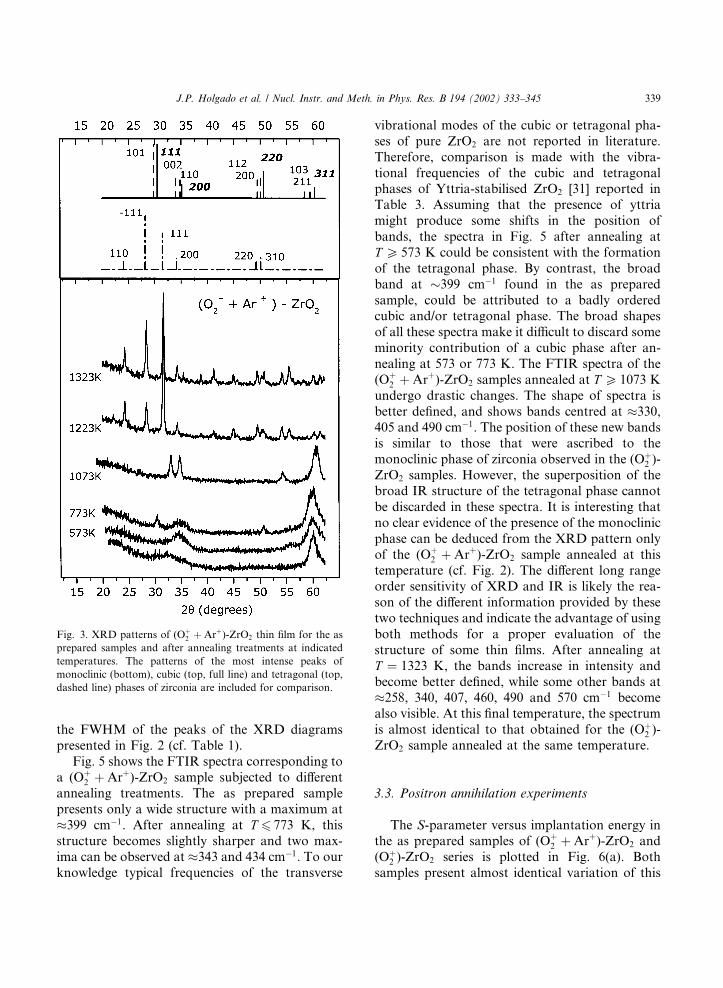
2 þArþ)-ZrO2 films pre-pared at 298K and subsequently annealed at in-creasingly higher temperatures up to 1323 K arepresented in Fig. 3. The XRD pattern of the ‘‘asdeposited’’ (Oþ
2 þArþ)-ZrO2 films depicts only twobroad features at diffraction angles which suggestthe existence of a badly ordered cubic or tetragonalstructure of ZrO2. Again, the width of the peaksmakes it very difficult to discriminate between thesetwo phases, and in the following discussion itshould always be kept in mind the possible exis-tence of either cubic/tetragonal phases or even amixture of both. Although the position of the dif-fraction lines is consistent with those of the cubic/tetragonal phases, the observed intensities are far
Fig. 2. XRD patterns of Oþ2 -ZrO2 thin film for the as prepared
samples and after annealing treatments at indicated tempera-
tures. The patterns of the most intense peaks of monoclinic
(bottom), cubic (top, full line) and tetragonal (top, dashed line)
phases of zirconia are included for comparison.
J.P. Holgado et al. / Nucl. Instr. and Meth. in Phys. Res. B 194 (2002) 333–345 337

from reference patterns. In particular, the high in-tensity of the peak at 2h ffi 59:4�, indicates a pref-erential growth of the film according to thecorresponding (3 1 1) planes of the cubic phase and/or the (2 1 1) plane of the tetragonal phase. Thepreferential growth of planes with high Miller in-dices has been recently reported by us for Fe2O3thin films prepared also by IBICVD [25]. Such apreferential growth was related with the presenceof Ar embedded in the structure.By annealing these zirconia samples at T P 573
K the diffraction pattern changed. The maximumof the peak at 2h ¼ 59:4� becomes slightly broaderwith a small asymmetry at higher diffraction an-gles. Simultaneously, a broad feature appears at2h ¼ 33–35�. The comparison of these structureswith the lines corresponding to the reference pat-tern of the bulk material, suggests the existence ofa badly ordered cubic/tetragonal phase of zirconiain the as prepared samples and their progressiveordering or restructuring with the annealingtreatments.A significant change in the diffraction diagram
of the (O2 þArþ)-ZrO2 samples is observed afterannealing at T ¼ 1073 K. In this case the peakcorresponding to planes (3 1 1) is still the mostintense, but becomes narrower (cf. Table 2). In thisdiagram peaks at �33–35� are now clearly visible,probably corresponding to some diffraction planesof the cubic/tetragonal phase of zirconia and/or(2 0 0) of the monoclinic phase. The peaks of thetetragonal/cubic phases of the zirconia are nolonger visible after annealing at T ¼ 1223 K, beingsubstituted by a clear pattern corresponding to themonoclinic phase. The diffraction peaks of this
phase are also much narrower now (cf. Table 2),having a full width at half maximum (FWHM)similar to that of the peaks of the (Oþ
2 )-ZrO2 thinfilms reported in Fig. 2 (cf. Table 1). After an-nealing at 1323 K, a diffraction diagram similar tothat depicted by the Oþ
2 -ZrO2 sample annealed atthe same temperature was obtained.Fourier transform infrared spectroscopy
(FTIR) spectroscopy can be used as a complementof XRD for a more accurate description of thestructure of ZrO2 thin films. Although FTIR isnormally used on a ‘‘fingerprint’’ basis, a system-atic analysis of IR spectra may also provide insightinto the ZrO2 thin film structure [25–29].Fig. 4 shows FTIR spectra for the (Oþ
2 )-ZrO2sample as prepared and after different annealingtreatments up to 1323 K. Initially, the FTIRspectra of the as prepared Oþ
2 -ZrO2 film is char-acterised by a structure where some broad bandsare defined at �340, 407 and 490 cm�1. Thesebands can be attributed to some of the 15 vibra-tional modes of the monoclinic phase of ZrO2 [30].By annealing at T 6 773 K, the bands becomeslightly sharper and increase in intensity. Thistendency is even clearer after annealing T P 1223K, while some new bands centred at �258, 460 and570 cm�1 develop in the spectrum. These bandscan be also assigned to some of the 15 vibrationalmodes of the monoclinic phase of ZrO2 [30]. Theincrease in intensity at T P 1073K, the develop-ment of new bands and the smaller width of theobserved bands above this temperature are factswhich are consistent with the observed increase inthe crystallinity of the monoclinic phase. Thistendency can be also deduced from the decrease of
Table 1
Normalised intensity, referred to most intense peak of each phase and FWHM (in brackets) of the most significant peaks appearing in
XRD diagrams of Fig. 2 for (Oþ2 )-ZrO2 samples after indicated annealing treatments
Temperature
Monoclinic Cubic/tetragonal
(1 1 0) (�1 1 1) (1 1 1) (1 1 1) (2 2 0) (3 1 1)
300 K 18 (0.98) 18 (0.90) 100 (0.82) 100 (0.92) – –
573 K 19 (0.85) 45 (0.83) 100 (0.82) 100 (0.88) – –
773 K 21 (0.75) 58 (0.75) 100 (0.62) 100 (0.81) – –
1073 K 14 (0.72) 58 (0.57) 100 (0.39) 100 (0.40) – –
1223 K 18 (0.32) 21 (0.32) 100 (0.26) – – –
1323 K 25 (0.25) 63 (0.29) 100 (0.23) – – –
Single crystal 25 100 70 100 50 20
338 J.P. Holgado et al. / Nucl. Instr. and Meth. in Phys. Res. B 194 (2002) 333–345
the FWHM of the peaks of the XRD diagramspresented in Fig. 2 (cf. Table 1).Fig. 5 shows the FTIR spectra corresponding to
a (Oþ2 þArþ)-ZrO2 sample subjected to different
annealing treatments. The as prepared samplepresents only a wide structure with a maximum at�399 cm�1. After annealing at T 6 773 K, thisstructure becomes slightly sharper and two max-ima can be observed at �343 and 434 cm�1. To ourknowledge typical frequencies of the transverse
vibrational modes of the cubic or tetragonal pha-ses of pure ZrO2 are not reported in literature.Therefore, comparison is made with the vibra-tional frequencies of the cubic and tetragonalphases of Yttria-stabilised ZrO2 [31] reported inTable 3. Assuming that the presence of yttriamight produce some shifts in the position ofbands, the spectra in Fig. 5 after annealing atT P 573 K could be consistent with the formationof the tetragonal phase. By contrast, the broadband at 399 cm�1 found in the as preparedsample, could be attributed to a badly orderedcubic and/or tetragonal phase. The broad shapesof all these spectra make it difficult to discard someminority contribution of a cubic phase after an-nealing at 573 or 773 K. The FTIR spectra of the(Oþ
2 þArþ)-ZrO2 samples annealed at T P 1073 Kundergo drastic changes. The shape of spectra isbetter defined, and shows bands centred at �330,405 and 490 cm�1. The position of these new bandsis similar to those that were ascribed to themonoclinic phase of zirconia observed in the (Oþ
2 )-ZrO2 samples. However, the superposition of thebroad IR structure of the tetragonal phase cannotbe discarded in these spectra. It is interesting thatno clear evidence of the presence of the monoclinicphase can be deduced from the XRD pattern onlyof the (Oþ
2 þArþ)-ZrO2 sample annealed at thistemperature (cf. Fig. 2). The different long rangeorder sensitivity of XRD and IR is likely the rea-son of the different information provided by thesetwo techniques and indicate the advantage of usingboth methods for a proper evaluation of thestructure of some thin films. After annealing atT ¼ 1323 K, the bands increase in intensity andbecome better defined, while some other bands at�258, 340, 407, 460, 490 and 570 cm�1 becomealso visible. At this final temperature, the spectrumis almost identical to that obtained for the (Oþ
2 )-ZrO2 sample annealed at the same temperature.
3.3. Positron annihilation experiments
The S-parameter versus implantation energy inthe as prepared samples of (Oþ
2 þArþ)-ZrO2 and(Oþ
2 )-ZrO2 series is plotted in Fig. 6(a). Bothsamples present almost identical variation of this
Fig. 3. XRD patterns of (Oþ2 þArþ)-ZrO2 thin film for the as
prepared samples and after annealing treatments at indicated
temperatures. The patterns of the most intense peaks of
monoclinic (bottom), cubic (top, full line) and tetragonal (top,
dashed line) phases of zirconia are included for comparison.
J.P. Holgado et al. / Nucl. Instr. and Meth. in Phys. Res. B 194 (2002) 333–345 339

parameter, indicating that the fraction of openvolume in the samples is very similar. By contrast,the variation of the W-parameter, presented inFig. 6(b), shows some differences between the asprepared samples of (Oþ
2 þArþ)-ZrO2 and (Oþ2 )-
ZrO2. In principle, this change can be ascribed tothe positron annihilation in the vicinity of argonions, as they are heavier than oxygen ions and,accordingly, positron annihilation with its coreelectrons would be enhanced.
Fig. 4. FTIR spectra of the (Oþ2 )-ZrO2 thin film for the as
prepared sample and those obtained after annealing treatments
at indicated temperatures.
Fig. 5. FTIR spectra of the (Arþ þOþ2 )-ZrO2 thin film for the
as prepared sample and those obtained after annealing treat-
ments at indicated temperatures.
Table 2
Normalised intensity, referred to most intense peak of each phase and FWHM (in brackets) of the most significant peaks appearing in
XRD diagrams of Fig. 3 for (Arþ þOþ2 )-ZrO2 samples after indicated annealing treatments
Temperature
Monoclinic Cubic/tetragonal
(1 1 0) (�1 1 1) (1 1 1) (1 1 1) (2 2 0) (3 1 1)
300 K – – – – – 100 (2.56)
573 K – – – – – 100 (2.56)
773 K – – – – – 100 (2.10)
1073 K – – – – – 100 (1.22)
1223 K 18 (0.29) 21 (0.32) 100 (0.26) – – –
1323 K 25 (0.23) 64 (0.29) 100 (0.23) – – –
Single crystal 25 100 70 100 50 20
340 J.P. Holgado et al. / Nucl. Instr. and Meth. in Phys. Res. B 194 (2002) 333–345
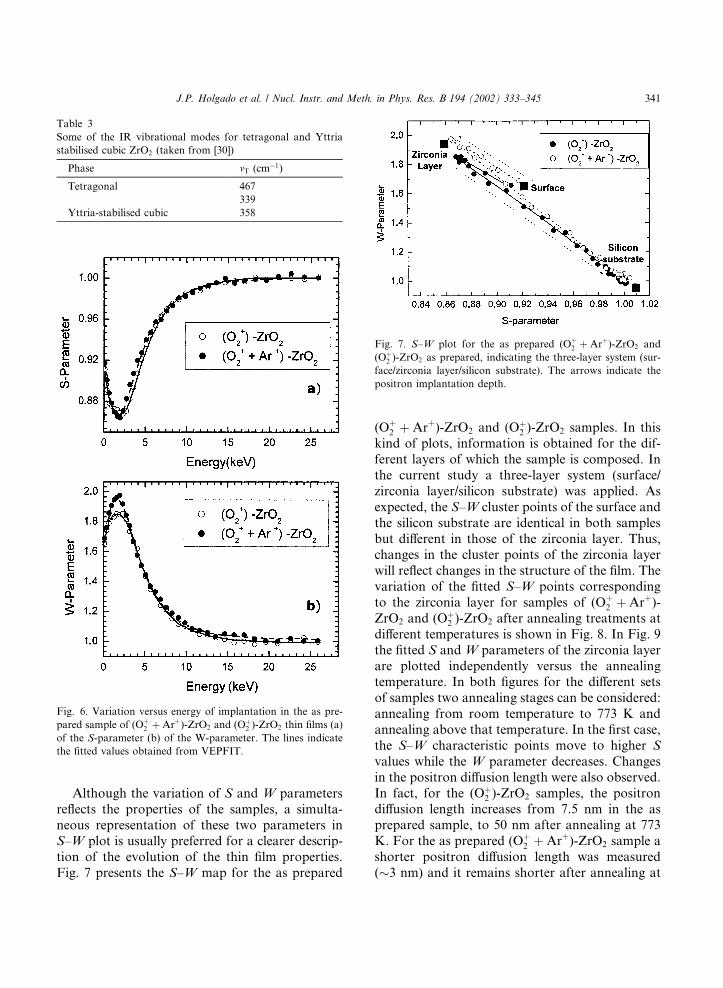
Although the variation of S and W parametersreflects the properties of the samples, a simulta-neous representation of these two parameters inS–W plot is usually preferred for a clearer descrip-tion of the evolution of the thin film properties.Fig. 7 presents the S–W map for the as prepared
(Oþ2 þArþ)-ZrO2 and (Oþ
2 )-ZrO2 samples. In thiskind of plots, information is obtained for the dif-ferent layers of which the sample is composed. Inthe current study a three-layer system (surface/zirconia layer/silicon substrate) was applied. Asexpected, the S–W cluster points of the surface andthe silicon substrate are identical in both samplesbut different in those of the zirconia layer. Thus,changes in the cluster points of the zirconia layerwill reflect changes in the structure of the film. Thevariation of the fitted S–W points correspondingto the zirconia layer for samples of (Oþ
2 þArþ)-ZrO2 and (O
þ2 )-ZrO2 after annealing treatments at
different temperatures is shown in Fig. 8. In Fig. 9the fitted S andW parameters of the zirconia layerare plotted independently versus the annealingtemperature. In both figures for the different setsof samples two annealing stages can be considered:annealing from room temperature to 773 K andannealing above that temperature. In the first case,the S–W characteristic points move to higher Svalues while the W parameter decreases. Changesin the positron diffusion length were also observed.In fact, for the (Oþ
2 )-ZrO2 samples, the positrondiffusion length increases from 7.5 nm in the asprepared sample, to 50 nm after annealing at 773K. For the as prepared (Oþ
2 þArþ)-ZrO2 sample ashorter positron diffusion length was measured(3 nm) and it remains shorter after annealing at
Table 3
Some of the IR vibrational modes for tetragonal and Yttria
stabilised cubic ZrO2 (taken from [30])
Phase mT (cm�1)
Tetragonal 467
339
Yttria-stabilised cubic 358
Fig. 6. Variation versus energy of implantation in the as pre-
pared sample of (Oþ2 þArþ)-ZrO2 and (Oþ
2 )-ZrO2 thin films (a)
of the S-parameter (b) of the W-parameter. The lines indicate
the fitted values obtained from VEPFIT.
Fig. 7. S–W plot for the as prepared (Oþ2 þArþ)-ZrO2 and
(Oþ2 )-ZrO2 as prepared, indicating the three-layer system (sur-
face/zirconia layer/silicon substrate). The arrows indicate the
positron implantation depth.
J.P. Holgado et al. / Nucl. Instr. and Meth. in Phys. Res. B 194 (2002) 333–345 341

773 K (�10 nm). The short diffusion lengthsmeasured for the as prepared samples could berelated with an initial amorphous state (partially)of the samples. It is likely that the difference be-tween the two samples and the evolution uponannealing up to 773 K are due to rougheningprocesses that, based on AFM data, have beenpreviously reported to occur at the surface of thesesamples [18]. However, after annealing at T > 773K it is observed that the cluster points in the S–Wdiagram of the two samples move towards posi-tions with highW and low S values. This tendencyis consistent with the progressive increase in crys-tallinity observed by XRD for the two samplesafter annealing at T > 873 K. It is also interestingthat at the highest annealing temperature the po-sitions of the cluster points of the two samplesapproach each other, a fact that can be relatedwith the progressive loss of Ar from the annealed(Oþ
2 –Arþ)-ZrO2 samples. In Fig. 8, the cluster
point corresponding to a single crystal Y-dopedtetragonal zirconia has been included for com-parison. With respect to this reference point, thoseof the ZrO2 thin films are slightly shifted towardslow W and high S values. The monoclinic phasestabilised in the thin films after annealing and,likely, grain boundaries effects are factors con-tributing to the observed shifts.
4. Discussion
RBS analysis of samples has shown that in(O2 þArþ)-ZrO2 thin films a significant amount ofAr (5–6 at.%) remains homogeneously dispersedwithin the thin film. The fact that the Ar distri-bution is not modified by annealing at 773 Ksuggests a restricted mobility for this atom withinthe ZrO2 lattice and/or grain boundaries. Releaseof Ar starts at T P 1023 K, a temperature at whichit is known that the oxygen ion mobility throughthe ZrO2 lattice acquires significant values [5,32].Therefore it is reasonable to assume that mobili-sation of oxygen anions by heating may providethe necessary pathways for an effective release of
Fig. 8. Variation of the fitted S–W points corresponding to the
zirconia layer for as prepared (Oþ2 þArþ)-ZrO2 and (Oþ
2 )-ZrO2thin films and the corresponding to those samples after an-
nealing treatments at indicated temperature.
Fig. 9. Variation versus annealing temperature in the
(Oþ2 þArþ)-ZrO2 and (Oþ
2 )-ZrO2 thin films (a) of the fitted S-
parameter (b) of the fitted W-parameter.
342 J.P. Holgado et al. / Nucl. Instr. and Meth. in Phys. Res. B 194 (2002) 333–345

the embedded Ar atoms. However, total removalof Ar does not occur even after annealing at 1323K, a fact that supports an effective trapping of thisatom within the Zr–O lattice, probably by ag-glomeration in small argon vacancy complexes.Incorporation of Ar within the ZrO2 thin film
causes significant modifications in its crystallo-graphic structure. Previous papers in literature onthe effect of ion bombardment in ZrO2 bulk [17]and thin film [16] materials have reported aboutmonoclinic-cubic/tetragonal phase transformationor crystallisation processes from an amorphousstate when this material is bombarded with ener-getic Ar beams. However, in these papers, al-though implantation of Arþ ions within thenetwork is implicitly assumed, a precise studyabout the fate of these implanted ions and/or theirinfluence on the crystallographic transformationsis missing. From the point of view of the energyreleased after the impingement of the ions onto thegrowing ZrO2 thin films prepared with our meth-od, both set of samples, Oþ
2 -ZrO2 and (Oþ2 –Ar
þ)-ZrO2, should have a similar behaviour. In fact, inboth cases the preparation of the films is done byusing similar ion densities and energies with abeam of either single or majority Oþ
2 species (theArþ ion density cannot be separately measured inour experiment but we assume that it is small sincein the feed gas of the ion the O2/Ar ratio was 10:1).Therefore, for the two sets of samples none ornegligible differences should exist in the energeticbalance due to the ballistic interactions during thepreparation of the films. Therefore, the distinctcrystallographic characteristics of the (Oþ
2 þArþ)-ZrO2 samples should be associated with the in-corporation of Ar within the thin film. As deducedfrom the XRD and FTIR analysis of the structureof the films the features of this study can besummarised as follows:
(a) Ar incorporation produces some amorphisa-tion of the original thin films.
(b) Annealing of samples with embedded Ar atT < 773 K stabilises the cubic/tetragonalphases of ZrO2 with a preferential growth ofcrystal planes with high Miller indexes (i.e.(3 1 1) of the cubic and/or (2 1 1) of the tetrag-onal phases in our case).
(c) Annealing at T ¼ 1023 K yields a zirconiasample where a distorted cubic/tetragonalphase is detected by XRD while FTIR revealsthat the monoclinic structure of zirconia startsto form.
Amorphisation of the as prepared ZrO2 thinfilms (i.e. point a) can be considered a generalfeature of oxide thin films prepared by IBICVD.However, it is remarkable that the amorphisationdegree is larger in samples (Oþ
2 þArþ)-ZrO2 thanin Oþ
2 -ZrO2 samples. This is an expected behaviourdue structural distortions produced by the incor-poration of Ar atoms within the ZrO2 lattice. Asimilar effect has been observed for Fe2O3 thinfilms prepared by IBICVD with a mixture of Arþ
and Oþ2 ions [25,33].
It is still unclear what is the cause that producethe stabilisation of the cubic/tetragonal phase ofZrO2 when Ar is embedded within the lattice(point b). Under thermodynamic equilibrium thetransformation of the monoclinic into the tetrag-onal phase of pure ZrO2 only occurs at T > 1446K. Therefore, the crystallisation into the tetrago-nal phase of the (Arþ þOþ
2 )-ZrO2 thin films atT 6 773 K must be due to some effect of the em-bedded Ar atoms. It is likely that embedded argonleads to an increase of the compressive stress in thefilms. Stabilisation of the tetragonal or cubicphases of ZrO2 by the incorporation of defectswithin its lattice has been recently reported bySickafus et al. [34]. Stabilisation of the cubic ortetragonal phases of ZrO2 has been also reportedwhen the constituent particles have a small size(d 300 �AA) [7]. In our case, although a particlesize effect cannot be discarded, the fact that sta-bilisation of a pure cubic/tetragonal phase is notfound for samples Oþ
2 -ZrO2 suggests that the maincause leading to the stabilisation of these phases isthe incorporation of Ar within the thin film. Asmentioned before, increase of lattice stress, gen-eration of defects and other related phenomenamust occur by the incorporation of Ar duringpreparation of the films. Some of these effects havebeen claimed to account for by the stabilisation ofthe tetragonal phase in ion doped zirconia [6] andtherefore they could have a similar influence here.The high texturing of the films developing crystal
J.P. Holgado et al. / Nucl. Instr. and Meth. in Phys. Res. B 194 (2002) 333–345 343
planes with high-Miller indexes (i.e. (3 1 1) of thecubic phase, see Fig. 3) is another effect of theincorporation of Ar within the ZrO2 lattice thathas been also reported for other thin film oxides[25,33]. At present, additional information aboutthe fate of Ar within the lattice would be necessaryto formulate a reasonable hypothesis to explainsuch texturing phenomena.Removal of some Ar by annealing at T P 1073
K leads to the stabilisation of the monoclinicphase of ZrO2. An interesting turning point is 1073K. At this temperature the Ar concentration di-minishes to 3% and a mixture of the cubic/tetrag-onal phase, detected by XRD (cf. Fig. 3) and themonoclinic phase, detected by FTIR (cf. Fig. 5) isfound for this sample. The different informationprovided by the two techniques is not contradic-tory because of the different length of coherentdomains required to yield XRD peaks or FTIRbands. In the second case the existence of localorder extending to a limited number of atom shellsis enough to produce the bands. In this way, thebands detected after annealing at 1073 K consti-tute a trace of the crystal nuclei of the monoclinicphase developed at higher annealing temperature(cf. Fig. 5) that are then detected by both XRDand FTIR.Positron annihilation experiments have re-
vealed the incorporation of Ar in the ZrO2 filmsbecause of the observed changes in the W pa-rameter (Fig. 6). Very short positron diffusionlengths have been found for the as prepared layersindicating an amorphous initial state. The positrondiffusion length is shorter in the case of the(Arþ þOþ
2 )-ZrO2 samples than in the (Oþ2 )-ZrO2
samples. This is consistent with a larger amorphi-sation degree of the (Arþ þOþ
2 )-ZrO2 samples asmentioned above.S–W maps (Fig. 8) and plots of S andW versus
annealing temperature (Fig. 9) have been used tomonitor the defect structure of the films duringannealing. Two different stages were detected:(a) From room temperature to 773 K, an in-
crease of the S parameter is observed in both setsof samples (Fig. 9(a)). This is related to an increaseof the open volume in the samples. This increase issmaller in the samples with embedded Ar, indi-cating that the trapping centres are filled with the
Ar gas. TheW parameter decreases (Fig. 9(b)) butit is always higher for the (Arþ þOþ
2 )-ZrO2 sam-ples than for the (Oþ
2 )-ZrO2 samples, reflecting theincorporation of heavier argon ions.(b) After 773 K a progressive crystallisation of
the samples is observed. The open volume de-creases with temperature, as shown in Fig. 9(a).The (Arþ þOþ
2 )-ZrO2 samples always present alower open volume fraction and the S–W clusterpoints (Fig. 8) approach the values of an Y-dopedzirconia single crystal. It is remarkable that after773 K, the cluster points lie on a straight linepointing towards the single crystal value. Thissuggest that there is only one type of defect thatare annealed out during sintering. The clusterpoints for the (Oþ
2 )-ZrO2 samples also turn to thesingle crystal value (Fig. 8) but always with ahigher S value (Fig. 9(a)). Only at high-annealingtemperatures (T P 1150 K), the cluster points areon the same straight line approaching the singlecrystal value. At these high temperatures the argonatoms starts to release and the cluster points ofboth type of samples approach each other, indi-cating a similar final state. It is interesting thatafter the loss of argon there is no increase of the Sparameter in the (Arþ þOþ
2 )-ZrO2 samples, thusindicating that the sites occupied by the argonatoms have been completely annealed.
5. Conclusions
Incorporation of Ar within the lattice of a ZrO2thin film induces modifications in the structure andmicrostructure of the films. Most significant is thefact that a cubic/tetragonal phase of ZrO2 can bestabilised by annealing at T 6 773 K, a tempera-ture at which Ar is still embedded within the lat-tice. Similar effects might have produced thestructural modifications reported for pure anddoped ZrO2 bulk [16,17] and thin films and othermaterials subjected to Arþ bombardment duringor after preparation. The comparison of thestructural evolution of Oþ
2 -ZrO2 and (Oþ2 þArþ)-
ZrO2 thin films suggest that ballistic interactionsare not the reason for the stabilisation of the cubic/tetragonal phase for the samples prepared with the(Oþ
2 þArþ) mixture. This paper suggests the pos-
344 J.P. Holgado et al. / Nucl. Instr. and Meth. in Phys. Res. B 194 (2002) 333–345

sibility of systematically using noble gas ‘‘doping’’as a way of controlling the structure and texturedevelopment of thin film materials. However,further studies are still necessary for a clear un-derstanding of the origin of the observed crys-tallographic effects in materials with Ar atomsembedded within their lattice. Understanding ofthese causes could lead to a systematic use of thistechnique for a tailored synthesis of thin ceramicfilms.
Acknowledgements
We want to express our acknowledgement toSpanish Ministry of Science and Technology(Project No. MAT2001-2820) and the DutchTechnology Foundation STW (Project No. GNS4901) and MULTIMETOX network for its fi-nancial support. We also want to thank the CNA(Sevilla) for the RBS measurements.
References
[1] H. Wendel, H. Holzschuh, H. Suhr, G. Erker, S. Dehnicke,
M. Mena, Mod. Phys. Lett. B 4 (1990) 1215.
[2] Y. Komatsu, T. Sato, S. Ito, K. Akadi, Thin Solid Films
341 (1999) 132.
[3] K. Izumi, M. Murakami, T. Deguchi, A. Morita, J. Am.
Ceram. Soc. 72 (1989) 1465.
[4] G.-Z. Cao, H.W. Brinkman, J. Meijerink, K.J. De Vries,
A.J. Burggraaf, J. Am. Ceram. Soc. 76 (1993) 2201.
[5] A.J. Appleby, Energy 7–8 (1996) 521.
[6] H.G. Scott, J. Mat. Sci. 10 (1975) 1527.
[7] B.E. Yoldas, J. Mat. Sci. 21 (1986) 1080.
[8] Y. Matsuzaki, M. Hishinuma, I. Yasuda, Thin Solid Films
340 (1999) 72.
[9] G. Garc�ııa, J. Casado, J. Llibre, J. Cifre, A. Figueras, S.Gal�ıı, J. Bassas, Chem. Vapour Depos. 3 (1997) 91.
[10] N. Sonnenberg, A.S. Longo, M.J. Cima, B.P. Chang, K.G.
Ressler, P.C. McIntyre, Y.P. Lin, J. Appl. Phys. 74 (1993)
1027.
[11] S.C. Moulzof, Y. Yu, D.J. Frankel, R.J. Lad, J. Vac. Sci.
Technol. A 15 (1997) 1211.
[12] G.K. Wolf, Nucl. Instr. and Meth. B 65 (1992) 107.
[13] Y.J. Mao, C.X. Ren, J. Yuan, F. Zhang, X.H. Lin, S.C.
Zon, J. Vac. Sci. Technol. A 15 (1997) 2687.
[14] T. Koch, P. Ziemann, Thin Solid Films 303 (1997) 122.
[15] N. Sommemberg, A.S. Longo,M.J. Cima, B.P. Chang, K.G.
O’Resiler, P.C. McIntyre, J. Appl. Phys. 74 (1993) 1027.
[16] P.J. Martin, J. Mat. Sci. 21 (1986) 1.
[17] H.M. Naguib, R. Kelly, J. Nucl. Mat. 35 (1970) 293.
[18] J.P. Holgado, J.P. Espin�oos, F. Yubero, A. Justo, M.
Oca~nna, J. Benitez, A.R. Gonz�aalez-Elipe, Thin Solid Films
377 (2000) 460.
[19] J.P. Espin�oos, A. Caballero, V.M. Jim�eenez, J.C. S�aanchez-
L�oopez, L. Contreras, D. Leinen, A.R. Gonz�aalez-Elipe,
Adv. Mat CVD 3 (1997) 219.
[20] F. Yubero, A. Stabel, A.R. Gonz�aalez-Elipe, J. Vac. Sci.Technol. A 16 (1998) 3477.
[21] D. Leinen, A. Caballero, A. Fern�aandez, J.P. Espin�oos, A.
Justo, A.R. Gonz�aalez-Elipe, J. Martin, B. Maurin-Perrier,
Thin Solid Films 272 (1996) 99.
[22] A. van Veen, J. Trace, Microprobe Tech. 8 (1&2) (1990) 1.
[23] L.R. Doolittle, Nucl. Instr. and Meth. Phys. Res. B9 (1985)
344.
[24] A. van Veen, H. Schut, J. de Vries, R.A. Hakvoort, M.R.
IJpma, in: P.J. Schultz, G.R. Massoumi, P.J. Simpson
(Eds.), Advanced Institute of Physics, Vol. 218, New York,
1991, p. 171.
[25] A.R. Gonz�aalez-Elipe, F. Yubero, J.P. Espin�oos, A. Cabal-
lero, M. Oca~nna, J.P. Holgado, J. Morales, Surf. Coat.
Technol. 125 (2000) 116.
[26] D.W. Berreman, Phys. Rev. 130 (1963) 2193.
[27] G.L. Bottger, A.L. Geddes, J. Chem. Phys. 46 (1967) 3000.
[28] F. Proix, M. Balkanski, Phys. Stat. Sol. 32 (1969) 119.
[29] J.S. Ahn, H.S. Choi, T.W. Noh, Phys. Rev. B 53 (1996)
10310.
[30] E. Anastassakis, B. Papanicloaou, I.M. Asher, J. Phys.
Chem. Solids 36 (1975) 667.
[31] C. Pecharrom�aan, M. Oca~nna, C.J. Serna, J. Appl. Phys. 80(1996) 33479.
[32] J.O’M. Bockris, B.E. Conway, R.E. White (Eds.), Modern
Aspects of Electrochemistry, Number 29, Plenum Press,
New York, 1996.
[33] F. Yubero, M. Oca~nna, A. Caballero, A.R. Gonzalez-Elipe,
Acta. Mater. 48 (2000) 4555.
[34] K.E. Sickafus, H. Matze, T. Hartmann, K. Yasuda, J.A.
Valdez, P. Chodak, M. Nastasi, R.A. Verrall, J. Nucl.
Mater. 274 (1999) 66.
J.P. Holgado et al. / Nucl. Instr. and Meth. in Phys. Res. B 194 (2002) 333–345 345