university of colorado 2013 annual financial report annual report... · 2013 annual financial...
TRANSCRIPT
UNIVERSITY OF COLORADO
2013 ANNUAL FINANCIAL REPORT
TABLE OF CONTENTS
PAGE Contents Board of Regents Photo ............................................................................................................. 1
From the President ..................................................................................................................... 2
Independent Auditors’ Report ................................................................................................... 3
Management’s Discussion and Analysis (Unaudited) ............................................................. 5
Basic Financial Statements
Statements of Net Position ................................................................................................... 18
Statements of Revenues, Expenses, and Changes in Net Position ..................................... 20
Statements of Cash Flows .................................................................................................... 22
Notes to Financial Statements .............................................................................................. 24
Note 1 – Basis of Presentation and Summary of Significant Accounting Policies ............ 24 Note 2 – Cash and Cash Equivalents ............................................................................... 37 Note 3 – Investments ........................................................................................................ 37 Note 4 – Accounts, Contributions, and Loans Receivable ................................................ 44 Note 5 – Capital Assets .................................................................................................... 45 Note 6 – Accrued Expenses ............................................................................................. 47 Note 7 – Compensated Absences and Other Postemployment Benefits ......................... 48 Note 8 – Unearned Revenue ............................................................................................ 50 Note 9 – Bonds and Capital Leases ................................................................................. 51 Note 10 – Other Liabilities ................................................................................................ 57 Note 11 – Unrestricted Net Position ................................................................................. 59 Note 12 – Spending Limitations ........................................................................................ 59 Note 13 – Scholarship Allowances ................................................................................... 60 Note 14 – Health Services Revenue ................................................................................. 61 Note 15 – Retirement Plans and Insurance Programs ..................................................... 61 Note 16 – Segment and Blended Component Unit Information ........................................ 67 Note 17 – Discretely Presented Component Units ........................................................... 69 Note 18 – Related Organizations, Joint Ventures, and Jointly Governed Organizations ................................................................... 73 Note 19 – Commitments and Contingencies .................................................................... 75 Note 20 – Subsequent Events .......................................................................................... 76
Required Supplementary Information
Funding Status of Other Postemployment Benefits .............................................................. 79
Funding Status of Alternate Medicare Plan ........................................................................... 79

1
The University of Colorado, Board of Regents, November 2013 Front Row: Mr. Kyle Hybl, 5th Congressional District; Dr. Irene Griego, 7th Congressional District; Chair, Mr. Michael Carrigan, 1st Congressional District; Vice Chair, Ms. Sue Sharkey, 4th Congressional District; Mr. Joseph Neguse, 2nd Congressional District. Back Row: Mr. Steve Bosley, At-Large; Dr. James Geddes, 6th Congressional District; Mr. Stephen Ludwig, At-Large; Mr. Glen Gallegos, 3rd Congressional District
2
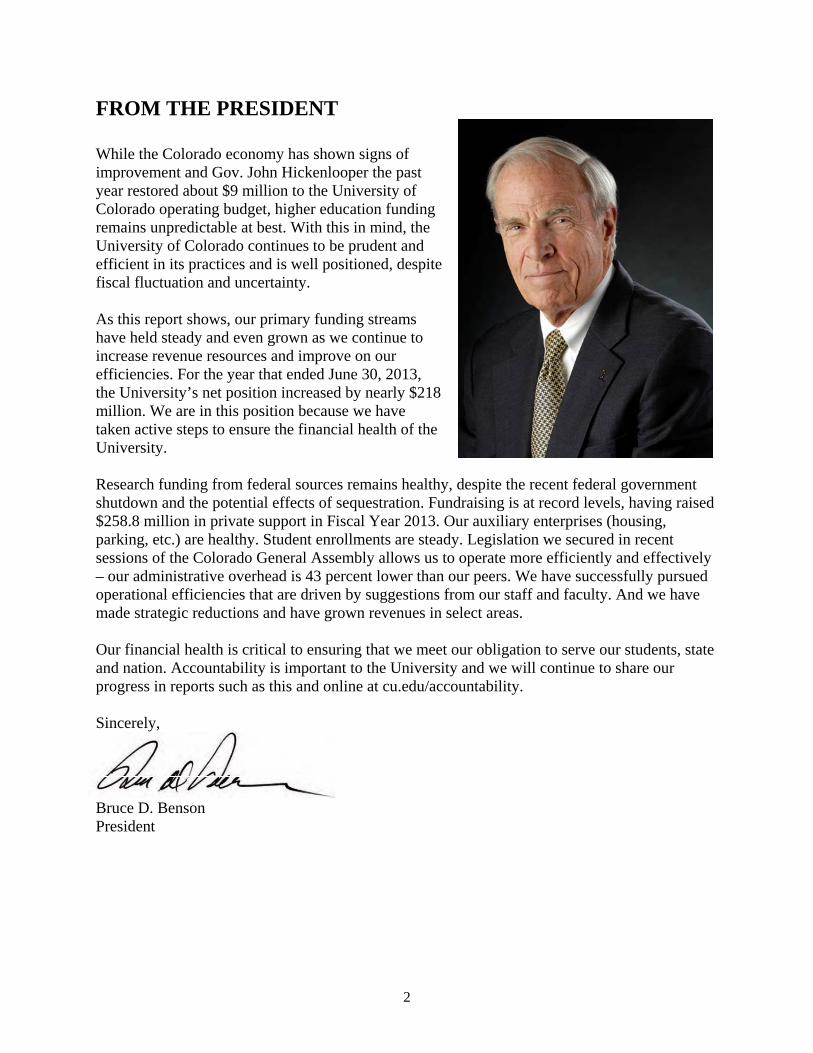
FROM THE PRESIDENT While the Colorado economy has shown signs of improvement and Gov. John Hickenlooper the past year restored about $9 million to the University of Colorado operating budget, higher education funding remains unpredictable at best. With this in mind, the University of Colorado continues to be prudent and efficient in its practices and is well positioned, despite fiscal fluctuation and uncertainty. As this report shows, our primary funding streams have held steady and even grown as we continue to increase revenue resources and improve on our efficiencies. For the year that ended June 30, 2013, the University’s net position increased by nearly $218 million. We are in this position because we have taken active steps to ensure the financial health of the University. Research funding from federal sources remains healthy, despite the recent federal government shutdown and the potential effects of sequestration. Fundraising is at record levels, having raised $258.8 million in private support in Fiscal Year 2013. Our auxiliary enterprises (housing, parking, etc.) are healthy. Student enrollments are steady. Legislation we secured in recent sessions of the Colorado General Assembly allows us to operate more efficiently and effectively – our administrative overhead is 43 percent lower than our peers. We have successfully pursued operational efficiencies that are driven by suggestions from our staff and faculty. And we have made strategic reductions and have grown revenues in select areas. Our financial health is critical to ensuring that we meet our obligation to serve our students, state and nation. Accountability is important to the University and we will continue to share our progress in reports such as this and online at cu.edu/accountability. Sincerely,
Bruce D. Benson President
3
INDEPENDENT AUDITORS' REPORT Members of the Legislative Audit Committee Report on the Financial Statements
We have audited the accompanying financial statements of the business-type activities and aggregate discretely presented component units of the University of Colorado (the University), an institution of higher education of the State of Colorado, as of and for the years ended June 30, 2013 and 2012, and the related notes to the financial statements, which collectively comprise the University’s basic financial statements as listed in the table of contents. Management’s Responsibility for the Financial Statements
Management is responsible for the preparation and fair presentation of these financial statements in accordance with accounting principles generally accepted in the United States of America; this includes the design, implementation, and maintenance of internal control relevant to the preparation and fair presentation of financial statements that are free from material misstatement, whether due to fraud or error. Auditors’ Responsibility
Our responsibility is to express opinions on these financial statements based on our audits. We did not audit the 2013 and 2012 financial statements of University Physicians, Inc. (UPI) a blended component unit, which represents approximately 6%, 9%, and 19%, respectively, of the assets, net position, and revenues of the business-type activities of the University for 2013 and 6%, 8%, and 15%, respectively, of the assets, net position, and revenues of the business-type activities of the University for 2012. In addition, we did not audit the 2013 and 2012 financial statements of the University of Colorado Foundation (CU Foundation) and the University of Colorado Real Estate Foundation (CUREF), which represent 100% of the assets, net position, and revenues of the aggregate discretely presented component units for 2013 and 2012. Those financial statements were audited by other auditors whose report has been furnished to us, and our opinions, insofar as it relates to the amounts included for UPI, CU Foundation, and CUREF, are based solely on the reports of the other auditors. We conducted our audits in accordance with auditing standards generally accepted in the United States of America and the standards applicable to financial audits contained in Government Auditing Standards, issued by the Comptroller General of the United States. Those standards require that we plan and perform the audit to obtain reasonable assurance about whether the financial statements are free from material misstatement. The financial statements of the CU Foundation and CUREF, discretely presented component units, and UPI, a blended component unit, were not audited in accordance with Government Auditing Standards. An audit involves performing procedures to obtain audit evidence about the amounts and disclosures in the financial statements. The procedures selected depend on the auditors’ judgment, including the assessment of the risks of material misstatement of the financial statements, whether due to fraud or error. In making those risk assessments, the auditor considers internal control relevant to the entity’s preparation and fair presentation of the financial statements in order to design audit procedures that are appropriate in the circumstances, but not for the purpose of expressing an opinion on the effectiveness of the entity’s internal control. Accordingly, we express no such opinion. An audit also includes evaluating the appropriateness of accounting policies used and the reasonableness of significant accounting estimates made by management, as well as evaluating the overall presentation of the financial statements.
An independent member of Nexia International
CliftonLarsonAllen LLP CLAconnect.com
4
We believe that the audit evidence we have obtained is sufficient and appropriate to provide a basis for our audit opinions. Opinions
In our opinion, based on our audits and the reports of other auditors, the financial statements referred to above present fairly, in all material respects, the respective financial position of the business-type activities and the aggregate discretely presented component units of the University of Colorado as of June 30, 2013 and 2012, and the respective changes in financial position and, where applicable, cash flows thereof for the year then ended in accordance with accounting principles generally accepted in the United States of America. Emphasis of Matter As discussed in Note 1, the financial statements of the University, an institution of higher education of the State of Colorado, are intended to present the financial position, the changes in financial position and cash flows of the business-type activities of only the University. Financial results for the State of Colorado are presented in separate state-wide financial statements prepared by the Office of the State Controller and audited by the Office of the State Auditor. Complete financial information for the State of Colorado is available in these state-wide financial statements. Our opinion is not modified with respect to this matter. Other Matters
Required Supplementary Information
Accounting principles generally accepted in the United States of America require that other the management’s discussion and analysis on pages 5 through 17 and the funding status of Other Post Employment Benefits and the Alternate Medicare Plan on page 79 be presented to supplement the basic financial statements. Such information, although not a part of the basic financial statements, is required by the Governmental Accounting Standards Board who considers it to be an essential part of financial reporting for placing the basic financial statements in an appropriate operational, economic, or historical context. We have applied certain limited procedures to the required supplementary information in accordance with auditing standards generally accepted in the United States of America, which consisted of inquiries of management about the methods of preparing the information and comparing the information for consistency with management’s responses to our inquiries, the basic financial statements, and other knowledge we obtained during our audits of the basic financial statements. We do not express an opinion or provide any assurance on the information because the limited procedures do not provide us with sufficient evidence to express an opinion or provide any assurance. Other Reporting Required by Government Auditing Standards
In accordance with Government Auditing Standards, we have also issued a report dated November 14, 2013 on our consideration of the University’s internal control over financial reporting and on our tests of its compliance with certain provisions of laws, regulations, contracts, and grant agreements and other matters. The purpose of that report is to describe the scope of our testing of internal control over financial reporting and compliance and the results of that testing, and not to provide an opinion on the internal control over financial reporting or on compliance. That report is an integral part of an audit performed in accordance with Government Auditing Standards in considering the University’s internal control over financial reporting and compliance.
a Greenwood Village, Colorado November 14, 2013
UNIVERSITY OF COLORADO MANAGEMENT’S DISCUSSION AND ANALYSIS
June 30, 2013 and 2012 (unaudited)
5
Management is pleased to present this financial discussion and analysis of the University of Colorado (the University). It is intended to make the University’s financial statements easier to understand and communicate our financial situation in an open, accountable, and transparent manner. It provides an analysis of the University’s position and results of operations for the years ended June 30, 2013 and 2012 (Fiscal Year 2013 and 2012, respectively), with comparative information for the year ended June 30, 2011. University management is responsible for the completeness and fairness of this discussion and analysis and the financial statements. UNDERSTANDING THE FINANCIAL STATEMENTS Statements of Net Position present the assets, deferred outflows, liabilities, and net position of the University at a point in time (June 30, 2013 and 2012). Their purpose is to present a financial snapshot of the University. They aid readers in determining the assets available to continue the University’s operations; how much the University owes to employees, vendors, and investors; and a picture of net position and the availability of assets for expenditure by the University. Statements of Revenues, Expenses, and Changes in Net Position present the total revenues and expenses of the University for operating, nonoperating, and other undertakings during the fiscal years ended June 30, 2013 and 2012. Their purpose is to assess the University’s operating and nonoperating activities. Statements of Cash Flows present cash receipts and payments of the University during the fiscal years ended June 30, 2013 and 2012. Their purpose is to assess the University’s ability to generate net cash flows and meet its obligations as they come due. Notes to the Financial Statements present additional information to support the financial statements and are commonly referred to as “Notes.” Their purpose is to clarify and expand on the information in the financial statements. Notes are referenced in this discussion to indicate where details of the financial highlights may be found. Required Supplementary Information (RSI) presents additional information that differs from the basic financial statements in that the auditor applies certain limited procedures in reviewing the information. In this report, RSI includes the funding status of other postemployment benefits and the Alternate Medicare Plan, as well as this management’s discussion and analysis. It is important to combine this financial analysis and discussion with relevant nonfinancial indicators to assess the overall state of the University. Examples of nonfinancial indicators include trend and quality of applicants, freshman class size, student retention, building condition, and campus safety. Information about nonfinancial indicators is not included in this analysis but may be obtained from the University’s Office of Institutional Research (see www.cu.edu/ir). Additional information may be obtained at the University’s Accountability Data Center (see www.cu.edu/accountability.
UNIVERSITY OF COLORADO MANAGEMENT’S DISCUSSION AND ANALYSIS
June 30, 2013 and 2012 (unaudited)
6
FINANCIAL HIGHLIGHTS Increases in net position during a period of declining budgets are one indicator of concerted planning on the part of University management to address previous and anticipated future funding reductions. For each of the two past fiscal years, the University has managed to increase its net position. The University’s net position increased by $217,859,000 for the year ended June 30, 2013. Selected financial highlights for the fiscal year ended June 30, 2013 include: University assets total $5,166,712,000, deferred outflows of resources (representing loss on bond
refundings) total $39,407,000, and liabilities total $2,183,557,000, resulting in net position of $3,022,562,000. Of this amount, $1,579,724,000 is the net investment in capital assets, $32,861,000 is restricted for nonexpendable purposes, meaning only the earnings on the related investments may be used for purposes dictated by the resource provider, and $390,116,000 is restricted for purposes for which the donor, grantor, or other external party intended. The remaining unrestricted is available to be used to meet the University’s ongoing financial obligations. Please note the inclusion of the deferred outflows of resources is the result of the University’s adoption of Governmental Accounting Standards Board Statement No. 65 Items Previously Reported as Assets and Liabilities. See Note 1 for additional information.
The significant factors impacting the increase in net position include increases in student tuition and
fee revenue due to increased rates, increases in auxiliary revenue due to the PAC-12 distributions, the new operation of the Health and Wellness facility on the University of Colorado Anschutz Medical Campus, increases in net health services revenue from University Physicians Inc. (UPI), a blended component unit, and increases in unrealized gains.
In total, operating revenues increased approximately 4.6 percent in Fiscal Year 2013 while operating
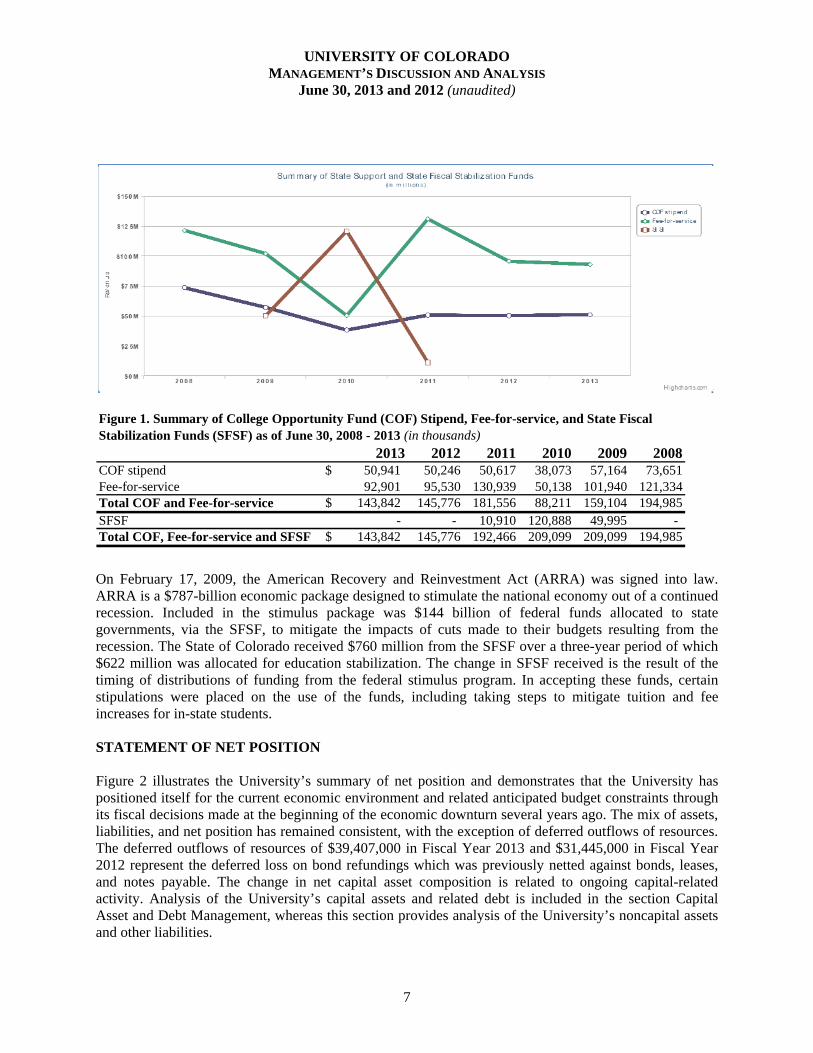
expenses increased 5.8 percent. For comparative purposes, operating revenues increased 4.0 percent in Fiscal Year 2012 while operating expenses increased 3.6 percent. Figure 1 demonstrates the six-year trend in State support. In Fiscal Years 2011, 2010, and 2009 the University also received State Fiscal Stabilization Funds (SFSF) of $10,910,000, $120,888,000, and $49,995,000, respectively, from the federal government to make up for the cuts to State funding. No such funding was available in Fiscal Year 2012 or Fiscal Year 2013 and no further funding of this type is expected.
UNIVERSITY OF COLORADO MANAGEMENT’S DISCUSSION AND ANALYSIS
June 30, 2013 and 2012 (unaudited)
7
2013 2012 2011 2010 2009 2008COF stipend 50,941$ 50,246 50,617 38,073 57,164 73,651Fee-for-service 92,901 95,530 130,939 50,138 101,940 121,334Total COF and Fee-for-service 143,842$ 145,776 181,556 88,211 159,104 194,985SFSF - - 10,910 120,888 49,995 - Total COF, Fee-for-service and SFSF 143,842$ 145,776 192,466 209,099 209,099 194,985
Figure 1. Summary of College Opportunity Fund (COF) Stipend, Fee-for-service, and State Fiscal Stabilization Funds (SFSF) as of June 30, 2008 - 2013 (in thousands)
On February 17, 2009, the American Recovery and Reinvestment Act (ARRA) was signed into law. ARRA is a $787-billion economic package designed to stimulate the national economy out of a continued recession. Included in the stimulus package was $144 billion of federal funds allocated to state governments, via the SFSF, to mitigate the impacts of cuts made to their budgets resulting from the recession. The State of Colorado received $760 million from the SFSF over a three-year period of which $622 million was allocated for education stabilization. The change in SFSF received is the result of the timing of distributions of funding from the federal stimulus program. In accepting these funds, certain stipulations were placed on the use of the funds, including taking steps to mitigate tuition and fee increases for in-state students. STATEMENT OF NET POSITION Figure 2 illustrates the University’s summary of net position and demonstrates that the University has positioned itself for the current economic environment and related anticipated budget constraints through its fiscal decisions made at the beginning of the economic downturn several years ago. The mix of assets, liabilities, and net position has remained consistent, with the exception of deferred outflows of resources. The deferred outflows of resources of $39,407,000 in Fiscal Year 2013 and $31,445,000 in Fiscal Year 2012 represent the deferred loss on bond refundings which was previously netted against bonds, leases, and notes payable. The change in net capital asset composition is related to ongoing capital-related activity. Analysis of the University’s capital assets and related debt is included in the section Capital Asset and Debt Management, whereas this section provides analysis of the University’s noncapital assets and other liabilities.
UNIVERSITY OF COLORADO MANAGEMENT’S DISCUSSION AND ANALYSIS
June 30, 2013 and 2012 (unaudited)
8
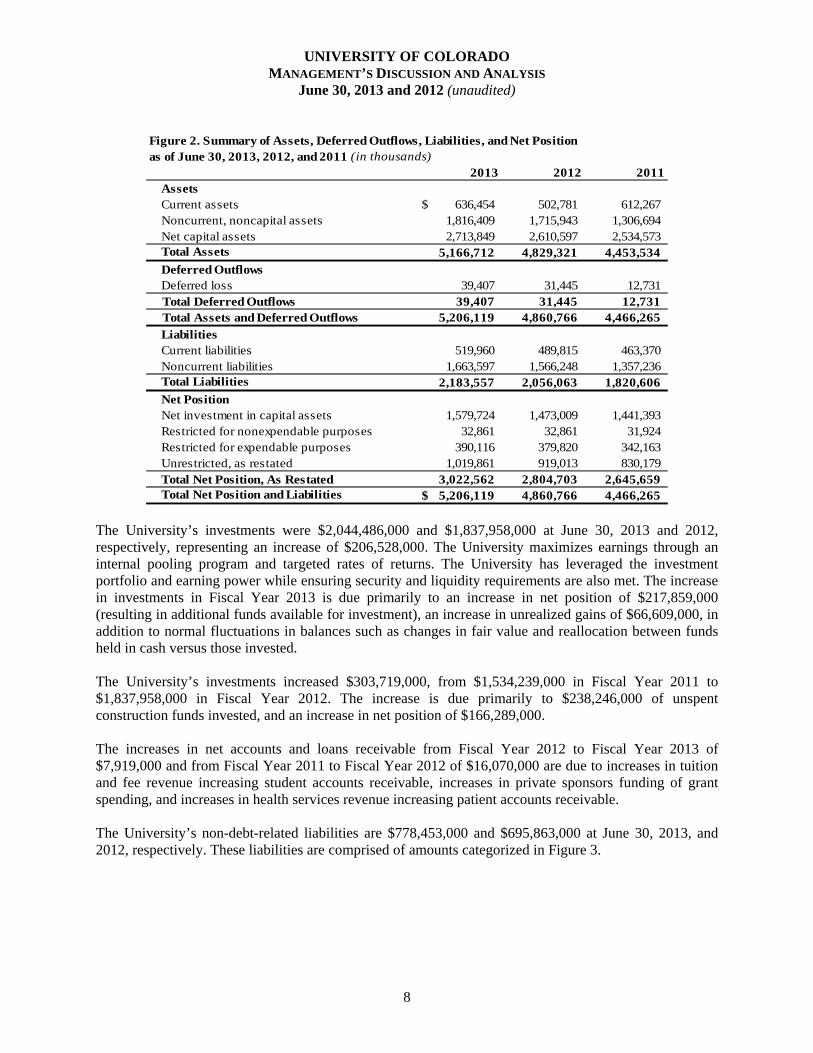
Figure 2. Summary of Assets, Deferred Outflows, Liabilities, and Net Positionas of June 30, 2013, 2012, and 2011 (in thousands)
2013 2012 2011AssetsCurrent assets 636,454$ 502,781 612,267Noncurrent, noncapital assets 1,816,409 1,715,943 1,306,694 Net capital assets 2,713,849 2,610,597 2,534,573 Total Assets 5,166,712 4,829,321 4,453,534
Deferred OutflowsDeferred loss 39,407 31,445 12,731
Total Deferred Outflows 39,407 31,445 12,731 Total Assets and Deferred Outflows 5,206,119 4,860,766 4,466,265
LiabilitiesCurrent liabilities 519,960 489,815 463,370Noncurrent liabilities 1,663,597 1,566,248 1,357,236 Total Liabilities 2,183,557 2,056,063 1,820,606Net PositionNet investment in capital assets 1,579,724 1,473,009 1,441,393Restricted for nonexpendable purposes 32,861 32,861 31,924 Restricted for expendable purposes 390,116 379,820 342,163 Unrestricted, as restated 1,019,861 919,013 830,179 Total Net Position, As Restated 3,022,562 2,804,703 2,645,659Total Net Position and Liabilities 5,206,119$ 4,860,766 4,466,265
The University’s investments were $2,044,486,000 and $1,837,958,000 at June 30, 2013 and 2012, respectively, representing an increase of $206,528,000. The University maximizes earnings through an internal pooling program and targeted rates of returns. The University has leveraged the investment portfolio and earning power while ensuring security and liquidity requirements are also met. The increase in investments in Fiscal Year 2013 is due primarily to an increase in net position of $217,859,000 (resulting in additional funds available for investment), an increase in unrealized gains of $66,609,000, in addition to normal fluctuations in balances such as changes in fair value and reallocation between funds held in cash versus those invested. The University’s investments increased $303,719,000, from $1,534,239,000 in Fiscal Year 2011 to $1,837,958,000 in Fiscal Year 2012. The increase is due primarily to $238,246,000 of unspent construction funds invested, and an increase in net position of $166,289,000. The increases in net accounts and loans receivable from Fiscal Year 2012 to Fiscal Year 2013 of $7,919,000 and from Fiscal Year 2011 to Fiscal Year 2012 of $16,070,000 are due to increases in tuition and fee revenue increasing student accounts receivable, increases in private sponsors funding of grant spending, and increases in health services revenue increasing patient accounts receivable. The University’s non-debt-related liabilities are $778,453,000 and $695,863,000 at June 30, 2013, and 2012, respectively. These liabilities are comprised of amounts categorized in Figure 3.
UNIVERSITY OF COLORADO MANAGEMENT’S DISCUSSION AND ANALYSIS
June 30, 2013 and 2012 (unaudited)
9
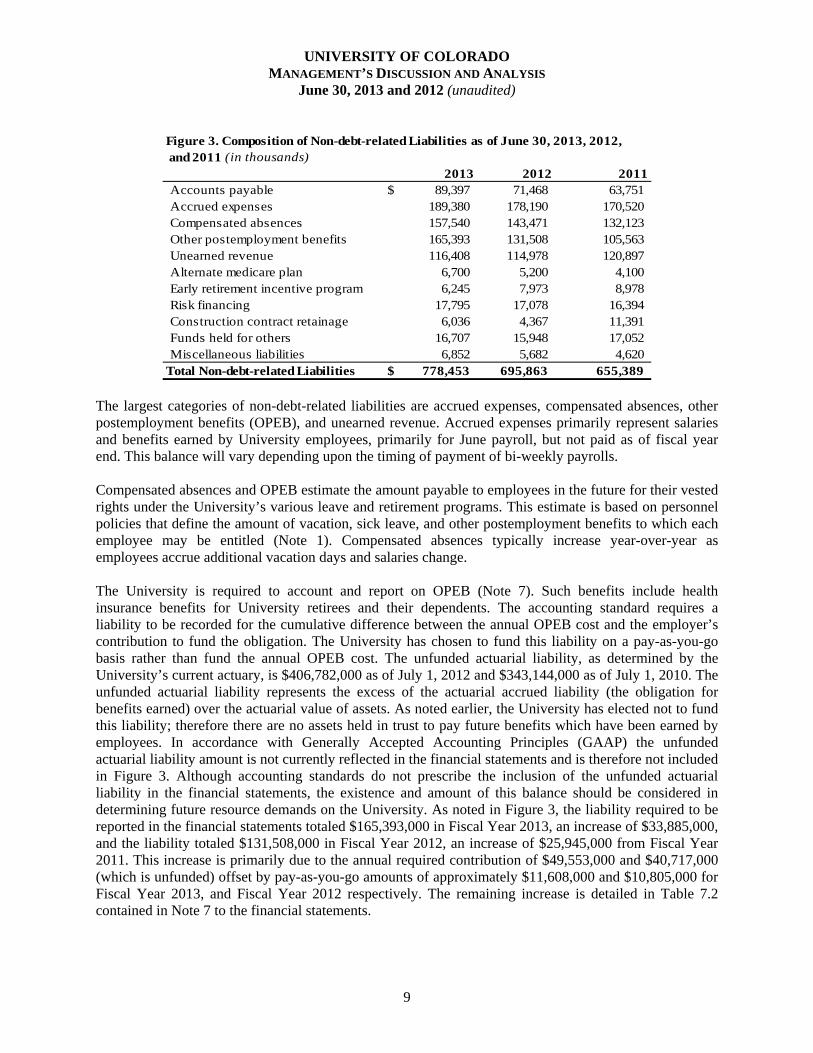
Figure 3. Composition of Non-debt-related Liabilities as of June 30, 2013, 2012, and 2011 (in thousands)
2013 2012 2011Accounts payable 89,397$ 71,468 63,751Accrued expenses 189,380 178,190 170,520Compensated absences 157,540 143,471 132,123Other postemployment benefits 165,393 131,508 105,563Unearned revenue 116,408 114,978 120,897Alternate medicare plan 6,700 5,200 4,100 Early retirement incentive program 6,245 7,973 8,978 Risk financing 17,795 17,078 16,394Construction contract retainage 6,036 4,367 11,391Funds held for others 16,707 15,948 17,052 Miscellaneous liabilities 6,852 5,682 4,620
Total Non-debt-related Liabilities 778,453$ 695,863 655,389 The largest categories of non-debt-related liabilities are accrued expenses, compensated absences, other postemployment benefits (OPEB), and unearned revenue. Accrued expenses primarily represent salaries and benefits earned by University employees, primarily for June payroll, but not paid as of fiscal year end. This balance will vary depending upon the timing of payment of bi-weekly payrolls. Compensated absences and OPEB estimate the amount payable to employees in the future for their vested rights under the University’s various leave and retirement programs. This estimate is based on personnel policies that define the amount of vacation, sick leave, and other postemployment benefits to which each employee may be entitled (Note 1). Compensated absences typically increase year-over-year as employees accrue additional vacation days and salaries change. The University is required to account and report on OPEB (Note 7). Such benefits include health insurance benefits for University retirees and their dependents. The accounting standard requires a liability to be recorded for the cumulative difference between the annual OPEB cost and the employer’s contribution to fund the obligation. The University has chosen to fund this liability on a pay-as-you-go basis rather than fund the annual OPEB cost. The unfunded actuarial liability, as determined by the University’s current actuary, is $406,782,000 as of July 1, 2012 and $343,144,000 as of July 1, 2010. The unfunded actuarial liability represents the excess of the actuarial accrued liability (the obligation for benefits earned) over the actuarial value of assets. As noted earlier, the University has elected not to fund this liability; therefore there are no assets held in trust to pay future benefits which have been earned by employees. In accordance with Generally Accepted Accounting Principles (GAAP) the unfunded actuarial liability amount is not currently reflected in the financial statements and is therefore not included in Figure 3. Although accounting standards do not prescribe the inclusion of the unfunded actuarial liability in the financial statements, the existence and amount of this balance should be considered in determining future resource demands on the University. As noted in Figure 3, the liability required to be reported in the financial statements totaled $165,393,000 in Fiscal Year 2013, an increase of $33,885,000, and the liability totaled $131,508,000 in Fiscal Year 2012, an increase of $25,945,000 from Fiscal Year 2011. This increase is primarily due to the annual required contribution of $49,553,000 and $40,717,000 (which is unfunded) offset by pay-as-you-go amounts of approximately $11,608,000 and $10,805,000 for Fiscal Year 2013, and Fiscal Year 2012 respectively. The remaining increase is detailed in Table 7.2 contained in Note 7 to the financial statements.
UNIVERSITY OF COLORADO MANAGEMENT’S DISCUSSION AND ANALYSIS
June 30, 2013 and 2012 (unaudited)
10
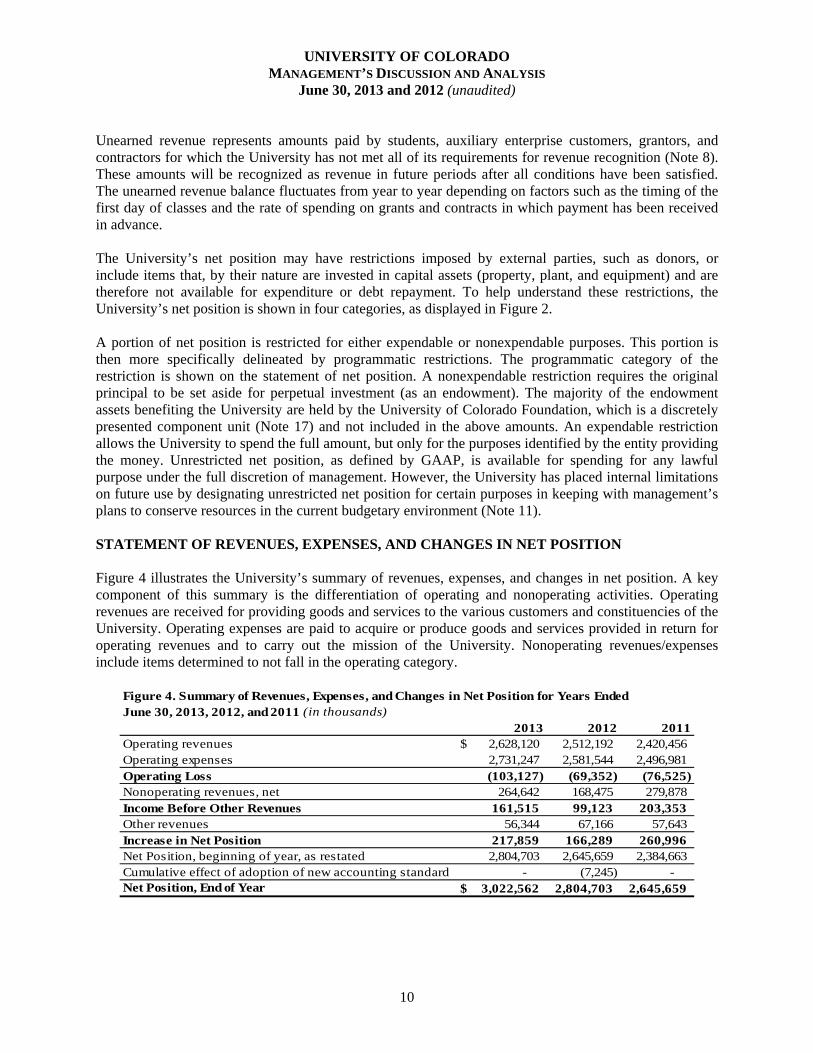
Unearned revenue represents amounts paid by students, auxiliary enterprise customers, grantors, and contractors for which the University has not met all of its requirements for revenue recognition (Note 8). These amounts will be recognized as revenue in future periods after all conditions have been satisfied. The unearned revenue balance fluctuates from year to year depending on factors such as the timing of the first day of classes and the rate of spending on grants and contracts in which payment has been received in advance. The University’s net position may have restrictions imposed by external parties, such as donors, or include items that, by their nature are invested in capital assets (property, plant, and equipment) and are therefore not available for expenditure or debt repayment. To help understand these restrictions, the University’s net position is shown in four categories, as displayed in Figure 2. A portion of net position is restricted for either expendable or nonexpendable purposes. This portion is then more specifically delineated by programmatic restrictions. The programmatic category of the restriction is shown on the statement of net position. A nonexpendable restriction requires the original principal to be set aside for perpetual investment (as an endowment). The majority of the endowment assets benefiting the University are held by the University of Colorado Foundation, which is a discretely presented component unit (Note 17) and not included in the above amounts. An expendable restriction allows the University to spend the full amount, but only for the purposes identified by the entity providing the money. Unrestricted net position, as defined by GAAP, is available for spending for any lawful purpose under the full discretion of management. However, the University has placed internal limitations on future use by designating unrestricted net position for certain purposes in keeping with management’s plans to conserve resources in the current budgetary environment (Note 11). STATEMENT OF REVENUES, EXPENSES, AND CHANGES IN NET POSITION Figure 4 illustrates the University’s summary of revenues, expenses, and changes in net position. A key component of this summary is the differentiation of operating and nonoperating activities. Operating revenues are received for providing goods and services to the various customers and constituencies of the University. Operating expenses are paid to acquire or produce goods and services provided in return for operating revenues and to carry out the mission of the University. Nonoperating revenues/expenses include items determined to not fall in the operating category.
Figure 4. Summary of Revenues, Expenses, and Changes in Net Position for Years EndedJune 30, 2013, 2012, and 2011 (in thousands)
2013 2012 2011Operating revenues 2,628,120$ 2,512,192 2,420,456 Operating expenses 2,731,247 2,581,544 2,496,981 Operating Loss (103,127) (69,352) (76,525) Nonoperating revenues, net 264,642 168,475 279,878 Income Before Other Revenues 161,515 99,123 203,353 Other revenues 56,344 67,166 57,643 Increase in Net Position 217,859 166,289 260,996 Net Position, beginning of year, as restated 2,804,703 2,645,659 2,384,663 Cumulative effect of adoption of new accounting standard - (7,245) - Net Position, End of Year 3,022,562$ 2,804,703 2,645,659
UNIVERSITY OF COLORADO MANAGEMENT’S DISCUSSION AND ANALYSIS
June 30, 2013 and 2012 (unaudited)
11
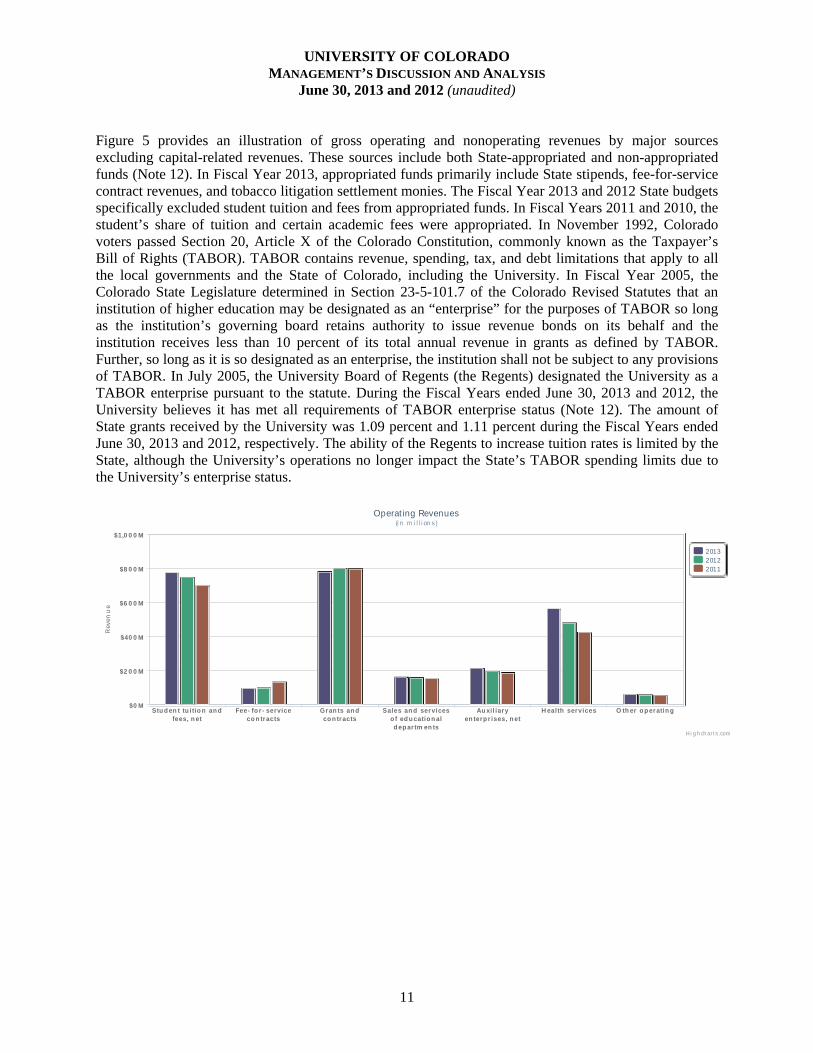
Figure 5 provides an illustration of gross operating and nonoperating revenues by major sources excluding capital-related revenues. These sources include both State-appropriated and non-appropriated funds (Note 12). In Fiscal Year 2013, appropriated funds primarily include State stipends, fee-for-service contract revenues, and tobacco litigation settlement monies. The Fiscal Year 2013 and 2012 State budgets specifically excluded student tuition and fees from appropriated funds. In Fiscal Years 2011 and 2010, the student’s share of tuition and certain academic fees were appropriated. In November 1992, Colorado voters passed Section 20, Article X of the Colorado Constitution, commonly known as the Taxpayer’s Bill of Rights (TABOR). TABOR contains revenue, spending, tax, and debt limitations that apply to all the local governments and the State of Colorado, including the University. In Fiscal Year 2005, the Colorado State Legislature determined in Section 23-5-101.7 of the Colorado Revised Statutes that an institution of higher education may be designated as an “enterprise” for the purposes of TABOR so long as the institution’s governing board retains authority to issue revenue bonds on its behalf and the institution receives less than 10 percent of its total annual revenue in grants as defined by TABOR. Further, so long as it is so designated as an enterprise, the institution shall not be subject to any provisions of TABOR. In July 2005, the University Board of Regents (the Regents) designated the University as a TABOR enterprise pursuant to the statute. During the Fiscal Years ended June 30, 2013 and 2012, the University believes it has met all requirements of TABOR enterprise status (Note 12). The amount of State grants received by the University was 1.09 percent and 1.11 percent during the Fiscal Years ended June 30, 2013 and 2012, respectively. The ability of the Regents to increase tuition rates is limited by the State, although the University’s operations no longer impact the State’s TABOR spending limits due to the University’s enterprise status.
Rev
enu
e
Operat ing Revenues(i n m i l l i on s)
201320122011
Stu d en t tu itio n an dfees, n et
Fee- fo r- serviceco n tracts
Gran ts an dco n tracts
Sales an d serviceso f ed u catio n ald ep artm en ts
Au xil iaryen terp r ises, n et
H ealth services O th er o p eratin g$0 M
$2 0 0 M
$40 0 M
$6 0 0 M
$8 0 0 M
$1,0 0 0 M
H i g h ch art s.com
UNIVERSITY OF COLORADO MANAGEMENT’S DISCUSSION AND ANALYSIS
June 30, 2013 and 2012 (unaudited)
12
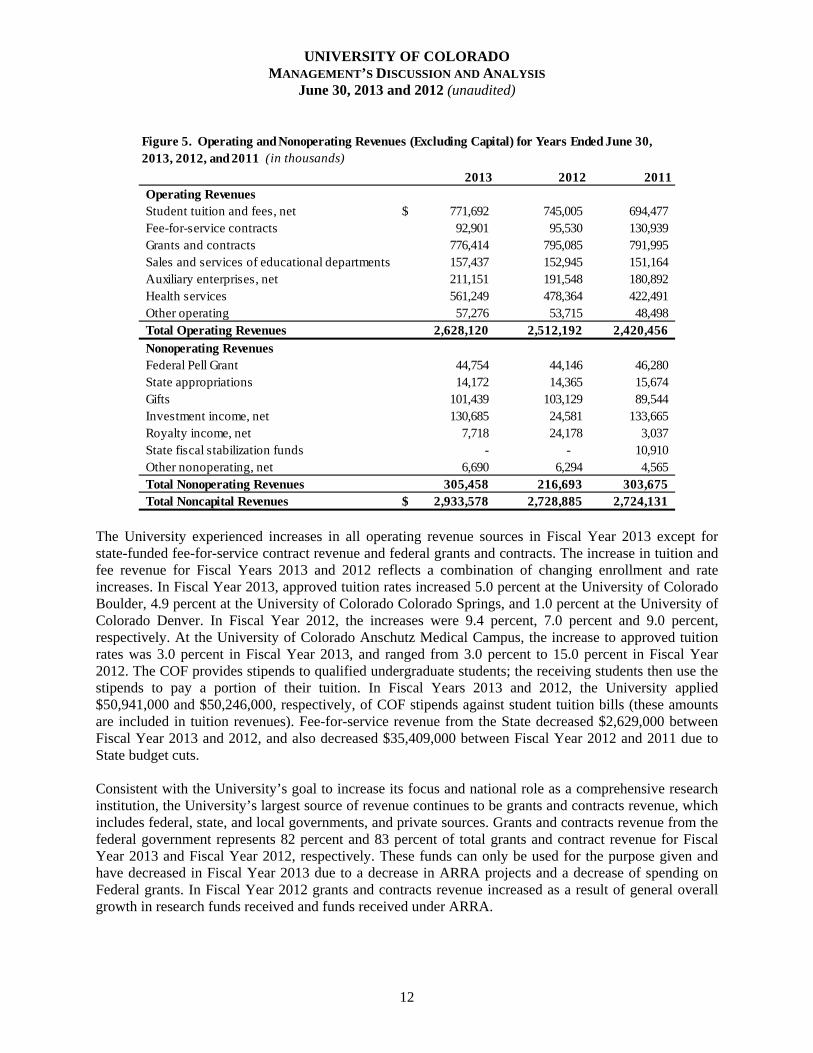
2013 2012 2011Operating RevenuesStudent tuition and fees, net 771,692$ 745,005 694,477 Fee-for-service contracts 92,901 95,530 130,939 Grants and contracts 776,414 795,085 791,995 Sales and services of educational departments 157,437 152,945 151,164 Auxiliary enterprises, net 211,151 191,548 180,892 Health services 561,249 478,364 422,491 Other operating 57,276 53,715 48,498 Total Operating Revenues 2,628,120 2,512,192 2,420,456
Nonoperating RevenuesFederal Pell Grant 44,754 44,146 46,280 State appropriations 14,172 14,365 15,674 Gifts 101,439 103,129 89,544 Investment income, net 130,685 24,581 133,665 Royalty income, net 7,718 24,178 3,037 State fiscal stabilization funds - - 10,910 Other nonoperating, net 6,690 6,294 4,565 Total Nonoperating Revenues 305,458 216,693 303,675 Total Noncapital Revenues 2,933,578$ 2,728,885 2,724,131
Figure 5. Operating and Nonoperating Revenues (Excluding Capital) for Years Ended June 30, 2013, 2012, and 2011 (in thousands)
The University experienced increases in all operating revenue sources in Fiscal Year 2013 except for state-funded fee-for-service contract revenue and federal grants and contracts. The increase in tuition and fee revenue for Fiscal Years 2013 and 2012 reflects a combination of changing enrollment and rate increases. In Fiscal Year 2013, approved tuition rates increased 5.0 percent at the University of Colorado Boulder, 4.9 percent at the University of Colorado Colorado Springs, and 1.0 percent at the University of Colorado Denver. In Fiscal Year 2012, the increases were 9.4 percent, 7.0 percent and 9.0 percent, respectively. At the University of Colorado Anschutz Medical Campus, the increase to approved tuition rates was 3.0 percent in Fiscal Year 2013, and ranged from 3.0 percent to 15.0 percent in Fiscal Year 2012. The COF provides stipends to qualified undergraduate students; the receiving students then use the stipends to pay a portion of their tuition. In Fiscal Years 2013 and 2012, the University applied $50,941,000 and $50,246,000, respectively, of COF stipends against student tuition bills (these amounts are included in tuition revenues). Fee-for-service revenue from the State decreased $2,629,000 between Fiscal Year 2013 and 2012, and also decreased $35,409,000 between Fiscal Year 2012 and 2011 due to State budget cuts. Consistent with the University’s goal to increase its focus and national role as a comprehensive research institution, the University’s largest source of revenue continues to be grants and contracts revenue, which includes federal, state, and local governments, and private sources. Grants and contracts revenue from the federal government represents 82 percent and 83 percent of total grants and contract revenue for Fiscal Year 2013 and Fiscal Year 2012, respectively. These funds can only be used for the purpose given and have decreased in Fiscal Year 2013 due to a decrease in ARRA projects and a decrease of spending on Federal grants. In Fiscal Year 2012 grants and contracts revenue increased as a result of general overall growth in research funds received and funds received under ARRA.
UNIVERSITY OF COLORADO MANAGEMENT’S DISCUSSION AND ANALYSIS
June 30, 2013 and 2012 (unaudited)
13
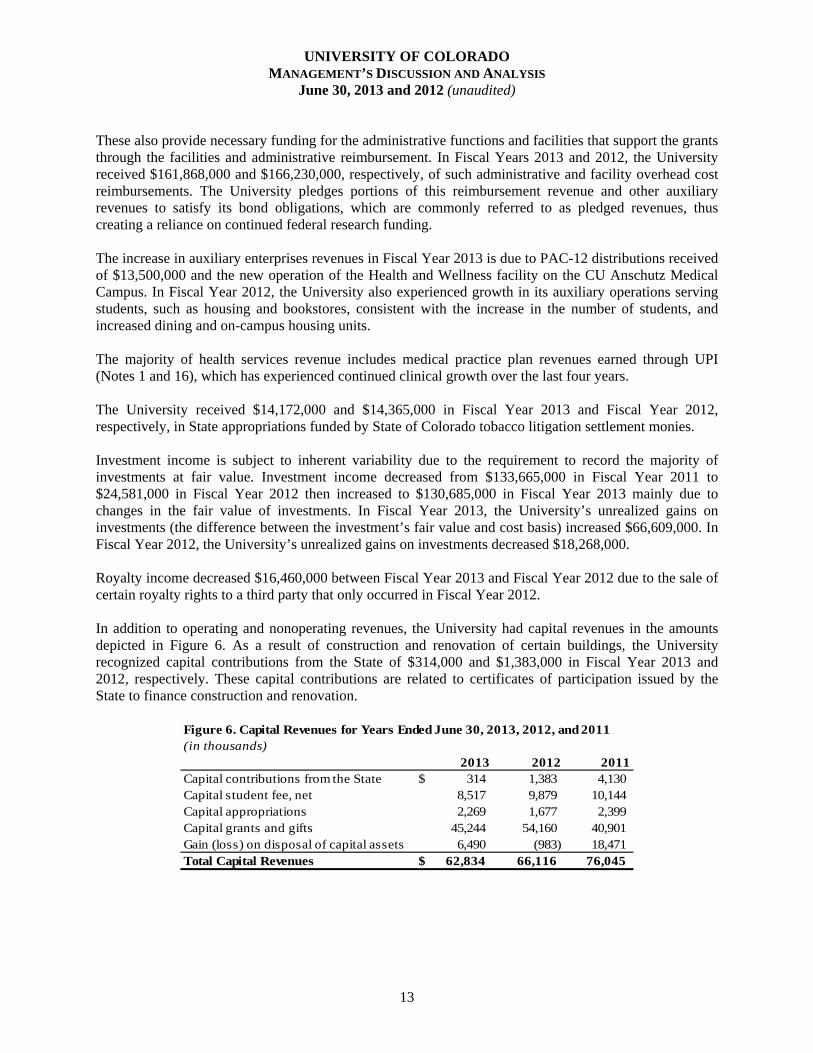
These also provide necessary funding for the administrative functions and facilities that support the grants through the facilities and administrative reimbursement. In Fiscal Years 2013 and 2012, the University received $161,868,000 and $166,230,000, respectively, of such administrative and facility overhead cost reimbursements. The University pledges portions of this reimbursement revenue and other auxiliary revenues to satisfy its bond obligations, which are commonly referred to as pledged revenues, thus creating a reliance on continued federal research funding. The increase in auxiliary enterprises revenues in Fiscal Year 2013 is due to PAC-12 distributions received of $13,500,000 and the new operation of the Health and Wellness facility on the CU Anschutz Medical Campus. In Fiscal Year 2012, the University also experienced growth in its auxiliary operations serving students, such as housing and bookstores, consistent with the increase in the number of students, and increased dining and on-campus housing units. The majority of health services revenue includes medical practice plan revenues earned through UPI (Notes 1 and 16), which has experienced continued clinical growth over the last four years. The University received $14,172,000 and $14,365,000 in Fiscal Year 2013 and Fiscal Year 2012, respectively, in State appropriations funded by State of Colorado tobacco litigation settlement monies. Investment income is subject to inherent variability due to the requirement to record the majority of investments at fair value. Investment income decreased from $133,665,000 in Fiscal Year 2011 to $24,581,000 in Fiscal Year 2012 then increased to $130,685,000 in Fiscal Year 2013 mainly due to changes in the fair value of investments. In Fiscal Year 2013, the University’s unrealized gains on investments (the difference between the investment’s fair value and cost basis) increased $66,609,000. In Fiscal Year 2012, the University’s unrealized gains on investments decreased $18,268,000. Royalty income decreased $16,460,000 between Fiscal Year 2013 and Fiscal Year 2012 due to the sale of certain royalty rights to a third party that only occurred in Fiscal Year 2012. In addition to operating and nonoperating revenues, the University had capital revenues in the amounts depicted in Figure 6. As a result of construction and renovation of certain buildings, the University recognized capital contributions from the State of $314,000 and $1,383,000 in Fiscal Year 2013 and 2012, respectively. These capital contributions are related to certificates of participation issued by the State to finance construction and renovation.
Figure 6. Capital Revenues for Years Ended June 30, 2013, 2012, and 2011(in thousands)
2013 2012 2011Capital contributions from the State 314$ 1,383 4,130 Capital student fee, net 8,517 9,879 10,144 Capital appropriations 2,269 1,677 2,399 Capital grants and gifts 45,244 54,160 40,901 Gain (loss) on disposal of capital assets 6,490 (983) 18,471 Total Capital Revenues 62,834$ 66,116 76,045
UNIVERSITY OF COLORADO MANAGEMENT’S DISCUSSION AND ANALYSIS
June 30, 2013 and 2012 (unaudited)
14
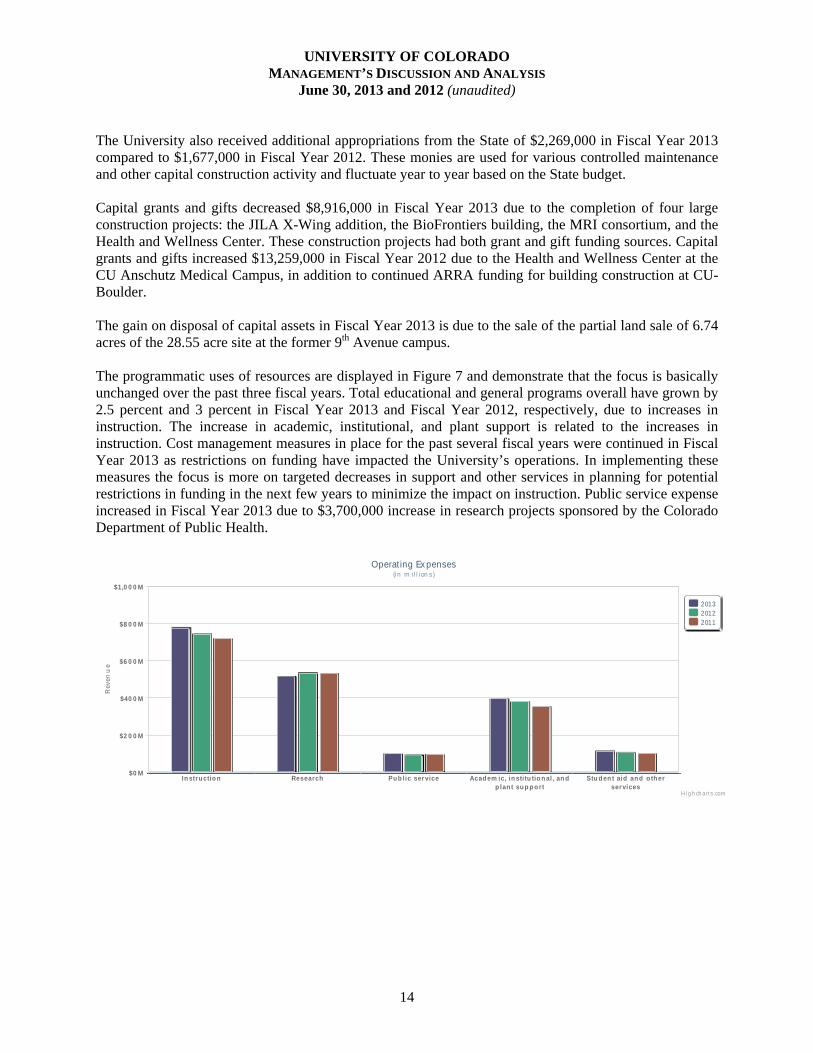
The University also received additional appropriations from the State of $2,269,000 in Fiscal Year 2013 compared to $1,677,000 in Fiscal Year 2012. These monies are used for various controlled maintenance and other capital construction activity and fluctuate year to year based on the State budget. Capital grants and gifts decreased $8,916,000 in Fiscal Year 2013 due to the completion of four large construction projects: the JILA X-Wing addition, the BioFrontiers building, the MRI consortium, and the Health and Wellness Center. These construction projects had both grant and gift funding sources. Capital grants and gifts increased $13,259,000 in Fiscal Year 2012 due to the Health and Wellness Center at the CU Anschutz Medical Campus, in addition to continued ARRA funding for building construction at CU-Boulder. The gain on disposal of capital assets in Fiscal Year 2013 is due to the sale of the partial land sale of 6.74 acres of the 28.55 acre site at the former 9th Avenue campus. The programmatic uses of resources are displayed in Figure 7 and demonstrate that the focus is basically unchanged over the past three fiscal years. Total educational and general programs overall have grown by 2.5 percent and 3 percent in Fiscal Year 2013 and Fiscal Year 2012, respectively, due to increases in instruction. The increase in academic, institutional, and plant support is related to the increases in instruction. Cost management measures in place for the past several fiscal years were continued in Fiscal Year 2013 as restrictions on funding have impacted the University’s operations. In implementing these measures the focus is more on targeted decreases in support and other services in planning for potential restrictions in funding in the next few years to minimize the impact on instruction. Public service expense increased in Fiscal Year 2013 due to $3,700,000 increase in research projects sponsored by the Colorado Department of Public Health.
Rev
enu
e
Operat ing Ex penses(i n m i l l i on s)
201320122011
In stru ctio n Research Pu b lic service Acad em ic, in sti tu tio n al , an dp lan t su p p o rt
Stu d en t aid an d o th erservices
$0 M
$2 0 0 M
$40 0 M
$6 0 0 M
$8 0 0 M
$1,0 0 0 M
Hi g h ch art s.com
UNIVERSITY OF COLORADO MANAGEMENT’S DISCUSSION AND ANALYSIS
June 30, 2013 and 2012 (unaudited)
15
Figure 7. Expense Program Categories for Years Ended June 30, 2013, 2012, and 2011(in thousands)
2013 2012 2011Instruction 774,465$ 738,736 716,349Research 511,162 530,198 529,463 Public service 98,606 89,032 94,954 Academic, institutional, and plant support 391,423 376,836 349,445 Student aid and other services 110,025 104,446 98,268 Total Education and General 1,885,681 1,839,248 1,788,479 Depreciation 170,478 153,680 140,025 Auxiliary enterprises 177,917 147,516 159,274 Health services 497,171 441,100 409,203 Total Operating Expenses 2,731,247$ 2,581,544 2,496,981
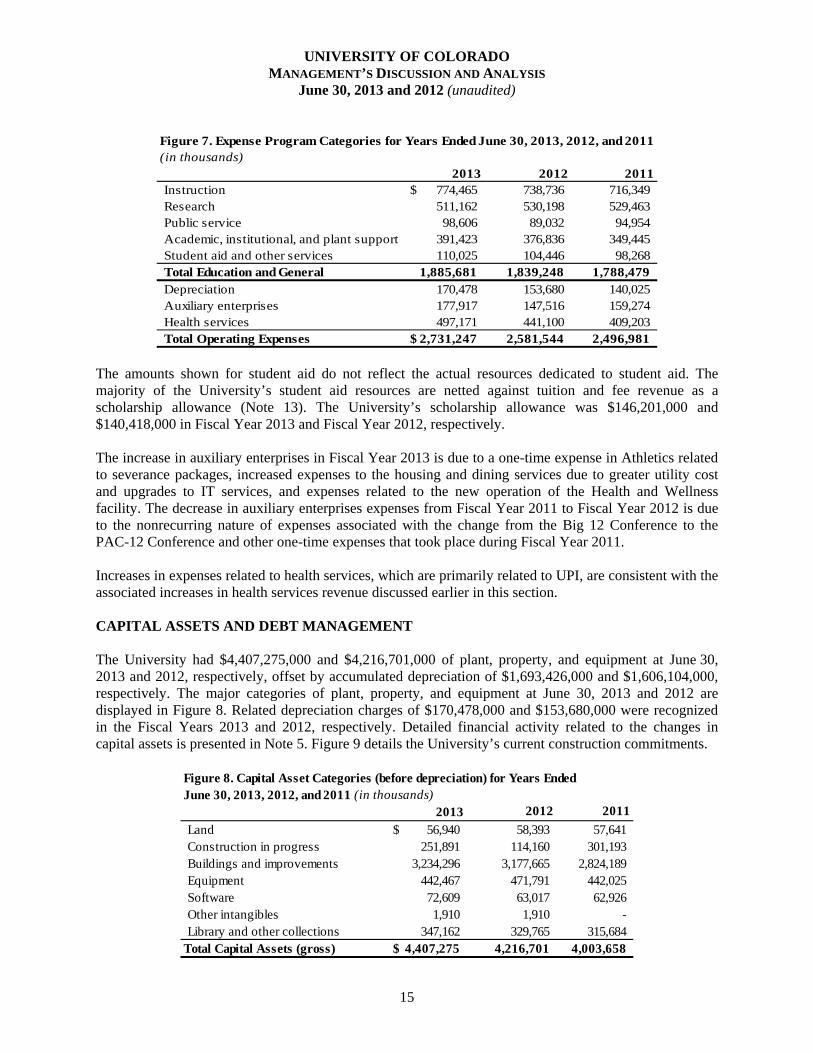
The amounts shown for student aid do not reflect the actual resources dedicated to student aid. The majority of the University’s student aid resources are netted against tuition and fee revenue as a scholarship allowance (Note 13). The University’s scholarship allowance was $146,201,000 and $140,418,000 in Fiscal Year 2013 and Fiscal Year 2012, respectively. The increase in auxiliary enterprises in Fiscal Year 2013 is due to a one-time expense in Athletics related to severance packages, increased expenses to the housing and dining services due to greater utility cost and upgrades to IT services, and expenses related to the new operation of the Health and Wellness facility. The decrease in auxiliary enterprises expenses from Fiscal Year 2011 to Fiscal Year 2012 is due to the nonrecurring nature of expenses associated with the change from the Big 12 Conference to the PAC-12 Conference and other one-time expenses that took place during Fiscal Year 2011. Increases in expenses related to health services, which are primarily related to UPI, are consistent with the associated increases in health services revenue discussed earlier in this section. CAPITAL ASSETS AND DEBT MANAGEMENT The University had $4,407,275,000 and $4,216,701,000 of plant, property, and equipment at June 30, 2013 and 2012, respectively, offset by accumulated depreciation of $1,693,426,000 and $1,606,104,000, respectively. The major categories of plant, property, and equipment at June 30, 2013 and 2012 are displayed in Figure 8. Related depreciation charges of $170,478,000 and $153,680,000 were recognized in the Fiscal Years 2013 and 2012, respectively. Detailed financial activity related to the changes in capital assets is presented in Note 5. Figure 9 details the University’s current construction commitments.
Figure 8. Capital Asset Categories (before depreciation) for Years Ended June 30, 2013, 2012, and 2011 (in thousands)
2013 2012 2011
Land 56,940$ 58,393 57,641 Construction in progress 251,891 114,160 301,193 Buildings and improvements 3,234,296 3,177,665 2,824,189 Equipment 442,467 471,791 442,025 Software 72,609 63,017 62,926 Other intangibles 1,910 1,910 - Library and other collections 347,162 329,765 315,684
Total Capital Assets (gross) 4,407,275$ 4,216,701 4,003,658
UNIVERSITY OF COLORADO MANAGEMENT’S DISCUSSION AND ANALYSIS
June 30, 2013 and 2012 (unaudited)
16
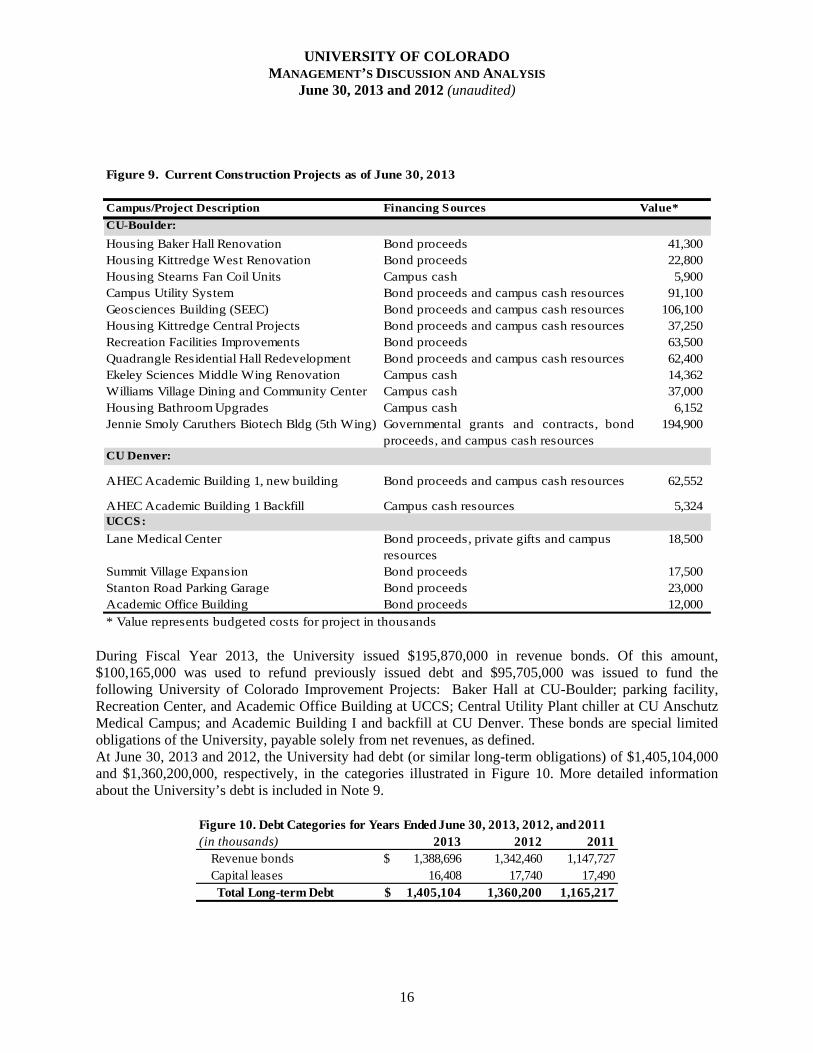
Figure 9. Current Construction Projects as of June 30, 2013
Campus/Project Description Financing Sources Value*
CU-Boulder:
Housing Baker Hall Renovation Bond proceeds 41,300 Housing Kittredge West Renovation Bond proceeds 22,800 Housing Stearns Fan Coil Units Campus cash 5,900 Campus Utility System Bond proceeds and campus cash resources 91,100 Geosciences Building (SEEC) Bond proceeds and campus cash resources 106,100 Housing Kittredge Central Projects Bond proceeds and campus cash resources 37,250 Recreation Facilities Improvements Bond proceeds 63,500 Quadrangle Residential Hall Redevelopment Bond proceeds and campus cash resources 62,400 Ekeley Sciences Middle Wing Renovation Campus cash 14,362 Williams Village Dining and Community Center Campus cash 37,000 Housing Bathroom Upgrades Campus cash 6,152 Jennie Smoly Caruthers Biotech Bldg (5th Wing) 194,900
CU Denver:
AHEC Academic Building 1, new building Bond proceeds and campus cash resources 62,552
AHEC Academic Building 1 Backfill Campus cash resources 5,324 UCCS:
Lane Medical Center Bond proceeds, private gifts and campus resources
18,500
Summit Village Expansion Bond proceeds 17,500 Stanton Road Parking Garage Bond proceeds 23,000 Academic Office Building Bond proceeds 12,000
* Value represents budgeted costs for project in thousands
Governmental grants and contracts, bondproceeds, and campus cash resources
During Fiscal Year 2013, the University issued $195,870,000 in revenue bonds. Of this amount, $100,165,000 was used to refund previously issued debt and $95,705,000 was issued to fund the following University of Colorado Improvement Projects: Baker Hall at CU-Boulder; parking facility, Recreation Center, and Academic Office Building at UCCS; Central Utility Plant chiller at CU Anschutz Medical Campus; and Academic Building I and backfill at CU Denver. These bonds are special limited obligations of the University, payable solely from net revenues, as defined. At June 30, 2013 and 2012, the University had debt (or similar long-term obligations) of $1,405,104,000 and $1,360,200,000, respectively, in the categories illustrated in Figure 10. More detailed information about the University’s debt is included in Note 9.
Figure 10. Debt Categories for Years Ended June 30, 2013, 2012, and 2011(in thousands) 2013 2012 2011
Revenue bonds $ 1,388,696 1,342,460 1,147,727 Capital leases 16,408 17,740 17,490 Total Long-term Debt $ 1,405,104 1,360,200 1,165,217
UNIVERSITY OF COLORADO MANAGEMENT’S DISCUSSION AND ANALYSIS
June 30, 2013 and 2012 (unaudited)
17
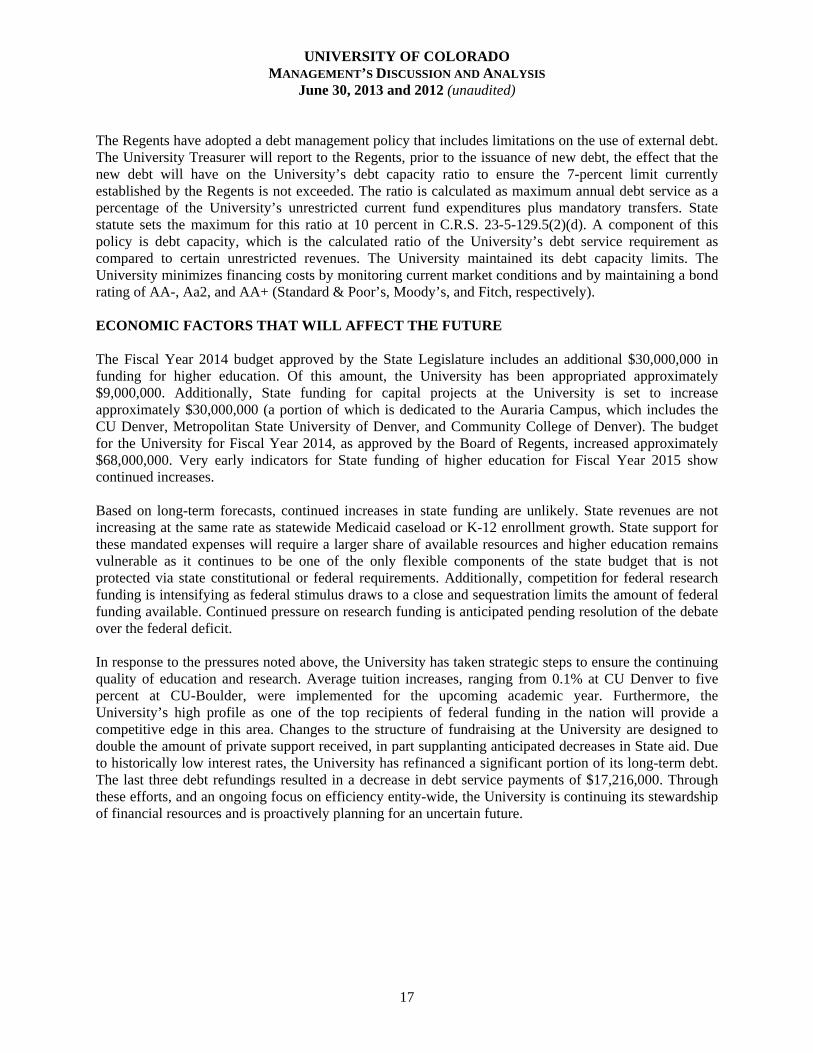
The Regents have adopted a debt management policy that includes limitations on the use of external debt. The University Treasurer will report to the Regents, prior to the issuance of new debt, the effect that the new debt will have on the University’s debt capacity ratio to ensure the 7-percent limit currently established by the Regents is not exceeded. The ratio is calculated as maximum annual debt service as a percentage of the University’s unrestricted current fund expenditures plus mandatory transfers. State statute sets the maximum for this ratio at 10 percent in C.R.S. 23-5-129.5(2)(d). A component of this policy is debt capacity, which is the calculated ratio of the University’s debt service requirement as compared to certain unrestricted revenues. The University maintained its debt capacity limits. The University minimizes financing costs by monitoring current market conditions and by maintaining a bond rating of AA-, Aa2, and AA+ (Standard & Poor’s, Moody’s, and Fitch, respectively). ECONOMIC FACTORS THAT WILL AFFECT THE FUTURE The Fiscal Year 2014 budget approved by the State Legislature includes an additional $30,000,000 in funding for higher education. Of this amount, the University has been appropriated approximately $9,000,000. Additionally, State funding for capital projects at the University is set to increase approximately $30,000,000 (a portion of which is dedicated to the Auraria Campus, which includes the CU Denver, Metropolitan State University of Denver, and Community College of Denver). The budget for the University for Fiscal Year 2014, as approved by the Board of Regents, increased approximately $68,000,000. Very early indicators for State funding of higher education for Fiscal Year 2015 show continued increases. Based on long-term forecasts, continued increases in state funding are unlikely. State revenues are not increasing at the same rate as statewide Medicaid caseload or K-12 enrollment growth. State support for these mandated expenses will require a larger share of available resources and higher education remains vulnerable as it continues to be one of the only flexible components of the state budget that is not protected via state constitutional or federal requirements. Additionally, competition for federal research funding is intensifying as federal stimulus draws to a close and sequestration limits the amount of federal funding available. Continued pressure on research funding is anticipated pending resolution of the debate over the federal deficit. In response to the pressures noted above, the University has taken strategic steps to ensure the continuing quality of education and research. Average tuition increases, ranging from 0.1% at CU Denver to five percent at CU-Boulder, were implemented for the upcoming academic year. Furthermore, the University’s high profile as one of the top recipients of federal funding in the nation will provide a competitive edge in this area. Changes to the structure of fundraising at the University are designed to double the amount of private support received, in part supplanting anticipated decreases in State aid. Due to historically low interest rates, the University has refinanced a significant portion of its long-term debt. The last three debt refundings resulted in a decrease in debt service payments of $17,216,000. Through these efforts, and an ongoing focus on efficiency entity-wide, the University is continuing its stewardship of financial resources and is proactively planning for an uncertain future.
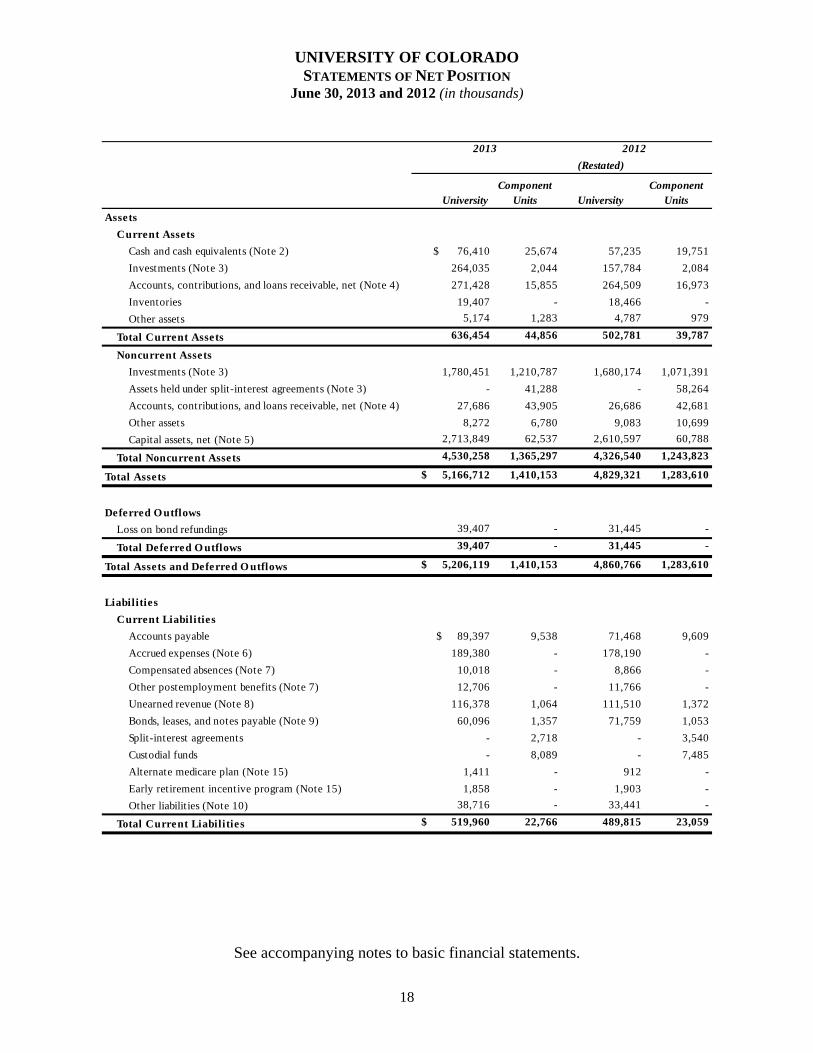
UNIVERSITY OF COLORADO STATEMENTS OF NET POSITION
June 30, 2013 and 2012 (in thousands)
18
(Restated)
Assets
Current Assets
Cash and cash equivalents (Note 2) $ 76,410 25,674 57,235 19,751
Investments (Note 3) 264,035 2,044 157,784 2,084
Accounts, contributions, and loans receivable, net (Note 4) 271,428 15,855 264,509 16,973
Inventories 19,407 - 18,466 -
Other assets 5,174 1,283 4,787 979
Total Current Assets 636,454 44,856 502,781 39,787
Noncurrent Assets
Investments (Note 3) 1,780,451 1,210,787 1,680,174 1,071,391
Assets held under split-interest agreements (Note 3) - 41,288 - 58,264
Accounts, contributions, and loans receivable, net (Note 4) 27,686 43,905 26,686 42,681
Other assets 8,272 6,780 9,083 10,699
Capital assets, net (Note 5) 2,713,849 62,537 2,610,597 60,788
Total Noncurrent Assets 4,530,258 1,365,297 4,326,540 1,243,823
Total Assets $ 5,166,712 1,410,153 4,829,321 1,283,610
Deferred O utflows
Loss on bond refundings 39,407 - 31,445 -
Total Deferred O utflows 39,407 - 31,445 -
Total Assets and Deferred O utflows $ 5,206,119 1,410,153 4,860,766 1,283,610
Liabilities
Current Liabilities
Accounts payable $ 89,397 9,538 71,468 9,609
Accrued expenses (Note 6) 189,380 - 178,190 -
Compensated absences (Note 7) 10,018 - 8,866 -
Other postemployment benefits (Note 7) 12,706 - 11,766 -
Unearned revenue (Note 8) 116,378 1,064 111,510 1,372
Bonds, leases, and notes payable (Note 9) 60,096 1,357 71,759 1,053
Split-interest agreements - 2,718 - 3,540
Custodial funds - 8,089 - 7,485
Alternate medicare plan (Note 15) 1,411 - 912 -
Early retirement incentive program (Note 15) 1,858 - 1,903 -
Other liabilit ies (Note 10) 38,716 - 33,441 -
Total Current Liabilities $ 519,960 22,766 489,815 23,059
2013 2012
Component UnitsUniversity University
Component Units
See accompanying notes to basic financial statements.
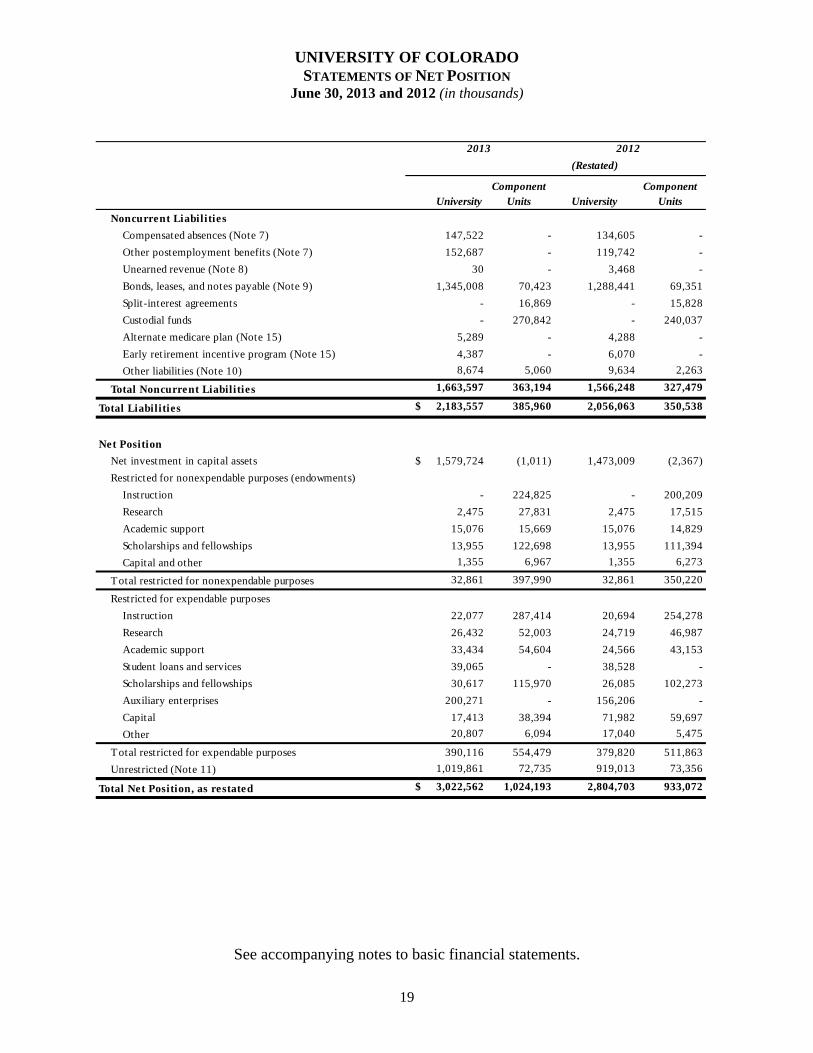
UNIVERSITY OF COLORADO STATEMENTS OF NET POSITION
June 30, 2013 and 2012 (in thousands)
19
(Restated)
Noncurrent Liabilities
Compensated absences (Note 7) 147,522 - 134,605 -
Other postemployment benefits (Note 7) 152,687 - 119,742 -
Unearned revenue (Note 8) 30 - 3,468 -
Bonds, leases, and notes payable (Note 9) 1,345,008 70,423 1,288,441 69,351
Split-interest agreements - 16,869 - 15,828
Custodial funds - 270,842 - 240,037
Alternate medicare plan (Note 15) 5,289 - 4,288 -
Early retirement incentive program (Note 15) 4,387 - 6,070 -
Other liabilit ies (Note 10) 8,674 5,060 9,634 2,263
Total Noncurrent Liabilities 1,663,597 363,194 1,566,248 327,479
Total Liabilities $ 2,183,557 385,960 2,056,063 350,538
Net Position
Net investment in capital assets $ 1,579,724 (1,011) 1,473,009 (2,367)
Restricted for nonexpendable purposes (endowments)
Instruction - 224,825 - 200,209
Research 2,475 27,831 2,475 17,515
Academic support 15,076 15,669 15,076 14,829
Scholarships and fellowships 13,955 122,698 13,955 111,394
Capital and other 1,355 6,967 1,355 6,273
Total restricted for nonexpendable purposes 32,861 397,990 32,861 350,220
Restricted for expendable purposes
Instruction 22,077 287,414 20,694 254,278
Research 26,432 52,003 24,719 46,987
Academic support 33,434 54,604 24,566 43,153
Student loans and services 39,065 - 38,528 -
Scholarships and fellowships 30,617 115,970 26,085 102,273
Auxiliary enterprises 200,271 - 156,206 -
Capital 17,413 38,394 71,982 59,697
Other 20,807 6,094 17,040 5,475
Total restricted for expendable purposes 390,116 554,479 379,820 511,863
Unrestricted (Note 11) 1,019,861 72,735 919,013 73,356
Total Net Position, as restated $ 3,022,562 1,024,193 2,804,703 933,072
University UniversityComponent
UnitsComponent
Units
20122013
See accompanying notes to basic financial statements.
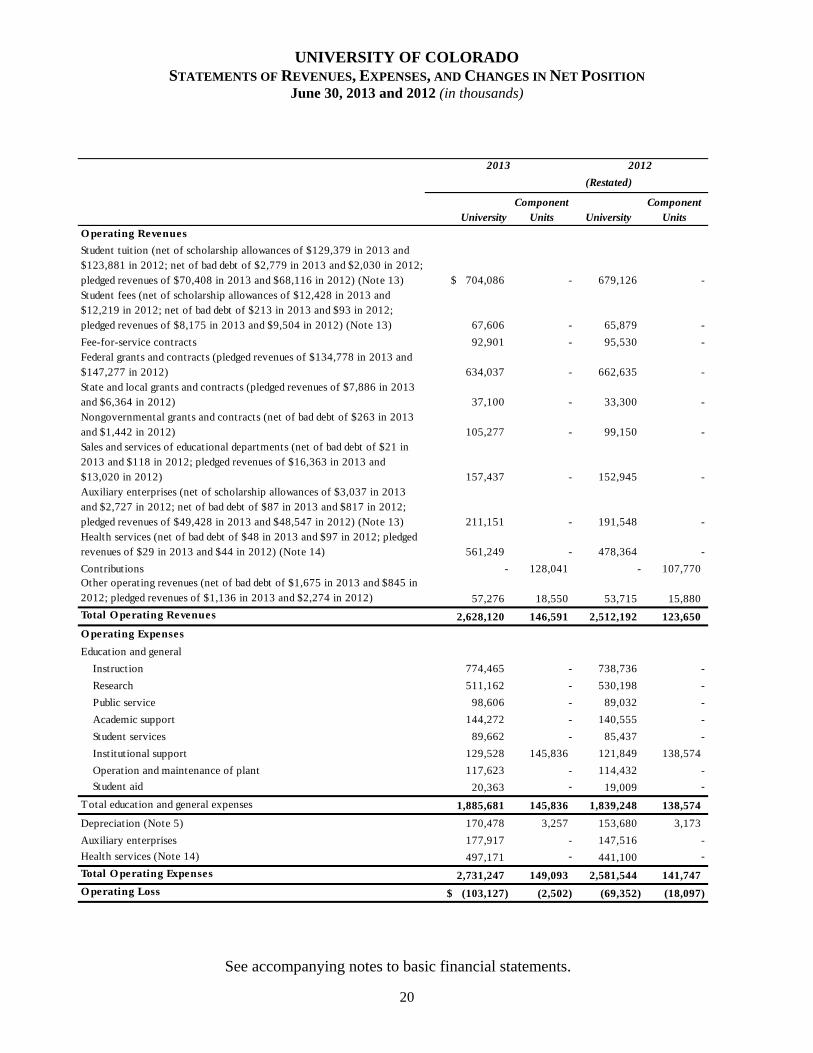
UNIVERSITY OF COLORADO STATEMENTS OF REVENUES, EXPENSES, AND CHANGES IN NET POSITION
June 30, 2013 and 2012 (in thousands)
20
(Restated)
O perating Revenues
Student tuition (net of scholarship allowances of $129,379 in 2013 and $123,881 in 2012; net of bad debt of $2,779 in 2013 and $2,030 in 2012; pledged revenues of $70,408 in 2013 and $68,116 in 2012) (Note 13) $ 704,086 - 679,126 -Student fees (net of scholarship allowances of $12,428 in 2013 and $12,219 in 2012; net of bad debt of $213 in 2013 and $93 in 2012; pledged revenues of $8,175 in 2013 and $9,504 in 2012) (Note 13) 67,606 - 65,879 -
Fee-for-service contracts 92,901 - 95,530 -Federal grants and contracts (pledged revenues of $134,778 in 2013 and $147,277 in 2012) 634,037 - 662,635 -State and local grants and contracts (pledged revenues of $7,886 in 2013 and $6,364 in 2012) 37,100 - 33,300 -Nongovernmental grants and contracts (net of bad debt of $263 in 2013 and $1,442 in 2012) 105,277 - 99,150 -Sales and services of educational departments (net of bad debt of $21 in 2013 and $118 in 2012; pledged revenues of $16,363 in 2013 and $13,020 in 2012) 157,437 - 152,945 -Auxiliary enterprises (net of scholarship allowances of $3,037 in 2013 and $2,727 in 2012; net of bad debt of $87 in 2013 and $817 in 2012; pledged revenues of $49,428 in 2013 and $48,547 in 2012) (Note 13) 211,151 - 191,548 -Health services (net of bad debt of $48 in 2013 and $97 in 2012; pledged revenues of $29 in 2013 and $44 in 2012) (Note 14) 561,249 - 478,364 -
Contributions - 128,041 - 107,770Other operating revenues (net of bad debt of $1,675 in 2013 and $845 in 2012; pledged revenues of $1,136 in 2013 and $2,274 in 2012) 57,276 18,550 53,715 15,880
Total O perating Revenues 2,628,120 146,591 2,512,192 123,650
O perating Expenses
Education and general
Instruction 774,465 - 738,736 -
Research 511,162 - 530,198 -
Public service 98,606 - 89,032 -
Academic support 144,272 - 140,555 -
Student services 89,662 - 85,437 -
Institutional support 129,528 145,836 121,849 138,574
Operation and maintenance of plant 117,623 - 114,432 -
Student aid 20,363 - 19,009 -
Total education and general expenses 1,885,681 145,836 1,839,248 138,574
Depreciation (Note 5) 170,478 3,257 153,680 3,173
Auxiliary enterprises 177,917 - 147,516 -
Health services (Note 14) 497,171 - 441,100 -
Total O perating Expenses 2,731,247 149,093 2,581,544 141,747
O perating Loss $ (103,127) (2,502) (69,352) (18,097)
2013 2012
University UniversityComponent
UnitsComponent
Units
See accompanying notes to basic financial statements.
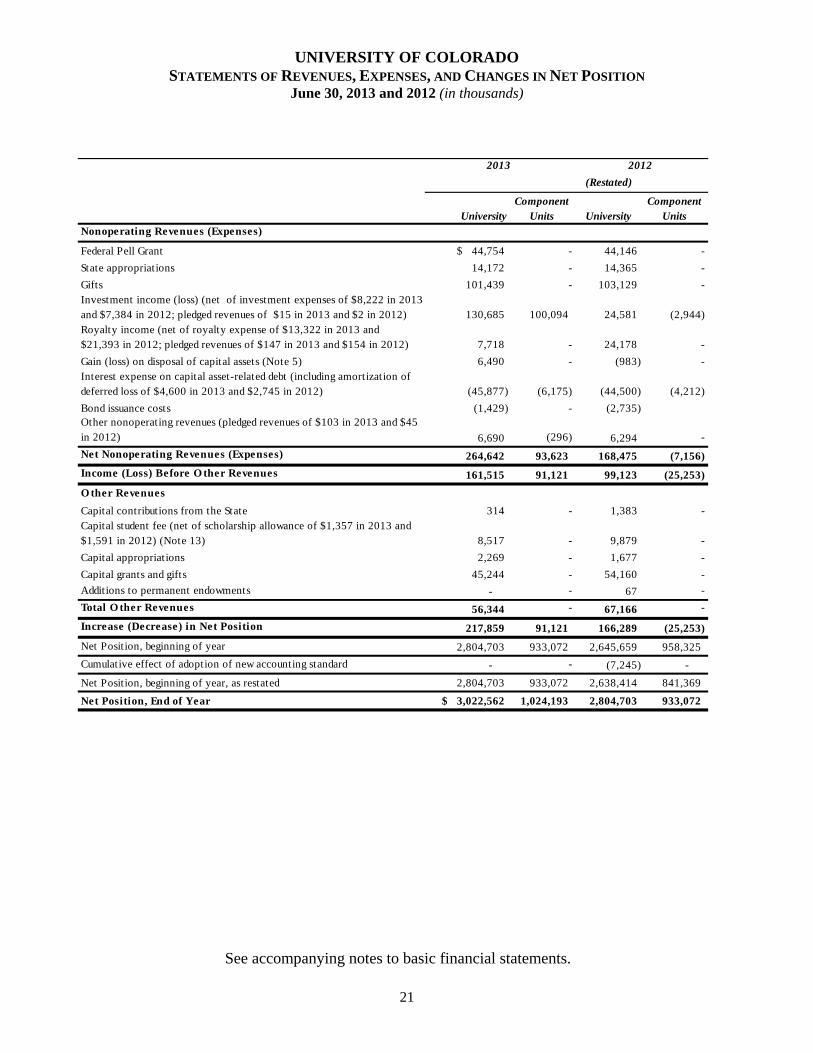
UNIVERSITY OF COLORADO STATEMENTS OF REVENUES, EXPENSES, AND CHANGES IN NET POSITION
June 30, 2013 and 2012 (in thousands)
21
(Restated)
Nonoperating Revenues (Expenses)
Federal Pell Grant $ 44,754 - 44,146 -
State appropriations 14,172 - 14,365 -
Gifts 101,439 - 103,129 - Investment income (loss) (net of investment expenses of $8,222 in 2013 and $7,384 in 2012; pledged revenues of $15 in 2013 and $2 in 2012) 130,685 100,094 24,581 (2,944) Royalty income (net of royalty expense of $13,322 in 2013 and $21,393 in 2012; pledged revenues of $147 in 2013 and $154 in 2012) 7,718 - 24,178 -
Gain (loss) on disposal of capital assets (Note 5) 6,490 - (983) - Interest expense on capital asset-related debt (including amortization of deferred loss of $4,600 in 2013 and $2,745 in 2012) (45,877) (6,175) (44,500) (4,212)
Bond issuance costs (1,429) - (2,735)Other nonoperating revenues (pledged revenues of $103 in 2013 and $45 in 2012) 6,690 (296) 6,294 -
Net Nonoperating Revenues (Expenses) 264,642 93,623 168,475 (7,156)
Income (Loss) Before O ther Revenues 161,515 91,121 99,123 (25,253)
O ther Revenues
Capital contributions from the State 314 - 1,383 - Capital student fee (net of scholarship allowance of $1,357 in 2013 and $1,591 in 2012) (Note 13) 8,517 - 9,879 -
Capital appropriations 2,269 - 1,677 -
Capital grants and gifts 45,244 - 54,160 -
Additions to permanent endowments - - 67 -
Total O ther Revenues 56,344 - 67,166 -
Increase (Decrease) in Net Position 217,859 91,121 166,289 (25,253)
Net Position, beginning of year 2,804,703 933,072 2,645,659 958,325
Cumulative effect of adoption of new accounting standard - - (7,245) -
Net Position, beginning of year, as restated 2,804,703 933,072 2,638,414 841,369
Net Position, End of Year $ 3,022,562 1,024,193 2,804,703 933,072
2013 2012
University UniversityComponent
UnitsComponent
Units
See accompanying notes to basic financial statements.
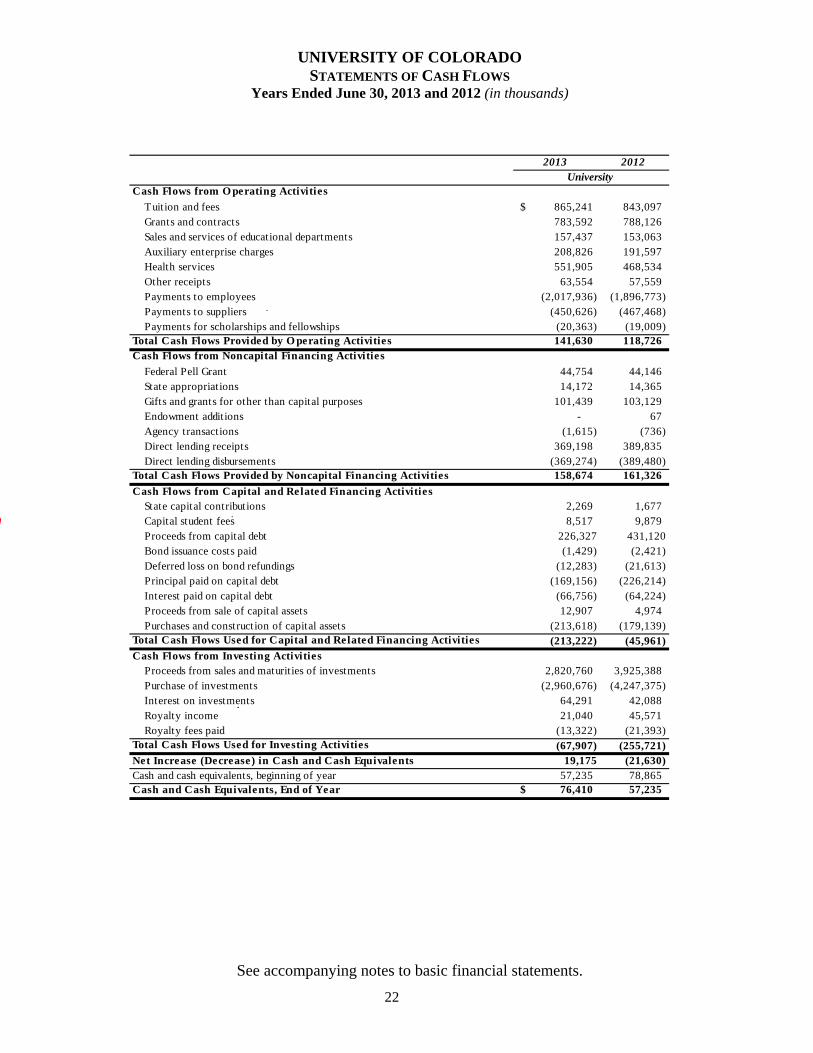
UNIVERSITY OF COLORADO STATEMENTS OF CASH FLOWS
Years Ended June 30, 2013 and 2012 (in thousands)
22
2013 2012
Cash Flows from O perating Activities
Tuition and fees 865,241$ 843,097 Grants and contracts 783,592 788,126Sales and services of educational departments 157,437 153,063Auxiliary enterprise charges 208,826 191,597Health services 551,905 468,534Other receipts 63,554 57,559Payments to employees (2,017,936) (1,896,773)Payments to suppliers (450,626) (467,468)Payments for scholarships and fellowships (20,363) (19,009)
Total Cash Flows Provided by O perating Activities 141,630 118,726Cash Flows from Noncapital Financing Activities
Federal Pell Grant 44,754 44,146 State appropriations 14,172 14,365
Gifts and grants for other than capital purposes 101,439 103,129Endowment additions - 67Agency transactions (1,615) (736)Direct lending receipts 369,198 389,835Direct lending disbursements (369,274) (389,480)
Total Cash Flows Provided by Noncapital Financing Activities 158,674 161,326
Cash Flows from Capital and Related Financing ActivitiesState capital contributions 2,269 1,677Capital student fees 8,517 9,879Proceeds from capital debt 226,327 431,120 Bond issuance costs paid (1,429) (2,421)Deferred loss on bond refundings (12,283) (21,613)Principal paid on capital debt (169,156) (226,214)Interest paid on capital debt (66,756) (64,224)Proceeds from sale of capital assets 12,907 4,974Purchases and construction of capital assets (213,618) (179,139)
Total Cash Flows Used for Capital and Related Financing Activities (213,222) (45,961)Cash Flows from Investing Activities
Proceeds from sales and maturities of investments 2,820,760 3,925,388Purchase of investments (2,960,676) (4,247,375)Interest on investments 64,291 42,088Royalty income 21,040 45,571Royalty fees paid (13,322) (21,393)
Total Cash Flows Used for Investing Activities (67,907) (255,721)Net Increase (Decrease) in Cash and Cash Equivalents 19,175 (21,630)Cash and cash equivalents, beginning of year 57,235 78,865Cash and Cash Equivalents, End of Year 76,410$ 57,235
University
See accompanying notes to basic financial statements.
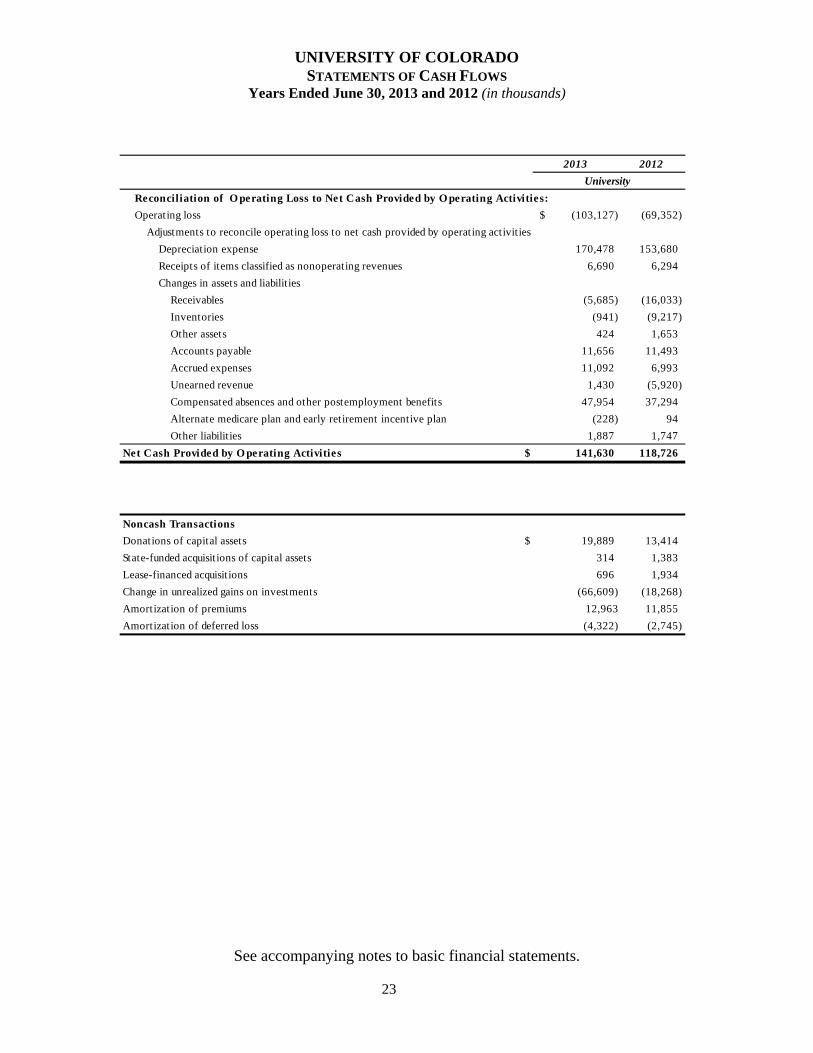
UNIVERSITY OF COLORADO STATEMENTS OF CASH FLOWS
Years Ended June 30, 2013 and 2012 (in thousands)
23
2013 2012
Reconciliation of O perating Loss to Net Cash Provided by O perating Activities:
Operating loss (103,127)$ (69,352)
Adjustments to reconcile operating loss to net cash provided by operating activities
Depreciation expense 170,478 153,680
Receipts of items classified as nonoperating revenues 6,690 6,294
Changes in assets and liabilit ies
Receivables (5,685) (16,033)
Inventories (941) (9,217)
Other assets 424 1,653
Accounts payable 11,656 11,493
Accrued expenses 11,092 6,993
Unearned revenue 1,430 (5,920)
Compensated absences and other postemployment benefits 47,954 37,294
Alternate medicare plan and early retirement incentive plan (228) 94
Other liabilit ies 1,887 1,747
Net Cash Provided by O perating Activities $ 141,630 118,726
Noncash Transactions
Donations of capital assets $ 19,889 13,414
State-funded acquisitions of capital assets 314 1,383
Lease-financed acquisitions 696 1,934
Change in unrealized gains on investments (66,609) (18,268)
Amortization of premiums 12,963 11,855
Amortization of deferred loss (4,322) (2,745)
University
See accompanying notes to basic financial statements.
UNIVERSITY OF COLORADO NOTES TO FINANCIAL STATEMENTS
June 30, 2013 and 2012
24
NOTE 1 – BASIS OF PRESENTATION AND SUMMARY OF SIGNIFICANT ACCOUNTING POLICIES
GOVERNANCE
The University of Colorado (the University) is a comprehensive degree-granting research university in the State of Colorado (the State). It is governed by a nine-member Board of Regents (the Regents) elected by popular vote in the State’s general elections. Serving staggered six-year terms, one member is elected from each of the State’s seven congressional districts with two Regents elected from the State at large. The University comprises the system office and the following three accredited campuses, each with its unique mission as detailed below:
University of Colorado Boulder (CU-Boulder)
Established in 1861, CU-Boulder is a comprehensive graduate research university (with selective admission standards) offering a comprehensive array of undergraduate, master’s, and doctoral degree programs.
University of Colorado Denver | Anschutz Medical Campus
Originally operated as two separate campuses, the Health Sciences Center and the Denver campus were established in 1883 and 1974, respectively. In 2004, the two campuses were institutionally merged into the University of Colorado Denver. The consolidated institution is an urban comprehensive research university offering a full range of undergraduate, graduate, and professional degree programs in life sciences, professional programs, and liberal arts. In 2007 the Health Sciences Center was renamed the Anschutz Medical Campus in recognition of several large gifts by businessman Philip Anschutz that helped make the building of the campus possible. The campuses are currently referred to collectively as University of Colorado Denver | Anschutz Medical Campus and separately as the University of Colorado Denver (CU Denver) and the University of Colorado Anschutz Medical Campus (CU Anschutz Medical Campus).
University of Colorado, Colorado Springs (UCCS)
Established as a separate campus in 1965, UCCS is a comprehensive graduate research university (with selective admission standards) offering a comprehensive array of undergraduate, master’s, and doctoral degree programs.
To accomplish its mission, the University’s 6,278 instructional faculty serve 58,166 students through 388 degree programs in 26 schools and colleges.
BASIS OF PRESENTATION AND FINANCIAL REPORTING ENTITY
Blended Component Units
The University’s financial reporting entity includes the operations of the University and all related entities for which the University is financially accountable. Financial accountability may stem from the University’s ability to appoint a majority of the governing board of the related organization, its ability to impose its will on the related organization, its ability to access assets, or its responsibility for debts of the related organization. Blended component units generally include those entities
UNIVERSITY OF COLORADO NOTES TO FINANCIAL STATEMENTS
June 30, 2013 and 2012
25
(1) that provide services entirely to the University, (2) in which there is a financial benefit or burden relationship, or (3) management of the University has operational responsibility. The University has the following blended component units:
Buffalo Power Corporation
Established in 1991, Buffalo Power is a Colorado nonprofit corporation organized to facilitate the construction and financing of a cogeneration plant project (plant). Buffalo Power Corporation’s directors are appointed by the Regents. The plant is designed to supply steam and electric power to CU-Boulder. Excess electricity produced by the plant is sold to third parties by CU-Boulder. There are no assets, liabilities, net position, revenues, or expenses for Fiscal Years 2013 and 2012. The University appoints a voting majority of Buffalo Power Corporation’s governing body and can remove appointed members at will. Additionally, the University is legally entitled to or can otherwise access Buffalo Power Corporation’s resources and the services provided are entirely for the University.
University of Colorado Finance Corporation
Established in 1998, the University of Colorado Finance Corporation is a Colorado nonprofit corporation organized to facilitate the acquisition of personal and real property for the University. There is no financial activity for this corporation for Fiscal Years 2013 and 2012. The University appoints a voting majority of the University of Colorado Finance Corporation’s governing body and can remove appointed members at will. Additionally, the University is legally entitled to or can otherwise access the University of Colorado Finance Corporation’s resources and the services provided are entirely for the University.
University License Equity Holding, Inc. (ULEHI)
Originally established in 1992, with a significant reorganization in 2001, ULEHI facilitates certain licensing activities for the University. ULEHI is a nonprofit entity under Section 501(c)(3) of the Internal Revenue Code. The University appoints a voting majority of ULEHI’s governing body, is able to impose its will on the organization, and the organization provides services entirely to the University.
Detailed financial information may be obtained directly from ULEHI at 4740 Walnut Street, Boulder, Colorado 80301.
University Physicians, Inc. (UPI)
Established in 1982, UPI performs the billing, collection, and disbursement services for the professional health services rendered for CU Anschutz Medical Campus as authorized in Section 23-20-114, Colorado Revised Statutes. UPI is the School of Medicine’s faculty practice plan with approximately 2,200 member physicians. It does not employ physicians or practice medicine directly; it provides the business and administrative support for the clinical faculty employed by the School of Medicine. It is a nonprofit entity under Section 501(c)(3) of the Internal Revenue Code. Medical care is provided to patients throughout the Rocky Mountain region through a statewide and regional network of services with over 160 sites of practice. The University appoints a majority of UPI’s governing body, and is able to impose its will. Additionally, UPI exclusively benefits the University by providing the services described above.
UNIVERSITY OF COLORADO NOTES TO FINANCIAL STATEMENTS
June 30, 2013 and 2012
26
In 1997, UPI acquired a 30 percent interest in the University of Colorado Hospital Authority’s (the Hospital Authority) investment in TriWest Healthcare Alliance Corp. (TriWest). Since that time, the Hospital Authority sold 50 percent of the joint TriWest investment back to TriWest resulting in a revised ownership split between the Hospital Authority and UPI. UPI now holds 60 percent of the Hospital Authority’s 15 percent investment. TriWest was formed to deliver healthcare services to eligible beneficiaries of the Civilian Health and Medical Program of the Uniformed Services within certain specified geographic regions. UPI accounts for its participation in TriWest on the cost basis. See Note 18 for additional information.
In December 2010, UPI, the Hospital Authority, and the University’s School of Medicine (SOM) entered into a joint operating agreement to develop and operate a radiology imaging facility. In 2012 and 2011, UPI contributed approximately $988,000, which is equal to 49 percent of total capital contributions for the imaging center. No contributions were made in 2013. Capital contributions and division of revenue and expenses will be split between the partners based upon the operating agreement. The University did not contribute any funds to the facility and has no equity interest in it. UPI received $429,000 and $244,000 in dividends during the years ended June 30, 2013 and 2012, respectively.
During 2009, UPI purchased 49 units representing a 24.5 percent share in The Children’s Hospital North Surgery Center, LLC (Surgery Center) for $490,000. The Surgery Center was formed by Children’s Hospital Colorado Association, UPI, and individual community physicians for the purpose of owning and operating a multi-specialty ambulatory surgery center focused on pediatric care. UPI accounts for its participation in the Surgery Center on the cost basis. During 2012, UPI contributed $122,500, through capital calls, thereby maintaining UPI’s original ownership interest. There were no such capital calls during Fiscal Year 2013. In addition to its equity interest in the entity, UPI has issued a guaranty for up to $1.2 million in support of a $4.7 million loan taken by the Surgery Center in support of its operations. In the event of default, UPI and Children’s Colorado would be responsible for their proportionate interest in this indebtedness to the extent it could not be satisfied by any equity remaining in the venture.
Detailed financial information may be obtained directly from UPI at P.O. Box 111719, Aurora, Colorado 80042-1719.
Discretely Presented Component Units
The University’s financial statements include certain supporting organizations as discretely presented component units (DPCU) of the University (labeled component units). The majority of the resources, or income thereon that the supporting organizations hold and invest, are restricted to the activities of the University by the donors.
Because these restricted resources held by the supporting organizations can only be used by, or for the benefit of, the University, the following supporting organizations are considered DPCU of the University (see Note 17 for additional information):
University of Colorado Foundation (CU Foundation)
Established in 1967, the CU Foundation solicits, receives, holds, invests, and transfers funds for the benefit of the University. The CU Foundation, a nonprofit entity under
UNIVERSITY OF COLORADO NOTES TO FINANCIAL STATEMENTS
June 30, 2013 and 2012
27
Section 501(c)(3) of the Internal Revenue Code, has a 15-member board of directors, of which a member of the Regents, the president of the University, and another University designee serve as ex-officio non-voting members. The board of trustees of the CU Foundation selects the board of directors. The CU Foundation, as a not-for-profit entity, follows Financial Accounting Standards Board guidance in the preparation of its financial statements, which are then modified to match the University’s financial reporting format.
Under an agreement between the CU Foundation and the University, the CU Foundation provides development and investment services to the University in exchange for a fee.
Detailed financial information may be obtained directly from the CU Foundation at 4740 Walnut Street, Boulder, Colorado 80301. Please see Note 20 for subsequent events related to the CU Foundation.
The University of Colorado Real Estate Foundation (CUREF)
Established in August 2002, CUREF solicits and manages real estate investments for the sole benefit of the University. CUREF, a nonprofit entity under Section 501(c)(3) and 509(a)(3) of the Internal Revenue Code, has up to a 14-member board of directors. Nine are voting members, of which four are appointed by the University. There are up to five ex-officio non-voting members.
In May 2005, Campus Village Apartments, LLC (CVA) was formed with CUREF as the sole shareholder to promote the general welfare, development, growth, and well-being of the University, specifically by acquiring, constructing, improving, equipping, and operating a new student housing facility located in Denver, Colorado.
18th Avenue, LLC (18th Avenue), a Colorado limited liability company, was formed under the laws of the State of Colorado on April 26, 2006, with CUREF as the sole member. 18th Avenue is organized, operated, and dedicated exclusively to promoting CUREF’s charitable purposes and to promoting the general welfare, development, growth, and well-being of the University of Colorado, and specifically for the primary purpose of acquiring, owning, operating, and maintaining real property consisting of an office building in Denver, Colorado. 33rd Street, LLC (33rd Street), a Colorado limited liability company, was formed under the laws of the State of Colorado on April 26, 2006, with CUREF as the sole member. 33rd Street is organized, operated, and dedicated exclusively to promoting the general welfare, development, growth, and well-being of the University of Colorado, and specifically for the primary purpose of acquiring, owning, operating, and maintaining real property consisting of an industrial building in Boulder, Colorado. Partnership Holdings Venture, LLC (PHV LLC), a Colorado limited liability company, was formed under the laws of the State of Colorado on January 10, 2008, with CUREF as the sole member. LHV LLC is organized, operated, and dedicated solely to promoting the general welfare, development, growth, and well-being of the University of Colorado, and specifically for the primary purpose of acquiring, ownership, operation, management, sale, and disposition of investments including membership interest in real estate properties.
UNIVERSITY OF COLORADO NOTES TO FINANCIAL STATEMENTS
June 30, 2013 and 2012
28
Land Holdings Venture, LLC (LHV LLC), a Colorado limited liability company, was formed under the laws of the State of Colorado on January 10, 2008, with CUREF as the sole member. LHV LLC is organized, operated, and dedicated solely to promoting the general welfare, development, growth, and well-being of the University of Colorado, and specifically for the primary purpose of acquiring, ownership, operation, management, sale, and disposition of investments including holdings in land. The University of Colorado UK Foundation Limited (CU UK), a charitable company with limited liability, was formed under the laws of England and Wales and incorporated February 25, 2010, with CUREF as the sole shareholder. CU UK’s purpose is to advance and promote education for the public benefit, in particular for any educational and charitable purposes connected with the University of Colorado, its affiliates, and its past and present students and staff. CU UK owns property in London. Detailed financial information may be obtained directly from CUREF at 1800 Grant Street, Suite 725, Denver, Colorado 80203.
Joint Ventures and Related Organizations
The University has associations with the following organizations for which it is not financially accountable, or has primary access to the resources. Accordingly, these organizations have not been included in the University’s financial statements. Information regarding the nature of the relationships is included in Note 18.
University of Colorado Hospital Authority (the Hospital Authority)
Auraria Higher Education Center (AHEC)
University of Colorado Health and Welfare Trust (the Trust)
Relationship to State of Colorado
Article VIII, Section 5 of the Colorado Constitution declares the University to be a state institution. The Board of Regents of the University is elected by popular vote of the citizens of the State. Therefore, the Board of the University is entirely different from the governing board of the State. Management of the University is completely separate and distinct from management of the State. The services provided by the University benefit the citizens of the State, rather than serving the State government. The services include provisions of undergraduate and graduate education to the citizens of the State, and conducting extensive amounts of federally and other funded research for the benefit of the citizens of the State, the nation and the world. Additionally, the University offers more than 200 public outreach programs serving Coloradans and their communities. All outstanding debt of the University is expected to be repaid entirely with resources generated by the University. No State funds are used to repay any debt issued by the University. For state-wide reporting purposes, the University is considered by the State to be part of the State’s reporting entity.
TAX-EXEMPT STATUS
The income generated by the University, as an instrumentality of the State, is generally excluded from federal income taxes under Section 115(a) of the Internal Revenue Code. The University also
UNIVERSITY OF COLORADO NOTES TO FINANCIAL STATEMENTS
June 30, 2013 and 2012
29
has a determination letter from the Internal Revenue Service stating it is exempt under Section 501(a) of the Internal Revenue Code as an organization described in Section 501(c)(3). Income generated from activities unrelated to the University’s exempt purpose is subject to tax under Internal Revenue Code Section 511(a)(2)(B). There was no tax liability related to income generated from activities unrelated to the University’s exempt purpose as of June 30, 2013 and 2012.
BASIS OF ACCOUNTING
For financial reporting purposes, the University is considered a special-purpose government engaged only in business-type activities. Accordingly, the University’s financial statements have been prepared using the economic resources measurement focus and the accrual basis of accounting. Under the accrual basis of accounting, revenues are recognized when earned, and expenses are recorded when an obligation is incurred.
The University applies all applicable Governmental Accounting Standards Board (GASB) pronouncements.
ACCOUNTING POLICIES
Cash and Cash Equivalents are defined for the purposes of reporting cash flows as cash on hand and deposit accounts. Investments in mutual funds and money market funds and securities are presented as investments. UPI and the CU Foundation consider money market funds and securities with a maturity, when acquired, of three months or less to be cash equivalents.
Investments are reported in the financial statements at fair value, which is determined primarily based on quoted market prices as of June 30, 2013 and 2012. Amortized costs (which approximate fair value) are used for money market investments. These money market accounts are held with Securities and Exchange Commission (SEC) registered investment companies under Rule 2a7 of the Investment Company Act of 1940.
The classification of investments as current or noncurrent is based on the underlying nature and restricted use of the asset. Current investments are those without restrictions imposed by third parties that can be used to pay current obligations of the University. Noncurrent investments include investments with a maturity in excess of one year, restricted investments, and those investments designated to be used for long-term obligations.
The University’s investment policies permit investments in fixed-income and equity securities and alternative strategies. These policies are implemented using individual securities, mutual funds, commingled funds, and alternative investments for the endowments.
Investments of the CU Foundation include those held as agency funds for the University. The CU Foundation records investment purchases, or when contributed to the Foundation, at the fair values of the investment assets received at the date of contribution. Investments in equity securities with readily determinable fair values and all investments in debt securities are stated at their fair values. The fair values of alternative investments publicly traded on national security exchanges are stated at their closing market prices at June 30, 2013 and 2012, respectively. The fair values of alternative investments not publicly traded on national security exchanges represent the Foundation’s pro-rata interest in the net assets of each investment and are based on financial information determined and reported by investment managers, subject to review, evaluation, and adjustment by the management of the Foundation, or on the basis of other information developed, obtained, and evaluated
UNIVERSITY OF COLORADO NOTES TO FINANCIAL STATEMENTS
June 30, 2013 and 2012
30
periodically by the Foundation. Because of the inherent uncertainties in the valuation of alternative investments, those estimated fair values may differ significantly from the values that would have been used had ready market for the investments existed. Included in the investments portfolio are real estate and note receivable assets. These assets are booked at cost and present value, respectively.
Endowments and similar gift instruments owned by the University and the CU Foundation are primarily recorded as investments in the accompanying financial statements. Endowment funds are subject to the restrictions of donor gift instruments requiring the principal to be invested in perpetuity. Life income funds are used to account for cash or other property contributed to the University subject to the requirement that the University periodically pay the income earned on such assets to a designated beneficiary. The assets of life income funds become the property of the University or the CU Foundation upon the death of the designated beneficiary. Annuity funds are used to account for property contributed to the University or the CU Foundation in exchange for a promise to pay a fixed amount to the donor for a specified period of time. In addition, certain funds have been established by the Regents to function as endowment funds until the restrictions are lifted by the Regents. Gifts-in-kind are recorded at the fair market value as of the date of donation.
Accounts, Contributions, and Loans Receivable are recorded net of estimated uncollectible amounts, approximating anticipated losses.
Contributions receivable for the CU Foundation are unconditional promises to give. Promises to give to CUREF are recorded at net realizable value if expected to be collected within one year and at the present value of their expected future cash flows if expected to be collected in more than one year. The CU Foundation uses the allowance method to determine the uncollectible portion of the unconditional contributions receivable. The allowance is based on management’s analysis of the historical collectability of contributions pledged. These promises to give are recorded at the net present value of the expected future cash flows.
For all other receivables, individual accounts are written off against the allowance when collection of the account appears doubtful. Bad debts substantially consist of write-offs for uncollectible balances on self-pay patients and contributions receivable.
Inventories are primarily accounted for using the consumption method and are stated at the lower of cost or market. Cost is determined using either first-in, first-out, average cost, or retail method.
Other Assets consists of prepaid expenses, travel advances, patent acquisition costs, and other prepaid items.
Capital Assets are stated at cost at the date of acquisition or at fair value at the date of donation. For equipment, the capitalization policy includes all items with a value of $5,000 or more, and an estimated useful life of greater than one year.
Intangibles (including software) and renovations to buildings and other improvements that significantly increase the value or extend the useful life of the structure are capitalized. For intangibles and renovations and improvements, the capitalization policy includes items with a value of $75,000 or more. Routine repairs and maintenance are charged to operating expense. Major outlays for capital assets and improvements are capitalized as construction in progress throughout the building project. Interest incurred during the construction phase is included as part of the value of the construction in progress.
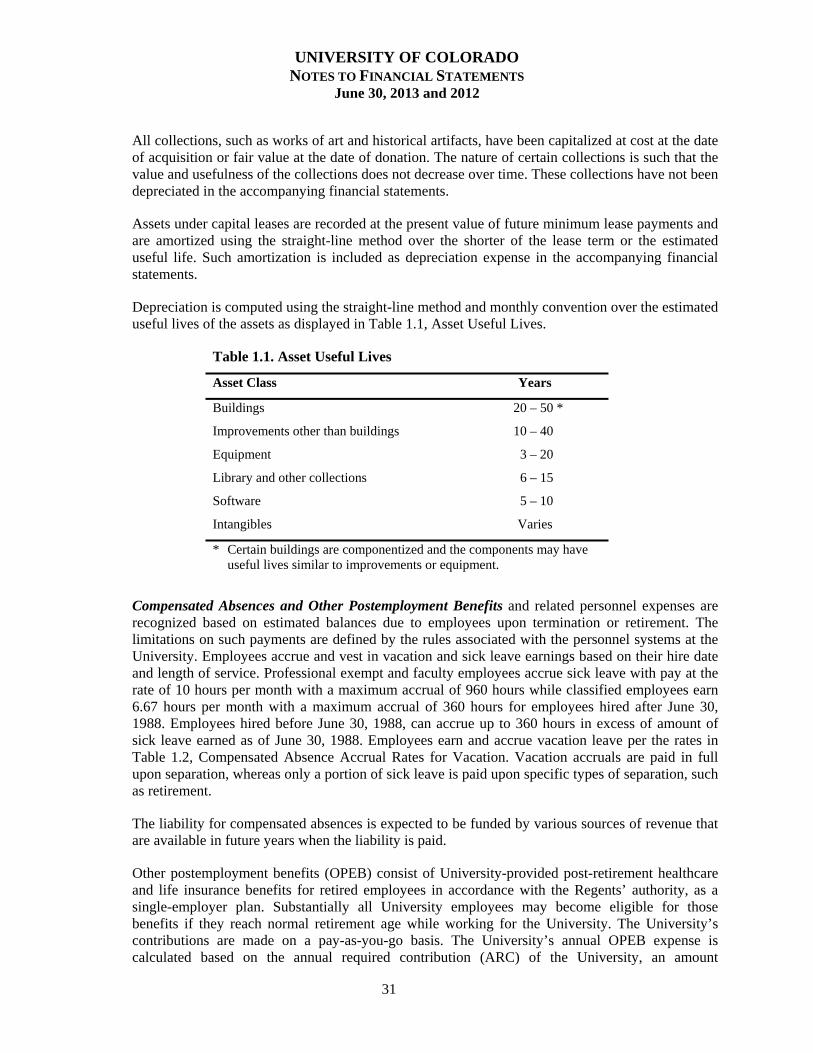
UNIVERSITY OF COLORADO NOTES TO FINANCIAL STATEMENTS
June 30, 2013 and 2012
31
All collections, such as works of art and historical artifacts, have been capitalized at cost at the date of acquisition or fair value at the date of donation. The nature of certain collections is such that the value and usefulness of the collections does not decrease over time. These collections have not been depreciated in the accompanying financial statements.
Assets under capital leases are recorded at the present value of future minimum lease payments and are amortized using the straight-line method over the shorter of the lease term or the estimated useful life. Such amortization is included as depreciation expense in the accompanying financial statements.
Depreciation is computed using the straight-line method and monthly convention over the estimated useful lives of the assets as displayed in Table 1.1, Asset Useful Lives.
Table 1.1. Asset Useful Lives
Asset Class Years
Buildings 20 – 50 *
Improvements other than buildings 10 – 40
Equipment 3 – 20
Library and other collections 6 – 15
Software 5 – 10
Intangibles Varies
* Certain buildings are componentized and the components may have useful lives similar to improvements or equipment.
Compensated Absences and Other Postemployment Benefits and related personnel expenses are recognized based on estimated balances due to employees upon termination or retirement. The limitations on such payments are defined by the rules associated with the personnel systems at the University. Employees accrue and vest in vacation and sick leave earnings based on their hire date and length of service. Professional exempt and faculty employees accrue sick leave with pay at the rate of 10 hours per month with a maximum accrual of 960 hours while classified employees earn 6.67 hours per month with a maximum accrual of 360 hours for employees hired after June 30, 1988. Employees hired before June 30, 1988, can accrue up to 360 hours in excess of amount of sick leave earned as of June 30, 1988. Employees earn and accrue vacation leave per the rates in Table 1.2, Compensated Absence Accrual Rates for Vacation. Vacation accruals are paid in full upon separation, whereas only a portion of sick leave is paid upon specific types of separation, such as retirement.
The liability for compensated absences is expected to be funded by various sources of revenue that are available in future years when the liability is paid.
Other postemployment benefits (OPEB) consist of University-provided post-retirement healthcare and life insurance benefits for retired employees in accordance with the Regents’ authority, as a single-employer plan. Substantially all University employees may become eligible for those benefits if they reach normal retirement age while working for the University. The University’s contributions are made on a pay-as-you-go basis. The University’s annual OPEB expense is calculated based on the annual required contribution (ARC) of the University, an amount
UNIVERSITY OF COLORADO NOTES TO FINANCIAL STATEMENTS
June 30, 2013 and 2012
32
actuarially determined. The ARC represents a level of funding that, if paid on an ongoing basis, is projected to cover normal cost each year and amortize any unfunded actuarial liabilities (or fund excess) of the plan over a period not to exceed 30 years.
Table 1.2. Compensated Absence Accrual Rates for Vacation
Type of Employee Days Earned Per
Month* Maximum Accrual
Classified employees hired before January 1, 1968 1.25-1.75 days 30 – 42 days
Classified employees hired on or after January 1, 1968 1-1.75 days 24 – 42 days
Professional exempt and faculty employees 1.83 days 44 days**
* Rates are for full-time employees; part-time employees earn at pro-rata based on percentage of appointment.
** Effective September 1, 1976, vacation accrual in excess of 44 days, earned in accordance with prior policies, will be carried forward; however, persons with unused vacation in excess of 44 days may not accumulate additional vacation time by failure to use vacation earned after that date.
Unearned Revenue consists of amounts received for the provision of education, research, auxiliary goods and services, and royalties that have not yet been earned.
Bonds, Leases, and Notes Payable are debt by borrowing or financing usually for the acquisition of buildings, equipment, or capital construction. Bonds are addressed in Note 9.
Capital leases consist of various lease-purchase contracts and other lease agreements. Such contracts provide that any commitments beyond the current year are contingent upon funds being appropriated for such purposes by the Regents. It is reasonably assured that such leases will be renewed in the normal course of business and, therefore, are treated as non-cancelable for financial reporting purposes.
Split-interest Agreements are beneficial interests in various agreements which include gift annuities, charitable remainder annuity trusts and unitrusts, and a pooled income fund. The CU Foundation typically serves as trustee, although certain trusts are administered by outside trustees.
For trusts administered by the CU Foundation, specified earnings are typically paid to a named beneficiary. After termination of the trusts, the assets revert to the CU Foundation to create an endowment to support University activities or to be temporarily restricted for other purposes at the University. Assets received under such agreements are typically marketable equity and fixed-income securities, are recorded at their market value, and are included in investments in the accompanying financial statements. The estimated net present value of the obligation to named beneficiaries is recorded as a liability under split-interest agreements. A risk-free rate, using U.S.
UNIVERSITY OF COLORADO NOTES TO FINANCIAL STATEMENTS
June 30, 2013 and 2012
33
Treasury bonds at the date of the gift, is used in conjunction with actuarially determined life expectancies to calculate present values. The fair value of assets received in excess of the obligation is recognized as contribution revenue at the date of the gift. Changes in the value of the investments are combined with the changes in the estimated liability and are recorded in the accompanying financial statements.
In cases where a split-interest agreement is administered by an outside trustee, the CU Foundation records the estimated fair value of future cash flows from the trust as a contribution receivable from charitable remainder trusts at the point at which the CU Foundation becomes aware of its interest in the trust. Under certain circumstances, the CU Foundation accepts and manages trust funds for which the University or the CU Foundation has beneficial interest but is not the sole beneficiary of the trust. Funds received for which the University or the CU Foundation is not the ultimate beneficiary are included as other liabilities in the accompanying financial statements and are not included in contributions revenue.
Custodial Funds consist of funds held by the CU Foundation for endowments legally owned by other entities, including the University.
Alternate Medicare Plan is described in Note 15.
Early Retirement Incentive Plan is described in Note 15.
Other Liabilities are addressed in Note 10 and consist of risk financing, construction contract retainage, funds held for others, and miscellaneous.
Net Position is classified in the accompanying financial statements as follows:
Net investment in capital assets represents the total investment in capital assets, net of outstanding debt obligations related to those capital assets. To the extent debt has been incurred but not yet expended for capital assets, such amounts are not included as a component of net investment in capital assets.
Restricted for nonexpendable purposes consists of endowments and similar instruments in which donors or other outside sources have stipulated, as a condition of the gift instrument, that the principal is to be maintained inviolate and in perpetuity, and invested for the purpose of producing present and future income, which may either be expended or added to principal.
Restricted for expendable purposes represents net resources in which the University or the DPCU is legally or contractually obligated to spend resources in accordance with restrictions imposed by external third parties.
Unrestricted net position represents net resources derived from student tuition and fees, fee-for-service contracts, and sales and services of educational departments. These resources are used for transactions relating to the educational and general operations of the University and may be used at the discretion of the Regents to meet current expenses for any purpose. These resources also include those from auxiliary enterprises, which are substantially self-supporting activities that provide services for students, faculty, and staff.
UNIVERSITY OF COLORADO NOTES TO FINANCIAL STATEMENTS
June 30, 2013 and 2012
34
Internal Transactions occur between University operating units, including its formal self-funded internal service units and blended component units. Examples of self-funded operating units are telecommunications, cogeneration, and storerooms. Transactions include the recognition of revenues, expenses, receivables, and payables in the appropriate accounts of the operating units. To accommodate external financial reporting, the internal revenues and receivables are netted against expenses and payables, respectively, and are eliminated at year end.
Classification of Revenues and Expenses in the accompanying financial statements has been made according to the following criteria:
Operating revenues are derived from activities associated with providing goods and services for instruction, research, public service, health services, or related support to entities separate from the University and that are exchange transactions. Examples include student tuition and fees, fee-for-service contracts, sales and services of auxiliary enterprises, healthcare and patient services, grants, and contracts. Tuition and fee revenue for sessions that are conducted over two fiscal years are allocated on a pro-rata basis. Operating revenues of the DPCU also include contributions, which are derived from their fundraising mission.
Other operating revenues include rental income, charges for services, transcript and diploma fees, other miscellaneous fees, and miscellaneous revenues from UPI.
Operating expenses are paid to acquire or produce goods and services provided in return for operating revenues and to carry out the mission of the University.
Nonoperating revenues and expenses include all revenues and related expenses that do not meet the definition of operating revenues, capital revenues, or endowment additions. They are primarily derived from activities that are non-exchange transactions (e.g., gifts, including those from the CU Foundation), from activities defined as such by the GASB cash flow standards (e.g., investment income) and also federal funds allocated to state governments, such as the Pell Grant, and insurance recoveries.
Scholarship Allowances are the difference between the stated charge for the goods and services provided by the University and the amount that is paid by the students or by other third parties making payments on the students’ behalf. Tuition and fee revenue and certain other auxiliary enterprise revenues are reported net of scholarship allowance in the accompanying financial statements. Certain grants from external governmental and private programs are recorded as either operating or nonoperating revenues in the accompanying financial statements. To the extent that such grant revenues are used to satisfy tuition and fees and other student charges, the University records scholarship allowances. Any excess grant revenues are recorded as student aid operating expense.
Health Services Revenue from Contractual Arrangements is recognized by UPI as a result of providing care to patients covered under various third parties such as Medicare and Medicaid, private insurance companies, and managed care programs, primarily from fixed-rate agreements. The federal and state government annually update fixed-rate agreements for Medicare and Medicaid, respectively. In addition to the standard Medicaid program, UPI provides substantial care to Medicaid patients under the Colorado Access program. Contractual arrangements with insurance companies and managed care plans are negotiated periodically for future years.
UNIVERSITY OF COLORADO NOTES TO FINANCIAL STATEMENTS
June 30, 2013 and 2012
35
Health services revenue is reported at the estimated net realizable amounts due from third-party payers and others for services rendered. Net patient services revenue includes care provided to patients who meet certain criteria under UPI's medically indigent care policy as reimbursed with funds provided by the State processed by the Hospital Authority, and co-payments made by care recipients. In accordance with UPI's mission and philosophy, UPI members annually provide substantial levels of charity care to patients who meet certain defined criteria. Charity care relates to services rendered for which no payment is expected.
Donor Restricted Endowment disbursements of the net appreciation (realized and unrealized) of investments of endowment gifts are permitted by state law, except where a donor has specified otherwise. The amount of earnings and net appreciation available for spending by the University and the CU Foundation is based on a spending rate set by the CU Foundation board on an annual basis. For the years ended June 30, 2013 and 2012, the authorized spending rate was equal to the greater of 4 percent of the current market value of the endowment or 4.5 percent of the endowment’s trailing 36-month average fair market value. Earnings in excess of the amount authorized for spending are available in future years and are included in the value of the related investment. Earnings authorized to be spent are recognized in the University’s financial statements as investment or gift revenue for University or CU Foundation-owned endowments, respectively. In Fiscal Years 2013 and 2012, there was $9,426,054 and $8,419,000, respectively, in net appreciation of investments available for authorization for expenditure as reported in restricted expendable net position.
Application of Restricted and Unrestricted Resources is made on a case-by-case basis by management depending on overall program resources.
Use of Estimates is made in order to prepare financial statements in conformity with accounting principles generally accepted in the United States of America. Management is required to make estimates and assumptions that affect the reported amounts of assets and liabilities and disclosure of contingent assets and liabilities at the date of the financial statements and the reported amounts of revenue and expense during the reporting period. Actual results could differ significantly from those estimates.
Reclassifications of certain prior year balances, including those made by the CU Foundation, have been made to conform to the current year’s financial statement presentation. Effective July 1, 2012, the University began offsetting certain revenue line items with associated bad debt expense. Prior to this date, bad debt expense was reported in the operating expense portion of the Statement of Revenues, Expenses, and Changes in Net Position. This change in reporting was made to conform to the Requirements of GASB No. 34 Basic Financial Statements – and Management’s Discussion and Analysis – for State and Local Governments, which requires revenues to be reported net of discounts and allowances. Prior to this reporting period, state-wide reporting limitations did not allow for the netting of bad debt expense against revenue. The impact of this reclassification was to decrease operating revenues and operating expenses for Fiscal Years 2013 and 2012 by $5,086,000 and $5,442,000, respectively. There was no impact on net position.
UNIVERSITY OF COLORADO NOTES TO FINANCIAL STATEMENTS
June 30, 2013 and 2012
36
NEW AND FUTURE ACCOUNTING PRONOUNCEMENTS Effective July 1, 2011, the University early adopted the provisions of GASB No. 65 “Items Previously Reported as Assets and Liabilities” (GASB No. 65). GASB No. 65 establishes accounting and financial reporting standards that reclassify, as deferred outflows of resources or deferred inflows of resources, certain items that were previously reported as assets and liabilities and recognizes, as outflows of resources or inflows of resources, certain items that were previously reported as assets and liabilities. Accounting changes to conform to the new provisions have been applied retroactively by restating the financial statements for the Fiscal Year Ended June 30, 2012, as prescribed by GASB No. 65. The primary impacts of the adoption of GASB No. 65 are (1) the reclassification of losses on debt refundings from noncurrent bonds, leases, and notes payable to deferred outflows of resources – loss on debt refunding (a new financial statement heading) and (2) the expensing of bond issuance costs rather than including as a component of other assets The impacts of these new provisions on the Fiscal Year 2012 financial statements are as follows:
Table 1.3. Fiscal Year 2012 Financial Statement Captions Impacted by the Adoption of GASB No. 65 (in thousands)
As Previously As Caption Reported Restated
Statement of Net PositionOther assets, noncurrent 16,840$ 9,083Bond, leases, and notes payable, noncurrent 1,256,996 1,288,441Deferred Outflows of Resources
Loss on debt refunding - 31,445Unrestricted Net Position 926,770 919,013
Statement of Revenues, Expenses, and Changesin Net Position
Interest expense on capital asset-related debt (46,723) (44,500)Bond issuance costs - (2,735)Net Position, end of the year 2,812,460 2,804,703
GASB No. 63 “Financial Reporting of Deferred Outflows of Resources, Deferred Inflows of Resources, and Net Position” (GASB No. 63) was early adopted in Fiscal Year 2012 and defines deferred outflow of resources as consumption of net assets by a government that is applicable to a future period. A deferred inflow of resources is defined as an acquisition of net assets applicable to future periods. The GASB issued Statement No. 68 Accounting and Financial Reporting for Pensions (Statement No. 68), which revises and establishes new financial reporting requirements for most governments that provide their employees with pension benefits. The University provides certain of its employees with pension benefits through the State’s multiple employer cost-sharing Public Employees’ Retirement Association (PERA) defined benefit retirement program.
UNIVERSITY OF COLORADO NOTES TO FINANCIAL STATEMENTS
June 30, 2013 and 2012
37
Statement No. 68 requires cost-sharing employers participating in the PERA program, such as the University, to record their proportionate share, as defined in Statement No. 68, of PERA’s unfunded pension liability. The University has no legal obligation to fund this shortfall nor does it have any ability to affect funding, benefit, or annual required contribution decisions made by PERA or the General Assembly. The requirement of Statement No. 68 to record a portion of PERA’s unfunded liability will negatively impact the University’s future unrestricted net position. Statement No. 68 is effective for Fiscal Year 2015. At this time, management is unable to estimate the magnitude of this impact. Information regarding PERA’s current funding status can be found in its Comprehensive Annual Financial Report.
NOTE 2 – CASH AND CASH EQUIVALENTS
The University’s cash and cash equivalents are detailed in Table 2, Cash and Cash Equivalents.
2013 2012University
Cash on hand (petty cash and change funds) 363 361 Deposits with U.S. financial institutions 75,986 56,803 Deposits with foreign financial institutions 61 71
Total Cash and Cash Equivalents – University $ 76,410 57,235
Table 2. Cash and Cash Equivalents (in thousands)
Custodial credit risk for deposits is the risk that in the event of a bank failure, the University’s deposits may not be returned to it. To manage custodial credit risk, deposits with U.S. and foreign financial institutions are made in accordance with University and State policy, including the Public Deposit Protection Act (PDPA). PDPA requires all eligible depositories holding public deposits to pledge designated eligible collateral having market value equal to at least 102 percent of the deposits exceeding those amounts insured by federal depository insurance. Deposits collateralized under the PDPA are considered to be collateralized with securities held by the pledging institution in the University’s name. Deposits with foreign financial institutions are not PDPA-eligible deposits and thus are exposed to custodial credit risk and require separate authorization as depositories by the State. During the years ended June 30, 2013 and 2012, all deposits with foreign financial institutions were authorized.
NOTE 3 – INVESTMENTS
The University’s investments generally include direct obligations of the U.S. government and its agencies, commercial paper, municipal and corporate bonds, asset-backed securities, mortgage-backed securities, mutual funds, repurchase agreements, corporate equities, certificates of deposit, and alternative non-equity securities. CU Foundation investments are similar to the University’s but also include alternative non-equity securities in hedge funds and oil and gas. Endowments are pooled to the extent possible under gift agreements. The CU Foundation manages certain of these endowments for the University in accordance with its investment policy. Details of investments by type for both the University and the CU Foundation are included in Table 3.1, Investments.
UNIVERSITY OF COLORADO NOTES TO FINANCIAL STATEMENTS
June 30, 2013 and 2012
38
To the extent permitted, and excluding the University’s blended entities, the University pools cash balances for investment purposes. An investment policy statement approved by the Regents directs the Treasurer of the University to meet the following investment objectives:
liquidity for daily operations,
protection of the nominal value of assets, and
generation of distributable earnings at a level commensurate with the time horizon of the investments.
For financial statement purposes, investment income (loss) is reported on a total return basis and is allocated among operational units based on average daily balances, using amortized costs. Average daily balances approximated $1,348,543,000 and $1,269,578,000 for the years ended June 30, 2013 and 2012, respectively. The total return on this pool was 7.8 and 1.1 percent for the years ended June 30, 2013 and 2012, respectively.
CUSTODIAL CREDIT RISK
Custodial credit risk for investments is the risk that, in the event of the failure of the counterparty, the University will not be able to recover the value of its investments or collateral securities that are in the possession of an outside party. Therefore, exposure arises if the securities are uninsured, not registered in the University’s name, and are held by either the counterparty to the investment purchase or the counterparty’s trust department or agent but not in the University’s name. Open-ended mutual funds and certain other investments are not subject to custodial risk because ownership of the investment is not evidenced by a security. None of the University’s investments are subject to custodial risk.

UNIVERSITY OF COLORADO NOTES TO FINANCIAL STATEMENTS
June 30, 2013 and 2012
39
Investment Type 2013 2012
UniversityU.S. government securities $ 276,052 273,085 Certificates of deposit 2,480 963 Commercial paper 8,145 4,050 Corporate bonds 175,301 167,714 Corporate equities 155,535 123,921 Municipal bonds 16,889 8,583 Mutual funds 889,930 806,030 Municipal securities - 5,289 Repurchase agreements 237,264 199,539 Asset-backed securities 137,865 127,135 Alternative non-equity securities: Absolute return fund 57,337 42,230 Private equity 39,010 36,299 Real estate 22,471 21,305 Venture capital 14,548 14,619 Other 11,659 7,196
Total Investments – University $ 2,044,486 1,837,958
CU FoundationCash equivalents $ 15,511 $ 13,227 Equity securities:
Domestic 254,126 237,247 International 259,727 170,945
Fixed-income securities 167,081 174,009 Alternative non-equity securities:
Real estate 54,727 109,683 Private equity 160,681 58,790 Hedge funds 81,403 27,736 Absolute return funds 115,582 143,886 Venture capital 60,202 72,490 Oil and gas 26,113 55,445 Commodities 7,964 - Other 869 868
Total Investments – CU Foundation $ 1,203,986 1,064,326
Table 3. 1. Investments (in thousands)
CREDIT QUALITY RISK
Credit risk is the risk that an issuer or other counterparty to an investment will not fulfill its obligations. Credit risk only applies to debt investments. This risk is assessed by national rating agencies, which assign a credit quality rating for many investments. The University’s investment policies for the Treasury pool do not permit investments in debt securities that are below investment grade at the time the security is purchased. University policy allows no more than 20 percent of investments to be rated below A (Standard and Poor’s) or A3 (Moody’s) at the time of purchase. There are two other investment policies tailored to non-pooled investments. Those policies do not restrict investments to a particular credit quality standard. Credit quality ratings are not required for obligations of the U.S. government or obligations explicitly guaranteed by the U.S.
UNIVERSITY OF COLORADO NOTES TO FINANCIAL STATEMENTS
June 30, 2013 and 2012
40
Government. The CU Foundation does not have a policy concerning credit quality risk. A summary of the University’s debt investments and credit quality risk as of June 30, 2013, and 2012 is shown in Table 3.2, Debt Investments and Credit Quality Risk. The University obtains ratings from both Moody’s and Standard and Poors, and primarily reflects the Moody’s ratings in Table 3.2 unless S&P is lower. The ratings reflected are Moody’s for UPI, and S&P for the CU Foundation. Table 3.2 is a subset of Table 3.1 and does not include $814,852,000 of non-debt securities and $174,256,000 of debt investments that are backed by the full faith and credit of the U.S. government in Fiscal Year 2013, and does not include $628,359,000 of non-debt securities and $115,114,000 of debt investments that are backed by the full faith and credit of the U.S. government in Fiscal Year 2012.
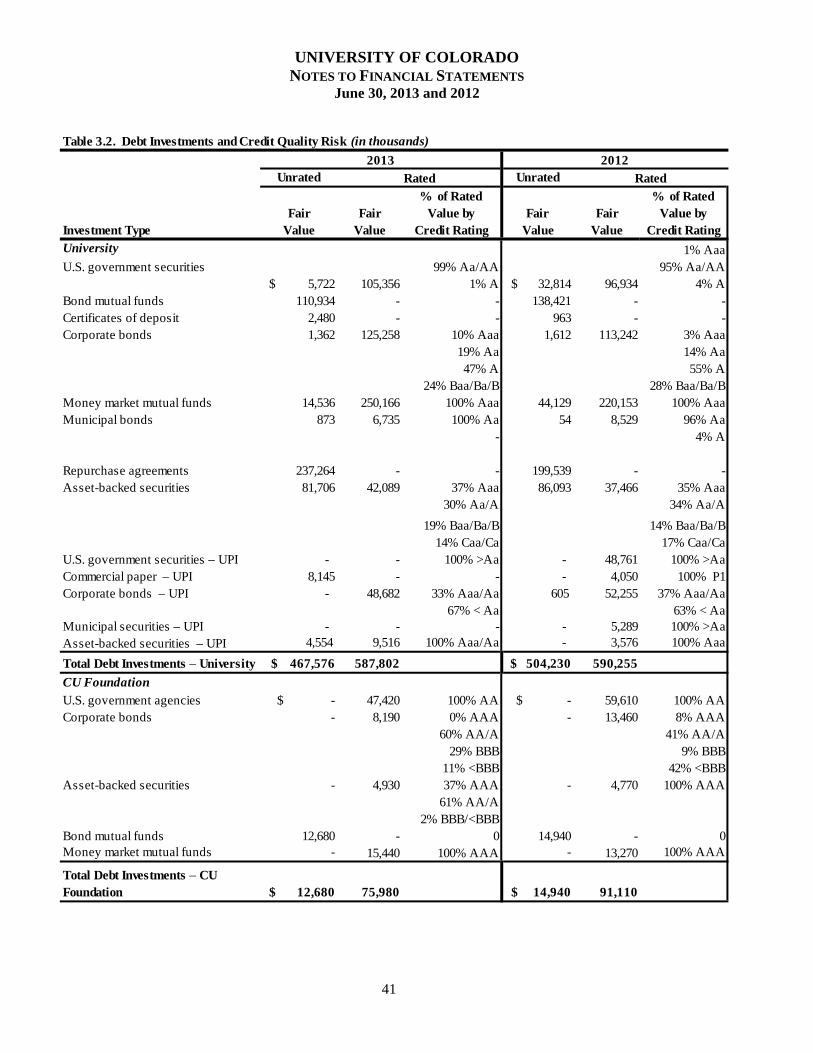
UNIVERSITY OF COLORADO NOTES TO FINANCIAL STATEMENTS
June 30, 2013 and 2012
41
Unrated Unrated
% of Rated % of Rated Fair Fair Value by Fair Fair Value by
Value Value Credit Rating Value Value Credit RatingUniversity 1% AaaU.S. government securities 99% Aa/AA 95% Aa/AA
1% A 4% ABond mutual funds 110,934 - - 138,421 - -Certificates of deposit 2,480 - - 963 - -
10% Aaa 3% Aaa19% Aa 14% Aa47% A 55% A
24% Baa/Ba/B 28% Baa/Ba/BMoney market mutual funds 14,536 250,166 100% Aaa 44,129 220,153 100% Aaa
100% Aa 96% Aa- 4% A
Repurchase agreements 237,264 - - 199,539 - - 37% Aaa 86,093 35% Aaa
30% Aa/A 34% Aa/A
19% Baa/Ba/B 14% Baa/Ba/B14% Caa/Ca 17% Caa/Ca
U.S. government securities – UPI - - 100% >Aa - 48,761 100% >AaCommercial paper – UPI 8,145 - - - 4,050 100% P1Corporate bonds – UPI - 48,682 33% Aaa/Aa
67% < Aa 605 52,255 37% Aaa/Aa
63% < AaMunicipal securities – UPI - - - - 5,289 100% >AaAsset-backed securities – UPI 4,554 9,516 100% Aaa/Aa - 3,576 100% Aaa
Total Debt Investments – University $ 467,576 587,802 $ 504,230 590,255
CU FoundationU.S. government agencies $ - 47,420 100% AA $ - 59,610 100% AA
- 8,190 0% AAA - 13,460 8% AAA60% AA/A 41% AA/A
29% BBB 9% BBB11% <BBB 42% <BBB
- 4,930 37% AAA - 4,770 100% AAA61% AA/A
2% BBB/<BBBBond mutual funds 12,680 - 0 14,940 - 0Money market mutual funds - 15,440 100% AAA - 13,270 100% AAA
Total Debt Investments – CU Foundation $ 12,680 75,980 $ 14,940 91,110
113,242
Asset-backed securities 81,706 42,089 37,466
Municipal bonds 873 6,735 54 8,529
Asset-backed securities
Corporate bonds
Table 3.2. Debt Investments and Credit Quality Risk (in thousands)
Investment Type
2013 2012Rated Rated
$ 5,722 105,356 $ 32,814 96,934
Corporate bonds 1,362 125,258 1,612
UNIVERSITY OF COLORADO NOTES TO FINANCIAL STATEMENTS
June 30, 2013 and 2012
42
INTEREST RATE RISK
Interest rate risk is the risk that changes in the market rate of interest will adversely affect the value of an investment. Interest rate risk only applies to debt investments. The University, except for UPI, manages interest rate risk in its investment portfolios by managing the duration, the maximum maturity, or both. University investment policies establish duration and maturity guidelines for each portfolio. The duration method uses the present value of cash flows, weighted for those cash flows as a percentage of the investment’s full price. UPI manages interest rate risk using weighted average maturity. Weighted average maturity is a measure of the time to maturity in years that has been weighted to reflect the dollar size of the individual investment within an investment type. The University’s investment policy mitigates interest rate risk through the use of maturity limits for each of the investment segment pools.
A summary of the fair value of the University’s debt investments and interest rate risk as of June 30, 2013 and 2012 is shown in Table 3.3, Debt Investments and Interest Rate Risk. Table 3.3 is a subset of Table 3.1 and does not include $1,079,610,000 of non-debt securities in Fiscal Year 2013, and does not include $1,112,718,000 of non-debt securities in Fiscal Year 2012. The main difference in the amount of non-debt securities excluded in Table 3.2 and Table 3.3 is that money-market mutual funds are included in Table 3.2 as they have credit risk but they are excluded from Table 3.3 as they do not have interest rate risk. Also, US backed securities are not subject to credit risks but are subject to interest rate risks and are included here but not in the credit quality risk section.
The University has investments in asset-backed securities, which consist mainly of mortgages, home equity loans, student loans, automobile loans, equipment trusts, and credit card receivables. These securities are based on cash flows from principal and interest payments on the underlying securities. An asset-backed security has repayments that are expected to significantly vary with interest rate changes. The variance may present itself in terms of variable repayment amounts and uncertain early or extended repayments.
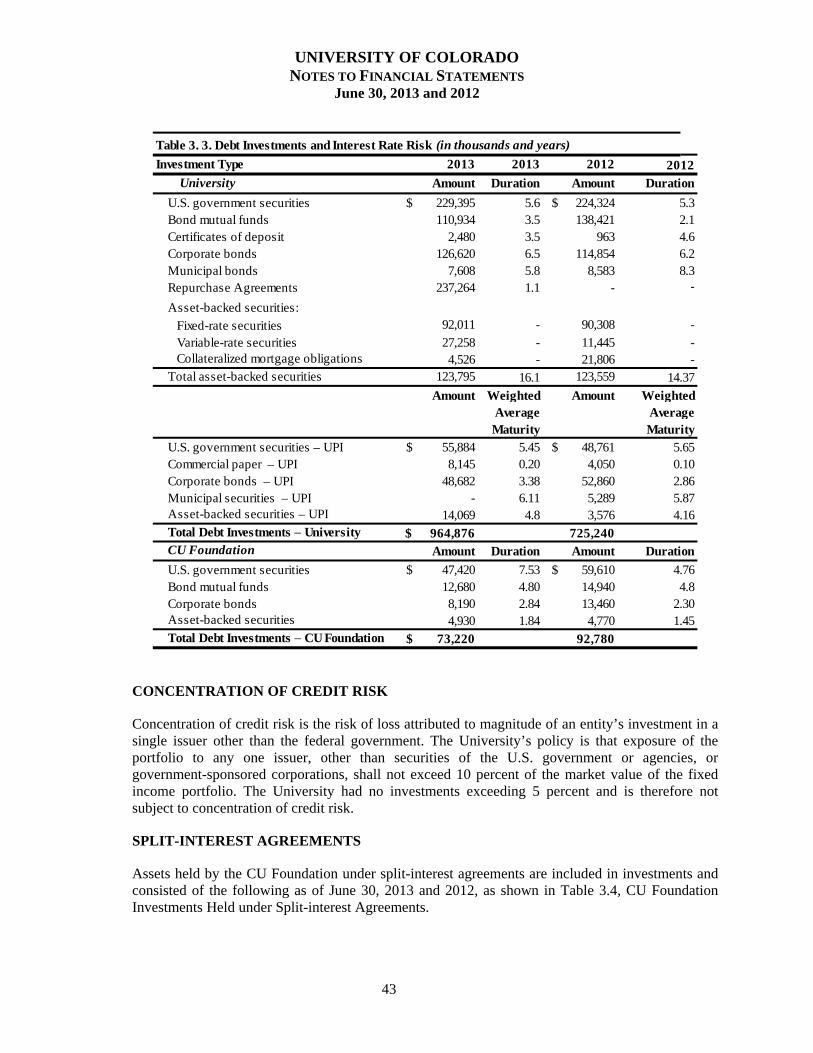
UNIVERSITY OF COLORADO NOTES TO FINANCIAL STATEMENTS
June 30, 2013 and 2012
43
Investment Type 2013 2013 2012
University Amount Duration Amount
U.S. government securities $ 229,395 5.6 $ 224,324 Bond mutual funds 110,934 3.5 138,421Certificates of deposit 2,480 3.5 963 Corporate bonds 126,620 6.5 114,854Municipal bonds 7,608 5.8 8,583Repurchase Agreements 237,264 1.1 - -
Asset-backed securities:
Fixed-rate securities 92,011 - 90,308
Variable-rate securities 27,258 - 11,445 Collateralized mortgage obligations 4,526 - 21,806 Total asset-backed securities 123,795 16.1 123,559
Amount Weighted Average Maturity
Amount
U.S. government securities – UPI $ 55,884 5.45 $ 48,761 Commercial paper – UPI 8,145 0.20 4,050Corporate bonds – UPI 48,682 3.38 52,860Municipal securities – UPI - 6.11 5,289Asset-backed securities – UPI 14,069 4.8 3,576Total Debt Investments – University $ 964,876 725,240 CU Foundation Amount Duration Amount
U.S. government securities $ 47,420 7.53 $ 59,610 Bond mutual funds 12,680 4.80 14,940 Corporate bonds 8,190 2.84 13,460 Asset-backed securities 4,930 1.84 4,770 Total Debt Investments – CU Foundation $ 73,220 92,780
2.301.45
4.8
14.37
Weighted Average Maturity
5.650.10
5.874.16
Duration
4.76
2.86
-
Table 3. 3. Debt Investments and Interest Rate Risk (in thousands and years)
2012
Duration
5.32.1
6.28.3
-
-
4.6
CONCENTRATION OF CREDIT RISK
Concentration of credit risk is the risk of loss attributed to magnitude of an entity’s investment in a single issuer other than the federal government. The University’s policy is that exposure of the portfolio to any one issuer, other than securities of the U.S. government or agencies, or government-sponsored corporations, shall not exceed 10 percent of the market value of the fixed income portfolio. The University had no investments exceeding 5 percent and is therefore not subject to concentration of credit risk.
SPLIT-INTEREST AGREEMENTS
Assets held by the CU Foundation under split-interest agreements are included in investments and consisted of the following as of June 30, 2013 and 2012, as shown in Table 3.4, CU Foundation Investments Held under Split-interest Agreements.
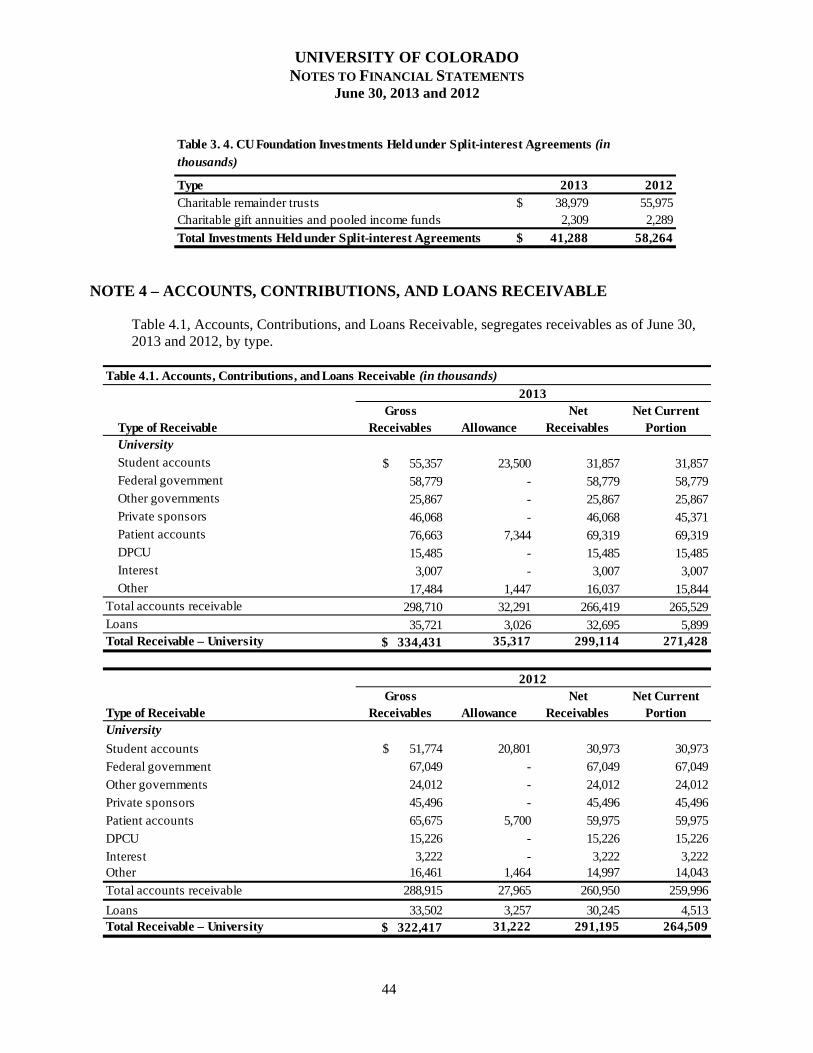
UNIVERSITY OF COLORADO NOTES TO FINANCIAL STATEMENTS
June 30, 2013 and 2012
44
Type 2013 2012Charitable remainder trusts $ 38,979 55,975 Charitable gift annuities and pooled income funds 2,309 2,289
Total Investments Held under Split-interest Agreements $ 41,288 58,264
Table 3. 4. CU Foundation Investments Held under Split-interest Agreements (in
thousands)
NOTE 4 – ACCOUNTS, CONTRIBUTIONS, AND LOANS RECEIVABLE
Table 4.1, Accounts, Contributions, and Loans Receivable, segregates receivables as of June 30, 2013 and 2012, by type.
Type of Receivable Gross
Receivables AllowanceNet
ReceivablesNet Current
PortionUniversityStudent accounts $ 55,357 23,500 31,857 31,857Federal government 58,779 - 58,779 58,779Other governments 25,867 - 25,867 25,867Private sponsors 46,068 - 46,068 45,371Patient accounts 76,663 7,344 69,319 69,319DPCU 15,485 - 15,485 15,485Interest 3,007 - 3,007 3,007Other 17,484 1,447 16,037 15,844
Total accounts receivable 298,710 32,291 266,419 265,529Loans 35,721 3,026 32,695 5,899 Total Receivable – University $ 334,431 35,317 299,114 271,428
Type of ReceivableGross
Receivables AllowanceNet
ReceivablesNet Current
PortionUniversity
Student accounts $ 51,774 20,801 30,973 30,973
Federal government 67,049 - 67,049 67,049
Other governments 24,012 - 24,012 24,012
Private sponsors 45,496 - 45,496 45,496
Patient accounts 65,675 5,700 59,975 59,975
DPCU 15,226 - 15,226 15,226
Interest 3,222 - 3,222 3,222Other 16,461 1,464 14,997 14,043
Total accounts receivable 288,915 27,965 260,950 259,996
Loans 33,502 3,257 30,245 4,513 Total Receivable – University $ 322,417 31,222 291,195 264,509
Table 4.1. Accounts, Contributions, and Loans Receivable (in thousands)
2013
2012
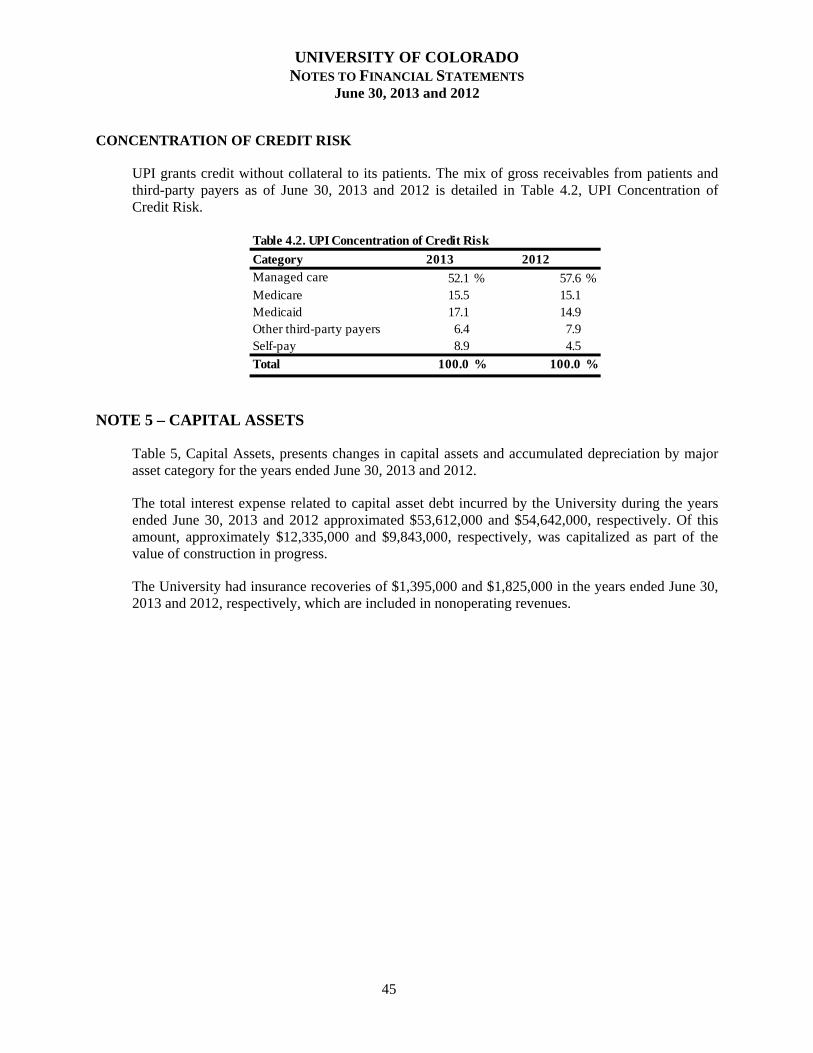
UNIVERSITY OF COLORADO NOTES TO FINANCIAL STATEMENTS
June 30, 2013 and 2012
45
CONCENTRATION OF CREDIT RISK
UPI grants credit without collateral to its patients. The mix of gross receivables from patients and third-party payers as of June 30, 2013 and 2012 is detailed in Table 4.2, UPI Concentration of Credit Risk.
Category 2013 2012Managed care 52.1 % 57.6 %Medicare 15.5 15.1Medicaid 17.1 14.9Other third-party payers 6.4 7.9Self-pay 8.9 4.5
Total 100.0 % 100.0 %
Table 4.2. UPI Concentration of Credit Risk
NOTE 5 – CAPITAL ASSETS
Table 5, Capital Assets, presents changes in capital assets and accumulated depreciation by major asset category for the years ended June 30, 2013 and 2012.
The total interest expense related to capital asset debt incurred by the University during the years ended June 30, 2013 and 2012 approximated $53,612,000 and $54,642,000, respectively. Of this amount, approximately $12,335,000 and $9,843,000, respectively, was capitalized as part of the value of construction in progress.
The University had insurance recoveries of $1,395,000 and $1,825,000 in the years ended June 30, 2013 and 2012, respectively, which are included in nonoperating revenues.
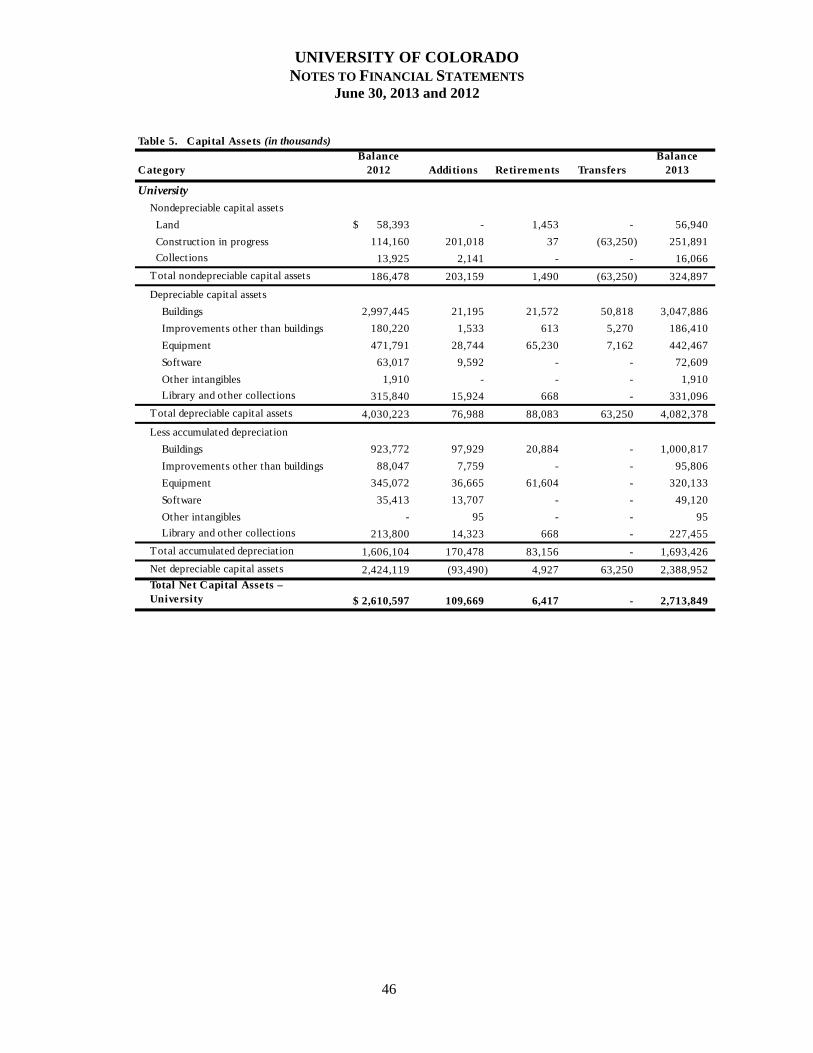
UNIVERSITY OF COLORADO NOTES TO FINANCIAL STATEMENTS
June 30, 2013 and 2012
46
CategoryBalance
2012 Additions Retirements TransfersBalance
2013
Nondepreciable capital assets
Land $ 58,393 - 1,453 - 56,940
Construction in progress 114,160 201,018 37 (63,250) 251,891
Collections 13,925 2,141 - - 16,066
Total nondepreciable capital assets 186,478 203,159 1,490 (63,250) 324,897
Depreciable capital assets
Buildings 2,997,445 21,195 21,572 50,818 3,047,886
Improvements other than buildings 180,220 1,533 613 5,270 186,410
Equipment 471,791 28,744 65,230 7,162 442,467
Software 63,017 9,592 - - 72,609
Other intangibles 1,910 - - - 1,910
Library and other collections 315,840 15,924 668 - 331,096
Total depreciable capital assets 4,030,223 76,988 88,083 63,250 4,082,378
Less accumulated depreciation
Buildings 923,772 97,929 20,884 - 1,000,817
Improvements other than buildings 88,047 7,759 - - 95,806
Equipment 345,072 36,665 61,604 - 320,133
Software 35,413 13,707 - - 49,120
Other intangibles - 95 - - 95
Library and other collections 213,800 14,323 668 - 227,455
Total accumulated depreciation 1,606,104 170,478 83,156 - 1,693,426
Net depreciable capital assets 2,424,119 (93,490) 4,927 63,250 2,388,952Total Net Capital Assets – University $ 2,610,597 109,669 6,417 - 2,713,849
University
Table 5. Capital Assets (in thousands)
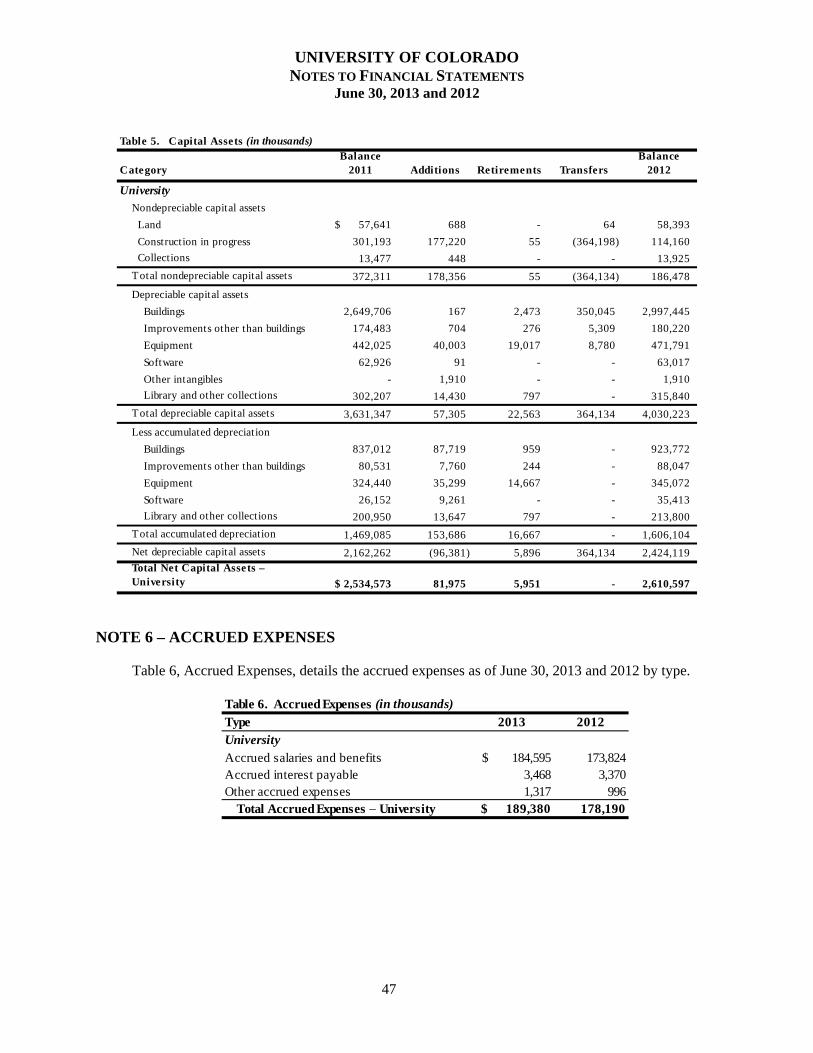
UNIVERSITY OF COLORADO NOTES TO FINANCIAL STATEMENTS
June 30, 2013 and 2012
47
CategoryBalance
2011 Additions Retirements TransfersBalance
2012
Nondepreciable capital assets
Land $ 57,641 688 - 64 58,393
Construction in progress 301,193 177,220 55 (364,198) 114,160
Collections 13,477 448 - - 13,925
Total nondepreciable capital assets 372,311 178,356 55 (364,134) 186,478
Depreciable capital assets
Buildings 2,649,706 167 2,473 350,045 2,997,445
Improvements other than buildings 174,483 704 276 5,309 180,220
Equipment 442,025 40,003 19,017 8,780 471,791
Software 62,926 91 - - 63,017
Other intangibles - 1,910 - - 1,910
Library and other collections 302,207 14,430 797 - 315,840
Total depreciable capital assets 3,631,347 57,305 22,563 364,134 4,030,223
Less accumulated depreciation
Buildings 837,012 87,719 959 - 923,772
Improvements other than buildings 80,531 7,760 244 - 88,047
Equipment 324,440 35,299 14,667 - 345,072
Software 26,152 9,261 - - 35,413
Library and other collections 200,950 13,647 797 - 213,800
Total accumulated depreciation 1,469,085 153,686 16,667 - 1,606,104
Net depreciable capital assets 2,162,262 (96,381) 5,896 364,134 2,424,119Total Net Capital Assets – University $ 2,534,573 81,975 5,951 - 2,610,597
Table 5. Capital Assets (in thousands)
University
NOTE 6 – ACCRUED EXPENSES
Table 6, Accrued Expenses, details the accrued expenses as of June 30, 2013 and 2012 by type.
Type 2013 2012UniversityAccrued salaries and benefits $ 184,595 173,824 Accrued interest payable 3,468 3,370 Other accrued expenses 1,317 996
Total Accrued Expenses – University $ 189,380 178,190
Table 6. Accrued Expenses (in thousands)
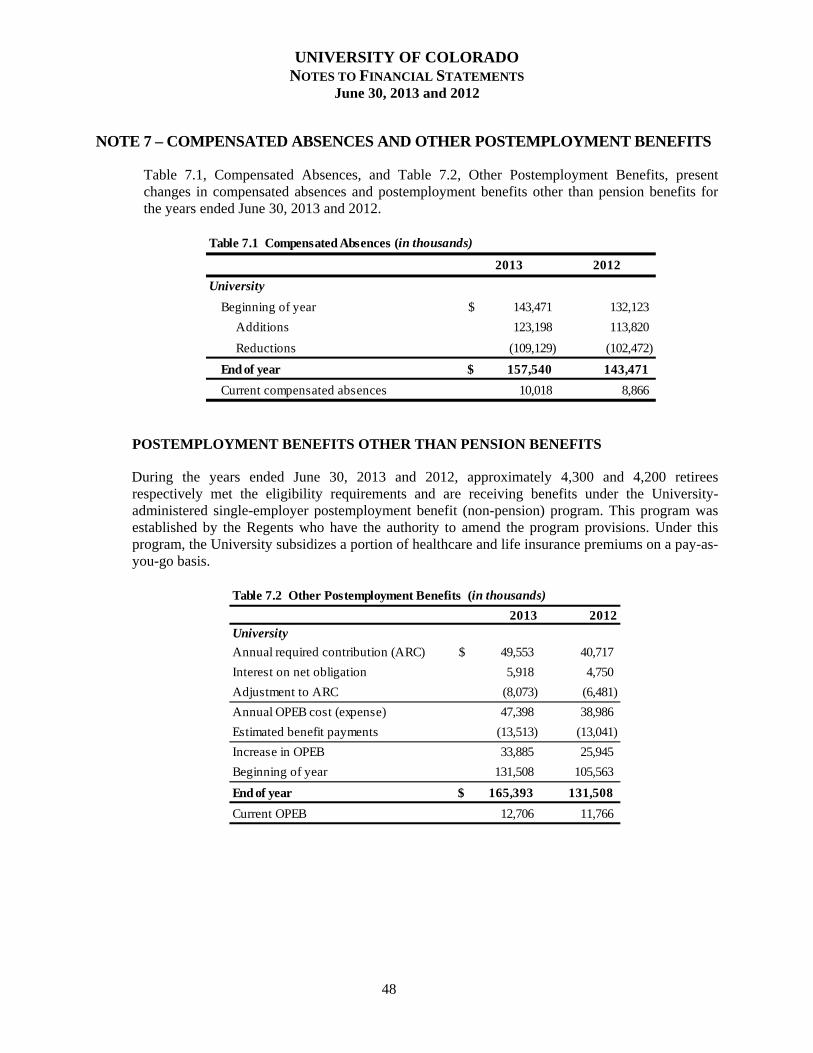
UNIVERSITY OF COLORADO NOTES TO FINANCIAL STATEMENTS
June 30, 2013 and 2012
48
NOTE 7 – COMPENSATED ABSENCES AND OTHER POSTEMPLOYMENT BENEFITS
Table 7.1, Compensated Absences, and Table 7.2, Other Postemployment Benefits, present changes in compensated absences and postemployment benefits other than pension benefits for the years ended June 30, 2013 and 2012.
2013 2012
University
Beginning of year 143,471$ 132,123
Additions 123,198 113,820
Reductions (109,129) (102,472)
End of year 157,540$ 143,471
Current compensated absences 10,018 8,866
Table 7.1 Compensated Absences (in thousands)
POSTEMPLOYMENT BENEFITS OTHER THAN PENSION BENEFITS
During the years ended June 30, 2013 and 2012, approximately 4,300 and 4,200 retirees respectively met the eligibility requirements and are receiving benefits under the University-administered single-employer postemployment benefit (non-pension) program. This program was established by the Regents who have the authority to amend the program provisions. Under this program, the University subsidizes a portion of healthcare and life insurance premiums on a pay-as-you-go basis.
2013 2012University
Annual required contribution (ARC) 49,553$ 40,717
Interest on net obligation 5,918 4,750
Adjustment to ARC (8,073) (6,481)
Annual OPEB cost (expense) 47,398 38,986
Estimated benefit payments (13,513) (13,041)
Increase in OPEB 33,885 25,945
Beginning of year 131,508 105,563
End of year 165,393$ 131,508
Current OPEB 12,706 11,766
Table 7.2 Other Postemployment Benefits (in thousands)
UNIVERSITY OF COLORADO NOTES TO FINANCIAL STATEMENTS
June 30, 2013 and 2012
49
Funded Status and Funding Progress. As of July 1, 2012, the most recent actuarial valuation date, the plan was 0 percent funded, and the actuarial accrued liability for benefits was $406,782,000. The actuarial value of assets was $0, resulting in an unfunded actuarial accrued liability (UAAL) of $406,782,000. For the year ended June 30, 2013, the covered payroll (annual payroll of active employees covered by the program) was $1,141,100,000, and the ratio of the UAAL to the covered payroll was 35.65 percent.
For the years ended June 30, 2013, 2012 and 2011, the annual OPEB cost was $47,398,000, $38,986,000, and $39,419,000, respectively. The University contributed $11,608,000, $10,805,000, and $8,865,000, respectively, which was 25 percent, 28 percent, and 22 percent, respectively, of the annual OPEB cost. The net OPEB obligation was $165,393,000, $131,508,000, and $105,563,000, respectively. Actuarial Methods and Assumptions. Actuarial valuations of an ongoing program involve estimates of the value of reported amounts and assumptions about the probability of occurrence of events far into the future. Examples include assumptions about future employment, mortality, and the healthcare cost trend. Amounts determined regarding the funded status of the program and the annual required contributions of the employer are subject to continual revision as actual results are compared with past expectations and new estimates are made about the future.
Projections of benefits for financial reporting purposes are based on the substantive program (the program as understood by the employer and the program members) and include the types of benefits provided at the time of each valuation and the historical pattern of sharing of benefit costs between the employer and program members to that point. The actuarial methods and assumptions used include techniques that are designed to reduce the effects of short-term volatility in actuarial accrued liabilities and the actuarial value of assets, consistent with the long-term perspective of the calculations.
The projected unit credit actuarial cost method is used. The discount rate used in the valuation is 4.5 percent based on the University’s expected long-term rate of return. The healthcare trend assumption reflects healthcare cost inflation expected to impact the plan based on forecast information in published papers from industry experts (actuaries, health economists, etc.). This research suggests a 8 percent long-term average increase for all healthcare benefits, trending down to an ultimate 5 percent increase for 2022 and later years. It was assumed that all members would be entitled to the maximum life insurance benefit amount; therefore, no salary increase rate is assumed. The UAAL is being amortized as a level dollar on an open basis over a period of 30 years. PERA POST-RETIREMENT HEALTH CARE AND LIFE INSURANCE BENEFITS
The PERA Health Care Program began covering benefit recipients and qualified dependents on July 1, 1986. This benefit was developed after legislation in 1985 established PERA and the Health Care Fund; PERA was converted to a trust fund in 1999. The plan is a cost-sharing multiple-employer plan under which PERA subsidizes a portion of the monthly premium for health care coverage. The benefits and employer contributions are established in statute and may be amended by the General Assembly. PERA includes the Health Care Trust Fund in its Comprehensive Annual Financial Report, which may be obtained by writing PERA at P.O. Box 5800, Denver, Colorado 80217, by calling PERA at 1-800-759-PERA (7372), or by visiting http://www.copera.org.
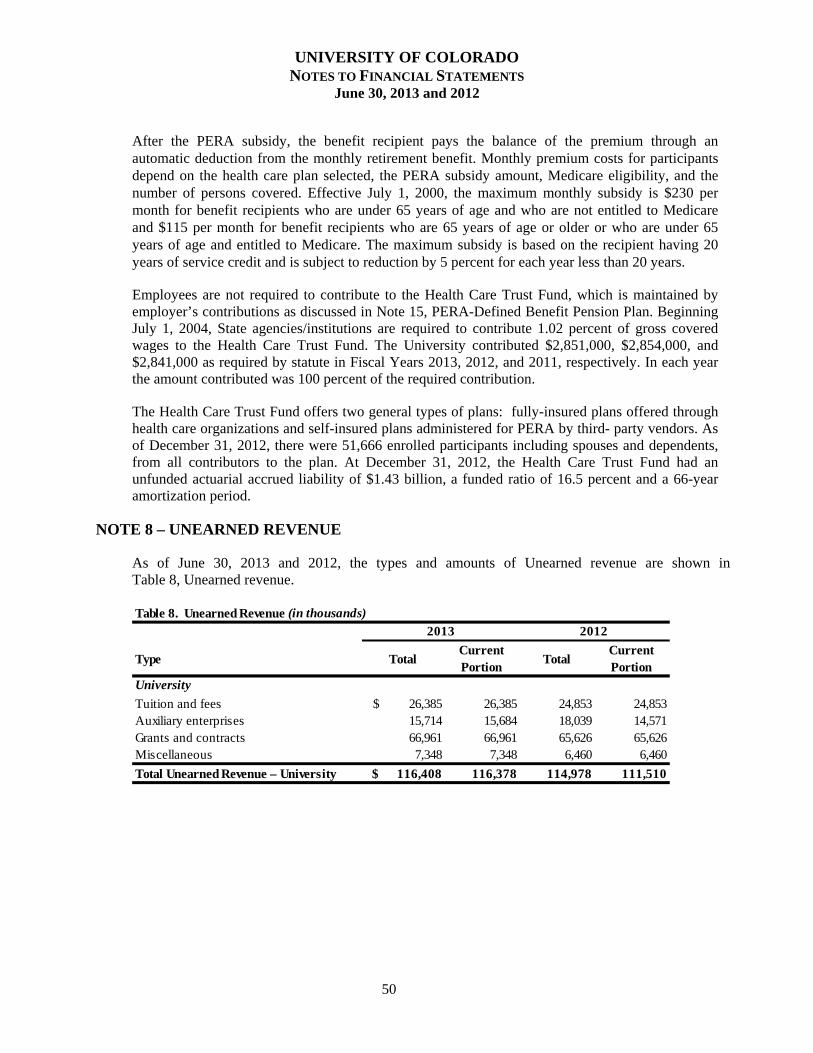
UNIVERSITY OF COLORADO NOTES TO FINANCIAL STATEMENTS
June 30, 2013 and 2012
50
After the PERA subsidy, the benefit recipient pays the balance of the premium through an automatic deduction from the monthly retirement benefit. Monthly premium costs for participants depend on the health care plan selected, the PERA subsidy amount, Medicare eligibility, and the number of persons covered. Effective July 1, 2000, the maximum monthly subsidy is $230 per month for benefit recipients who are under 65 years of age and who are not entitled to Medicare and $115 per month for benefit recipients who are 65 years of age or older or who are under 65 years of age and entitled to Medicare. The maximum subsidy is based on the recipient having 20 years of service credit and is subject to reduction by 5 percent for each year less than 20 years.
Employees are not required to contribute to the Health Care Trust Fund, which is maintained by employer’s contributions as discussed in Note 15, PERA-Defined Benefit Pension Plan. Beginning July 1, 2004, State agencies/institutions are required to contribute 1.02 percent of gross covered wages to the Health Care Trust Fund. The University contributed $2,851,000, $2,854,000, and $2,841,000 as required by statute in Fiscal Years 2013, 2012, and 2011, respectively. In each year the amount contributed was 100 percent of the required contribution.
The Health Care Trust Fund offers two general types of plans: fully-insured plans offered through health care organizations and self-insured plans administered for PERA by third- party vendors. As of December 31, 2012, there were 51,666 enrolled participants including spouses and dependents, from all contributors to the plan. At December 31, 2012, the Health Care Trust Fund had an unfunded actuarial accrued liability of $1.43 billion, a funded ratio of 16.5 percent and a 66-year amortization period.
NOTE 8 – UNEARNED REVENUE
As of June 30, 2013 and 2012, the types and amounts of Unearned revenue are shown in Table 8, Unearned revenue.
Type TotalCurrent Portion
TotalCurrent Portion
University
Tuition and fees $ 26,385 26,385 24,853 24,853 Auxiliary enterprises 15,714 15,684 18,039 14,571 Grants and contracts 66,961 66,961 65,626 65,626 Miscellaneous 7,348 7,348 6,460 6,460
Total Unearned Revenue – University $ 116,408 116,378 114,978 111,510
Table 8. Unearned Revenue (in thousands)
2013 2012
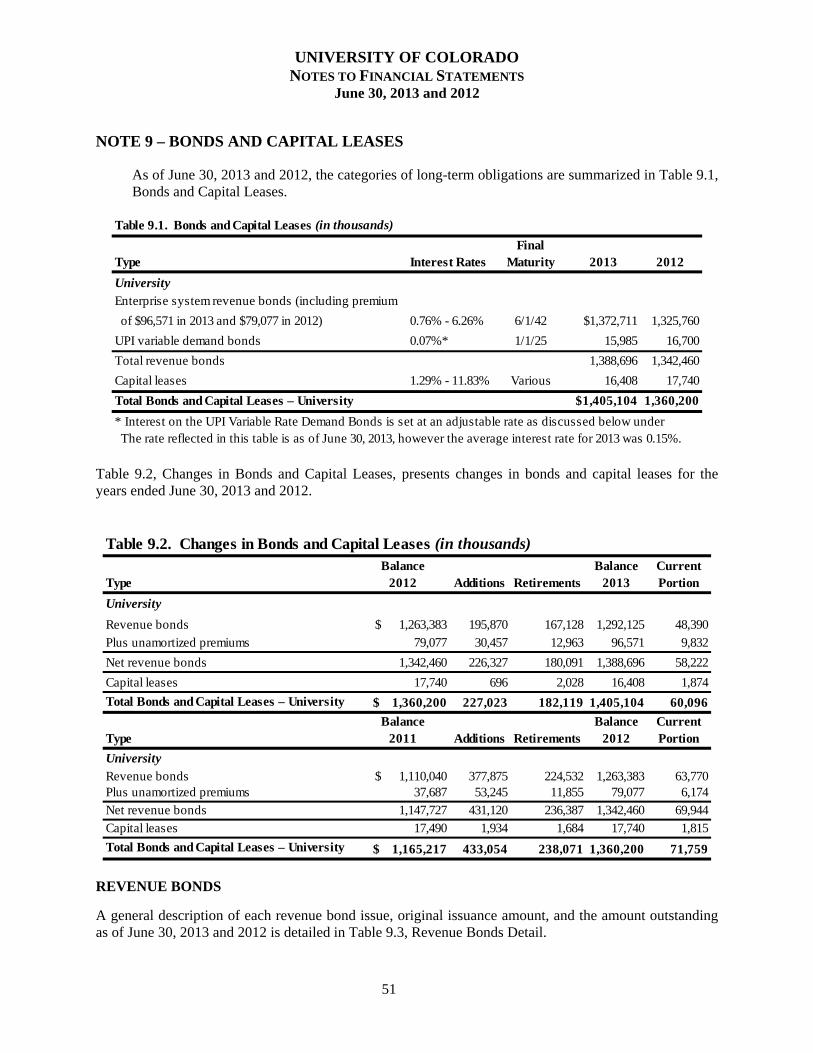
UNIVERSITY OF COLORADO NOTES TO FINANCIAL STATEMENTS
June 30, 2013 and 2012
51
NOTE 9 – BONDS AND CAPITAL LEASES
As of June 30, 2013 and 2012, the categories of long-term obligations are summarized in Table 9.1, Bonds and Capital Leases.
Type Interest RatesFinal
Maturity 2013 2012
UniversityEnterprise system revenue bonds (including premium
of $96,571 in 2013 and $79,077 in 2012) 0.76% - 6.26% 6/1/42 $1,372,711 1,325,760
UPI variable demand bonds 0.07%* 1/1/25 15,985 16,700
Total revenue bonds 1,388,696 1,342,460
Capital leases 1.29% - 11.83% Various 16,408 17,740
Total Bonds and Capital Leases – University $1,405,104 1,360,200
Table 9.1. Bonds and Capital Leases (in thousands)
* Interest on the UPI Variable Rate Demand Bonds is set at an adjustable rate as discussed below under The rate reflected in this table is as of June 30, 2013, however the average interest rate for 2013 was 0.15%.
Table 9.2, Changes in Bonds and Capital Leases, presents changes in bonds and capital leases for the years ended June 30, 2013 and 2012.
Table 9.2. Changes in Bonds and Capital Leases (in thousands)
TypeBalance
2012 Additions RetirementsBalance
2013Current Portion
University
Revenue bonds $ 1,263,383 195,870 167,128 1,292,125 48,390
Plus unamortized premiums 79,077 30,457 12,963 96,571 9,832
Net revenue bonds 1,342,460 226,327 180,091 1,388,696 58,222
Capital leases 17,740 696 2,028 16,408 1,874
Total Bonds and Capital Leases – University $ 1,360,200 227,023 182,119 1,405,104 60,096
TypeBalance
2011 Additions RetirementsBalance
2012Current Portion
UniversityRevenue bonds $ 1,110,040 377,875 224,532 1,263,383 63,770Plus unamortized premiums 37,687 53,245 11,855 79,077 6,174
Net revenue bonds 1,147,727 431,120 236,387 1,342,460 69,944
Capital leases 17,490 1,934 1,684 17,740 1,815
Total Bonds and Capital Leases – University $ 1,165,217 433,054 238,071 1,360,200 71,759
REVENUE BONDS
A general description of each revenue bond issue, original issuance amount, and the amount outstanding as of June 30, 2013 and 2012 is detailed in Table 9.3, Revenue Bonds Detail.
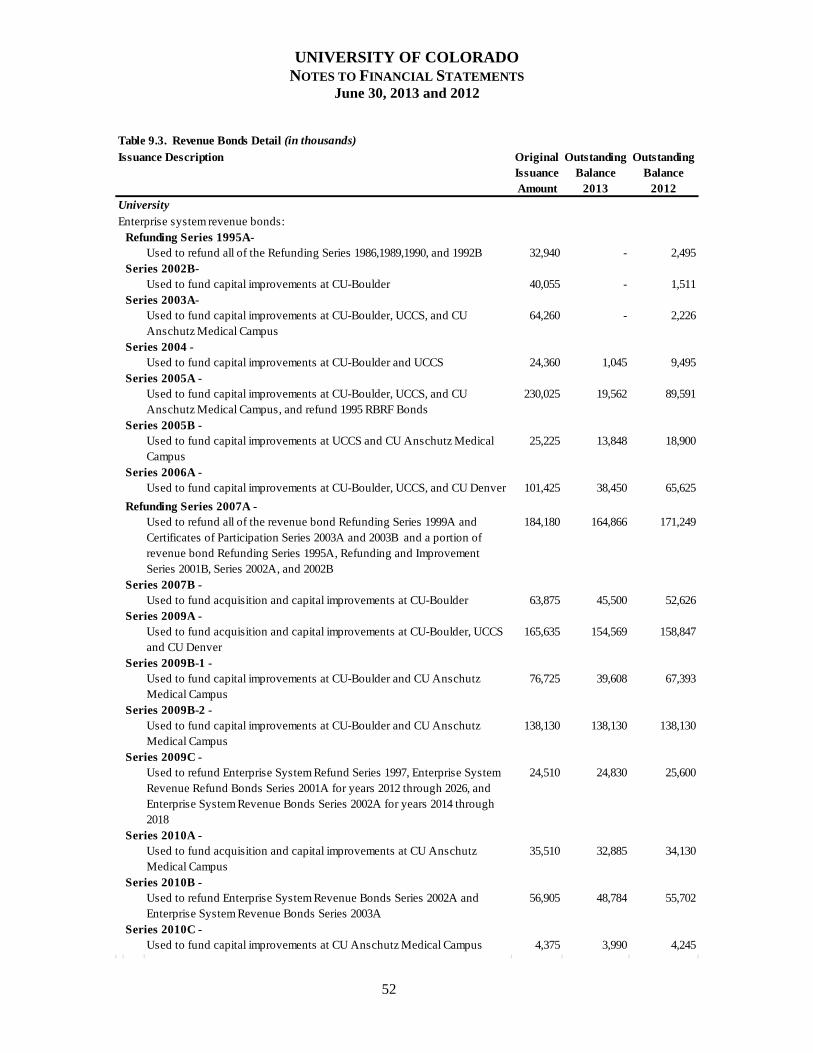
UNIVERSITY OF COLORADO NOTES TO FINANCIAL STATEMENTS
June 30, 2013 and 2012
52
Table 9.3. Revenue Bonds Detail (in thousands)
Issuance Description Original Issuance Amount
Outstanding Balance
2013
Outstanding Balance
2012University Enterprise system revenue bonds:
Refunding Series 1995A-Used to refund all of the Refunding Series 1986,1989,1990, and 1992B 32,940 - 2,495
Series 2002B-Used to fund capital improvements at CU-Boulder 40,055 - 1,511
Series 2003A-Used to fund capital improvements at CU-Boulder, UCCS, and CU Anschutz Medical Campus
64,260 - 2,226
Series 2004 -Used to fund capital improvements at CU-Boulder and UCCS 24,360 1,045 9,495
Series 2005A -Used to fund capital improvements at CU-Boulder, UCCS, and CU Anschutz Medical Campus, and refund 1995 RBRF Bonds
230,025 19,562 89,591
Series 2005B -Used to fund capital improvements at UCCS and CU Anschutz Medical Campus
25,225 13,848 18,900
Series 2006A - Used to fund capital improvements at CU-Boulder, UCCS, and CU Denver 101,425 38,450 65,625
Refunding Series 2007A - Used to refund all of the revenue bond Refunding Series 1999A and Certificates of Participation Series 2003A and 2003B and a portion of revenue bond Refunding Series 1995A, Refunding and Improvement Series 2001B, Series 2002A, and 2002B
184,180 164,866 171,249
Series 2007B - Used to fund acquisition and capital improvements at CU-Boulder 63,875 45,500 52,626
Series 2009A -Used to fund acquisition and capital improvements at CU-Boulder, UCCS and CU Denver
165,635 154,569 158,847
Series 2009B-1 -Used to fund capital improvements at CU-Boulder and CU Anschutz Medical Campus
76,725 39,608 67,393
Series 2009B-2 - Used to fund capital improvements at CU-Boulder and CU Anschutz Medical Campus
138,130 138,130 138,130
Series 2009C -Used to refund Enterprise System Refund Series 1997, Enterprise System Revenue Refund Bonds Series 2001A for years 2012 through 2026, and Enterprise System Revenue Bonds Series 2002A for years 2014 through 2018
24,510 24,830 25,600
Series 2010A -Used to fund acquisition and capital improvements at CU Anschutz Medical Campus
35,510 32,885 34,130
Series 2010B -Used to refund Enterprise System Revenue Bonds Series 2002A and Enterprise System Revenue Bonds Series 2003A
56,905 48,784 55,702
Series 2010C -Used to fund capital improvements at CU Anschutz Medical Campus 4,375 3,990 4,245
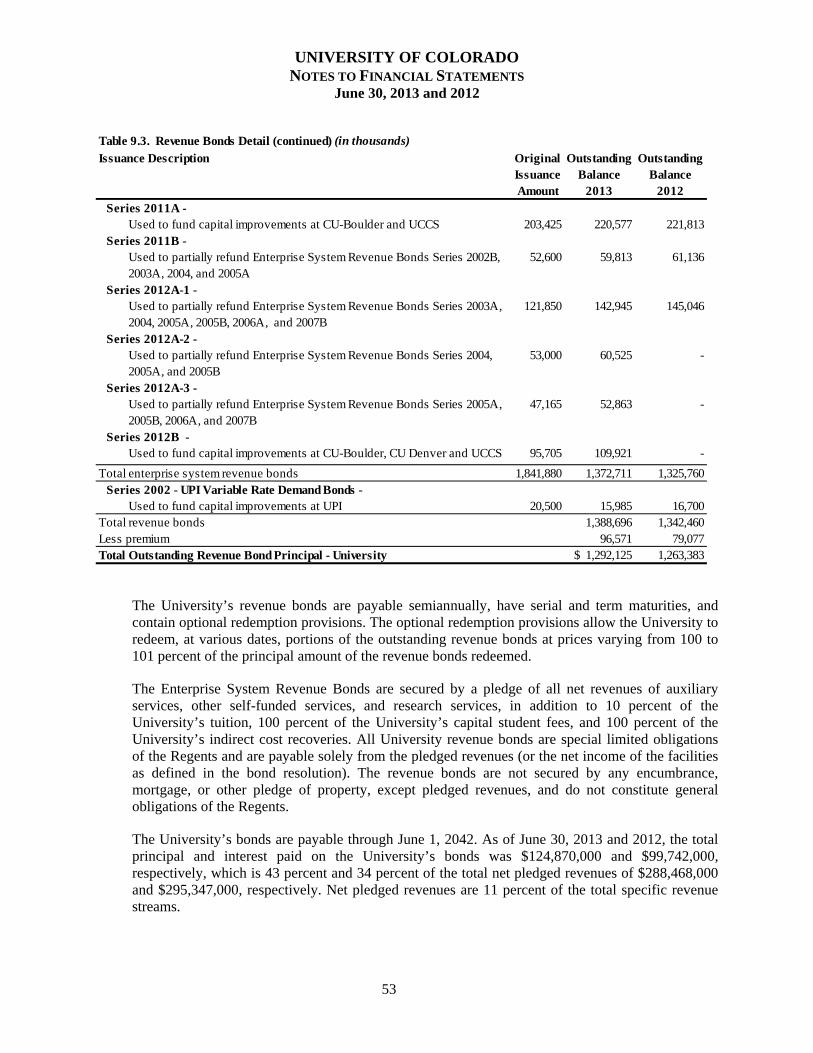
UNIVERSITY OF COLORADO NOTES TO FINANCIAL STATEMENTS
June 30, 2013 and 2012
53
Table 9.3. Revenue Bonds Detail (continued) (in thousands)
Issuance Description Original Issuance Amount
Outstanding Balance
2013
Outstanding Balance
2012Series 2011A -
Used to fund capital improvements at CU-Boulder and UCCS 203,425 220,577 221,813Series 2011B -
Used to partially refund Enterprise System Revenue Bonds Series 2002B, 2003A, 2004, and 2005A
52,600 59,813 61,136
Series 2012A-1 -Used to partially refund Enterprise System Revenue Bonds Series 2003A, 2004, 2005A, 2005B, 2006A, and 2007B
121,850 142,945 145,046
Series 2012A-2 -Used to partially refund Enterprise System Revenue Bonds Series 2004, 2005A, and 2005B
53,000 60,525 -
Series 2012A-3 -Used to partially refund Enterprise System Revenue Bonds Series 2005A, 2005B, 2006A, and 2007B
47,165 52,863 -
Series 2012B -Used to fund capital improvements at CU-Boulder, CU Denver and UCCS 95,705 109,921 -
Total enterprise system revenue bonds 1,841,880 1,372,711 1,325,760Series 2002 - UPI Variable Rate Demand Bonds -
Used to fund capital improvements at UPI 20,500 15,985 16,700Total revenue bonds 1,388,696 1,342,460Less premium 96,571 79,077Total Outstanding Revenue Bond Principal - University $ 1,292,125 1,263,383
The University’s revenue bonds are payable semiannually, have serial and term maturities, and contain optional redemption provisions. The optional redemption provisions allow the University to redeem, at various dates, portions of the outstanding revenue bonds at prices varying from 100 to 101 percent of the principal amount of the revenue bonds redeemed.
The Enterprise System Revenue Bonds are secured by a pledge of all net revenues of auxiliary services, other self-funded services, and research services, in addition to 10 percent of the University’s tuition, 100 percent of the University’s capital student fees, and 100 percent of the University’s indirect cost recoveries. All University revenue bonds are special limited obligations of the Regents and are payable solely from the pledged revenues (or the net income of the facilities as defined in the bond resolution). The revenue bonds are not secured by any encumbrance, mortgage, or other pledge of property, except pledged revenues, and do not constitute general obligations of the Regents.
The University’s bonds are payable through June 1, 2042. As of June 30, 2013 and 2012, the total principal and interest paid on the University’s bonds was $124,870,000 and $99,742,000, respectively, which is 43 percent and 34 percent of the total net pledged revenues of $288,468,000 and $295,347,000, respectively. Net pledged revenues are 11 percent of the total specific revenue streams.
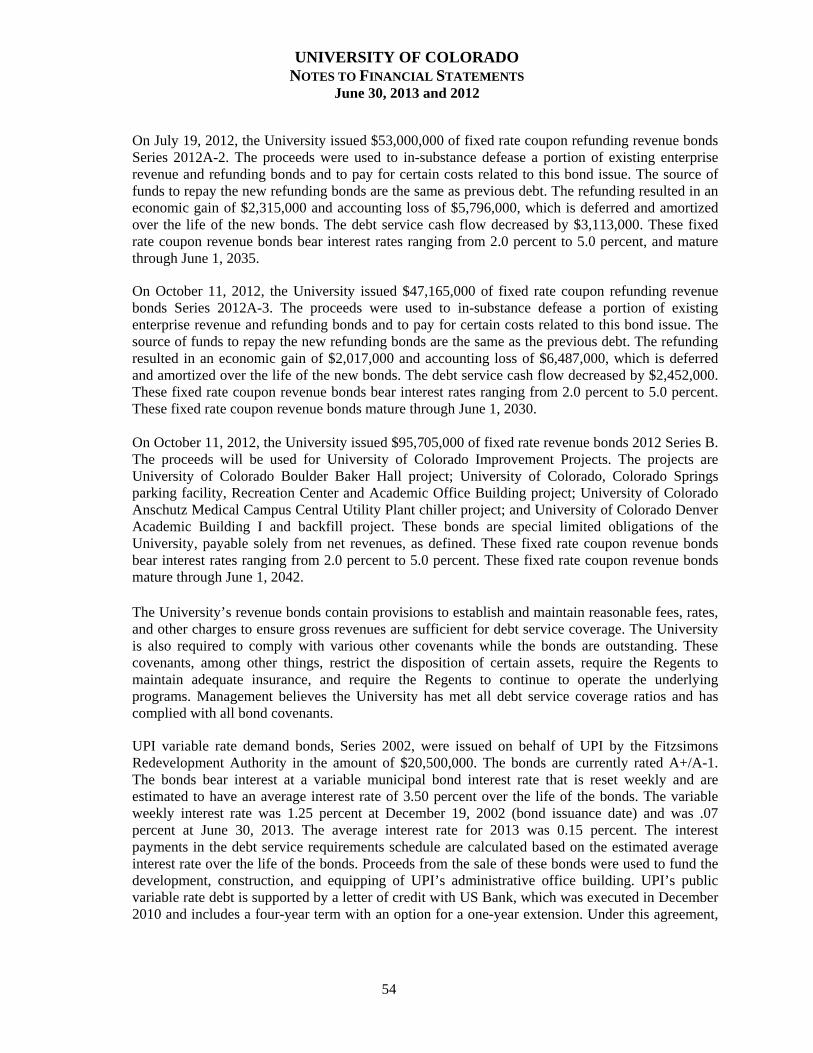
UNIVERSITY OF COLORADO NOTES TO FINANCIAL STATEMENTS
June 30, 2013 and 2012
54
On July 19, 2012, the University issued $53,000,000 of fixed rate coupon refunding revenue bonds Series 2012A-2. The proceeds were used to in-substance defease a portion of existing enterprise revenue and refunding bonds and to pay for certain costs related to this bond issue. The source of funds to repay the new refunding bonds are the same as previous debt. The refunding resulted in an economic gain of $2,315,000 and accounting loss of $5,796,000, which is deferred and amortized over the life of the new bonds. The debt service cash flow decreased by $3,113,000. These fixed rate coupon revenue bonds bear interest rates ranging from 2.0 percent to 5.0 percent, and mature through June 1, 2035.
On October 11, 2012, the University issued $47,165,000 of fixed rate coupon refunding revenue bonds Series 2012A-3. The proceeds were used to in-substance defease a portion of existing enterprise revenue and refunding bonds and to pay for certain costs related to this bond issue. The source of funds to repay the new refunding bonds are the same as the previous debt. The refunding resulted in an economic gain of $2,017,000 and accounting loss of $6,487,000, which is deferred and amortized over the life of the new bonds. The debt service cash flow decreased by $2,452,000. These fixed rate coupon revenue bonds bear interest rates ranging from 2.0 percent to 5.0 percent. These fixed rate coupon revenue bonds mature through June 1, 2030. On October 11, 2012, the University issued $95,705,000 of fixed rate revenue bonds 2012 Series B. The proceeds will be used for University of Colorado Improvement Projects. The projects are University of Colorado Boulder Baker Hall project; University of Colorado, Colorado Springs parking facility, Recreation Center and Academic Office Building project; University of Colorado Anschutz Medical Campus Central Utility Plant chiller project; and University of Colorado Denver Academic Building I and backfill project. These bonds are special limited obligations of the University, payable solely from net revenues, as defined. These fixed rate coupon revenue bonds bear interest rates ranging from 2.0 percent to 5.0 percent. These fixed rate coupon revenue bonds mature through June 1, 2042. The University’s revenue bonds contain provisions to establish and maintain reasonable fees, rates, and other charges to ensure gross revenues are sufficient for debt service coverage. The University is also required to comply with various other covenants while the bonds are outstanding. These covenants, among other things, restrict the disposition of certain assets, require the Regents to maintain adequate insurance, and require the Regents to continue to operate the underlying programs. Management believes the University has met all debt service coverage ratios and has complied with all bond covenants.
UPI variable rate demand bonds, Series 2002, were issued on behalf of UPI by the Fitzsimons Redevelopment Authority in the amount of $20,500,000. The bonds are currently rated A+/A-1. The bonds bear interest at a variable municipal bond interest rate that is reset weekly and are estimated to have an average interest rate of 3.50 percent over the life of the bonds. The variable weekly interest rate was 1.25 percent at December 19, 2002 (bond issuance date) and was .07 percent at June 30, 2013. The average interest rate for 2013 was 0.15 percent. The interest payments in the debt service requirements schedule are calculated based on the estimated average interest rate over the life of the bonds. Proceeds from the sale of these bonds were used to fund the development, construction, and equipping of UPI’s administrative office building. UPI’s public variable rate debt is supported by a letter of credit with US Bank, which was executed in December 2010 and includes a four-year term with an option for a one-year extension. Under this agreement,
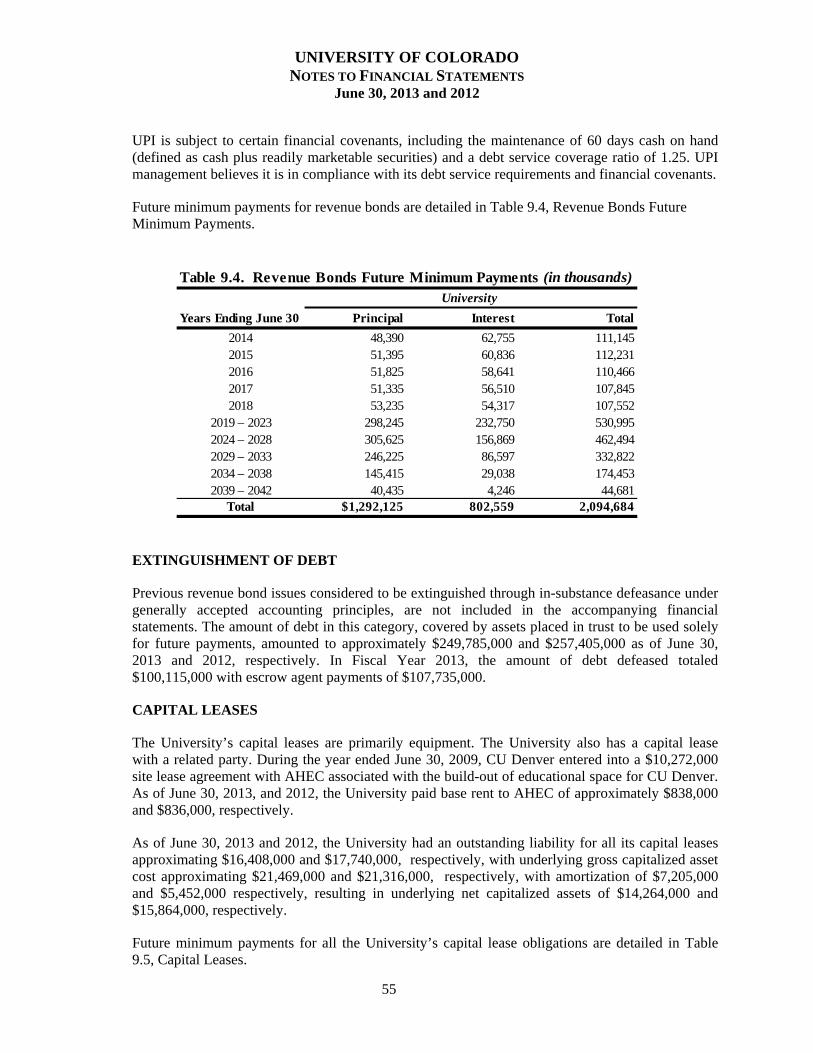
UNIVERSITY OF COLORADO NOTES TO FINANCIAL STATEMENTS
June 30, 2013 and 2012
55
UPI is subject to certain financial covenants, including the maintenance of 60 days cash on hand (defined as cash plus readily marketable securities) and a debt service coverage ratio of 1.25. UPI management believes it is in compliance with its debt service requirements and financial covenants.
Future minimum payments for revenue bonds are detailed in Table 9.4, Revenue Bonds Future Minimum Payments.
Years Ending June 30 Principal Interest Total
2014 48,390 62,755 111,1452015 51,395 60,836 112,2312016 51,825 58,641 110,4662017 51,335 56,510 107,8452018 53,235 54,317 107,552
2019 – 2023 298,245 232,750 530,9952024 – 2028 305,625 156,869 462,4942029 – 2033 246,225 86,597 332,8222034 – 2038 145,415 29,038 174,4532039 – 2042 40,435 4,246 44,681
Total $1,292,125 802,559 2,094,684
Table 9.4. Revenue Bonds Future Minimum Payments (in thousands)University
EXTINGUISHMENT OF DEBT
Previous revenue bond issues considered to be extinguished through in-substance defeasance under generally accepted accounting principles, are not included in the accompanying financial statements. The amount of debt in this category, covered by assets placed in trust to be used solely for future payments, amounted to approximately $249,785,000 and $257,405,000 as of June 30, 2013 and 2012, respectively. In Fiscal Year 2013, the amount of debt defeased totaled $100,115,000 with escrow agent payments of $107,735,000.
CAPITAL LEASES
The University’s capital leases are primarily equipment. The University also has a capital lease with a related party. During the year ended June 30, 2009, CU Denver entered into a $10,272,000 site lease agreement with AHEC associated with the build-out of educational space for CU Denver. As of June 30, 2013, and 2012, the University paid base rent to AHEC of approximately $838,000 and $836,000, respectively.
As of June 30, 2013 and 2012, the University had an outstanding liability for all its capital leases approximating $16,408,000 and $17,740,000, respectively, with underlying gross capitalized asset cost approximating $21,469,000 and $21,316,000, respectively, with amortization of $7,205,000 and $5,452,000 respectively, resulting in underlying net capitalized assets of $14,264,000 and $15,864,000, respectively.
Future minimum payments for all the University’s capital lease obligations are detailed in Table 9.5, Capital Leases.
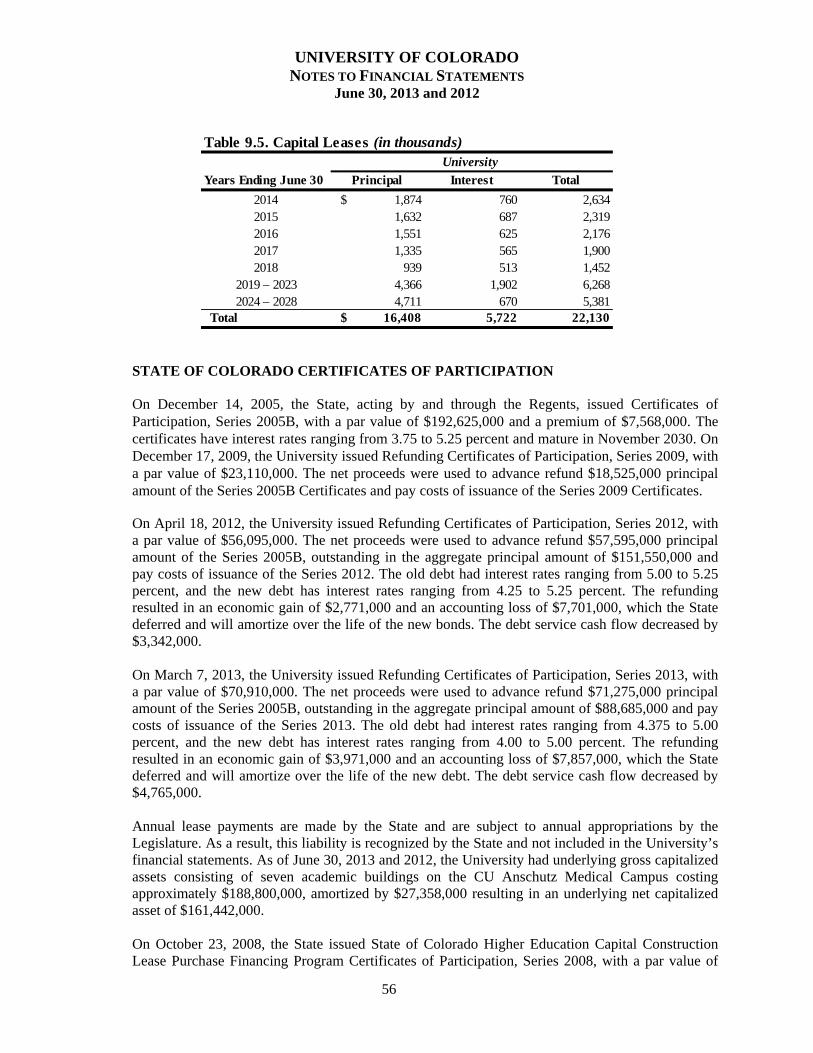
UNIVERSITY OF COLORADO NOTES TO FINANCIAL STATEMENTS
June 30, 2013 and 2012
56
Years Ending June 30 Principal Interest Total
2014 $ 1,874 760 2,6342015 1,632 687 2,3192016 1,551 625 2,1762017 1,335 565 1,9002018 939 513 1,452
2019 – 2023 4,366 1,902 6,2682024 – 2028 4,711 670 5,381
Total $ 16,408 5,722 22,130
Table 9.5. Capital Leases (in thousands)University
STATE OF COLORADO CERTIFICATES OF PARTICIPATION
On December 14, 2005, the State, acting by and through the Regents, issued Certificates of Participation, Series 2005B, with a par value of $192,625,000 and a premium of $7,568,000. The certificates have interest rates ranging from 3.75 to 5.25 percent and mature in November 2030. On December 17, 2009, the University issued Refunding Certificates of Participation, Series 2009, with a par value of $23,110,000. The net proceeds were used to advance refund $18,525,000 principal amount of the Series 2005B Certificates and pay costs of issuance of the Series 2009 Certificates.
On April 18, 2012, the University issued Refunding Certificates of Participation, Series 2012, with a par value of $56,095,000. The net proceeds were used to advance refund $57,595,000 principal amount of the Series 2005B, outstanding in the aggregate principal amount of $151,550,000 and pay costs of issuance of the Series 2012. The old debt had interest rates ranging from 5.00 to 5.25 percent, and the new debt has interest rates ranging from 4.25 to 5.25 percent. The refunding resulted in an economic gain of $2,771,000 and an accounting loss of $7,701,000, which the State deferred and will amortize over the life of the new bonds. The debt service cash flow decreased by $3,342,000. On March 7, 2013, the University issued Refunding Certificates of Participation, Series 2013, with a par value of $70,910,000. The net proceeds were used to advance refund $71,275,000 principal amount of the Series 2005B, outstanding in the aggregate principal amount of $88,685,000 and pay costs of issuance of the Series 2013. The old debt had interest rates ranging from 4.375 to 5.00 percent, and the new debt has interest rates ranging from 4.00 to 5.00 percent. The refunding resulted in an economic gain of $3,971,000 and an accounting loss of $7,857,000, which the State deferred and will amortize over the life of the new debt. The debt service cash flow decreased by $4,765,000. Annual lease payments are made by the State and are subject to annual appropriations by the Legislature. As a result, this liability is recognized by the State and not included in the University’s financial statements. As of June 30, 2013 and 2012, the University had underlying gross capitalized assets consisting of seven academic buildings on the CU Anschutz Medical Campus costing approximately $188,800,000, amortized by $27,358,000 resulting in an underlying net capitalized asset of $161,442,000. On October 23, 2008, the State issued State of Colorado Higher Education Capital Construction Lease Purchase Financing Program Certificates of Participation, Series 2008, with a par value of
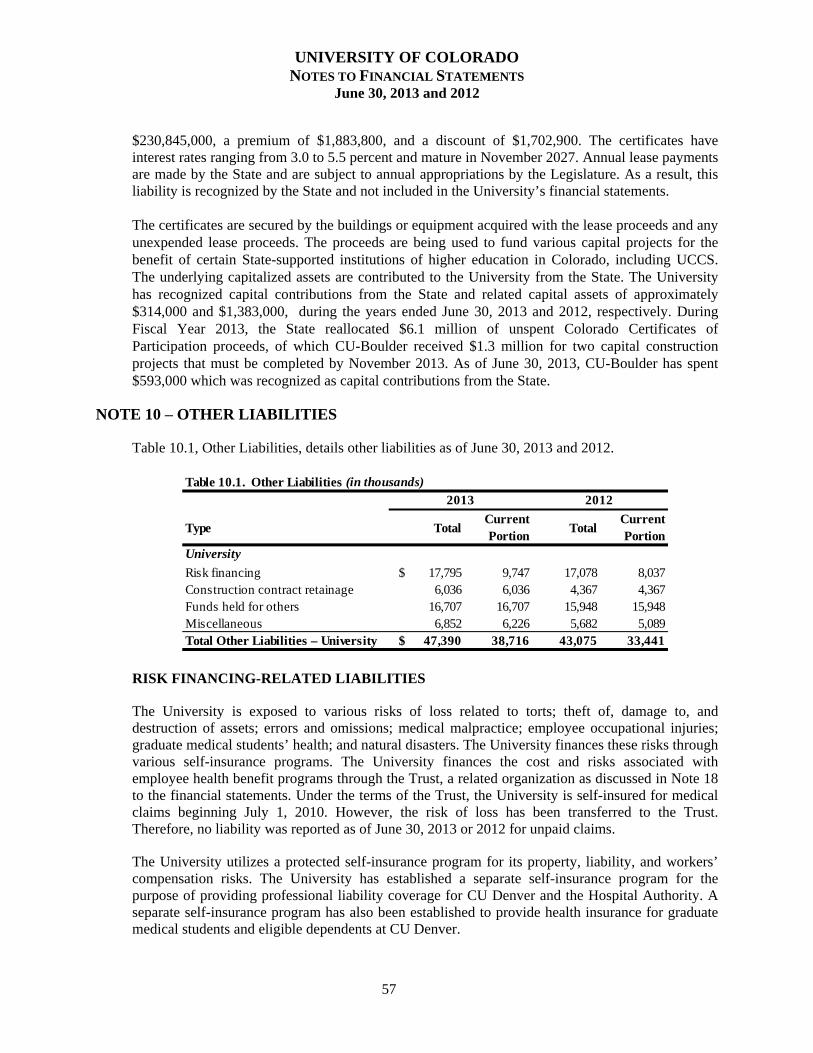
UNIVERSITY OF COLORADO NOTES TO FINANCIAL STATEMENTS
June 30, 2013 and 2012
57
$230,845,000, a premium of $1,883,800, and a discount of $1,702,900. The certificates have interest rates ranging from 3.0 to 5.5 percent and mature in November 2027. Annual lease payments are made by the State and are subject to annual appropriations by the Legislature. As a result, this liability is recognized by the State and not included in the University’s financial statements.
The certificates are secured by the buildings or equipment acquired with the lease proceeds and any unexpended lease proceeds. The proceeds are being used to fund various capital projects for the benefit of certain State-supported institutions of higher education in Colorado, including UCCS. The underlying capitalized assets are contributed to the University from the State. The University has recognized capital contributions from the State and related capital assets of approximately $314,000 and $1,383,000, during the years ended June 30, 2013 and 2012, respectively. During Fiscal Year 2013, the State reallocated $6.1 million of unspent Colorado Certificates of Participation proceeds, of which CU-Boulder received $1.3 million for two capital construction projects that must be completed by November 2013. As of June 30, 2013, CU-Boulder has spent $593,000 which was recognized as capital contributions from the State.
NOTE 10 – OTHER LIABILITIES
Table 10.1, Other Liabilities, details other liabilities as of June 30, 2013 and 2012.
Type TotalCurrent Portion
TotalCurrent Portion
University
Risk financing $ 17,795 9,747 17,078 8,037 Construction contract retainage 6,036 6,036 4,367 4,367 Funds held for others 16,707 16,707 15,948 15,948 Miscellaneous 6,852 6,226 5,682 5,089 Total Other Liabilities – University $ 47,390 38,716 43,075 33,441
Table 10.1. Other Liabilities (in thousands)
2013 2012
RISK FINANCING-RELATED LIABILITIES
The University is exposed to various risks of loss related to torts; theft of, damage to, and destruction of assets; errors and omissions; medical malpractice; employee occupational injuries; graduate medical students’ health; and natural disasters. The University finances these risks through various self-insurance programs. The University finances the cost and risks associated with employee health benefit programs through the Trust, a related organization as discussed in Note 18 to the financial statements. Under the terms of the Trust, the University is self-insured for medical claims beginning July 1, 2010. However, the risk of loss has been transferred to the Trust. Therefore, no liability was reported as of June 30, 2013 or 2012 for unpaid claims.
The University utilizes a protected self-insurance program for its property, liability, and workers’ compensation risks. The University has established a separate self-insurance program for the purpose of providing professional liability coverage for CU Denver and the Hospital Authority. A separate self-insurance program has also been established to provide health insurance for graduate medical students and eligible dependents at CU Denver.
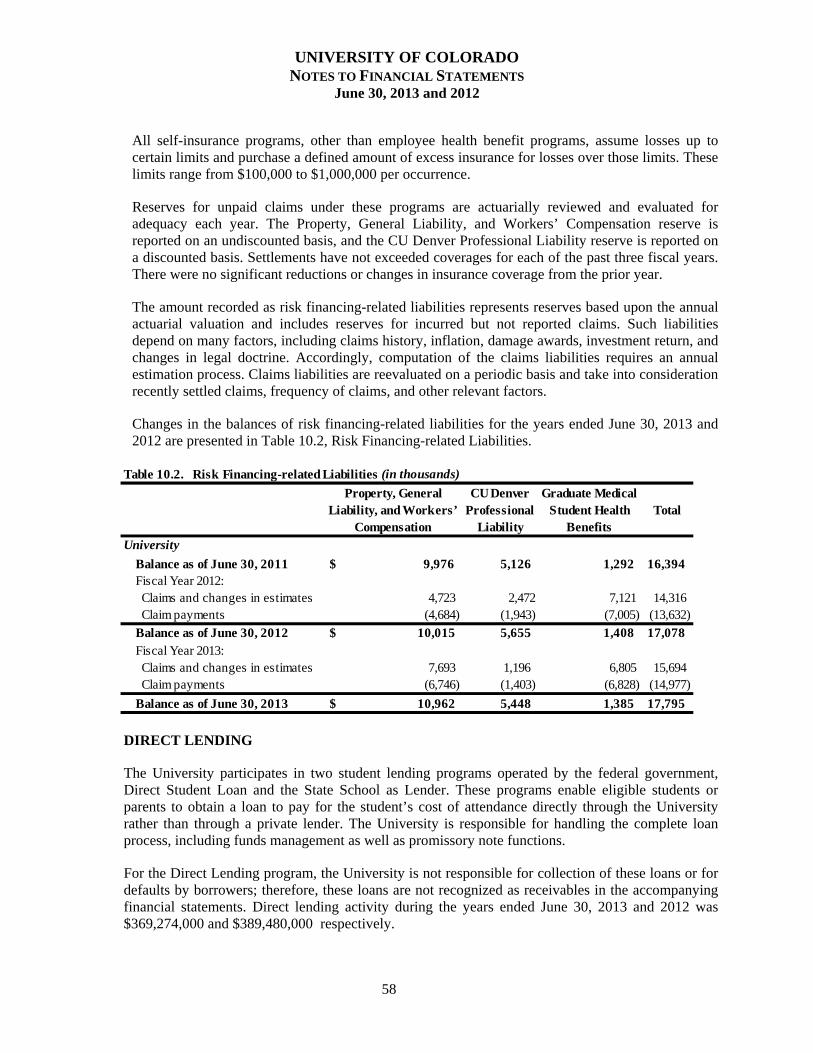
UNIVERSITY OF COLORADO NOTES TO FINANCIAL STATEMENTS
June 30, 2013 and 2012
58
All self-insurance programs, other than employee health benefit programs, assume losses up to certain limits and purchase a defined amount of excess insurance for losses over those limits. These limits range from $100,000 to $1,000,000 per occurrence.
Reserves for unpaid claims under these programs are actuarially reviewed and evaluated for adequacy each year. The Property, General Liability, and Workers’ Compensation reserve is reported on an undiscounted basis, and the CU Denver Professional Liability reserve is reported on a discounted basis. Settlements have not exceeded coverages for each of the past three fiscal years. There were no significant reductions or changes in insurance coverage from the prior year.
The amount recorded as risk financing-related liabilities represents reserves based upon the annual actuarial valuation and includes reserves for incurred but not reported claims. Such liabilities depend on many factors, including claims history, inflation, damage awards, investment return, and changes in legal doctrine. Accordingly, computation of the claims liabilities requires an annual estimation process. Claims liabilities are reevaluated on a periodic basis and take into consideration recently settled claims, frequency of claims, and other relevant factors.
Changes in the balances of risk financing-related liabilities for the years ended June 30, 2013 and 2012 are presented in Table 10.2, Risk Financing-related Liabilities.
Property, General Liability, and Workers’
Compensation
CU Denver Professional
Liability
Graduate Medical Student Health
BenefitsTotal
University
Balance as of June 30, 2011 $ 9,976 5,126 1,292 16,394 Fiscal Year 2012: Claims and changes in estimates 4,723 2,472 7,121 14,316 Claim payments (4,684) (1,943) (7,005) (13,632)
Balance as of June 30, 2012 $ 10,015 5,655 1,408 17,078 Fiscal Year 2013: Claims and changes in estimates 7,693 1,196 6,805 15,694 Claim payments (6,746) (1,403) (6,828) (14,977)
Balance as of June 30, 2013 $ 10,962 5,448 1,385 17,795
Table 10.2. Risk Financing-related Liabilities (in thousands)
DIRECT LENDING
The University participates in two student lending programs operated by the federal government, Direct Student Loan and the State School as Lender. These programs enable eligible students or parents to obtain a loan to pay for the student’s cost of attendance directly through the University rather than through a private lender. The University is responsible for handling the complete loan process, including funds management as well as promissory note functions.
For the Direct Lending program, the University is not responsible for collection of these loans or for defaults by borrowers; therefore, these loans are not recognized as receivables in the accompanying financial statements. Direct lending activity during the years ended June 30, 2013 and 2012 was $369,274,000 and $389,480,000 respectively.
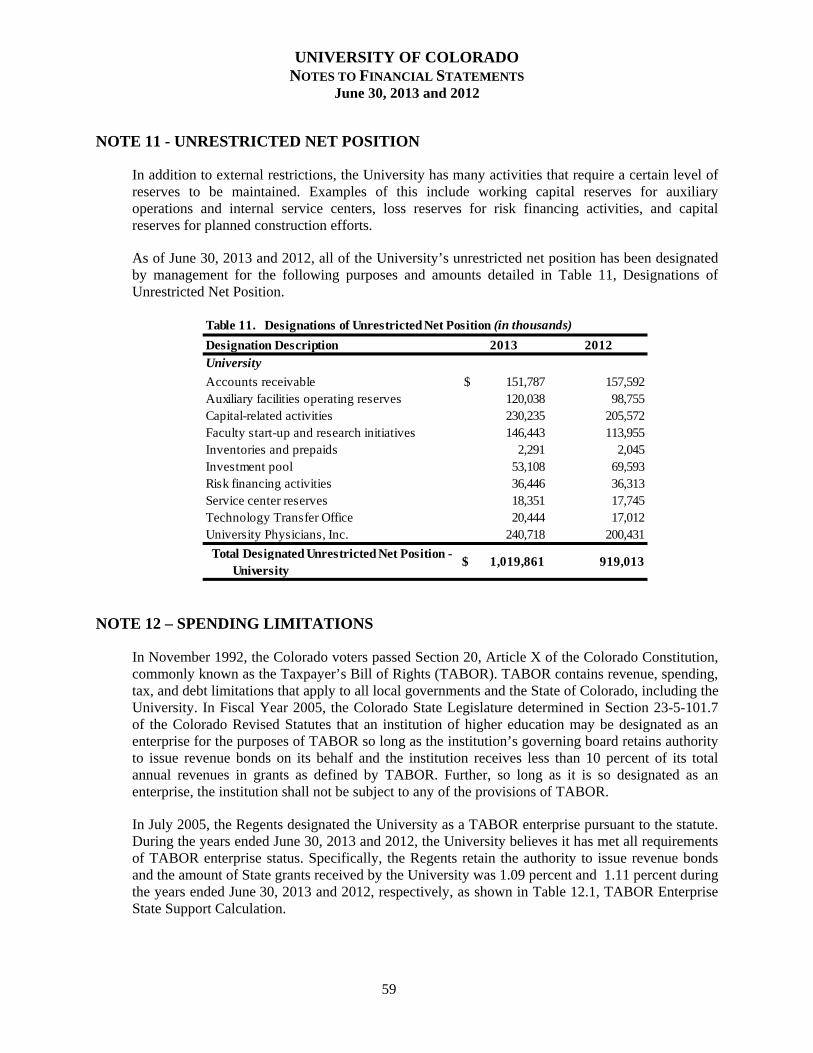
UNIVERSITY OF COLORADO NOTES TO FINANCIAL STATEMENTS
June 30, 2013 and 2012
59
NOTE 11 - UNRESTRICTED NET POSITION
In addition to external restrictions, the University has many activities that require a certain level of reserves to be maintained. Examples of this include working capital reserves for auxiliary operations and internal service centers, loss reserves for risk financing activities, and capital reserves for planned construction efforts.
As of June 30, 2013 and 2012, all of the University’s unrestricted net position has been designated by management for the following purposes and amounts detailed in Table 11, Designations of Unrestricted Net Position.
Designation Description 2013 2012University
Accounts receivable 151,787$ 157,592 Auxiliary facilities operating reserves 120,038 98,755 Capital-related activities 230,235 205,572 Faculty start-up and research initiatives 146,443 113,955 Inventories and prepaids 2,291 2,045 Investment pool 53,108 69,593 Risk financing activities 36,446 36,313 Service center reserves 18,351 17,745 Technology Transfer Office 20,444 17,012 University Physicians, Inc. 240,718 200,431
Total Designated Unrestricted Net Position - University
1,019,861$ 919,013
Table 11. Designations of Unrestricted Net Position (in thousands)
NOTE 12 – SPENDING LIMITATIONS
In November 1992, the Colorado voters passed Section 20, Article X of the Colorado Constitution, commonly known as the Taxpayer’s Bill of Rights (TABOR). TABOR contains revenue, spending, tax, and debt limitations that apply to all local governments and the State of Colorado, including the University. In Fiscal Year 2005, the Colorado State Legislature determined in Section 23-5-101.7 of the Colorado Revised Statutes that an institution of higher education may be designated as an enterprise for the purposes of TABOR so long as the institution’s governing board retains authority to issue revenue bonds on its behalf and the institution receives less than 10 percent of its total annual revenues in grants as defined by TABOR. Further, so long as it is so designated as an enterprise, the institution shall not be subject to any of the provisions of TABOR.
In July 2005, the Regents designated the University as a TABOR enterprise pursuant to the statute. During the years ended June 30, 2013 and 2012, the University believes it has met all requirements of TABOR enterprise status. Specifically, the Regents retain the authority to issue revenue bonds and the amount of State grants received by the University was 1.09 percent and 1.11 percent during the years ended June 30, 2013 and 2012, respectively, as shown in Table 12.1, TABOR Enterprise State Support Calculation.
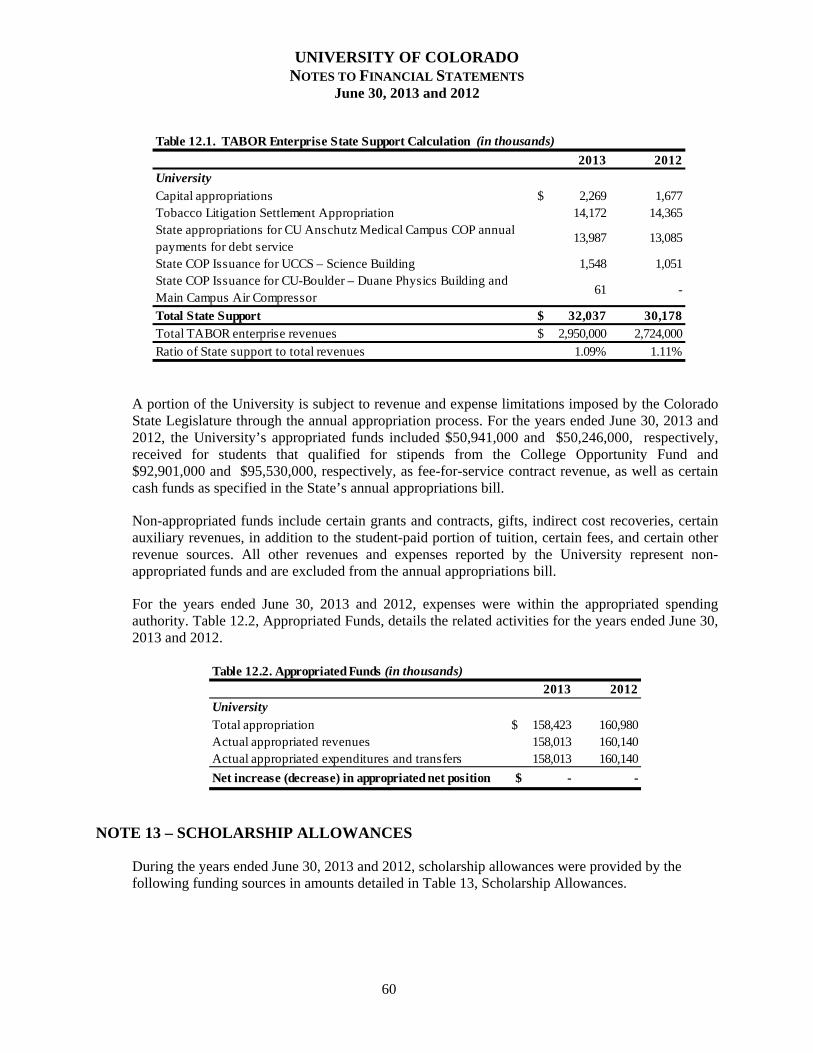
UNIVERSITY OF COLORADO NOTES TO FINANCIAL STATEMENTS
June 30, 2013 and 2012
60
2013 2012UniversityCapital appropriations $ 2,269 1,677 Tobacco Litigation Settlement Appropriation 14,172 14,365 State appropriations for CU Anschutz Medical Campus COP annual payments for debt service
13,987 13,085
State COP Issuance for UCCS – Science Building 1,548 1,051 State COP Issuance for CU-Boulder – Duane Physics Building and Main Campus Air Compressor
61 -
Total State Support $ 32,037 30,178 Total TABOR enterprise revenues $ 2,950,000 2,724,000
Ratio of State support to total revenues 1.09% 1.11%
Table 12.1. TABOR Enterprise State Support Calculation (in thousands)
A portion of the University is subject to revenue and expense limitations imposed by the Colorado State Legislature through the annual appropriation process. For the years ended June 30, 2013 and 2012, the University’s appropriated funds included $50,941,000 and $50,246,000, respectively, received for students that qualified for stipends from the College Opportunity Fund and $92,901,000 and $95,530,000, respectively, as fee-for-service contract revenue, as well as certain cash funds as specified in the State’s annual appropriations bill.
Non-appropriated funds include certain grants and contracts, gifts, indirect cost recoveries, certain auxiliary revenues, in addition to the student-paid portion of tuition, certain fees, and certain other revenue sources. All other revenues and expenses reported by the University represent non-appropriated funds and are excluded from the annual appropriations bill.
For the years ended June 30, 2013 and 2012, expenses were within the appropriated spending authority. Table 12.2, Appropriated Funds, details the related activities for the years ended June 30, 2013 and 2012.
2013 2012UniversityTotal appropriation $ 158,423 160,980 Actual appropriated revenues 158,013 160,140 Actual appropriated expenditures and transfers 158,013 160,140
Net increase (decrease) in appropriated net position $ - -
Table 12.2. Appropriated Funds (in thousands)
NOTE 13 – SCHOLARSHIP ALLOWANCES
During the years ended June 30, 2013 and 2012, scholarship allowances were provided by the following funding sources in amounts detailed in Table 13, Scholarship Allowances.
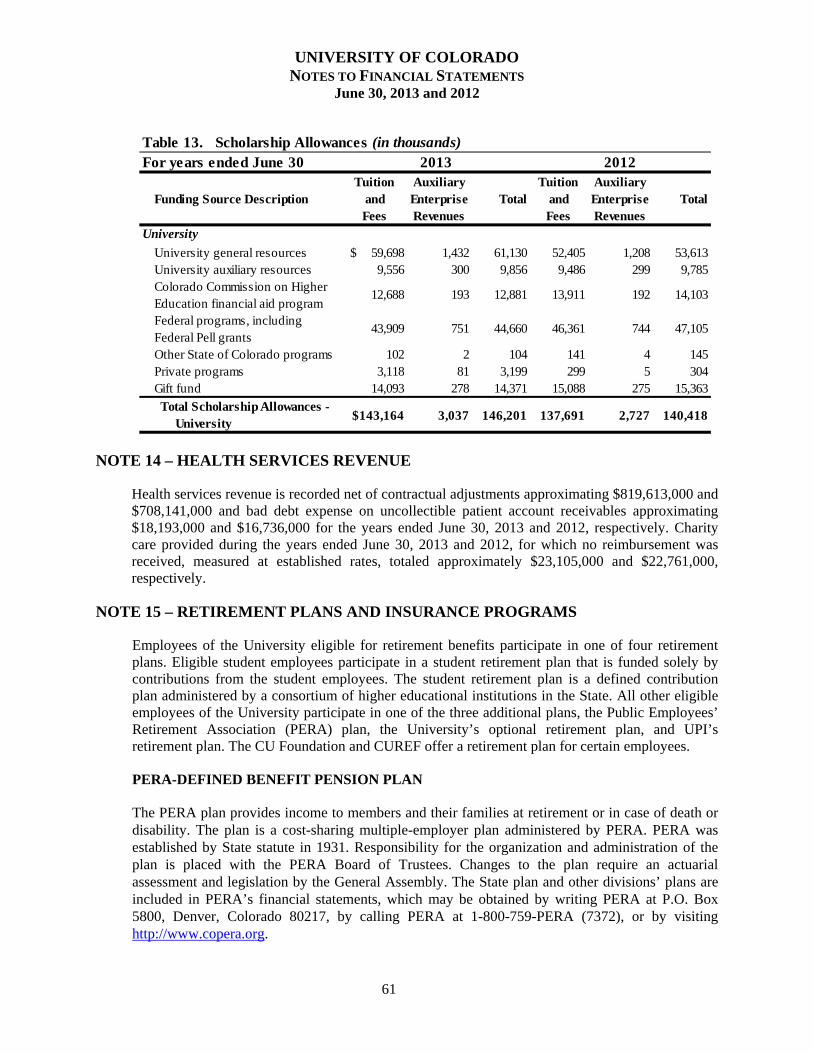
UNIVERSITY OF COLORADO NOTES TO FINANCIAL STATEMENTS
June 30, 2013 and 2012
61
For years ended June 30
Funding Source DescriptionTuition
and Fees
Auxiliary Enterprise Revenues
Total Tuition
andFees
Auxiliary Enterprise Revenues
Total
University
University general resources $ 59,698 1,432 61,130 52,405 1,208 53,613 University auxiliary resources 9,556 300 9,856 9,486 299 9,785 Colorado Commission on Higher Education financial aid program
12,688 193 12,881 13,911 192 14,103
Federal programs, including Federal Pell grants
43,909 751 44,660 46,361 744 47,105
Other State of Colorado programs 102 2 104 141 4 145 Private programs 3,118 81 3,199 299 5 304 Gift fund 14,093 278 14,371 15,088 275 15,363
Total Scholarship Allowances - University
$143,164 3,037 146,201 137,691 2,727 140,418
Table 13. Scholarship Allowances (in thousands)
2013 2012
NOTE 14 – HEALTH SERVICES REVENUE
Health services revenue is recorded net of contractual adjustments approximating $819,613,000 and $708,141,000 and bad debt expense on uncollectible patient account receivables approximating $18,193,000 and $16,736,000 for the years ended June 30, 2013 and 2012, respectively. Charity care provided during the years ended June 30, 2013 and 2012, for which no reimbursement was received, measured at established rates, totaled approximately $23,105,000 and $22,761,000, respectively.
NOTE 15 – RETIREMENT PLANS AND INSURANCE PROGRAMS
Employees of the University eligible for retirement benefits participate in one of four retirement plans. Eligible student employees participate in a student retirement plan that is funded solely by contributions from the student employees. The student retirement plan is a defined contribution plan administered by a consortium of higher educational institutions in the State. All other eligible employees of the University participate in one of the three additional plans, the Public Employees’ Retirement Association (PERA) plan, the University’s optional retirement plan, and UPI’s retirement plan. The CU Foundation and CUREF offer a retirement plan for certain employees.
PERA-DEFINED BENEFIT PENSION PLAN
The PERA plan provides income to members and their families at retirement or in case of death or disability. The plan is a cost-sharing multiple-employer plan administered by PERA. PERA was established by State statute in 1931. Responsibility for the organization and administration of the plan is placed with the PERA Board of Trustees. Changes to the plan require an actuarial assessment and legislation by the General Assembly. The State plan and other divisions’ plans are included in PERA’s financial statements, which may be obtained by writing PERA at P.O. Box 5800, Denver, Colorado 80217, by calling PERA at 1-800-759-PERA (7372), or by visiting http://www.copera.org.
UNIVERSITY OF COLORADO NOTES TO FINANCIAL STATEMENTS
June 30, 2013 and 2012
62
The University of Colorado has both classified and non-classified employees. All classified employees participate in PERA. Prior to legislation passed during the 2006 session, higher education employees may have participated in social security, PERA’s defined benefit plan, or the institution’s optional retirement plan. Currently, the University’s employees, except classified employees, are required to participate in their institution’s optional plan, if available, unless they are active or inactive members of PERA with at least one year of service credit. In that case, they may elect either PERA or their institution’s optional plan.
PERA members electing the defined contribution plan are allowed an irrevocable election between the second and fifth year to use their defined contribution account to purchase service credit and be covered under the defined benefit retirement plan. However, making this election subjects the member to the rules in effect for those hired on or after January 1, 2007, as discussed below. Employer contributions to the defined contribution plan are the same as the contributions to the PERA defined benefit plan.
Defined benefit plan members are eligible to vest after five years of service and are eligible for full retirement based on their original hire date as follows:
Hired before July 1, 2005 – age 50 with 30 years of service, age 60 with 20 years of service, or age 65 with 5 years of service.
Hired between July 1, 2005 and December 31, 2006 – any age with 35 years of service, age 55 with 30 years of service, age 60 with 20 years of service, or age 65 with any years of service.
Hired between January 1, 2007 and December 31, 2010 – any age with 35 years of service, age 55 with 30 years of service, age 60 with 25 years of service, or age 65 with 5 years of service. For members with less than five years of service credit as of January 1, 2011, age and service requirements increase to those required for members hired between January 1, 2007 and December 31, 2010.
Hired between January 1, 2011 and December 31, 2016 – any age with 35 years of service, age 58 with 30 years of service, or age 65 with 5 years of service.
Hired on or after January 1, 2017 – any age with 35 years of service, age 60 with 30 years of service, or age 65 with 5 years of service.
Members are also eligible for retirement benefits without a reduction for early retirement based on their original hire date as follows:
Hired before January 1, 2007 – age 55 with a minimum of 5 years of service credit and age plus years of service equals 80 or more.
Hired between January 1, 2007 and December 31, 2010 – age 55 with a minimum of 5 years of service credit and age plus years of service equals 85 or more. Age plus years of service requirements increase to 85 for members with less than five years of service credit as of January 1, 2011.
Hired between January 1, 2011 and December 31, 2016 – age 58 and age plus years of service equals 88 or more.
UNIVERSITY OF COLORADO NOTES TO FINANCIAL STATEMENTS
June 30, 2013 and 2012
63
Hired on or after January 1, 2017 – age 60 and age plus years of service equals 90.
Members automatically receive the higher of the defined retirement benefit or money purchase benefit at retirement. Defined benefits are calculated as 2.5 percent times the number of years of service times the highest average salary (HAS). For retirements before January 1, 2009, HAS is calculated as one-twelfth of the average of the highest salaries on which contributions were paid, associated with three periods of 12 consecutive months of service credit and limited to a 15-percent increase between periods. For retirements after January 1, 2009, or persons hired on or after January 1, 2007, more restrictive limits are placed on salary increases between periods used in calculating HAS.
Retiree benefits are increased annually in July based on the member’s original hire date as follows:
Hired before July 1, 2007 – the lessor of 2 percent or the average of the monthly Consumer Price Index increases.
Hired on or after January 1, 2007 – the lesser of 2 percent or the actual increase in the national Consumer Price Index, limited to a 10 percent reduction in a reserve established for cost of living increases related strictly to those hired on or after January 1, 2007. (The reserve is funded by 1 percentage point of salaries contributed by employers for employees hired on or after January 1, 2007.)
The upper limits on benefits increase by one-quarter percentage point each year when the funded ratio of PERA equals or exceeds 103 percent and declines by one-quarter percentage point when the funded ratio drops below 90 percent after having exceeded 103 percent. The funded ratio increase does not apply for three years when a negative return on investment occurs.
Members who are disabled, who have five or more years of service credit, six months of which has been earned since the most recent period of membership, may receive retirement benefits if determined to be permanently disabled. If a member dies before retirement, their spouse or their eligible children under the age of 18 (23 if a full-time student) may be entitled to a single payment or monthly benefit payments. If there is no eligible child or spouse then financially dependent parents, beneficiaries, or the member’s estate, may be entitled to a survivor’s benefit.
The contribution requirements of plan members and their employers are established, and may be amended, by the General Assembly. Salary subject to PERA contributions is gross earnings less any reduction in pay to offset employer contributions to the State sponsored IRC 125 plan established under Section 125 of the Internal Revenue Code.
Most employees contribute 8.0 percent of their salary, as defined in CRS 24-51-101(42), to an individual account in the plan. Effective July 1, 2012, the temporary contribution rate increase of 2.5 percent for members in the State and Judicial Divisions to replace the 2.5 percent reduction in employer contributions effective for Fiscal Years 2010-11 and 2011-12 expired.
From July 1, 2012, to December 31, 2012, the State contributed 15.65 percent of the employee’s salary. From January 1, 2013, through June 30, 2013, the State contributed 16.55 percent. During all of Fiscal Year 2012-13, 1.02 percent of the employees’ total salary was allocated to the Health Care Trust Fund.
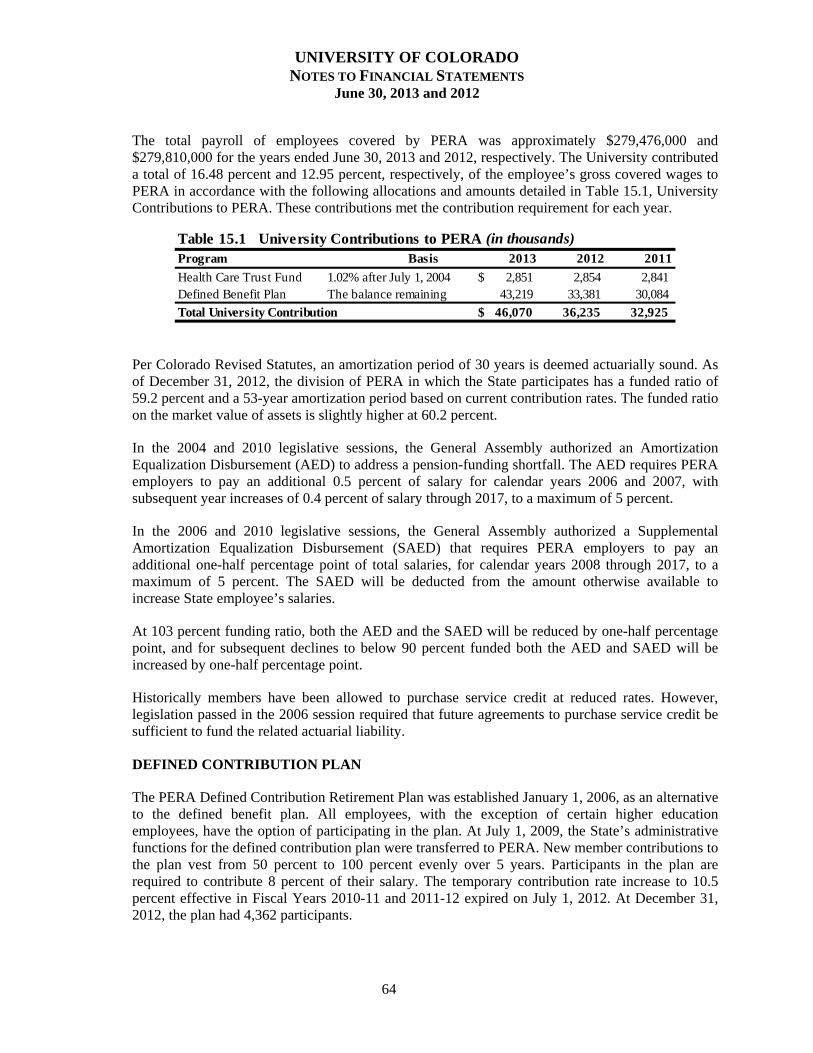
UNIVERSITY OF COLORADO NOTES TO FINANCIAL STATEMENTS
June 30, 2013 and 2012
64
The total payroll of employees covered by PERA was approximately $279,476,000 and $279,810,000 for the years ended June 30, 2013 and 2012, respectively. The University contributed a total of 16.48 percent and 12.95 percent, respectively, of the employee’s gross covered wages to PERA in accordance with the following allocations and amounts detailed in Table 15.1, University Contributions to PERA. These contributions met the contribution requirement for each year.
Table 15.1 University Contributions to PERA (in thousands)Program Basis 2013 2012 2011
Health Care Trust Fund 1.02% after July 1, 2004 2,851$ 2,854 2,841 Defined Benefit Plan The balance remaining 43,219 33,381 30,084
Total University Contribution 46,070$ 36,235 32,925
Per Colorado Revised Statutes, an amortization period of 30 years is deemed actuarially sound. As of December 31, 2012, the division of PERA in which the State participates has a funded ratio of 59.2 percent and a 53-year amortization period based on current contribution rates. The funded ratio on the market value of assets is slightly higher at 60.2 percent.
In the 2004 and 2010 legislative sessions, the General Assembly authorized an Amortization Equalization Disbursement (AED) to address a pension-funding shortfall. The AED requires PERA employers to pay an additional 0.5 percent of salary for calendar years 2006 and 2007, with subsequent year increases of 0.4 percent of salary through 2017, to a maximum of 5 percent.
In the 2006 and 2010 legislative sessions, the General Assembly authorized a Supplemental Amortization Equalization Disbursement (SAED) that requires PERA employers to pay an additional one-half percentage point of total salaries, for calendar years 2008 through 2017, to a maximum of 5 percent. The SAED will be deducted from the amount otherwise available to increase State employee’s salaries.
At 103 percent funding ratio, both the AED and the SAED will be reduced by one-half percentage point, and for subsequent declines to below 90 percent funded both the AED and SAED will be increased by one-half percentage point.
Historically members have been allowed to purchase service credit at reduced rates. However, legislation passed in the 2006 session required that future agreements to purchase service credit be sufficient to fund the related actuarial liability.
DEFINED CONTRIBUTION PLAN
The PERA Defined Contribution Retirement Plan was established January 1, 2006, as an alternative to the defined benefit plan. All employees, with the exception of certain higher education employees, have the option of participating in the plan. At July 1, 2009, the State’s administrative functions for the defined contribution plan were transferred to PERA. New member contributions to the plan vest from 50 percent to 100 percent evenly over 5 years. Participants in the plan are required to contribute 8 percent of their salary. The temporary contribution rate increase to 10.5 percent effective in Fiscal Years 2010-11 and 2011-12 expired on July 1, 2012. At December 31, 2012, the plan had 4,362 participants.
UNIVERSITY OF COLORADO NOTES TO FINANCIAL STATEMENTS
June 30, 2013 and 2012
65
DEFERRED COMPENSATION PLAN
The PERA Deferred Compensation Plan (457) was established July 1, 2009, as a continuation of the State’s deferred compensation plan, which was established for state and local government employees in 1981. At July 1, 2009, the State’s administrative functions for the 457 plan were transferred to PERA, where all costs of administration and funding are borne by the plan participants. In calendar year 2012, participants were allowed to make contributions of up to 100 percent of their annual gross salary (reduced by their 8 percent PERA contribution) to a maximum of $17,000. The reduction for the 8 percent PERA contribution reflects the expiration of the temporary contribution rate increase to 10.5 percent effective in Fiscal Year 2010-11 and 2011-12. Participants who are age 50 and older, and contributing the maximum amount allowable, were allowed to make an additional $5,500 contribution in 2012, for total contributions of $22,500. Contributions and earnings are tax deferred. At December 31, 2012, the plan had 17,469 participants.
VOLUNTARY TAX-DEFERRED RETIREMENT PLANS
PERA also offers a voluntary 401K plan entirely separate from the defined benefit pension plan. The State offers a 457 deferred compensation plan and certain agencies and institutions of the State offer 403(b) or 401(a) plans.
UNIVERSITY OPTIONAL RETIREMENT PLAN
Under the University’s optional retirement plan (ORP), certain members of the University are required to participate in a defined contribution retirement plan administered by the University for the benefit of full-time faculty and exempt staff members. The State constitution assigns the authority to establish and amend plan provisions to the Regents. The contribution requirements of plan members and the University are established and may be amended by the Regents. Generally, employees are eligible for participation in the ORP after completing one year of service and are vested immediately upon participation. For the years ended June 30, 2013 and 2012, the University’s contribution to the defined contribution retirement plan was equal to 10 percent of covered payroll, and the employee contribution was equal to 5 percent of covered payroll. The University’s contribution under the ORP during the years ended June 30, 2013 and 2012, approximated $82,060,000 and $77,088,000, respectively. The employees’ contribution under the ORP approximated $40,887,000 and $38,439,000 during the years ended June 30, 2013 and 2012, respectively.
Participants in the University’s ORP choose to invest all contributions with one or more of three designated vendors. In addition, participants in the University’s ORP are covered under federal Social Security. Federal Social Security regulations require both the employer and employee to contribute a percentage of covered payroll to Social Security. The first half of Fiscal Year 2011 the Social Security rate was 6.2 percent of covered payroll. The second half of Fiscal Year 2011, the employee percentage dropped temporarily to 4.2 percent which will remain in effect until December 31, 2012. The employee percentage of Social Security rate returned to 6.2 percent January 1, 2013.
ALTERNATE MEDICARE PLAN The University provides an Alternate Medicare Plan (AMP) to retirees aged 65 and over. The AMP is available to the employee and eligible spouse/same gender domestic partner. Coverage is not
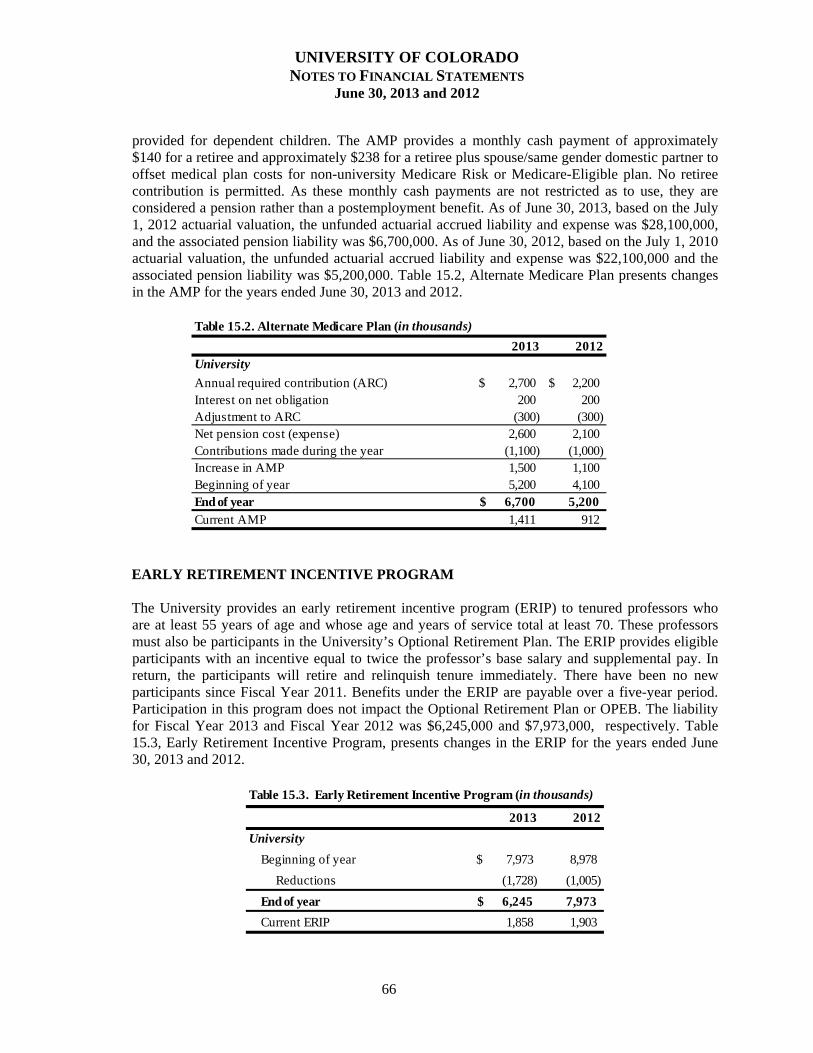
UNIVERSITY OF COLORADO NOTES TO FINANCIAL STATEMENTS
June 30, 2013 and 2012
66
provided for dependent children. The AMP provides a monthly cash payment of approximately $140 for a retiree and approximately $238 for a retiree plus spouse/same gender domestic partner to offset medical plan costs for non-university Medicare Risk or Medicare-Eligible plan. No retiree contribution is permitted. As these monthly cash payments are not restricted as to use, they are considered a pension rather than a postemployment benefit. As of June 30, 2013, based on the July 1, 2012 actuarial valuation, the unfunded actuarial accrued liability and expense was $28,100,000, and the associated pension liability was $6,700,000. As of June 30, 2012, based on the July 1, 2010 actuarial valuation, the unfunded actuarial accrued liability and expense was $22,100,000 and the associated pension liability was $5,200,000. Table 15.2, Alternate Medicare Plan presents changes in the AMP for the years ended June 30, 2013 and 2012.
Table 15.2. Alternate Medicare Plan (in thousands)
2013 2012University
Annual required contribution (ARC) 2,700$ 2,200$ Interest on net obligation 200 200 Adjustment to ARC (300) (300) Net pension cost (expense) 2,600 2,100 Contributions made during the year (1,100) (1,000) Increase in AMP 1,500 1,100 Beginning of year 5,200 4,100 End of year 6,700$ 5,200 Current AMP 1,411 912
EARLY RETIREMENT INCENTIVE PROGRAM The University provides an early retirement incentive program (ERIP) to tenured professors who are at least 55 years of age and whose age and years of service total at least 70. These professors must also be participants in the University’s Optional Retirement Plan. The ERIP provides eligible participants with an incentive equal to twice the professor’s base salary and supplemental pay. In return, the participants will retire and relinquish tenure immediately. There have been no new participants since Fiscal Year 2011. Benefits under the ERIP are payable over a five-year period. Participation in this program does not impact the Optional Retirement Plan or OPEB. The liability for Fiscal Year 2013 and Fiscal Year 2012 was $6,245,000 and $7,973,000, respectively. Table 15.3, Early Retirement Incentive Program, presents changes in the ERIP for the years ended June 30, 2013 and 2012.
2013 2012
University
Beginning of year 7,973$ 8,978
Reductions (1,728) (1,005)
End of year 6,245$ 7,973
Current ERIP 1,858 1,903
Table 15.3. Early Retirement Incentive Program (in thousands)
UNIVERSITY OF COLORADO NOTES TO FINANCIAL STATEMENTS
June 30, 2013 and 2012
67
UPI RETIREMENT PLAN
UPI sponsors a defined contribution retirement plan for its permanent employees that is administered by the Teachers Insurance Annuities Association's College Retirement Equities Fund. The board of directors for UPI has the authority to amend plan provisions. Employees are eligible for participation in the plan after completing one year of service. On behalf of eligible employees, UPI contributed an amount equal to 7 percent of eligible employees' salaries for the years ended June 30, 2013 and 2012. UPI's contributions for covered payroll to the retirement plan for the years ended June 30, 2013 and 2012, approximated $1,756,000 and $1,701,000, respectively.
HEALTH INSURANCE PROGRAMS
The University’s contributions to its various health insurance programs approximated $117,278,000 and $100,976,000 during the years ended June 30, 2013 and 2012, respectively.
NOTE 16 – SEGMENT AND BLENDED COMPONENT UNIT INFORMATION
As of June 30, 2013 and 2012, the University has one segment, UPI. UPI is also a blended component unit of the University.
UPI has identifiable activities for which UPI Variable Rate Demand bonds approximating $15,985,000 and $16,700,00 are outstanding as of June 30, 2013 and 2012, respectively. The activities of this segment include all the University of Colorado Denver School of Medicine’s faculty practice plan.
Summary financial information as of and for the years ended June 30, 2013 and 2012, is presented in Table 16, Segment Financial Information.
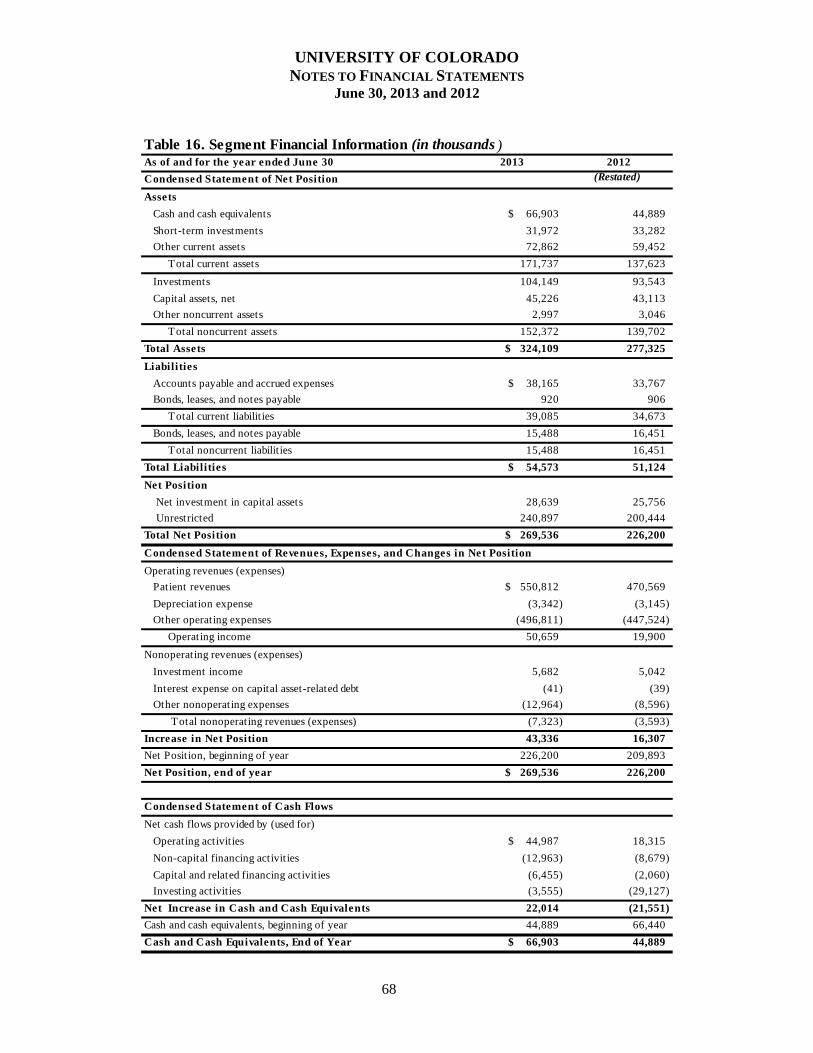
UNIVERSITY OF COLORADO NOTES TO FINANCIAL STATEMENTS
June 30, 2013 and 2012
68
As of and for the year ended June 30 2013 2012
Condensed Statement of Net Position (Restated)
Assets
Cash and cash equivalents $ 66,903 44,889
Short-term investments 31,972 33,282
Other current assets 72,862 59,452
Total current assets 171,737 137,623
Investments 104,149 93,543
Capital assets, net 45,226 43,113
Other noncurrent assets 2,997 3,046
Total noncurrent assets 152,372 139,702
Total Assets $ 324,109 277,325
Liabilities
Accounts payable and accrued expenses $ 38,165 33,767
Bonds, leases, and notes payable 920 906
Total current liabilit ies 39,085 34,673
Bonds, leases, and notes payable 15,488 16,451
Total noncurrent liabilit ies 15,488 16,451
Total Liabilities $ 54,573 51,124
Net Position
Net investment in capital assets 28,639 25,756
Unrestricted 240,897 200,444
Total Net Position $ 269,536 226,200
Operating revenues (expenses)
Patient revenues $ 550,812 470,569
Depreciation expense (3,342) (3,145)
Other operating expenses (496,811) (447,524)
Operating income 50,659 19,900
Nonoperating revenues (expenses)
Investment income 5,682 5,042
Interest expense on capital asset-related debt (41) (39)
Other nonoperating expenses (12,964) (8,596)
Total nonoperating revenues (expenses) (7,323) (3,593)
Increase in Net Position 43,336 16,307
Net Position, beginning of year 226,200 209,893
Net Position, end of year $ 269,536 226,200
Condensed Statement of Cash Flows
Net cash flows provided by (used for)
Operating activities $ 44,987 18,315
Non-capital financing activities (12,963) (8,679)
Capital and related financing activities (6,455) (2,060)
Investing activities (3,555) (29,127)
Net Increase in Cash and Cash Equivalents 22,014 (21,551)
Cash and cash equivalents, beginning of year 44,889 66,440
Cash and Cash Equivalents, End of Year $ 66,903 44,889
Table 16. Segment Financial Information (in thousands )
Condensed Statement of Revenues, Expenses, and Changes in Net Position
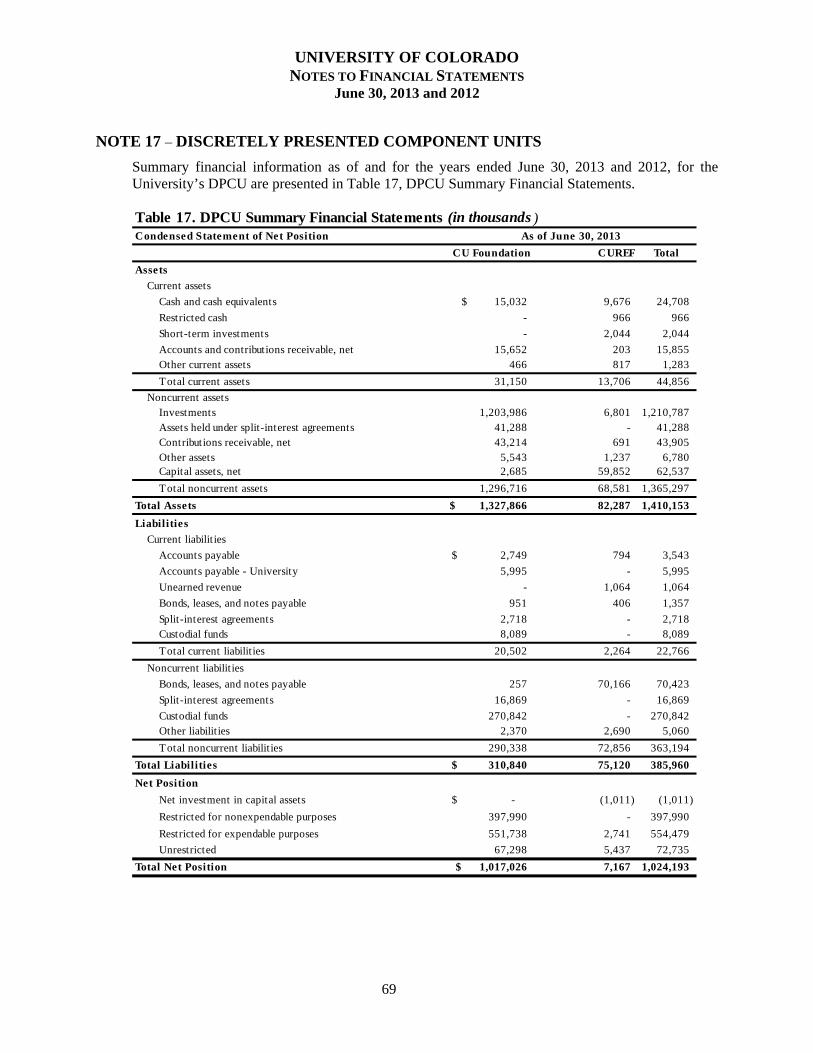
UNIVERSITY OF COLORADO NOTES TO FINANCIAL STATEMENTS
June 30, 2013 and 2012
69
NOTE 17 – DISCRETELY PRESENTED COMPONENT UNITS
Summary financial information as of and for the years ended June 30, 2013 and 2012, for the University’s DPCU are presented in Table 17, DPCU Summary Financial Statements.
Condensed Statement of Net Position
CU Foundation CUREF Total
Assets
Current assets
Cash and cash equivalents $ 15,032 9,676 24,708
Restricted cash - 966 966
Short-term investments - 2,044 2,044
Accounts and contributions receivable, net 15,652 203 15,855 Other current assets 466 817 1,283
Total current assets 31,150 13,706 44,856
Noncurrent assets Investments 1,203,986 6,801 1,210,787 Assets held under split-interest agreements 41,288 - 41,288 Contributions receivable, net 43,214 691 43,905 Other assets 5,543 1,237 6,780 Capital assets, net 2,685 59,852 62,537
Total noncurrent assets 1,296,716 68,581 1,365,297
Total Assets $ 1,327,866 82,287 1,410,153
Liabilities
Current liabilit ies
Accounts payable 2,749$ 794 3,543
Accounts payable - University 5,995 - 5,995
Unearned revenue - 1,064 1,064
Bonds, leases, and notes payable 951 406 1,357
Split-interest agreements 2,718 - 2,718 Custodial funds 8,089 - 8,089
Total current liabilit ies 20,502 2,264 22,766
Noncurrent liabilit ies
Bonds, leases, and notes payable 257 70,166 70,423
Split-interest agreements 16,869 - 16,869
Custodial funds 270,842 - 270,842 Other liabilit ies 2,370 2,690 5,060
Total noncurrent liabilit ies 290,338 72,856 363,194
Total Liabilities 310,840$ 75,120 385,960
Net Position
Net investment in capital assets -$ (1,011) (1,011)
Restricted for nonexpendable purposes 397,990 - 397,990
Restricted for expendable purposes 551,738 2,741 554,479
Unrestricted 67,298 5,437 72,735
Total Net Position $ 1,017,026 7,167 1,024,193
As of June 30, 2013
Table 17. DPCU Summary Financial Statements (in thousands )
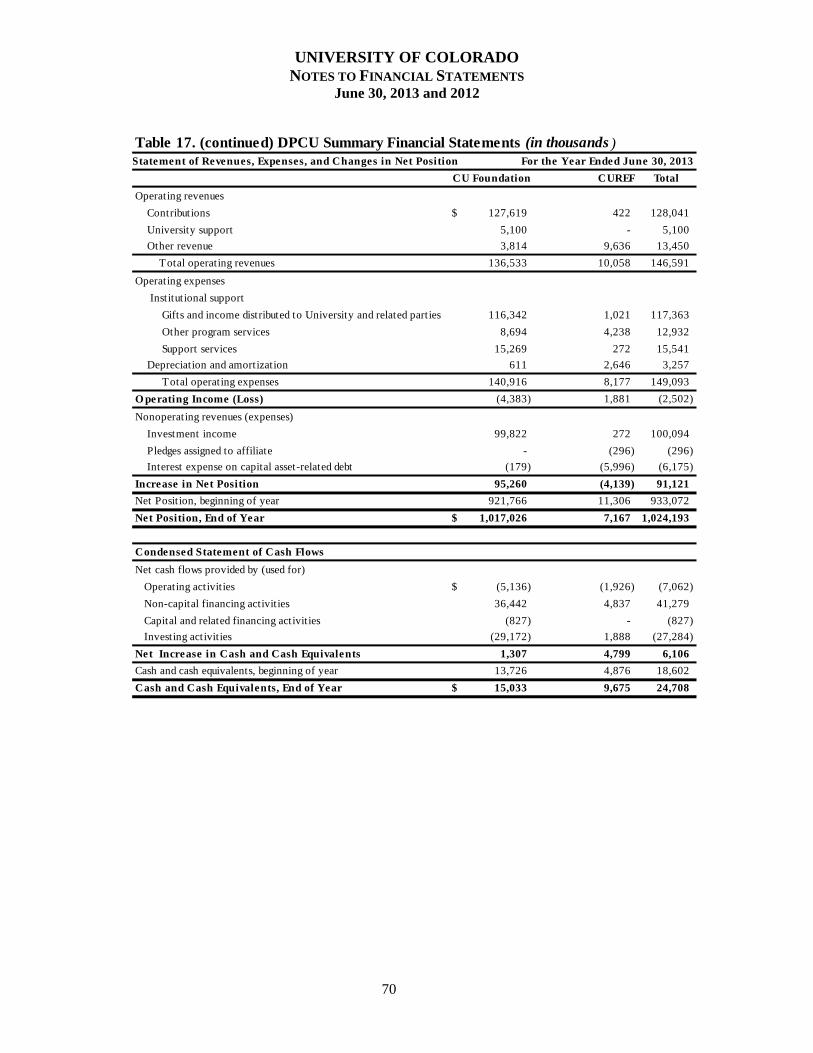
UNIVERSITY OF COLORADO NOTES TO FINANCIAL STATEMENTS
June 30, 2013 and 2012
70
Statement of Revenues, Expenses, and Changes in Net Position For the Year Ended June 30, 2013
CU Foundation CUREF Total
Operating revenues
Contributions 127,619$ 422 128,041
University support 5,100 - 5,100
Other revenue 3,814 9,636 13,450
Total operating revenues 136,533 10,058 146,591
Operating expenses
Institutional support
Gifts and income distributed to University and related parties 116,342 1,021 117,363
Other program services 8,694 4,238 12,932
Support services 15,269 272 15,541
Depreciation and amortization 611 2,646 3,257
Total operating expenses 140,916 8,177 149,093
O perating Income (Loss) (4,383) 1,881 (2,502)
Nonoperating revenues (expenses)
Investment income 99,822 272 100,094
Pledges assigned to affiliate - (296) (296)
Interest expense on capital asset-related debt (179) (5,996) (6,175)
Increase in Net Position 95,260 (4,139) 91,121
Net Position, beginning of year 921,766 11,306 933,072
Net Position, End of Year 1,017,026$ 7,167 1,024,193
Condensed Statement of Cash Flows
Net cash flows provided by (used for)
Operating activities (5,136)$ (1,926) (7,062)
Non-capital financing activities 36,442 4,837 41,279
Capital and related financing activities (827) - (827)
Investing activities (29,172) 1,888 (27,284)
Net Increase in Cash and Cash Equivalents 1,307 4,799 6,106
Cash and cash equivalents, beginning of year 13,726 4,876 18,602
Cash and Cash Equivalents, End of Year 15,033$ 9,675 24,708
Table 17. (continued) DPCU Summary Financial Statements (in thousands )
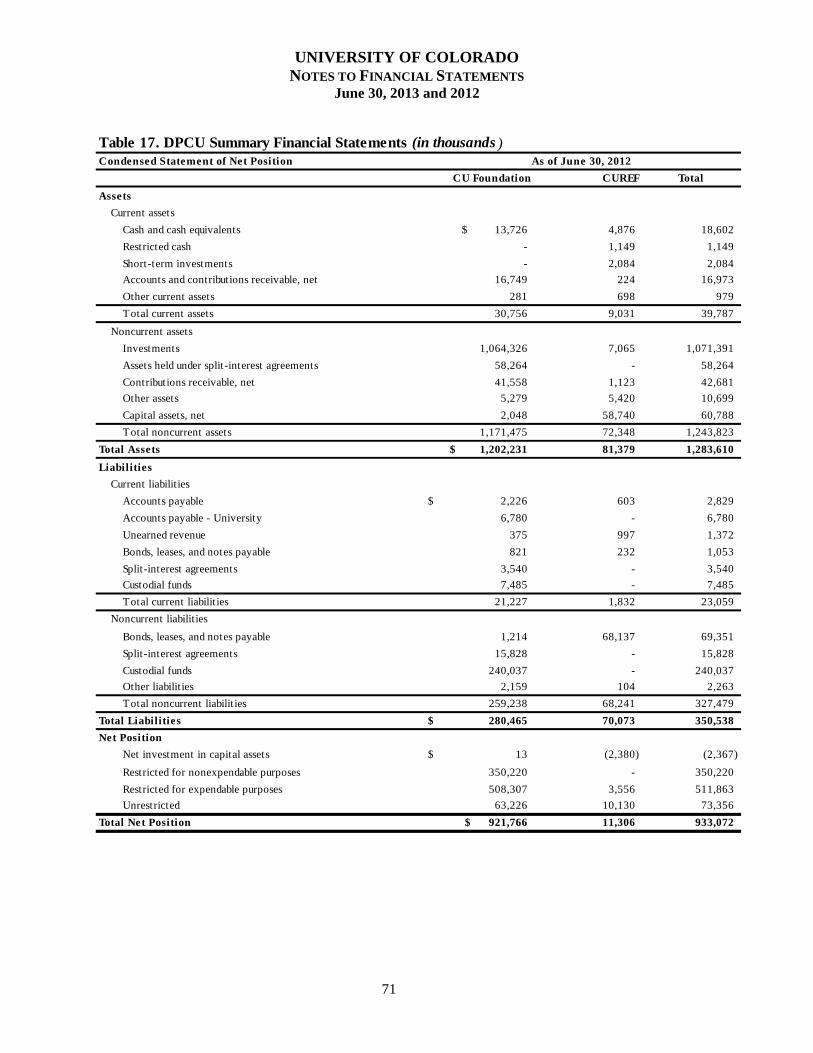
UNIVERSITY OF COLORADO NOTES TO FINANCIAL STATEMENTS
June 30, 2013 and 2012
71
Condensed Statement of Net Position
CU Foundation CUREF Total
Assets
Current assets
Cash and cash equivalents $ 13,726 4,876 18,602
Restricted cash - 1,149 1,149
Short-term investments - 2,084 2,084
Accounts and contributions receivable, net 16,749 224 16,973
Other current assets 281 698 979
Total current assets 30,756 9,031 39,787
Noncurrent assets
Investments 1,064,326 7,065 1,071,391
Assets held under split-interest agreements 58,264 - 58,264
Contributions receivable, net 41,558 1,123 42,681
Other assets 5,279 5,420 10,699
Capital assets, net 2,048 58,740 60,788
Total noncurrent assets 1,171,475 72,348 1,243,823
Total Assets $ 1,202,231 81,379 1,283,610
Liabilities
Current liabilit ies
Accounts payable 2,226$ 603 2,829
Accounts payable - University 6,780 - 6,780
Unearned revenue 375 997 1,372
Bonds, leases, and notes payable 821 232 1,053
Split-interest agreements 3,540 - 3,540
Custodial funds 7,485 - 7,485
Total current liabilit ies 21,227 1,832 23,059
Noncurrent liabilit ies
Bonds, leases, and notes payable 1,214 68,137 69,351
Split-interest agreements 15,828 - 15,828
Custodial funds 240,037 - 240,037
Other liabilit ies 2,159 104 2,263
Total noncurrent liabilit ies 259,238 68,241 327,479
Total Liabilities 280,465$ 70,073 350,538
Net Position
Net investment in capital assets 13$ (2,380) (2,367)
Restricted for nonexpendable purposes 350,220 - 350,220
Restricted for expendable purposes 508,307 3,556 511,863
Unrestricted 63,226 10,130 73,356
Total Net Position $ 921,766 11,306 933,072
Table 17. DPCU Summary Financial Statements (in thousands )As of June 30, 2012
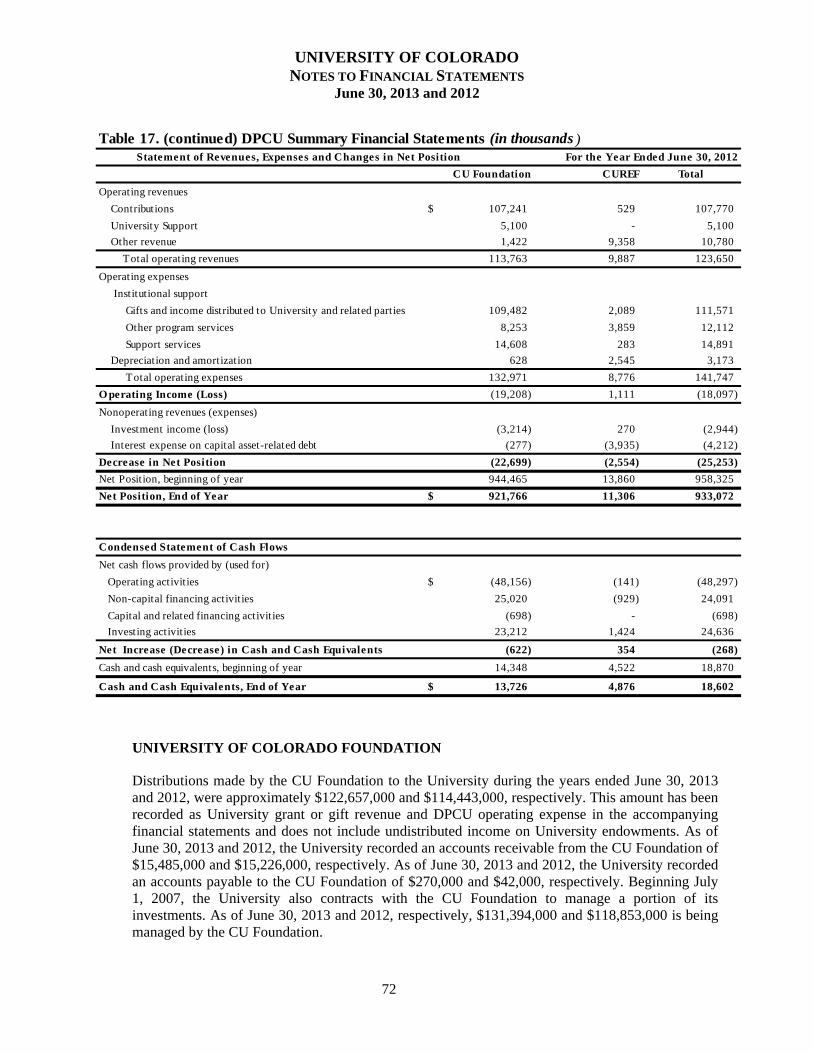
UNIVERSITY OF COLORADO NOTES TO FINANCIAL STATEMENTS
June 30, 2013 and 2012
72
Statement of Revenues, Expenses and Changes in Net Position For the Year Ended June 30, 2012
CU Foundation CUREF Total
Operating revenues
Contributions 107,241$ 529 107,770
University Support 5,100 - 5,100
Other revenue 1,422 9,358 10,780
Total operating revenues 113,763 9,887 123,650
Operating expenses
Institutional support
Gifts and income distributed to University and related parties 109,482 2,089 111,571
Other program services 8,253 3,859 12,112
Support services 14,608 283 14,891
Depreciation and amortization 628 2,545 3,173
Total operating expenses 132,971 8,776 141,747
O perating Income (Loss) (19,208) 1,111 (18,097)
Nonoperating revenues (expenses)
Investment income (loss) (3,214) 270 (2,944)
Interest expense on capital asset-related debt (277) (3,935) (4,212)
Decrease in Net Position (22,699) (2,554) (25,253)
Net Position, beginning of year 944,465 13,860 958,325
Net Position, End of Year 921,766$ 11,306 933,072
Condensed Statement of Cash Flows
Net cash flows provided by (used for)
Operating activities (48,156)$ (141) (48,297)
Non-capital financing activities 25,020 (929) 24,091
Capital and related financing activities (698) - (698)
Investing activities 23,212 1,424 24,636
Net Increase (Decrease) in Cash and Cash Equivalents (622) 354 (268)
Cash and cash equivalents, beginning of year 14,348 4,522 18,870
Cash and Cash Equivalents, End of Year 13,726$ 4,876 18,602
Table 17. (continued) DPCU Summary Financial Statements (in thousands )
UNIVERSITY OF COLORADO FOUNDATION
Distributions made by the CU Foundation to the University during the years ended June 30, 2013 and 2012, were approximately $122,657,000 and $114,443,000, respectively. This amount has been recorded as University grant or gift revenue and DPCU operating expense in the accompanying financial statements and does not include undistributed income on University endowments. As of June 30, 2013 and 2012, the University recorded an accounts receivable from the CU Foundation of $15,485,000 and $15,226,000, respectively. As of June 30, 2013 and 2012, the University recorded an accounts payable to the CU Foundation of $270,000 and $42,000, respectively. Beginning July 1, 2007, the University also contracts with the CU Foundation to manage a portion of its investments. As of June 30, 2013 and 2012, respectively, $131,394,000 and $118,853,000 is being managed by the CU Foundation.
UNIVERSITY OF COLORADO NOTES TO FINANCIAL STATEMENTS
June 30, 2013 and 2012
73
The University is the ultimate beneficiary of substantially all restricted and trust funds held by the CU Foundation and is income beneficiary of a significant portion of endowment funds held by the CU Foundation. In addition, the University contracts with the CU Foundation to manage its endowments. The University has endowments and other assets held by the CU Foundation approximating $133,259,000 and $126,498,000 as of June 30, 2013 and 2012, respectively. The CU Foundation retained an investment management fee equal to 1 percent. The University paid a fee to the CU Foundation for development services of $5,100,000 during the years ended June 30, 2013 and 2012.
THE UNIVERSITY OF COLORADO REAL ESTATE FOUNDATION
For the years ended June 30, 2013 and 2012, CUREF distributed approximately $1,021,000 and $2,089,000, respectively, reported as operating expense, to the University, which recognized an equal amount of gift revenue. CUREF has a line of credit with the University in the amount of $7,000,000, which expired on July 3, 2013, but was renewed through June 30, 2023. Interest rates are determined at the time a draw on the line of credit is made. During the year ended June 30, 2013, CUREF drew $2,500,000 which was still outstanding at year end at a rate of 2.10 percent. Interest only payments on the $2,500,000 draw are due semiannually on June 1 and December 1, until December, 2014, when semiannual payments of principal and interest are due until maturity on June 30, 2023. CUREF has a long-term agreement with the University to rent portions of a building owned by CUREF. For the years ended June 30, 2013 and 2012, the University paid approximately $2,560,000 and $2,270,000, respectively, in rent of which approximately $362,000 and $372,000, respectively was prepaid at June 30, 2013 and 2012, to CUREF, which recognized an equal amount of other operating revenues. As of June 30, 2013 and 2012, the University had no accounts receivable owed from and no accounts payable due to CUREF.
NOTE 18 – RELATED ORGANIZATIONS, JOINT VENTURES, AND JOINTLY GOVERNED ORGANIZATIONS
UNIVERSITY OF COLORADO HOSPITAL AUTHORITY
In accordance with 1991 State legislation, the Hospital Authority was established as a separate and distinct entity. Detailed financial information may be obtained directly from the Hospital Authority at Mail Stop F-401, P.O. Box 6506, Aurora, Colorado 80045.
CU Denver and UPI have several types of financial transactions with the Hospital Authority. On an annual basis, CU Denver or UPI and the Hospital Authority enter into agreements specifying the fees to be charged for services and the allocation of expenses between the two organizations. In certain circumstances, CU Denver may bear the entire cost of certain services in exchange for educational or other services provided by the Hospital Authority. In some instances, the fee charged by CU Denver, UPI, or the Hospital Authority is a set amount for specific services to be provided. In other circumstances, the fee charged is based upon the amount or type of services requested by either CU Denver or the Hospital Authority.
UNIVERSITY OF COLORADO NOTES TO FINANCIAL STATEMENTS
June 30, 2013 and 2012
74
Examples of services provided by CU Denver to the Hospital Authority include telecommunications services, rental of office space, and resident doctors. Examples of services provided by the Hospital Authority to CU Denver include shipping and receiving services and student health services. In general, amounts receivable from, or payable to, the Hospital Authority are settled within the following calendar quarter.
Total payments issued by the Hospital Authority to CU Denver approximated $37,796,000 and $34,798,000 for years ended June 30, 2013 and 2012, respectively. Total payments issued by CU Denver to the Hospital Authority for the years ended June 30, 2013 and 2012 approximated $9,943,000 and $10,792,000, respectively.
During the years ended June 30, 2013 and 2012, UPI recognized approximately $27,762,000 and $28,409,000, respectively, in health services revenue from the Hospital Authority in support of clinical and academic missions. UPI also received approximately $40,264,000 and $32,906,000 during the years ended June 30, 2013 and 2012, respectively, from the Hospital Authority for amounts earned for services performed by UPI faculty members but required to be processed through the Hospital Authority (such as the State of Colorado medically indigent program, Ryan White, and other miscellaneous programs).
As of June 30, 2013 and 2012, the University recorded an accounts receivable from the Hospital Authority of $3,417,000 and $3,524,000, respectively, for various services provided. As of June 30, 2013 and 2012, the University recorded an accounts payable to the Hospital Authority of $73,000 and $81,000, respectively. Generally, amounts due are paid during the current or subsequent month.
UPI received $4,822,000 and $873,000 in dividends from TriWest during the years ended June 30, 2013 and 2012, respectively. UPI has signed an agreement to assume the Hospital Authority's network management commitment to TriWest for a fee and has also signed a provider service agreement with TriWest. See Note 1 for more information about UPI and TriWest.
AURARIA HIGHER EDUCATION CENTER
AHEC, established by legislation in 1974, is jointly governed and utilized by CU Denver, the Community College of Denver, and Metropolitan State University of Denver. The institutions share the costs of operating common educational, library, and other auxiliary facilities. Costs of the common facilities are shared in accordance with an operating agreement between AHEC and the respective institutions. During the years ended June 30, 2013 and 2012, the University incurred expenses related to the common facilities approximating $8,562,000 and $8,976,000, respectively, for payments to AHEC.
At June 30, 2013 and 2012, the University recorded an accounts payable to AHEC of $152,000 and $375,000, respectively, for services rendered but not yet paid, and for fees collected for the spring end of term but not yet paid. At June 30, 2013 and 2012, the University had no accounts receivable due from AHEC. For related party lease transactions, see Note 9.
Detailed financial information may be obtained directly from AHEC at 1201 5th Street Suite 370, Denver, Colorado 80217-336.
UNIVERSITY OF COLORADO NOTES TO FINANCIAL STATEMENTS
June 30, 2013 and 2012
75
UNIVERSITY OF COLORADO HEALTH AND WELFARE TRUST
The Trust was formed June 28, 2010. Trust members are the University, the Hospital Authority, and UPI. The purpose of the Trust is to provide healthcare benefits to the employees of the Trust members on a self-insured basis effective July 1, 2010. The University does not have financial accountability over the Trust. Self-insured risks are transferred to the pool.
The Trust paid medical claims on behalf of the University of $109,044,000 and $91,757,000 for Fiscal Year 2013 and Fiscal Year 2012, respectively. The University’s contributions to the Trust were $117,153,000 and $96,535,000 for the years ended June 30, 2013 and 2012, respectively, and the employees’ contributions were $19,641,000 and $20,522,000, respectively. As of June 30, 2013 and 2012, the University had accounts receivable owed from the Trust of $550,000 and $143,000, respectively, and accounts payable due to the Trust of $39,725 and $287,000, respectively. Detailed financial information may be obtained directly from the Trust at 1800 Grant Street, Suite 225, Denver, Colorado 80203.
NOTE 19 – COMMITMENTS AND CONTINGENCIES
The University leases various buildings and equipment under operating lease rental agreements. Operating leases do not give rise to property rights or meet other capital lease criteria and, therefore, the related assets and liabilities are not recorded in the accompanying financial statements. For the years ended June 30, 2013 and 2012, total rental expense under these agreements approximated $11,329,000 and $9,724,000 for the University, respectively. Future minimum payments for these operating leases are shown in Table 19, University Operating Leases Minimum Lease Obligations.
Table 19. University Operating Leases Minimum Lease Obligations (in thousands)
Years Ending June 302014 $ 9,495
2015 8,0192016 5,1972017 4,9962018 3,587
2019-2023 13,5272024-2028 154
Total Operating Lease Obligations $ 44,975
Minimum Lease Obligation
University
Contracts have been entered into for the purpose of planning, acquiring, constructing, and equipping certain building additions and other projects with outstanding amounts totaling approximately $195,756,000 and $102,153,000, as of June 30, 2013 and 2012, respectively. These additions will be funded or financed by donor contributions, appropriations from the State, issuance of revenue bonds, and other financings. As of June 30, 2013 and 2012, the amount of capital construction appropriations authorized from the State for these projects approximated $14,476,000 and $3,841,000, respectively.
UNIVERSITY OF COLORADO NOTES TO FINANCIAL STATEMENTS
June 30, 2013 and 2012
76
Substantial amounts are received and expended by the University under federal and state grants and contracts, and are subject to audit by cognizant governmental agencies. This funding relates to research, student aid, and other programs. University management believes that any liabilities arising from such audits will not have a material effect on the University’s financial position or operations.
UPI, as a member of the healthcare industry, is subject to numerous laws and regulations of federal, state, and local governments. These laws and regulations include, but are not necessarily limited to, matters such as licensure, accreditation, and government healthcare program participation requirements; reimbursement for patient services; and Medicare and Medicaid fraud and abuse. Government activity has continued to increase with respect to investigations and allegations concerning possible violations of fraud and abuse statutes and regulations by healthcare providers. Violations of these laws and regulations could result in expulsion from government healthcare programs, together with the imposition of significant fines and penalties, as well as significant repayments for patient services previously billed. UPI management believes that UPI is in substantial compliance with fraud and abuse statutes as well as other applicable government laws and regulations. While no regulatory inquiries have been made, compliance with such laws and regulations can be subject to future government review and interpretation as well as regulatory actions unknown or unasserted at this time. On June 17, 2013, a buyer purchased 6.74 acres (“Residential Parcel”) of the 28.55 acres of the former Ninth Avenue campus for $9,215,000. $1,000,000 of that purchase price was escrowed to be used by the buyer to reimburse it for the University’s share of demolition and infrastructure construction costs that will benefit the remaining parcel. In addition to the purchase price, the University will be the recipient of any Tax Increment Financing (TIP) proceeds that are generated from the Residential Parcel. The University has recently placed the remaining 21.81 acre parcel on the market and hopes to have a buyer selected for that parcel by the end of calendar year 2013. The University is a defendant in a number of legal actions. While the final outcome of many of these legal actions cannot be determined at this time, management is of the opinion that the ultimate liability not covered by insurance, if any, for these legal actions will not have a material effect on the University’s financial position or operations.
NOTE 20 – SUBSEQUENT EVENTS
CU FOUNDATION
Approximately 140 employees of the CU Foundation became employees of the University effective July 1, 2013. An additional 60 CU Foundation employees became University employees effective August 1, 2013. This change in employment status is part of a restructuring of the University’s donor cultivation, solicitation, and stewardship efforts. The restructuring resulted in significantly all CU Foundation employees and fundraising activities transitioning to the University. The CU Foundation continues to exist as a separate legal entity and maintain its investment portfolio. As the significance of
UNIVERSITY OF COLORADO NOTES TO FINANCIAL STATEMENTS
June 30, 2013 and 2012
77
philanthropy and other private support to the University of Colorado continues to grow, the university has determined that development and related support operations should be formally integrated into the university structure rather than being managed through the CU Foundation.
The new structure is expected to better align university and fundraising personnel and priorities, as the University pursues higher fundraising goals for and priority initiatives that include: a major Athletics capital initiative at CU-Boulder, a scholarships campaign at CU Denver, the CU Cancer Center at the Anschutz Medical Campus, and a North Nevada Avenue expansion at UCCS.
CU-BOULDER
The CU-Boulder campus experienced significant flooding subsequent to year end. It is estimated that approximately 25 percent of campus buildings sustained some degree of water damage. As of the report date, management is in the process of completing its assessment of the damage and the associated cost of repair. A majority of the repair cost is expected to be covered by University insurance policies. At this time, it is not possible to estimate the financial impact of the capital asset impairments.
BOND ISSUANCE
On October 9, 2013, the University issued $142,460,000 of Tax-Exempt University Enterprise Revenue Bonds, Series 2013A, and $11,245,000 of Taxable University Enterprise Revenue Bonds, Series 2013B, and used the proceeds to defray a portion of the cost of financing certain capital improvement projects, and to pay certain costs related to the issuance. These special limited obligations are payable solely from the net revenues as defined. Series 2013A has rates ranging from 2 percent to 5 percent, and the bonds mature through June 1, 2033. Series 2013B has rates ranging from 1.088 percent to 4.65 percent, and the bonds mature through June 1, 2028.
78
REQUIRED SUPPLEMENTARY INFORMATION
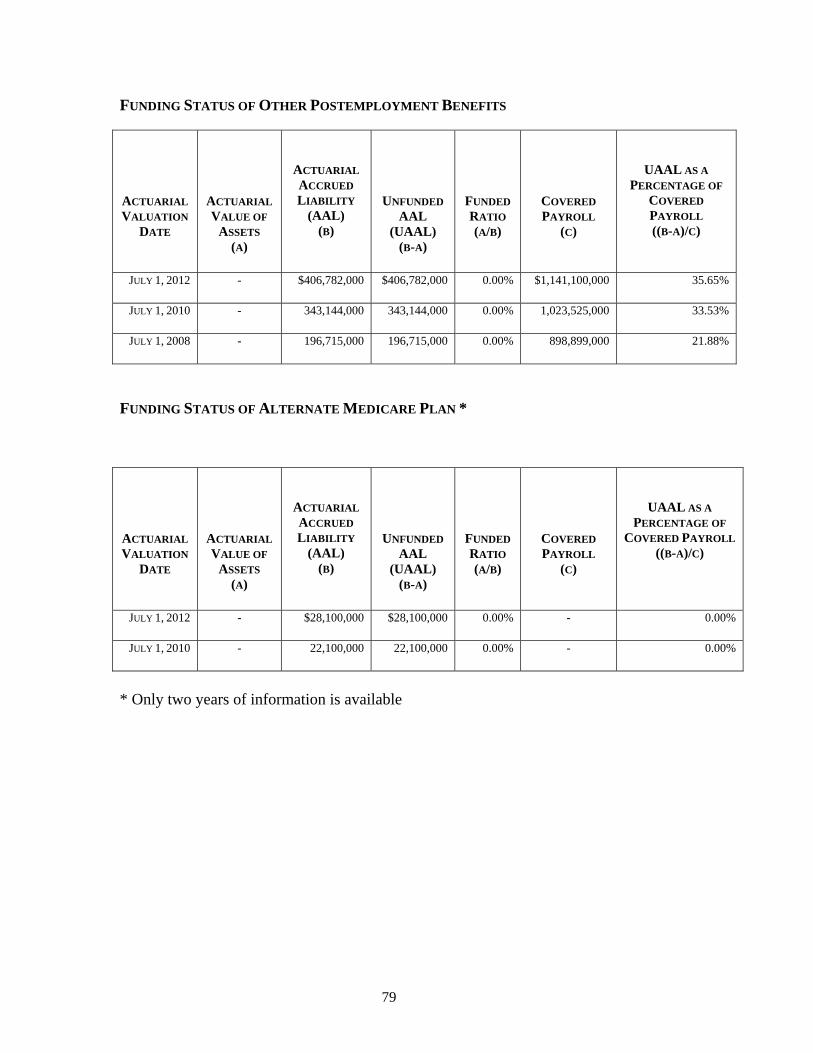
79
FUNDING STATUS OF OTHER POSTEMPLOYMENT BENEFITS
ACTUARIAL
VALUATION
DATE
ACTUARIAL
VALUE OF
ASSETS (A)
ACTUARIAL
ACCRUED
LIABILITY
(AAL)
(B)
UNFUNDED
AAL
(UAAL)
(B-A)
FUNDED
RATIO
(A/B)
COVERED
PAYROLL
(C)
UAAL AS A
PERCENTAGE OF
COVERED
PAYROLL ((B-A)/C)
JULY 1, 2012 - $406,782,000 $406,782,000 0.00% $1,141,100,000 35.65%
JULY 1, 2010 - 343,144,000 343,144,000 0.00% 1,023,525,000 33.53%
JULY 1, 2008 - 196,715,000 196,715,000 0.00% 898,899,000 21.88%
FUNDING STATUS OF ALTERNATE MEDICARE PLAN *
ACTUARIAL
VALUATION
DATE
ACTUARIAL
VALUE OF
ASSETS (A)
ACTUARIAL
ACCRUED
LIABILITY
(AAL)
(B)
UNFUNDED
AAL
(UAAL)
(B-A)
FUNDED
RATIO
(A/B)
COVERED
PAYROLL
(C)
UAAL AS A
PERCENTAGE OF
COVERED PAYROLL
((B-A)/C)
JULY 1, 2012 - $28,100,000 $28,100,000 0.00% - 0.00%
JULY 1, 2010 - 22,100,000 22,100,000 0.00% - 0.00%
* Only two years of information is available
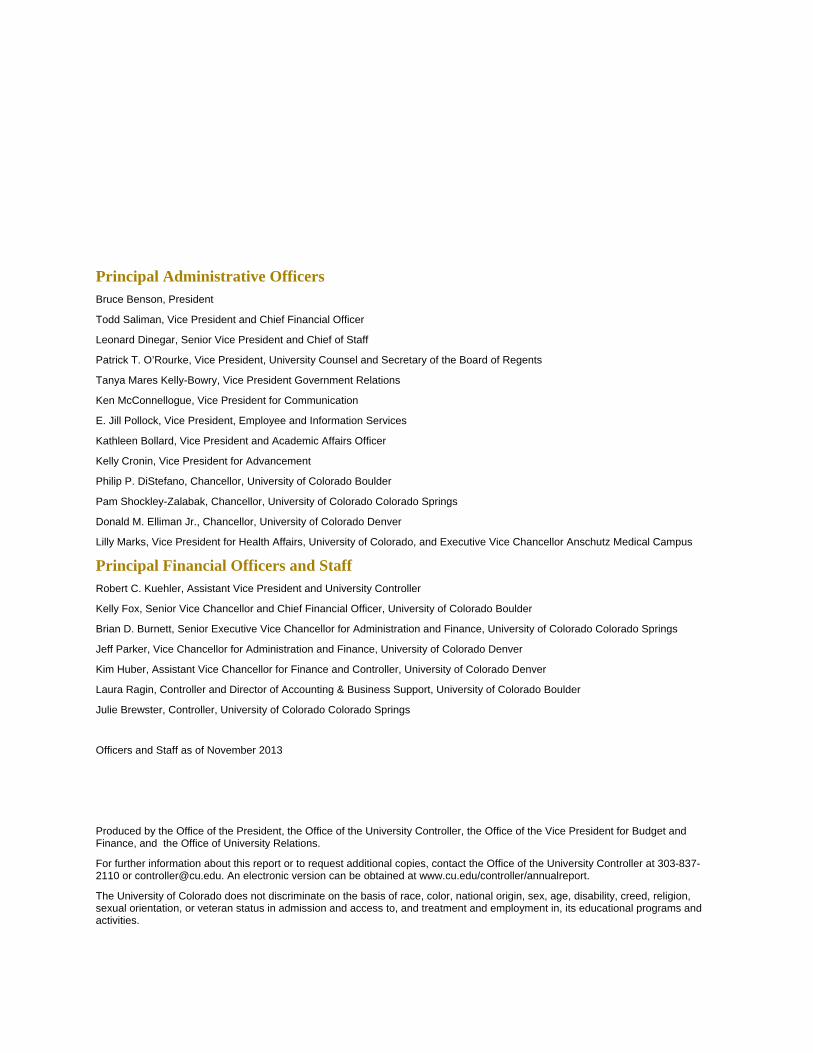
Principal Administrative Officers Bruce Benson, President
Todd Saliman, Vice President and Chief Financial Officer
Leonard Dinegar, Senior Vice President and Chief of Staff
Patrick T. O’Rourke, Vice President, University Counsel and Secretary of the Board of Regents
Tanya Mares Kelly-Bowry, Vice President Government Relations
Ken McConnellogue, Vice President for Communication
E. Jill Pollock, Vice President, Employee and Information Services
Kathleen Bollard, Vice President and Academic Affairs Officer
Kelly Cronin, Vice President for Advancement
Philip P. DiStefano, Chancellor, University of Colorado Boulder
Pam Shockley-Zalabak, Chancellor, University of Colorado Colorado Springs
Donald M. Elliman Jr., Chancellor, University of Colorado Denver
Lilly Marks, Vice President for Health Affairs, University of Colorado, and Executive Vice Chancellor Anschutz Medical Campus
Principal Financial Officers and Staff Robert C. Kuehler, Assistant Vice President and University Controller
Kelly Fox, Senior Vice Chancellor and Chief Financial Officer, University of Colorado Boulder
Brian D. Burnett, Senior Executive Vice Chancellor for Administration and Finance, University of Colorado Colorado Springs
Jeff Parker, Vice Chancellor for Administration and Finance, University of Colorado Denver
Kim Huber, Assistant Vice Chancellor for Finance and Controller, University of Colorado Denver
Laura Ragin, Controller and Director of Accounting & Business Support, University of Colorado Boulder
Julie Brewster, Controller, University of Colorado Colorado Springs
Officers and Staff as of November 2013
Produced by the Office of the President, the Office of the University Controller, the Office of the Vice President for Budget and Finance, and the Office of University Relations.
For further information about this report or to request additional copies, contact the Office of the University Controller at 303-837-2110 or [email protected]. An electronic version can be obtained at www.cu.edu/controller/annualreport.
The University of Colorado does not discriminate on the basis of race, color, national origin, sex, age, disability, creed, religion, sexual orientation, or veteran status in admission and access to, and treatment and employment in, its educational programs and activities.