university of arizona department of hydrology and...
TRANSCRIPT

Page 1 of 7
University of ArizonaDepartment of Hydrology and Water Resources
Dr. Marek ZredaHWR431/531 - Hydrogeology
Final exam - 11 December 2012Open books and notes - but individual work!!!
The test contains 16 questions/problems on 7 pages. Most are worth 10 points each; the last two are worth 30 points each. The maximum is 200.
Problem 1. [10 points]
Define the following terms (in words and using formulas, where applicable; give units; give typi-cal values or example values). Describe where and how they are used.
(a) well function.
(b) tensiometer.
(c) superposition.
(d) equilibrium constant.
(e) radioactive decay constant.
Problem 2. [10 points]
Use simple graphs to show correlation between the following pairs of parameters/variables (in other words, show their mathematical relationships graphically). Explain briefly.
(a) activity coefficient and ion’s valence.
(b) ionic strength and total dissolved solids.
(c) parent nuclide and daughter nuclide (e.g., 3H and 3He).
(d) water content (or saturation) and unsaturated specific discharge.
(e) transmissivity and drawdown.
1 2 3 4 5 6 7 8
9 10 11 12 13 14 15 16

Page 2 of 7
Problem 3. [10 points]
How many image wells are theoretically needed in the system that consists of one real well and two parallel straight line boundaries (figure)? Why? Are these pumping or injecting wells? How many wells will suffice in practice? Why? Show them on the graph.
Problem 4. [10 points]
In a horizontal, confined aquifer, hydraulic conductivity changes in the direction of flow linearly from Ka=0.2 m/d at point A to Kb=0.1 m/d at point B, and porosity changes linearly from na=0.1 to nb=0.2 (A and B are along a typical flow path). Is the velocity of ground water constant along the flow path? Why or why not?
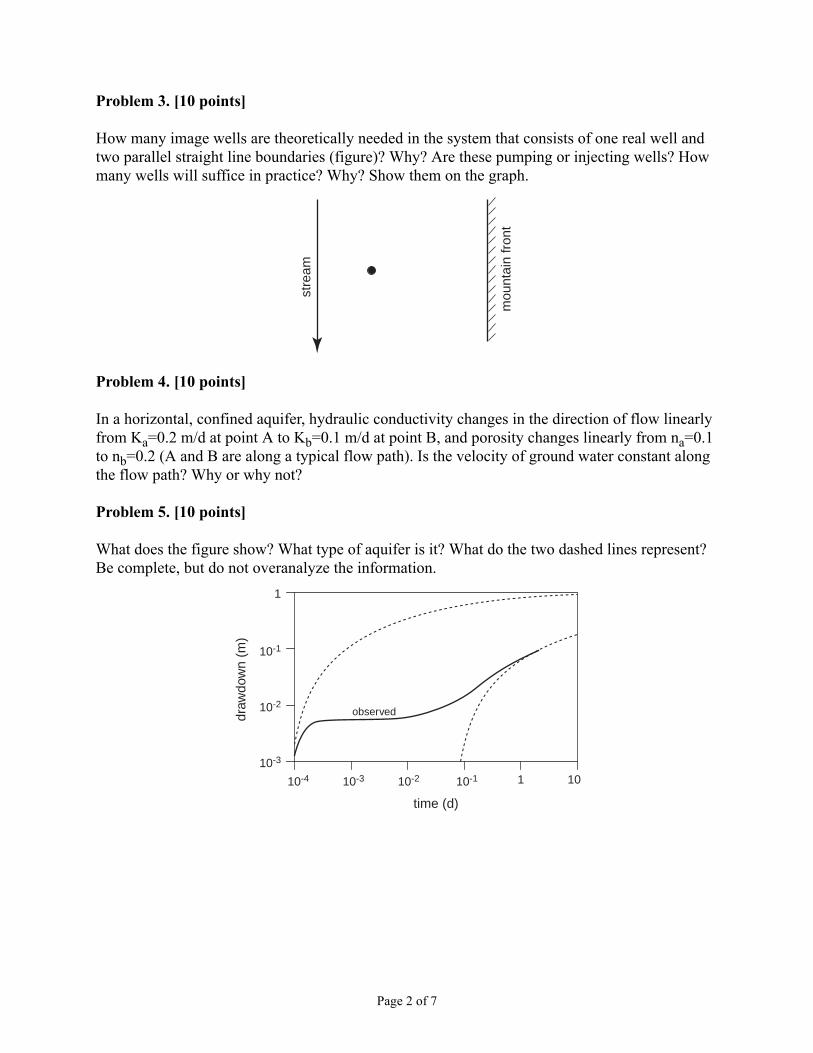
Problem 5. [10 points]
What does the figure show? What type of aquifer is it? What do the two dashed lines represent? Be complete, but do not overanalyze the information.
stre
am
mou
ntai
n fr
ont
observed
time (d)
draw
dow
n (m
)
10-4 10-3 10110-110-2
10-3
10-2
10-1
1
Page 3 of 7
Problem 6. [10 points]
(a) For effective hydraulic conductivity, we can use arithmetic, harmonic or geometric mean. Forthe data in the table, order the three averages from smallest to largest. Is this relationshipalways valid? Why or why not? What assumption(s) regarding each layer did we make?
(b) The five different isotropic horizontal layers from part (a) separate a confined aquifer fromground surface. If the piezometric surface in the confined aquifer is at the bottom of layer 5,what is the recharge rate of the confined aquifer? (Assume that all layers are saturated, that theinfiltration rate at the surface is sufficient to maintain any downward flow, and that no water isstanding above the surface.)
Problem 7. [10 points]
A sandy soil is in contact (horizontally) with a silty soil. If they have the same initial water con-tent (and both are unsaturated) will there be a movement of water? Why or why not? If yes, in what direction? Why?
Problem 8. [10 points]
A chemical tracer has been injected in a deep confined aquifer, and its concentrations monitored at observation wells. Expected arrival time was calculated based on advective velocity. Give at least one reason for each of the following cases: (i) the tracer arrived slightly earlier than expected; (ii) the tracer arrived much earlier than expected; (iii) the tracer arrived slightly later than expected; and (iv) the tracer arrived much later than expected.
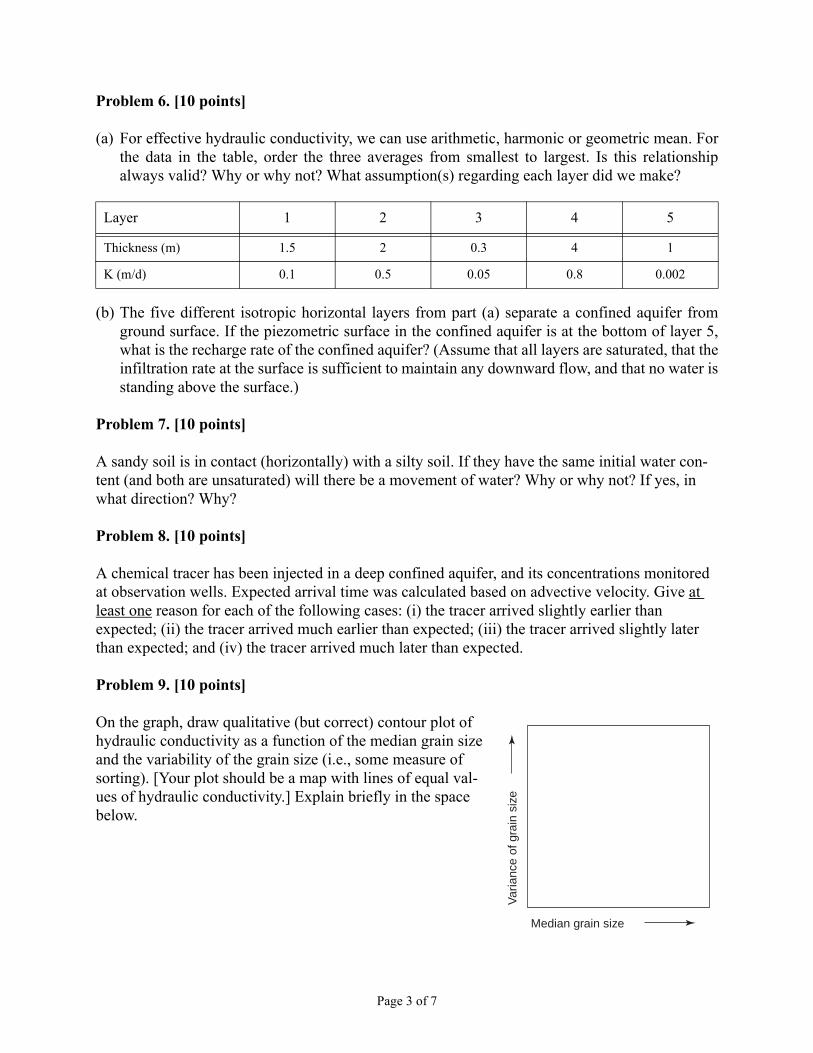
Problem 9. [10 points]
On the graph, draw qualitative (but correct) contour plot of hydraulic conductivity as a function of the median grain size and the variability of the grain size (i.e., some measure of sorting). [Your plot should be a map with lines of equal val-ues of hydraulic conductivity.] Explain briefly in the space below.
Layer 1 2 3 4 5
Thickness (m) 1.5 2 0.3 4 1
K (m/d) 0.1 0.5 0.05 0.8 0.002
Median grain size
Var
ianc
e of
gra
in s
ize

Page 4 of 7
Problem 10. [10 points]
A core sample from unsaturated zone is 10 cm long, 5 cm in diameter, weighs 420.3 g before dry-ing and 369.2 g after drying. Calculate gravimetric water content, volumetric water content, porosity, void ratio, saturation percentage, and bulk density.
Problem 11. [10 points]
(a) What is the difference between hydraulic head h and hydraulic potential Φ? What are com-mon units of each? Write an equation relating a change dh in hydraulic head to a change dΦ inhydraulic potential.
(b) Write Darcy’s law in terms of hydraulic head h and conductivity K, and again in terms of fluidpotential Φ and permeability k. When might it be most convenient to use the first form ofDarcy’s law? The second?
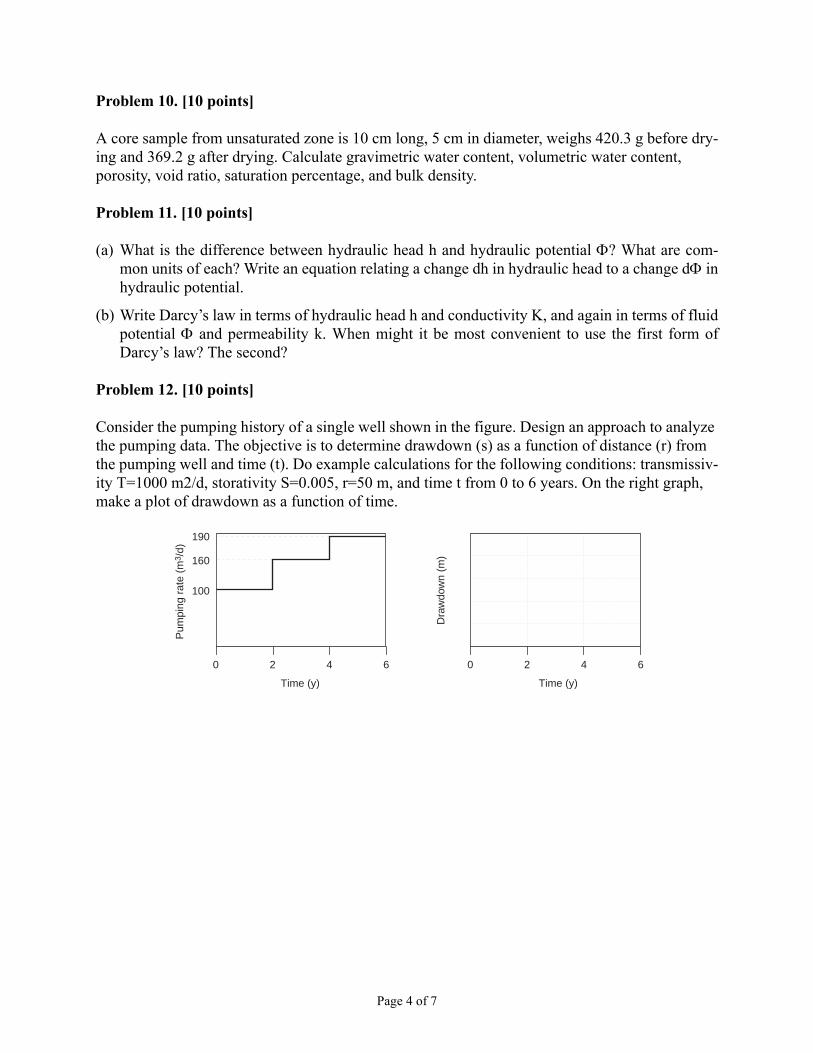
Problem 12. [10 points]
Consider the pumping history of a single well shown in the figure. Design an approach to analyze the pumping data. The objective is to determine drawdown (s) as a function of distance (r) from the pumping well and time (t). Do example calculations for the following conditions: transmissiv-ity T=1000 m2/d, storativity S=0.005, r=50 m, and time t from 0 to 6 years. On the right graph, make a plot of drawdown as a function of time.
Time (y)
Pum
ping
rat
e (m
3 /d)
0 2 64
100
190
160
Time (y)
Dra
wdo
wn
(m)
0 2 64

Page 5 of 7
Problem 13. [10 points]
(a) Consider 100 m of an aquifer through which groundwater flows at a velocity of 5 m/yr. Attime t=0, a non-reacting solute of concentration C0 begins to recharge the aquifer. The distri-bution of solute in the aquifer is given by solving the advection-dispersion equation. Sketchthe expected distribution of solute concentration as a function of distance traveled at t=10 yr(the horizontal axis should show distance, the vertical - concentration). Then, sketch howincreasing and decreasing the value assumed for the dispersivity would affect the solute distri-bution. Finally, sketch the profile expected at t=10 yr for a sorbing solute, taking R = 2.
(b) A chemical tracer has been injected in a deep confined aquifer, and its concentrations moni-tored at observation wells. Expected arrival time was calculated based on advective velocity.Give at least one reason for each of the following cases: (i) the tracer arrived slightly earlierthan expected; (ii) the tracer arrived much earlier than expected; (iii) the tracer arrived slightlylater than expected; and (iv) the tracer arrived much later than expected.
Problem 14. [10 points]
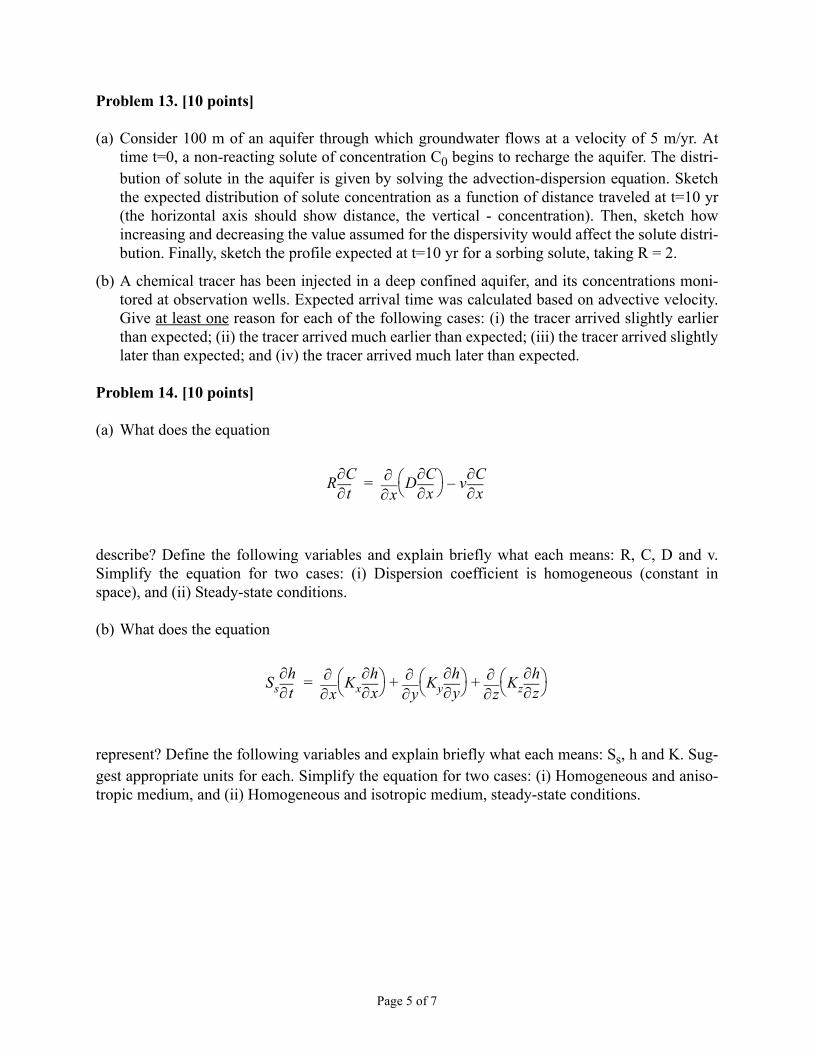
(a) What does the equation
describe? Define the following variables and explain briefly what each means: R, C, D and v.Simplify the equation for two cases: (i) Dispersion coefficient is homogeneous (constant inspace), and (ii) Steady-state conditions.
(b) What does the equation
represent? Define the following variables and explain briefly what each means: Ss, h and K. Sug-gest appropriate units for each. Simplify the equation for two cases: (i) Homogeneous and aniso-tropic medium, and (ii) Homogeneous and isotropic medium, steady-state conditions.
R t∂∂C
x∂∂ D x∂
∂C v x∂
∂C–=
Ss t∂∂h
x∂∂ Kx x∂
∂h
y∂∂ Ky y∂
∂h
z∂∂ Kz z∂
∂h + +=

Page 6 of 7
Problem 15. [30 points]
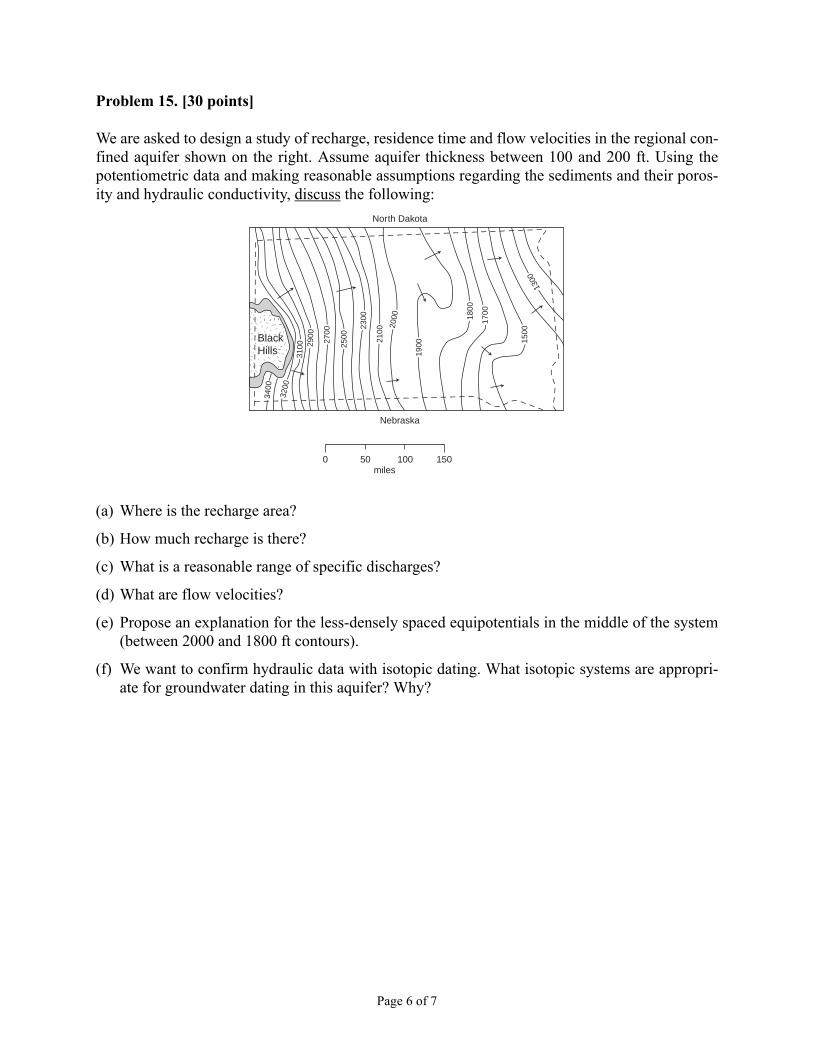
We are asked to design a study of recharge, residence time and flow velocities in the regional con-fined aquifer shown on the right. Assume aquifer thickness between 100 and 200 ft. Using thepotentiometric data and making reasonable assumptions regarding the sediments and their poros-ity and hydraulic conductivity, discuss the following:
(a) Where is the recharge area?
(b) How much recharge is there?
(c) What is a reasonable range of specific discharges?
(d) What are flow velocities?
(e) Propose an explanation for the less-densely spaced equipotentials in the middle of the system(between 2000 and 1800 ft contours).
(f) We want to confirm hydraulic data with isotopic dating. What isotopic systems are appropri-ate for groundwater dating in this aquifer? Why?
������
yyyyyy
BlackHills
3400
3200
3100 29
00
2700
2500
2300
2100
1900
1700
1500
1300
2000 18
00
North Dakota
Nebraska
0 50 100 150miles

Page 7 of 7
Problem 16. [30 points]
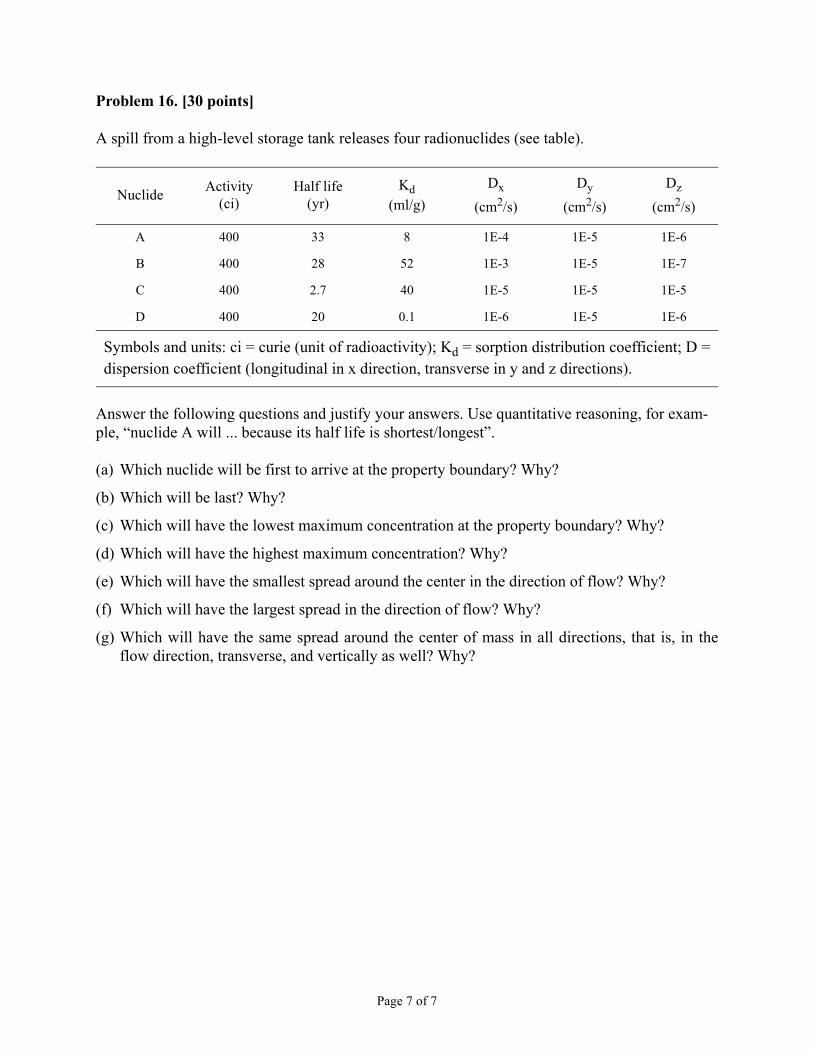
A spill from a high-level storage tank releases four radionuclides (see table).
Answer the following questions and justify your answers. Use quantitative reasoning, for exam-ple, “nuclide A will ... because its half life is shortest/longest”.
(a) Which nuclide will be first to arrive at the property boundary? Why?
(b) Which will be last? Why?
(c) Which will have the lowest maximum concentration at the property boundary? Why?
(d) Which will have the highest maximum concentration? Why?
(e) Which will have the smallest spread around the center in the direction of flow? Why?
(f) Which will have the largest spread in the direction of flow? Why?
(g) Which will have the same spread around the center of mass in all directions, that is, in theflow direction, transverse, and vertically as well? Why?
Nuclide Activity(ci)
Half life(yr)
Kd(ml/g)
Dx
(cm2/s)Dy
(cm2/s)Dz
(cm2/s)
A 400 33 8 1E-4 1E-5 1E-6
B 400 28 52 1E-3 1E-5 1E-7
C 400 2.7 40 1E-5 1E-5 1E-5
D 400 20 0.1 1E-6 1E-5 1E-6
Symbols and units: ci = curie (unit of radioactivity); Kd = sorption distribution coefficient; D =dispersion coefficient (longitudinal in x direction, transverse in y and z directions).
Page 1 of 7
University of ArizonaDepartment of Hydrology and Water Resources
Dr. Marek ZredaHWR431/531 - Hydrogeology
Final exam - 11 December 2012Open books and notes - but individual work!!!
The test contains 16 questions/problems on 7 pages. Most are worth 10 points each; the last two are worth 30 points each. The maximum is 200.
Problem 1. [10 points]
Define the following terms (in words and using formulas, where applicable; give units; give typi-cal values or example values). Describe where and how they are used.
(a) well function.
(b) tensiometer.
(c) superposition.
(d) equilibrium constant.
(e) radioactive decay constant.
Problem 2. [10 points]
Use simple graphs to show correlation between the following pairs of parameters/variables (in other words, show their mathematical relationships graphically). Explain briefly.
(a) activity coefficient and ion’s valence.
(b) ionic strength and total dissolved solids.
(c) parent nuclide and daughter nuclide (e.g., 3H and 3He).
(d) water content (or saturation) and unsaturated specific discharge.
(e) transmissivity and drawdown.
1 2 3 4 5 6 7 8
9 10 11 12 13 14 15 16

Page 2 of 7
Problem 3. [10 points]
How many image wells are theoretically needed in the system that consists of one real well and two parallel straight line boundaries (figure)? Why? Are these pumping or injecting wells? How many wells will suffice in practice? Why? Show them on the graph.
Problem 4. [10 points]
In a horizontal, confined aquifer, hydraulic conductivity changes in the direction of flow linearly from Ka=0.2 m/d at point A to Kb=0.1 m/d at point B, and porosity changes linearly from na=0.1 to nb=0.2 (A and B are along a typical flow path). Is the velocity of ground water constant along the flow path? Why or why not?
Problem 5. [10 points]
What does the figure show? What type of aquifer is it? What do the two dashed lines represent? Be complete, but do not overanalyze the information.
stre
am
mou
ntai
n fr
ont
observed
time (d)
draw
dow
n (m
)
10-4 10-3 10110-110-2
10-3
10-2
10-1
1

Page 3 of 7
Problem 6. [10 points]
(a) For effective hydraulic conductivity, we can use arithmetic, harmonic or geometric mean. Forthe data in the table, order the three averages from smallest to largest. Is this relationshipalways valid? Why or why not? What assumption(s) regarding each layer did we make?
(b) The five different isotropic horizontal layers from part (a) separate a confined aquifer fromground surface. If the piezometric surface in the confined aquifer is at the bottom of layer 5,what is the recharge rate of the confined aquifer? (Assume that all layers are saturated, that theinfiltration rate at the surface is sufficient to maintain any downward flow, and that no water isstanding above the surface.)
Problem 7. [10 points]
A sandy soil is in contact (horizontally) with a silty soil. If they have the same initial water con-tent (and both are unsaturated) will there be a movement of water? Why or why not? If yes, in what direction? Why?
Problem 8. [10 points]
A chemical tracer has been injected in a deep confined aquifer, and its concentrations monitored at observation wells. Expected arrival time was calculated based on advective velocity. Give at least one reason for each of the following cases: (i) the tracer arrived slightly earlier than expected; (ii) the tracer arrived much earlier than expected; (iii) the tracer arrived slightly later than expected; and (iv) the tracer arrived much later than expected.
Problem 9. [10 points]
On the graph, draw qualitative (but correct) contour plot of hydraulic conductivity as a function of the median grain size and the variability of the grain size (i.e., some measure of sorting). [Your plot should be a map with lines of equal val-ues of hydraulic conductivity.] Explain briefly in the space below.
Layer 1 2 3 4 5
Thickness (m) 1.5 2 0.3 4 1
K (m/d) 0.1 0.5 0.05 0.8 0.002
Median grain size
Var
ianc
e of
gra
in s
ize

Page 4 of 7
Problem 10. [10 points]
A core sample from unsaturated zone is 10 cm long, 5 cm in diameter, weighs 420.3 g before dry-ing and 369.2 g after drying. Calculate gravimetric water content, volumetric water content, porosity, void ratio, saturation percentage, and bulk density.
Problem 11. [10 points]
(a) What is the difference between hydraulic head h and hydraulic potential Φ? What are com-mon units of each? Write an equation relating a change dh in hydraulic head to a change dΦ inhydraulic potential.
(b) Write Darcy’s law in terms of hydraulic head h and conductivity K, and again in terms of fluidpotential Φ and permeability k. When might it be most convenient to use the first form ofDarcy’s law? The second?
Problem 12. [10 points]
Consider the pumping history of a single well shown in the figure. Design an approach to analyze the pumping data. The objective is to determine drawdown (s) as a function of distance (r) from the pumping well and time (t). Do example calculations for the following conditions: transmissiv-ity T=1000 m2/d, storativity S=0.005, r=50 m, and time t from 0 to 6 years. On the right graph, make a plot of drawdown as a function of time.
Time (y)
Pum
ping
rat
e (m
3 /d)
0 2 64
100
190
160
Time (y)
Dra
wdo
wn
(m)
0 2 64

Page 5 of 7
Problem 13. [10 points]
(a) Consider 100 m of an aquifer through which groundwater flows at a velocity of 5 m/yr. Attime t=0, a non-reacting solute of concentration C0 begins to recharge the aquifer. The distri-bution of solute in the aquifer is given by solving the advection-dispersion equation. Sketchthe expected distribution of solute concentration as a function of distance traveled at t=10 yr(the horizontal axis should show distance, the vertical - concentration). Then, sketch howincreasing and decreasing the value assumed for the dispersivity would affect the solute distri-bution. Finally, sketch the profile expected at t=10 yr for a sorbing solute, taking R = 2.
(b) A chemical tracer has been injected in a deep confined aquifer, and its concentrations moni-tored at observation wells. Expected arrival time was calculated based on advective velocity.Give at least one reason for each of the following cases: (i) the tracer arrived slightly earlierthan expected; (ii) the tracer arrived much earlier than expected; (iii) the tracer arrived slightlylater than expected; and (iv) the tracer arrived much later than expected.
Problem 14. [10 points]
(a) What does the equation
describe? Define the following variables and explain briefly what each means: R, C, D and v.Simplify the equation for two cases: (i) Dispersion coefficient is homogeneous (constant inspace), and (ii) Steady-state conditions.
(b) What does the equation
represent? Define the following variables and explain briefly what each means: Ss, h and K. Sug-gest appropriate units for each. Simplify the equation for two cases: (i) Homogeneous and aniso-tropic medium, and (ii) Homogeneous and isotropic medium, steady-state conditions.
R t∂∂C
x∂∂ D x∂
∂C v x∂
∂C–=
Ss t∂∂h
x∂∂ Kx x∂
∂h
y∂∂ Ky y∂
∂h
z∂∂ Kz z∂
∂h + +=

Page 6 of 7
Problem 15. [30 points]
We are asked to design a study of recharge, residence time and flow velocities in the regional con-fined aquifer shown on the right. Assume aquifer thickness between 100 and 200 ft. Using thepotentiometric data and making reasonable assumptions regarding the sediments and their poros-ity and hydraulic conductivity, discuss the following:
(a) Where is the recharge area?
(b) How much recharge is there?
(c) What is a reasonable range of specific discharges?
(d) What are flow velocities?
(e) Propose an explanation for the less-densely spaced equipotentials in the middle of the system(between 2000 and 1800 ft contours).
(f) We want to confirm hydraulic data with isotopic dating. What isotopic systems are appropri-ate for groundwater dating in this aquifer? Why?
������
yyyyyy
BlackHills
3400
3200
3100 29
00
2700
2500
2300
2100
1900
1700
1500
1300
2000 18
00
North Dakota
Nebraska
0 50 100 150miles

Page 7 of 7
Problem 16. [30 points]
A spill from a high-level storage tank releases four radionuclides (see table).
Answer the following questions and justify your answers. Use quantitative reasoning, for exam-ple, “nuclide A will ... because its half life is shortest/longest”.
(a) Which nuclide will be first to arrive at the property boundary? Why?
(b) Which will be last? Why?
(c) Which will have the lowest maximum concentration at the property boundary? Why?
(d) Which will have the highest maximum concentration? Why?
(e) Which will have the smallest spread around the center in the direction of flow? Why?
(f) Which will have the largest spread in the direction of flow? Why?
(g) Which will have the same spread around the center of mass in all directions, that is, in theflow direction, transverse, and vertically as well? Why?
Nuclide Activity(ci)
Half life(yr)
Kd(ml/g)
Dx
(cm2/s)Dy
(cm2/s)Dz
(cm2/s)
A 400 33 8 1E-4 1E-5 1E-6
B 400 28 52 1E-3 1E-5 1E-7
C 400 2.7 40 1E-5 1E-5 1E-5
D 400 20 0.1 1E-6 1E-5 1E-6
Symbols and units: ci = curie (unit of radioactivity); Kd = sorption distribution coefficient; D =dispersion coefficient (longitudinal in x direction, transverse in y and z directions).

Page 1 of 7
University of ArizonaDepartment of Hydrology and Water Resources
Dr. Marek ZredaHWR431/531 - Hydrogeology
Final exam - 11 December 2012Open books and notes - but individual work!!!
The test contains 16 questions/problems on 7 pages. Most are worth 10 points each; the last two are worth 30 points each. The maximum is 200.
Problem 1. [10 points]
Define the following terms (in words and using formulas, where applicable; give units; give typi-cal values or example values). Describe where and how they are used.
(a) well function.
(b) tensiometer.
(c) superposition.
(d) equilibrium constant.
(e) radioactive decay constant.
Problem 2. [10 points]
Use simple graphs to show correlation between the following pairs of parameters/variables (in other words, show their mathematical relationships graphically). Explain briefly.
(a) activity coefficient and ion’s valence.
(b) ionic strength and total dissolved solids.
(c) parent nuclide and daughter nuclide (e.g., 3H and 3He).
(d) water content (or saturation) and unsaturated specific discharge.
(e) transmissivity and drawdown.
1 2 3 4 5 6 7 8
9 10 11 12 13 14 15 16
Page 2 of 7
Problem 3. [10 points]
How many image wells are theoretically needed in the system that consists of one real well and two parallel straight line boundaries (figure)? Why? Are these pumping or injecting wells? How many wells will suffice in practice? Why? Show them on the graph.
Problem 4. [10 points]
In a horizontal, confined aquifer, hydraulic conductivity changes in the direction of flow linearly from Ka=0.2 m/d at point A to Kb=0.1 m/d at point B, and porosity changes linearly from na=0.1 to nb=0.2 (A and B are along a typical flow path). Is the velocity of ground water constant along the flow path? Why or why not?
Problem 5. [10 points]
What does the figure show? What type of aquifer is it? What do the two dashed lines represent? Be complete, but do not overanalyze the information.
stre
am
mou
ntai
n fr
ont
observed
time (d)
draw
dow
n (m
)
10-4 10-3 10110-110-2
10-3
10-2
10-1
1

Page 3 of 7
Problem 6. [10 points]
(a) For effective hydraulic conductivity, we can use arithmetic, harmonic or geometric mean. Forthe data in the table, order the three averages from smallest to largest. Is this relationshipalways valid? Why or why not? What assumption(s) regarding each layer did we make?
(b) The five different isotropic horizontal layers from part (a) separate a confined aquifer fromground surface. If the piezometric surface in the confined aquifer is at the bottom of layer 5,what is the recharge rate of the confined aquifer? (Assume that all layers are saturated, that theinfiltration rate at the surface is sufficient to maintain any downward flow, and that no water isstanding above the surface.)
Problem 7. [10 points]
A sandy soil is in contact (horizontally) with a silty soil. If they have the same initial water con-tent (and both are unsaturated) will there be a movement of water? Why or why not? If yes, in what direction? Why?
Problem 8. [10 points]
A chemical tracer has been injected in a deep confined aquifer, and its concentrations monitored at observation wells. Expected arrival time was calculated based on advective velocity. Give at least one reason for each of the following cases: (i) the tracer arrived slightly earlier than expected; (ii) the tracer arrived much earlier than expected; (iii) the tracer arrived slightly later than expected; and (iv) the tracer arrived much later than expected.
Problem 9. [10 points]
On the graph, draw qualitative (but correct) contour plot of hydraulic conductivity as a function of the median grain size and the variability of the grain size (i.e., some measure of sorting). [Your plot should be a map with lines of equal val-ues of hydraulic conductivity.] Explain briefly in the space below.
Layer 1 2 3 4 5
Thickness (m) 1.5 2 0.3 4 1
K (m/d) 0.1 0.5 0.05 0.8 0.002
Median grain size
Var
ianc
e of
gra
in s
ize
Page 4 of 7
Problem 10. [10 points]
A core sample from unsaturated zone is 10 cm long, 5 cm in diameter, weighs 420.3 g before dry-ing and 369.2 g after drying. Calculate gravimetric water content, volumetric water content, porosity, void ratio, saturation percentage, and bulk density.
Problem 11. [10 points]
(a) What is the difference between hydraulic head h and hydraulic potential Φ? What are com-mon units of each? Write an equation relating a change dh in hydraulic head to a change dΦ inhydraulic potential.
(b) Write Darcy’s law in terms of hydraulic head h and conductivity K, and again in terms of fluidpotential Φ and permeability k. When might it be most convenient to use the first form ofDarcy’s law? The second?
Problem 12. [10 points]
Consider the pumping history of a single well shown in the figure. Design an approach to analyze the pumping data. The objective is to determine drawdown (s) as a function of distance (r) from the pumping well and time (t). Do example calculations for the following conditions: transmissiv-ity T=1000 m2/d, storativity S=0.005, r=50 m, and time t from 0 to 6 years. On the right graph, make a plot of drawdown as a function of time.
Time (y)
Pum
ping
rat
e (m
3 /d)
0 2 64
100
190
160
Time (y)
Dra
wdo
wn
(m)
0 2 64
Page 5 of 7
Problem 13. [10 points]
(a) Consider 100 m of an aquifer through which groundwater flows at a velocity of 5 m/yr. Attime t=0, a non-reacting solute of concentration C0 begins to recharge the aquifer. The distri-bution of solute in the aquifer is given by solving the advection-dispersion equation. Sketchthe expected distribution of solute concentration as a function of distance traveled at t=10 yr(the horizontal axis should show distance, the vertical - concentration). Then, sketch howincreasing and decreasing the value assumed for the dispersivity would affect the solute distri-bution. Finally, sketch the profile expected at t=10 yr for a sorbing solute, taking R = 2.
(b) A chemical tracer has been injected in a deep confined aquifer, and its concentrations moni-tored at observation wells. Expected arrival time was calculated based on advective velocity.Give at least one reason for each of the following cases: (i) the tracer arrived slightly earlierthan expected; (ii) the tracer arrived much earlier than expected; (iii) the tracer arrived slightlylater than expected; and (iv) the tracer arrived much later than expected.
Problem 14. [10 points]
(a) What does the equation
describe? Define the following variables and explain briefly what each means: R, C, D and v.Simplify the equation for two cases: (i) Dispersion coefficient is homogeneous (constant inspace), and (ii) Steady-state conditions.
(b) What does the equation
represent? Define the following variables and explain briefly what each means: Ss, h and K. Sug-gest appropriate units for each. Simplify the equation for two cases: (i) Homogeneous and aniso-tropic medium, and (ii) Homogeneous and isotropic medium, steady-state conditions.
R t∂∂C
x∂∂ D x∂
∂C v x∂
∂C–=
Ss t∂∂h
x∂∂ Kx x∂
∂h
y∂∂ Ky y∂
∂h
z∂∂ Kz z∂
∂h + +=
Page 6 of 7
Problem 15. [30 points]
We are asked to design a study of recharge, residence time and flow velocities in the regional con-fined aquifer shown on the right. Assume aquifer thickness between 100 and 200 ft. Using thepotentiometric data and making reasonable assumptions regarding the sediments and their poros-ity and hydraulic conductivity, discuss the following:
(a) Where is the recharge area?
(b) How much recharge is there?
(c) What is a reasonable range of specific discharges?
(d) What are flow velocities?
(e) Propose an explanation for the less-densely spaced equipotentials in the middle of the system(between 2000 and 1800 ft contours).
(f) We want to confirm hydraulic data with isotopic dating. What isotopic systems are appropri-ate for groundwater dating in this aquifer? Why?
������
yyyyyy
BlackHills
3400
3200
3100 29
00
2700
2500
2300
2100
1900
1700
1500
1300
2000 18
00
North Dakota
Nebraska
0 50 100 150miles

Page 7 of 7
Problem 16. [30 points]
A spill from a high-level storage tank releases four radionuclides (see table).
Answer the following questions and justify your answers. Use quantitative reasoning, for exam-ple, “nuclide A will ... because its half life is shortest/longest”.
(a) Which nuclide will be first to arrive at the property boundary? Why?
(b) Which will be last? Why?
(c) Which will have the lowest maximum concentration at the property boundary? Why?
(d) Which will have the highest maximum concentration? Why?
(e) Which will have the smallest spread around the center in the direction of flow? Why?
(f) Which will have the largest spread in the direction of flow? Why?
(g) Which will have the same spread around the center of mass in all directions, that is, in theflow direction, transverse, and vertically as well? Why?
Nuclide Activity(ci)
Half life(yr)
Kd(ml/g)
Dx
(cm2/s)Dy
(cm2/s)Dz
(cm2/s)
A 400 33 8 1E-4 1E-5 1E-6
B 400 28 52 1E-3 1E-5 1E-7
C 400 2.7 40 1E-5 1E-5 1E-5
D 400 20 0.1 1E-6 1E-5 1E-6
Symbols and units: ci = curie (unit of radioactivity); Kd = sorption distribution coefficient; D =dispersion coefficient (longitudinal in x direction, transverse in y and z directions).

Page 1 of 7
University of ArizonaDepartment of Hydrology and Water Resources
Dr. Marek ZredaHWR431/531 - Hydrogeology
Final exam - 11 December 2012Open books and notes - but individual work!!!
The test contains 16 questions/problems on 7 pages. Most are worth 10 points each; the last two are worth 30 points each. The maximum is 200.
Problem 1. [10 points]
Define the following terms (in words and using formulas, where applicable; give units; give typi-cal values or example values). Describe where and how they are used.
(a) well function.
(b) tensiometer.
(c) superposition.
(d) equilibrium constant.
(e) radioactive decay constant.
Problem 2. [10 points]
Use simple graphs to show correlation between the following pairs of parameters/variables (in other words, show their mathematical relationships graphically). Explain briefly.
(a) activity coefficient and ion’s valence.
(b) ionic strength and total dissolved solids.
(c) parent nuclide and daughter nuclide (e.g., 3H and 3He).
(d) water content (or saturation) and unsaturated specific discharge.
(e) transmissivity and drawdown.
1 2 3 4 5 6 7 8
9 10 11 12 13 14 15 16

Page 2 of 7
Problem 3. [10 points]
How many image wells are theoretically needed in the system that consists of one real well and two parallel straight line boundaries (figure)? Why? Are these pumping or injecting wells? How many wells will suffice in practice? Why? Show them on the graph.
Problem 4. [10 points]
In a horizontal, confined aquifer, hydraulic conductivity changes in the direction of flow linearly from Ka=0.2 m/d at point A to Kb=0.1 m/d at point B, and porosity changes linearly from na=0.1 to nb=0.2 (A and B are along a typical flow path). Is the velocity of ground water constant along the flow path? Why or why not?
Problem 5. [10 points]
What does the figure show? What type of aquifer is it? What do the two dashed lines represent? Be complete, but do not overanalyze the information.
stre
am
mou
ntai
n fr
ont
observed
time (d)
draw
dow
n (m
)
10-4 10-3 10110-110-2
10-3
10-2
10-1
1

Page 3 of 7
Problem 6. [10 points]
(a) For effective hydraulic conductivity, we can use arithmetic, harmonic or geometric mean. Forthe data in the table, order the three averages from smallest to largest. Is this relationshipalways valid? Why or why not? What assumption(s) regarding each layer did we make?
(b) The five different isotropic horizontal layers from part (a) separate a confined aquifer fromground surface. If the piezometric surface in the confined aquifer is at the bottom of layer 5,what is the recharge rate of the confined aquifer? (Assume that all layers are saturated, that theinfiltration rate at the surface is sufficient to maintain any downward flow, and that no water isstanding above the surface.)
Problem 7. [10 points]
A sandy soil is in contact (horizontally) with a silty soil. If they have the same initial water con-tent (and both are unsaturated) will there be a movement of water? Why or why not? If yes, in what direction? Why?
Problem 8. [10 points]
A chemical tracer has been injected in a deep confined aquifer, and its concentrations monitored at observation wells. Expected arrival time was calculated based on advective velocity. Give at least one reason for each of the following cases: (i) the tracer arrived slightly earlier than expected; (ii) the tracer arrived much earlier than expected; (iii) the tracer arrived slightly later than expected; and (iv) the tracer arrived much later than expected.
Problem 9. [10 points]
On the graph, draw qualitative (but correct) contour plot of hydraulic conductivity as a function of the median grain size and the variability of the grain size (i.e., some measure of sorting). [Your plot should be a map with lines of equal val-ues of hydraulic conductivity.] Explain briefly in the space below.
Layer 1 2 3 4 5
Thickness (m) 1.5 2 0.3 4 1
K (m/d) 0.1 0.5 0.05 0.8 0.002
Median grain size
Var
ianc
e of
gra
in s
ize

Page 4 of 7
Problem 10. [10 points]
A core sample from unsaturated zone is 10 cm long, 5 cm in diameter, weighs 420.3 g before dry-ing and 369.2 g after drying. Calculate gravimetric water content, volumetric water content, porosity, void ratio, saturation percentage, and bulk density.
Problem 11. [10 points]
(a) What is the difference between hydraulic head h and hydraulic potential Φ? What are com-mon units of each? Write an equation relating a change dh in hydraulic head to a change dΦ inhydraulic potential.
(b) Write Darcy’s law in terms of hydraulic head h and conductivity K, and again in terms of fluidpotential Φ and permeability k. When might it be most convenient to use the first form ofDarcy’s law? The second?
Problem 12. [10 points]
Consider the pumping history of a single well shown in the figure. Design an approach to analyze the pumping data. The objective is to determine drawdown (s) as a function of distance (r) from the pumping well and time (t). Do example calculations for the following conditions: transmissiv-ity T=1000 m2/d, storativity S=0.005, r=50 m, and time t from 0 to 6 years. On the right graph, make a plot of drawdown as a function of time.
Time (y)
Pum
ping
rat
e (m
3 /d)
0 2 64
100
190
160
Time (y)
Dra
wdo
wn
(m)
0 2 64

Page 5 of 7
Problem 13. [10 points]
(a) Consider 100 m of an aquifer through which groundwater flows at a velocity of 5 m/yr. Attime t=0, a non-reacting solute of concentration C0 begins to recharge the aquifer. The distri-bution of solute in the aquifer is given by solving the advection-dispersion equation. Sketchthe expected distribution of solute concentration as a function of distance traveled at t=10 yr(the horizontal axis should show distance, the vertical - concentration). Then, sketch howincreasing and decreasing the value assumed for the dispersivity would affect the solute distri-bution. Finally, sketch the profile expected at t=10 yr for a sorbing solute, taking R = 2.
(b) A chemical tracer has been injected in a deep confined aquifer, and its concentrations moni-tored at observation wells. Expected arrival time was calculated based on advective velocity.Give at least one reason for each of the following cases: (i) the tracer arrived slightly earlierthan expected; (ii) the tracer arrived much earlier than expected; (iii) the tracer arrived slightlylater than expected; and (iv) the tracer arrived much later than expected.
Problem 14. [10 points]
(a) What does the equation
describe? Define the following variables and explain briefly what each means: R, C, D and v.Simplify the equation for two cases: (i) Dispersion coefficient is homogeneous (constant inspace), and (ii) Steady-state conditions.
(b) What does the equation
represent? Define the following variables and explain briefly what each means: Ss, h and K. Sug-gest appropriate units for each. Simplify the equation for two cases: (i) Homogeneous and aniso-tropic medium, and (ii) Homogeneous and isotropic medium, steady-state conditions.
R t∂∂C
x∂∂ D x∂
∂C v x∂
∂C–=
Ss t∂∂h
x∂∂ Kx x∂
∂h
y∂∂ Ky y∂
∂h
z∂∂ Kz z∂
∂h + +=

Page 6 of 7
Problem 15. [30 points]
We are asked to design a study of recharge, residence time and flow velocities in the regional con-fined aquifer shown on the right. Assume aquifer thickness between 100 and 200 ft. Using thepotentiometric data and making reasonable assumptions regarding the sediments and their poros-ity and hydraulic conductivity, discuss the following:
(a) Where is the recharge area?
(b) How much recharge is there?
(c) What is a reasonable range of specific discharges?
(d) What are flow velocities?
(e) Propose an explanation for the less-densely spaced equipotentials in the middle of the system(between 2000 and 1800 ft contours).
(f) We want to confirm hydraulic data with isotopic dating. What isotopic systems are appropri-ate for groundwater dating in this aquifer? Why?
������
yyyyyy
BlackHills
3400
3200
3100 29
00
2700
2500
2300
2100
1900
1700
1500
1300
2000 18
00
North Dakota
Nebraska
0 50 100 150miles
Page 7 of 7
Problem 16. [30 points]
A spill from a high-level storage tank releases four radionuclides (see table).
Answer the following questions and justify your answers. Use quantitative reasoning, for exam-ple, “nuclide A will ... because its half life is shortest/longest”.
(a) Which nuclide will be first to arrive at the property boundary? Why?
(b) Which will be last? Why?
(c) Which will have the lowest maximum concentration at the property boundary? Why?
(d) Which will have the highest maximum concentration? Why?
(e) Which will have the smallest spread around the center in the direction of flow? Why?
(f) Which will have the largest spread in the direction of flow? Why?
(g) Which will have the same spread around the center of mass in all directions, that is, in theflow direction, transverse, and vertically as well? Why?
Nuclide Activity(ci)
Half life(yr)
Kd(ml/g)
Dx
(cm2/s)Dy
(cm2/s)Dz
(cm2/s)
A 400 33 8 1E-4 1E-5 1E-6
B 400 28 52 1E-3 1E-5 1E-7
C 400 2.7 40 1E-5 1E-5 1E-5
D 400 20 0.1 1E-6 1E-5 1E-6
Symbols and units: ci = curie (unit of radioactivity); Kd = sorption distribution coefficient; D =dispersion coefficient (longitudinal in x direction, transverse in y and z directions).