university at buffalo · new york overview of financial ... research foundation for suny and the...
TRANSCRIPT

2012 Financial Overview 0
UNIVERSITY AT BUFFALO
THE STATE UNIVERSITY OF
NEW YORK
OVERVIEW OF FINANCIAL ACTIVITIES
2011-2012

2012 Financial Overview 1
Introduction .................................................................................................................................... 2 Overview ......................................................................................................................................... 3 Core Operating Activities
Financial Highlights.................................................................................................................. 3 State Appropriation .................................................................................................................. 9 University-wide Programs Appropriations ............................................................................. 12 Tuition Revenue ....................................................................................................................... 13 Comprehensive Fee .................................................................................................................. 15 Residence Halls and Apartments Revenue .............................................................................. 16 Activity Revenues ..................................................................................................................... 17 Facility and Administrative (F&A) Cost Recovery ................................................................... 18 Statement of Revenues and Expenses for Core Operating Activities ...................................... 19
Other Financial Highlights
Endowment and Similar Investments .................................................................................... 20 Long-term Debt ...................................................................................................................... 22 General University Service Fee ............................................................................................... 23 Sponsored Research Expenditure Activity ............................................................................. 24 Economic Impact .....................................................................................................................25
Components of Report Defined .................................................................................................... 26 University at Buffalo Annual Financial Statements Fiscal Years
Ended June 30, 2012 and 2011 .................................................................................... Appendix

2012 Financial Overview 2
Introduction
The objective of the annual Overview of Financial Activities of the State University of New York at Buffalo (UB) is to provide UB’s leadership with a comprehensive summary of financial information for the campus to assist them with their financial decisions related to UB’s core operations. The operating statements and financial information in this report, for the year ended June 30, 2012, are prepared on a cash basis for core operations that includes funding from:
State tax support, tuition, fees, and service revenue
Residence halls and apartments operations
Agency, endowment income, and unrestricted gifts administered in the University at Buffalo Foundation
Facility and administrative cost recovery and other income administered in the Research Foundation for SUNY
Agency revenue administered in Campus Dining & Shops
A detailed description of the funding sources can be found on page 26 of the report. In addition to the core operating activities, the Appendix of this report presents UB’s Annual Financial Statements for the fiscal years ended June 30, 2012 and 2011, which were prepared on an accrual basis. The financial statements include restricted revenues that cannot be used for day-to-day operating activities, as well as the financial activity of closely affiliated entities, both of which are not included in the Overview of Financial Activities. These entities or activities include sponsored research activity in the Research Foundation for SUNY and the University at Buffalo Foundation Services, Inc., the SUNY Construction Fund, and Campus Dining & Shops corporate activities.
2012 Financial Overview 3
Overview
The Overview of Financial Activities examines in-depth the University at Buffalo’s (UB) core financial operating condition and activities for the fiscal year ended June 30, 2012 and prior years. The report is focused on the core operations of UB that includes sources from:
State operating tax support Tuition and fees Service revenue Residence halls and apartments
operations
Agency, endowment income, and unrestricted
gifts administered in the University at Buffalo Foundation (UBF)
Research Foundation (RF) facility and administrative cost recovery and other revenue
Campus Dining & Shops (CDS) agency revenue
Amounts reported in the accompanying cash basis report are different from amounts reported in UB’s financial statements, which were prepared on an accrual basis and include activities from closely affiliated entities that UB’s management does not directly control. Other financial highlights outside of UB’s core operating activities are presented beginning on page 20 and include analysis of UB’s endowment fund investments, long-term debt, general university service fee, sponsored research activity, and UB’s economic impact on the Buffalo-Niagara region.
Core Operating Activities
Financial Highlights
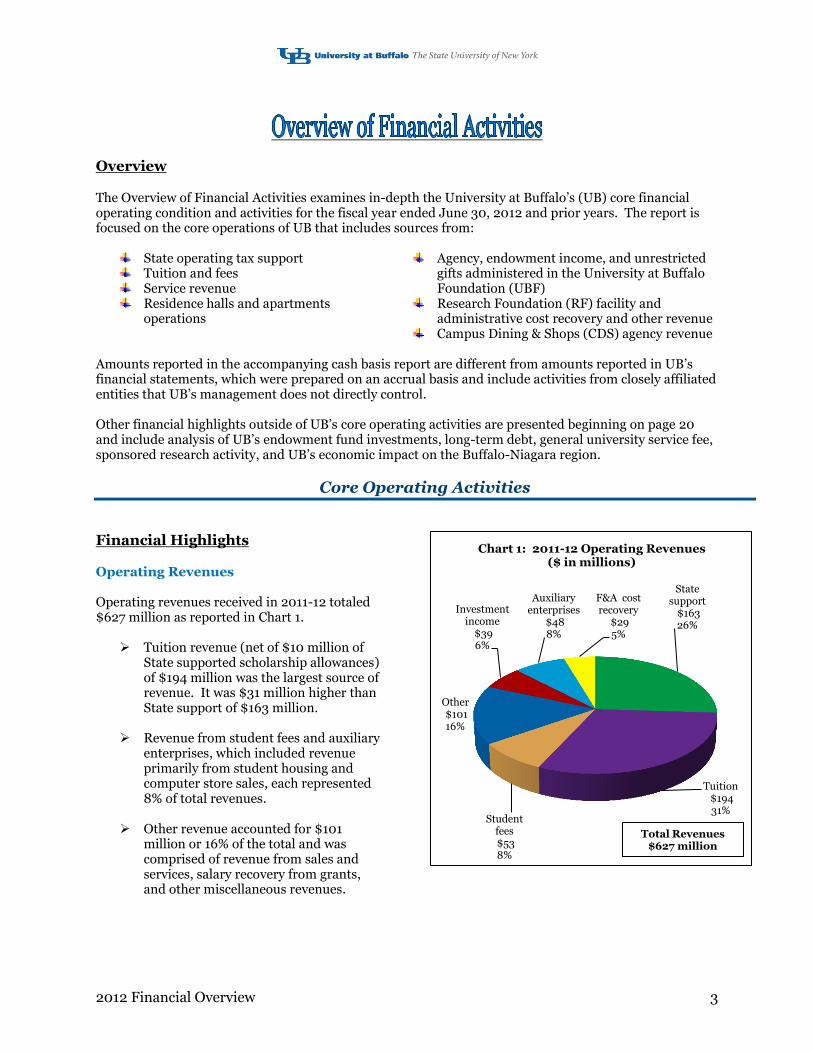
Operating Revenues Operating revenues received in 2011-12 totaled $627 million as reported in Chart 1.
Tuition revenue (net of $10 million of State supported scholarship allowances) of $194 million was the largest source of revenue. It was $31 million higher than State support of $163 million.
Revenue from student fees and auxiliary
enterprises, which included revenue primarily from student housing and computer store sales, each represented 8% of total revenues.
Other revenue accounted for $101
million or 16% of the total and was comprised of revenue from sales and services, salary recovery from grants, and other miscellaneous revenues.
State support
$163 26%
Tuition $194 31%
Student fees $53 8%
Other $101 16%
Investment income
$39 6%
Auxiliary enterprises
$48 8%
F&A cost recovery
$29 5%
Chart 1: 2011-12 Operating Revenues ($ in millions)
Total Revenues $627 million

2012 Financial Overview 4
Chart 2 displays the operating revenues by source for fiscal years 2009-10 through 2011-12. Revenues for 2011-12 of $627 million were $13 million or 2% greater than $614 million for 2009-10. The significant changes were:
State support of $163 million fell $34 million or 17% from $197 million in 2009-10 as the State recovered from a severe economic recession.
Tuition revenue of $194 million rose $16 million or 9% from $178 million in 2009-10 mostly due to tuition rate increases by the SUNY Board of Trustees to offset shrinking State support.
Investment income of $39 million increased $14 million from $25 million in 2009-10 mostly from a $7 million spendable donation to the School of Medicine and Biomedical Sciences.
Other revenue of $101 million grew $12 million or 13% from $89 million in 2009-10 due to increases in summer session tuition, hospital and clinical, continuing education and Center for the Arts revenues.
Operating Expenses by Function
Operating expenses of $625 million for 2011-12 are displayed according to functional classification in Charts 3 and 4.
Combined expenses for instruction, departmental research and academic support of $348 million represented 56% of total 2011-12 expenses.
Institutional support expenses include
activities that are of a general character and for the general executive and administrative offices serving UB as a whole. (Includes Office of the Chief Information Officer, University Business Services and Student Advisement, Resources & Financial Services).
Other expenses totaled $75 million and
consisted of expenses for public service, hospitals and clinics, residence halls, intercollegiate athletics, and other operating expenses.
$0 $50 $100 $150 $200 $250
Other
Investment income
F&A cost recovery
Student fees
Auxiliary enterprises
Tuition
State support
Chart 2: 2009-10 through 2011-12 Operating Revenues by Source
($ in millions)
2011-12 2010-11 2009-10
Instruction $274 44%
Departmental research
$44 7%
Academic support
$30 5%
Student services
$31 5%
Institutional support $100 16%
Operation and maintenance
of plant $51 8%
Scholarships and
fellowships $20 3%
Other $75 12%
Chart 3: 2011-12 Operating Expenses by Functional Classification
($ in millions)
Total Expenses $625 million
2012 Financial Overview 5
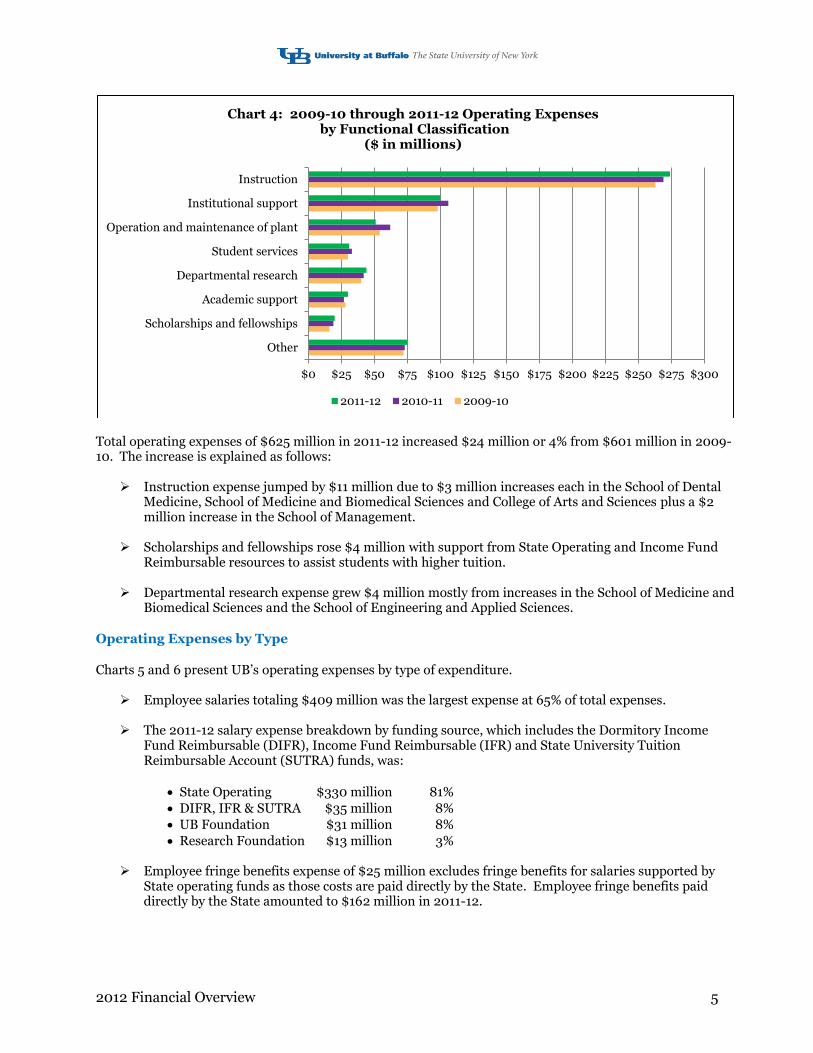
Total operating expenses of $625 million in 2011-12 increased $24 million or 4% from $601 million in 2009-10. The increase is explained as follows:
Instruction expense jumped by $11 million due to $3 million increases each in the School of Dental Medicine, School of Medicine and Biomedical Sciences and College of Arts and Sciences plus a $2 million increase in the School of Management.
Scholarships and fellowships rose $4 million with support from State Operating and Income Fund
Reimbursable resources to assist students with higher tuition. Departmental research expense grew $4 million mostly from increases in the School of Medicine and
Biomedical Sciences and the School of Engineering and Applied Sciences.
Operating Expenses by Type
Charts 5 and 6 present UB’s operating expenses by type of expenditure.
Employee salaries totaling $409 million was the largest expense at 65% of total expenses.
The 2011-12 salary expense breakdown by funding source, which includes the Dormitory Income Fund Reimbursable (DIFR), Income Fund Reimbursable (IFR) and State University Tuition Reimbursable Account (SUTRA) funds, was:
State Operating $330 million 81%
DIFR, IFR & SUTRA $35 million 8%
UB Foundation $31 million 8%
Research Foundation $13 million 3%
Employee fringe benefits expense of $25 million excludes fringe benefits for salaries supported by State operating funds as those costs are paid directly by the State. Employee fringe benefits paid directly by the State amounted to $162 million in 2011-12.
$0 $25 $50 $75 $100 $125 $150 $175 $200 $225 $250 $275 $300
Other
Scholarships and fellowships
Academic support
Departmental research
Student services
Operation and maintenance of plant
Institutional support
Instruction
Chart 4: 2009-10 through 2011-12 Operating Expenses by Functional Classification
($ in millions)
2011-12 2010-11 2009-10
2012 Financial Overview 6
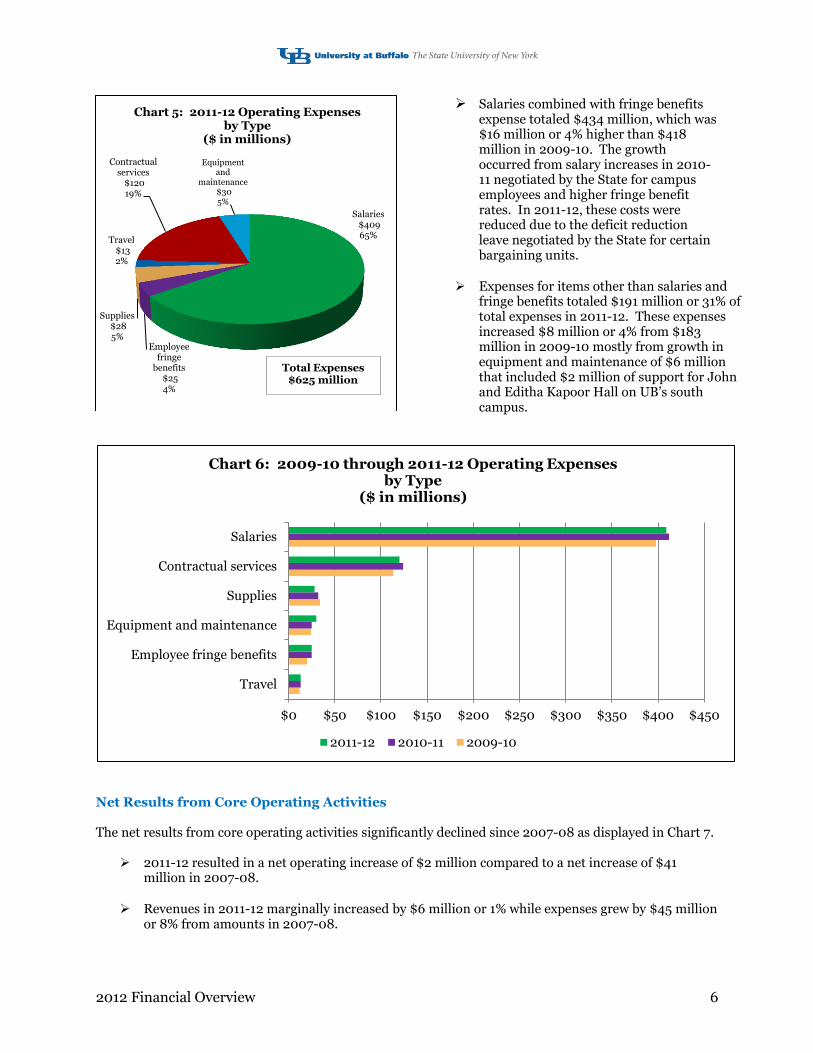
Salaries combined with fringe benefits expense totaled $434 million, which was $16 million or 4% higher than $418 million in 2009-10. The growth occurred from salary increases in 2010-11 negotiated by the State for campus employees and higher fringe benefit rates. In 2011-12, these costs were reduced due to the deficit reduction leave negotiated by the State for certain bargaining units.
Expenses for items other than salaries and fringe benefits totaled $191 million or 31% of total expenses in 2011-12. These expenses increased $8 million or 4% from $183 million in 2009-10 mostly from growth in equipment and maintenance of $6 million that included $2 million of support for John and Editha Kapoor Hall on UB’s south campus.
Net Results from Core Operating Activities The net results from core operating activities significantly declined since 2007-08 as displayed in Chart 7.
2011-12 resulted in a net operating increase of $2 million compared to a net increase of $41
million in 2007-08.
Revenues in 2011-12 marginally increased by $6 million or 1% while expenses grew by $45 million or 8% from amounts in 2007-08.
Salaries $409 65%
Employee fringe
benefits $25 4%
Supplies $28 5%
Travel $13 2%
Contractual services
$120 19%
Equipment and
maintenance $30 5%
Chart 5: 2011-12 Operating Expenses by Type
($ in millions)
Total Expenses $625 million
$0 $50 $100 $150 $200 $250 $300 $350 $400 $450
Travel
Employee fringe benefits
Equipment and maintenance
Supplies
Contractual services
Salaries
Chart 6: 2009-10 through 2011-12 Operating Expenses by Type
($ in millions)
2011-12 2010-11 2009-10
2012 Financial Overview 7
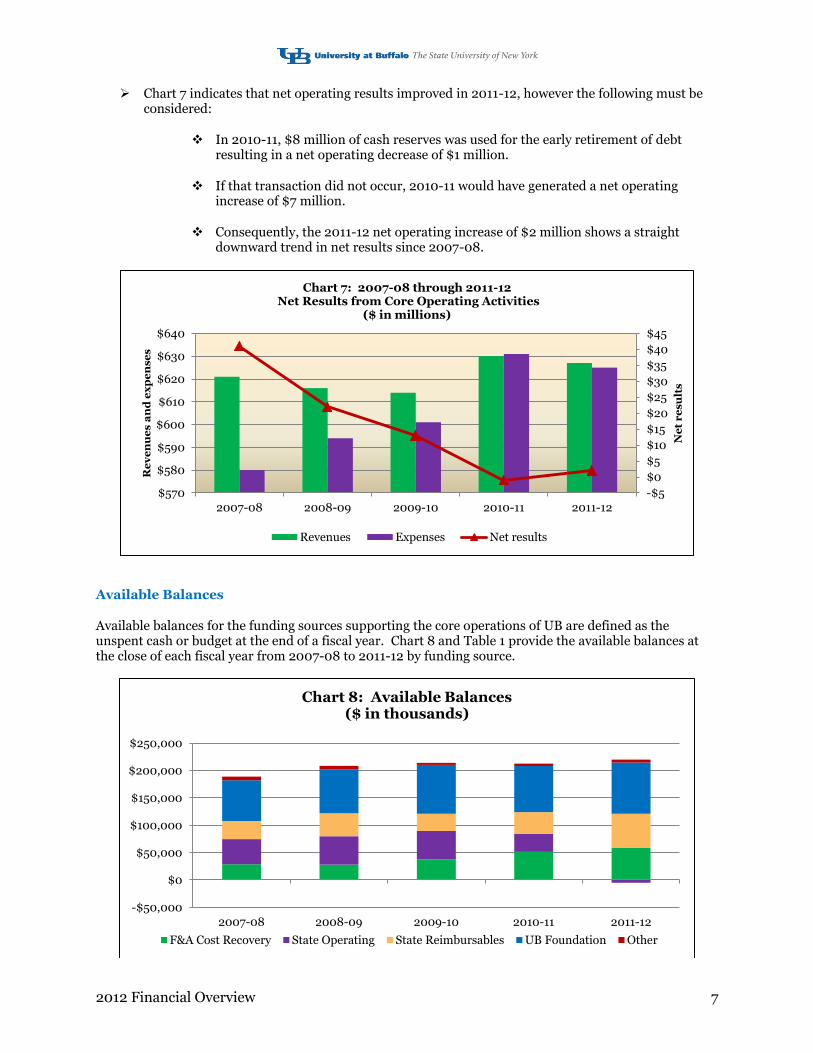
Chart 7 indicates that net operating results improved in 2011-12, however the following must be considered:
In 2010-11, $8 million of cash reserves was used for the early retirement of debt resulting in a net operating decrease of $1 million.
If that transaction did not occur, 2010-11 would have generated a net operating increase of $7 million.
Consequently, the 2011-12 net operating increase of $2 million shows a straight downward trend in net results since 2007-08.
Available Balances
Available balances for the funding sources supporting the core operations of UB are defined as the unspent cash or budget at the end of a fiscal year. Chart 8 and Table 1 provide the available balances at the close of each fiscal year from 2007-08 to 2011-12 by funding source.
-$5
$0
$5
$10
$15
$20
$25
$30
$35
$40
$45
$570
$580
$590
$600
$610
$620
$630
$640
2007-08 2008-09 2009-10 2010-11 2011-12
Ne
t r
esu
lts
Re
ve
nu
es a
nd
ex
pe
nse
s
Chart 7: 2007-08 through 2011-12 Net Results from Core Operating Activities
($ in millions)
Revenues Expenses Net results
-$50,000
$0
$50,000
$100,000
$150,000
$200,000
$250,000
2007-08 2008-09 2009-10 2010-11 2011-12
Chart 8: Available Balances ($ in thousands)
F&A Cost Recovery State Operating State Reimbursables UB Foundation Other
2012 Financial Overview 8
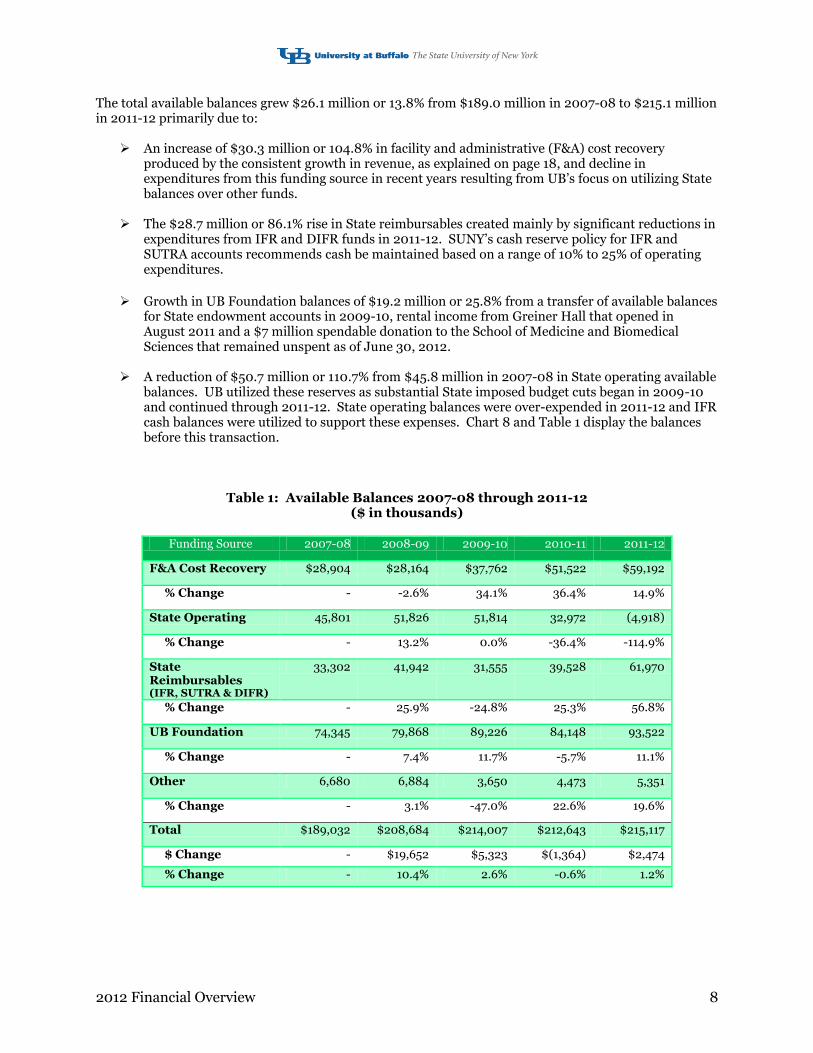
The total available balances grew $26.1 million or 13.8% from $189.0 million in 2007-08 to $215.1 million in 2011-12 primarily due to:
An increase of $30.3 million or 104.8% in facility and administrative (F&A) cost recovery produced by the consistent growth in revenue, as explained on page 18, and decline in expenditures from this funding source in recent years resulting from UB’s focus on utilizing State balances over other funds.
The $28.7 million or 86.1% rise in State reimbursables created mainly by significant reductions in
expenditures from IFR and DIFR funds in 2011-12. SUNY’s cash reserve policy for IFR and SUTRA accounts recommends cash be maintained based on a range of 10% to 25% of operating expenditures.
Growth in UB Foundation balances of $19.2 million or 25.8% from a transfer of available balances
for State endowment accounts in 2009-10, rental income from Greiner Hall that opened in August 2011 and a $7 million spendable donation to the School of Medicine and Biomedical Sciences that remained unspent as of June 30, 2012.
A reduction of $50.7 million or 110.7% from $45.8 million in 2007-08 in State operating available
balances. UB utilized these reserves as substantial State imposed budget cuts began in 2009-10 and continued through 2011-12. State operating balances were over-expended in 2011-12 and IFR cash balances were utilized to support these expenses. Chart 8 and Table 1 display the balances before this transaction.
Table 1: Available Balances 2007-08 through 2011-12 ($ in thousands)
Funding Source 2007-08 2008-09 2009-10 2010-11 2011-12
F&A Cost Recovery $28,904 $28,164 $37,762 $51,522 $59,192
% Change - -2.6% 34.1% 36.4% 14.9%
State Operating 45,801 51,826 51,814 32,972 (4,918)
% Change - 13.2% 0.0% -36.4% -114.9%
State Reimbursables (IFR, SUTRA & DIFR)
33,302 41,942 31,555 39,528 61,970
% Change - 25.9% -24.8% 25.3% 56.8%
UB Foundation 74,345 79,868 89,226 84,148 93,522
% Change - 7.4% 11.7% -5.7% 11.1%
Other 6,680 6,884 3,650 4,473 5,351
% Change - 3.1% -47.0% 22.6% 19.6%
Total $189,032 $208,684 $214,007 $212,643 $215,117
$ Change - $19,652 $5,323 $(1,364) $2,474
% Change - 10.4% 2.6% -0.6% 1.2%
2012 Financial Overview 9
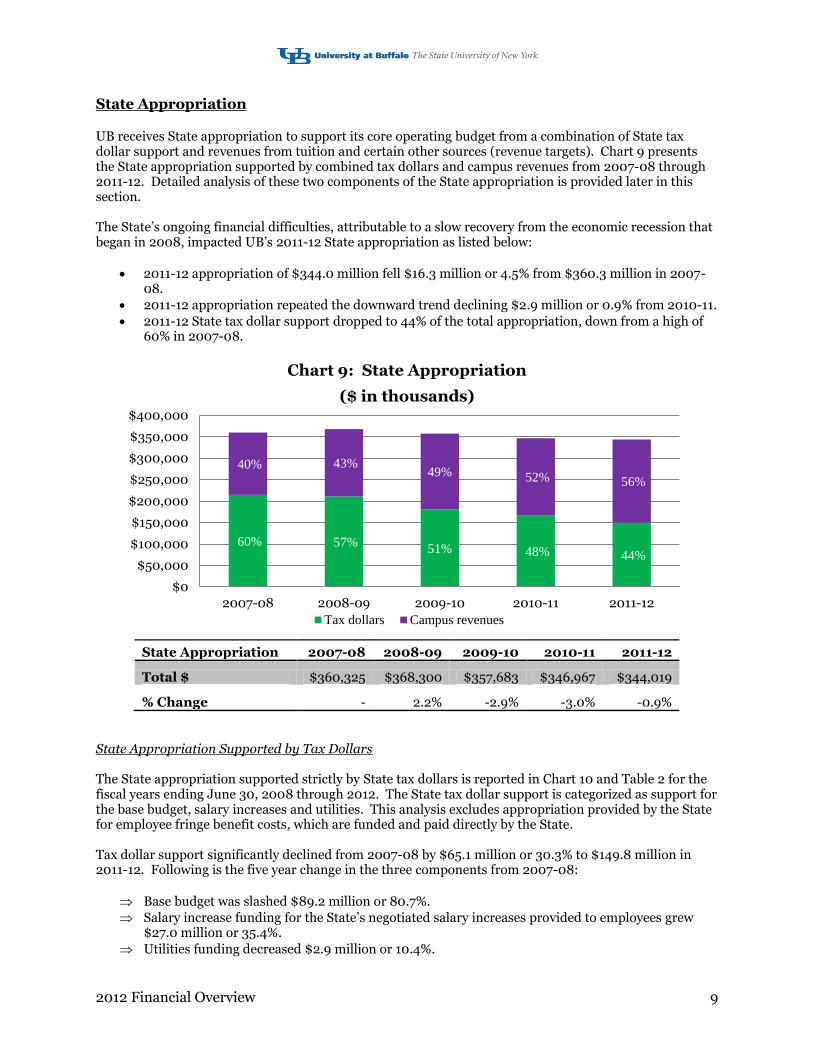
State Appropriation UB receives State appropriation to support its core operating budget from a combination of State tax dollar support and revenues from tuition and certain other sources (revenue targets). Chart 9 presents the State appropriation supported by combined tax dollars and campus revenues from 2007-08 through 2011-12. Detailed analysis of these two components of the State appropriation is provided later in this section. The State’s ongoing financial difficulties, attributable to a slow recovery from the economic recession that began in 2008, impacted UB’s 2011-12 State appropriation as listed below:
2011-12 appropriation of $344.0 million fell $16.3 million or 4.5% from $360.3 million in 2007-08.
2011-12 appropriation repeated the downward trend declining $2.9 million or 0.9% from 2010-11.
2011-12 State tax dollar support dropped to 44% of the total appropriation, down from a high of 60% in 2007-08.
State Appropriation 2007-08 2008-09 2009-10 2010-11 2011-12
Total $ $360,325 $368,300 $357,683 $346,967 $344,019
% Change - 2.2% -2.9% -3.0% -0.9%
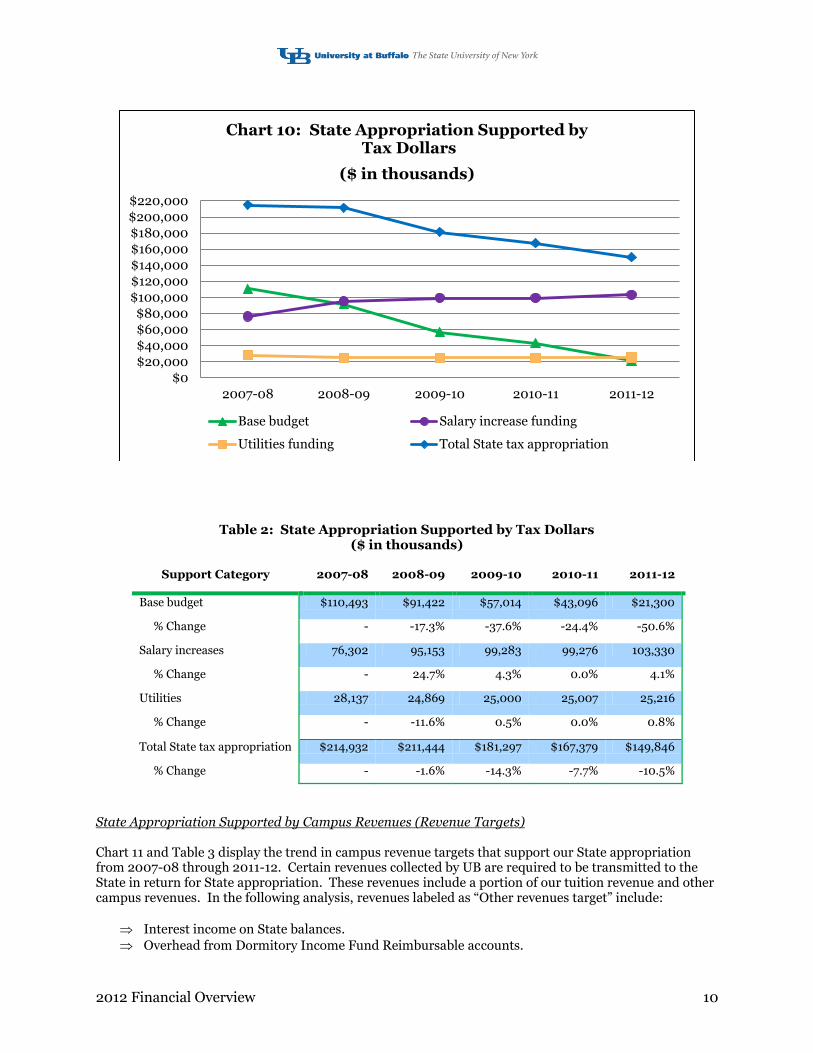
State Appropriation Supported by Tax Dollars The State appropriation supported strictly by State tax dollars is reported in Chart 10 and Table 2 for the fiscal years ending June 30, 2008 through 2012. The State tax dollar support is categorized as support for the base budget, salary increases and utilities. This analysis excludes appropriation provided by the State for employee fringe benefit costs, which are funded and paid directly by the State. Tax dollar support significantly declined from 2007-08 by $65.1 million or 30.3% to $149.8 million in 2011-12. Following is the five year change in the three components from 2007-08:
Base budget was slashed $89.2 million or 80.7%.
Salary increase funding for the State’s negotiated salary increases provided to employees grew $27.0 million or 35.4%.
Utilities funding decreased $2.9 million or 10.4%.
60% 57% 51% 48% 44%
40% 43% 49% 52% 56%
$0
$50,000
$100,000
$150,000
$200,000
$250,000
$300,000
$350,000
$400,000
2007-08 2008-09 2009-10 2010-11 2011-12
Chart 9: State Appropriation
($ in thousands)
Tax dollars Campus revenues
2012 Financial Overview 10
Table 2: State Appropriation Supported by Tax Dollars ($ in thousands)
Support Category 2007-08 2008-09 2009-10 2010-11 2011-12
Base budget $110,493 $91,422 $57,014 $43,096 $21,300
% Change - -17.3% -37.6% -24.4% -50.6%
Salary increases 76,302 95,153 99,283 99,276 103,330
% Change - 24.7% 4.3% 0.0% 4.1%
Utilities 28,137 24,869 25,000 25,007 25,216
% Change - -11.6% 0.5% 0.0% 0.8%
Total State tax appropriation $214,932 $211,444 $181,297 $167,379 $149,846
% Change - -1.6% -14.3% -7.7% -10.5%
State Appropriation Supported by Campus Revenues (Revenue Targets) Chart 11 and Table 3 display the trend in campus revenue targets that support our State appropriation from 2007-08 through 2011-12. Certain revenues collected by UB are required to be transmitted to the State in return for State appropriation. These revenues include a portion of our tuition revenue and other campus revenues. In the following analysis, revenues labeled as “Other revenues target” include:
Interest income on State balances.
Overhead from Dormitory Income Fund Reimbursable accounts.
$0$20,000
$40,000$60,000$80,000
$100,000$120,000$140,000$160,000$180,000$200,000$220,000
2007-08 2008-09 2009-10 2010-11 2011-12
Chart 10: State Appropriation Supported by Tax Dollars
($ in thousands)
Base budget Salary increase funding
Utilities funding Total State tax appropriation

2012 Financial Overview 11
College fee.
A portion of certain other fees (graduate application, late payment, late registration, library fines, returned check, and academic transcript fees).
Research Foundation revenue tithe (effective 2009-10). State appropriation supported by campus revenues in 2011-12 jumped $48.8 million or 33.6% from 2007-08 due to increases in the tuition revenue target needed to compensate for the $65.1 million reduction in State tax dollar support. Increases to tuition rates in 2007-08 through 2011-12 funded the growing tuition revenue target each year. The 2011-12 other revenues target decreased nearly $0.5 million or 9.7% from 2007-08 caused by record low interest rates earned on State balances offset by the revenue tithe implemented in 2009-10.
Table 3: State Appropriation Supported by Revenue Targets ($ in thousands)
Support Category 2007-08 2008-09 2009-10 2010-11 2011-12
Tuition revenue target $140,590 $152,053 $169,251 $175,244 $189,838
% Change - 8.2% 11.3% 3.5% 8.3%
Other revenues target 4,803 4,803 7,135 4,344 4,335
% Change - 0.0% 48.6% -39.1% -0.2%
Total campus revenues target
$145,393 $156,856 $176,386 $179,588 $194,173
% Change - 7.9% 12.5% 1.8% 8.1%
$120,000
$130,000
$140,000
$150,000
$160,000
$170,000
$180,000
$190,000
$200,000
2007-08 2008-09 2009-10 2010-11 2011-12
Chart 11: State Appropriation Supported by Revenue Targets
($ in thousands)
Tuition revenue target Other revenues target
2012 Financial Overview 12
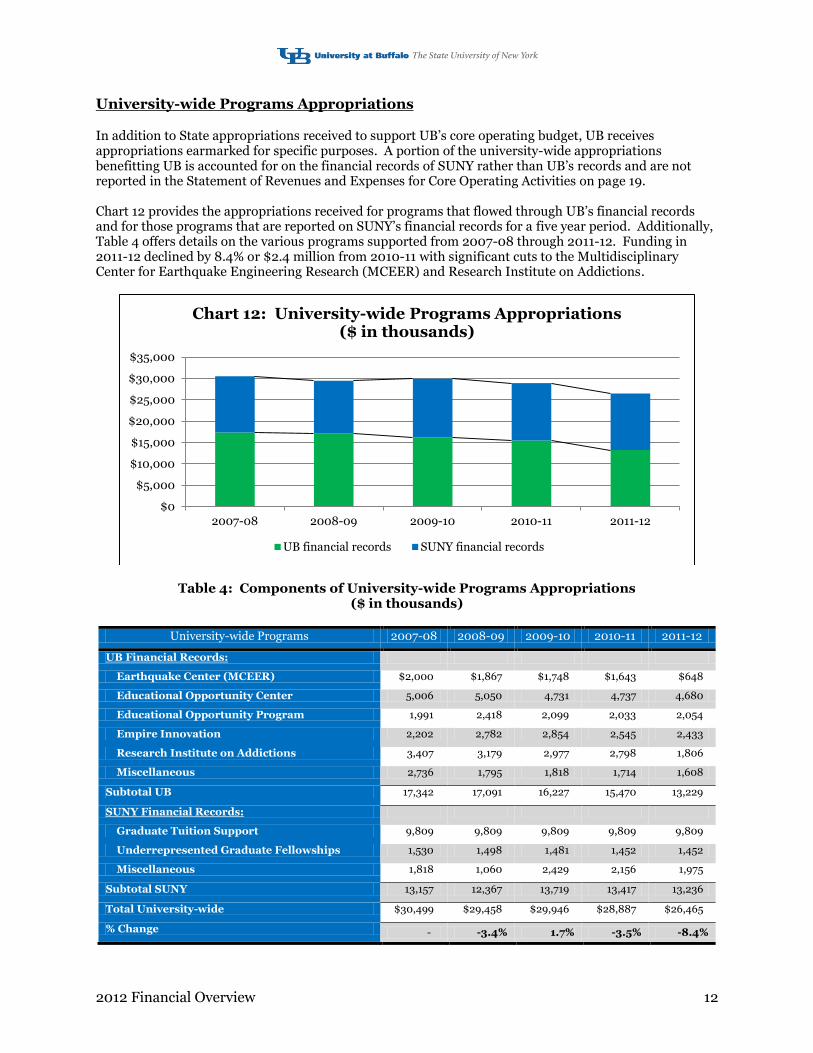
University-wide Programs Appropriations
In addition to State appropriations received to support UB’s core operating budget, UB receives appropriations earmarked for specific purposes. A portion of the university-wide appropriations benefitting UB is accounted for on the financial records of SUNY rather than UB’s records and are not reported in the Statement of Revenues and Expenses for Core Operating Activities on page 19. Chart 12 provides the appropriations received for programs that flowed through UB’s financial records and for those programs that are reported on SUNY’s financial records for a five year period. Additionally, Table 4 offers details on the various programs supported from 2007-08 through 2011-12. Funding in 2011-12 declined by 8.4% or $2.4 million from 2010-11 with significant cuts to the Multidisciplinary Center for Earthquake Engineering Research (MCEER) and Research Institute on Addictions.
Table 4: Components of University-wide Programs Appropriations ($ in thousands)
University-wide Programs 2007-08 2008-09 2009-10 2010-11 2011-12
UB Financial Records:
Earthquake Center (MCEER) $2,000 $1,867 $1,748 $1,643 $648
Educational Opportunity Center 5,006 5,050 4,731 4,737 4,680
Educational Opportunity Program 1,991 2,418 2,099 2,033 2,054
Empire Innovation 2,202 2,782 2,854 2,545 2,433
Research Institute on Addictions 3,407 3,179 2,977 2,798 1,806
Miscellaneous 2,736 1,795 1,818 1,714 1,608
Subtotal UB 17,342 17,091 16,227 15,470 13,229
SUNY Financial Records:
Graduate Tuition Support 9,809 9,809 9,809 9,809 9,809
Underrepresented Graduate Fellowships 1,530 1,498 1,481 1,452 1,452
Miscellaneous 1,818 1,060 2,429 2,156 1,975
Subtotal SUNY 13,157 12,367 13,719 13,417 13,236
Total University-wide $30,499 $29,458 $29,946 $28,887 $26,465
% Change - -3.4% 1.7% -3.5% -8.4%
$0
$5,000
$10,000
$15,000
$20,000
$25,000
$30,000
$35,000
2007-08 2008-09 2009-10 2010-11 2011-12
Chart 12: University-wide Programs Appropriations ($ in thousands)
UB financial records SUNY financial records
2012 Financial Overview 13
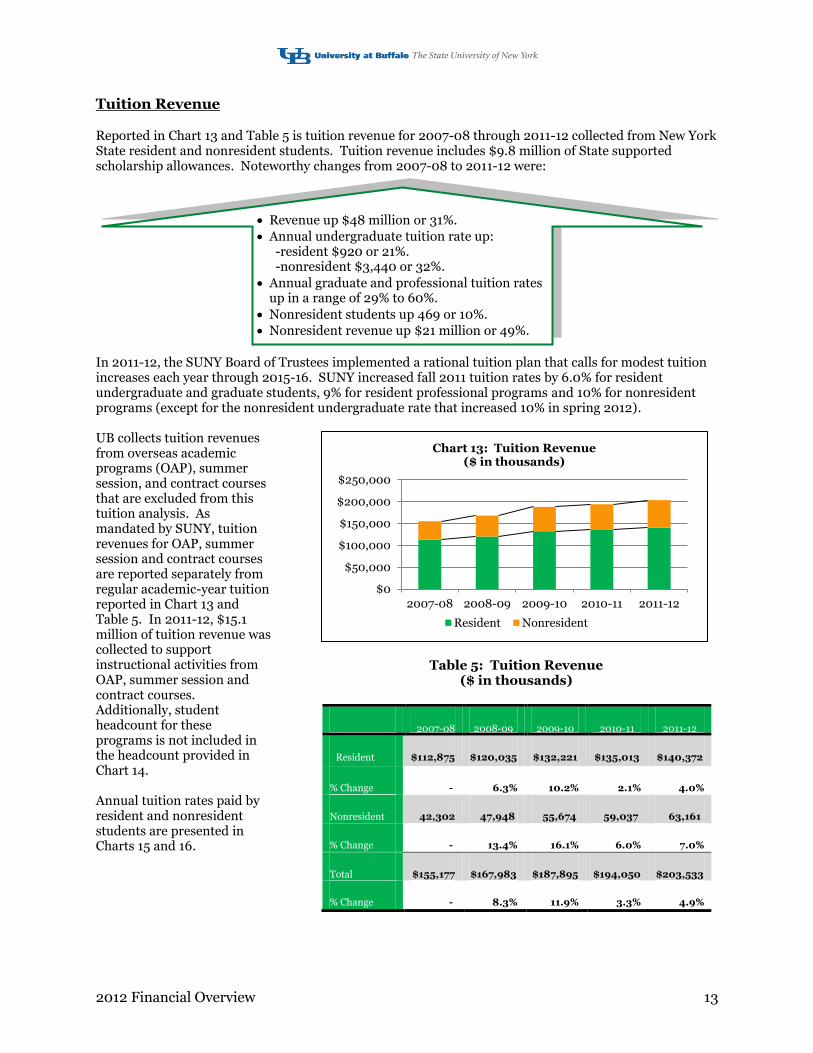
Tuition Revenue
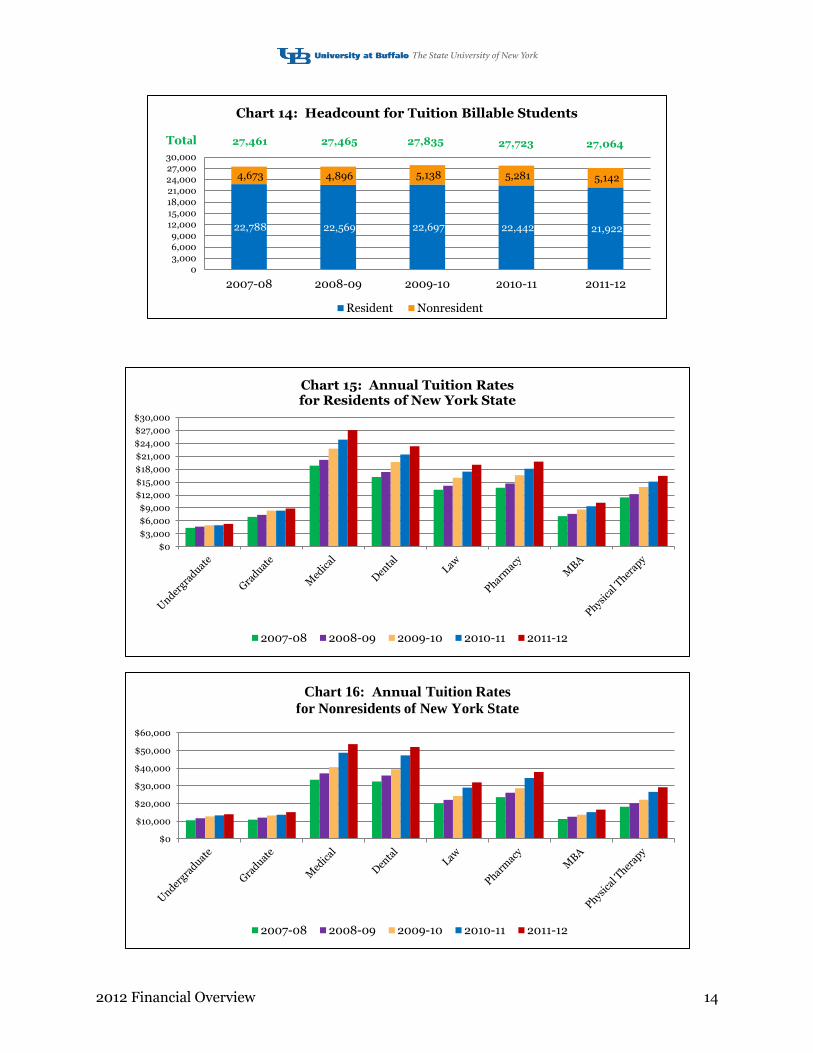
Reported in Chart 13 and Table 5 is tuition revenue for 2007-08 through 2011-12 collected from New York State resident and nonresident students. Tuition revenue includes $9.8 million of State supported scholarship allowances. Noteworthy changes from 2007-08 to 2011-12 were: In 2011-12, the SUNY Board of Trustees implemented a rational tuition plan that calls for modest tuition increases each year through 2015-16. SUNY increased fall 2011 tuition rates by 6.0% for resident undergraduate and graduate students, 9% for resident professional programs and 10% for nonresident programs (except for the nonresident undergraduate rate that increased 10% in spring 2012). UB collects tuition revenues from overseas academic programs (OAP), summer session, and contract courses that are excluded from this tuition analysis. As mandated by SUNY, tuition revenues for OAP, summer session and contract courses are reported separately from regular academic-year tuition reported in Chart 13 and Table 5. In 2011-12, $15.1 million of tuition revenue was collected to support instructional activities from OAP, summer session and contract courses. Additionally, student headcount for these programs is not included in the headcount provided in Chart 14. Annual tuition rates paid by resident and nonresident students are presented in Charts 15 and 16.
Table 5: Tuition Revenue ($ in thousands)
$0
$50,000
$100,000
$150,000
$200,000
$250,000
2007-08 2008-09 2009-10 2010-11 2011-12
Chart 13: Tuition Revenue ($ in thousands)
Resident Nonresident
2007-08 2008-09 2009-10 2010-11 2011-12
Resident $112,875 $120,035 $132,221 $135,013 $140,372
% Change - 6.3% 10.2% 2.1% 4.0%
Nonresident 42,302 47,948 55,674 59,037 63,161
% Change - 13.4% 16.1% 6.0% 7.0%
Total $155,177 $167,983 $187,895 $194,050 $203,533
% Change - 8.3% 11.9% 3.3% 4.9%
Revenue up $48 million or 31%.
Annual undergraduate tuition rate up: -resident $920 or 21%. -nonresident $3,440 or 32%.
Annual graduate and professional tuition rates up in a range of 29% to 60%.
Nonresident students up 469 or 10%.
Nonresident revenue up $21 million or 49%.
2012 Financial Overview 14
22,788 22,569 22,697 22,442 21,922
4,673 4,896 5,138 5,281 5,142
03,0006,0009,000
12,00015,00018,000
21,00024,00027,00030,000
2007-08 2008-09 2009-10 2010-11 2011-12
Chart 14: Headcount for Tuition Billable Students
Resident Nonresident
27,465 Total 27,835 27,723 27,461 27,064
$0
$3,000
$6,000
$9,000
$12,000
$15,000
$18,000
$21,000
$24,000
$27,000
$30,000
Chart 15: Annual Tuition Rates for Residents of New York State
2007-08 2008-09 2009-10 2010-11 2011-12
$0
$10,000
$20,000
$30,000
$40,000
$50,000
$60,000
Chart 16: Annual Tuition Rates
for Nonresidents of New York State
2007-08 2008-09 2009-10 2010-11 2011-12

2012 Financial Overview 15
Comprehensive Fee
The comprehensive fee is a consolidation of campus-required fees paid by students attending UB unless they meet waiver requirements. The components of the comprehensive fee include the following: college, transportation, technology, campus life, health service, transcript and athletics (undergraduate day students only). Table 6 provides a list of the annual rates charged to a full-time undergraduate student by component and Chart 17 illustrates the growth in comprehensive fee revenue over a 5 year period. The college fee component is excluded from Chart 17 because the revenue collected is transferred to the State University of New York and is redistributed to UB as State appropriation dollars. The significant rise in comprehensive fee revenue is mostly due to the increase in the rate offset by the 1.4% decline in students from 2007-08 as reflected in Chart 14 on page 14.
Table 6: Comprehensive Fee Annual Rates
Fee Component 2007-08 2008-09 2009-10 2010-11 2011-12
Athletics $415 $430 $447 $474 $484
Campus Life 164 170 177 201 201
College 25 25 25 25 25
Health Service 218 233 247 261 282
Technology 592 614 644 683 693
Transcript 10 10 10 10 10
Transportation 284 293 304 322 327
Total $1,708 $1,775 $1,854 $1,976 $2,022
% Change - 3.9% 4.5% 6.6% 2.3%
$0
$5,000
$10,000
$15,000
$20,000
$25,000
$30,000
$35,000
$40,000
$45,000
$50,000
2007-08 2008-09 2009-10 2010-11 2011-12
Chart 17: Comprehensive Fee Revenue ($ in thousands)
Athletic Campus Life Health Service Technology Transcript Transportation
2011-12 Annual Fee Rate $2,022 UP
$314 or 18.4% from $1,708 in 2007-08
2011-12 Fee Revenue $44.3 million UP
$6.7 million or 18.1% from $37.6 million in 2007-08

2012 Financial Overview 16
Residence Halls and Apartments Revenue
Combined revenue from residence halls and apartments is the largest component of auxiliary enterprises operating revenue presented in Charts 1 and 2, found in the Financial Highlights section beginning on page 3, and on the Statement of Revenues and Expenses for Core Operating Activities on page 19. Other activity reported in auxiliary enterprises revenue includes sales and services for food services, campus store operations, intercollegiate athletics and transportation.
Revenue from residence halls is accounted for in Dormitory Income Fund Reimbursable (DIFR) State accounts while revenue from on-campus apartment rentals is administered through the University at Buffalo Foundation Faculty-Student Housing Corporation. UB offers a wide variety of on-campus housing options at various costs that are designed around the needs of the students.
Since 2007-08 total revenue from residence halls and apartments grew $9.0 million or 18.8% to $56.8 million in 2011-12, as reflected in Chart 18. Room rates for residence halls increased 5.1% from 2010-11 to cover additional debt incurred to rehabilitate residential buildings and support the construction of a new dining hall.
Residence Halls and Apartments 2007-08 2008-09 2009-10 2010-11 2011-12
Total revenue $47,818 $47,753 $46,923 $54,174 $56,821
% Change - -0.1% -1.7% 15.5% 4.9%
69% 71% 71% 68% 62%
31% 29% 29% 32% 38%
$0
$10,000
$20,000
$30,000
$40,000
$50,000
$60,000
2007-08 2008-09 2009-10 2010-11 2011-12
Chart 18: Residence Halls and Apartments Revenue
($ in thousands)
Residence halls Apartments
2012 Financial Overview 17
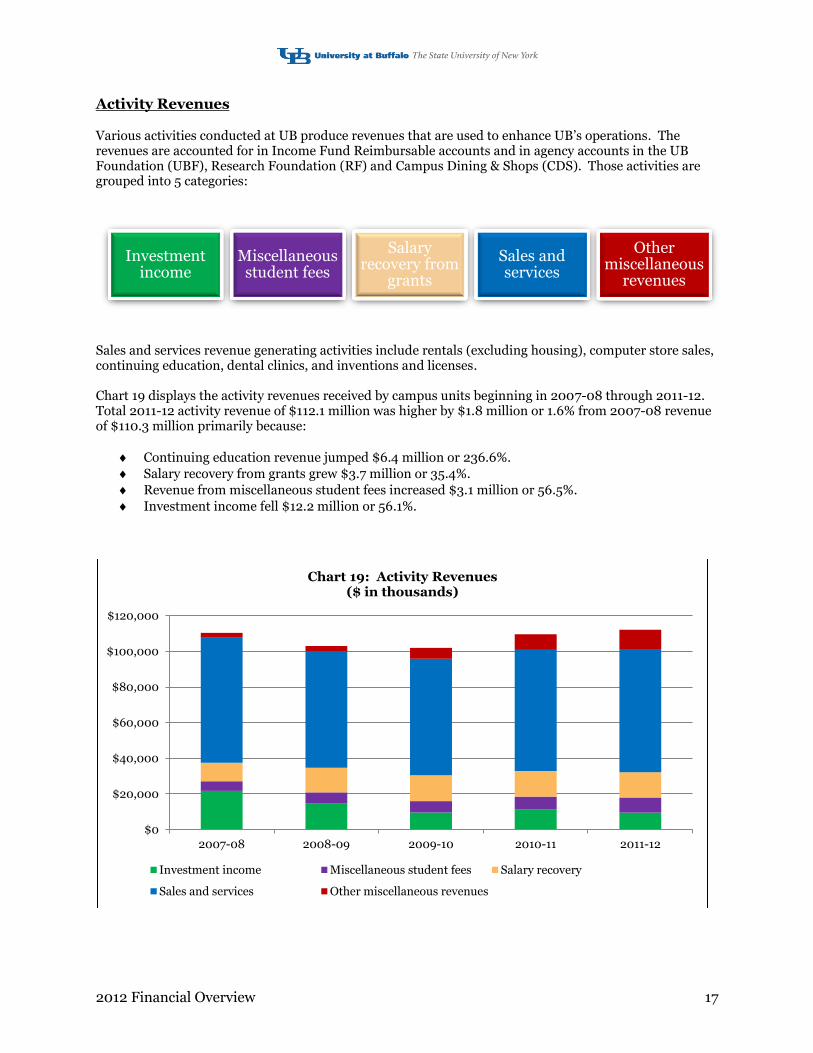
Activity Revenues
Various activities conducted at UB produce revenues that are used to enhance UB’s operations. The revenues are accounted for in Income Fund Reimbursable accounts and in agency accounts in the UB Foundation (UBF), Research Foundation (RF) and Campus Dining & Shops (CDS). Those activities are grouped into 5 categories:
Sales and services revenue generating activities include rentals (excluding housing), computer store sales, continuing education, dental clinics, and inventions and licenses. Chart 19 displays the activity revenues received by campus units beginning in 2007-08 through 2011-12. Total 2011-12 activity revenue of $112.1 million was higher by $1.8 million or 1.6% from 2007-08 revenue of $110.3 million primarily because:
Continuing education revenue jumped $6.4 million or 236.6%.
Salary recovery from grants grew $3.7 million or 35.4%.
Revenue from miscellaneous student fees increased $3.1 million or 56.5%.
Investment income fell $12.2 million or 56.1%.
Investment income
Miscellaneous student fees
Salary recovery from
grants
Sales and services
Other miscellaneous
revenues
$0
$20,000
$40,000
$60,000
$80,000
$100,000
$120,000
2007-08 2008-09 2009-10 2010-11 2011-12
Chart 19: Activity Revenues ($ in thousands)
Investment income Miscellaneous student fees Salary recovery
Sales and services Other miscellaneous revenues

2012 Financial Overview 18
Facility and Administrative (F&A) Cost Recovery
Sponsored research programs generate two types of costs: direct costs and F&A costs (indirect costs). The F&A costs incurred by UB for accepting the sponsored research cannot be assigned easily and accurately to specific programs and therefore are calculated as a fixed percentage of all or a portion of a program’s direct costs. The calculated amount is recovered by UB and is used to support decanal units, several administrative units, research incentive programs, and various other financial commitments, as well as cover an annual administrative assessment by the Research Foundation (RF). Chart 20 portrays the trend in F&A cost recovery earned net and gross of the RF annual assessment. Net F&A cost recovery collected in 2011-12 was $33.6 million, which was $6.4 million or 23.4% higher than the amount collected in 2007-08 of $27.2 million. Factors contributing to the increase were:
$1.7 million collected in 2011-12 on federal research awards funded by the American Recovery and Reinvestment Act (ARRA) of 2009.
Growth in direct costs, excluding funds from ARRA, of 4.5% since 2007-08. A decrease in the issuance of waivers of F&A cost assessments.
The F&A cost recovery reported in Chart 1 on page 3 represents the amount received rather than earned as reported in the previous paragraph. In 2011-12, the RF paid UB $29.3 million of the net F&A cost recovery earned that consisted of $4.1 million due from 2010-11 and $25.2 million from 2011-12. The RF will pay the 2011-12 balance of $8.4 million to UB in 2012-13.
$0
$5,000
$10,000
$15,000
$20,000
$25,000
$30,000
$35,000
$40,000
2007-08 2008-09 2009-10 2010-11 2011-12
Chart 20: Facility and Administrative Cost Recovery ($ in thousands)
Gross RF assessment Net

2012 Financial Overview 19
University at Buffalo
Statement of Revenues and Expenses for Core Operating Activities For the Years Ended June 30, 2012 and 2011
($ in thousands)
2011-12 2010-11
Operating revenues:
Tuition $203,533 $194,050
Less: scholarship allowances (9,809) (9,809)
Net tuition 193,724 184,241
State support 163,075 182,849
Student fees 52,827 51,327
Auxiliary enterprises 47,876 54,033
Investment income 38,900 22,872
Facility and administrative cost recovery 29,253 34,216
Other operating revenue:
Salary recovery from sponsored programs 14,135 14,395
Sales and services 65,498 63,086
Other 21,860 23,050
Total operating revenues 627,148 630,069
Operating expenses by functional classification:
Instruction 274,068 269,264
Departmental research 43,570 42,081
Public service 4,326 4,217
Academic support 30,174 27,136
Student services 30,756 32,414
Institutional support 99,894 106,087
Operation and maintenance of plant 51,335 61,687
Scholarships and fellowships 19,547 19,217
Hospitals and clinics 6,332 6,273
Auxiliary enterprises:
Intercollegiate athletics 21,207 22,264
Student housing 43,016 39,757
Other 449 296
Total operating expenses by function 624,674 630,693
Net results of core operating activities $2,474 $(624)
Operating expenses by type:
Salaries $409,220 $411,762
Employee fringe benefits 24,729 24,724
Supplies 28,223 32,085
Travel 12,417 12,712
Contractual services 119,845 124,266
Equipment, repairs and maintenance 30,240 25,144
Total operating expenses by type $624,674 $630,693

2012 Financial Overview 20
Other Financial Highlights
Endowment and Similar Investments
UB Foundation’s (UBF) endowment consists of approximately 1,100 individual funds established for a variety of purposes, including both donor-restricted endowment funds and funds designated by UBF’s Board of Trustees to function as endowments. UBF’s Trustee Investment Committee supervises the management of UB’s endowment assets with the primary investment objective to maximize total investment return while preserving the inflation-adjusted purchasing power of the portfolio and providing a predictable stream of funding to programs. A professional consultant and investment managers share in the administration of the portfolio, with performance monitored by the investment committee. UBF targets a diversified asset allocation to achieve its long-term objectives within prudent risk parameters. Table 7 reports the market value and activity for UB’s endowment fund from 2007-08 through 2011-12. Additions to the endowment fund are predominantly contributions from donors while the amounts in the withdrawals column primarily represent dollars made available for spending to various UB units.
Table 7: Endowment Activity 2007-08 through 2011-12 ($ in thousands)
Year
Beginning Market Value
Additions
Investment Return
Withdrawals
Ending Market Value
2011-12 $494,791 $42,507 $5,280 $31,558 $511,020
2010-11 $428,851 $9,187 $83,533 $26,780 $494,791
2009-10 $410,464 $3,633 $41,277 $26,523 $428,851
2008-09 $552,663 $3,717 ($117,572) $28,344 $410,464
2007-08 $582,168 $14,630 ($19,371) $24,764 $552,663
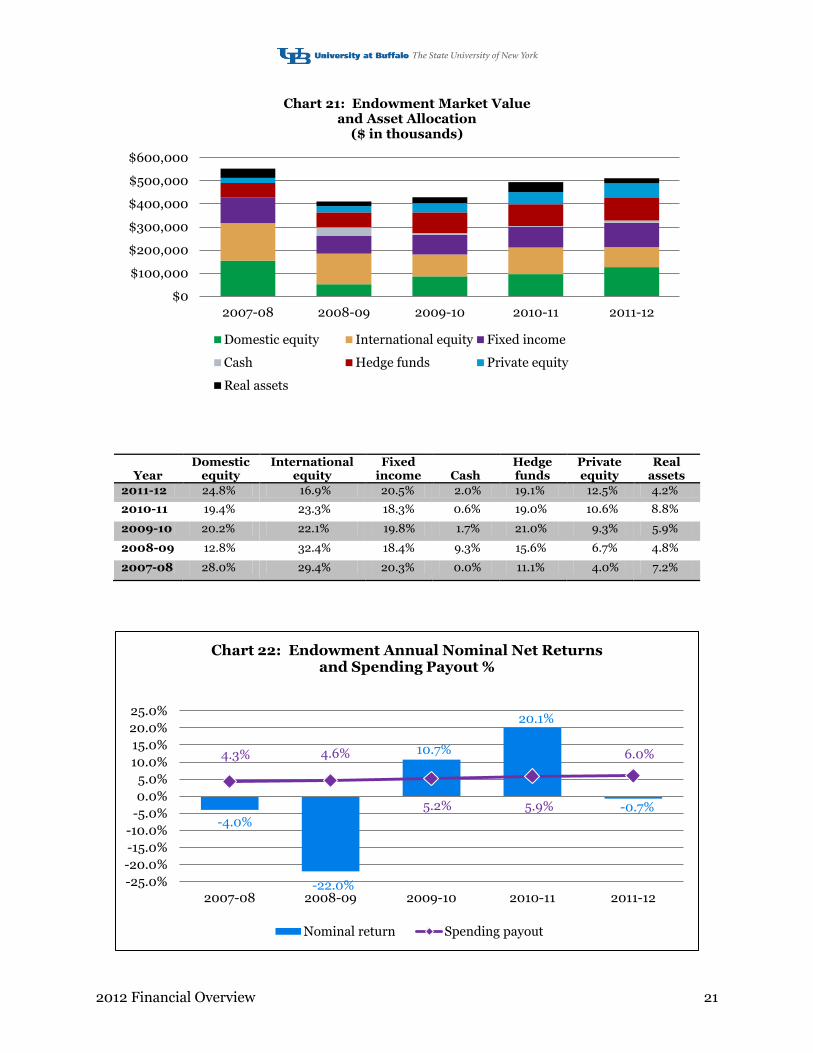
UB’s endowment fund asset allocation from 2007-08 through 2011-12 is displayed in Chart 21 on page 21. Since 2007-08, the fund’s assets were reallocated from international equity to hedge funds and private equity, which is consistent with the asset allocation targets proposed by the consultant and approved by the UBF investment committee. These significant changes are provided in the adjacent diagram.
Chart 22 presents the annual nominal (not adjusted for inflation) returns net of fees and spending payout percentages for the endowment fund from 2007-08 through 2011-12. The spending payout is defined as funds made available from the endowment for university programs and administrative expenses, exclusive of management, brokerage, and custodial fees, as a percentage of the beginning market value. In terms of real dollars, the spending payout is relatively consistent as designed by the spending formula.
Down:
International equity 47%
Up:
Hedge funds 59%
Private equity 189%
2011-12 market value of $511 million is below its
highest value of $582 million in 2006-07.
2012 Financial Overview 21
Year Domestic
equity International
equity Fixed
income Cash Hedge funds
Private equity
Real assets
2011-12 24.8% 16.9% 20.5% 2.0% 19.1% 12.5% 4.2%
2010-11 19.4% 23.3% 18.3% 0.6% 19.0% 10.6% 8.8%
2009-10 20.2% 22.1% 19.8% 1.7% 21.0% 9.3% 5.9%
2008-09 12.8% 32.4% 18.4% 9.3% 15.6% 6.7% 4.8%
2007-08 28.0% 29.4% 20.3% 0.0% 11.1% 4.0% 7.2%
-4.0%
-22.0%
10.7%
20.1%
-0.7%
4.3% 4.6%
5.2% 5.9%
6.0%
-25.0%
-20.0%
-15.0%
-10.0%
-5.0%
0.0%
5.0%
10.0%
15.0%
20.0%
25.0%
2007-08 2008-09 2009-10 2010-11 2011-12
Chart 22: Endowment Annual Nominal Net Returns and Spending Payout %
Nominal return Spending payout
$0
$100,000
$200,000
$300,000
$400,000
$500,000
$600,000
2007-08 2008-09 2009-10 2010-11 2011-12
Chart 21: Endowment Market Value and Asset Allocation
($ in thousands)
Domestic equity International equity Fixed income
Cash Hedge funds Private equity
Real assets
2012 Financial Overview 22
Long-term Debt
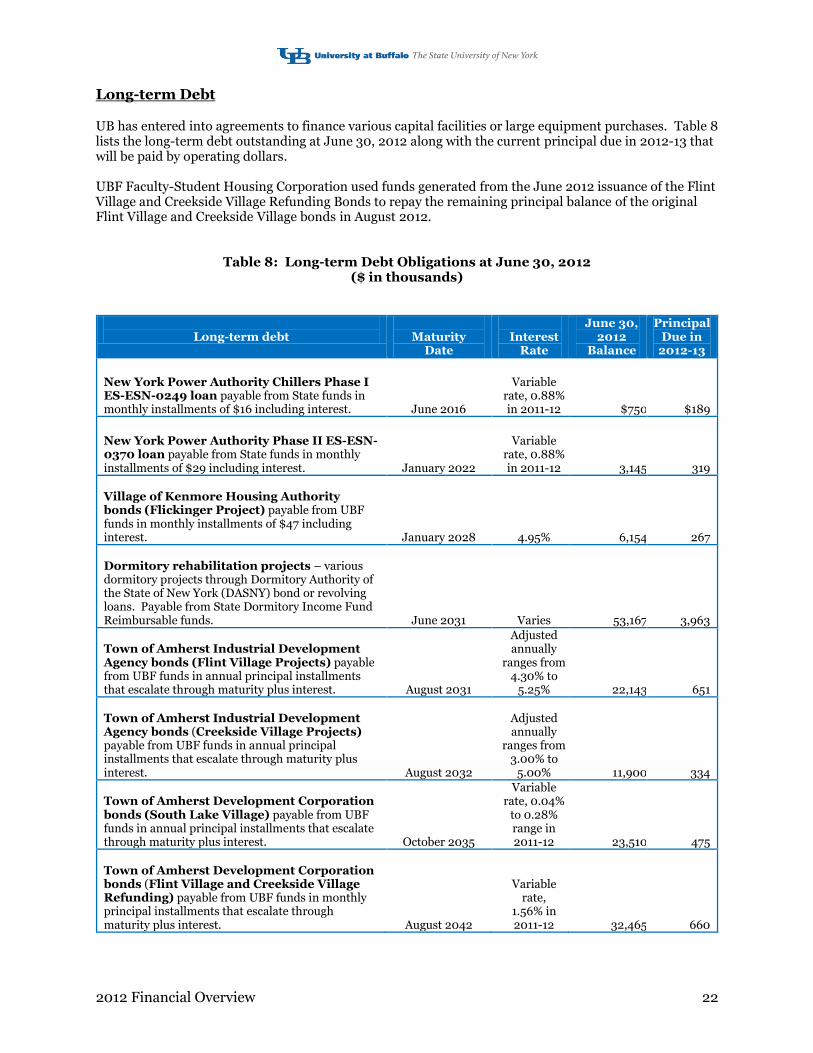
UB has entered into agreements to finance various capital facilities or large equipment purchases. Table 8 lists the long-term debt outstanding at June 30, 2012 along with the current principal due in 2012-13 that will be paid by operating dollars. UBF Faculty-Student Housing Corporation used funds generated from the June 2012 issuance of the Flint Village and Creekside Village Refunding Bonds to repay the remaining principal balance of the original Flint Village and Creekside Village bonds in August 2012.
Table 8: Long-term Debt Obligations at June 30, 2012 ($ in thousands)
Long-term debt
Maturity
Date
Interest
Rate
June 30, 2012
Balance
Principal Due in
2012-13
New York Power Authority Chillers Phase I ES-ESN-0249 loan payable from State funds in monthly installments of $16 including interest.
June 2016
Variable
rate, 0.88% in 2011-12
$750
$189
New York Power Authority Phase II ES-ESN-0370 loan payable from State funds in monthly installments of $29 including interest.
January 2022
Variable
rate, 0.88% in 2011-12
3,145
319
Village of Kenmore Housing Authority bonds (Flickinger Project) payable from UBF funds in monthly installments of $47 including interest.
January 2028
4.95%
6,154
267
Dormitory rehabilitation projects – various dormitory projects through Dormitory Authority of the State of New York (DASNY) bond or revolving loans. Payable from State Dormitory Income Fund Reimbursable funds.
June 2031
Varies
53,167
3,963
Town of Amherst Industrial Development Agency bonds (Flint Village Projects) payable from UBF funds in annual principal installments that escalate through maturity plus interest.
August 2031
Adjusted annually
ranges from 4.30% to
5.25%
22,143
651
Town of Amherst Industrial Development Agency bonds (Creekside Village Projects) payable from UBF funds in annual principal installments that escalate through maturity plus interest.
August 2032
Adjusted annually
ranges from 3.00% to
5.00%
11,900
334
Town of Amherst Development Corporation bonds (South Lake Village) payable from UBF funds in annual principal installments that escalate through maturity plus interest.
October 2035
Variable rate, 0.04%
to 0.28% range in 2011-12
23,510
475
Town of Amherst Development Corporation bonds (Flint Village and Creekside Village Refunding) payable from UBF funds in monthly principal installments that escalate through maturity plus interest. August 2042
Variable rate,
1.56% in 2011-12 32,465 660

2012 Financial Overview 23
Long-term debt (continued)
Maturity
Date
Interest
Rate
June 30, 2012
Balance
Principal Due in
2012-13
Town of Amherst Development Corporation bonds (Greiner Hall and Hadley Village) payable from UBF funds in annual principal installments that escalate through maturity plus interest. October 2045
Adjusted annually
ranges from 3.00% to
5.00% 81,782 1,860
Total debt obligations
$235,016 $8,718
General University Service Fee
A general university service fee (GUSF) is charged on external revenues that are deposited into State Income Fund Reimbursable (IFR), University at Buffalo Foundation (UBF), Research Foundation (RF) and Campus Dining & Shops (CDS) accounts. GUSF is not applied to gifts, sponsored programs and CDS corporate activity. Effective November 1, 2011, GUSF increased to a rate of 13% from 10%. Chart 23 presents GUSF collections by entity from 2007-08 through 2011-12. Total GUSF collected grew substantially by $7.3 million or 127.0% to $13.1 million in 2011-12 from $5.8 million in 2007-08. This growth is mostly attributable to 3% increases in the GUSF rate implemented on July 1, 2010 and November 1, 2011 and consistent annual increases in student fee revenue in the State IFR accounts.
Year State IFR UBF RF CDS Total
2011-12 $9,505 $3,437 $158 $14 $13,114
2010-11 $8,571 $1,994 $121 $11 $10,697
2009-10 $4,440 $1,290 $49 $6 $5,785
2008-09 $4,059 $1,685 $43 $4 $5,791
2007-08 $3,942 $1,794 $38 $3 $5,777
$0
$2,000
$4,000
$6,000
$8,000
$10,000
$12,000
$14,000
2007-08 2008-09 2009-10 2010-11 2011-12
Chart 23: General University Service Fee Collections ($ in thousands)
State IFR UBF RF CDS
2012 Financial Overview 24
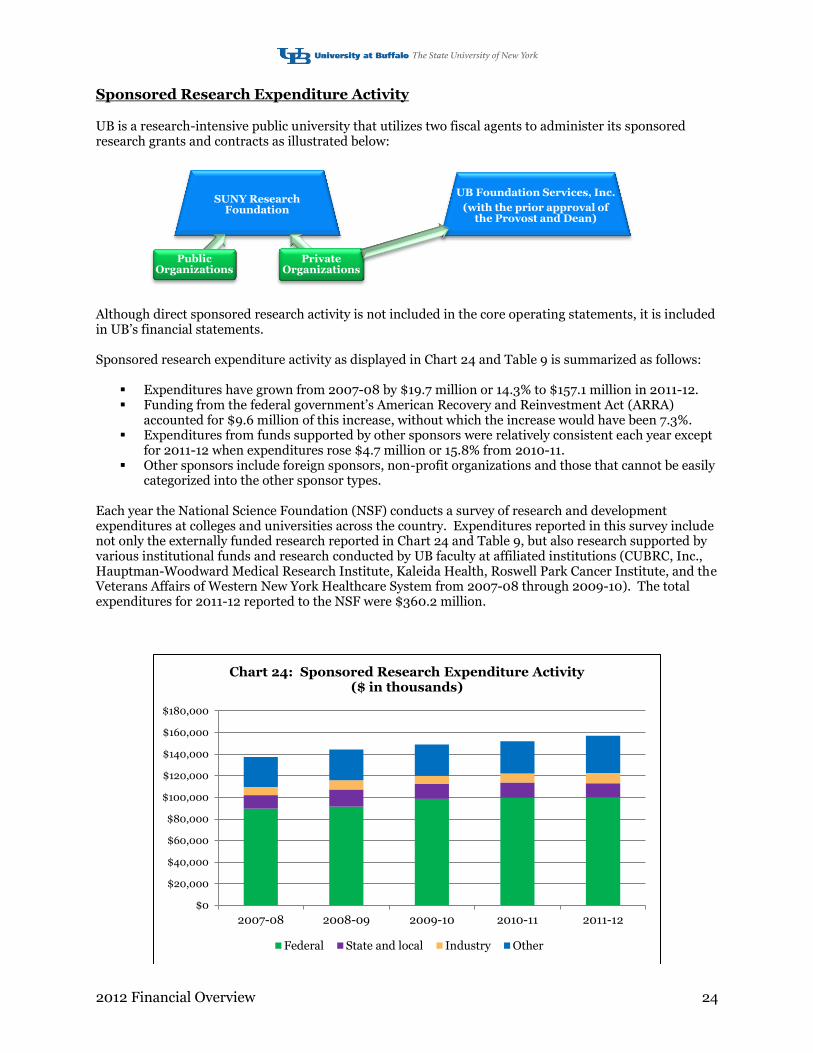
Sponsored Research Expenditure Activity
UB is a research-intensive public university that utilizes two fiscal agents to administer its sponsored research grants and contracts as illustrated below:
Although direct sponsored research activity is not included in the core operating statements, it is included in UB’s financial statements. Sponsored research expenditure activity as displayed in Chart 24 and Table 9 is summarized as follows:
Expenditures have grown from 2007-08 by $19.7 million or 14.3% to $157.1 million in 2011-12. Funding from the federal government’s American Recovery and Reinvestment Act (ARRA)
accounted for $9.6 million of this increase, without which the increase would have been 7.3%. Expenditures from funds supported by other sponsors were relatively consistent each year except
for 2011-12 when expenditures rose $4.7 million or 15.8% from 2010-11. Other sponsors include foreign sponsors, non-profit organizations and those that cannot be easily
categorized into the other sponsor types. Each year the National Science Foundation (NSF) conducts a survey of research and development expenditures at colleges and universities across the country. Expenditures reported in this survey include not only the externally funded research reported in Chart 24 and Table 9, but also research supported by various institutional funds and research conducted by UB faculty at affiliated institutions (CUBRC, Inc., Hauptman-Woodward Medical Research Institute, Kaleida Health, Roswell Park Cancer Institute, and the Veterans Affairs of Western New York Healthcare System from 2007-08 through 2009-10). The total expenditures for 2011-12 reported to the NSF were $360.2 million.
SUNY Research Foundation
Public Organizations
Private Organizations
UB Foundation Services, Inc.
(with the prior approval of the Provost and Dean)
$0
$20,000
$40,000
$60,000
$80,000
$100,000
$120,000
$140,000
$160,000
$180,000
2007-08 2008-09 2009-10 2010-11 2011-12
Chart 24: Sponsored Research Expenditure Activity ($ in thousands)
Federal State and local Industry Other

2012 Financial Overview 25
Table 9: Sponsored Research Expenditure Activity
2007-08 through 2011-12 ($ in thousands)
Sponsor 2007-08 2008-09 2009-10 2010-11 2011-12
Federal (without ARRA) $89,512 $91,468 $88,915 $85,597 $91,744
% Change - 2.2% -2.8% -3.7% 7.2%
ARRA (Federal only) - - 9,617 14,064 8,159
Subtotal Federal 89,512 91,468 98,532 99,661 99,903
% Change - 2.2% 7.7% 1.2% 0.2%
State and local 12,589 15,790 14,162 14,166 13,203
% Change - 25.4% -10.3% 0.0% -6.8%
Industry 7,606 8,603 7,202 8,301 9,462
% Change - 13.1% -16.3% 15.3% 14.0%
Other 27,758 28,495 29,035 29,834 34,549
% Change - 2.7% 1.9% 2.8% 15.8%
Total expenditures $137,465 $144,356 $148,931 $151,962 $157,117
% Change - 5.0% 3.2% 2.0% 3.4%
Economic Impact
The economy of the Buffalo-Niagara region benefits in many ways from UB’s educational and research activities conducted at its three campuses. The region also profits from UB’s capital projects as it purchases structures, constructs new buildings and renovates existing buildings that currently number 181 across its three campuses. UB’s Office of Science, Technology Transfer and Economic Outreach (STOR) promotes economic revitalization to the region by transferring technology developed at UB to the business community and has assisted in launching new companies through its incubator program.
UB is comprised of multiple components or entities as described on page 26 and Table 10 on page 27. Combined expense activity for entities reported in UB’s financial statements, dental and medical clinical practice plans, dental and medical resident services private corporations, and related student associations and clubs, produced a direct economic impact of $1.3 billion in the region during 2011-12. Additional financial stimulus to the Buffalo-Niagara economy is provided by faculty, staff, students and visitors.
Nearly $1.3 Billion Approximately 28,900 Students Direct Economic Impact 12,120 Employees

2012 Financial Overview 26
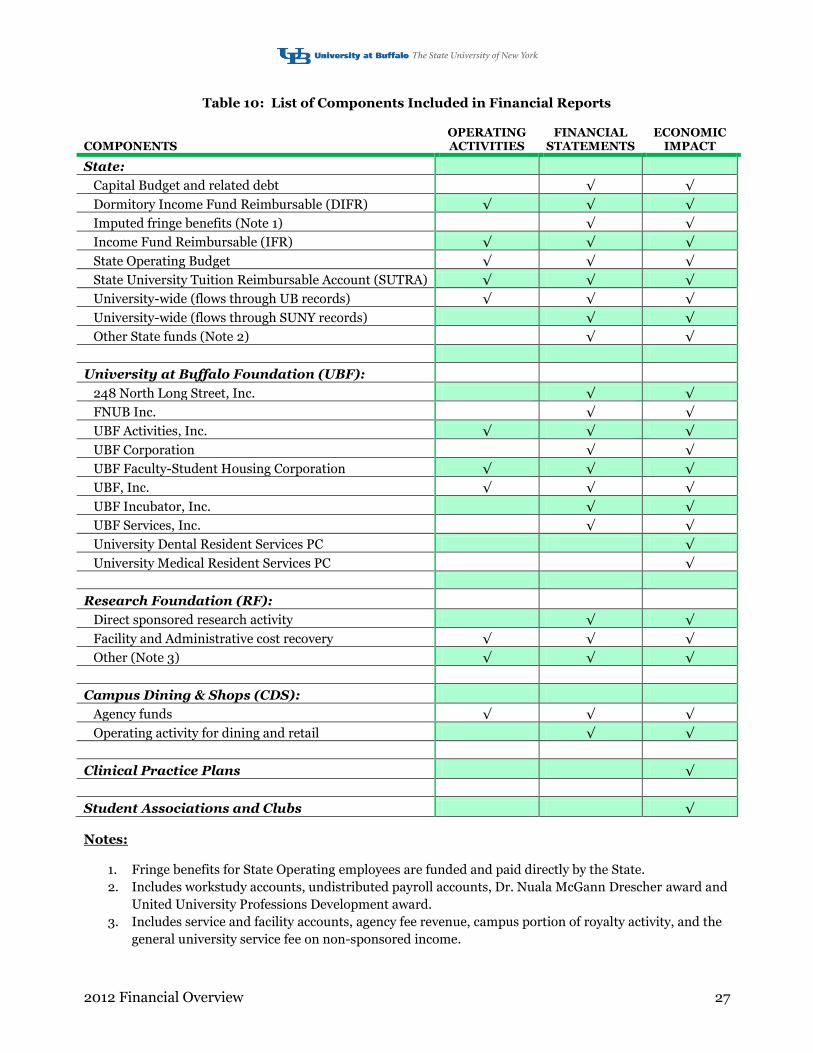
Components of Report Defined
The Overview of Financial Activities (Overview) provides key financial information for the campus, focusing on operating activities directly controlled by campus management. This is in contrast to the financial statements of the campus, which includes entities that are closely affiliated with the campus and campus management may not have direct control over the operations. Furthermore, UB’s economic impact on the Buffalo-Niagara region, discussed on page 25, includes activities from independent organizations that the University has a close association with. In Table 10, the components of the Statement of Revenues and Expenses for Core Operating Activities on page 19 of the Overview are compared to the Statement of Revenues, Expenses and Changes in Net Assets on page 3 of UB’s Annual Financial Statements for fiscal years ended June 30, 2012 and 2011 (Appendix) and UB’s economic impact results. A list and description of components or entities included in the Overview, UB’s financial statements, and economic impact section are provided in the following paragraphs and table. New York State budget components supporting UB’s core operations that are contained in the Overview include the following:
State Operating Budget which is a combination of support from State tax dollars and campus revenues from tuition and certain other sources. Also, included are other earmarked State funds.
Income Fund Reimbursable (IFR) and State University Tuition Reimbursable Account (SUTRA) which are self-supporting funds that provide educational and related activities to students and clients from fee, service and tuition revenue.
Dormitory Income Fund Reimbursable (DIFR) which is a self-supporting fund used to administer room rental fees and charges.
Other components supporting UB’s core operations that are included in the Overview are:
University at Buffalo Foundation (UBF) agency, endowment income, and unrestricted gifts used to support and promote the educational and public service mission of UB. Companies included in the report are UBF, Inc., UBF Activities, Inc. and UBF Faculty-Student Housing Corporation.
Research Foundation (RF) dollars managed by UB generated from facility and administrative (F&A) cost recovery from sponsored programs and agency service fees.
Campus Dining & Shops (CDS) agency funds expended by campus departments for operating activities.
The following restricted revenue that cannot be used for day-to-day operating activities and financial activity of closely affiliated entities are not included in the balances reported in the Overview, but are included in UB’s financial statements and economic impact amounts:
Capital Budget activities tracked in the State University of New York (SUNY) Construction Fund system that includes construction in progress, capitalized interest and depreciation of assets.
Research activities funded from external contracts and grants administered through the RF for SUNY and UBF Services, Inc.
UBF restricted activities (UBF Corporation, endowment investments, and various property corporations).
Dining, retail, vending, campus identification cards, and catering services provided by CDS. Operations of independent organizations that are included in the amounts reported only in the economic impact section are:
Medical and dental services extended to patients by UB faculty through the Clinical Practice Plans. University Dental Resident Services PC and University Medical Resident Services PC. Student associations and clubs such as the Graduate Student Association, Medical Student Polity, and
Undergraduate Student Association.
2012 Financial Overview 27
Table 10: List of Components Included in Financial Reports COMPONENTS
OPERATING ACTIVITIES
FINANCIAL STATEMENTS
ECONOMIC IMPACT
State:
Capital Budget and related debt √ √
Dormitory Income Fund Reimbursable (DIFR) √ √ √
Imputed fringe benefits (Note 1) √ √
Income Fund Reimbursable (IFR) √ √ √
State Operating Budget √ √ √
State University Tuition Reimbursable Account (SUTRA) √ √ √
University-wide (flows through UB records) √ √ √
University-wide (flows through SUNY records) √ √
Other State funds (Note 2) √ √
University at Buffalo Foundation (UBF):
248 North Long Street, Inc. √ √
FNUB Inc. √ √
UBF Activities, Inc. √ √ √
UBF Corporation √ √
UBF Faculty-Student Housing Corporation √ √ √
UBF, Inc. √ √ √
UBF Incubator, Inc. √ √
UBF Services, Inc. √ √
University Dental Resident Services PC √
University Medical Resident Services PC √
Research Foundation (RF):
Direct sponsored research activity √ √
Facility and Administrative cost recovery √ √ √
Other (Note 3) √ √ √
Campus Dining & Shops (CDS):
Agency funds √ √ √
Operating activity for dining and retail √ √
Clinical Practice Plans √
Student Associations and Clubs √
Notes:
1. Fringe benefits for State Operating employees are funded and paid directly by the State.
2. Includes workstudy accounts, undistributed payroll accounts, Dr. Nuala McGann Drescher award and
United University Professions Development award.
3. Includes service and facility accounts, agency fee revenue, campus portion of royalty activity, and the
general university service fee on non-sponsored income.

0
STATE UNIVERSITY OF NEW YORK AT BUFFALO
ANNUAL FINANCIAL STATEMENTS
FISCAL YEARS ENDED JUNE 30, 2012 and 2011

1
Table of Contents
Financial Statements ........................................................................................................................ 2
Notes to Consolidated Financial Statements .................................................................................. 4
Supplemental Schedules ................................................................................................................ 12

2
STATE UNIVERSITY OF NEW YORK AT BUFFALO
ASSETS, LIABILITIES AND NET ASSETS
BALANCE AT JUNE 30, 2012 and 2011
Assets 2012 2011
Current assets:
Cash and cash equivalents (Note 6) $158,548,980 $159,553,943
Accounts and notes receivable, net (Note 7) 46,601,557 45,358,362
Other receivables (Note 8) 32,353,600 55,524,580
Short-term investments 366,336,321 385,089,633
Inventory (Note 10) 3,164,266 3,254,369
Prepaid expenses 1,274,223 1,164,749
Total current assets 608,278,947 649,945,636
Noncurrent assets:
Property, plant and equipment, net (Note 11) 1,046,304,848 797,111,602
Long-term investments 344,989,127 289,850,698
Other assets (Note 12) 10,324,988 9,974,945
Total noncurrent assets 1,401,618,963 1,096,937,245
Total assets $2,009,897,910 $1,746,882,881
Liabilities and Net Assets
Current liabilities:
Accounts payable $21,827,916 $18,046,644
Accrued expenses 10,577,486 10,093,156
Current portion of long-term debt 8,869,862 6,843,295
Deferred revenue 966,932 2,117,190
Other current liabilities 307,285 296,068
Total current liabilities 42,549,481 37,396,353
Noncurrent liabilities:
Long-term debt (Note 13) 254,097,580 223,194,741
Other long-term liabilities (Note 14) 467,719,933 125,019,036
Total noncurrent liabilities 721,817,513 348,213,777
Total liabilities 764,366,994 385,610,130
Net assets:
Unrestricted (293,491,261) 33,404,974
Restricted – non expendable 161,503,198 149,214,755
Restricted – expendable 1,377,518,979 1,178,653,022
Total net assets 1,245,530,916 1,361,272,751
Total liabilities and net assets $2,009,897,910 $1,746,882,881
See accompanying notes to financial statements
3
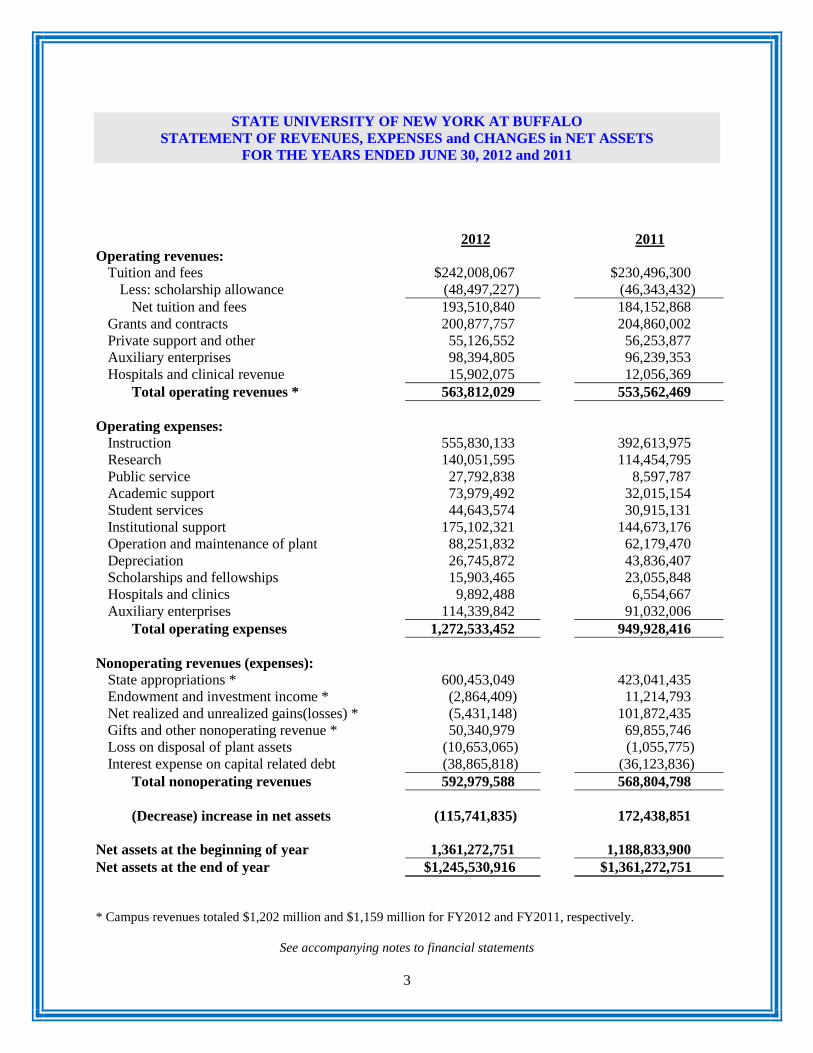
STATE UNIVERSITY OF NEW YORK AT BUFFALO
STATEMENT OF REVENUES, EXPENSES and CHANGES in NET ASSETS
FOR THE YEARS ENDED JUNE 30, 2012 and 2011
2012 2011
Operating revenues:
Tuition and fees $242,008,067 $230,496,300
Less: scholarship allowance (48,497,227) (46,343,432)
Net tuition and fees 193,510,840 184,152,868
Grants and contracts 200,877,757 204,860,002
Private support and other 55,126,552 56,253,877
Auxiliary enterprises 98,394,805 96,239,353
Hospitals and clinical revenue 15,902,075 12,056,369
Total operating revenues * 563,812,029 553,562,469
Operating expenses:
Instruction 555,830,133 392,613,975
Research 140,051,595 114,454,795
Public service 27,792,838 8,597,787
Academic support 73,979,492 32,015,154
Student services 44,643,574 30,915,131
Institutional support 175,102,321 144,673,176
Operation and maintenance of plant 88,251,832 62,179,470
Depreciation 26,745,872 43,836,407
Scholarships and fellowships 15,903,465 23,055,848
Hospitals and clinics 9,892,488 6,554,667
Auxiliary enterprises 114,339,842 91,032,006
Total operating expenses 1,272,533,452 949,928,416
Nonoperating revenues (expenses):
State appropriations * 600,453,049 423,041,435
Endowment and investment income * (2,864,409) 11,214,793
Net realized and unrealized gains(losses) * (5,431,148) 101,872,435
Gifts and other nonoperating revenue * 50,340,979 69,855,746
Loss on disposal of plant assets (10,653,065) (1,055,775)
Interest expense on capital related debt (38,865,818) (36,123,836)
Total nonoperating revenues 592,979,588 568,804,798
(Decrease) increase in net assets (115,741,835) 172,438,851
Net assets at the beginning of year 1,361,272,751 1,188,833,900
Net assets at the end of year $1,245,530,916 $1,361,272,751
* Campus revenues totaled $1,202 million and $1,159 million for FY2012 and FY2011, respectively.
See accompanying notes to financial statements
4
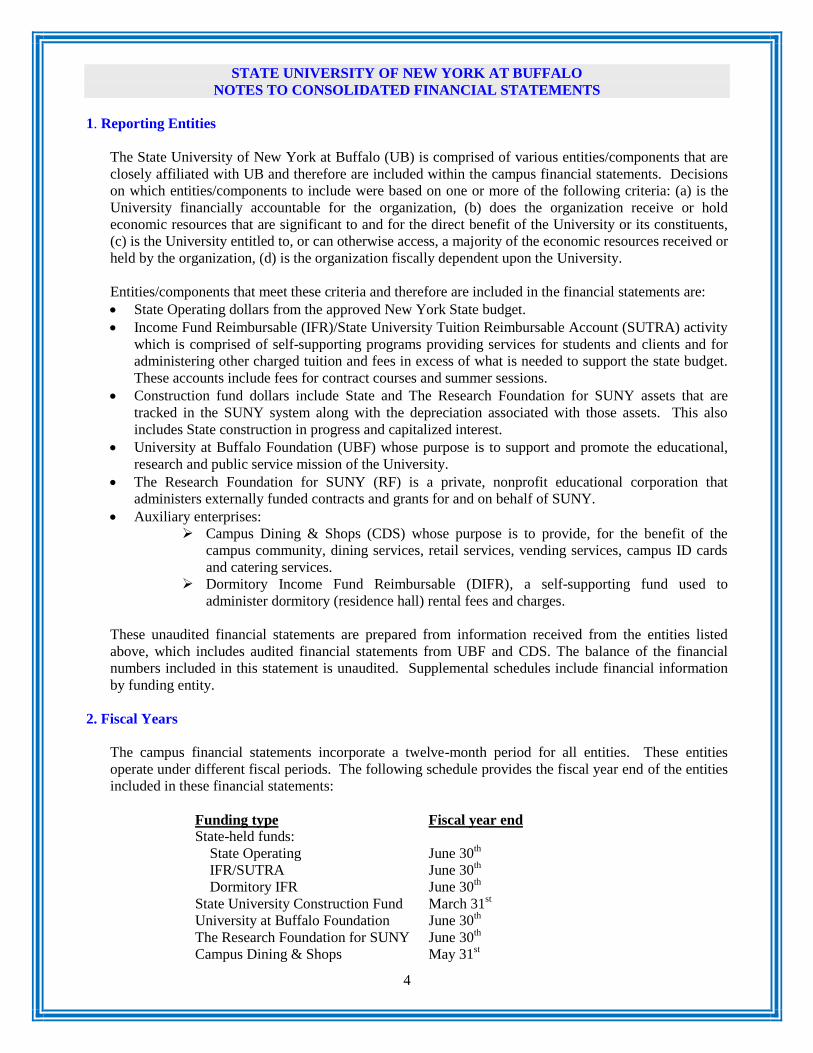
STATE UNIVERSITY OF NEW YORK AT BUFFALO
NOTES TO CONSOLIDATED FINANCIAL STATEMENTS
1. Reporting Entities
The State University of New York at Buffalo (UB) is comprised of various entities/components that are
closely affiliated with UB and therefore are included within the campus financial statements. Decisions
on which entities/components to include were based on one or more of the following criteria: (a) is the
University financially accountable for the organization, (b) does the organization receive or hold
economic resources that are significant to and for the direct benefit of the University or its constituents,
(c) is the University entitled to, or can otherwise access, a majority of the economic resources received or
held by the organization, (d) is the organization fiscally dependent upon the University.
Entities/components that meet these criteria and therefore are included in the financial statements are:
State Operating dollars from the approved New York State budget.
Income Fund Reimbursable (IFR)/State University Tuition Reimbursable Account (SUTRA) activity
which is comprised of self-supporting programs providing services for students and clients and for
administering other charged tuition and fees in excess of what is needed to support the state budget.
These accounts include fees for contract courses and summer sessions.
Construction fund dollars include State and The Research Foundation for SUNY assets that are
tracked in the SUNY system along with the depreciation associated with those assets. This also
includes State construction in progress and capitalized interest.
University at Buffalo Foundation (UBF) whose purpose is to support and promote the educational,
research and public service mission of the University.
The Research Foundation for SUNY (RF) is a private, nonprofit educational corporation that
administers externally funded contracts and grants for and on behalf of SUNY.
Auxiliary enterprises:
Campus Dining & Shops (CDS) whose purpose is to provide, for the benefit of the
campus community, dining services, retail services, vending services, campus ID cards
and catering services.
Dormitory Income Fund Reimbursable (DIFR), a self-supporting fund used to
administer dormitory (residence hall) rental fees and charges.
These unaudited financial statements are prepared from information received from the entities listed
above, which includes audited financial statements from UBF and CDS. The balance of the financial
numbers included in this statement is unaudited. Supplemental schedules include financial information
by funding entity.
2. Fiscal Years
The campus financial statements incorporate a twelve-month period for all entities. These entities
operate under different fiscal periods. The following schedule provides the fiscal year end of the entities
included in these financial statements:
Funding type Fiscal year end
State-held funds:
State Operating June 30th
IFR/SUTRA June 30th
Dormitory IFR June 30th
State University Construction Fund March 31st
University at Buffalo Foundation June 30th
The Research Foundation for SUNY June 30th
Campus Dining & Shops May 31st

5
3. Limitation of Consolidated Campus Financial Statements
Component parts of the campus financial statements have been audited by independent public accounting
firms; however, the consolidation of these statements has not. While an attempt has been made to
eliminate inter-entity transactions to the extent practical, it is possible that there exists some duplication
of financial information that does not materially distort the accuracy of the financial statements.
4. Use of Estimates
In preparing the financial statements certain information was not available either from the State
University Construction Fund or from SUNY System Administration. This required the use of estimates
in order to present the financial statements in conformity with U.S. generally accepted accounting
principles. Actual results could differ from those estimates and will be reflected in next year’s financial
statements.
5. Fringe Benefits
Employee fringe benefits (i.e., health insurance, worker’s compensation, retirement and post-retirement
benefits) are paid by the State on behalf of UB for employees funded through State Operating accounts.
Other State-held funding sources such as IFR and SUTRA along with non-State entities, as outlined in
Note 1, pay their own fringe benefits costs. The fringe benefits amount for UB employees paid by State
Operating funds is calculated by taking the fringe benefits rate which is determined by the State, and
applying it to total eligible personal service and temporary service costs incurred. These imputed costs
are included in the financial statements.
6. Cash and Cash Equivalents
Cash and cash equivalents represent University at Buffalo funds held in the short-term investment pool
(STIP) in the State Treasury or in local depositories by the various entities included in these statements.
The following schedule summarizes cash and cash equivalents by funding source:
2012 2011
State-held funds:
State Operating $878,747 $1,316,165
IFR/SUTRA 55,410,708 72,416,845
Dormitory IFR 7,991,296 5,391,241
The Research Foundation for SUNY 58,405,294 59,831,459
University at Buffalo Foundation 29,484,700 15,563,775
Campus Dining & Shops 6,378,235 5,034,458
Total $158,548,980 $159,553,943
Campus Dining & Shops (CDS) has approximately $230,129 and $249,416 in their agency accounts for
the fiscal years ended June 30, 2012 and 2011, respectively. CDS is the custodian of these funds that
have been raised by various campus units that are associated with, but not controlled by, CDS. Such
funds are disbursed at the instructions of the particular campus unit that controls them.
The Research Foundation for SUNY (RF) has two pools of cash, unrestricted (non-sponsored) and
restricted (sponsored). Unrestricted cash represents the majority of the balance and consists of facilities
and administrative (indirect) cost recovery dollars that were not spent at the end of the fiscal year.
Restricted cash is the consolidated balance of payments to the University by sponsors in excess of
current expenditures for sponsored research projects.
6
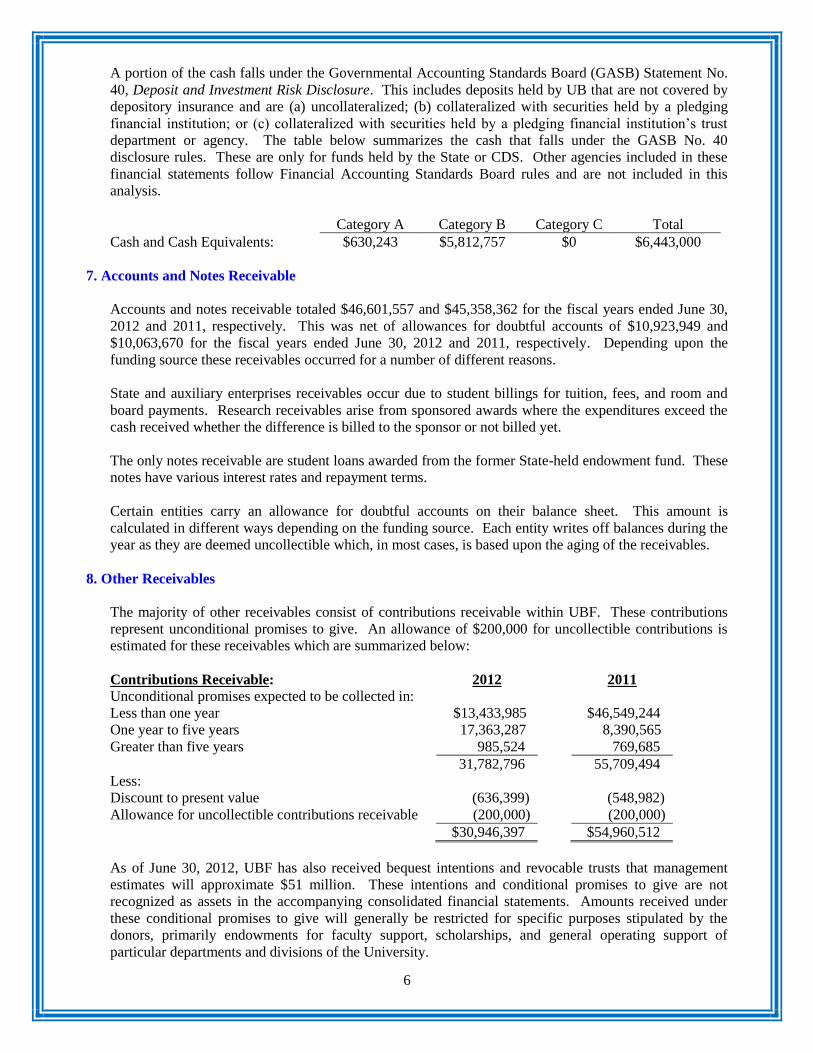
A portion of the cash falls under the Governmental Accounting Standards Board (GASB) Statement No.
40, Deposit and Investment Risk Disclosure. This includes deposits held by UB that are not covered by
depository insurance and are (a) uncollateralized; (b) collateralized with securities held by a pledging
financial institution; or (c) collateralized with securities held by a pledging financial institution’s trust
department or agency. The table below summarizes the cash that falls under the GASB No. 40
disclosure rules. These are only for funds held by the State or CDS. Other agencies included in these
financial statements follow Financial Accounting Standards Board rules and are not included in this
analysis.
Category A Category B Category C Total
Cash and Cash Equivalents: $630,243 $5,812,757 $0 $6,443,000
7. Accounts and Notes Receivable
Accounts and notes receivable totaled $46,601,557 and $45,358,362 for the fiscal years ended June 30,
2012 and 2011, respectively. This was net of allowances for doubtful accounts of $10,923,949 and
$10,063,670 for the fiscal years ended June 30, 2012 and 2011, respectively. Depending upon the
funding source these receivables occurred for a number of different reasons.
State and auxiliary enterprises receivables occur due to student billings for tuition, fees, and room and
board payments. Research receivables arise from sponsored awards where the expenditures exceed the
cash received whether the difference is billed to the sponsor or not billed yet.
The only notes receivable are student loans awarded from the former State-held endowment fund. These
notes have various interest rates and repayment terms.
Certain entities carry an allowance for doubtful accounts on their balance sheet. This amount is
calculated in different ways depending on the funding source. Each entity writes off balances during the
year as they are deemed uncollectible which, in most cases, is based upon the aging of the receivables.
8. Other Receivables
The majority of other receivables consist of contributions receivable within UBF. These contributions
represent unconditional promises to give. An allowance of $200,000 for uncollectible contributions is
estimated for these receivables which are summarized below:
Contributions Receivable: 2012 2011
Unconditional promises expected to be collected in:
Less than one year $13,433,985 $46,549,244
One year to five years 17,363,287 8,390,565
Greater than five years 985,524 769,685
31,782,796 55,709,494
Less:
Discount to present value (636,399) (548,982)
Allowance for uncollectible contributions receivable (200,000) (200,000)
$30,946,397 $54,960,512
As of June 30, 2012, UBF has also received bequest intentions and revocable trusts that management
estimates will approximate $51 million. These intentions and conditional promises to give are not
recognized as assets in the accompanying consolidated financial statements. Amounts received under
these conditional promises to give will generally be restricted for specific purposes stipulated by the
donors, primarily endowments for faculty support, scholarships, and general operating support of
particular departments and divisions of the University.

7
Included in contributions receivable at June 30, 2011 is one bequest receivable in the amount of $40
million, which is restricted for the UB School of Medicine and Biomedical Sciences. This bequest was
collected during fiscal year ended June 30, 2012.
UB has committed Research Foundation (RF) funds to be used for a term loan and extension of credit to
UB Associates Inc. (UBA) with the following terms:
Term loan – The loan is unsecured and in the amount of $11 million. It will be repaid via interest until
May 2012 and then principal and interest from June 2012 through May 2017. The loan’s outstanding
balance was $10.8 million as of June 30, 2012.
Extension of credit – The extension of credit is unsecured and is in the amount of $2.9 million. Its
outstanding balance as of June 30, 2012 was $2.86 million.
9. Endowment and Other Investments
Investments of UB are recorded at fair value with the majority of them being long-term. Investment
income is reported net of investment fees. Realized and unrealized gains and losses are reflected in the
Statement of Revenues, Expenses and Changes in Net Assets.
CDS invests primarily in fixed income securities, which are comprised of income funds. These income
funds are mutual funds, whose purpose is to provide income from investments. The composition of these
investments (excluding cash) is as follows:
June 30, 2012 June 30, 2011
CDS UBF CDS UBF
Repurchase agreement $605,000
Fixed income securities $2,246,402 $123,552,568 4,322,519 $142,024,839
Domestic equity 147,268,119 129,918,557
International equity 1,785,797 140,955,707 86,660 152,283,235
Alternative investments:
Real assets 53,026,427 56,335,960
Venture capital/private equity partnerships 82,292,568 67,368,904
Hedge funds and funds of funds 125,285,848 119,273,624
Other 2,447,012 2,721,033
$4,032,199 $674,828,249 $5,014,179 $669,926,152
The Research Foundation maintains a diverse investment portfolio and with respect to debt instruments,
has a policy of investing primarily in high quality securities. Investments are held with the investment
custodian in the Research Foundation’s name and could not be broken out by campus for these
statements. Therefore, the Research Foundation’s investment balances could not be shown in the asset
section nor could the unrealized or realized gains be recorded in the Statement of Revenues and
Expenses.
10. Inventory
The composition of inventory depends upon the entity being examined. For the entities covered within
these financial statements, inventory consists of food, beverage, store inventory, dental supplies and
chemicals. Inventory is stated at lower of cost (first-in, first-out method) or market.

8
11. Property, Plant and Equipment
Fixed assets are either stated at historical cost if purchased or at fair market value at date of receipt if
acquired by gift. Fixed assets are shown net of accumulated depreciation of $863,289,268 and
$852,820,000 as of June 30, 2012 and 2011, respectively. The majority of the University depreciates its
assets using the straight-line method over the assets estimated useful life. In general, the buildings and
components are depreciated between 25-50 years, capital equipment, furniture, and fixtures lives range
from 4 to 15 years and library acquisitions are depreciated over 10 years.
State Appropriations were affected by an adjustment made to the Property, Plant and Equipment portion
of the balance sheet (State Appropriations are $600 million and $423 million as of June 30, 2012 and
2011, respectively). The offsetting entry to an increase in fixed assets increases the amount of
appropriations received in order to purchase or build the asset.
The State Construction Fund and SUNY’s figures were used in calculating a one-time entry to balance to
SUNY’s financial statement figures for the University. There continues to be a one year lag between the
Property, Plant and Equipment amounts recorded here in these statements due to the availability of the
SUNY figures for our University. SUNY’s numbers are finalized in the spring of the following year,
while the numbers used for these statements are compiled in the fall, after the fiscal year closes (fiscal
year 2011-12 numbers are available in March 2013, so fiscal year 2010-11 numbers are used instead).
A difference was discovered between the balance (net of accumulated depreciation) and SUNY’s figures,
even with the one year lag. The majority of the difference was discovered in the recording of
construction in progress figures (CIP), which increased significantly due to the building of three new
buildings (e.g. Greiner Hall, Davis Hall, Kapoor Hall) over the past few fiscal years.
12. Other Assets
Fine art collections are included within the other assets reported in the financial statements and are
valued at $9,854,042 and $9,582,813 for the fiscal years ended June 30, 2012 and 2011, respectively.
These assets make up the majority of the University’s other assets.
13. Long-term liabilities
The University at Buffalo and its affiliated entities have entered into several debt obligations to finance
various capital facilities or large equipment purchases. Total long-term and short-term obligations are
summarized below:
2012 2011
Campus Dining & Shops (CDS)
Industrial Development Agency bonds payable in annual
installments ranging from $405,000 to $1,120,000 through
April 1, 2017, plus interest ranging from 4.50% to 5.75%.
Secured by property and equipment located at Ellicott
Residential Complex with a net book value of $2,007,382 at
May 31, 2011. Fully paid in 2012 – see below. - $3,350,000
Note payable to a bank in monthly installments of principal and
interest of $53,454, based on a fixed interest rate of 2.62%
through April 2017. This note is secured by investments with a
net book value of $2,906,797. $2,952,878 -

9
2012 2011
University at Buffalo Foundation (UBF)
Village of Kenmore Housing Authority bonds payable in
monthly installments of $47,516 through January 2028,
including interest at 4.95%. (Flickinger Project) 6,154,224 6,407,734
Town of Amherst Industrial Development Agency bonds
payable in annual principal installments that escalate through
maturity in August 2031, plus interest ranging from 4.30% to
5.25% adjusted annually, net of discount of $72,184 in 2012
and $75,950 in 2011. (Flint Village Projects) – see subsequent
events notes. 22,142,816 22,769,050
Town of Amherst Industrial Development Agency bonds
payable in annual principal installments that escalate through
maturity in August 2032, plus interest ranging from 3.00% to
5.00% adjusted annually, net of discount of $115,343 in 2012
and $121,062 in 2011. (Creekside Village Projects) – see
subsequent events notes. 11,899,657 12,223,938
Town of Amherst Development Corporation bonds payable in
annual principal installments that escalate through maturity in
October 2045, plus interest ranging from 3.00% to 5.00%
adjusted annually, net of discount of $13,438 in 2012 and net of
premiums of $1,465 in 2011. (Greiner Hall Project and Hadley
Village Refunding) 81,781,563 82,593,535
Town of Amherst Development Corporation bonds payable in
annual principal installments that escalate through maturity in
October 2035 plus variable rate of interest. Interest rates
ranged from 0.04% to 0.28% and 0.06% to 0.26% for the years
ended June 30, 2012 and 2011, respectively. (South Lake
Village) 23,510,000 23,975,000
Town of Amherst Development Corporation bonds payable in
monthly principal installments that escalate through maturity in
August 2042 plus variable rate of interest. The interest rate
from the date of issuance through June 30, 2012 was 1.56%
(Flint Village and Creekside Village Refunding) - see
subsequent events notes. 32,465,000 -
Operating Line of Credit payable on demand and bearing
interest at 1.5% below the bank’s prime rate, (1.75% at June 30,
2012 and June 30, 2011). 25,000,000 21,022,983
State
NYPA Phase I Chillers loan payable in monthly installments of
$16,100 through maturity May 2016. Variable interest rate,
0.88% for 2011-12 and 0.51% for 2010-11. 749,499 937,758
NYPA Phase II HVAC and outdoor lighting loan payable in
monthly installments of $28,245 through maturity January
2022. Variable interest rate, 0.88% in 2011-12. 3,144,879 -
Dorm Rehab projects – various dormitory projects through
Dormitory Authority of the State of New York (DASNY) bond
or revolving loans with the Dormitory Authority. Maturity of
these borrowings end in June 2031 with varying interest rates. 53,166,926 56,758,038
Total debt obligations
Current portion of long-term debt
Long-term debt
$262,967,442
(8,869,862)
$254,097,580
$230,038,036
(6,843,295)
$223,194,741
10
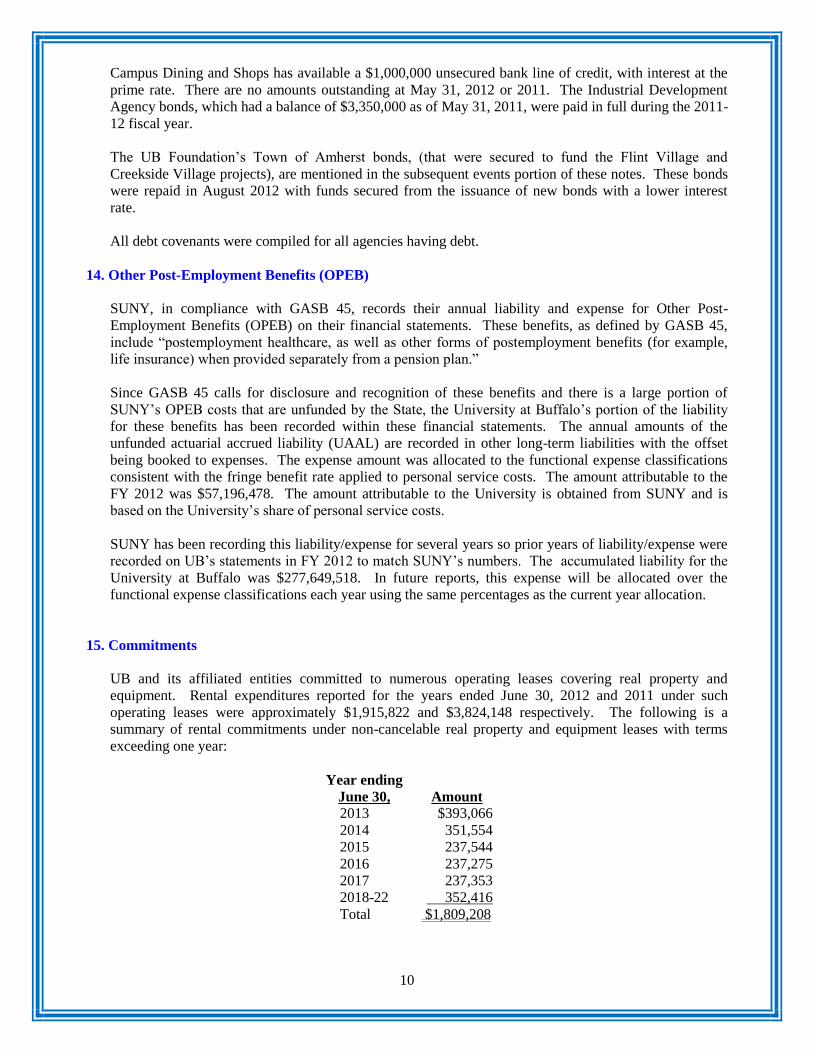
Campus Dining and Shops has available a $1,000,000 unsecured bank line of credit, with interest at the
prime rate. There are no amounts outstanding at May 31, 2012 or 2011. The Industrial Development
Agency bonds, which had a balance of $3,350,000 as of May 31, 2011, were paid in full during the 2011-
12 fiscal year.
The UB Foundation’s Town of Amherst bonds, (that were secured to fund the Flint Village and
Creekside Village projects), are mentioned in the subsequent events portion of these notes. These bonds
were repaid in August 2012 with funds secured from the issuance of new bonds with a lower interest
rate.
All debt covenants were compiled for all agencies having debt.
14. Other Post-Employment Benefits (OPEB)
SUNY, in compliance with GASB 45, records their annual liability and expense for Other Post-
Employment Benefits (OPEB) on their financial statements. These benefits, as defined by GASB 45,
include “postemployment healthcare, as well as other forms of postemployment benefits (for example,
life insurance) when provided separately from a pension plan.”
Since GASB 45 calls for disclosure and recognition of these benefits and there is a large portion of
SUNY’s OPEB costs that are unfunded by the State, the University at Buffalo’s portion of the liability
for these benefits has been recorded within these financial statements. The annual amounts of the
unfunded actuarial accrued liability (UAAL) are recorded in other long-term liabilities with the offset
being booked to expenses. The expense amount was allocated to the functional expense classifications
consistent with the fringe benefit rate applied to personal service costs. The amount attributable to the
FY 2012 was $57,196,478. The amount attributable to the University is obtained from SUNY and is
based on the University’s share of personal service costs.
SUNY has been recording this liability/expense for several years so prior years of liability/expense were
recorded on UB’s statements in FY 2012 to match SUNY’s numbers. The accumulated liability for the
University at Buffalo was $277,649,518. In future reports, this expense will be allocated over the
functional expense classifications each year using the same percentages as the current year allocation.
15. Commitments
UB and its affiliated entities committed to numerous operating leases covering real property and
equipment. Rental expenditures reported for the years ended June 30, 2012 and 2011 under such
operating leases were approximately $1,915,822 and $3,824,148 respectively. The following is a
summary of rental commitments under non-cancelable real property and equipment leases with terms
exceeding one year:
Year ending
June 30,
Amount
2013 $393,066
2014 351,554
2015 237,544
2016 237,275
2017 237,353
2018-22 352,416
Total $1,809,208
11
The above schedule does not include The Research Foundation for SUNY. Their rental payments
amounted to $360,818 and $550,625 for the fiscal years ended June 30, 2012 and 2011, respectively.
Any amounts paid between State and UBF have been eliminated.
16. Subsequent Events
In August 2012, UBF Faculty-Student Housing Corporation, used funds obtained from the June 2012
issuance of Flint Village and Creekside Village Refunding Bonds, to repay the remaining principal
balances of the original Flint Village and Creekside Village bonds. The new bonds payable amounted to
$32,465,000 and payments began on those bonds in the 2012-13 fiscal year. The combined bonds that
were repaid in August 2012 amounted to $34 million at June 30, 2012.
Campus Dining and Shops (CDS) has entered into contracts for the construction and renovation of a
dining facility. The total cost of this project is anticipated to be approximately $11.5 million and the
project is expected to be completed in November of 2012. CDS anticipates financing the project with
$10 million of long-term debt and $1.5 million of operating cash.
In January 2012 a letter of intent was sent to Buffalo Archives LLC outlining UB’s intent to purchase the
Buffalo Archives library storage building on Rensch Road. The purchase of this facility will cost
approximately $4 million which will be paid out of the University’s IFR accounts. This transaction will
save the University nearly $5 million over the next 15 years. As of the timing of these statements, this
transaction was to take place in December 2012.
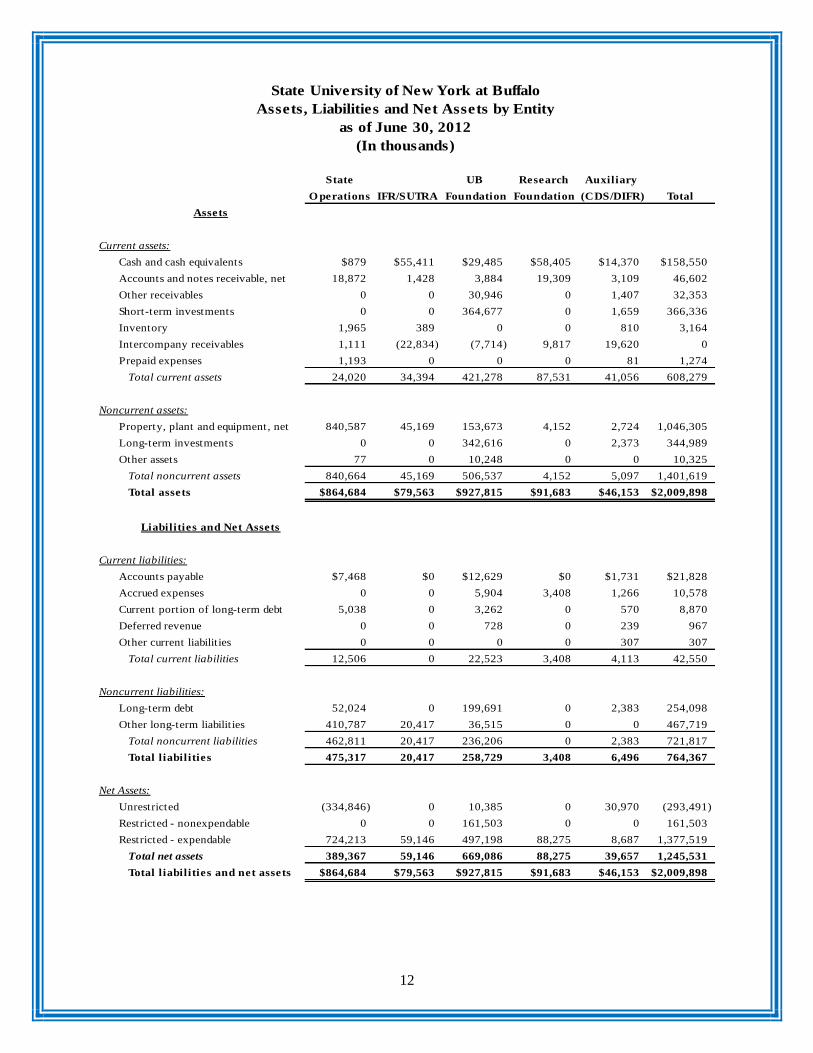
12
State UB Research Auxiliary
O perations IFR/SUTRA Foundation Foundation (CDS/DIFR) Total
Assets
Current assets:
Cash and cash equivalents $879 $55,411 $29,485 $58,405 $14,370 $158,550
Accounts and notes receivable, net 18,872 1,428 3,884 19,309 3,109 46,602
Other receivables 0 0 30,946 0 1,407 32,353
Short-term investments 0 0 364,677 0 1,659 366,336
Inventory 1,965 389 0 0 810 3,164
Intercompany receivables 1,111 (22,834) (7,714) 9,817 19,620 0
Prepaid expenses 1,193 0 0 0 81 1,274
Total current assets 24,020 34,394 421,278 87,531 41,056 608,279
Noncurrent assets:
Property, plant and equipment, net 840,587 45,169 153,673 4,152 2,724 1,046,305
Long-term investments 0 0 342,616 0 2,373 344,989
Other assets 77 0 10,248 0 0 10,325
Total noncurrent assets 840,664 45,169 506,537 4,152 5,097 1,401,619
Total assets $864,684 $79,563 $927,815 $91,683 $46,153 $2,009,898
Liabilities and Net Assets
Current liabilities:
Accounts payable $7,468 $0 $12,629 $0 $1,731 $21,828
Accrued expenses 0 0 5,904 3,408 1,266 10,578
Current portion of long-term debt 5,038 0 3,262 0 570 8,870
Deferred revenue 0 0 728 0 239 967
Other current liabilit ies 0 0 0 0 307 307
Total current liabilities 12,506 0 22,523 3,408 4,113 42,550
Noncurrent liabilities:
Long-term debt 52,024 0 199,691 0 2,383 254,098
Other long-term liabilit ies 410,787 20,417 36,515 0 0 467,719
Total noncurrent liabilities 462,811 20,417 236,206 0 2,383 721,817
Total liabilities 475,317 20,417 258,729 3,408 6,496 764,367
Net Assets:
Unrestricted (334,846) 0 10,385 0 30,970 (293,491)
Restricted - nonexpendable 0 0 161,503 0 0 161,503
Restricted - expendable 724,213 59,146 497,198 88,275 8,687 1,377,519
Total net assets 389,367 59,146 669,086 88,275 39,657 1,245,531
Total liabilities and net assets $864,684 $79,563 $927,815 $91,683 $46,153 $2,009,898
State University of New York at Buffalo
Assets, Liabilities and Net Assets by Entity
as of June 30, 2012
(In thousands)
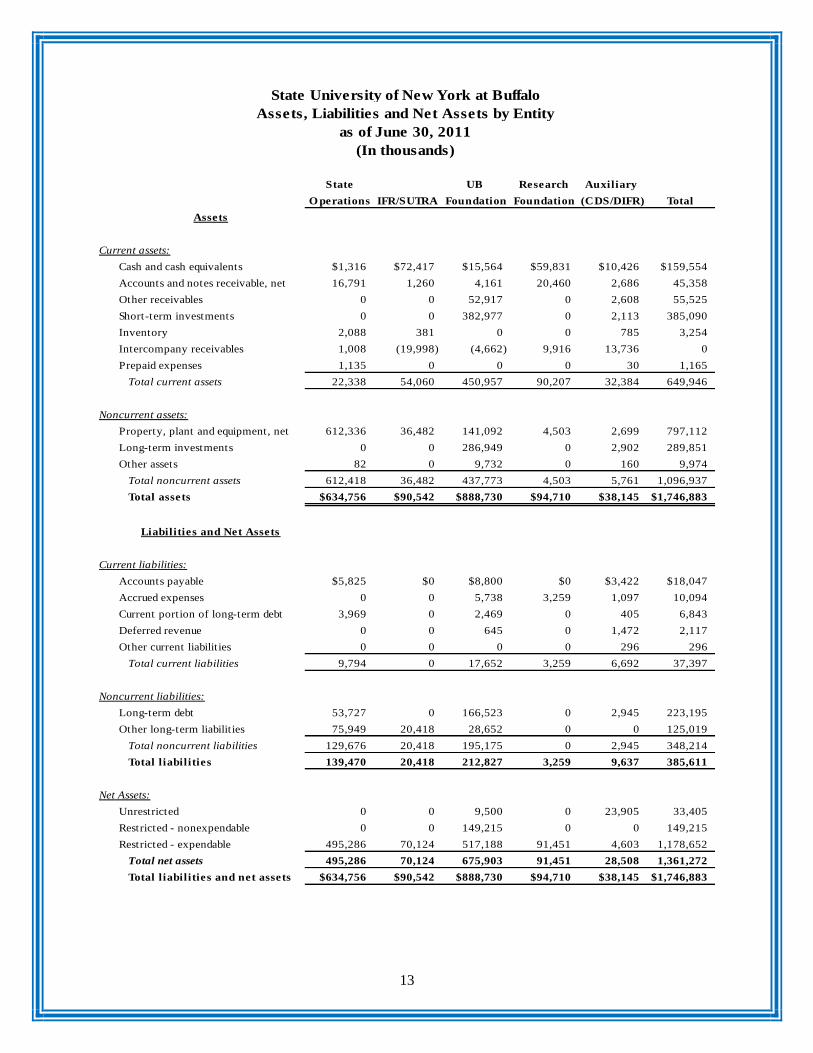
13
State UB Research Auxiliary
O perations IFR/SUTRA Foundation Foundation (CDS/DIFR) Total
Assets
Current assets:
Cash and cash equivalents $1,316 $72,417 $15,564 $59,831 $10,426 $159,554
Accounts and notes receivable, net 16,791 1,260 4,161 20,460 2,686 45,358
Other receivables 0 0 52,917 0 2,608 55,525
Short-term investments 0 0 382,977 0 2,113 385,090
Inventory 2,088 381 0 0 785 3,254
Intercompany receivables 1,008 (19,998) (4,662) 9,916 13,736 0
Prepaid expenses 1,135 0 0 0 30 1,165
Total current assets 22,338 54,060 450,957 90,207 32,384 649,946
Noncurrent assets:
Property, plant and equipment, net 612,336 36,482 141,092 4,503 2,699 797,112
Long-term investments 0 0 286,949 0 2,902 289,851
Other assets 82 0 9,732 0 160 9,974
Total noncurrent assets 612,418 36,482 437,773 4,503 5,761 1,096,937
Total assets $634,756 $90,542 $888,730 $94,710 $38,145 $1,746,883
Liabilities and Net Assets
Current liabilities:
Accounts payable $5,825 $0 $8,800 $0 $3,422 $18,047
Accrued expenses 0 0 5,738 3,259 1,097 10,094
Current portion of long-term debt 3,969 0 2,469 0 405 6,843
Deferred revenue 0 0 645 0 1,472 2,117
Other current liabilit ies 0 0 0 0 296 296
Total current liabilities 9,794 0 17,652 3,259 6,692 37,397
Noncurrent liabilities:
Long-term debt 53,727 0 166,523 0 2,945 223,195
Other long-term liabilit ies 75,949 20,418 28,652 0 0 125,019
Total noncurrent liabilities 129,676 20,418 195,175 0 2,945 348,214
Total liabilities 139,470 20,418 212,827 3,259 9,637 385,611
Net Assets:
Unrestricted 0 0 9,500 0 23,905 33,405
Restricted - nonexpendable 0 0 149,215 0 0 149,215
Restricted - expendable 495,286 70,124 517,188 91,451 4,603 1,178,652
Total net assets 495,286 70,124 675,903 91,451 28,508 1,361,272
Total liabilities and net assets $634,756 $90,542 $888,730 $94,710 $38,145 $1,746,883
State University of New York at Buffalo
Assets, Liabilities and Net Assets by Entity
as of June 30, 2011
(In thousands)
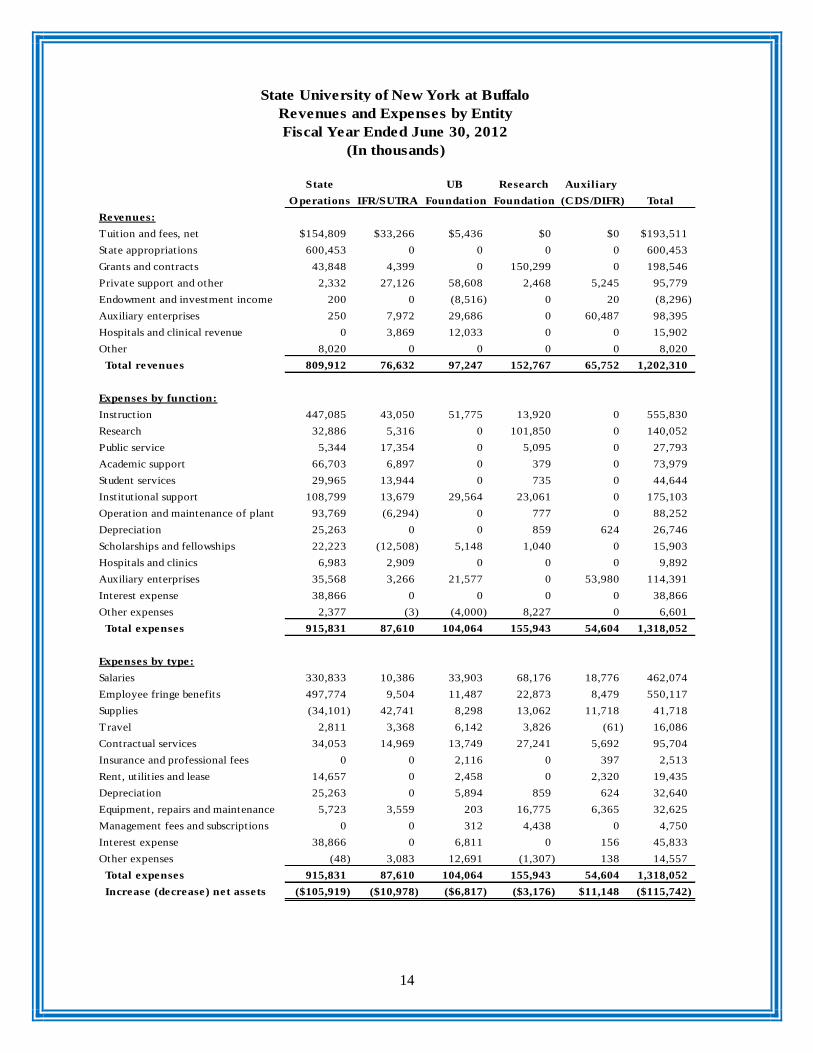
14
State UB Research Auxiliary
O perations IFR/SUTRA Foundation Foundation (CDS/DIFR) Total
Revenues:
Tuition and fees, net $154,809 $33,266 $5,436 $0 $0 $193,511
State appropriations 600,453 0 0 0 0 600,453
Grants and contracts 43,848 4,399 0 150,299 0 198,546
Private support and other 2,332 27,126 58,608 2,468 5,245 95,779
Endowment and investment income 200 0 (8,516) 0 20 (8,296)
Auxiliary enterprises 250 7,972 29,686 0 60,487 98,395
Hospitals and clinical revenue 0 3,869 12,033 0 0 15,902
Other 8,020 0 0 0 0 8,020
Total revenues 809,912 76,632 97,247 152,767 65,752 1,202,310
Expenses by function:
Instruction 447,085 43,050 51,775 13,920 0 555,830
Research 32,886 5,316 0 101,850 0 140,052
Public service 5,344 17,354 0 5,095 0 27,793
Academic support 66,703 6,897 0 379 0 73,979
Student services 29,965 13,944 0 735 0 44,644
Institutional support 108,799 13,679 29,564 23,061 0 175,103
Operation and maintenance of plant 93,769 (6,294) 0 777 0 88,252
Depreciation 25,263 0 0 859 624 26,746
Scholarships and fellowships 22,223 (12,508) 5,148 1,040 0 15,903
Hospitals and clinics 6,983 2,909 0 0 0 9,892
Auxiliary enterprises 35,568 3,266 21,577 0 53,980 114,391
Interest expense 38,866 0 0 0 0 38,866
Other expenses 2,377 (3) (4,000) 8,227 0 6,601
Total expenses 915,831 87,610 104,064 155,943 54,604 1,318,052
Expenses by type:
Salaries 330,833 10,386 33,903 68,176 18,776 462,074
Employee fringe benefits 497,774 9,504 11,487 22,873 8,479 550,117
Supplies (34,101) 42,741 8,298 13,062 11,718 41,718
Travel 2,811 3,368 6,142 3,826 (61) 16,086
Contractual services 34,053 14,969 13,749 27,241 5,692 95,704
Insurance and professional fees 0 0 2,116 0 397 2,513
Rent, utilit ies and lease 14,657 0 2,458 0 2,320 19,435
Depreciation 25,263 0 5,894 859 624 32,640
Equipment, repairs and maintenance 5,723 3,559 203 16,775 6,365 32,625
Management fees and subscriptions 0 0 312 4,438 0 4,750
Interest expense 38,866 0 6,811 0 156 45,833
Other expenses (48) 3,083 12,691 (1,307) 138 14,557
Total expenses 915,831 87,610 104,064 155,943 54,604 1,318,052
Increase (decrease) net assets ($105,919) ($10,978) ($6,817) ($3,176) $11,148 ($115,742)
State University of New York at Buffalo
Revenues and Expenses by Entity
Fiscal Year Ended June 30, 2012
(In thousands)
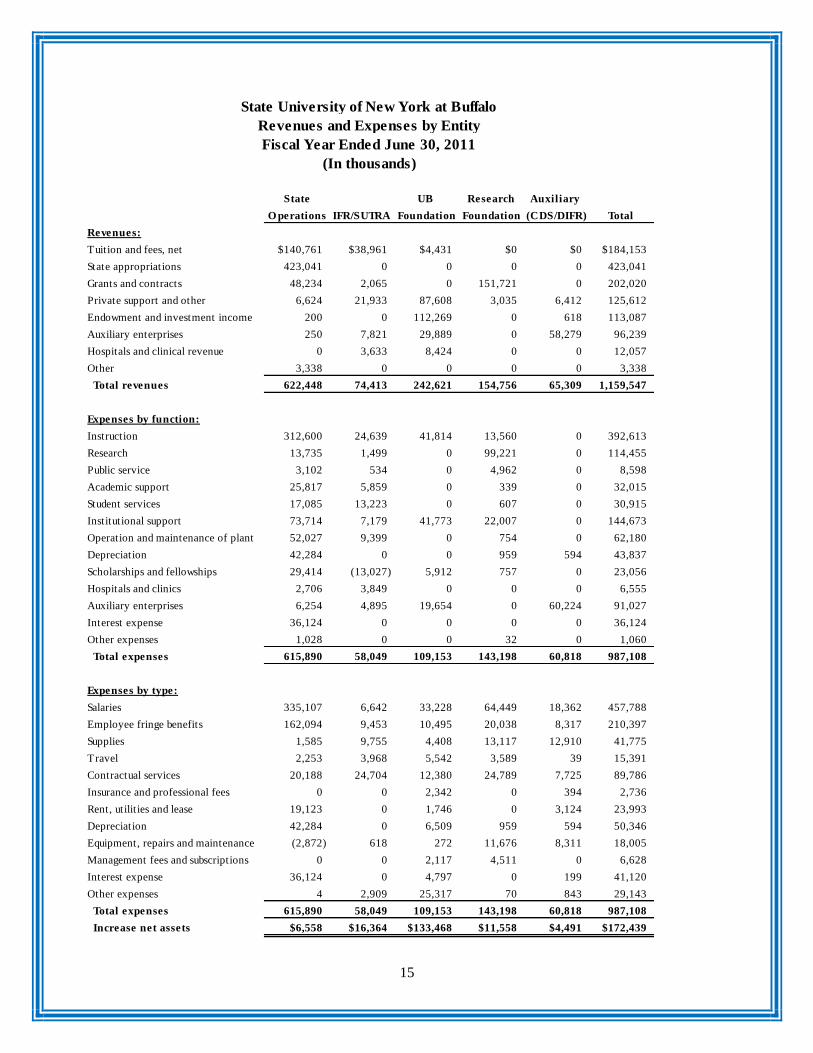
15
State UB Research Auxiliary
O perations IFR/SUTRA Foundation Foundation (CDS/DIFR) Total
Revenues:
Tuition and fees, net $140,761 $38,961 $4,431 $0 $0 $184,153
State appropriations 423,041 0 0 0 0 423,041
Grants and contracts 48,234 2,065 0 151,721 0 202,020
Private support and other 6,624 21,933 87,608 3,035 6,412 125,612
Endowment and investment income 200 0 112,269 0 618 113,087
Auxiliary enterprises 250 7,821 29,889 0 58,279 96,239
Hospitals and clinical revenue 0 3,633 8,424 0 0 12,057
Other 3,338 0 0 0 0 3,338
Total revenues 622,448 74,413 242,621 154,756 65,309 1,159,547
Expenses by function:
Instruction 312,600 24,639 41,814 13,560 0 392,613
Research 13,735 1,499 0 99,221 0 114,455
Public service 3,102 534 0 4,962 0 8,598
Academic support 25,817 5,859 0 339 0 32,015
Student services 17,085 13,223 0 607 0 30,915
Institutional support 73,714 7,179 41,773 22,007 0 144,673
Operation and maintenance of plant 52,027 9,399 0 754 0 62,180
Depreciation 42,284 0 0 959 594 43,837
Scholarships and fellowships 29,414 (13,027) 5,912 757 0 23,056
Hospitals and clinics 2,706 3,849 0 0 0 6,555
Auxiliary enterprises 6,254 4,895 19,654 0 60,224 91,027
Interest expense 36,124 0 0 0 0 36,124
Other expenses 1,028 0 0 32 0 1,060
Total expenses 615,890 58,049 109,153 143,198 60,818 987,108
Expenses by type:
Salaries 335,107 6,642 33,228 64,449 18,362 457,788
Employee fringe benefits 162,094 9,453 10,495 20,038 8,317 210,397
Supplies 1,585 9,755 4,408 13,117 12,910 41,775
Travel 2,253 3,968 5,542 3,589 39 15,391
Contractual services 20,188 24,704 12,380 24,789 7,725 89,786
Insurance and professional fees 0 0 2,342 0 394 2,736
Rent, utilit ies and lease 19,123 0 1,746 0 3,124 23,993
Depreciation 42,284 0 6,509 959 594 50,346
Equipment, repairs and maintenance (2,872) 618 272 11,676 8,311 18,005
Management fees and subscriptions 0 0 2,117 4,511 0 6,628
Interest expense 36,124 0 4,797 0 199 41,120
Other expenses 4 2,909 25,317 70 843 29,143
Total expenses 615,890 58,049 109,153 143,198 60,818 987,108
Increase net assets $6,558 $16,364 $133,468 $11,558 $4,491 $172,439
State University of New York at Buffalo
Revenues and Expenses by Entity
Fiscal Year Ended June 30, 2011
(In thousands)

Prepared by Financial Services, a division of University Business Services