unilever annual report 2013 we make reference to unilever’s and other third-party websites, and to...
TRANSCRIPT
DISCLAIMER
NOTES TO THE ANNUAL REPORT AND ACCOUNTS This PDF version of the Unilever Annual Report and Accounts 2013 is an exact copy of the printed document provided to Unilever’s shareholders.
Certain sections of the Unilever Annual Report and Accounts 2013 have been audited. These are on pages 90 to 135, 137 to 141, 143 to 145, and those parts noted as audited within the Directors’ Remuneration Report on pages 73 to 81.
The maintenance and integrity of the Unilever website is the responsibility of the Directors; the work carried out by the auditors does not involve consideration of these matters. Accordingly, the auditors accept no responsibility for any changes that may have occurred to the financial statements since they were initially placed on the website.
Legislation in the United Kingdom and the Netherlands governing the preparation and dissemination of financial statements may differ from legislation in other jurisdictions.
DISCLAIMER Except where you are a shareholder, this material is provided for information purposes only and is not, in particular, intended to confer any legal rights on you.
This Annual Report and Accounts does not constitute an invitation to invest in Unilever shares. Any decisions you make in reliance on this information are solely your responsibility.
The information is given as of the dates specified, is not updated, and any forward-looking statements are made subject to the reservations specified on the final page of the Report.
Unilever accepts no responsibility for any information on other websites that may be accessed from this site by hyperlinks.
UNILEVERAN
NUAL REPORT AN
D ACCOUNTS 2013
Making sustainable living com
monplace
ANNUAL REPORT AND ACCOUNTS 2013
MAKING SUSTAINABLE LIVING COMMONPLACE
PROJECT SUNLIGHT: HELPING TO CREATE A BRIGHTER FUTURE
We believe there has never been a better time to create a better future for our children. A world where no child goes to bed hungry, where every home has clean drinking water and where preventable diseases become a thing of the past. Project Sunlight brings together the work of our brands to help as many people as possible take small sustainable steps that add up to building a world where everyone lives well and within the natural limits of the planet.
Get involved at:www.projectsunlight.com
UNILEVER N.V.Weena 455, PO Box 760 3000 DK Rotterdam The Netherlands T +31 (0)10 217 4000 F +31 (0)10 217 4798
Commercial Register Rotterdam Number: 24051830
UNILEVER PLC100 Victoria Embankment London EC4Y 0DY United Kingdom T +44 (0)20 7822 5252 F +44 (0)20 7822 5951
UNILEVER PLC REGISTERED OFFICEUnilever PLC Port Sunlight Wirral Merseyside CH62 4ZD United Kingdom
Registered in England and Wales Company Number: 41424
For further information on our social, economic and environmental performance, please visit our website:
WWW.UNILEVER.COM

OUR PURPOSE TO MAKE SUSTAINABLE LIVING COMMONPLACEWe work to create a better future every day, with brands and services that help people feel good, look good and get more out of life.
Our first priority is to our consumers – then customers, employees, suppliers and communities. When we fulfil our responsibilities to them, we believe that our shareholders will be rewarded.
UNILEVER SUSTAINABLE LIVING PLAN (USLP)Our Annual Report and Accounts 2013 will be complemented by the online Unilever Sustainable Living Report for 2013 to be published in April 2014. This will detail performance against our USLP targets for the period 1 January to 31 December 2013 except where indicated otherwise. The online report will also cover the scope of our assurance programme and a wealth of information on our approach to running a responsible business.
See www.unilever.com/sustainable-living
OTHER INFORMATIONThe brand names shown in this report are trademarks owned by or licensed to companies within the Unilever Group. This report contains certain statements that are neither reported financial results nor other historical information. These statements are forward-looking statements, including within the meaning of the United States Private Securities Litigation Reform Act of 1995. Actual results may differ materially from those disclosed in our forward-looking statements. For a description of factors that could affect future results, reference should be made to the full ‘Cautionary statement’ on the inside back cover and to the section entitled ‘Risks’ on pages 34 to 39.
For information about our non-GAAP measures, see pages 32 and 33. In this report we make reference to Unilever’s and other third-party websites, and to social media sites. Information on websites and/or social media sites is not incorporated herein and does not form part of this document. This report comprises regulated information within the meaning of sections 1:1 and 5:25c of the Act on Financial Supervision (“Wet op het financieel toezicht (Wft)”) in the Netherlands.
CAUTIONARY STATEMENTThis document may contain forward-looking statements, including ‘forward-looking statements’ within the meaning of the United States Private Securities Litigation Reform Act of 1995. Words such as ‘will’, ‘aim’, ‘expects’, ‘anticipates’, ‘intends’, ‘looks’, ‘believes’, ‘vision’, or the negative of these terms and other similar expressions of future performance or results, and their negatives, are intended to identify such forward-looking statements. These forward-looking statements are based upon current expectations and assumptions regarding anticipated developments and other factors affecting the Group. They are not historical facts, nor are they guarantees of future performance.
Because these forward-looking statements involve risks and uncertainties, there are important factors that could cause actual results to differ materially from those expressed or implied by these forward-looking statements. Among other risks and uncertainties, the material or principal factors which cause actual results to differ materially are: Unilever’s global brands not meeting consumer preferences; Unilever’s ability to innovate and remain competitive; Unilever’s investment choices in its portfolio management; inability to find sustainable solutions to support long-term growth; customer relationships; the recruitment and retention of talented employees; disruptions in our supply chain; the cost of raw materials and commodities; the production of safe and high quality products; secure and reliable IT infrastructure; successful execution of acquisitions, divestitures and business transformation projects; economic and political risks and natural disasters; financial risks; failure to meet high and ethical standards; and managing regulatory, tax and legal matters. Further details of potential risks and uncertainties affecting the Group are described in the Group’s filings with the London Stock Exchange, Euronext Amsterdam and the US Securities and Exchange Commission, including in the Group’s Annual Report on Form 20-F for the year ended 31 December 2013 and the Annual Report and Accounts 2013. These forward-looking statements speak only as of the date of this document. Except as required by any applicable law or regulation, the Group expressly disclaims any obligation or undertaking to release publicly any updates or revisions to any forward-looking statements contained herein to reflect any change in the Group’s expectations with regard thereto or any change in events, conditions or circumstances on which any such statement is based.
This document is not prepared in accordance with US GAAP and should not therefore be relied upon by readers as such. The Group’s Annual Report on Form 20-F for 2013 is separately filed with the US Securities and Exchange Commission and is available on our corporate website www.unilever.com. Any information on or linked from our or third-party websites is not incorporated by reference into this document or the Annual Report on Form 20-F. In addition, a printed copy of the Annual Report on Form 20-F is available, free of charge, upon request to Unilever, Investor Relations Department, 100 Victoria Embankment, London EC4Y 0DY, United Kingdom.
Designed and produced by Unilever Communications in conjunction with Addison Group at www.addison-group.net.
Photography by Samuel Olusegun Ajayi, Oliver Edwards, Igor Emmerich, Philip Gatward, Joseph Marcantonio, Chris Moyse, Gandhi Prabowo, Elise Romany, Rian Ardi Wakito, Jessie Watford, Yan Zhen, Na Lata (Brazil), The Edge Picture Company, The Pack Shot Company and from the Unilever image library and content hub.
Printed at Pureprint Group, ISO 14001. FSC® certified and CarbonNeutral®.
This document forms part of the Unilever Annual Report and Accounts 2013 suite of documents and is printed on Amadeus 100% Recycled Silk and Offset. These papers have been exclusively supplied by Denmaur Independent Papers which has offset the carbon produced by the production and delivery of them to the printer.
These papers are 100% recycled and manufactured using de-inked post-consumer waste. All of the pulp is bleached using an elemental chlorine free process (ECF). Printed in the UK by Pureprint using its alcofree® and pureprint® environmental printing technology. Vegetable inks were used throughout. Pureprint is a CarbonNeutral® company. Both the manufacturing mill and the printer are registered to the Environmental Management System ISO 14001 and are Forest Stewardship Council® (FSC) chain-of-custody certified. If you have finished with this document and no longer wish to retain it, please pass it on to other interested readers or dispose of it in your recycled paper waste. Thank you.
REDUCEENVIRONMENTAL
FOOTPRINT
DOUBLE THEBUSINESS
POSITIVESOCIAL IMPACT
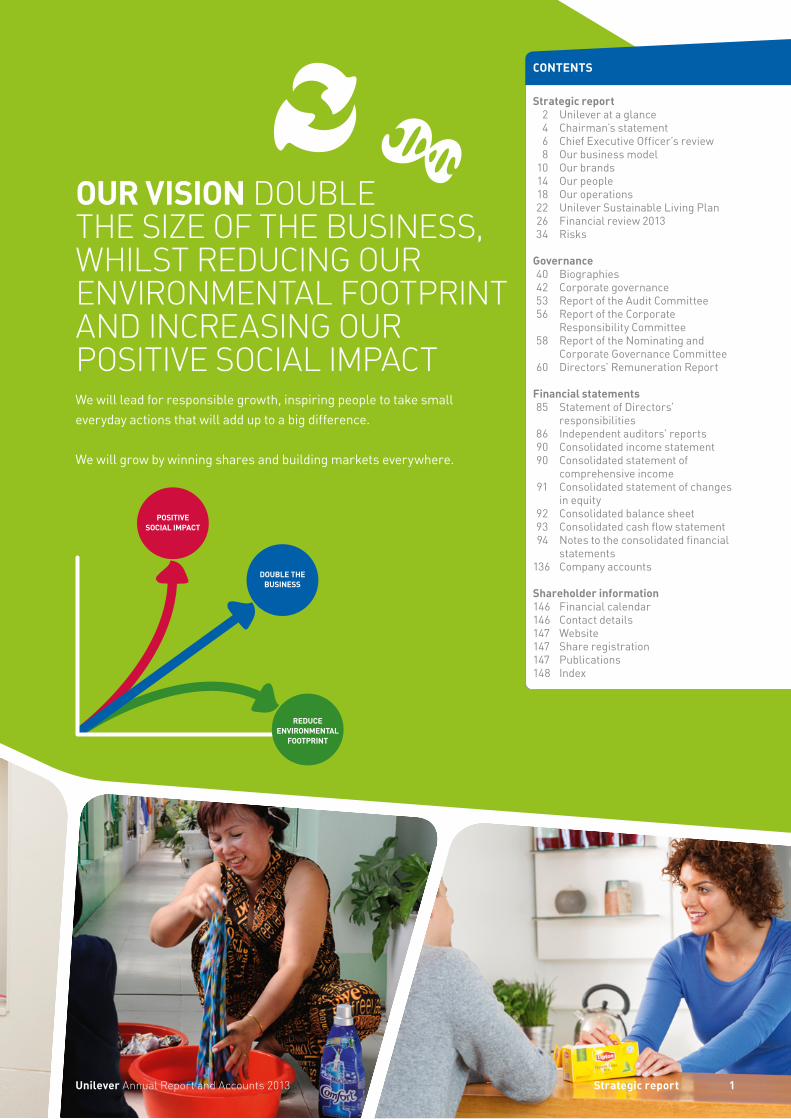
OUR VISION DOUBLE THE SIZE OF THE BUSINESS, WHILST REDUCING OUR ENVIRONMENTAL FOOTPRINT AND INCREASING OUR POSITIVE SOCIAL IMPACTWe will lead for responsible growth, inspiring people to take small everyday actions that will add up to a big difference.
We will grow by winning shares and building markets everywhere.
1Strategic reportUnilever Annual Report and Accounts 2013
CONTENTS
Strategic report 2 Unilever at a glance 4 Chairman’s statement 6 Chief Executive Officer’s review 8 Our business model 10 Our brands 14 Our people 18 Our operations 22 Unilever Sustainable Living Plan 26 Financial review 2013 34 Risks
Governance 40 Biographies 42 Corporate governance 53 Report of the Audit Committee 56 Report of the Corporate
Responsibility Committee 58 Report of the Nominating and
Corporate Governance Committee 60 Directors’ Remuneration Report
Financial statements 85 Statement of Directors’
responsibilities 86 Independent auditors’ reports 90 Consolidated income statement 90 Consolidated statement of
comprehensive income 91 Consolidated statement of changes
in equity 92 Consolidated balance sheet 93 Consolidated cash flow statement 94 Notes to the consolidated financial
statements 136 Company accounts
Shareholder information 146 Financial calendar 146 Contact details 147 Website 147 Share registration 147 Publications 148 Index
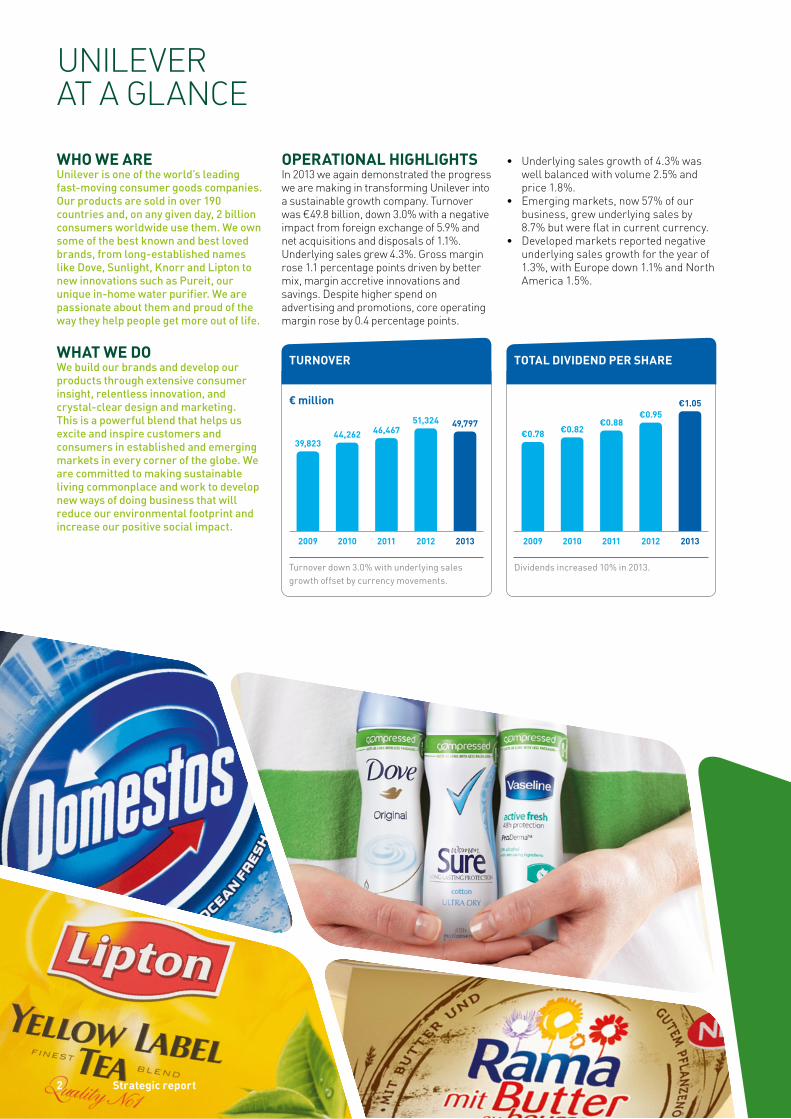
20132012201120102009
49,79751,32446,46744,262
39,823
20132012201120102009
€1.05€0.95
€0.88€0.82€0.78
WHO WE AREUnilever is one of the world’s leading fast-moving consumer goods companies. Our products are sold in over 190 countries and, on any given day, 2 billion consumers worldwide use them. We own some of the best known and best loved brands, from long-established names like Dove, Sunlight, Knorr and Lipton to new innovations such as Pureit, our unique in-home water purifier. We are passionate about them and proud of the way they help people get more out of life.
WHAT WE DOWe build our brands and develop our products through extensive consumer insight, relentless innovation, and crystal-clear design and marketing. This is a powerful blend that helps us excite and inspire customers and consumers in established and emerging markets in every corner of the globe. We are committed to making sustainable living commonplace and work to develop new ways of doing business that will reduce our environmental footprint and increase our positive social impact.
OPERATIONAL HIGHLIGHTSIn 2013 we again demonstrated the progress we are making in transforming Unilever into a sustainable growth company. Turnover was €49.8 billion, down 3.0% with a negative impact from foreign exchange of 5.9% and net acquisitions and disposals of 1.1%. Underlying sales grew 4.3%. Gross margin rose 1.1 percentage points driven by better mix, margin accretive innovations and savings. Despite higher spend on advertising and promotions, core operating margin rose by 0.4 percentage points.
• Underlying sales growth of 4.3% was well balanced with volume 2.5% and price 1.8%.
• Emerging markets, now 57% of our business, grew underlying sales by 8.7% but were flat in current currency.
• Developed markets reported negative underlying sales growth for the year of 1.3%, with Europe down 1.1% and North America 1.5%.
€ million
Turnover down 3.0% with underlying sales growth offset by currency movements.
Dividends increased 10% in 2013.
Strategic report2
UNILEVER AT A GLANCE
TURNOVER TOTAL DIVIDEND PER SHARE
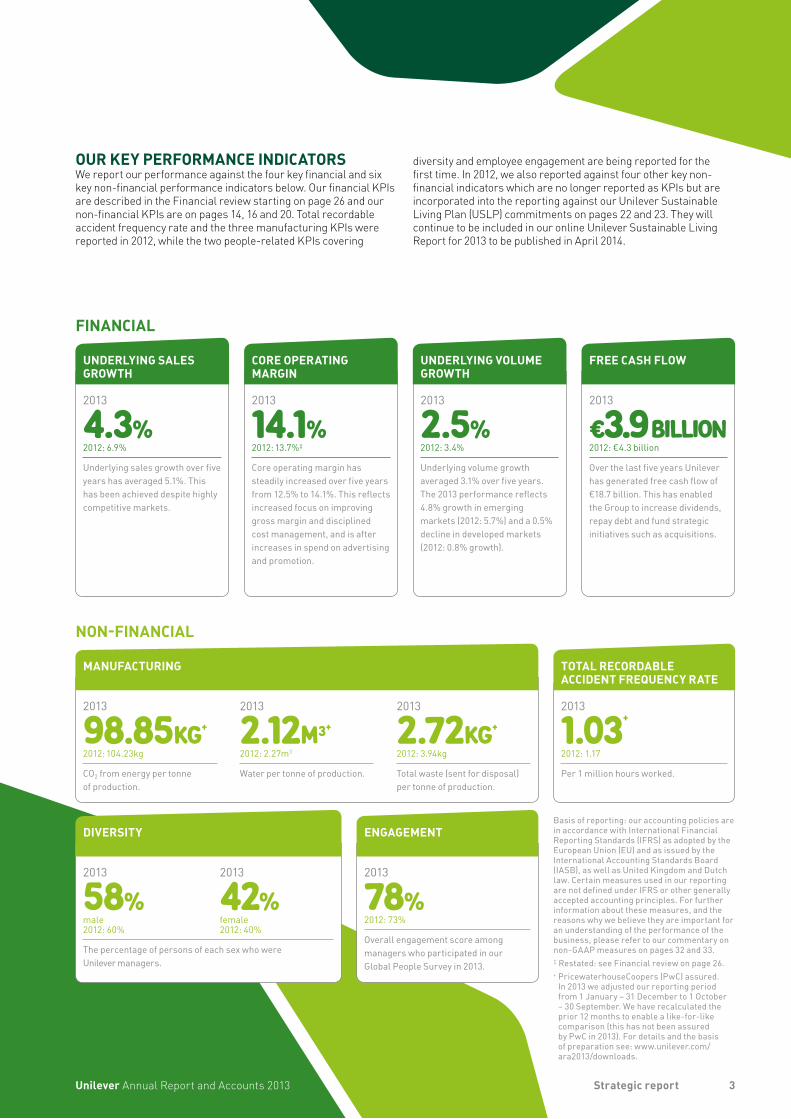
OUR KEY PERFORMANCE INDICATORSWe report our performance against the four key financial and six key non-financial performance indicators below. Our financial KPIs are described in the Financial review starting on page 26 and our non-financial KPIs are on pages 14, 16 and 20. Total recordable accident frequency rate and the three manufacturing KPIs were reported in 2012, while the two people-related KPIs covering
Basis of reporting: our accounting policies are in accordance with International Financial Reporting Standards (IFRS) as adopted by the European Union (EU) and as issued by the International Accounting Standards Board (IASB), as well as United Kingdom and Dutch law. Certain measures used in our reporting are not defined under IFRS or other generally accepted accounting principles. For further information about these measures, and the reasons why we believe they are important for an understanding of the performance of the business, please refer to our commentary on non-GAAP measures on pages 32 and 33.‡ Restated: see Financial review on page 26.+ PricewaterhouseCoopers (PwC) assured.
In 2013 we adjusted our reporting period from 1 January – 31 December to 1 October – 30 September. We have recalculated the prior 12 months to enable a like-for-like comparison (this has not been assured by PwC in 2013). For details and the basis of preparation see: www.unilever.com/ara2013/downloads.
2013
4.3%2012: 6.9%
2013
2.5%2012: 3.4%
2013
14.1%2012: 13.7%‡
2013
€3.9 billion2012: €4.3 billion
Underlying sales growth over five years has averaged 5.1%. This has been achieved despite highly competitive markets.
Underlying volume growth averaged 3.1% over five years. The 2013 performance reflects 4.8% growth in emerging markets (2012: 5.7%) and a 0.5% decline in developed markets (2012: 0.8% growth).
Core operating margin has steadily increased over five years from 12.5% to 14.1%. This reflects increased focus on improving gross margin and disciplined cost management, and is after increases in spend on advertising and promotion.
Over the last five years Unilever has generated free cash flow of €18.7 billion. This has enabled the Group to increase dividends, repay debt and fund strategic initiatives such as acquisitions.
diversity and employee engagement are being reported for the first time. In 2012, we also reported against four other key non-financial indicators which are no longer reported as KPIs but are incorporated into the reporting against our Unilever Sustainable Living Plan (USLP) commitments on pages 22 and 23. They will continue to be included in our online Unilever Sustainable Living Report for 2013 to be published in April 2014.
FINANCIAL
NON-FINANCIAL
2013
58%male2012: 60%
2013
78%2012: 73%
2013
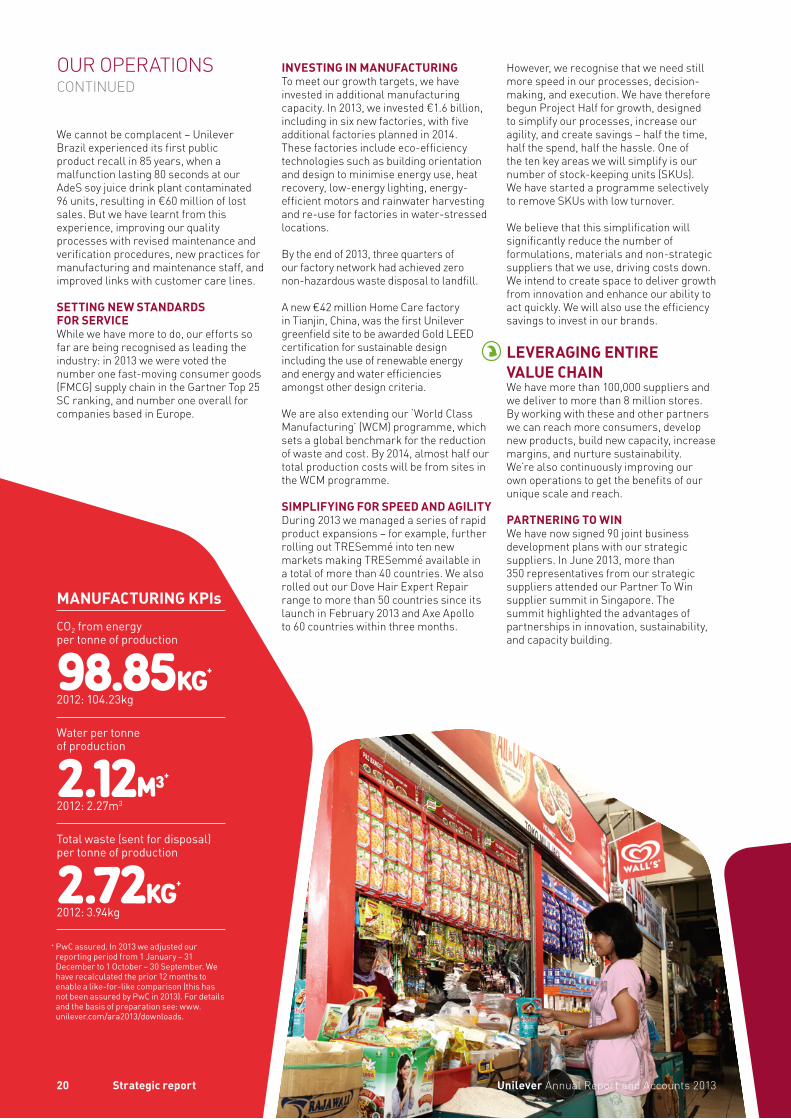
98.85KG+
2012: 104.23kg
2013
2.12m3+
2012: 2.27m3
2013
2.72kg+
2012: 3.94kg
2013
1.03+
2012: 1.17
The percentage of persons of each sex who were Unilever managers.
CO2 from energy per tonne of production.
Water per tonne of production. Total waste (sent for disposal)per tonne of production.
Overall engagement score among managers who participated in our Global People Survey in 2013.
Per 1 million hours worked.
2013
42%female2012: 40%
3Strategic reportUnilever Annual Report and Accounts 2013
UNDERLYING SALES GROWTH
UNDERLYING VOLUME GROWTH
CORE OPERATING MARGIN
FREE CASH FLOW
DIVERSITY
MANUFACTURING
ENGAGEMENT
TOTAL RECORDABLE ACCIDENT FREQUENCY RATE
Over the last five years we have seen the steady transformation of Unilever into a sustainable growth company, underpinned by an energising and purpose-driven business model. 2013 was another year of progress in that journey and the Boards remain confident that Unilever’s strategy will continue to generate sustainable returns for shareholders. Although the economic environment remains challenging, Unilever’s financial highlights point towards a business that is delivering long-term financial performance. Strong dependable cash flow has led to steadily increasing dividends year on year. The full-year dividend paid in 2013 rose to €1.05, a 10% increase from 2012.
FIVE YEARS OF PROGRESSFive years ago, under a new Chief Executive Officer, the Group set out a new direction, captured in the Compass strategy. The emphasis was on restoring confidence in Unilever’s ability to deliver consistent top and bottom line growth. Every aspect of the business was reviewed and wide-ranging changes followed.
The progress since has been significant. Growth has been strong and well ahead of Unilever’s own markets, with a majority of the business winning share despite the tough environment. Moreover, there has been a marked step-up in the quality of the performance. Significant investments have been made, for example, behind the
long-term drivers of growth, including R&D, brand support and people development. Today, as a result, Unilever’s organisational structure is stronger, its portfolio of brands is more competitive and Unilever is benefiting from a much sharper focus on performance and delivery. Around €10 billion in turnover has been added to the top line and shareholders have undoubtedly benefited from the changes at Unilever – with a 98% cumulative Total Shareholder Return (TSR) over the last five years.
At the same time, the Group has been energised around its commitment to sustainable and equitable growth, as set out in the Unilever Sustainable Living Plan (USLP). By focusing Unilever’s business strategy around the need to develop solutions to some of the world’s most deep-seated social and environmental challenges, the USLP is motivating employees and inspiring a growing number of customers and suppliers to partner with us.
Five years on, the Boards believe that the Compass and the USLP provide the right framework for Unilever and that they will become increasingly relevant in helping to address tomorrow’s challenges and ensuring long-term success for the Group.
MAINTAINING GOOD GOVERNANCEThe Boards believe that a business built on the principles of good governance is more likely to succeed over the long term. We responded constructively to an increased number of government and regulatory consultation exercises in 2013. Helping to shape an environment conducive to good governance is an important investment for the Group. On remuneration, we remain committed to linking pay to the longer-term objectives of Unilever and, in turn, the longer-term interests of shareholders. We believe our current remuneration framework, set out later in the Directors’ Remuneration Report, reflects this.
BOARD FOCUSIn 2013 the Boards continued to visit a range of Unilever operations with meetings held at Unilever’s international management centre at Four Acres, UK; in New York, US; and in Barcelona, Spain in addition to London and Rotterdam. Unilever US remains our largest operation in terms of turnover so it was a fitting location for 2013’s corporate strategy review which included increased interaction between the Directors and members of the Unilever Leadership Executive. In Spain the Boards saw the robustness of Unilever’s business model in a challenging market. Visits such as these allow the Non-Executive Directors to gain a deeper understanding of the business, to gain more exposure to Unilever’s talent pipeline and to participate in Unilever events, sharing their experience and meeting senior managers. Given the volatile environment, the Boards have during the year paid particular attention to sharpening our focus on key risk areas.
EFFECTIVENESS2013 was the third year in our three-year Board evaluation cycle. The interviews with Directors coupled with the evaluation questionnaires completed by Directors provided the Boards with important insights and enabled us to assess individual contributions and areas for improvement. The process confirmed that no major modifications were required and that the Boards continue to operate in an effective manner.
You, our shareholders, have the opportunity to vote on both the Group’s and Boards’ effectiveness at the Annual General Meetings in May. Although we always strive to improve, we were pleased, at our AGMs in May 2013, to receive votes in favour on all resolutions between 93.53% and 99.98% for NV and between 88.50% and 99.95% for PLC.
Unilever Annual Report and Accounts 2013Strategic report4
CHAIRMAN’SSTATEMENT

STRENGTHENING ALREADY DIVERSE BOARDSA key role for the Boards is to provide adequately for their succession, and I was very pleased that you voted to elect Laura Cha, Mary Ma and John Rishton as Directors at the AGMs in May 2013. They all bring knowledge and an understanding of emerging markets, a prime driver of Unilever’s growth, and further strengthen the financial expertise of the Boards.
I am pleased that over 40% of our Non-Executive Directors are women. We understand the importance of diversity within our workforce, not least because of the wide range of consumers we serve. This goes right through our organisation, starting with the Boards. We are committed to gender diversity at Board level and are tracking the major efforts being made by Unilever management to increase the number of women in our workforce.
SHAREHOLDER AND STAKEHOLDER ENGAGEMENT Unilever values open, constructive and effective communication with our shareholders. I continue to meet with a number of investors and industry representatives to answer their questions and to gain a better understanding of their policies on governance and voting. We expect and welcome further engagement with our institutional investors.
Reflecting therefore on a successful 2013, let me express my thanks and appreciation to my fellow Directors on the Boards, our Chief Executive Officer, Unilever’s senior executives and to all the other 174,000 employees around the world. Looking forward, I am confident that we have the strategy, people and resources to continue to deliver sustainable and equitable growth in the years ahead.
Michael Treschow Chairman
1 Michael Treschow Chairman
2 Kees Storm Vice-Chairman & Senior Independent Director
3 Paul Polman Chief Executive Officer
4 Jean-Marc Huët Chief Financial Officer
5 Laura Cha Non-Executive Director
6 Louise Fresco Non-Executive Director
7 Ann Fudge Non-Executive Director
8 Charles Golden Non-Executive Director
9 Byron Grote Non-Executive Director
10 Mary Ma Non-Executive Director
11 Hixonia Nyasulu Non-Executive Director
12 Sir Malcolm Rifkind Non-Executive Director
13 John Rishton Non-Executive Director
14 Paul Walsh Non-Executive Director
For Directors’ biographies, please see page 40.
THE UNILEVER GROUP Unilever N.V. (NV) is a public limited company registered in the Netherlands. It has listings of shares and depositary receipts for shares on Euronext Amsterdam and of New York Registry Shares on the New York Stock Exchange. Unilever PLC (PLC) is a public limited company registered in England and Wales. It has shares listed on the London Stock Exchange and, as American Depositary Receipts, on the New York Stock Exchange.The two parent companies, NV and PLC, together with their group companies, operate as a single economic entity (the Unilever Group, also referred to as Unilever or the Group). NV and PLC and their group companies, regardless of legal ownership, constitute a single reporting entity for the purposes of presenting consolidated financial statements. Accordingly, the accounts of the Unilever Group are presented by both NV and PLC as their respective consolidated financial statements. The same people sit on the Boards of NV and PLC and other officers are officers of both companies. Any references to the Board in this document mean the Boards of NV and PLC.Names are listed in alphabetical order with the exception of the Chairman, Vice-Chairman, Chief Executive Officer and Chief Financial Officer.
5Strategic reportUnilever Annual Report and Accounts 2013
BOARD OF DIRECTORS
1
4
7
10
2
5
8
11
13
3
6
9
12
14
TRANSFORMATION TO A CONSISTENT, COMPETITIVE, PROFITABLE AND RESPONSIBLE GROWTH COMPANY2013 was another year of turbulence in many parts of the world. Widespread citizen protests in countries as far apart as Brazil, Turkey and Egypt, the devastating typhoon in the Philippines, and the significant weakening of many emerging market currencies were all reminders of today’s increasingly ‘VUCA’ world – volatile, uncertain, complex and ambiguous. While emerging markets slowed, there were only limited signs of recovery in Europe and the US, with little improvement in either consumer confidence or unemployment.
While today’s VUCA world is certainly more difficult to navigate, it does present opportunities if managed well. This is the thinking behind the Unilever Sustainable Living Plan (USLP) and our vision to double the size of the business while reducing our environmental footprint and increasing our positive social impact. This Annual Report seeks to highlight the integral link between our long-term business purpose of making sustainable living commonplace and Unilever’s overall results.
2013 RESULTS2013 was another year of top and bottom line growth. Underlying sales growth was once again ahead of the market, at 4.3%, and our core operating margin was up 0.4 percentage points, to a record 14.1%, though weaker currencies impacted on our reported turnover and earnings. The quality of results was equally good, with 55% of our business winning share. Growth was driven by Personal Care and Home Care, which continue to outperform the markets and our competitive set. Most of the growth came from emerging markets, which now account for 57% of our business.
CATEGORY PERFORMANCEIn 2013, Personal Care, our largest category, showed strong broad-based momentum. The acquisitions of Alberto Culver, Sara Lee, Kalina and Toni & Guy have helped to transform the portfolio. Dove had a particularly impressive year. Home Care also delivered strong underlying growth. The implementation of low-cost business models and higher margin innovations, including concentrated detergents, helped to drive better gross margins in laundry, and household cleaners benefited from growth in new territories – Domestos toilet cleaner was our fastest growing global brand.
Foods has been a major cash contributor for Unilever, allowing us to finance faster
expansions in Home Care and Personal Care. Although we saw solid performances in savoury and dressings, with both Knorr and Hellmann’s building share, sales declined in spreads due to falling markets in Europe and North America. While we are encouraged by the early signs of recovery in our spreads business, we haven’t yet seen the broader improvements we were expecting and it remains an important focus for us. As part of our strategy of making Foods fit for growth, we sharpened the portfolio further in 2013 with the divestment of a number of less strategic, underperforming brands, like Wish-Bone, Skippy and Unipro.
It was a mixed year for Refreshment, with solid growth in tea but a contrasting performance from ice cream where two of our biggest markets – the US and Italy – struggled. We continued to expand into the profitable out-of-home ice cream sector with brands like Cornetto, Ben & Jerry’s, Magnum and Fruttare. Additionally, we expanded our low-cost business models and further sharpened our choices in capital expenditure. In tea, we have renewed our focus on driving the core business through our Lipton brand and we were pleased to welcome the premium T2 business to our portfolio.
FINANCIAL PERFORMANCEOver the last five years, we have established a simple framework for driving long-term success – to grow ahead of our markets, expand our margin and deliver strong cash flow. We achieved this again in 2013, despite further investments in advertising and promotion to strengthen the business. Gross margin expansion of 1.1 percentage points was the best for ten years, while free cash flow of €3.9 billion reflected improved margins as well as tight capital management.
We used the strong balance sheet position to increase our holdings in Hindustan Unilever in 2013, from 52% to 67%, and we bought out the remaining holding in Unilever Pakistan. Our pension fund deficit decreased from €3.3 billion at the end of 2012 to €2.0 billion at the end of 2013, reflecting mainly strong investment returns.
A STRONGER ORGANISATIONA VUCA world requires continued investment in our long-term pillars of growth: brands, people, and operations. We increased investment further in manufacturing, with the construction of five plants currently under way, as well as continuing to upgrade our IT systems. Employee engagement scores rose again
and our commitment to building world-class leaders was re-affirmed with the opening of our state-of-the-art management development centre in Singapore.
We made changes to strengthen the organisation in 2013, integrating R&D into our category structure, sharpening and streamlining our marketing organisation. We also embarked on a major simplification exercise, Project Half for growth, which aims to rework our most complex processes and systems to free up time and resource to put behind our principal growth opportunities.
LOOKING FORWARD2014 will be as challenging as 2013, with continuing volatility in the external environment. We will position Unilever accordingly and drive out complexity and cost to fund growth opportunities. The good news is that we have no shortage of opportunities: increasing our presence in places like Africa, returning our Foods business to competitive growth and extending our categories into more premium spaces. We are making good progress in driving bigger innovations faster across the world but we need to continue to set the bar higher.
Once again, we will remain focused on delivering profitable volume growth ahead of our markets, steady and sustainable core operating margin improvement and strong cash flow.
A BETTER WORLD, A BETTER BUSINESS – THE USLP AS A DRIVER OF GROWTHEvery year, the USLP becomes more firmly embedded in all aspects of the business. As this Annual Report highlights, the USLP is driving waste and inefficiencies out of the system and helping us transform the supply chain. Suppliers and customers are increasingly keen to work with us under the USLP and, by helping to grow our business in a responsible and equitable way, the USLP is benefiting all our stakeholders, including our shareholders.
It is in stimulating the growth of our brands that the USLP really comes to life. By developing strong social missions our brands are showing that they can make a real difference to people’s lives while at the same time growing our business. There were many inspiring examples in 2013,
Unilever Annual Report and Accounts 2013Strategic report6
CHIEF EXECUTIVE OFFICER’S REVIEW
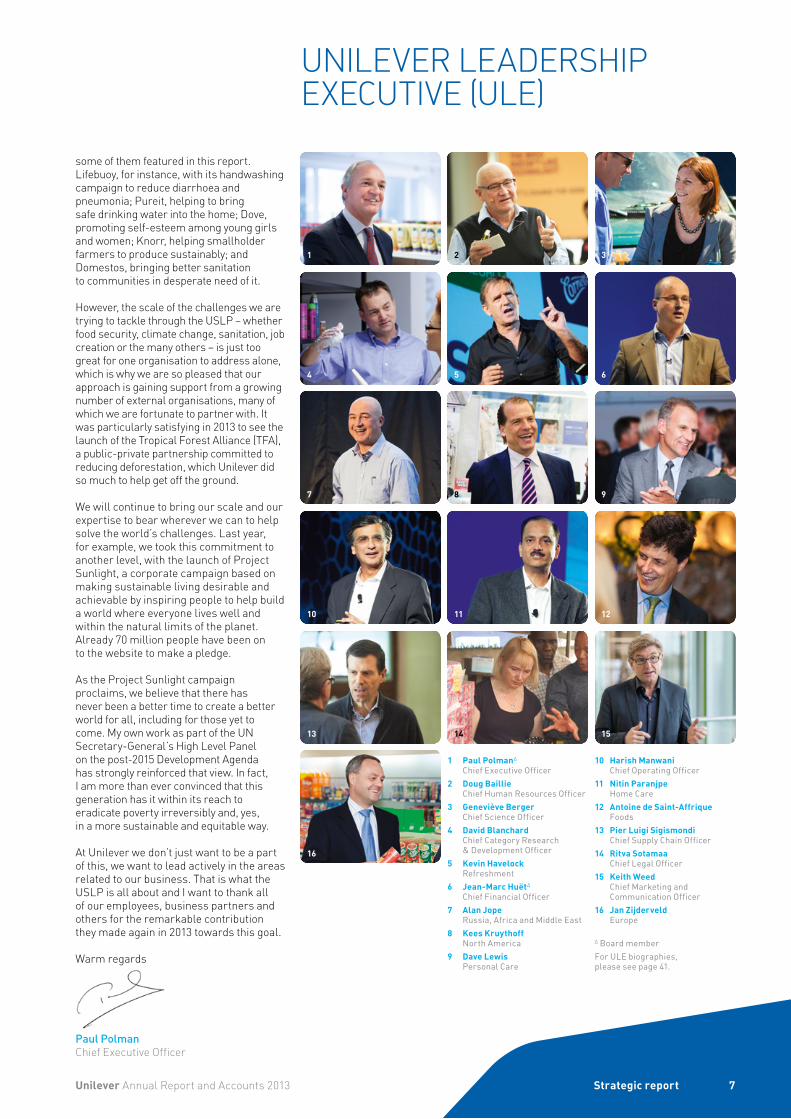
1 Paul Polman∆ Chief Executive Officer
2 Doug Baillie Chief Human Resources Officer
3 Geneviève Berger Chief Science Officer
4 David Blanchard Chief Category Research & Development Officer
5 Kevin Havelock Refreshment
6 Jean-Marc Huët∆ Chief Financial Officer
7 Alan Jope Russia, Africa and Middle East
8 Kees Kruythoff North America
9 Dave Lewis Personal Care
10 Harish Manwani Chief Operating Officer
11 Nitin Paranjpe Home Care
12 Antoine de Saint-Affrique Foods
13 Pier Luigi Sigismondi Chief Supply Chain Officer
14 Ritva Sotamaa Chief Legal Officer
15 Keith Weed Chief Marketing and Communication Officer
16 Jan Zijderveld Europe
∆ Board memberFor ULE biographies, please see page 41.
some of them featured in this report. Lifebuoy, for instance, with its handwashing campaign to reduce diarrhoea and pneumonia; Pureit, helping to bring safe drinking water into the home; Dove, promoting self-esteem among young girls and women; Knorr, helping smallholder farmers to produce sustainably; and Domestos, bringing better sanitation to communities in desperate need of it.
However, the scale of the challenges we are trying to tackle through the USLP – whether food security, climate change, sanitation, job creation or the many others – is just too great for one organisation to address alone, which is why we are so pleased that our approach is gaining support from a growing number of external organisations, many of which we are fortunate to partner with. It was particularly satisfying in 2013 to see the launch of the Tropical Forest Alliance (TFA), a public-private partnership committed to reducing deforestation, which Unilever did so much to help get off the ground.
We will continue to bring our scale and our expertise to bear wherever we can to help solve the world’s challenges. Last year, for example, we took this commitment to another level, with the launch of Project Sunlight, a corporate campaign based on making sustainable living desirable and achievable by inspiring people to help build a world where everyone lives well and within the natural limits of the planet. Already 70 million people have been on to the website to make a pledge.
As the Project Sunlight campaign proclaims, we believe that there has never been a better time to create a better world for all, including for those yet to come. My own work as part of the UN Secretary-General’s High Level Panel on the post-2015 Development Agenda has strongly reinforced that view. In fact, I am more than ever convinced that this generation has it within its reach to eradicate poverty irreversibly and, yes, in a more sustainable and equitable way.
At Unilever we don’t just want to be a part of this, we want to lead actively in the areas related to our business. That is what the USLP is all about and I want to thank all of our employees, business partners and others for the remarkable contribution they made again in 2013 towards this goal.
Warm regards
Paul PolmanChief Executive Officer
7Strategic reportUnilever Annual Report and Accounts 2013
UNILEVER LEADERSHIP EXECUTIVE (ULE)
1
4
7
10
2
5
8
11
13
16
3
6
9
12
14 15
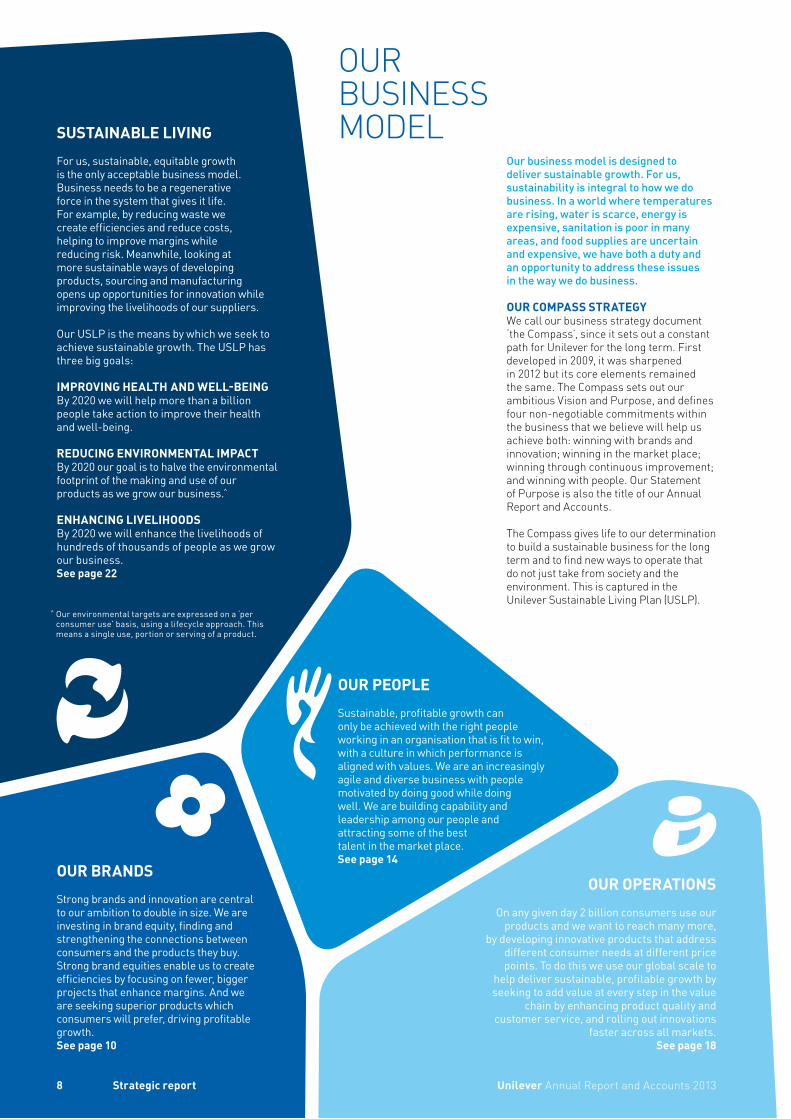
SUSTAINABLE LIVINGFor us, sustainable, equitable growth is the only acceptable business model. Business needs to be a regenerative force in the system that gives it life. For example, by reducing waste we create efficiencies and reduce costs, helping to improve margins while reducing risk. Meanwhile, looking at more sustainable ways of developing products, sourcing and manufacturing opens up opportunities for innovation while improving the livelihoods of our suppliers.
Our USLP is the means by which we seek to achieve sustainable growth. The USLP has three big goals:
IMPROVING HEALTH AND WELL-BEINGBy 2020 we will help more than a billion people take action to improve their health and well-being.
REDUCING ENVIRONMENTAL IMPACTBy 2020 our goal is to halve the environmental footprint of the making and use of our products as we grow our business.̂
ENHANCING LIVELIHOODSBy 2020 we will enhance the livelihoods of hundreds of thousands of people as we grow our business.See page 22
OUR PEOPLESustainable, profitable growth can only be achieved with the right people working in an organisation that is fit to win, with a culture in which performance is aligned with values. We are an increasingly agile and diverse business with people motivated by doing good while doing well. We are building capability and leadership among our people and attracting some of the best talent in the market place.See page 14
OUR BRANDSStrong brands and innovation are central to our ambition to double in size. We are investing in brand equity, finding and strengthening the connections between consumers and the products they buy. Strong brand equities enable us to create efficiencies by focusing on fewer, bigger projects that enhance margins. And we are seeking superior products which consumers will prefer, driving profitable growth.See page 10
OUR OPERATIONSOn any given day 2 billion consumers use our
products and we want to reach many more, by developing innovative products that address
different consumer needs at different price points. To do this we use our global scale to
help deliver sustainable, profitable growth by seeking to add value at every step in the value
chain by enhancing product quality and customer service, and rolling out innovations
faster across all markets. See page 18
Our business model is designed to deliver sustainable growth. For us, sustainability is integral to how we do business. In a world where temperatures are rising, water is scarce, energy is expensive, sanitation is poor in many areas, and food supplies are uncertain and expensive, we have both a duty and an opportunity to address these issues in the way we do business.
OUR COMPASS STRATEGYWe call our business strategy document ‘the Compass’, since it sets out a constant path for Unilever for the long term. First developed in 2009, it was sharpened in 2012 but its core elements remained the same. The Compass sets out our ambitious Vision and Purpose, and defines four non-negotiable commitments within the business that we believe will help us achieve both: winning with brands and innovation; winning in the market place; winning through continuous improvement; and winning with people. Our Statement of Purpose is also the title of our Annual Report and Accounts.
The Compass gives life to our determination to build a sustainable business for the long term and to find new ways to operate that do not just take from society and the environment. This is captured in the Unilever Sustainable Living Plan (USLP).
^ Our environmental targets are expressed on a ‘per consumer use’ basis, using a lifecycle approach. This means a single use, portion or serving of a product.
8 Strategic report Unilever Annual Report and Accounts 2013
OUR BUSINESS MODEL

SUSTAINABLE LIVING
PROFITABLEVOLUMEGROWTH
COSTLEVERAGE +EFFICIENCY
INNOVATION +MARKETING INVESTMENT
OUR BRANDS
OUR OPER
ATIO
NSOUR PEOPLE
OUR BUSINESS MODELThe inputs to our business model, like those of all major packaged goods manufacturers, are threefold: brands; people; and operations. These map directly on to our Compass ‘winning with’ commitments – with both continuous improvement and the market place pillars supporting the operations strand of the model.
The differentiator in our business model is our USLP and the goal of sustainable living.
The outputs of the model are threefold: sustained growth; lower environmental impact; and positive social impact. These align directly with our Vision statement.
The diagram represents our virtuous circle of growth. It summarises, simply, how we derive profit from our business model.
PROFITABLE VOLUME GROWTHProfitable volume growth is the basis of the virtuous circle of growth. The drivers of our volume growth are innovation and investment behind our brands. Consistently strong volume growth builds brand equity as we reach more consumers, more often.
COST LEVERAGE + EFFICIENCYProfitable volume growth allows us to optimise the utilisation of our infrastructure and spread fixed costs over a larger number of units produced, reducing the average cost per unit. It improves our profitability and allows us to invest in the business.
INNOVATION + MARKETING INVESTMENTLower costs and improved efficiency enable us to strengthen our business further. New and improved products are the result of investment in R&D and, together with effective marketing, strengthen our brand equity. This results in profitable volume growth, self-perpetuating the virtuous circle of growth.
9Unilever Annual Report and Accounts 2013 Strategic report
A VIRTUOUS CIRCLE OF GROWTH

OURBRANDS
WIN
CONSUMER PREFERENCE
LEVERAGE BIGGER BRANDS
BUILDING BRAND EQUITIES
INNOVATION +MARKETINGINVESTMENT
PROFITABLEVOLUMEGROWTH
COSTLEVERAGE +EFFICIENCY
Turnover
€18.1 BILLION2012: €18.1 billion
Underlying sales growth
7.3%2012: 10.0%
Core operating margin
17.8%2012: 17.0%‡
Our brands make a difference. They succeed when we create high-quality products which make a connection with people’s lives and needs, bringing a promise to the consumer and driving sustainable, profitable growth. A stream of innovations is helping us create ‘brands with purpose’. We aim to grow our business and improve our margins by building on our brands’ strength – especially our 14 €1 billion brands, where our impact can be greatest.
BUILDING BRAND EQUITIESBehind every brand should be a unique insight into the purpose it will serve in the life of the person who buys it. We build brand equity by ensuring not only that our brands have a purpose, but also that it is clearly understood, and valued, by our consumers.
BRANDS WITH PURPOSEWhether it is Lifebuoy or Domestos helping to prevent the spread of diarrhoea and other serious diseases; Becel improving heart health; reminding parents that ‘dirt is good’ for their child’s development and giving them the best laundry detergents like Omo to clean up afterwards; giving people the confidence to get more out of life through our Personal Care brands; or providing delicious food and refreshments made with more and more sustainably-sourced ingredients – our brands make a difference.
PRODUCTS THAT DELIVER MOREBy combining human insight with technological innovation we find new ways to connect with consumers. In February 2013, for example, we launched a radical new compressed aerosol deodorant for women from Dove, Sure and Vaseline in the UK. The new cans are half the size and use half the propellant of their predecessors, while lasting just as long and delivering the same excellent protection. Not only does this reduction in packaging and material deliver environmental benefits – including an overall carbon footprint reduction of an average of 25% per can – but the format was an immediate success. More than 9 million cans have been sold since launch, representing a 9.6% share of the female antiperspirant aerosol market.
Another Personal Care innovation, Vaseline Spray & Go moisturiser, features a continuous-spray system which delivers a targeted application easily and evenly across the body. In developing a formulation which was thin enough to be sprayed but contained the right balance of moisturising ingredients, we were working on the insight that people wanted moisturisers which could be applied rapidly and did not need to be rubbed in. Since its launch, in North America alone Vaseline Spray & Go has added more than €25 million turnover to the Vaseline brand.
INNOVATING TO FIND NEW CHANNELSInnovation can also build the equity of brands by bringing established products to consumers through novel channels. For example, Lipton introduced new hot and iced-tea varieties for the Keurig K-Cup brewing system – by sales value, the leading single cup coffee and tea dispenser in the US. The innovation, combined with a campaign that includes reaching 2.5 million consumers through Twitter, has seen Lipton gain over 10% of the tea capsules market
Unilever Annual Report and Accounts 201310 Strategic report
OUR BRANDS
OUR CATEGORIES
PERSONAL CARE
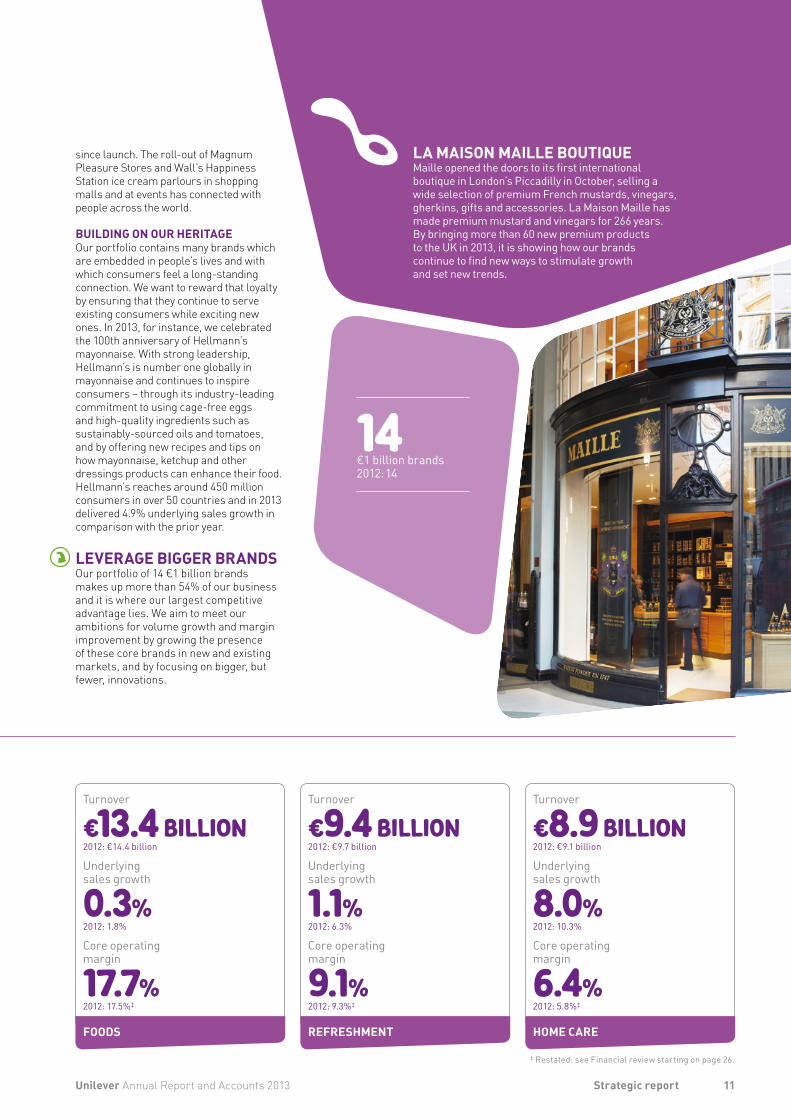
LA MAISON MAILLE BOUTIQUEMaille opened the doors to its first international boutique in London’s Piccadilly in October, selling a wide selection of premium French mustards, vinegars, gherkins, gifts and accessories. La Maison Maille has made premium mustard and vinegars for 266 years. By bringing more than 60 new premium products to the UK in 2013, it is showing how our brands continue to find new ways to stimulate growth and set new trends.
14€1 billion brands 2012: 14
Turnover
€13.4 BILLION2012: €14.4 billion
Underlying sales growth
0.3%2012: 1.8%
Core operating margin
17.7%2012: 17.5%‡
Turnover
€9.4 BILLION2012: €9.7 billion
Underlying sales growth
1.1%2012: 6.3%
Core operating margin
9.1%2012: 9.3%‡
Turnover
€8.9 BILLION2012: €9.1 billion
Underlying sales growth
8.0%2012: 10.3%
Core operating margin
6.4%2012: 5.8%‡
since launch. The roll-out of Magnum Pleasure Stores and Wall’s Happiness Station ice cream parlours in shopping malls and at events has connected with people across the world.
BUILDING ON OUR HERITAGEOur portfolio contains many brands which are embedded in people’s lives and with which consumers feel a long-standing connection. We want to reward that loyalty by ensuring that they continue to serve existing consumers while exciting new ones. In 2013, for instance, we celebrated the 100th anniversary of Hellmann’s mayonnaise. With strong leadership, Hellmann’s is number one globally in mayonnaise and continues to inspire consumers – through its industry-leading commitment to using cage-free eggs and high-quality ingredients such as sustainably-sourced oils and tomatoes, and by offering new recipes and tips on how mayonnaise, ketchup and other dressings products can enhance their food. Hellmann’s reaches around 450 million consumers in over 50 countries and in 2013 delivered 4.9% underlying sales growth in comparison with the prior year.
LEVERAGE BIGGER BRANDSOur portfolio of 14 €1 billion brands makes up more than 54% of our business and it is where our largest competitive advantage lies. We aim to meet our ambitions for volume growth and margin improvement by growing the presence of these core brands in new and existing markets, and by focusing on bigger, but fewer, innovations.
‡ Restated: see Financial review starting on page 26.
11Unilever Annual Report and Accounts 2013 Strategic report
FOODS REFRESHMENT HOME CARE
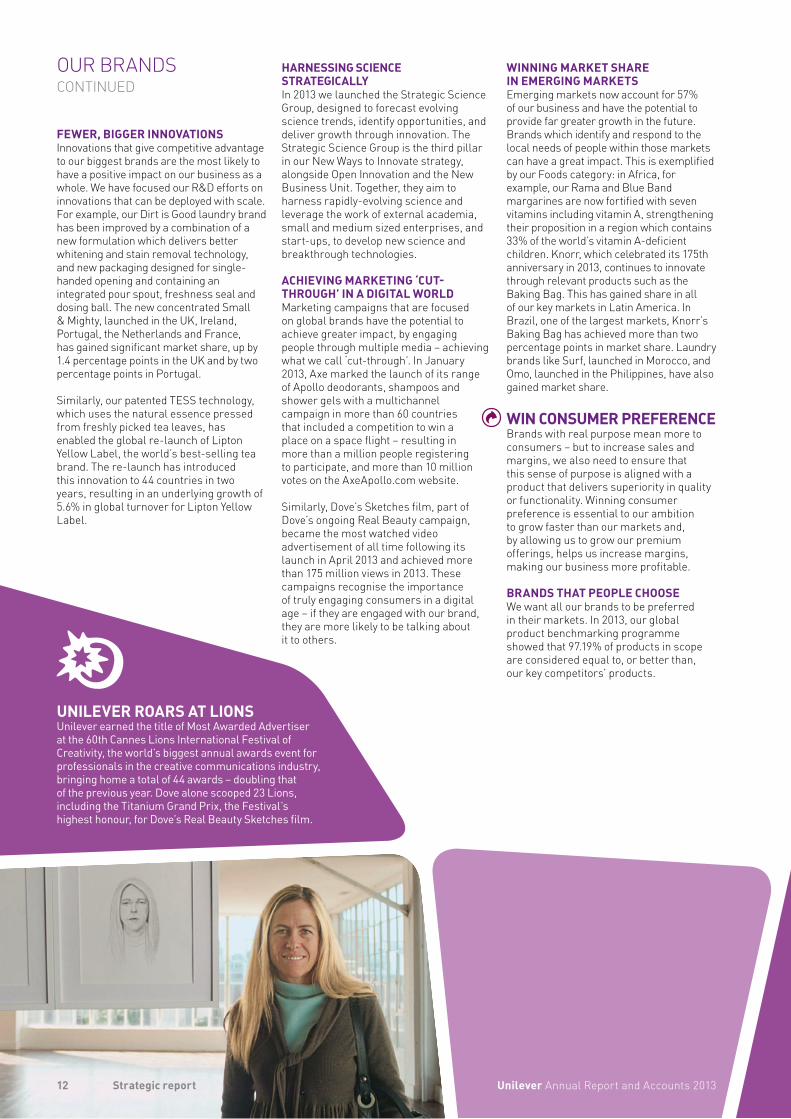
UNILEVER ROARS AT LIONSUnilever earned the title of Most Awarded Advertiser at the 60th Cannes Lions International Festival of Creativity, the world’s biggest annual awards event for professionals in the creative communications industry, bringing home a total of 44 awards – doubling that of the previous year. Dove alone scooped 23 Lions, including the Titanium Grand Prix, the Festival’s highest honour, for Dove’s Real Beauty Sketches film.
FEWER, BIGGER INNOVATIONSInnovations that give competitive advantage to our biggest brands are the most likely to have a positive impact on our business as a whole. We have focused our R&D efforts on innovations that can be deployed with scale. For example, our Dirt is Good laundry brand has been improved by a combination of a new formulation which delivers better whitening and stain removal technology, and new packaging designed for single-handed opening and containing an integrated pour spout, freshness seal and dosing ball. The new concentrated Small & Mighty, launched in the UK, Ireland, Portugal, the Netherlands and France, has gained significant market share, up by 1.4 percentage points in the UK and by two percentage points in Portugal.
Similarly, our patented TESS technology, which uses the natural essence pressed from freshly picked tea leaves, has enabled the global re-launch of Lipton Yellow Label, the world’s best-selling tea brand. The re-launch has introduced this innovation to 44 countries in two years, resulting in an underlying growth of 5.6% in global turnover for Lipton Yellow Label.
HARNESSING SCIENCE STRATEGICALLYIn 2013 we launched the Strategic Science Group, designed to forecast evolving science trends, identify opportunities, and deliver growth through innovation. The Strategic Science Group is the third pillar in our New Ways to Innovate strategy, alongside Open Innovation and the New Business Unit. Together, they aim to harness rapidly-evolving science and leverage the work of external academia, small and medium sized enterprises, and start-ups, to develop new science and breakthrough technologies.
ACHIEVING MARKETING ‘CUT-THROUGH’ IN A DIGITAL WORLDMarketing campaigns that are focused on global brands have the potential to achieve greater impact, by engaging people through multiple media – achieving what we call ‘cut-through’. In January 2013, Axe marked the launch of its range of Apollo deodorants, shampoos and shower gels with a multichannel campaign in more than 60 countries that included a competition to win a place on a space flight – resulting in more than a million people registering to participate, and more than 10 million votes on the AxeApollo.com website.
Similarly, Dove’s Sketches film, part of Dove’s ongoing Real Beauty campaign, became the most watched video advertisement of all time following its launch in April 2013 and achieved more than 175 million views in 2013. These campaigns recognise the importance of truly engaging consumers in a digital age – if they are engaged with our brand, they are more likely to be talking about it to others.
WINNING MARKET SHARE IN EMERGING MARKETSEmerging markets now account for 57% of our business and have the potential to provide far greater growth in the future. Brands which identify and respond to the local needs of people within those markets can have a great impact. This is exemplified by our Foods category: in Africa, for example, our Rama and Blue Band margarines are now fortified with seven vitamins including vitamin A, strengthening their proposition in a region which contains 33% of the world’s vitamin A-deficient children. Knorr, which celebrated its 175th anniversary in 2013, continues to innovate through relevant products such as the Baking Bag. This has gained share in all of our key markets in Latin America. In Brazil, one of the largest markets, Knorr’s Baking Bag has achieved more than two percentage points in market share. Laundry brands like Surf, launched in Morocco, and Omo, launched in the Philippines, have also gained market share.
WIN CONSUMER PREFERENCEBrands with real purpose mean more to consumers – but to increase sales and margins, we also need to ensure that this sense of purpose is aligned with a product that delivers superiority in quality or functionality. Winning consumer preference is essential to our ambition to grow faster than our markets and, by allowing us to grow our premium offerings, helps us increase margins, making our business more profitable.
BRANDS THAT PEOPLE CHOOSEWe want all our brands to be preferred in their markets. In 2013, our global product benchmarking programme showed that 97.19% of products in scope are considered equal to, or better than, our key competitors’ products.
Unilever Annual Report and Accounts 201312 Strategic report
OUR BRANDS CONTINUED
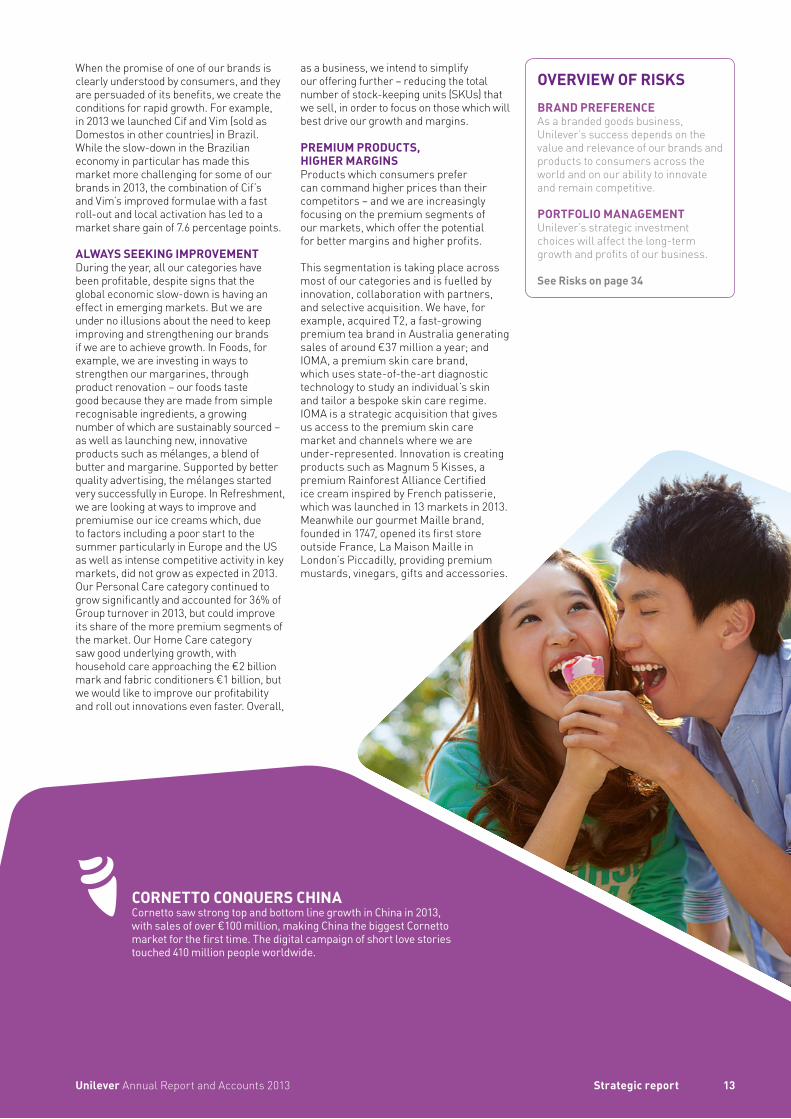
CORNETTO CONQUERS CHINACornetto saw strong top and bottom line growth in China in 2013, with sales of over €100 million, making China the biggest Cornetto market for the first time. The digital campaign of short love stories touched 410 million people worldwide.
When the promise of one of our brands is clearly understood by consumers, and they are persuaded of its benefits, we create the conditions for rapid growth. For example, in 2013 we launched Cif and Vim (sold as Domestos in other countries) in Brazil. While the slow-down in the Brazilian economy in particular has made this market more challenging for some of our brands in 2013, the combination of Cif’s and Vim’s improved formulae with a fast roll-out and local activation has led to a market share gain of 7.6 percentage points.
ALWAYS SEEKING IMPROVEMENTDuring the year, all our categories have been profitable, despite signs that the global economic slow-down is having an effect in emerging markets. But we are under no illusions about the need to keep improving and strengthening our brands if we are to achieve growth. In Foods, for example, we are investing in ways to strengthen our margarines, through product renovation – our foods taste good because they are made from simple recognisable ingredients, a growing number of which are sustainably sourced – as well as launching new, innovative products such as mélanges, a blend of butter and margarine. Supported by better quality advertising, the mélanges started very successfully in Europe. In Refreshment, we are looking at ways to improve and premiumise our ice creams which, due to factors including a poor start to the summer particularly in Europe and the US as well as intense competitive activity in key markets, did not grow as expected in 2013. Our Personal Care category continued to grow significantly and accounted for 36% of Group turnover in 2013, but could improve its share of the more premium segments of the market. Our Home Care category saw good underlying growth, with household care approaching the €2 billion mark and fabric conditioners €1 billion, but we would like to improve our profitability and roll out innovations even faster. Overall,
as a business, we intend to simplify our offering further – reducing the total number of stock-keeping units (SKUs) that we sell, in order to focus on those which will best drive our growth and margins.
PREMIUM PRODUCTS, HIGHER MARGINSProducts which consumers prefer can command higher prices than their competitors – and we are increasingly focusing on the premium segments of our markets, which offer the potential for better margins and higher profits.
This segmentation is taking place across most of our categories and is fuelled by innovation, collaboration with partners, and selective acquisition. We have, for example, acquired T2, a fast-growing premium tea brand in Australia generating sales of around €37 million a year; and IOMA, a premium skin care brand, which uses state-of-the-art diagnostic technology to study an individual’s skin and tailor a bespoke skin care regime. IOMA is a strategic acquisition that gives us access to the premium skin care market and channels where we are under-represented. Innovation is creating products such as Magnum 5 Kisses, a premium Rainforest Alliance Certified ice cream inspired by French patisserie, which was launched in 13 markets in 2013. Meanwhile our gourmet Maille brand, founded in 1747, opened its first store outside France, La Maison Maille in London’s Piccadilly, providing premium mustards, vinegars, gifts and accessories.
OVERVIEW OF RISKSBRAND PREFERENCEAs a branded goods business, Unilever’s success depends on the value and relevance of our brands and products to consumers across the world and on our ability to innovate and remain competitive.
PORTFOLIO MANAGEMENTUnilever’s strategic investment choices will affect the long-term growth and profits of our business.
See Risks on page 34
13Strategic reportUnilever Annual Report and Accounts 2013
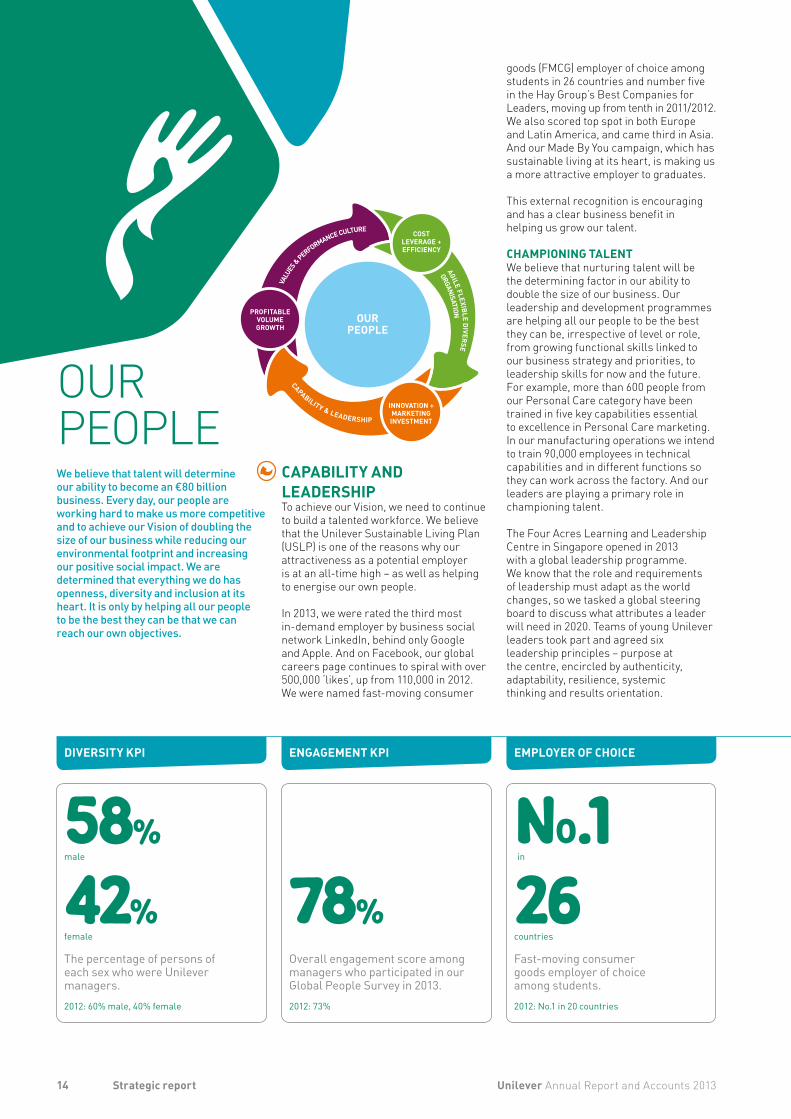
OURPEOPLE
VALU
ES & PERFORMANCE CULTURE
ORGANISATIONAGILE FLEXIBLE DIVERSE
CAPABILITY & LEADERSHIP
INNOVATION +MARKETINGINVESTMENT
PROFITABLEVOLUMEGROWTH
COSTLEVERAGE +EFFICIENCY
58%male
42%female
The percentage of persons of each sex who were Unilever managers.2012: 60% male, 40% female
78%Overall engagement score among managers who participated in our Global People Survey in 2013.2012: 73%
NO.1 in
26countries
Fast-moving consumer goods employer of choice among students.2012: No.1 in 20 countries
We believe that talent will determine our ability to become an €80 billion business. Every day, our people are working hard to make us more competitive and to achieve our Vision of doubling the size of our business while reducing our environmental footprint and increasing our positive social impact. We are determined that everything we do has openness, diversity and inclusion at its heart. It is only by helping all our people to be the best they can be that we can reach our own objectives.
CAPABILITY AND LEADERSHIPTo achieve our Vision, we need to continue to build a talented workforce. We believe that the Unilever Sustainable Living Plan (USLP) is one of the reasons why our attractiveness as a potential employer is at an all-time high – as well as helping to energise our own people.
In 2013, we were rated the third most in-demand employer by business social network LinkedIn, behind only Google and Apple. And on Facebook, our global careers page continues to spiral with over 500,000 ‘likes’, up from 110,000 in 2012. We were named fast-moving consumer
goods (FMCG) employer of choice among students in 26 countries and number five in the Hay Group’s Best Companies for Leaders, moving up from tenth in 2011/2012. We also scored top spot in both Europe and Latin America, and came third in Asia. And our Made By You campaign, which has sustainable living at its heart, is making us a more attractive employer to graduates.
This external recognition is encouraging and has a clear business benefit in helping us grow our talent.
CHAMPIONING TALENTWe believe that nurturing talent will be the determining factor in our ability to double the size of our business. Our leadership and development programmes are helping all our people to be the best they can be, irrespective of level or role, from growing functional skills linked to our business strategy and priorities, to leadership skills for now and the future. For example, more than 600 people from our Personal Care category have been trained in five key capabilities essential to excellence in Personal Care marketing. In our manufacturing operations we intend to train 90,000 employees in technical capabilities and in different functions so they can work across the factory. And our leaders are playing a primary role in championing talent.
The Four Acres Learning and Leadership Centre in Singapore opened in 2013 with a global leadership programme. We know that the role and requirements of leadership must adapt as the world changes, so we tasked a global steering board to discuss what attributes a leader will need in 2020. Teams of young Unilever leaders took part and agreed six leadership principles – purpose at the centre, encircled by authenticity, adaptability, resilience, systemic thinking and results orientation.
14 Unilever Annual Report and Accounts 2013Strategic report
OUR PEOPLE
DIVERSITY KPI ENGAGEMENT KPI EMPLOYER OF CHOICE

500,000‘likes’ of our Facebook global careers page.
2012: 110,000
Investment in our people stretches beyond careers to their well-being, which is just as important for our success as a business. For example, our mental health and resilience initiative in the UK and Ireland trains managers to spot symptoms and support employees who are struggling, offers a confidential web and telephone support service, and encourages team workshops to manage workloads and pressure.
SHAPING LEADERS OF THE FUTURE During 2013 in Singapore, we launched the Future Leaders League, our first global employer brand-building competition, to motivate young leaders about our business, brands, the USLP and our views on future leadership. Finalists representing ten countries across our markets created a holistic campaign for Lifebuoy that was designed to touch millions of people in 2013. And, at the One Young World summit in Johannesburg in October 2013, our Chief Executive Officer urged 1,200 delegates from 190 countries to become a force for good.
As well as generating a positive buzz around our employer brand, our aim with initiatives like these is to create a generation of advocates for sustainable growth.
AGILE, FLEXIBLE AND DIVERSE ORGANISATIONInclusion is at the heart of being an agile, flexible and diverse organisation. It means having a representative workforce, empowering our people with policies and infrastructure to help them work quickly and effectively, and creating flexible ways of working to suit their circumstances. The smarter we work, the more effective and efficient we will be at meeting the needs of our consumers in a rapidly changing world.
THE GOOD SISTEREvery year, our people nominate ‘Unilever heroes’ for work that brings our values to life. Habiba Haroon has helped over 1,400 women in rural Pakistan to earn a sustainable income through the Guddi Baji (Good Sister) programme, training them to become saleswomen for beauty products like Sunsilk and Lux. Now they can earn an average of €58 per month, improving their livelihoods by making meaningful contributions to their families’ incomes.
Unilever Annual Report and Accounts 2013 15Strategic report
GLOBAL CAREERS PAGE
FROM DIVERSITY TO INCLUSIONWomen are Unilever’s core consumers, controlling nearly two thirds of consumer spending, so it’s important that we represent them in our workforce. As at 31 December 2013, 119,139 (68%) of our global workforce of 174,381 employees were male and 55,242 (32%) female. Of these, 115 are considered senior leadership executives (96 male, 19 female). If you include employees who are statutory directors of the corporate entities whose financial information is included in the Group’s 2013 consolidated accounts in this Annual Report, the number increases to 681 males and 181 females. 35% (five out of 14) of the Board are female. Our ambition is for 50% of our managers to be women (2013: 42% were female and 58% male).
We know there is still much to do and we are working hard to put programmes in place to improve our representation and retention of women. Our Winning Balance campaign, for example, encouraged employees to give their views on gender balance. We used over 1,750 responses to make real changes. These included a programme to retain female staff during and after maternity leave, as well as training leaders to be more inclusive.
Our efforts are showing signs of success and we’re encouraged by external recognition including two golds for ‘Winning Balance’ at the tenth Stevie Awards for Women in Business, as well as a Catalyst Award for Creating a Gender-Balanced Workforce in Different
Cultures. We were included in The Times Top 50 Employers for Women in the UK, The Working Mother 100 Best Companies in North America and the Corporate Empowerment for Women Award from Cosmetics Executive Women, North America.
SIMPLIFYING THE WAY WE WORKSimplifying working practices and cutting out unnecessary bureaucracy has a twofold benefit: it helps us respond swiftly to changes in the market place and allows our people to focus on what inspires them – building and growing our brands.
One way of doing this is to bring people together: we have opened a European Marketing and Innovation Hub in Rotterdam, relocating approximately 270 employees from nine different countries, which will speed up both decision-making and the sharing of best practice. We’re also pleased that 58% of people based there are women and they represent 28 different nationalities.
We are also looking at working practices across the company. For example, we are rolling out Agile Working and now have 30 Agile Workplaces. This new way of working measures performance on results, not time and attendance, and reinforces diversity by helping people – particularly women – balance their personal and professional lives.
And during the year we set ourselves a challenge: to rework our major processes and systems – those that are the most complex, time consuming and frustrating – to halve the time they take to use. In the spirit of this ambition, we coined the initiative Project Half for growth, and identified a radical simplification of ten processes and systems that would reduce the time we spend on doing things that don’t add value and concentrate on things that do. Each initiative is championed by a ULE member.
Similarly, Project Sunset, an IT tool that speeds up decisions, has been rolled out across 103 countries and is already
available in seven languages. The new approach, pioneered by Hindustan Unilever in 2012, escalates business problem solving to the highest levels of leadership within three weeks. Using Sunset in India to deal swiftly with customer management issues has led to better retention of salesmen and lower costs of hiring.
Meanwhile, building on the findings from our Winning Balance campaign, more than 87,000 people viewed our Winning Together programme which is helping teams make changes to everyday working practices. This includes meetings and email etiquette, so as to spend time more effectively on making the biggest difference to the business. For example, teams are creating their own manifestos and sharing best practice, with promises including more video conferencing to reduce travel, keeping meetings to time and an end to cc-ing emails unnecessarily.
But there is still much to do. In 2014, we intend to focus on helping leaders promote a culture of inclusivity.
VALUES AND PERFORMANCE CULTURE In a turbulent world, people are looking for meaning at work, and contributing to making sustainable living commonplace, as we do at Unilever, is highly motivating. Our values of integrity, responsibility, and respect, and our pioneering spirit guide our people in the judgements, actions and decisions they make each day. They are especially important as we expand into new markets, recruit new people and face new challenges.
ENGAGEMENTEach year, our Global People Survey measures employee engagement, alternating between polling all employees and managers only. In 2013, we surveyed our managers and 89% participated, with the overall engagement score increasing five percentage points to 78% (compared with managers’ results in 2012). However, our bias for action scores rose only slightly to 50% – we hope to see this change as our programmes to simplify our working practices start to take effect.
SAFETY KPITotal recordable accident frequency rate
1.03+
per 1 million hours worked 2012: 1.17 per 1 million hours worked
Unilever Annual Report and Accounts 2013Strategic report16
OUR PEOPLE CONTINUED
HUMAN RIGHTSIn line with the UN Guiding Principles on Business and Human Rights (UNGP), we base our human rights commitment and policy on the International Bill of Human Rights (the Universal Declaration of Human Rights, the International Covenant on Civil and Political Rights and the International Covenant on Economic, Social and Cultural Rights) and the principles concerning fundamental rights set out in the International Labour Organization’s Declaration on Fundamental Principles and Rights at Work. We seek to uphold these rights in our operations, in our relationships with our suppliers and other business partners, and by working through external initiatives, such as the United Nations Global Compact. In 2013 we appointed a Global Vice President for Social Impact to lead the implementation of the UNGP and the development of the Enhancing Livelihoods pillar of the USLP, including the advancement of women’s rights and economic inclusion. We will report in more detail on this next year.
MOTIVATIONTo reach our ambition of sustainable growth, we need people with a winning
mindset, a passion for consumers and an appetite to drive personal performance. To do this, we are building a winning culture in which every employee is encouraged to grow to his or her full potential. Our performance-based reward structure recognises those who have delivered results and have the right values for our business.
While recognition reinforces our values and the positive behaviours that drive our business performance, recognition can be delivered in many ways. This year, we honoured five people nominated by their colleagues as Unilever heroes. Our 2013 heroes include Habiba Haroon (pictured on page 15) who helped more than 1,000 women in rural Pakistan to earn a sustainable income, and Hasan Monsoor, from our Customer Development team in Bangladesh, who devised a way of protecting our teams and delivering our products safely during politically-charged protests that often escalate into violence.
A number of initiatives beyond our brands enable our people to contribute to social issues as Unilever grows. For example, the Unilever Foundation Challenge, now in its
OVERVIEW OF RISKSTALENTA skilled workforce is essential for the continued success of our business.
ETHICALActing in an ethical manner, consistent with the expectations of customers, consumers and other stakeholders, is essential for the protection of the reputation of Unilever and its brands.
See Risks on page 34
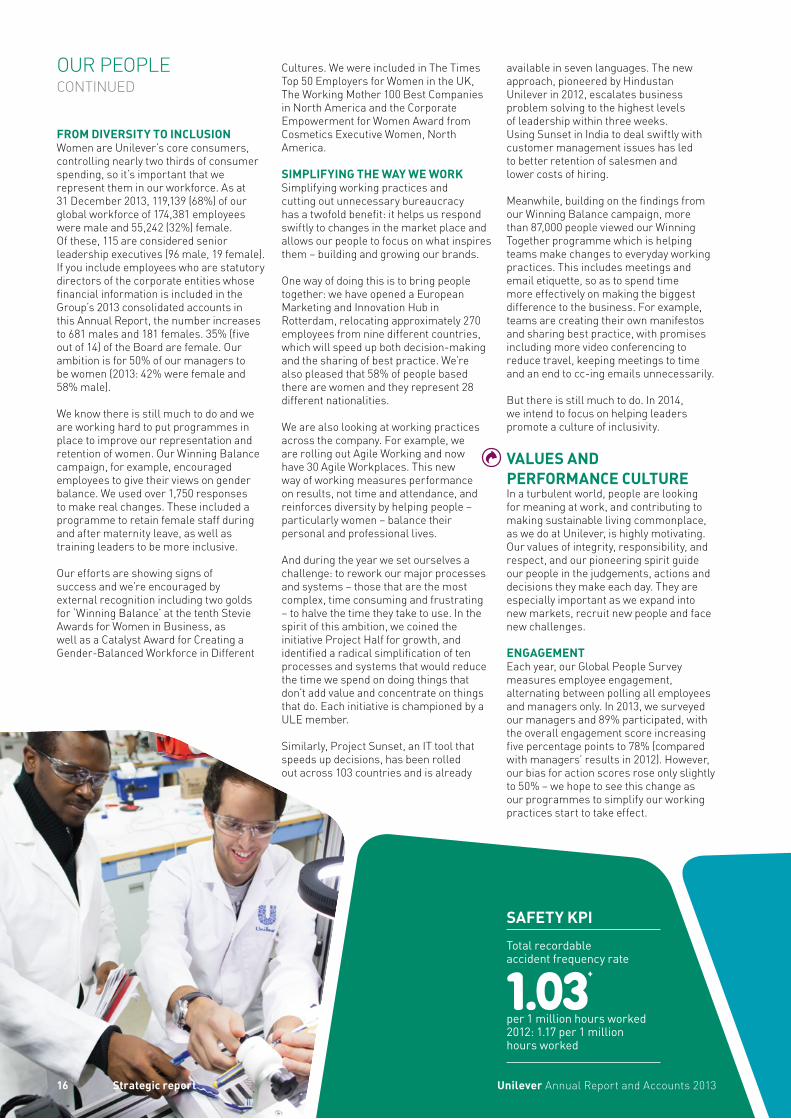
SUPPLY CHAIN ACADEMYWe have created a global infrastructure to develop the technical skills of our managers and senior leaders across our entire supply chain function, building training programmes tailored to the roles of each individual. Within manufacturing, we are building a similarly robust development programme for our teams on the factory floor across the globe to ensure there are common standards of skills in place.
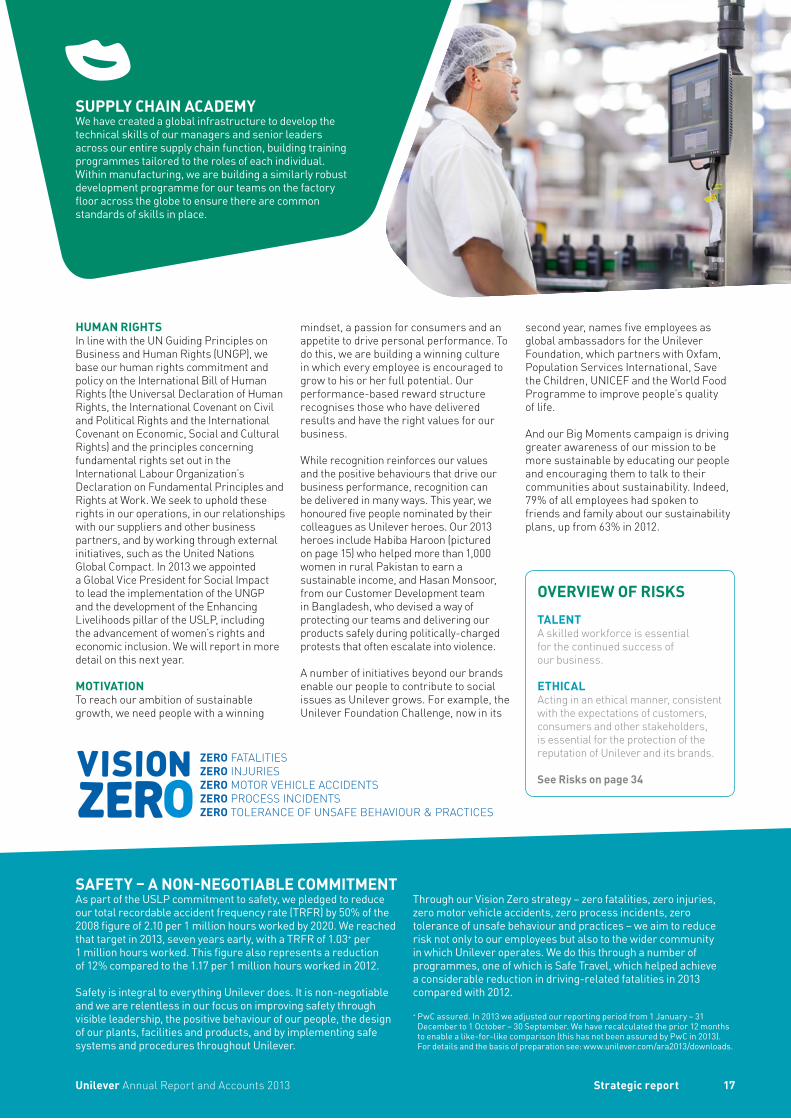
SAFETY – A NON-NEGOTIABLE COMMITMENTAs part of the USLP commitment to safety, we pledged to reduce our total recordable accident frequency rate (TRFR) by 50% of the 2008 figure of 2.10 per 1 million hours worked by 2020. We reached that target in 2013, seven years early, with a TRFR of 1.03+ per 1 million hours worked. This figure also represents a reduction of 12% compared to the 1.17 per 1 million hours worked in 2012.
Safety is integral to everything Unilever does. It is non-negotiable and we are relentless in our focus on improving safety through visible leadership, the positive behaviour of our people, the design of our plants, facilities and products, and by implementing safe systems and procedures throughout Unilever.
Through our Vision Zero strategy – zero fatalities, zero injuries, zero motor vehicle accidents, zero process incidents, zero tolerance of unsafe behaviour and practices – we aim to reduce risk not only to our employees but also to the wider community in which Unilever operates. We do this through a number of programmes, one of which is Safe Travel, which helped achieve a considerable reduction in driving-related fatalities in 2013 compared with 2012.
+ PwC assured. In 2013 we adjusted our reporting period from 1 January – 31 December to 1 October – 30 September. We have recalculated the prior 12 months to enable a like-for-like comparison (this has not been assured by PwC in 2013). For details and the basis of preparation see: www.unilever.com/ara2013/downloads.
second year, names five employees as global ambassadors for the Unilever Foundation, which partners with Oxfam, Population Services International, Save the Children, UNICEF and the World Food Programme to improve people’s quality of life.
And our Big Moments campaign is driving greater awareness of our mission to be more sustainable by educating our people and encouraging them to talk to their communities about sustainability. Indeed, 79% of all employees had spoken to friends and family about our sustainability plans, up from 63% in 2012.
17Strategic reportUnilever Annual Report and Accounts 2013
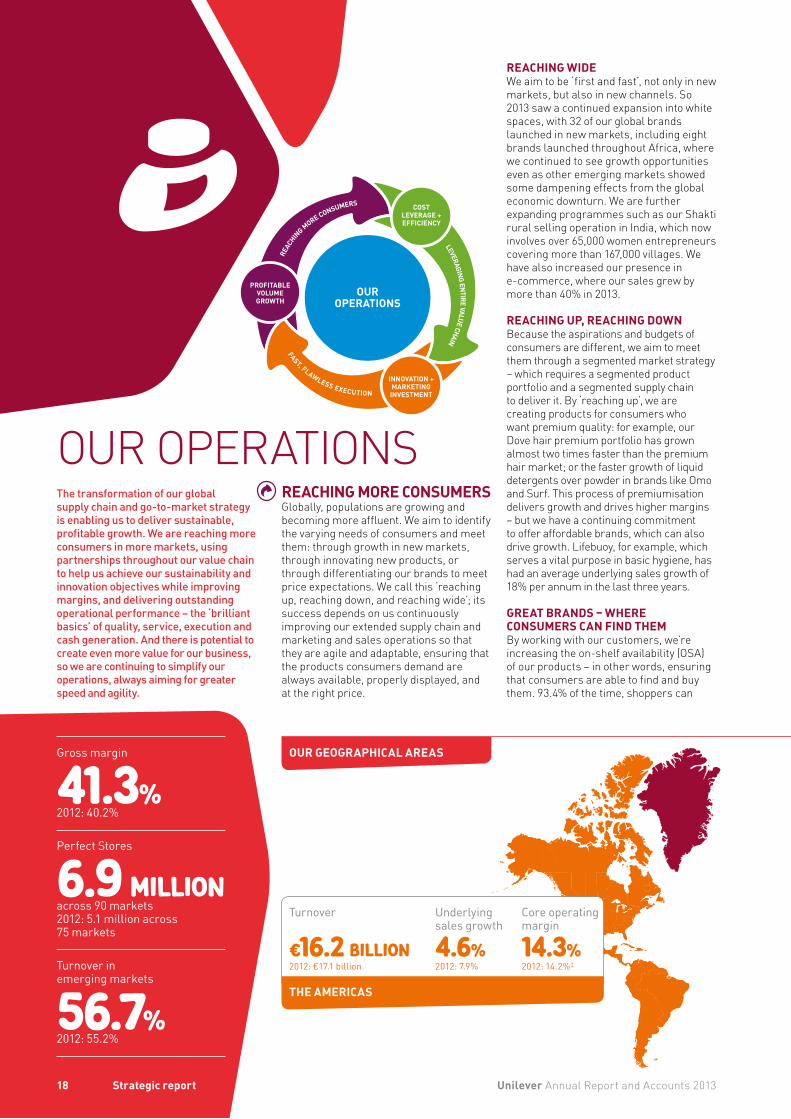
OUROPERATIONS
REAC
HING MORE CONSUMERS
LEVERAGING ENTIRE VALUE CHAIN
FAST, FLAWLESS EXECUTION
INNOVATION +MARKETINGINVESTMENT
PROFITABLEVOLUMEGROWTH
COSTLEVERAGE +EFFICIENCY
The transformation of our global supply chain and go-to-market strategy is enabling us to deliver sustainable, profitable growth. We are reaching more consumers in more markets, using partnerships throughout our value chain to help us achieve our sustainability and innovation objectives while improving margins, and delivering outstanding operational performance – the ‘brilliant basics’ of quality, service, execution and cash generation. And there is potential to create even more value for our business, so we are continuing to simplify our operations, always aiming for greater speed and agility.
REACHING MORE CONSUMERSGlobally, populations are growing and becoming more affluent. We aim to identify the varying needs of consumers and meet them: through growth in new markets, through innovating new products, or through differentiating our brands to meet price expectations. We call this ‘reaching up, reaching down, and reaching wide’; its success depends on us continuously improving our extended supply chain and marketing and sales operations so that they are agile and adaptable, ensuring that the products consumers demand are always available, properly displayed, and at the right price.
REACHING WIDEWe aim to be ‘first and fast’, not only in new markets, but also in new channels. So 2013 saw a continued expansion into white spaces, with 32 of our global brands launched in new markets, including eight brands launched throughout Africa, where we continued to see growth opportunities even as other emerging markets showed some dampening effects from the global economic downturn. We are further expanding programmes such as our Shakti rural selling operation in India, which now involves over 65,000 women entrepreneurs covering more than 167,000 villages. We have also increased our presence in e-commerce, where our sales grew by more than 40% in 2013.
REACHING UP, REACHING DOWNBecause the aspirations and budgets of consumers are different, we aim to meet them through a segmented market strategy – which requires a segmented product portfolio and a segmented supply chain to deliver it. By ‘reaching up’, we are creating products for consumers who want premium quality: for example, our Dove hair premium portfolio has grown almost two times faster than the premium hair market; or the faster growth of liquid detergents over powder in brands like Omo and Surf. This process of premiumisation delivers growth and drives higher margins – but we have a continuing commitment to offer affordable brands, which can also drive growth. Lifebuoy, for example, which serves a vital purpose in basic hygiene, has had an average underlying sales growth of 18% per annum in the last three years.
GREAT BRANDS – WHERE CONSUMERS CAN FIND THEMBy working with our customers, we’re increasing the on-shelf availability (OSA) of our products – in other words, ensuring that consumers are able to find and buy them. 93.4% of the time, shoppers can
Gross margin
41.3%2012: 40.2%
Perfect Stores
6.9 MILLIONacross 90 markets2012: 5.1 million across 75 markets
Turnover in emerging markets
56.7%2012: 55.2%
Turnover
€16.2 BILLION2012: €17.1 billion
Underlying sales growth
4.6%2012: 7.9%
Core operating margin
14.3%2012: 14.2%‡
THE AMERICAS
Unilever Annual Report and Accounts 2013Strategic report18
OUR OPERATIONS
OUR GEOGRAPHICAL AREAS

find our products on the shelves, and in 2013 we have reduced empty shelves by a further 12%.
Our Perfect Stores programme aims to get our products into the right part of the store, well displayed and promoted. It enables us to engage shoppers better and more relevantly through in-store communication, with the aim of driving growth in every store in the programme, from small neighbourhood shops to the largest hypermarket. We enrolled an additional 1.8 million Perfect Stores in 2013, reaching a total of 6.9 million Perfect Stores across 90 markets.
FAST, FLAWLESS EXECUTIONOur ability to innovate, deliver quality products and roll out repeatable working models across countries more quickly is critical to our success in the market. We’re working hard to achieve high levels of product quality and consumer satisfaction, and making substantial investments in new manufacturing capacity to grow our markets further.
STRIVING FOR QUALITYThe quality of our products, as perceived by consumers, improved in 2013. Consumer complaints fell by 10%, meaning that only 0.00038% of our products sold caused a complaint; product incidents fell by 29%.
‡ Restated: see Financial review starting on page 26.†† AMET refers to Africa, Middle East and Turkey; and
RUB refers to Russia, Ukraine and Belarus.
Turnover
€20.1 BILLION2012: €20.4 billion
Turnover
€13.5 BILLION2012: €13.9 billion
Underlying sales growth
7.8%2012: 10.6%
Underlying sales growth
(1.1)%2012: 0.8%
Core operating margin
13.3%2012: 13.1%‡
Core operating margin
14.9%2012: 14.2%‡
ASIA/AMET/RUB††
EUROPE
IMPROVING LIVELIHOODS FOR VANILLA FARMERSVanilla bean farmers in Madagascar are benefiting from our collaboration with our supplier partner Symrise and the development agency GIZ. The three-year public-private partnership includes field schools to help farmers improve the yield, quality and sustainability of vanilla production, and gives better access to education for their children.
19Unilever Annual Report and Accounts 2013 Strategic report
We cannot be complacent – Unilever Brazil experienced its first public product recall in 85 years, when a malfunction lasting 80 seconds at our AdeS soy juice drink plant contaminated 96 units, resulting in €60 million of lost sales. But we have learnt from this experience, improving our quality processes with revised maintenance and verification procedures, new practices for manufacturing and maintenance staff, and improved links with customer care lines.
SETTING NEW STANDARDS FOR SERVICEWhile we have more to do, our efforts so far are being recognised as leading the industry: in 2013 we were voted the number one fast-moving consumer goods (FMCG) supply chain in the Gartner Top 25 SC ranking, and number one overall for companies based in Europe.
INVESTING IN MANUFACTURINGTo meet our growth targets, we have invested in additional manufacturing capacity. In 2013, we invested €1.6 billion, including in six new factories, with five additional factories planned in 2014. These factories include eco-efficiency technologies such as building orientation and design to minimise energy use, heat recovery, low-energy lighting, energy-efficient motors and rainwater harvesting and re-use for factories in water-stressed locations.
By the end of 2013, three quarters of our factory network had achieved zero non-hazardous waste disposal to landfill.
A new €42 million Home Care factory in Tianjin, China, was the first Unilever greenfield site to be awarded Gold LEED certification for sustainable design including the use of renewable energy and energy and water efficiencies amongst other design criteria.
We are also extending our ‘World Class Manufacturing’ (WCM) programme, which sets a global benchmark for the reduction of waste and cost. By 2014, almost half our total production costs will be from sites in the WCM programme.
SIMPLIFYING FOR SPEED AND AGILITYDuring 2013 we managed a series of rapid product expansions – for example, further rolling out TRESemmé into ten new markets making TRESemmé available in a total of more than 40 countries. We also rolled out our Dove Hair Expert Repair range to more than 50 countries since its launch in February 2013 and Axe Apollo to 60 countries within three months.
However, we recognise that we need still more speed in our processes, decision-making, and execution. We have therefore begun Project Half for growth, designed to simplify our processes, increase our agility, and create savings – half the time, half the spend, half the hassle. One of the ten key areas we will simplify is our number of stock-keeping units (SKUs). We have started a programme selectively to remove SKUs with low turnover.
We believe that this simplification will significantly reduce the number of formulations, materials and non-strategic suppliers that we use, driving costs down. We intend to create space to deliver growth from innovation and enhance our ability to act quickly. We will also use the efficiency savings to invest in our brands.
LEVERAGING ENTIRE VALUE CHAINWe have more than 100,000 suppliers and we deliver to more than 8 million stores. By working with these and other partners we can reach more consumers, develop new products, build new capacity, increase margins, and nurture sustainability. We’re also continuously improving our own operations to get the benefits of our unique scale and reach.
PARTNERING TO WINWe have now signed 90 joint business development plans with our strategic suppliers. In June 2013, more than 350 representatives from our strategic suppliers attended our Partner To Win supplier summit in Singapore. The summit highlighted the advantages of partnerships in innovation, sustainability, and capacity building.
MANUFACTURING KPIsCO2 from energy per tonne of production
98.85KG+
2012: 104.23kg
Water per tonne of production
2.12m3+
2012: 2.27m3
Total waste (sent for disposal)per tonne of production
2.72kg+
2012: 3.94kg
+ PwC assured. In 2013 we adjusted our reporting period from 1 January – 31 December to 1 October – 30 September. We have recalculated the prior 12 months to enable a like-for-like comparison (this has not been assured by PwC in 2013). For details and the basis of preparation see: www.unilever.com/ara2013/downloads.
Unilever Annual Report and Accounts 2013Strategic report20
OUR OPERATIONS CONTINUED
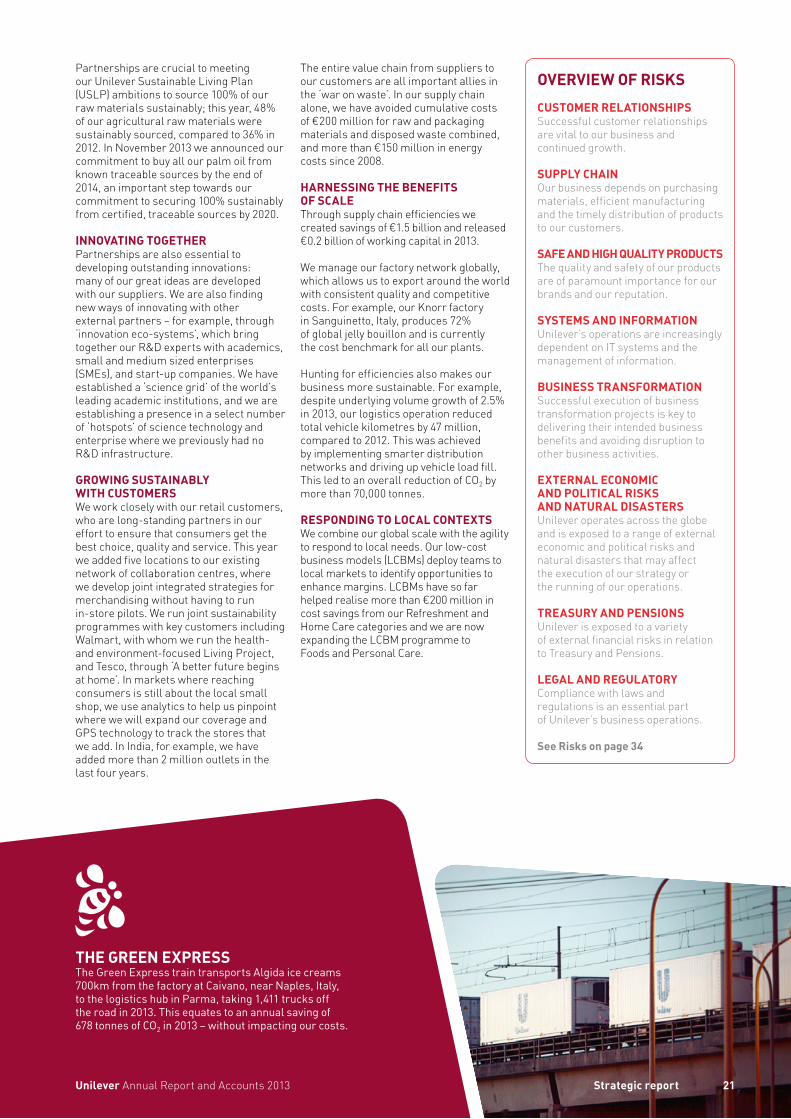
Partnerships are crucial to meeting our Unilever Sustainable Living Plan (USLP) ambitions to source 100% of our raw materials sustainably; this year, 48% of our agricultural raw materials were sustainably sourced, compared to 36% in 2012. In November 2013 we announced our commitment to buy all our palm oil from known traceable sources by the end of 2014, an important step towards our commitment to securing 100% sustainably from certified, traceable sources by 2020.
INNOVATING TOGETHERPartnerships are also essential to developing outstanding innovations: many of our great ideas are developed with our suppliers. We are also finding new ways of innovating with other external partners – for example, through ‘innovation eco-systems’, which bring together our R&D experts with academics, small and medium sized enterprises (SMEs), and start-up companies. We have established a ‘science grid’ of the world’s leading academic institutions, and we are establishing a presence in a select number of ‘hotspots’ of science technology and enterprise where we previously had no R&D infrastructure. GROWING SUSTAINABLY WITH CUSTOMERS We work closely with our retail customers, who are long-standing partners in our effort to ensure that consumers get the best choice, quality and service. This year we added five locations to our existing network of collaboration centres, where we develop joint integrated strategies for merchandising without having to run in-store pilots. We run joint sustainability programmes with key customers including Walmart, with whom we run the health- and environment-focused Living Project, and Tesco, through ‘A better future begins at home’. In markets where reaching consumers is still about the local small shop, we use analytics to help us pinpoint where we will expand our coverage and GPS technology to track the stores that we add. In India, for example, we have added more than 2 million outlets in the last four years.
The entire value chain from suppliers to our customers are all important allies in the ‘war on waste’. In our supply chain alone, we have avoided cumulative costs of €200 million for raw and packaging materials and disposed waste combined, and more than €150 million in energy costs since 2008.
HARNESSING THE BENEFITS OF SCALEThrough supply chain efficiencies we created savings of €1.5 billion and released €0.2 billion of working capital in 2013. We manage our factory network globally, which allows us to export around the world with consistent quality and competitive costs. For example, our Knorr factory in Sanguinetto, Italy, produces 72% of global jelly bouillon and is currently the cost benchmark for all our plants.
Hunting for efficiencies also makes our business more sustainable. For example, despite underlying volume growth of 2.5% in 2013, our logistics operation reduced total vehicle kilometres by 47 million, compared to 2012. This was achieved by implementing smarter distribution networks and driving up vehicle load fill. This led to an overall reduction of CO2 by more than 70,000 tonnes.
RESPONDING TO LOCAL CONTEXTSWe combine our global scale with the agility to respond to local needs. Our low-cost business models (LCBMs) deploy teams to local markets to identify opportunities to enhance margins. LCBMs have so far helped realise more than €200 million in cost savings from our Refreshment and Home Care categories and we are now expanding the LCBM programme to Foods and Personal Care.
OVERVIEW OF RISKSCUSTOMER RELATIONSHIPSSuccessful customer relationships are vital to our business and continued growth.
SUPPLY CHAINOur business depends on purchasing materials, efficient manufacturing and the timely distribution of products to our customers.
SAFE AND HIGH QUALITY PRODUCTSThe quality and safety of our products are of paramount importance for our brands and our reputation.
SYSTEMS AND INFORMATIONUnilever’s operations are increasingly dependent on IT systems and the management of information.
BUSINESS TRANSFORMATIONSuccessful execution of business transformation projects is key to delivering their intended business benefits and avoiding disruption to other business activities.
EXTERNAL ECONOMIC AND POLITICAL RISKS AND NATURAL DISASTERSUnilever operates across the globe and is exposed to a range of external economic and political risks and natural disasters that may affect the execution of our strategy or the running of our operations.
TREASURY AND PENSIONSUnilever is exposed to a variety of external financial risks in relation to Treasury and Pensions.
LEGAL AND REGULATORYCompliance with laws and regulations is an essential part of Unilever’s business operations.
See Risks on page 34
THE GREEN EXPRESSThe Green Express train transports Algida ice creams 700km from the factory at Caivano, near Naples, Italy, to the logistics hub in Parma, taking 1,411 trucks off the road in 2013. This equates to an annual saving of 678 tonnes of CO2 in 2013 – without impacting our costs.
21Strategic reportUnilever Annual Report and Accounts 2013
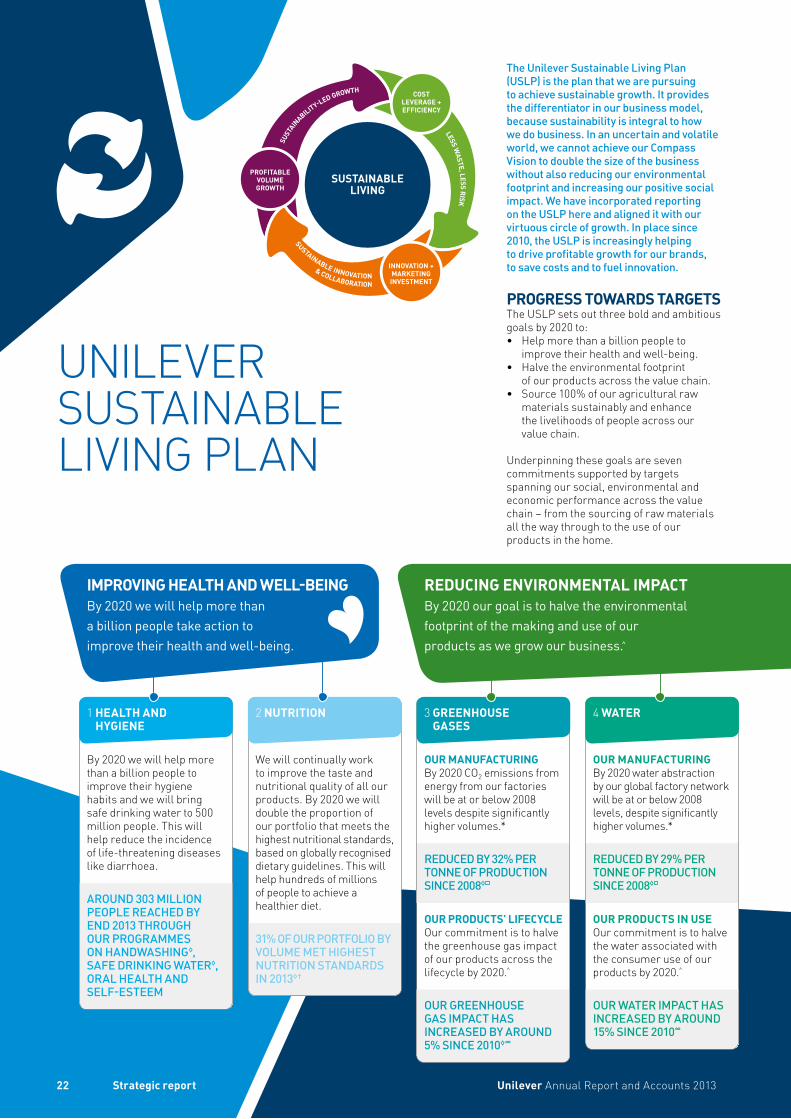
SUSTAINABLE LIVING
INNOVATION +MARKETINGINVESTMENT
SUST
AINABILITY-LED GROWTH
LESS WASTE, LESS RISK
SUSTAINABLE INNOVATION& COLLABORATION
PROFITABLEVOLUMEGROWTH
COSTLEVERAGE +EFFICIENCY
The Unilever Sustainable Living Plan (USLP) is the plan that we are pursuing to achieve sustainable growth. It provides the differentiator in our business model, because sustainability is integral to how we do business. In an uncertain and volatile world, we cannot achieve our Compass Vision to double the size of the business without also reducing our environmental footprint and increasing our positive social impact. We have incorporated reporting on the USLP here and aligned it with our virtuous circle of growth. In place since 2010, the USLP is increasingly helping to drive profitable growth for our brands, to save costs and to fuel innovation.
PROGRESS TOWARDS TARGETSThe USLP sets out three bold and ambitious goals by 2020 to:• Help more than a billion people to
improve their health and well-being.• Halve the environmental footprint
of our products across the value chain.• Source 100% of our agricultural raw
materials sustainably and enhance the livelihoods of people across our value chain.
Underpinning these goals are seven commitments supported by targets spanning our social, environmental and economic performance across the value chain – from the sourcing of raw materials all the way through to the use of our products in the home.
By 2020 we will help more than a billion people take action to improve their health and well-being.
By 2020 our goal is to halve the environmental footprint of the making and use of our products as we grow our business.̂
By 2020 we will help more than a billion people to improve their hygiene habits and we will bring safe drinking water to 500 million people. This will help reduce the incidence of life-threatening diseases like diarrhoea.
AROUND 303 MILLION PEOPLE REACHED BY END 2013 THROUGH OUR PROGRAMMES ON HANDWASHING◊, SAFE DRINKING WATER◊, ORAL HEALTH AND SELF-ESTEEM
OUR MANUFACTURINGBy 2020 CO2 emissions from energy from our factories will be at or below 2008 levels despite significantly higher volumes.*
REDUCED BY 32% PER TONNE OF PRODUCTION SINCE 2008◊
OUR PRODUCTS’ LIFECYCLE Our commitment is to halve the greenhouse gas impact of our products across the lifecycle by 2020.̂
OUR GREENHOUSE GAS IMPACT HAS INCREASED BY AROUND 5% SINCE 2010װ
We will continually work to improve the taste and nutritional quality of all our products. By 2020 we will double the proportion of our portfolio that meets the highest nutritional standards, based on globally recognised dietary guidelines. This will help hundreds of millions of people to achieve a healthier diet.
31% OF OUR PORTFOLIO BY VOLUME MET HIGHEST NUTRITION STANDARDS IN 2013נ
OUR MANUFACTURINGBy 2020 water abstraction by our global factory network will be at or below 2008 levels, despite significantly higher volumes.*
REDUCED BY 29% PER TONNE OF PRODUCTION SINCE 2008◊
OUR PRODUCTS IN USEOur commitment is to halve the water associated with the consumer use of our products by 2020.̂
OUR WATER IMPACT HAS INCREASED BY AROUND 15% SINCE 2010∞
IMPROVING HEALTH AND WELL-BEING REDUCING ENVIRONMENTAL IMPACT
Unilever Annual Report and Accounts 201322 Strategic report
UNILEVER SUSTAINABLE LIVING PLAN
1 HEALTH AND HYGIENE
2 NUTRITION 3 GREENHOUSE GASES
4 WATER
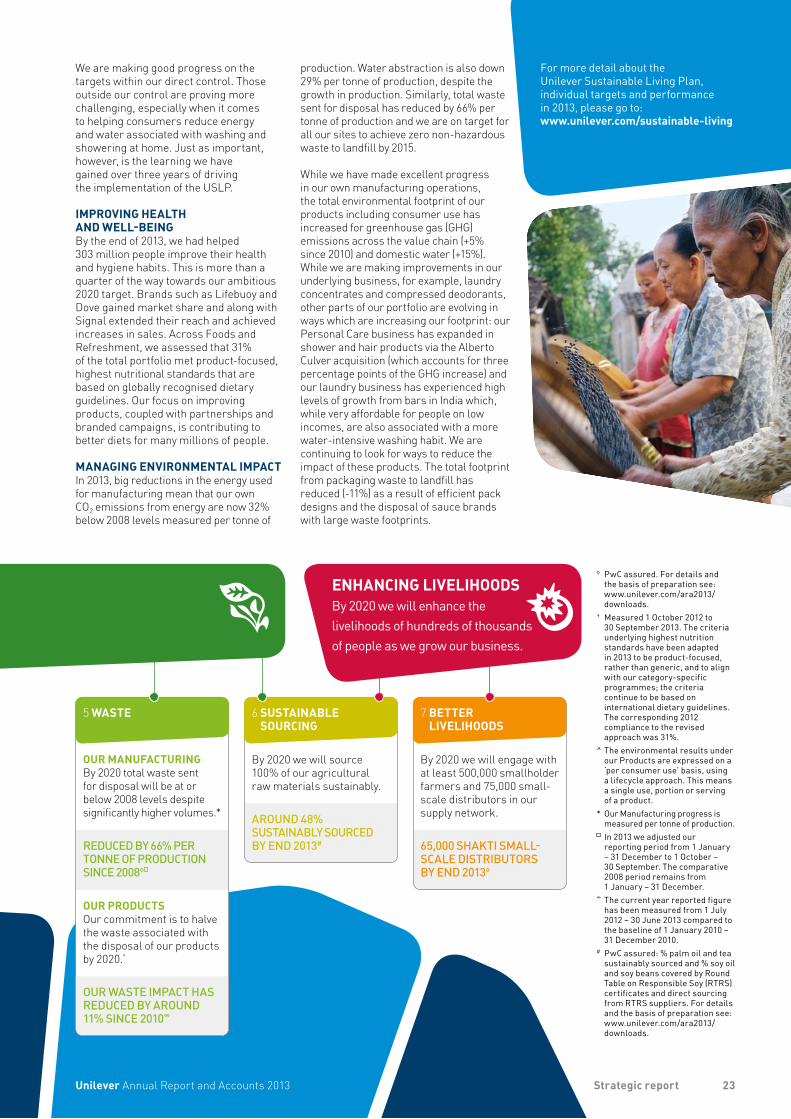
We are making good progress on the targets within our direct control. Those outside our control are proving more challenging, especially when it comes to helping consumers reduce energy and water associated with washing and showering at home. Just as important, however, is the learning we have gained over three years of driving the implementation of the USLP.
IMPROVING HEALTH AND WELL-BEINGBy the end of 2013, we had helped 303 million people improve their health and hygiene habits. This is more than a quarter of the way towards our ambitious 2020 target. Brands such as Lifebuoy and Dove gained market share and along with Signal extended their reach and achieved increases in sales. Across Foods and Refreshment, we assessed that 31% of the total portfolio met product-focused, highest nutritional standards that are based on globally recognised dietary guidelines. Our focus on improving products, coupled with partnerships and branded campaigns, is contributing to better diets for many millions of people.
MANAGING ENVIRONMENTAL IMPACTIn 2013, big reductions in the energy used for manufacturing mean that our own CO2 emissions from energy are now 32% below 2008 levels measured per tonne of
production. Water abstraction is also down 29% per tonne of production, despite the growth in production. Similarly, total waste sent for disposal has reduced by 66% per tonne of production and we are on target for all our sites to achieve zero non-hazardous waste to landfill by 2015.
While we have made excellent progress in our own manufacturing operations, the total environmental footprint of our products including consumer use has increased for greenhouse gas (GHG) emissions across the value chain (+5% since 2010) and domestic water (+15%). While we are making improvements in our underlying business, for example, laundry concentrates and compressed deodorants, other parts of our portfolio are evolving in ways which are increasing our footprint: our Personal Care business has expanded in shower and hair products via the Alberto Culver acquisition (which accounts for three percentage points of the GHG increase) and our laundry business has experienced high levels of growth from bars in India which, while very affordable for people on low incomes, are also associated with a more water-intensive washing habit. We are continuing to look for ways to reduce the impact of these products. The total footprint from packaging waste to landfill has reduced (-11%) as a result of efficient pack designs and the disposal of sauce brands with large waste footprints.
For more detail about the Unilever Sustainable Living Plan, individual targets and performance in 2013, please go to: www.unilever.com/sustainable-living
OUR MANUFACTURINGBy 2020 total waste sent for disposal will be at or below 2008 levels despite significantly higher volumes.*
REDUCED BY 66% PER TONNE OF PRODUCTION SINCE 2008◊
OUR PRODUCTS Our commitment is to halve the waste associated with the disposal of our products by 2020.̂
OUR WASTE IMPACT HAS REDUCED BY AROUND 11% SINCE 2010∞
By 2020 we will source 100% of our agricultural raw materials sustainably.
AROUND 48% SUSTAINABLY SOURCED BY END 2013#
By 2020 we will engage with at least 500,000 smallholder farmers and 75,000 small- scale distributors in our supply network.
65,000 SHAKTI SMALL- SCALE DISTRIBUTORS BY END 2013◊
◊ PwC assured. For details and the basis of preparation see: www.unilever.com/ara2013/downloads.
† Measured 1 October 2012 to 30 September 2013. The criteria underlying highest nutrition standards have been adapted in 2013 to be product-focused, rather than generic, and to align with our category-specific programmes; the criteria continue to be based on international dietary guidelines. The corresponding 2012 compliance to the revised approach was 31%.
^ The environmental results under our Products are expressed on a ‘per consumer use’ basis, using a lifecycle approach. This means a single use, portion or serving of a product.
* Our Manufacturing progress is measured per tonne of production.
In 2013 we adjusted our reporting period from 1 January – 31 December to 1 October – 30 September. The comparative 2008 period remains from 1 January – 31 December.
∞ The current year reported figure has been measured from 1 July 2012 – 30 June 2013 compared to the baseline of 1 January 2010 – 31 December 2010.
# PwC assured: % palm oil and tea sustainably sourced and % soy oil and soy beans covered by Round Table on Responsible Soy (RTRS) certificates and direct sourcing from RTRS suppliers. For details and the basis of preparation see: www.unilever.com/ara2013/downloads.
ENHANCING LIVELIHOODSBy 2020 we will enhance the livelihoods of hundreds of thousands of people as we grow our business.
23Strategic reportUnilever Annual Report and Accounts 2013
5 WASTE 6 SUSTAINABLE SOURCING
7 BETTER LIVELIHOODS
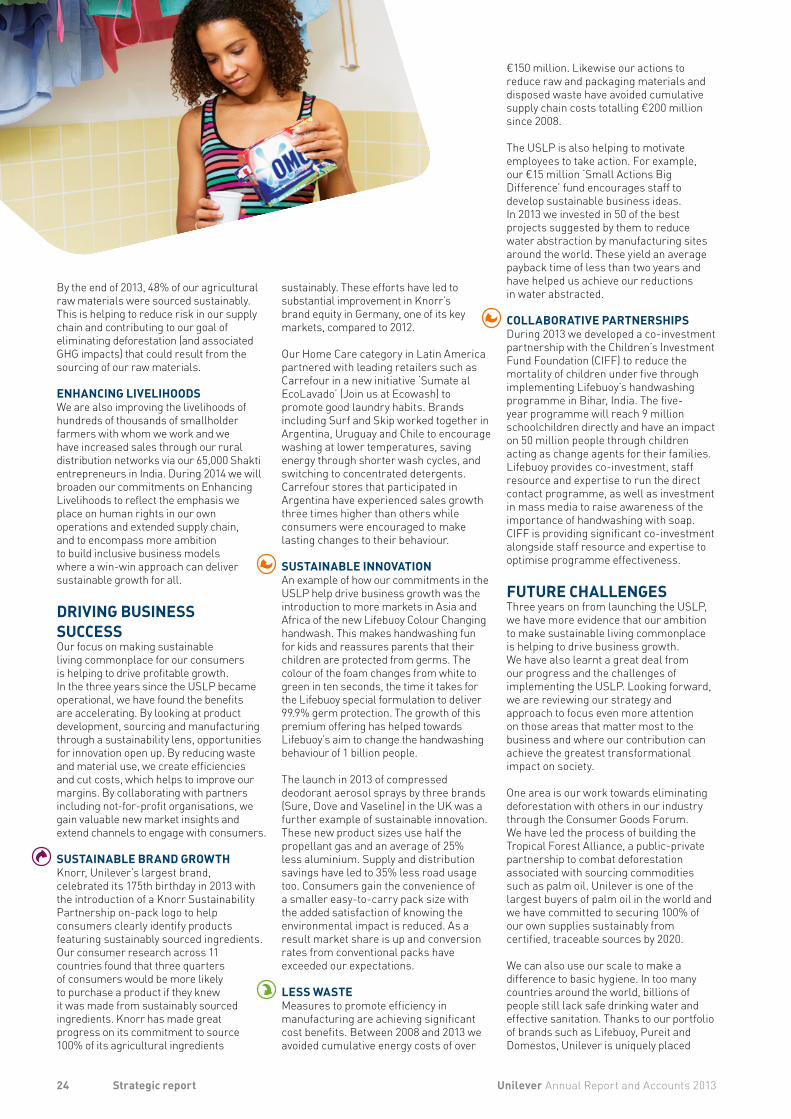
By the end of 2013, 48% of our agricultural raw materials were sourced sustainably. This is helping to reduce risk in our supply chain and contributing to our goal of eliminating deforestation (and associated GHG impacts) that could result from the sourcing of our raw materials.
ENHANCING LIVELIHOODSWe are also improving the livelihoods of hundreds of thousands of smallholder farmers with whom we work and we have increased sales through our rural distribution networks via our 65,000 Shakti entrepreneurs in India. During 2014 we will broaden our commitments on Enhancing Livelihoods to reflect the emphasis we place on human rights in our own operations and extended supply chain, and to encompass more ambition to build inclusive business models where a win-win approach can deliver sustainable growth for all.
DRIVING BUSINESS SUCCESSOur focus on making sustainable living commonplace for our consumers is helping to drive profitable growth. In the three years since the USLP became operational, we have found the benefits are accelerating. By looking at product development, sourcing and manufacturing through a sustainability lens, opportunities for innovation open up. By reducing waste and material use, we create efficiencies and cut costs, which helps to improve our margins. By collaborating with partners including not-for-profit organisations, we gain valuable new market insights and extend channels to engage with consumers.
SUSTAINABLE BRAND GROWTHKnorr, Unilever’s largest brand, celebrated its 175th birthday in 2013 with the introduction of a Knorr Sustainability Partnership on-pack logo to help consumers clearly identify products featuring sustainably sourced ingredients. Our consumer research across 11 countries found that three quarters of consumers would be more likely to purchase a product if they knew it was made from sustainably sourced ingredients. Knorr has made great progress on its commitment to source 100% of its agricultural ingredients
sustainably. These efforts have led to substantial improvement in Knorr’s brand equity in Germany, one of its key markets, compared to 2012.
Our Home Care category in Latin America partnered with leading retailers such as Carrefour in a new initiative ‘Sumate al EcoLavado’ (Join us at Ecowash) to promote good laundry habits. Brands including Surf and Skip worked together in Argentina, Uruguay and Chile to encourage washing at lower temperatures, saving energy through shorter wash cycles, and switching to concentrated detergents. Carrefour stores that participated in Argentina have experienced sales growth three times higher than others while consumers were encouraged to make lasting changes to their behaviour.
SUSTAINABLE INNOVATIONAn example of how our commitments in the USLP help drive business growth was the introduction to more markets in Asia and Africa of the new Lifebuoy Colour Changing handwash. This makes handwashing fun for kids and reassures parents that their children are protected from germs. The colour of the foam changes from white to green in ten seconds, the time it takes for the Lifebuoy special formulation to deliver 99.9% germ protection. The growth of this premium offering has helped towards Lifebuoy’s aim to change the handwashing behaviour of 1 billion people.
The launch in 2013 of compressed deodorant aerosol sprays by three brands (Sure, Dove and Vaseline) in the UK was a further example of sustainable innovation. These new product sizes use half the propellant gas and an average of 25% less aluminium. Supply and distribution savings have led to 35% less road usage too. Consumers gain the convenience of a smaller easy-to-carry pack size with the added satisfaction of knowing the environmental impact is reduced. As a result market share is up and conversion rates from conventional packs have exceeded our expectations.
LESS WASTEMeasures to promote efficiency in manufacturing are achieving significant cost benefits. Between 2008 and 2013 we avoided cumulative energy costs of over
€150 million. Likewise our actions to reduce raw and packaging materials and disposed waste have avoided cumulative supply chain costs totalling €200 million since 2008.
The USLP is also helping to motivate employees to take action. For example, our €15 million ‘Small Actions Big Difference’ fund encourages staff to develop sustainable business ideas. In 2013 we invested in 50 of the best projects suggested by them to reduce water abstraction by manufacturing sites around the world. These yield an average payback time of less than two years and have helped us achieve our reductions in water abstracted.
COLLABORATIVE PARTNERSHIPSDuring 2013 we developed a co-investment partnership with the Children’s Investment Fund Foundation (CIFF) to reduce the mortality of children under five through implementing Lifebuoy’s handwashing programme in Bihar, India. The five- year programme will reach 9 million schoolchildren directly and have an impact on 50 million people through children acting as change agents for their families. Lifebuoy provides co-investment, staff resource and expertise to run the direct contact programme, as well as investment in mass media to raise awareness of the importance of handwashing with soap. CIFF is providing significant co-investment alongside staff resource and expertise to optimise programme effectiveness.
FUTURE CHALLENGESThree years on from launching the USLP, we have more evidence that our ambition to make sustainable living commonplace is helping to drive business growth. We have also learnt a great deal from our progress and the challenges of implementing the USLP. Looking forward, we are reviewing our strategy and approach to focus even more attention on those areas that matter most to the business and where our contribution can achieve the greatest transformational impact on society.
One area is our work towards eliminating deforestation with others in our industry through the Consumer Goods Forum. We have led the process of building the Tropical Forest Alliance, a public-private partnership to combat deforestation associated with sourcing commodities such as palm oil. Unilever is one of the largest buyers of palm oil in the world and we have committed to securing 100% of our own supplies sustainably from certified, traceable sources by 2020.
We can also use our scale to make a difference to basic hygiene. In too many countries around the world, billions of people still lack safe drinking water and effective sanitation. Thanks to our portfolio of brands such as Lifebuoy, Pureit and Domestos, Unilever is uniquely placed
24 Unilever Annual Report and Accounts 2013Strategic report
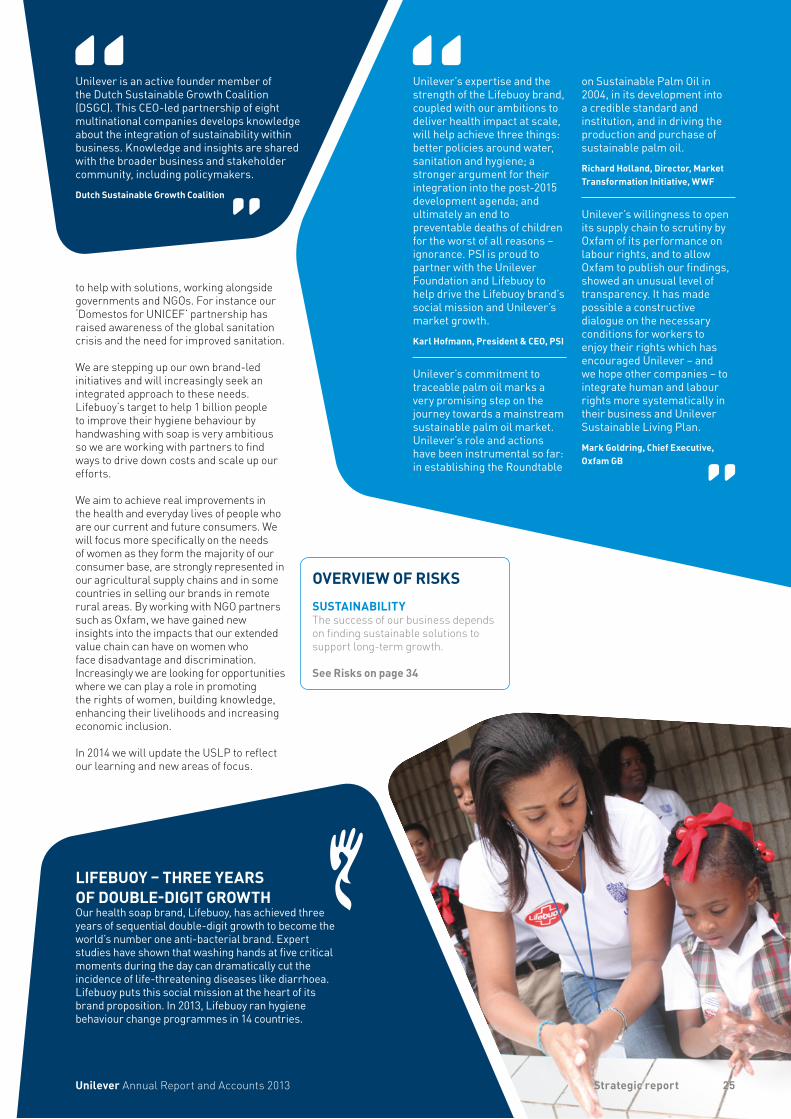
to help with solutions, working alongside governments and NGOs. For instance our ‘Domestos for UNICEF’ partnership has raised awareness of the global sanitation crisis and the need for improved sanitation.
We are stepping up our own brand-led initiatives and will increasingly seek an integrated approach to these needs. Lifebuoy’s target to help 1 billion people to improve their hygiene behaviour by handwashing with soap is very ambitious so we are working with partners to find ways to drive down costs and scale up our efforts.
We aim to achieve real improvements in the health and everyday lives of people who are our current and future consumers. We will focus more specifically on the needs of women as they form the majority of our consumer base, are strongly represented in our agricultural supply chains and in some countries in selling our brands in remote rural areas. By working with NGO partners such as Oxfam, we have gained new insights into the impacts that our extended value chain can have on women who face disadvantage and discrimination. Increasingly we are looking for opportunities where we can play a role in promoting the rights of women, building knowledge, enhancing their livelihoods and increasing economic inclusion.
In 2014 we will update the USLP to reflect our learning and new areas of focus.
OVERVIEW OF RISKSSUSTAINABILITYThe success of our business depends on finding sustainable solutions to support long-term growth.
See Risks on page 34
LIFEBUOY – THREE YEARS OF DOUBLE-DIGIT GROWTHOur health soap brand, Lifebuoy, has achieved three years of sequential double-digit growth to become the world’s number one anti-bacterial brand. Expert studies have shown that washing hands at five critical moments during the day can dramatically cut the incidence of life-threatening diseases like diarrhoea. Lifebuoy puts this social mission at the heart of its brand proposition. In 2013, Lifebuoy ran hygiene behaviour change programmes in 14 countries.
Unilever is an active founder member of the Dutch Sustainable Growth Coalition (DSGC). This CEO-led partnership of eight multinational companies develops knowledge about the integration of sustainability within business. Knowledge and insights are shared with the broader business and stakeholder community, including policymakers.
Dutch Sustainable Growth Coalition
Unilever’s expertise and the strength of the Lifebuoy brand, coupled with our ambitions to deliver health impact at scale, will help achieve three things: better policies around water, sanitation and hygiene; a stronger argument for their integration into the post-2015 development agenda; and ultimately an end to preventable deaths of children for the worst of all reasons – ignorance. PSI is proud to partner with the Unilever Foundation and Lifebuoy to help drive the Lifebuoy brand’s social mission and Unilever’s market growth.
Karl Hofmann, President & CEO, PSI
Unilever’s commitment to traceable palm oil marks a very promising step on the journey towards a mainstream sustainable palm oil market. Unilever’s role and actions have been instrumental so far: in establishing the Roundtable
on Sustainable Palm Oil in 2004, in its development into a credible standard and institution, and in driving the production and purchase of sustainable palm oil.
Richard Holland, Director, Market Transformation Initiative, WWF
Unilever’s willingness to open its supply chain to scrutiny by Oxfam of its performance on labour rights, and to allow Oxfam to publish our findings, showed an unusual level of transparency. It has made possible a constructive dialogue on the necessary conditions for workers to enjoy their rights which has encouraged Unilever – and we hope other companies – to integrate human and labour rights more systematically in their business and Unilever Sustainable Living Plan.
Mark Goldring, Chief Executive, Oxfam GB
25Strategic reportUnilever Annual Report and Accounts 2013
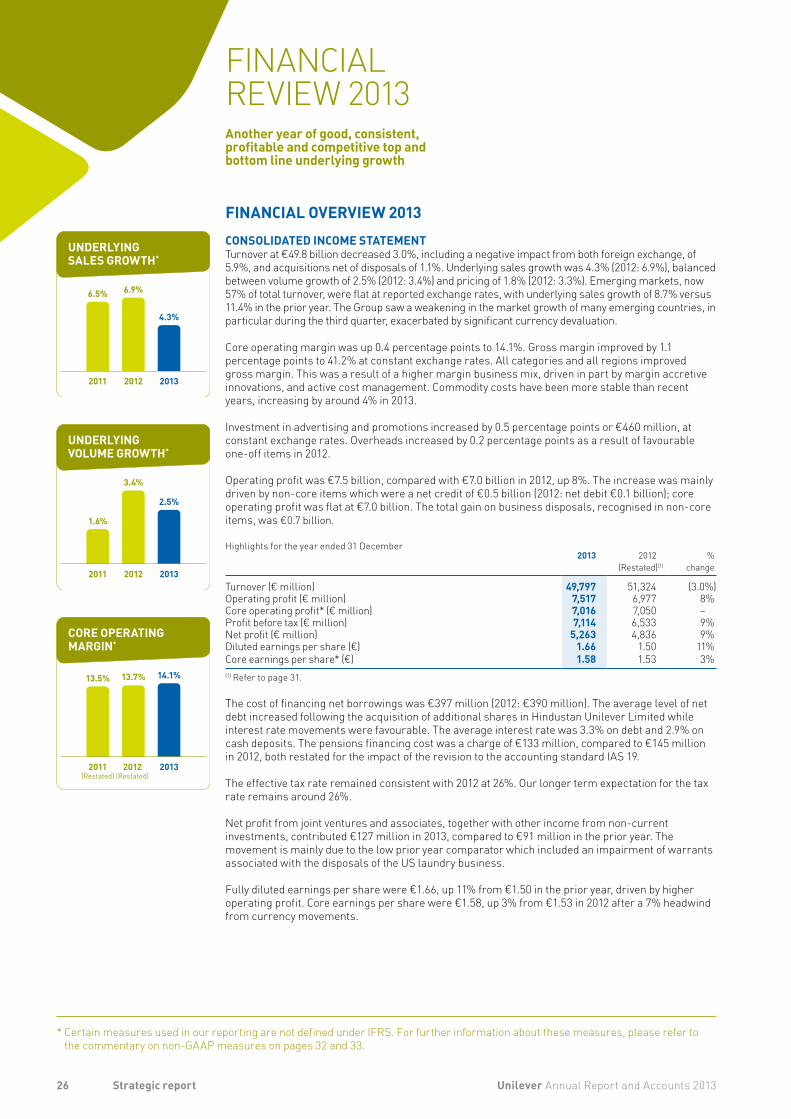
UNDERLYING SALES GROWTH*
2011 2012 2013
6.5% 6.9%
4.3%
UNDERLYING VOLUME GROWTH*
2011 2012 2013
1.6%
3.4%
2.5%
CORE OPERATING MARGIN*
2011 2012 2013
13.5% 13.7% 14.1%
(Restated) (Restated)
Another year of good, consistent, profitable and competitive top and bottom line underlying growth
CONSOLIDATED INCOME STATEMENTTurnover at €49.8 billion decreased 3.0%, including a negative impact from both foreign exchange, of 5.9%, and acquisitions net of disposals of 1.1%. Underlying sales growth was 4.3% (2012: 6.9%), balanced between volume growth of 2.5% (2012: 3.4%) and pricing of 1.8% (2012: 3.3%). Emerging markets, now 57% of total turnover, were flat at reported exchange rates, with underlying sales growth of 8.7% versus 11.4% in the prior year. The Group saw a weakening in the market growth of many emerging countries, in particular during the third quarter, exacerbated by significant currency devaluation.
Core operating margin was up 0.4 percentage points to 14.1%. Gross margin improved by 1.1 percentage points to 41.2% at constant exchange rates. All categories and all regions improved gross margin. This was a result of a higher margin business mix, driven in part by margin accretive innovations, and active cost management. Commodity costs have been more stable than recent years, increasing by around 4% in 2013.
Investment in advertising and promotions increased by 0.5 percentage points or €460 million, at constant exchange rates. Overheads increased by 0.2 percentage points as a result of favourable one-off items in 2012.
Operating profit was €7.5 billion, compared with €7.0 billion in 2012, up 8%. The increase was mainly driven by non-core items which were a net credit of €0.5 billion (2012: net debit €0.1 billion); core operating profit was flat at €7.0 billion. The total gain on business disposals, recognised in non-core items, was €0.7 billion.
Highlights for the year ended 31 December2013 2012
(Restated)(1)%
change
Turnover (€ million) 49,797 51,324 (3.0%)Operating profit (€ million) 7,517 6,977 8%Core operating profit* (€ million) 7,016 7,050 –Profit before tax (€ million) 7,114 6,533 9%Net profit (€ million) 5,263 4,836 9%Diluted earnings per share (€) 1.66 1.50 11%Core earnings per share* (€) 1.58 1.53 3%(1) Refer to page 31.
The cost of financing net borrowings was €397 million (2012: €390 million). The average level of net debt increased following the acquisition of additional shares in Hindustan Unilever Limited while interest rate movements were favourable. The average interest rate was 3.3% on debt and 2.9% on cash deposits. The pensions financing cost was a charge of €133 million, compared to €145 million in 2012, both restated for the impact of the revision to the accounting standard IAS 19.
The effective tax rate remained consistent with 2012 at 26%. Our longer term expectation for the tax rate remains around 26%.
Net profit from joint ventures and associates, together with other income from non-current investments, contributed €127 million in 2013, compared to €91 million in the prior year. The movement is mainly due to the low prior year comparator which included an impairment of warrants associated with the disposals of the US laundry business.
Fully diluted earnings per share were €1.66, up 11% from €1.50 in the prior year, driven by higher operating profit. Core earnings per share were €1.58, up 3% from €1.53 in 2012 after a 7% headwind from currency movements.
* Certain measures used in our reporting are not defined under IFRS. For further information about these measures, please refer to the commentary on non-GAAP measures on pages 32 and 33.
26 Unilever Annual Report and Accounts 2013Strategic report
FINANCIAL REVIEW 2013
FINANCIAL OVERVIEW 2013
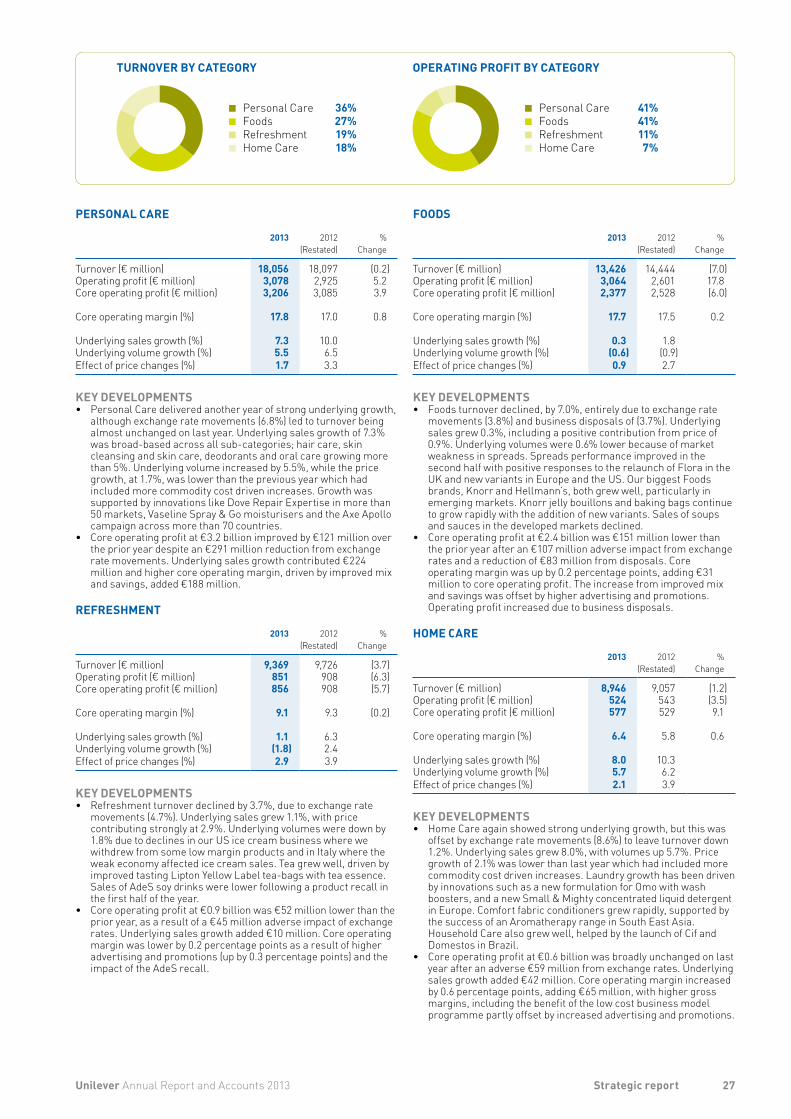
TURNOVER BY CATEGORY
Personal CareFoodsRefreshmentHome Care
36%27%19%18%
OPERATING PROFIT BY CATEGORY
Personal CareFoodsRefreshmentHome Care
41%41%11%7%
PERSONAL CARE
2013 2012
(Restated)%
Change
Turnover (€ million) 18,056 18,097 (0.2)Operating profit (€ million) 3,078 2,925 5.2Core operating profit (€ million) 3,206 3,085 3.9
Core operating margin (%) 17.8 17.0 0.8
Underlying sales growth (%) 7.3 10.0Underlying volume growth (%) 5.5 6.5Effect of price changes (%) 1.7 3.3
KEY DEVELOPMENTS• Personal Care delivered another year of strong underlying growth,
although exchange rate movements (6.8%) led to turnover being almost unchanged on last year. Underlying sales growth of 7.3% was broad-based across all sub-categories; hair care, skin cleansing and skin care, deodorants and oral care growing more than 5%. Underlying volume increased by 5.5%, while the price growth, at 1.7%, was lower than the previous year which had included more commodity cost driven increases. Growth was supported by innovations like Dove Repair Expertise in more than 50 markets, Vaseline Spray & Go moisturisers and the Axe Apollo campaign across more than 70 countries.
• Core operating profit at €3.2 billion improved by €121 million over the prior year despite an €291 million reduction from exchange rate movements. Underlying sales growth contributed €224 million and higher core operating margin, driven by improved mix and savings, added €188 million.
REFRESHMENT
2013 2012
(Restated)%
Change
Turnover (€ million) 9,369 9,726 (3.7)Operating profit (€ million) 851 908 (6.3)Core operating profit (€ million) 856 908 (5.7)
Core operating margin (%) 9.1 9.3 (0.2)
Underlying sales growth (%) 1.1 6.3Underlying volume growth (%) (1.8) 2.4Effect of price changes (%) 2.9 3.9
KEY DEVELOPMENTS• Refreshment turnover declined by 3.7%, due to exchange rate
movements (4.7%). Underlying sales grew 1.1%, with price contributing strongly at 2.9%. Underlying volumes were down by 1.8% due to declines in our US ice cream business where we withdrew from some low margin products and in Italy where the weak economy affected ice cream sales. Tea grew well, driven by improved tasting Lipton Yellow Label tea-bags with tea essence. Sales of AdeS soy drinks were lower following a product recall in the first half of the year.
• Core operating profit at €0.9 billion was €52 million lower than the prior year, as a result of a €45 million adverse impact of exchange rates. Underlying sales growth added €10 million. Core operating margin was lower by 0.2 percentage points as a result of higher advertising and promotions (up by 0.3 percentage points) and the impact of the AdeS recall.
FOODS
2013 2012
(Restated)%
Change
Turnover (€ million) 13,426 14,444 (7.0)Operating profit (€ million) 3,064 2,601 17.8Core operating profit (€ million) 2,377 2,528 (6.0)
Core operating margin (%) 17.7 17.5 0.2
Underlying sales growth (%) 0.3 1.8Underlying volume growth (%) (0.6) (0.9)Effect of price changes (%) 0.9 2.7
KEY DEVELOPMENTS• Foods turnover declined, by 7.0%, entirely due to exchange rate
movements (3.8%) and business disposals of (3.7%). Underlying sales grew 0.3%, including a positive contribution from price of 0.9%. Underlying volumes were 0.6% lower because of market weakness in spreads. Spreads performance improved in the second half with positive responses to the relaunch of Flora in the UK and new variants in Europe and the US. Our biggest Foods brands, Knorr and Hellmann’s, both grew well, particularly in emerging markets. Knorr jelly bouillons and baking bags continue to grow rapidly with the addition of new variants. Sales of soups and sauces in the developed markets declined.
• Core operating profit at €2.4 billion was €151 million lower than the prior year after an €107 million adverse impact from exchange rates and a reduction of €83 million from disposals. Core operating margin was up by 0.2 percentage points, adding €31 million to core operating profit. The increase from improved mix and savings was offset by higher advertising and promotions. Operating profit increased due to business disposals.
HOME CARE
2013 2012
(Restated)%
Change
Turnover (€ million) 8,946 9,057 (1.2)Operating profit (€ million) 524 543 (3.5)Core operating profit (€ million) 577 529 9.1
Core operating margin (%) 6.4 5.8 0.6
Underlying sales growth (%) 8.0 10.3Underlying volume growth (%) 5.7 6.2Effect of price changes (%) 2.1 3.9
KEY DEVELOPMENTS• Home Care again showed strong underlying growth, but this was
offset by exchange rate movements (8.6%) to leave turnover down 1.2%. Underlying sales grew 8.0%, with volumes up 5.7%. Price growth of 2.1% was lower than last year which had included more commodity cost driven increases. Laundry growth has been driven by innovations such as a new formulation for Omo with wash boosters, and a new Small & Mighty concentrated liquid detergent in Europe. Comfort fabric conditioners grew rapidly, supported by the success of an Aromatherapy range in South East Asia. Household Care also grew well, helped by the launch of Cif and Domestos in Brazil.
• Core operating profit at €0.6 billion was broadly unchanged on last year after an adverse €59 million from exchange rates. Underlying sales growth added €42 million. Core operating margin increased by 0.6 percentage points, adding €65 million, with higher gross margins, including the benefit of the low cost business model programme partly offset by increased advertising and promotions.
27Unilever Annual Report and Accounts 2013 Strategic report
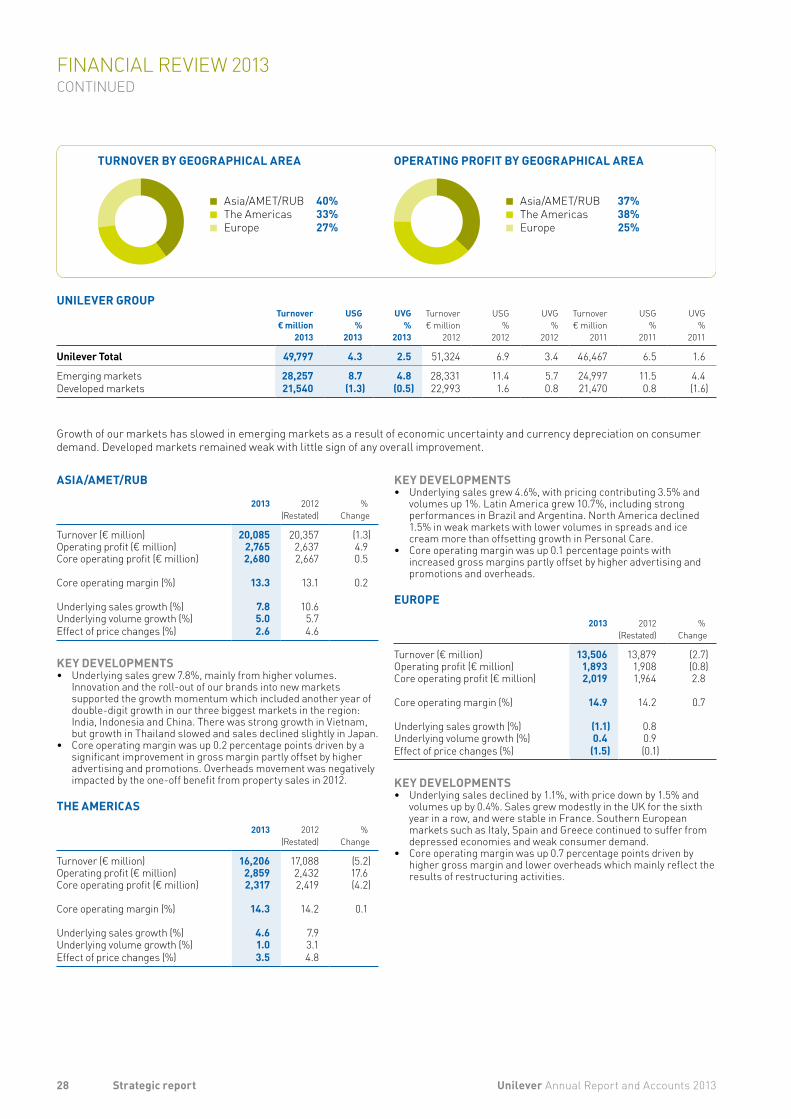
Asia/AMET/RUBThe AmericasEurope
40%33%27%
Asia/AMET/RUBThe AmericasEurope
37%38%25%
TURNOVER BY GEOGRAPHICAL AREA OPERATING PROFIT BY GEOGRAPHICAL AREA
Growth of our markets has slowed in emerging markets as a result of economic uncertainty and currency depreciation on consumer demand. Developed markets remained weak with little sign of any overall improvement.
UNILEVER GROUP
Turnover€ million
2013
USG%
2013
UVG%
2013
Turnover€ million
2012
USG%
2012
UVG%
2012
Turnover€ million
2011
USG%
2011
UVG%
2011
Unilever Total 49,797 4.3 2.5 51,324 6.9 3.4 46,467 6.5 1.6
Emerging markets 28,257 8.7 4.8 28,331 11.4 5.7 24,997 11.5 4.4Developed markets 21,540 (1.3) (0.5) 22,993 1.6 0.8 21,470 0.8 (1.6)
KEY DEVELOPMENTS• Underlying sales grew 4.6%, with pricing contributing 3.5% and
volumes up 1%. Latin America grew 10.7%, including strong performances in Brazil and Argentina. North America declined 1.5% in weak markets with lower volumes in spreads and ice cream more than offsetting growth in Personal Care.
• Core operating margin was up 0.1 percentage points with increased gross margins partly offset by higher advertising and promotions and overheads.
EUROPE
2013 2012 (Restated)
%Change
Turnover (€ million) 13,506 13,879 (2.7)Operating profit (€ million) 1,893 1,908 (0.8)Core operating profit (€ million) 2,019 1,964 2.8
Core operating margin (%) 14.9 14.2 0.7
Underlying sales growth (%) (1.1) 0.8Underlying volume growth (%) 0.4 0.9Effect of price changes (%) (1.5) (0.1)
KEY DEVELOPMENTS• Underlying sales declined by 1.1%, with price down by 1.5% and
volumes up by 0.4%. Sales grew modestly in the UK for the sixth year in a row, and were stable in France. Southern European markets such as Italy, Spain and Greece continued to suffer from depressed economies and weak consumer demand.
• Core operating margin was up 0.7 percentage points driven by higher gross margin and lower overheads which mainly reflect the results of restructuring activities.
ASIA/AMET/RUB
2013 2012(Restated)
%Change
Turnover (€ million) 20,085 20,357 (1.3)Operating profit (€ million) 2,765 2,637 4.9Core operating profit (€ million) 2,680 2,667 0.5
Core operating margin (%) 13.3 13.1 0.2
Underlying sales growth (%) 7.8 10.6Underlying volume growth (%) 5.0 5.7Effect of price changes (%) 2.6 4.6
KEY DEVELOPMENTS• Underlying sales grew 7.8%, mainly from higher volumes.
Innovation and the roll-out of our brands into new markets supported the growth momentum which included another year of double-digit growth in our three biggest markets in the region: India, Indonesia and China. There was strong growth in Vietnam, but growth in Thailand slowed and sales declined slightly in Japan.
• Core operating margin was up 0.2 percentage points driven by a significant improvement in gross margin partly offset by higher advertising and promotions. Overheads movement was negatively impacted by the one-off benefit from property sales in 2012.
THE AMERICAS
2013 2012 (Restated)
%Change
Turnover (€ million) 16,206 17,088 (5.2)Operating profit (€ million) 2,859 2,432 17.6Core operating profit (€ million) 2,317 2,419 (4.2)
Core operating margin (%) 14.3 14.2 0.1
Underlying sales growth (%) 4.6 7.9Underlying volume growth (%) 1.0 3.1Effect of price changes (%) 3.5 4.8
28 Unilever Annual Report and Accounts 2013Strategic report
FINANCIAL REVIEW 2013 CONTINUED
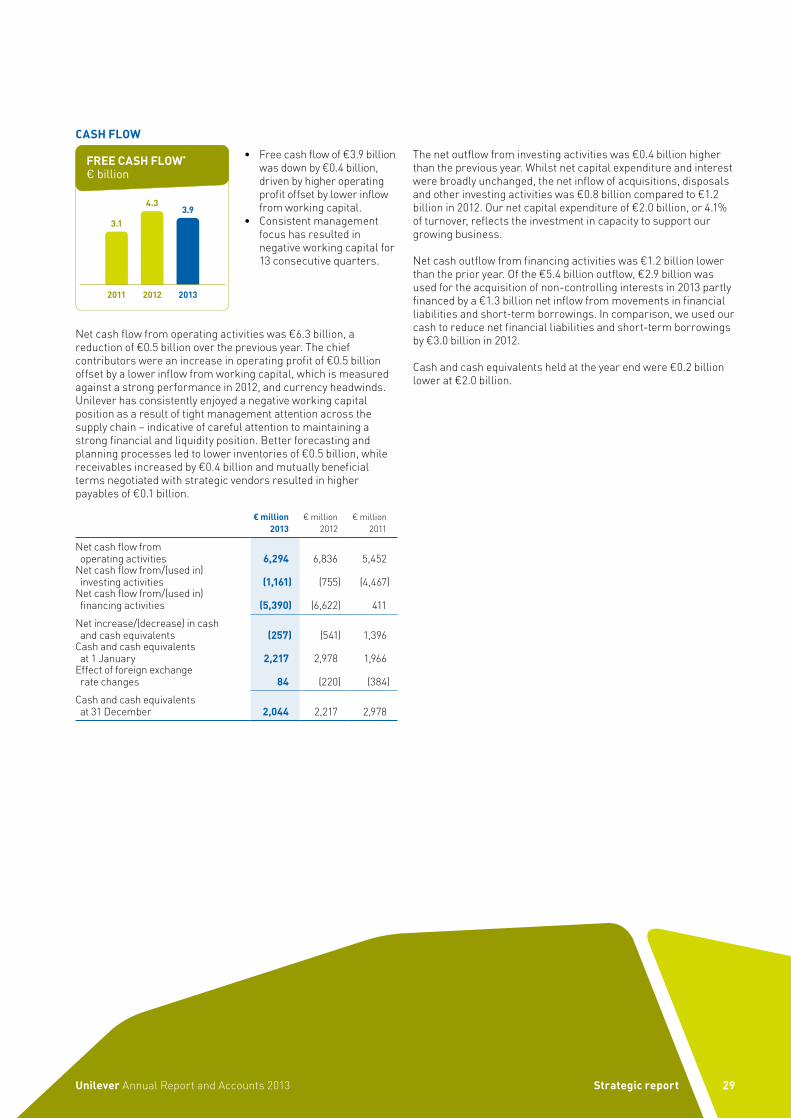
2011 2012 2013
3.1
4.33.9
FREE CASH FLOW* € billion
• Free cash flow of €3.9 billion was down by €0.4 billion, driven by higher operating profit offset by lower inflow from working capital.
• Consistent management focus has resulted in negative working capital for 13 consecutive quarters.
The net outflow from investing activities was €0.4 billion higher than the previous year. Whilst net capital expenditure and interest were broadly unchanged, the net inflow of acquisitions, disposals and other investing activities was €0.8 billion compared to €1.2 billion in 2012. Our net capital expenditure of €2.0 billion, or 4.1% of turnover, reflects the investment in capacity to support our growing business.
Net cash outflow from financing activities was €1.2 billion lower than the prior year. Of the €5.4 billion outflow, €2.9 billion was used for the acquisition of non-controlling interests in 2013 partly financed by a €1.3 billion net inflow from movements in financial liabilities and short-term borrowings. In comparison, we used our cash to reduce net financial liabilities and short-term borrowings by €3.0 billion in 2012.
Cash and cash equivalents held at the year end were €0.2 billion lower at €2.0 billion.
CASH FLOW
Net cash flow from operating activities was €6.3 billion, a reduction of €0.5 billion over the previous year. The chief contributors were an increase in operating profit of €0.5 billion offset by a lower inflow from working capital, which is measured against a strong performance in 2012, and currency headwinds. Unilever has consistently enjoyed a negative working capital position as a result of tight management attention across the supply chain – indicative of careful attention to maintaining a strong financial and liquidity position. Better forecasting and planning processes led to lower inventories of €0.5 billion, while receivables increased by €0.4 billion and mutually beneficial terms negotiated with strategic vendors resulted in higher payables of €0.1 billion.
€ million
2013€ million
2012€ million
2011
Net cash flow from operating activities 6,294 6,836 5,452
Net cash flow from/(used in) investing activities (1,161) (755) (4,467)
Net cash flow from/(used in) financing activities (5,390) (6,622) 411
Net increase/(decrease) in cash and cash equivalents (257) (541) 1,396
Cash and cash equivalents at 1 January 2,217 2,978 1,966
Effect of foreign exchange rate changes 84 (220) (384)
Cash and cash equivalents at 31 December 2,044 2,217 2,978
29Strategic reportUnilever Annual Report and Accounts 2013
BALANCE SHEETUnilever N.V.’s and Unilever PLC’s combined market capitalisation rose from €81.9 billion at the end of 2012 to €83.8 billion at 31 December 2013. The full year dividend for 2013 rose 10% to €1.05. A final dividend of €0.2690 per NV ordinary share and £0.2222 per PLC ordinary share was declared on 21 January 2014. Information on dividends is set out in note 8 on page 109.
€ million2013
€ million2012
(Restated)(1)
Goodwill and intangible assets 20,904 21,718Other non-current assets 12,487 12,324Current assets 12,122 12,147
Total assets 45,513 46,189
Current liabilities 17,382 15,815Non-current liabilities 13,316 14,425
Total liabilities 30,698 30,240
Shareholders’ equity 14,344 15,392Non-controlling interest 471 557
Total equity 14,815 15,949
Total liabilities and equity 45,513 46,189(1) Refer to page 31.
Goodwill and intangible assets reduced by €0.8 billion mainly due to business disposals and currency movements. All material goodwill and indefinite-life intangible assets have been tested for impairment. No impairments were identified.
During 2013 the Group sold its global Skippy business to Hormel Foods for a total cash consideration of approximately US $700 million. It also sold its Wish-Bone and Western dressings brands to Pinnacle Foods Inc. for approximately US $580 million.
In July 2013 Unilever paid INR 192 billion (€2,515 million) for 319,563,398 shares in Hindustan Unilever Limited (representing 14.78% of the total shareholding), increasing the Group ownership to 67%. Accordingly, €104 million previously shown as attributable to non-controlling interests within equity is now attributable to shareholders and the resulting loss on the acquisition recorded in retained earnings is €2,411 million.
Current assets were flat versus 2012, with good progress in reducing inventory levels being offset by higher trade and other receivables.
During 2013 Unilever recognised provisions of €120 million in relation to investigations by national competition authorities. Current liabilities were €1.6 billion higher mainly driven by the impact of a €2.5 billion cash outflow to increase the Group’s interest in Hindustan Unilever Limited. Non-current liabilities (excluding pensions) were broadly in line with the previous year.The net movements in assets and liabilities for all pension arrangements during the year was as follows:
€ million
2013
1 January (3,342)Current service cost (301)Employee contributions 18Special termination benefits (18)Past service costs 53Settlements/curtailments 36Actual return on plan assets (excluding amounts in interest) 934Net interest cost (133)Actuarial gain/(loss) 8Employer contributions 593Reclassification of benefits –Currency retranslation 17531 December (1,977)
The overall net liability for all pension arrangements was €2.0 billion at the end of 2013, down from €3.3 billion at the end of 2012. €1.0 billion of this relates to funded schemes in surplus (2012: €0.8 billion). The decrease in the net obligation reflects the impact of investment returns, in excess of the interest cost on liabilities, and cash contributions. Cash expenditure on pensions was €0.7 billion, the same as in the prior year and as forecast for 2014.
FINANCE AND LIQUIDITYThe Group’s financial strategy provides the financial flexibility to meet strategic and day-to-day needs. Our current long-term credit rating is A+/A1 and our current short-term credit rating is A1/P1. We aim to maintain a competitive balance sheet which we consider to be the equivalent of a credit rating of A+/A1. We believe this provides us with: • appropriate access to equity and debt markets; • sufficient flexibility for acquisitions; • sufficient resilience against economic and financial
uncertainty ensuring ample liquidity; and • optimal weighted average cost of capital, given the above
constraints.
Unilever aims to concentrate cash in the parent and central finance companies in order to ensure maximum flexibility in meeting changing business needs. Operating subsidiaries are financed through the mixture of retained earnings, third-party borrowings and loans from parent and central finance companies. Unilever maintains access to global debt markets through an infrastructure of short-term debt programmes (principally US domestic and euro commercial paper programmes) and long-term debt programmes (principally a US Shelf Registration programme and a European markets Debt Issuance Programme). Debt in the international markets is, in general, issued in the name of NV, PLC, Unilever Finance International BV or Unilever Capital Corporation. NV, PLC and Unilever United States Inc. will normally guarantee such debt where they are not the issuer.
Approximately €1.3 billion (or 59%) of the Unilever Group’s cash and cash equivalents balances are held in foreign subsidiaries. We generally repatriate distributable reserves from our subsidiaries on a regular basis. In the majority of countries we are able to repatriate funds to Unilever N.V. and Unilever PLC through dividends free of tax. In a few countries we face cross-border foreign exchange controls and/or other legal restrictions that prevent balances being available in any means for general use by the parent companies or subsidiaries. In each of the last three years the amount of cash held in these countries was less than €250 million.
30 Unilever Annual Report and Accounts 2013Strategic report
FINANCIAL REVIEW 2013 CONTINUED
We closely monitored all our exposures and counter-party limits.
Unilever has committed credit facilities in place for general corporate purposes. The undrawn bilateral committed credit facilities in place on 31 December 2013 were US $6,400 million. Further details are given in note 16A on page 120.
On 11 February 2013 we redeemed a US $450 million four-year bond which was issued in 2009 at 3.125%. On 21 May 2013 we redeemed a €750 million five-year bond which was issued in 2008 at 4.875%. On 5 August 2013 we issued a seven-year €750 million bond at 1.75%. On 6 September 2013 we issued US $750 million 2.20% fixed rate notes due March 2019. CONTRACTUAL OBLIGATIONS AT 31 DECEMBER 2013
€ million
Total
€ millionDue
within1 year
€ million
Due in1-3 years
€ million
Due in3-5 years
€ millionDue in
over 5 years
Long-term debt 10,790 3,545 2,018 1,263 3,964Interest on financial liabilities 2,578 307 466 371 1,434
Operating lease obligations 1,787 335 513 400 539
Purchase obligations(a) 187 163 19 5 –
Finance leases 312 25 67 40 180Other long-term commitments 1,522 743 610 144 25
Total 17,176 5,118 3,693 2,223 6,142(a) For raw and packaging materials and finished goods.
Unilever’s contractual obligations at the end of 2013 included capital expenditure commitments, borrowings, lease commitments and other commitments. A summary of certain contractual obligations at 31 December 2013 is provided in the preceding table. Further details are set out in the following notes to the consolidated financial statements: note 10 on pages 111 and 112, note 15C on pages 118 and 119, and note 20 on pages 129 to 131.
Unilever is satisfied that its financing arrangements are adequate to meet its working capital needs for the foreseeable future. In relation to the facilities available to the Group, borrowing requirements do not fluctuate materially during the year and are not seasonal.
FINANCIAL INSTRUMENTS AND RISKThe key financial instruments used by Unilever are short-term and long-term borrowings, cash and cash equivalents, and certain plain vanilla derivative instruments, principally comprising interest rate swaps and foreign exchange contracts. The accounting for derivative instruments is discussed in note 16 on page 120 and on pages 124 and 125. The use of leveraged instruments is not permitted.
Treasury processes are governed by standards approved by the Unilever Leadership Executive. Unilever manages a variety of market risks, including the effects of changes in foreign exchange rates, interest rates, commodity costs and liquidity. Further details of the management of these risks are given in note 16 on pages 120 to 125.
BASIS OF REPORTING AND CRITICAL ACCOUNTING POLICIESThe consolidated financial statements have been prepared in accordance with IFRS. The accounting policies that are most significant in connection with our financial reporting are set out in note 1 on pages 94 and 95 and other than as noted below are consistent with those applied in 2012.
In the year the Group adopted IAS 19 (Revised) ‘Employee benefits’ which changes disclosure requirements and restricts the accounting options available for defined benefit pension plans. The changes resulted in an increase in finance costs of €193 million for the year ended 31 December 2013 (€138 million for the year ended 31 December 2012) and a reduction in net defined benefit liability of €198 million in the restated comparative opening balance sheet as at 1 January 2012, with a corresponding increase in actuarial gains or losses on pension schemes before tax when restated under the new standard.
AUDIT FEES AND OPINIONIncluded within operating profit is €21 million (2012: €21 million) paid to the external auditor, of which €16 million (2012: €18 million) related to statutory audit services.
The audit opinions issued, by PricewaterhouseCoopers Accountants N.V. and PricewaterhouseCoopers LLP, on the consolidated results of the Group, as set out on pages 86 to 89, were unqualified and contained no exceptions or emphasis of matter.
Unilever Annual Report and Accounts 2013 31Strategic report
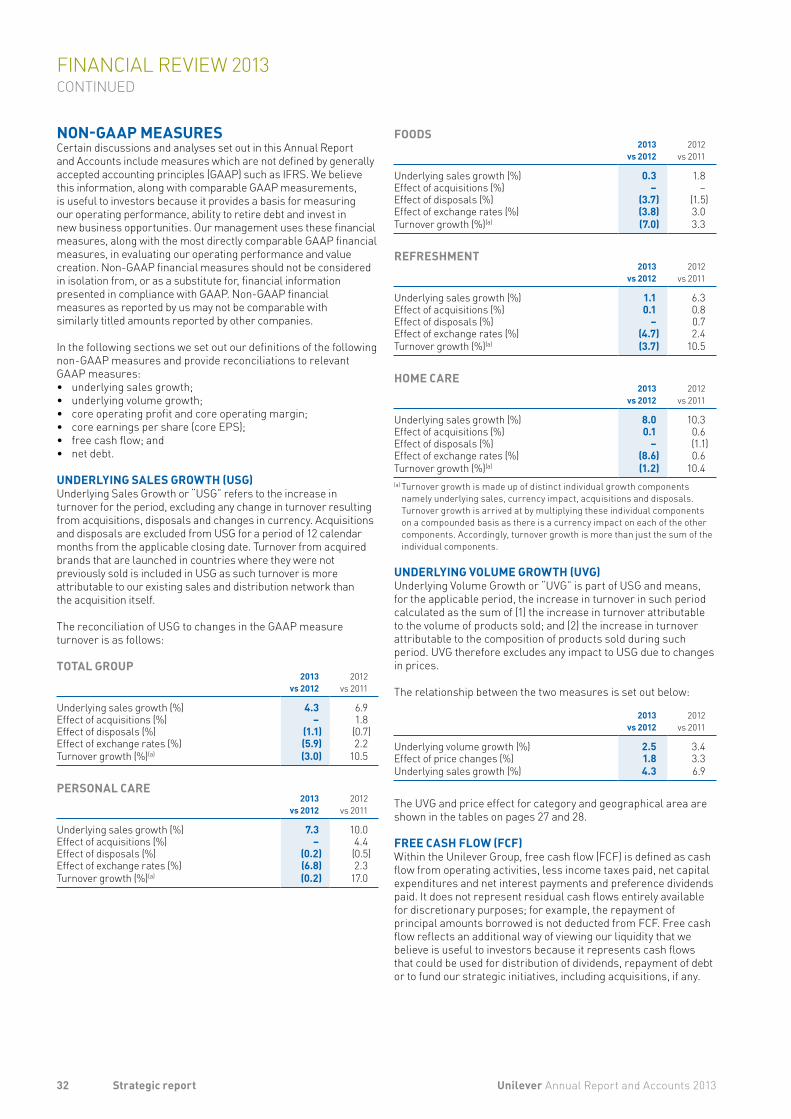
NON-GAAP MEASURESCertain discussions and analyses set out in this Annual Report and Accounts include measures which are not defined by generally accepted accounting principles (GAAP) such as IFRS. We believe this information, along with comparable GAAP measurements, is useful to investors because it provides a basis for measuring our operating performance, ability to retire debt and invest in new business opportunities. Our management uses these financial measures, along with the most directly comparable GAAP financial measures, in evaluating our operating performance and value creation. Non-GAAP financial measures should not be considered in isolation from, or as a substitute for, financial information presented in compliance with GAAP. Non-GAAP financial measures as reported by us may not be comparable with similarly titled amounts reported by other companies.
In the following sections we set out our definitions of the following non-GAAP measures and provide reconciliations to relevant GAAP measures:• underlying sales growth;• underlying volume growth;• core operating profit and core operating margin;• core earnings per share (core EPS);• free cash flow; and• net debt.
UNDERLYING SALES GROWTH (USG)Underlying Sales Growth or “USG” refers to the increase in turnover for the period, excluding any change in turnover resulting from acquisitions, disposals and changes in currency. Acquisitions and disposals are excluded from USG for a period of 12 calendar months from the applicable closing date. Turnover from acquired brands that are launched in countries where they were not previously sold is included in USG as such turnover is more attributable to our existing sales and distribution network than the acquisition itself.
The reconciliation of USG to changes in the GAAP measure turnover is as follows:
TOTAL GROUP
2013vs 2012
2012vs 2011
Underlying sales growth (%) 4.3 6.9Effect of acquisitions (%) – 1.8Effect of disposals (%) (1.1) (0.7)Effect of exchange rates (%) (5.9) 2.2Turnover growth (%)(a) (3.0) 10.5
PERSONAL CARE
2013vs 2012
2012vs 2011
Underlying sales growth (%) 7.3 10.0Effect of acquisitions (%) – 4.4Effect of disposals (%) (0.2) (0.5)Effect of exchange rates (%) (6.8) 2.3Turnover growth (%)(a) (0.2) 17.0
FOODS
2013vs 2012
2012vs 2011
Underlying sales growth (%) 0.3 1.8Effect of acquisitions (%) – –Effect of disposals (%) (3.7) (1.5)Effect of exchange rates (%) (3.8) 3.0Turnover growth (%)(a) (7.0) 3.3
REFRESHMENT
2013vs 2012
2012vs 2011
Underlying sales growth (%) 1.1 6.3Effect of acquisitions (%) 0.1 0.8Effect of disposals (%) – 0.7Effect of exchange rates (%) (4.7) 2.4Turnover growth (%)(a) (3.7) 10.5
HOME CARE
2013vs 2012
2012vs 2011
Underlying sales growth (%) 8.0 10.3Effect of acquisitions (%) 0.1 0.6Effect of disposals (%) – (1.1)Effect of exchange rates (%) (8.6) 0.6Turnover growth (%)(a) (1.2) 10.4(a) Turnover growth is made up of distinct individual growth components
namely underlying sales, currency impact, acquisitions and disposals. Turnover growth is arrived at by multiplying these individual components on a compounded basis as there is a currency impact on each of the other components. Accordingly, turnover growth is more than just the sum of the individual components.
UNDERLYING VOLUME GROWTH (UVG)Underlying Volume Growth or “UVG” is part of USG and means, for the applicable period, the increase in turnover in such period calculated as the sum of (1) the increase in turnover attributable to the volume of products sold; and (2) the increase in turnover attributable to the composition of products sold during such period. UVG therefore excludes any impact to USG due to changes in prices.
The relationship between the two measures is set out below:
2013vs 2012
2012vs 2011
Underlying volume growth (%) 2.5 3.4Effect of price changes (%) 1.8 3.3Underlying sales growth (%) 4.3 6.9
The UVG and price effect for category and geographical area are shown in the tables on pages 27 and 28.
FREE CASH FLOW (FCF)Within the Unilever Group, free cash flow (FCF) is defined as cash flow from operating activities, less income taxes paid, net capital expenditures and net interest payments and preference dividends paid. It does not represent residual cash flows entirely available for discretionary purposes; for example, the repayment of principal amounts borrowed is not deducted from FCF. Free cash flow reflects an additional way of viewing our liquidity that we believe is useful to investors because it represents cash flows that could be used for distribution of dividends, repayment of debt or to fund our strategic initiatives, including acquisitions, if any.
32 Unilever Annual Report and Accounts 2013Strategic report
FINANCIAL REVIEW 2013 CONTINUED
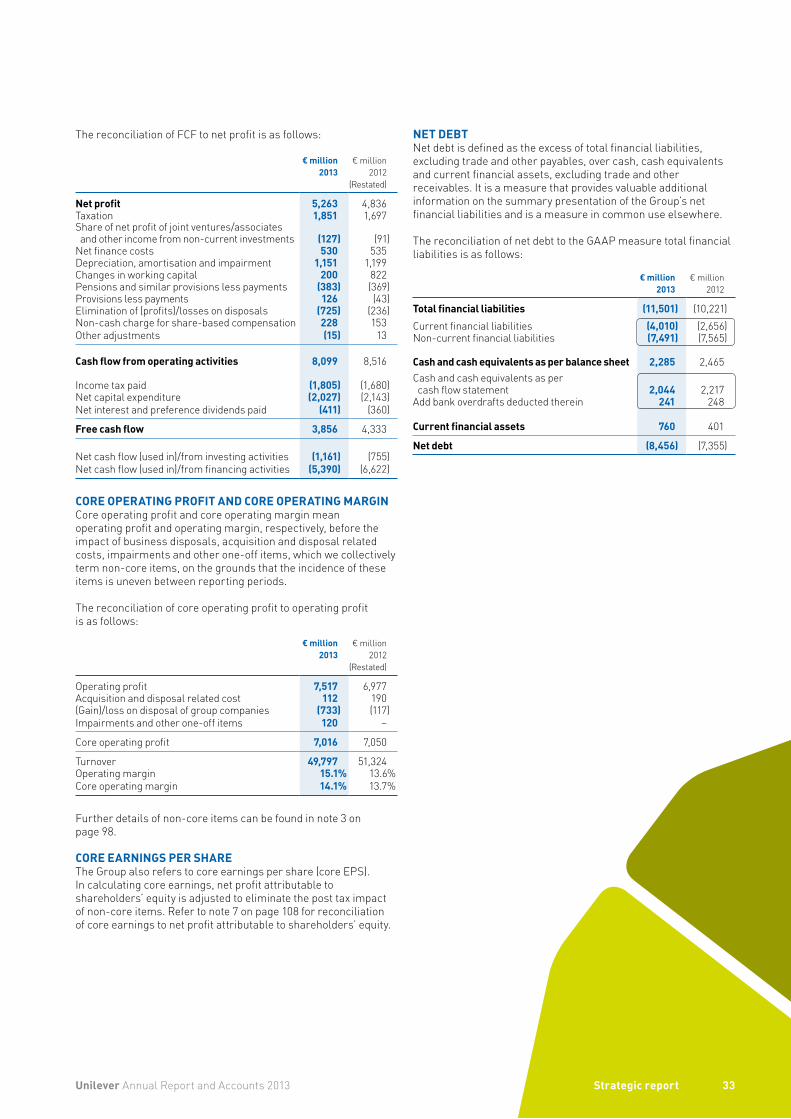
The reconciliation of FCF to net profit is as follows:
€ million2013
€ million2012
(Restated)
Net profit 5,263 4,836Taxation 1,851 1,697Share of net profit of joint ventures/associates and other income from non-current investments (127) (91)
Net finance costs 530 535Depreciation, amortisation and impairment 1,151 1,199Changes in working capital 200 822Pensions and similar provisions less payments (383) (369)Provisions less payments 126 (43)Elimination of (profits)/losses on disposals (725) (236)Non-cash charge for share-based compensation 228 153Other adjustments (15) 13
Cash flow from operating activities 8,099 8,516
Income tax paid (1,805) (1,680)Net capital expenditure (2,027) (2,143)Net interest and preference dividends paid (411) (360)
Free cash flow 3,856 4,333
Net cash flow (used in)/from investing activities (1,161) (755)Net cash flow (used in)/from financing activities (5,390) (6,622)
CORE OPERATING PROFIT AND CORE OPERATING MARGINCore operating profit and core operating margin mean operating profit and operating margin, respectively, before the impact of business disposals, acquisition and disposal related costs, impairments and other one-off items, which we collectively term non-core items, on the grounds that the incidence of these items is uneven between reporting periods.
The reconciliation of core operating profit to operating profit is as follows:
€ million2013
€ million2012
(Restated)
Operating profit 7,517 6,977Acquisition and disposal related cost 112 190(Gain)/loss on disposal of group companies (733) (117)Impairments and other one-off items 120 –
Core operating profit 7,016 7,050
Turnover 49,797 51,324Operating margin 15.1% 13.6%Core operating margin 14.1% 13.7%
Further details of non-core items can be found in note 3 on page 98.
CORE EARNINGS PER SHAREThe Group also refers to core earnings per share (core EPS). In calculating core earnings, net profit attributable to shareholders’ equity is adjusted to eliminate the post tax impact of non-core items. Refer to note 7 on page 108 for reconciliation of core earnings to net profit attributable to shareholders’ equity.
NET DEBTNet debt is defined as the excess of total financial liabilities, excluding trade and other payables, over cash, cash equivalents and current financial assets, excluding trade and other receivables. It is a measure that provides valuable additional information on the summary presentation of the Group’s net financial liabilities and is a measure in common use elsewhere.
The reconciliation of net debt to the GAAP measure total financial liabilities is as follows:
€ million2013
€ million2012
Total financial liabilities (11,501) (10,221)Current financial liabilities (4,010) (2,656)Non-current financial liabilities (7,491) (7,565)
Cash and cash equivalents as per balance sheet 2,285 2,465Cash and cash equivalents as per cash flow statement 2,044 2,217
Add bank overdrafts deducted therein 241 248
Current financial assets 760 401
Net debt (8,456) (7,355)
Unilever Annual Report and Accounts 2013 33Strategic report
The following discussion of the risk outlook and our principal risk management activities includes ‘forward-looking’ statements that reflect Unilever’s view of the operating risk environment. The actual results could differ materially from those projected. See the ‘Cautionary statement’ on the inside back cover.
OUTLOOKMarket conditions for our business were again challenging in 2013 and we do not anticipate this changing significantly in 2014.
Economic pressures are expected to continue. Consumer demand in emerging markets has slowed and is expected to remain subdued in 2014. In developed market economies, there are signs of gradual recovery, but any improvement in consumer demand is likely to be slow and muted and shoppers will remain focused on value. While the greatest pressures in the Eurozone have reduced, they have not been permanently resolved and economic and political risks remain.
Currency markets remain volatile and uncertain. Commodities markets have been relatively stable during 2013 but we remain watchful of potential volatility in 2014. Terrorist activity and political unrest may also result in business interruptions and a decreased demand for our products.
The competitive environment for our business is likely to remain intense in 2014. Our competitors, both global and local, will continue to shift resources into emerging markets. We expect continued high levels of competitive challenge to our many category leadership positions. Some of this may be price based, but we also expect strong innovation based competition. With the improvements we have been making, and continue to make, to our business we are well prepared for these challenges.
Our plans give us confidence that Unilever can continue to deliver against the objectives we have set out: volume growth ahead of our markets, steady and sustainable improvement in core operating margin and strong cash flow.
OUR RISK APPETITE AND APPROACH TO RISK MANAGEMENT Risk management is integral to Unilever’s strategy and to the achievement of Unilever’s long-term goals. Our success as an organisation depends on our ability to identify and exploit the opportunities generated by our business and the markets we are in. In doing this we take an embedded approach to risk management which puts risk and opportunity assessment at the core of the leadership team agenda, which is where we believe it should be.
Unilever adopts a risk profile that is aligned to our vision to double the size of our business while reducing our environmental footprint and increasing our positive social impact. Our available capital and other resources are applied to underpin our priorities. We aim to maintain a strong single A credit rating on a long-term basis.
Our approach to risk management is designed to provide reasonable, but not absolute, assurance that our assets are safeguarded, the risks facing the business are being assessed and mitigated and all information that may be required to be disclosed is reported to Unilever’s senior management including, where appropriate, the Chief Executive Officer and Chief Financial Officer.
ORGANISATIONThe Unilever Boards assume overall accountability for the management of risk and for reviewing the effectiveness of Unilever’s risk management and internal control systems.
The Boards have established a clear organisational structure with well defined accountabilities for the principal risks that Unilever faces in the short, medium and long term. This organisational structure and distribution of accountabilities and responsibilities ensures that every country in which we operate has specific resources and processes for risk review and risk mitigation. This is supported by the Unilever Leadership Executive, which takes an active responsibility for focusing on the principal areas of risk to Unilever. The Boards regularly review these risk areas, including consideration of environmental, social and governance matters, and retain responsibility for determining the nature and extent of the significant risks that Unilever is prepared to take to achieve its strategic objectives.
FOUNDATION AND PRINCIPLESUnilever’s approach to doing business is framed by our Corporate Purpose. Our Code of Business Principles sets out the standards of behaviour that we expect all employees to adhere to. Day-to-day responsibility for ensuring these principles are applied throughout Unilever rests with senior management across categories, geographies and functions. A network of Code Officers and Committees supports the activities necessary to communicate the Code, deliver training, maintain processes and procedures (including ‘hotlines’) to report and respond to alleged breaches, and to capture and communicate learnings.
We have a framework of Code Policies that underpin the Code of Business Principles and set out the non-negotiable standards of behaviour expected from all our employees.
For each of our principal risks we have a risk management framework detailing the controls we have in place and who is responsible for both managing the overall risk and the individual controls mitigating that risk.
Unilever Annual Report and Accounts 201334 Strategic report
RISKS
Unilever’s functional standards define mandatory requirements across a range of specialist areas such as health and safety, accounting and reporting and financial risk management.
PROCESSES Unilever operates a wide range of processes and activities across all its operations covering strategy, planning, execution and performance management. Risk management is integrated into every stage of this business cycle. These procedures are formalised and documented and are increasingly being centralised and automated into transactional and other information technology systems.
ASSURANCE AND RE-ASSURANCEAssurance on compliance with the Code of Business Principles and all of our Code Policies is obtained annually from Unilever management via a formal Code declaration. In addition, there are specialist compliance programmes which run during the year and vary depending on the business priorities. These specialist compliance programmes supplement the Code declaration. Our Corporate Audit function plays a vital role in providing to both management and the Boards an objective and independent review of the effectiveness of risk management and internal control systems throughout Unilever.
BOARDS’ ASSESSMENT OF COMPLIANCE WITH THE RISK MANAGEMENT FRAMEWORKSThe Boards, advised by the Committees where appropriate, regularly review the significant risks and decisions that could have a material impact on Unilever. These reviews consider the level of risk that Unilever is prepared to take in pursuit of the business strategy and the effectiveness of the management controls in place to mitigate the risk exposure.
The Boards, through the Audit Committee, have reviewed the assessment of risks, internal controls and disclosure controls and procedures in operation within Unilever. They have also considered the effectiveness of any remedial actions taken for the year covered by this report and up to the date of its approval by the Boards.
Details of the activities of the Audit Committee in relation to this can be found in the Report of the Audit Committee on pages 53 to 55.
Further statements on compliance with the specific risk management and control requirements in the Dutch Corporate Governance Code, the UK Corporate Governance Code, the US Securities Exchange Act (1934) and the Sarbanes-Oxley (2002) Act can be found on pages 47, 48 and 50.
PRINCIPAL RISK FACTORSOur business is subject to risks and uncertainties. On the following pages we have identified the risks that we regard as the most relevant to our business. There may be other risks which are unknown to Unilever or which are currently believed to be immaterial. We have also commented below on certain mitigating actions that we believe help us to manage these risks. However, we may not be successful in deploying some or all of these mitigating actions. If the circumstances in these risks occur or are not successfully mitigated, our cash flow, operating results, financial position, business and reputation could be materially adversely affected. In addition risks and uncertainties could cause actual results to vary from those described, which may include forward-looking statements, or could impact on our ability to meet our targets or be detrimental to our profitability or reputation.
Unilever Annual Report and Accounts 2013 35Strategic report
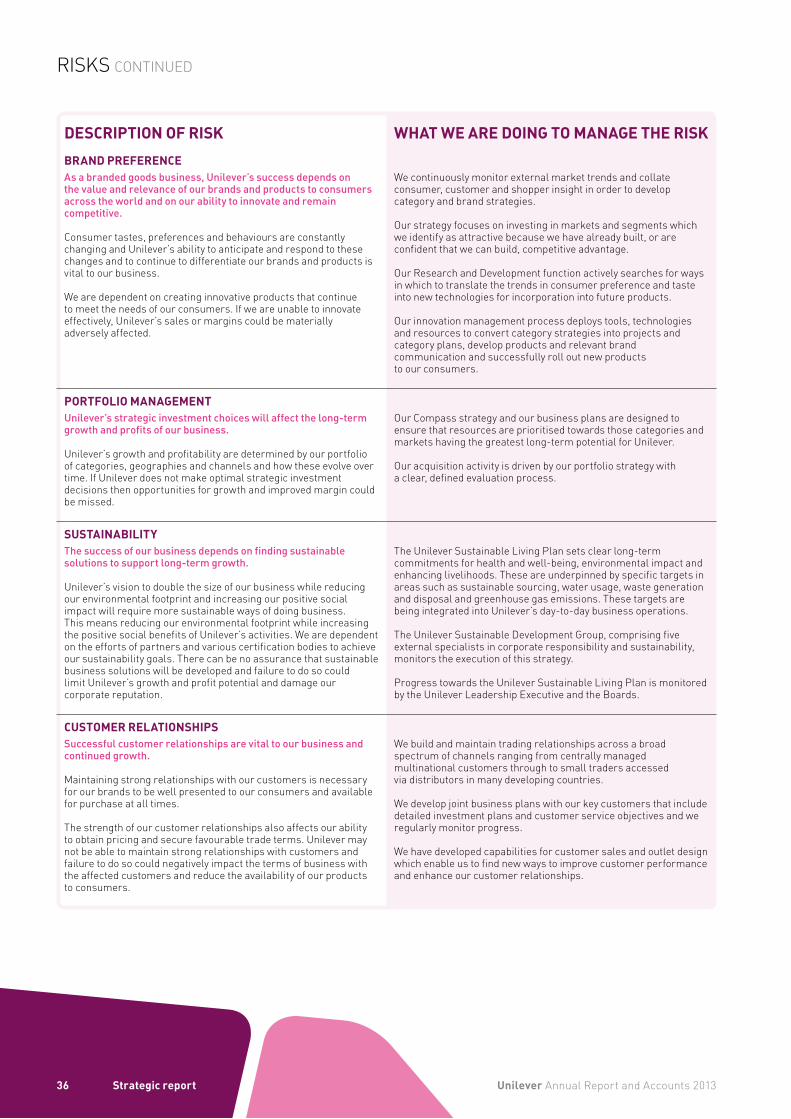
DESCRIPTION OF RISK WHAT WE ARE DOING TO MANAGE THE RISKBRAND PREFERENCEAs a branded goods business, Unilever’s success depends on the value and relevance of our brands and products to consumers across the world and on our ability to innovate and remain competitive.
Consumer tastes, preferences and behaviours are constantly changing and Unilever’s ability to anticipate and respond to these changes and to continue to differentiate our brands and products is vital to our business.
We are dependent on creating innovative products that continue to meet the needs of our consumers. If we are unable to innovate effectively, Unilever’s sales or margins could be materially adversely affected.
We continuously monitor external market trends and collate consumer, customer and shopper insight in order to develop category and brand strategies.
Our strategy focuses on investing in markets and segments which we identify as attractive because we have already built, or are confident that we can build, competitive advantage.
Our Research and Development function actively searches for ways in which to translate the trends in consumer preference and taste into new technologies for incorporation into future products.
Our innovation management process deploys tools, technologies and resources to convert category strategies into projects and category plans, develop products and relevant brand communication and successfully roll out new products to our consumers.
PORTFOLIO MANAGEMENTUnilever’s strategic investment choices will affect the long-term growth and profits of our business.
Unilever’s growth and profitability are determined by our portfolio of categories, geographies and channels and how these evolve over time. If Unilever does not make optimal strategic investment decisions then opportunities for growth and improved margin could be missed.
Our Compass strategy and our business plans are designed to ensure that resources are prioritised towards those categories and markets having the greatest long-term potential for Unilever.
Our acquisition activity is driven by our portfolio strategy with a clear, defined evaluation process.
SUSTAINABILITYThe success of our business depends on finding sustainable solutions to support long-term growth.
Unilever’s vision to double the size of our business while reducing our environmental footprint and increasing our positive social impact will require more sustainable ways of doing business. This means reducing our environmental footprint while increasing the positive social benefits of Unilever’s activities. We are dependent on the efforts of partners and various certification bodies to achieve our sustainability goals. There can be no assurance that sustainable business solutions will be developed and failure to do so could limit Unilever’s growth and profit potential and damage our corporate reputation.
The Unilever Sustainable Living Plan sets clear long-term commitments for health and well-being, environmental impact and enhancing livelihoods. These are underpinned by specific targets in areas such as sustainable sourcing, water usage, waste generation and disposal and greenhouse gas emissions. These targets are being integrated into Unilever’s day-to-day business operations.
The Unilever Sustainable Development Group, comprising five external specialists in corporate responsibility and sustainability, monitors the execution of this strategy.
Progress towards the Unilever Sustainable Living Plan is monitored by the Unilever Leadership Executive and the Boards.
CUSTOMER RELATIONSHIPSSuccessful customer relationships are vital to our business and continued growth.
Maintaining strong relationships with our customers is necessary for our brands to be well presented to our consumers and available for purchase at all times.
The strength of our customer relationships also affects our ability to obtain pricing and secure favourable trade terms. Unilever may not be able to maintain strong relationships with customers and failure to do so could negatively impact the terms of business with the affected customers and reduce the availability of our products to consumers.
We build and maintain trading relationships across a broad spectrum of channels ranging from centrally managed multinational customers through to small traders accessed via distributors in many developing countries.
We develop joint business plans with our key customers that include detailed investment plans and customer service objectives and we regularly monitor progress.
We have developed capabilities for customer sales and outlet design which enable us to find new ways to improve customer performance and enhance our customer relationships.
Unilever Annual Report and Accounts 201336 Strategic report
RISKS CONTINUED
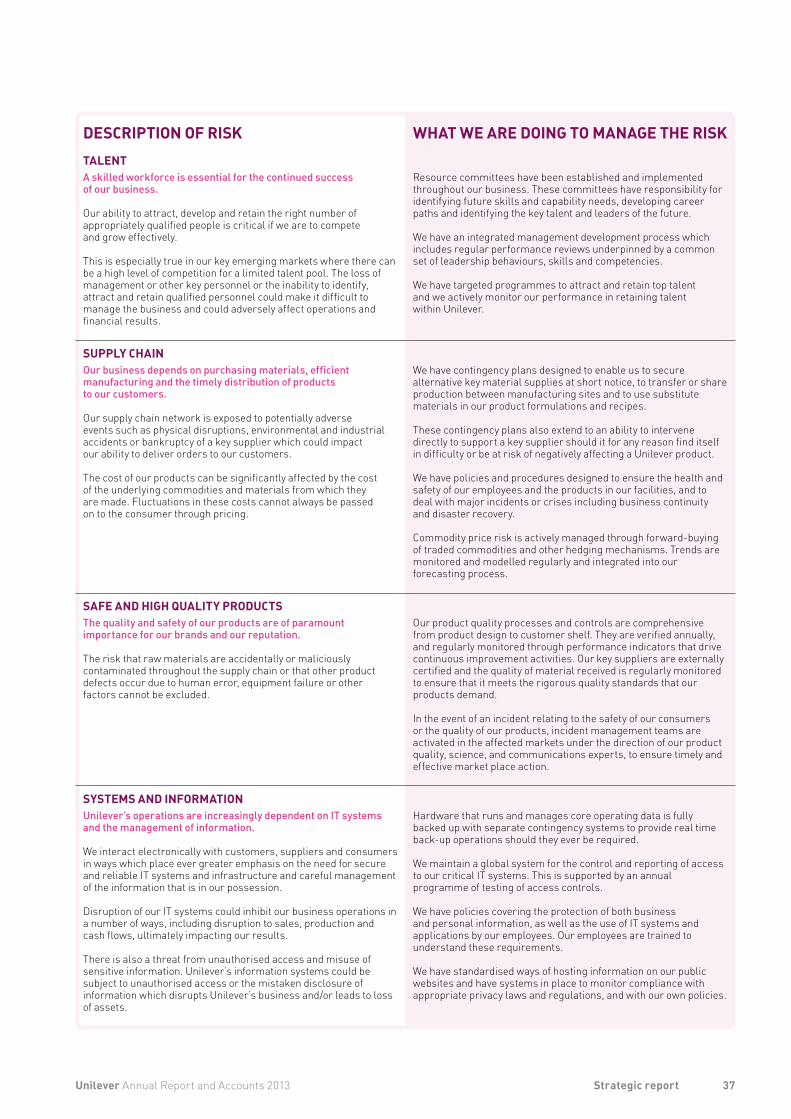
DESCRIPTION OF RISK WHAT WE ARE DOING TO MANAGE THE RISKTALENTA skilled workforce is essential for the continued success of our business.
Our ability to attract, develop and retain the right number of appropriately qualified people is critical if we are to compete and grow effectively.
This is especially true in our key emerging markets where there can be a high level of competition for a limited talent pool. The loss of management or other key personnel or the inability to identify, attract and retain qualified personnel could make it difficult to manage the business and could adversely affect operations and financial results.
Resource committees have been established and implemented throughout our business. These committees have responsibility for identifying future skills and capability needs, developing career paths and identifying the key talent and leaders of the future.
We have an integrated management development process which includes regular performance reviews underpinned by a common set of leadership behaviours, skills and competencies.
We have targeted programmes to attract and retain top talent and we actively monitor our performance in retaining talent within Unilever.
SUPPLY CHAINOur business depends on purchasing materials, efficient manufacturing and the timely distribution of products to our customers.
Our supply chain network is exposed to potentially adverse events such as physical disruptions, environmental and industrial accidents or bankruptcy of a key supplier which could impact our ability to deliver orders to our customers.
The cost of our products can be significantly affected by the cost of the underlying commodities and materials from which they are made. Fluctuations in these costs cannot always be passed on to the consumer through pricing.
We have contingency plans designed to enable us to secure alternative key material supplies at short notice, to transfer or share production between manufacturing sites and to use substitute materials in our product formulations and recipes.
These contingency plans also extend to an ability to intervene directly to support a key supplier should it for any reason find itself in difficulty or be at risk of negatively affecting a Unilever product.
We have policies and procedures designed to ensure the health and safety of our employees and the products in our facilities, and to deal with major incidents or crises including business continuity and disaster recovery.
Commodity price risk is actively managed through forward-buying of traded commodities and other hedging mechanisms. Trends are monitored and modelled regularly and integrated into our forecasting process.
SAFE AND HIGH QUALITY PRODUCTSThe quality and safety of our products are of paramount importance for our brands and our reputation.
The risk that raw materials are accidentally or maliciously contaminated throughout the supply chain or that other product defects occur due to human error, equipment failure or other factors cannot be excluded.
Our product quality processes and controls are comprehensive from product design to customer shelf. They are verified annually, and regularly monitored through performance indicators that drive continuous improvement activities. Our key suppliers are externally certified and the quality of material received is regularly monitored to ensure that it meets the rigorous quality standards that our products demand.
In the event of an incident relating to the safety of our consumers or the quality of our products, incident management teams are activated in the affected markets under the direction of our product quality, science, and communications experts, to ensure timely and effective market place action.
SYSTEMS AND INFORMATIONUnilever’s operations are increasingly dependent on IT systems and the management of information.
We interact electronically with customers, suppliers and consumers in ways which place ever greater emphasis on the need for secure and reliable IT systems and infrastructure and careful management of the information that is in our possession.
Disruption of our IT systems could inhibit our business operations in a number of ways, including disruption to sales, production and cash flows, ultimately impacting our results. There is also a threat from unauthorised access and misuse of sensitive information. Unilever’s information systems could be subject to unauthorised access or the mistaken disclosure of information which disrupts Unilever’s business and/or leads to loss of assets.
Hardware that runs and manages core operating data is fully backed up with separate contingency systems to provide real time back-up operations should they ever be required.
We maintain a global system for the control and reporting of access to our critical IT systems. This is supported by an annual programme of testing of access controls.
We have policies covering the protection of both business and personal information, as well as the use of IT systems and applications by our employees. Our employees are trained to understand these requirements.
We have standardised ways of hosting information on our public websites and have systems in place to monitor compliance with appropriate privacy laws and regulations, and with our own policies.
37Unilever Annual Report and Accounts 2013 Strategic report
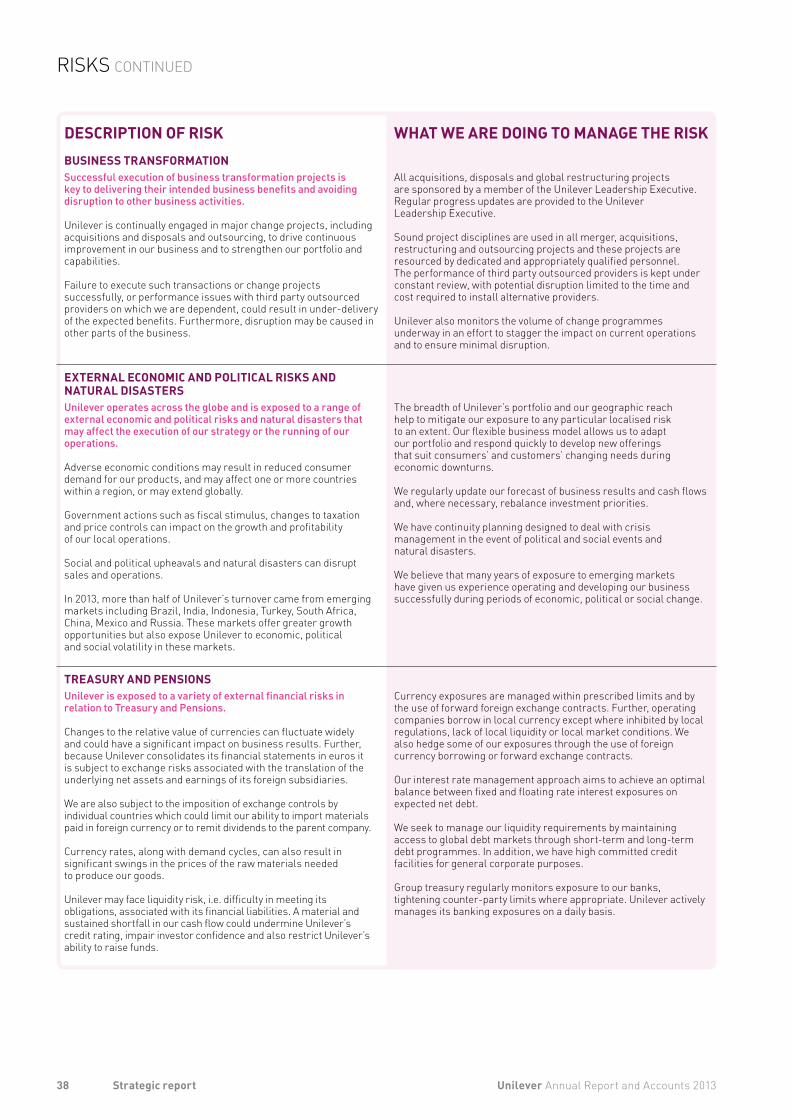
DESCRIPTION OF RISK WHAT WE ARE DOING TO MANAGE THE RISKBUSINESS TRANSFORMATIONSuccessful execution of business transformation projects is key to delivering their intended business benefits and avoiding disruption to other business activities.
Unilever is continually engaged in major change projects, including acquisitions and disposals and outsourcing, to drive continuous improvement in our business and to strengthen our portfolio and capabilities.
Failure to execute such transactions or change projects successfully, or performance issues with third party outsourced providers on which we are dependent, could result in under-delivery of the expected benefits. Furthermore, disruption may be caused in other parts of the business.
All acquisitions, disposals and global restructuring projects are sponsored by a member of the Unilever Leadership Executive. Regular progress updates are provided to the Unilever Leadership Executive.
Sound project disciplines are used in all merger, acquisitions, restructuring and outsourcing projects and these projects are resourced by dedicated and appropriately qualified personnel. The performance of third party outsourced providers is kept under constant review, with potential disruption limited to the time and cost required to install alternative providers.
Unilever also monitors the volume of change programmes underway in an effort to stagger the impact on current operations and to ensure minimal disruption.
EXTERNAL ECONOMIC AND POLITICAL RISKS AND NATURAL DISASTERSUnilever operates across the globe and is exposed to a range of external economic and political risks and natural disasters that may affect the execution of our strategy or the running of our operations.
Adverse economic conditions may result in reduced consumer demand for our products, and may affect one or more countries within a region, or may extend globally.
Government actions such as fiscal stimulus, changes to taxation and price controls can impact on the growth and profitability of our local operations.
Social and political upheavals and natural disasters can disrupt sales and operations.
In 2013, more than half of Unilever’s turnover came from emerging markets including Brazil, India, Indonesia, Turkey, South Africa, China, Mexico and Russia. These markets offer greater growth opportunities but also expose Unilever to economic, political and social volatility in these markets.
The breadth of Unilever’s portfolio and our geographic reach help to mitigate our exposure to any particular localised risk to an extent. Our flexible business model allows us to adapt our portfolio and respond quickly to develop new offerings that suit consumers’ and customers’ changing needs during economic downturns.
We regularly update our forecast of business results and cash flows and, where necessary, rebalance investment priorities.
We have continuity planning designed to deal with crisis management in the event of political and social events and natural disasters.
We believe that many years of exposure to emerging markets have given us experience operating and developing our business successfully during periods of economic, political or social change.
TREASURY AND PENSIONSUnilever is exposed to a variety of external financial risks in relation to Treasury and Pensions.
Changes to the relative value of currencies can fluctuate widely and could have a significant impact on business results. Further, because Unilever consolidates its financial statements in euros it is subject to exchange risks associated with the translation of the underlying net assets and earnings of its foreign subsidiaries.
We are also subject to the imposition of exchange controls by individual countries which could limit our ability to import materials paid in foreign currency or to remit dividends to the parent company.
Currency rates, along with demand cycles, can also result in significant swings in the prices of the raw materials needed to produce our goods.
Unilever may face liquidity risk, i.e. difficulty in meeting its obligations, associated with its financial liabilities. A material and sustained shortfall in our cash flow could undermine Unilever’s credit rating, impair investor confidence and also restrict Unilever’s ability to raise funds.
Currency exposures are managed within prescribed limits and by the use of forward foreign exchange contracts. Further, operating companies borrow in local currency except where inhibited by local regulations, lack of local liquidity or local market conditions. We also hedge some of our exposures through the use of foreign currency borrowing or forward exchange contracts.
Our interest rate management approach aims to achieve an optimal balance between fixed and floating rate interest exposures on expected net debt.
We seek to manage our liquidity requirements by maintaining access to global debt markets through short-term and long-term debt programmes. In addition, we have high committed credit facilities for general corporate purposes.
Group treasury regularly monitors exposure to our banks, tightening counter-party limits where appropriate. Unilever actively manages its banking exposures on a daily basis.
Unilever Annual Report and Accounts 201338 Strategic report
RISKS CONTINUED
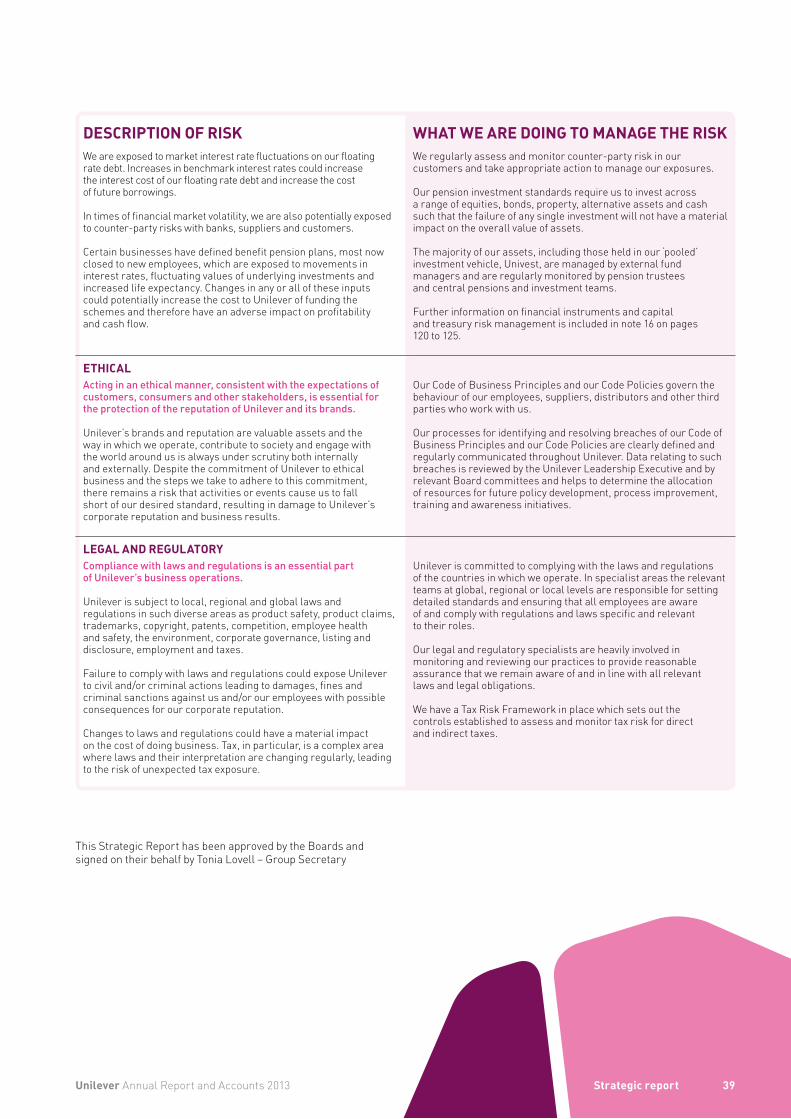
DESCRIPTION OF RISK WHAT WE ARE DOING TO MANAGE THE RISKWe are exposed to market interest rate fluctuations on our floating rate debt. Increases in benchmark interest rates could increase the interest cost of our floating rate debt and increase the cost of future borrowings.
In times of financial market volatility, we are also potentially exposed to counter-party risks with banks, suppliers and customers.
Certain businesses have defined benefit pension plans, most now closed to new employees, which are exposed to movements in interest rates, fluctuating values of underlying investments and increased life expectancy. Changes in any or all of these inputs could potentially increase the cost to Unilever of funding the schemes and therefore have an adverse impact on profitability and cash flow.
We regularly assess and monitor counter-party risk in our customers and take appropriate action to manage our exposures.
Our pension investment standards require us to invest across a range of equities, bonds, property, alternative assets and cash such that the failure of any single investment will not have a material impact on the overall value of assets.
The majority of our assets, including those held in our ‘pooled’ investment vehicle, Univest, are managed by external fund managers and are regularly monitored by pension trustees and central pensions and investment teams.
Further information on financial instruments and capital and treasury risk management is included in note 16 on pages 120 to 125.
ETHICALActing in an ethical manner, consistent with the expectations of customers, consumers and other stakeholders, is essential for the protection of the reputation of Unilever and its brands.
Unilever’s brands and reputation are valuable assets and the way in which we operate, contribute to society and engage with the world around us is always under scrutiny both internally and externally. Despite the commitment of Unilever to ethical business and the steps we take to adhere to this commitment, there remains a risk that activities or events cause us to fall short of our desired standard, resulting in damage to Unilever’s corporate reputation and business results.
Our Code of Business Principles and our Code Policies govern the behaviour of our employees, suppliers, distributors and other third parties who work with us.
Our processes for identifying and resolving breaches of our Code of Business Principles and our Code Policies are clearly defined and regularly communicated throughout Unilever. Data relating to such breaches is reviewed by the Unilever Leadership Executive and by relevant Board committees and helps to determine the allocation of resources for future policy development, process improvement, training and awareness initiatives.
LEGAL AND REGULATORYCompliance with laws and regulations is an essential part of Unilever’s business operations.
Unilever is subject to local, regional and global laws and regulations in such diverse areas as product safety, product claims, trademarks, copyright, patents, competition, employee health and safety, the environment, corporate governance, listing and disclosure, employment and taxes.
Failure to comply with laws and regulations could expose Unilever to civil and/or criminal actions leading to damages, fines and criminal sanctions against us and/or our employees with possible consequences for our corporate reputation.
Changes to laws and regulations could have a material impact on the cost of doing business. Tax, in particular, is a complex area where laws and their interpretation are changing regularly, leading to the risk of unexpected tax exposure.
Unilever is committed to complying with the laws and regulations of the countries in which we operate. In specialist areas the relevant teams at global, regional or local levels are responsible for setting detailed standards and ensuring that all employees are aware of and comply with regulations and laws specific and relevant to their roles.
Our legal and regulatory specialists are heavily involved in monitoring and reviewing our practices to provide reasonable assurance that we remain aware of and in line with all relevant laws and legal obligations.
We have a Tax Risk Framework in place which sets out the controls established to assess and monitor tax risk for direct and indirect taxes.
This Strategic Report has been approved by the Boards and signed on their behalf by Tonia Lovell – Group Secretary
Unilever Annual Report and Accounts 2013 39Strategic report
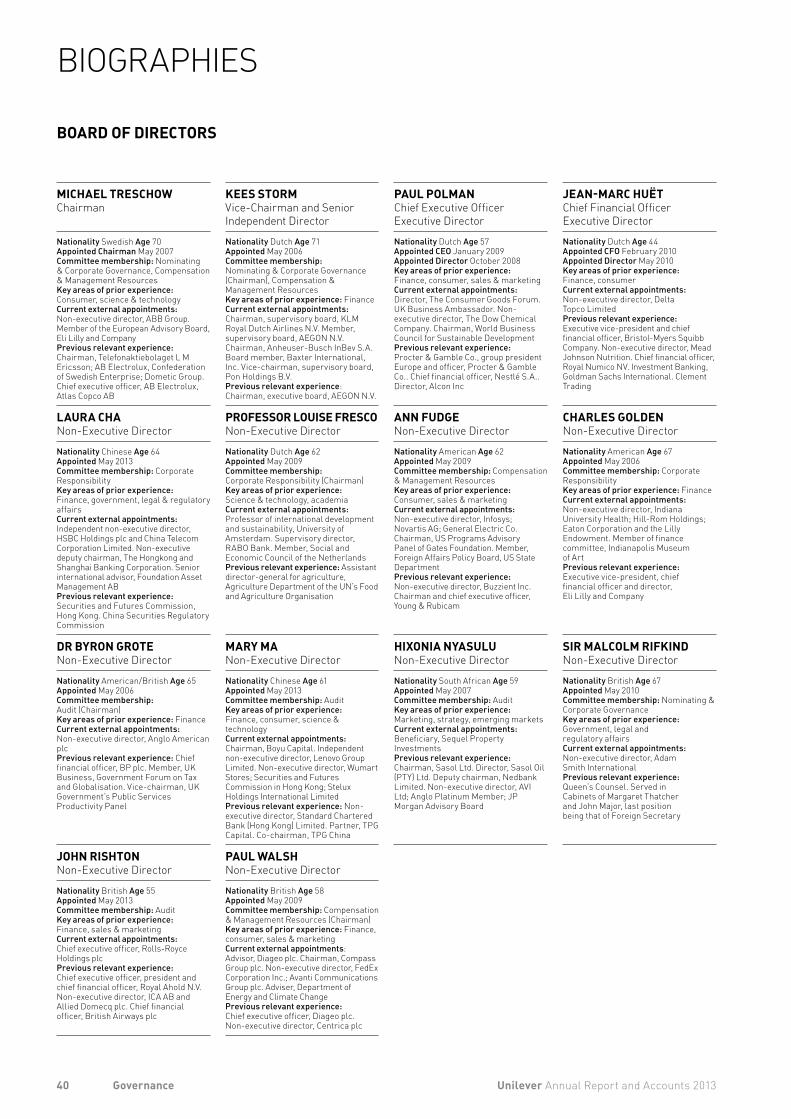
BOARD OF DIRECTORS
MICHAEL TRESCHOWChairman
KEES STORMVice-Chairman and Senior Independent Director
PAUL POLMANChief Executive OfficerExecutive Director
JEAN-MARC HUËTChief Financial OfficerExecutive Director
Nationality Swedish Age 70Appointed Chairman May 2007Committee membership: Nominating & Corporate Governance, Compensation & Management ResourcesKey areas of prior experience: Consumer, science & technologyCurrent external appointments: Non-executive director, ABB Group. Member of the European Advisory Board, Eli Lilly and CompanyPrevious relevant experience: Chairman, Telefonaktiebolaget L M Ericsson; AB Electrolux, Confederation of Swedish Enterprise; Dometic Group. Chief executive officer, AB Electrolux, Atlas Copco AB
Nationality Dutch Age 71Appointed May 2006Committee membership:Nominating & Corporate Governance (Chairman), Compensation & Management ResourcesKey areas of prior experience: FinanceCurrent external appointments: Chairman, supervisory board, KLM Royal Dutch Airlines N.V. Member, supervisory board, AEGON N.V. Chairman, Anheuser-Busch InBev S.A. Board member, Baxter International, Inc. Vice-chairman, supervisory board, Pon Holdings B.V.Previous relevant experience: Chairman, executive board, AEGON N.V.
Nationality Dutch Age 57Appointed CEO January 2009Appointed Director October 2008Key areas of prior experience: Finance, consumer, sales & marketingCurrent external appointments: Director, The Consumer Goods Forum. UK Business Ambassador. Non-executive director, The Dow Chemical Company. Chairman, World Business Council for Sustainable DevelopmentPrevious relevant experience: Procter & Gamble Co., group president Europe and officer, Procter & Gamble Co.. Chief financial officer, Nestlé S.A.. Director, Alcon Inc
Nationality Dutch Age 44Appointed CFO February 2010Appointed Director May 2010Key areas of prior experience: Finance, consumerCurrent external appointments: Non-executive director, Delta Topco LimitedPrevious relevant experience: Executive vice-president and chief financial officer, Bristol-Myers Squibb Company. Non-executive director, Mead Johnson Nutrition. Chief financial officer, Royal Numico NV. Investment Banking, Goldman Sachs International. Clement Trading
LAURA CHANon-Executive Director
PROFESSOR LOUISE FRESCONon-Executive Director
ANN FUDGENon-Executive Director
CHARLES GOLDENNon-Executive Director
Nationality Chinese Age 64Appointed May 2013Committee membership: Corporate ResponsibilityKey areas of prior experience: Finance, government, legal & regulatory affairsCurrent external appointments: Independent non-executive director, HSBC Holdings plc and China Telecom Corporation Limited. Non-executive deputy chairman, The Hongkong and Shanghai Banking Corporation. Senior international advisor, Foundation Asset Management AB Previous relevant experience: Securities and Futures Commission, Hong Kong. China Securities Regulatory Commission
Nationality Dutch Age 62Appointed May 2009Committee membership: Corporate Responsibility (Chairman)Key areas of prior experience: Science & technology, academiaCurrent external appointments: Professor of international development and sustainability, University of Amsterdam. Supervisory director, RABO Bank. Member, Social and Economic Council of the NetherlandsPrevious relevant experience: Assistant director-general for agriculture, Agriculture Department of the UN’s Food and Agriculture Organisation
Nationality American Age 62Appointed May 2009Committee membership: Compensation & Management ResourcesKey areas of prior experience: Consumer, sales & marketingCurrent external appointments: Non-executive director, Infosys; Novartis AG; General Electric Co. Chairman, US Programs Advisory Panel of Gates Foundation. Member, Foreign Affairs Policy Board, US State Department Previous relevant experience: Non-executive director, Buzzient Inc. Chairman and chief executive officer, Young & Rubicam
Nationality American Age 67Appointed May 2006Committee membership: Corporate ResponsibilityKey areas of prior experience: FinanceCurrent external appointments: Non-executive director, Indiana University Health; Hill-Rom Holdings; Eaton Corporation and the Lilly Endowment. Member of finance committee, Indianapolis Museum of ArtPrevious relevant experience: Executive vice-president, chief financial officer and director, Eli Lilly and Company
DR BYRON GROTENon-Executive Director
MARY MANon-Executive Director
HIXONIA NYASULUNon-Executive Director
SIR MALCOLM RIFKINDNon-Executive Director
Nationality American/British Age 65Appointed May 2006Committee membership: Audit (Chairman)Key areas of prior experience: FinanceCurrent external appointments: Non-executive director, Anglo American plcPrevious relevant experience: Chief financial officer, BP plc. Member, UK Business, Government Forum on Tax and Globalisation. Vice-chairman, UK Government’s Public Services Productivity Panel
Nationality Chinese Age 61Appointed May 2013Committee membership: AuditKey areas of prior experience: Finance, consumer, science & technologyCurrent external appointments: Chairman, Boyu Capital. Independent non-executive director, Lenovo Group Limited. Non-executive director, Wumart Stores; Securities and Futures Commission in Hong Kong; Stelux Holdings International LimitedPrevious relevant experience: Non-executive director, Standard Chartered Bank (Hong Kong) Limited. Partner, TPG Capital. Co-chairman, TPG China
Nationality South African Age 59Appointed May 2007Committee membership: Audit Key areas of prior experience: Marketing, strategy, emerging marketsCurrent external appointments: Beneficiary, Sequel Property InvestmentsPrevious relevant experience: Chairman, Sasol Ltd. Director, Sasol Oil (PTY) Ltd. Deputy chairman, Nedbank Limited. Non-executive director, AVI Ltd; Anglo Platinum Member; JP Morgan Advisory Board
Nationality British Age 67Appointed May 2010Committee membership: Nominating & Corporate GovernanceKey areas of prior experience: Government, legal and regulatory affairsCurrent external appointments: Non-executive director, Adam Smith International Previous relevant experience: Queen’s Counsel. Served in Cabinets of Margaret Thatcher and John Major, last position being that of Foreign Secretary
JOHN RISHTONNon-Executive Director
PAUL WALSHNon-Executive Director
Nationality British Age 55Appointed May 2013 Committee membership: AuditKey areas of prior experience: Finance, sales & marketingCurrent external appointments: Chief executive officer, Rolls-Royce Holdings plcPrevious relevant experience: Chief executive officer, president and chief financial officer, Royal Ahold N.V. Non-executive director, ICA AB and Allied Domecq plc. Chief financial officer, British Airways plc
Nationality British Age 58Appointed May 2009Committee membership: Compensation & Management Resources (Chairman)Key areas of prior experience: Finance, consumer, sales & marketingCurrent external appointments: Advisor, Diageo plc. Chairman, Compass Group plc. Non-executive director, FedEx Corporation Inc.; Avanti Communications Group plc. Adviser, Department of Energy and Climate ChangePrevious relevant experience: Chief executive officer, Diageo plc. Non-executive director, Centrica plc
40 Unilever Annual Report and Accounts 2013Governance
BIOGRAPHIES
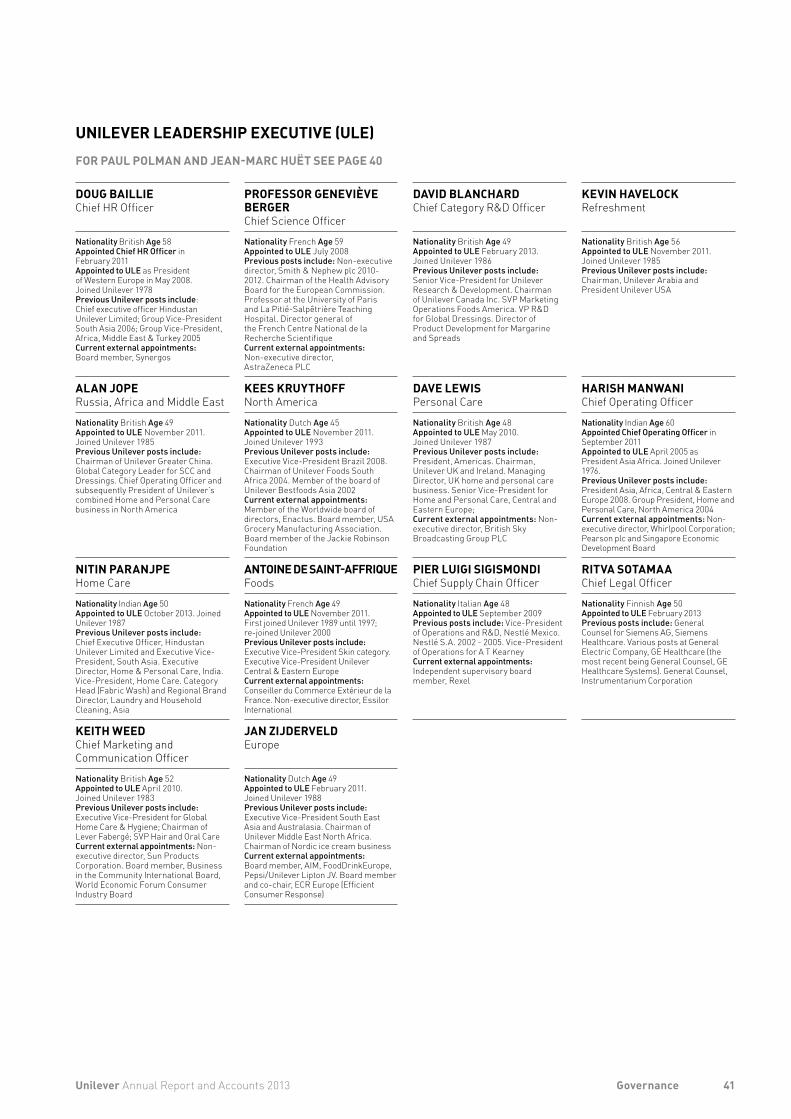
UNILEVER LEADERSHIP EXECUTIVE (ULE)FOR PAUL POLMAN AND JEAN-MARC HUËT SEE PAGE 40
DOUG BAILLIEChief HR Officer
PROFESSOR GENEVIÈVE BERGERChief Science Officer
DAVID BLANCHARDChief Category R&D Officer
KEVIN HAVELOCKRefreshment
Nationality British Age 58Appointed Chief HR Officer in February 2011 Appointed to ULE as President of Western Europe in May 2008. Joined Unilever 1978 Previous Unilever posts include: Chief executive officer Hindustan Unilever Limited; Group Vice-President South Asia 2006; Group Vice-President, Africa, Middle East & Turkey 2005 Current external appointments: Board member, Synergos
Nationality French Age 59Appointed to ULE July 2008 Previous posts include: Non-executive director, Smith & Nephew plc 2010-2012. Chairman of the Health Advisory Board for the European Commission. Professor at the University of Paris and La Pitié-Salpêtrière Teaching Hospital. Director general of the French Centre National de la Recherche Scientifique Current external appointments: Non-executive director, AstraZeneca PLC
Nationality British Age 49Appointed to ULE February 2013. Joined Unilever 1986 Previous Unilever posts include: Senior Vice-President for Unilever Research & Development. Chairman of Unilever Canada Inc. SVP Marketing Operations Foods America. VP R&D for Global Dressings. Director of Product Development for Margarine and Spreads
Nationality British Age 56Appointed to ULE November 2011. Joined Unilever 1985 Previous Unilever posts include: Chairman, Unilever Arabia and President Unilever USA
ALAN JOPERussia, Africa and Middle East
KEES KRUYTHOFFNorth America
DAVE LEWISPersonal Care
HARISH MANWANIChief Operating Officer
Nationality British Age 49Appointed to ULE November 2011. Joined Unilever 1985 Previous Unilever posts include: Chairman of Unilever Greater China. Global Category Leader for SCC and Dressings. Chief Operating Officer and subsequently President of Unilever’s combined Home and Personal Care business in North America
Nationality Dutch Age 45 Appointed to ULE November 2011. Joined Unilever 1993 Previous Unilever posts include: Executive Vice-President Brazil 2008. Chairman of Unilever Foods South Africa 2004. Member of the board of Unilever Bestfoods Asia 2002Current external appointments: Member of the Worldwide board of directors, Enactus. Board member, USA Grocery Manufacturing Association. Board member of the Jackie Robinson Foundation
Nationality British Age 48 Appointed to ULE May 2010. Joined Unilever 1987 Previous Unilever posts include: President, Americas. Chairman, Unilever UK and Ireland. Managing Director, UK home and personal care business. Senior Vice-President for Home and Personal Care, Central and Eastern Europe; Current external appointments: Non-executive director, British Sky Broadcasting Group PLC
Nationality Indian Age 60Appointed Chief Operating Officer in September 2011Appointed to ULE April 2005 as President Asia Africa. Joined Unilever 1976.Previous Unilever posts include: President Asia, Africa, Central & Eastern Europe 2008. Group President, Home and Personal Care, North America 2004Current external appointments: Non-executive director, Whirlpool Corporation; Pearson plc and Singapore Economic Development Board
NITIN PARANJPEHome Care
ANTOINE DE SAINT-AFFRIQUEFoods
PIER LUIGI SIGISMONDIChief Supply Chain Officer
RITVA SOTAMAAChief Legal Officer
Nationality Indian Age 50Appointed to ULE October 2013. Joined Unilever 1987Previous Unilever posts include: Chief Executive Officer, Hindustan Unilever Limited and Executive Vice-President, South Asia. Executive Director, Home & Personal Care, India. Vice-President, Home Care. Category Head (Fabric Wash) and Regional Brand Director, Laundry and Household Cleaning, Asia
Nationality French Age 49Appointed to ULE November 2011. First joined Unilever 1989 until 1997; re-joined Unilever 2000 Previous Unilever posts include: Executive Vice-President Skin category. Executive Vice-President Unilever Central & Eastern EuropeCurrent external appointments: Conseiller du Commerce Extérieur de la France. Non-executive director, Essilor International
Nationality Italian Age 48Appointed to ULE September 2009 Previous posts include: Vice-President of Operations and R&D, Nestlé Mexico. Nestlé S.A. 2002 - 2005. Vice-President of Operations for A T Kearney Current external appointments: Independent supervisory board member, Rexel
Nationality Finnish Age 50Appointed to ULE February 2013Previous posts include: General Counsel for Siemens AG, Siemens Healthcare. Various posts at General Electric Company, GE Healthcare (the most recent being General Counsel, GE Healthcare Systems). General Counsel, Instrumentarium Corporation
KEITH WEEDChief Marketing and Communication Officer
JAN ZIJDERVELDEurope
Nationality British Age 52 Appointed to ULE April 2010. Joined Unilever 1983 Previous Unilever posts include: Executive Vice-President for Global Home Care & Hygiene; Chairman of Lever Fabergé; SVP Hair and Oral Care Current external appointments: Non-executive director, Sun Products Corporation. Board member, Business in the Community International Board, World Economic Forum Consumer Industry Board
Nationality Dutch Age 49 Appointed to ULE February 2011. Joined Unilever 1988 Previous Unilever posts include: Executive Vice-President South East Asia and Australasia. Chairman of Unilever Middle East North Africa. Chairman of Nordic ice cream businessCurrent external appointments: Board member, AIM, FoodDrinkEurope, Pepsi/Unilever Lipton JV. Board member and co-chair, ECR Europe (Efficient Consumer Response)
41Unilever Annual Report and Accounts 2013 Governance
ABOUT UNILEVERSince 1930 when the Unilever Group was formed, Unilever N.V. (NV) and Unilever PLC (PLC), together with their group companies, have operated as nearly as practicable as a single economic entity. This is achieved by a series of agreements between NV and PLC (the Foundation Agreements, further described on page 47), together with special provisions in the Articles of Association of NV and PLC.
Each NV ordinary share represents the same underlying economic interest in the Unilever Group as each PLC ordinary share. However, NV and PLC remain separate legal entities with different shareholder constituencies and separate stock exchange listings. Shareholders cannot convert or exchange the shares of one for the shares of the other. Shares in Unilever group companies may ultimately be held wholly by either NV or PLC or by the two companies in varying proportions.
NV and PLC have the same Directors, adopt the same accounting principles and pay dividends to their respective shareholders on an equalised basis. NV and PLC and their group companies constitute a single reporting entity for the purposes of presenting consolidated accounts. Accordingly, the accounts of the Unilever Group are presented by both NV and PLC as their respective consolidated accounts.
Unilever is subject to various corporate governance requirements and best practice codes, the most relevant being those in the Netherlands, the UK and the US. We conduct our operations in accordance with internationally accepted principles of good governance and best practice, whilst ensuring compliance with the corporate governance requirements applicable in the countries in which we operate.
NV and PLC are holding and service companies and the business activity of Unilever is carried out by their subsidiaries around the world.
THE BOARDSIt has always been a requirement of Unilever that the same people be on the Boards of the two parent companies. This guarantees that all matters are considered by the Boards as a single intellect, reaching the same conclusions on the same set of facts save where specific local factors apply. It is essential that in reaching the same decisions the NV and PLC Boards identify and resolve any potential conflicts of interest between NV and PLC.
The Boards are one-tier boards, comprising Executive Directors and, in a majority, Non-Executive Directors. The Boards have ultimate responsibility for the management, general affairs, direction, performance and long-term success of our business as a whole. The responsibility of the Directors is collective, taking into account their respective roles as Executive Directors andNon-Executive Directors.
The Boards have, with the exception of certain matters which are reserved for them, delegated the operational running of the Group to the Chief Executive Officer (CEO). The CEO is responsible to the Boards and is able to delegate any of his powers and discretions. Matters reserved for the Boards include structural and constitutional matters, corporate governance, approval of dividends, approval of overall strategy for the Group and approval of significant transactions or arrangements in relation to mergers, acquisitions, joint ventures and disposals, capital expenditure, contracts, litigation, financing and pensions.
Further details of how our Boards effectively operate as one Board, govern themselves and delegate their authorities are set out in the document entitled ‘The Governance of Unilever’, which can be found at www.unilever.com/investorrelations/corp_governance.
A list of our current Directors and the dates of their appointment is set out on page 40.
ROLES AND RESPONSIBILITIESThe Non-Executive Directors share responsibility, together with the Executive Directors, for the execution of the Boards’ duties.
CHAIRMANUnilever has a Non-Executive Chairman and a CEO. There is a clear division of responsibilities between their roles.
The Chairman is primarily responsible for leadership of the Boards and ensuring their effectiveness. The Chairman sets the Boards’ agenda, ensures the Directors receive accurate, timely and clear information, promotes effective relationships and open communication between the Executive and Non-Executive Directors and maintains effective communication with major shareholders. With the Group Secretary, the Chairman will take the lead in providing a properly constructed induction programme for new Directors that is comprehensive, formal and tailored.
VICE-CHAIRMAN/SENIOR INDEPENDENT DIRECTORThe Vice Chairman/Senior Independent Director serves as an intermediary for the other Directors when necessary. He is also a point of contact for shareholders if they have concerns which cannot be resolved through the Chairman or the Executive Directors.
NON-EXECUTIVE DIRECTORSThe role of Non-Executive Directors is essentially supervisory and their key responsibilities are:• supervision of, and advice to, the CEO;• developing strategy with the CEO;• scrutiny of performance of the business and the CEO;• oversight of risks and controls;• reporting of performance;• remuneration of and succession planning for Executive
Directors; and• governance and compliance.
CEO The CEO has the authority to determine which duties regarding the operational management of NV and PLC and their business enterprises will be carried out under his responsibility, by one or more Executive Directors or by one or more other persons. This provides a basis for the Unilever Leadership Executive (ULE) that is chaired by and reports to the CEO. For ULE members’ biographies see page 41.
EXECUTIVE DIRECTORSDuring 2013, Unilever continued to have two Executive Directors, the CEO and Chief Financial Officer (CFO), who are also members of the ULE and are full-time employees of Unilever.
GROUP SECRETARYThe Group Secretary is available to advise all Directors on matters relating to the governance of the Group and ensures compliance with Board procedures. The Group Secretary is Tonia Lovell.
42 Unilever Annual Report and Accounts 2013Governance
CORPORATE GOVERNANCE
APPOINTMENT OF DIRECTORSIn seeking to ensure that NV and PLC have the same Directors, the Articles of Association of NV and PLC contain provisions which are designed to ensure that both NV and PLC shareholders are presented with the same candidates for election as Directors. Anyone being elected as a Director of NV must also be elected as a Director of PLC and vice versa. Therefore, if an individual fails to be elected to both companies he or she will be unable to take his or her place on either Board. These provisions of the Articles cannot be changed without the permission, in the case of NV, of the holders of the special ordinary shares numbered 1 to 2,400 inclusive and, in the case of PLC, of the holders of PLC’s deferred stock. The NV special ordinary shares may only be transferred to one or more other holders of such shares. The joint holders of both the NV special ordinary shares and the PLC deferred stock are N.V. Elma and United Holdings Limited, which are joint subsidiaries of NV and PLC. The Boards of N.V. Elma and United Holdings Limited comprise the members of the Nominating and Corporate Governance Committee (NCGC).
The Non-Executive Directors are chosen individually for their broad and relevant experience and international outlook, as well as for their independence. The profile set by the Boards for the Non-Executive Directors (which can be found in ‘The Governance of Unilever’) provides guiding principles for the composition of the Boards in line with the recommendations of applicable governance regulations and best practice, and takes into account the balance of skills, diversity, knowledge and experience on the Boards. The schedule used for orderly succession planning can be found on our website at www.unilever.com/investorrelations/corp_governance. In consultation with the NCGC, the Boards review both the adequacy of succession planning processes and succession planning itself at both Board and ULE level. Details of the current Non-Executive Directors’ various appointments can be found in their biographies on page 40.
CHANGES TO THE BOARDDuring 2013 the NCGC engaged the services of an executive search agency to assist with the recruitment of new Non-Executive Directors. Russell Reynolds Associates, who also assist in the recruitment of senior executives as appropriate, employed a rigorous search process, by firstly gaining a thorough understanding of the strategic goals of Unilever, the specific leadership roles and competencies needed to meet those goals, and the culture of our organisation, in which to identify potential candidates. As a result of this, Laura Cha, Mary Ma and John Rishton were appointed to the Boards as Non-Executive Directors at the 2013 AGMs. Sunil B Mittal retired as a Non-Executive Director at the 2013 AGMs.
TENURENon-Executive Directors normally serve for a maximum of nine years. Executive Directors stop holding executive office on ceasing to be Directors.
All existing Executive and Non-Executive Directors, unless they are retiring, submit themselves for evaluation by the NCGC every year. Based on the evaluation of the Boards, its Committees and the continued good performance of individual Directors, the NCGC recommends to each Board a list of candidates for nomination/re-election at the AGMs of both NV and PLC. In addition, shareholders are able to nominate Directors. To do so they must put a resolution to both AGMs in line with local requirements. Directors are appointed by shareholders by a simple majority vote at the AGMs.
BOARD INDUCTION, TRAINING AND SUPPORTUpon election, Directors receive a comprehensive Directors’ Information Pack and are briefed thoroughly on their responsibilities and the business with a tailored induction programme. The Chairman ensures that ongoing training is provided for Directors by way of site visits, presentations and circulated updates at Board and Board Committee meetings on, among other things, Unilever’s business, environmental, social and corporate governance, regulatory developments and investor relations matters. In 2013 the Board knowledge sessions were on building and protecting Unilever’s brands, talent and leadership development initiatives and our Treasury function.
A procedure is in place to enable Directors, if they so wish, to seek independent advice at Unilever’s expense.
BOARD MEETINGSA minimum of five face-to-face meetings are planned throughout the calendar year to consider, for example, the half-year and full-year results announcements of the Group and the Annual Report and Accounts. Other Board meetings and telephone conferences are held to discuss matters that arise as well as Group strategic issues.
During the year the Boards will consider important corporate events and actions, such as:• developing and approval of the overall strategy;• oversight of the performance of the business;• review of risks and controls;• authorisation of major transactions;• declaration of dividends;• convening of shareholders’ meetings;• nominations for Board appointments;• approval of Directors’ remuneration policy;• review of the functioning of the Boards and their Committees;
and• review of corporate responsibility and sustainability, in
particular the Unilever Sustainable Living Plan.
Our risk management approach and associated systems of internal control are of utmost importance to the Boards and are described further on pages 34 to 39.
Meetings of the Boards may be held either in London or Rotterdam or such other locations as the Boards think fit, with one or two off-site Board meetings a year. In 2013, off-site Board meetings were held in Unilever’s international management centre in Four Acres, UK; New York, US; and Barcelona, Spain. In these locations the Boards learnt more about the talent and leadership development initiatives within the Group, Unilever’s innovation process, risk management and the competitive environment. Visits such as these allow the Non-Executive Directors to meet senior managers around Unilever’s global business and in turn allow them to gain a deeper understanding of the business.
NON-EXECUTIVE DIRECTOR MEETINGSThe Non-Executive Directors meet as a group, without the Executive Directors present, to consider specific agenda items set by them, usually four or five times a year. In 2013 they met five times. The Chairman, or in his absence the Vice-Chairman/Senior Independent Director, presides over such meetings.
43Unilever Annual Report and Accounts 2013 Governance
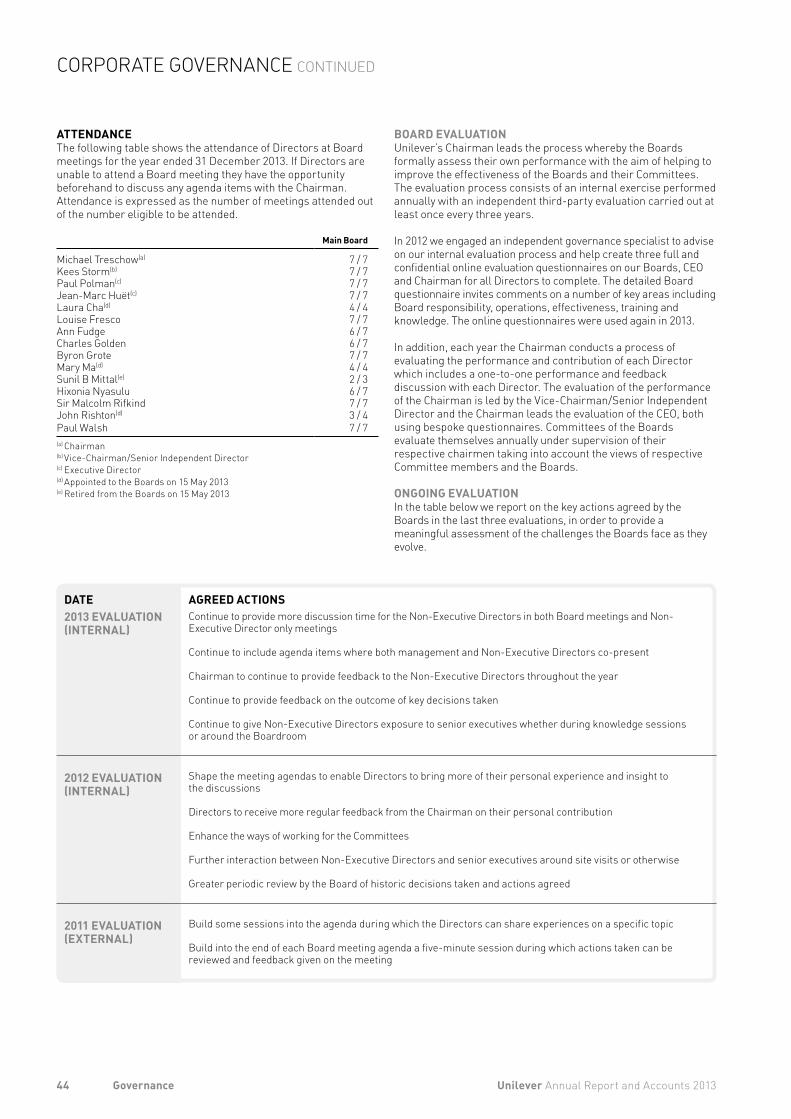
DATE AGREED ACTIONS2013 EVALUATION (INTERNAL)
Continue to provide more discussion time for the Non-Executive Directors in both Board meetings and Non-Executive Director only meetings
Continue to include agenda items where both management and Non-Executive Directors co-present
Chairman to continue to provide feedback to the Non-Executive Directors throughout the year
Continue to provide feedback on the outcome of key decisions taken
Continue to give Non-Executive Directors exposure to senior executives whether during knowledge sessions or around the Boardroom
2012 EVALUATION (INTERNAL)
Shape the meeting agendas to enable Directors to bring more of their personal experience and insight to the discussions
Directors to receive more regular feedback from the Chairman on their personal contribution
Enhance the ways of working for the Committees
Further interaction between Non-Executive Directors and senior executives around site visits or otherwise
Greater periodic review by the Board of historic decisions taken and actions agreed
2011 EVALUATION (EXTERNAL)
Build some sessions into the agenda during which the Directors can share experiences on a specific topic
Build into the end of each Board meeting agenda a five-minute session during which actions taken can be reviewed and feedback given on the meeting
ATTENDANCEThe following table shows the attendance of Directors at Board meetings for the year ended 31 December 2013. If Directors are unable to attend a Board meeting they have the opportunity beforehand to discuss any agenda items with the Chairman. Attendance is expressed as the number of meetings attended out of the number eligible to be attended.
Main Board
Michael Treschow(a) 7 / 7Kees Storm(b) 7 / 7Paul Polman(c) 7 / 7Jean-Marc Huët(c) 7 / 7Laura Cha(d) 4 / 4Louise Fresco 7 / 7Ann Fudge 6 / 7Charles Golden 6 / 7Byron Grote 7 / 7Mary Ma(d) 4 / 4Sunil B Mittal(e) 2 / 3Hixonia Nyasulu 6 / 7Sir Malcolm Rifkind 7 / 7John Rishton(d) 3 / 4Paul Walsh 7 / 7(a) Chairman (b) Vice-Chairman/Senior Independent Director(c) Executive Director(d) Appointed to the Boards on 15 May 2013(e) Retired from the Boards on 15 May 2013
BOARD EVALUATIONUnilever’s Chairman leads the process whereby the Boards formally assess their own performance with the aim of helping to improve the effectiveness of the Boards and their Committees. The evaluation process consists of an internal exercise performed annually with an independent third-party evaluation carried out at least once every three years.
In 2012 we engaged an independent governance specialist to advise on our internal evaluation process and help create three full and confidential online evaluation questionnaires on our Boards, CEO and Chairman for all Directors to complete. The detailed Board questionnaire invites comments on a number of key areas including Board responsibility, operations, effectiveness, training and knowledge. The online questionnaires were used again in 2013.
In addition, each year the Chairman conducts a process of evaluating the performance and contribution of each Director which includes a one-to-one performance and feedback discussion with each Director. The evaluation of the performance of the Chairman is led by the Vice-Chairman/Senior Independent Director and the Chairman leads the evaluation of the CEO, both using bespoke questionnaires. Committees of the Boards evaluate themselves annually under supervision of their respective chairmen taking into account the views of respective Committee members and the Boards.
ONGOING EVALUATIONIn the table below we report on the key actions agreed by the Boards in the last three evaluations, in order to provide a meaningful assessment of the challenges the Boards face as they evolve.
44 Unilever Annual Report and Accounts 2013Governance
CORPORATE GOVERNANCE CONTINUED
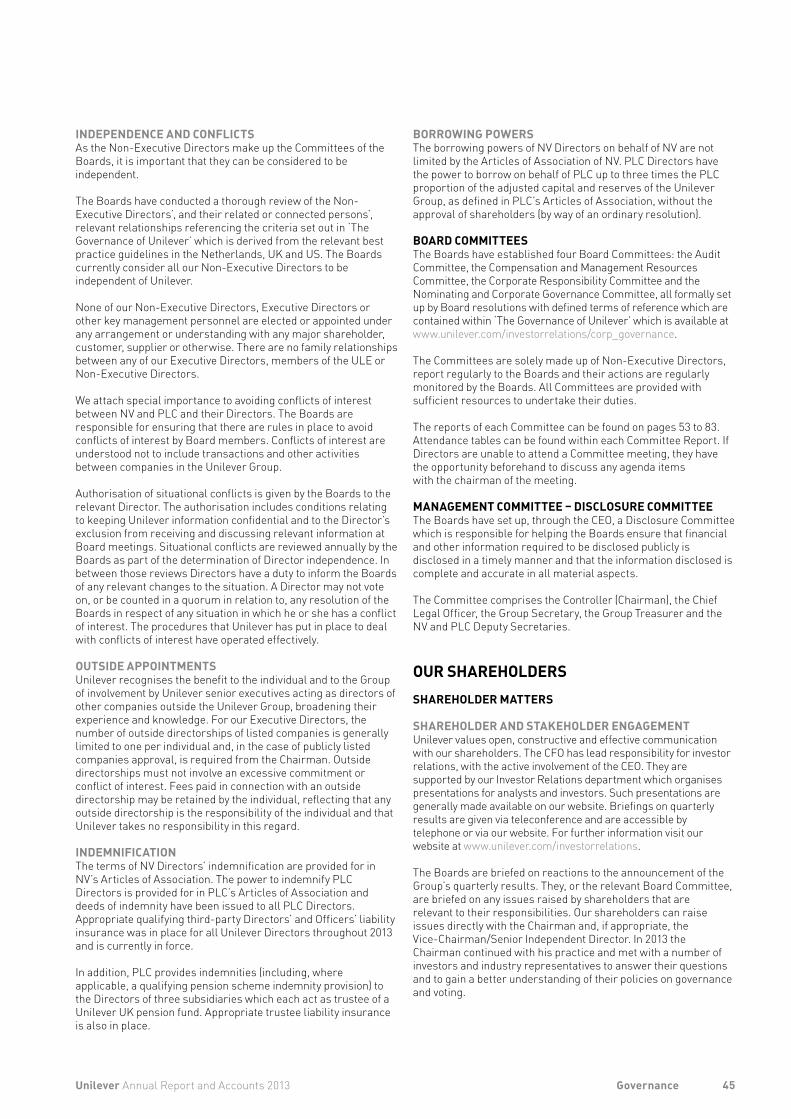
INDEPENDENCE AND CONFLICTSAs the Non-Executive Directors make up the Committees of the Boards, it is important that they can be considered to be independent.
The Boards have conducted a thorough review of the Non-Executive Directors’, and their related or connected persons’, relevant relationships referencing the criteria set out in ‘The Governance of Unilever’ which is derived from the relevant best practice guidelines in the Netherlands, UK and US. The Boards currently consider all our Non-Executive Directors to be independent of Unilever.
None of our Non-Executive Directors, Executive Directors or other key management personnel are elected or appointed under any arrangement or understanding with any major shareholder, customer, supplier or otherwise. There are no family relationships between any of our Executive Directors, members of the ULE or Non-Executive Directors.
We attach special importance to avoiding conflicts of interest between NV and PLC and their Directors. The Boards are responsible for ensuring that there are rules in place to avoid conflicts of interest by Board members. Conflicts of interest are understood not to include transactions and other activities between companies in the Unilever Group.
Authorisation of situational conflicts is given by the Boards to the relevant Director. The authorisation includes conditions relating to keeping Unilever information confidential and to the Director’s exclusion from receiving and discussing relevant information at Board meetings. Situational conflicts are reviewed annually by the Boards as part of the determination of Director independence. In between those reviews Directors have a duty to inform the Boards of any relevant changes to the situation. A Director may not vote on, or be counted in a quorum in relation to, any resolution of the Boards in respect of any situation in which he or she has a conflict of interest. The procedures that Unilever has put in place to deal with conflicts of interest have operated effectively.
OUTSIDE APPOINTMENTSUnilever recognises the benefit to the individual and to the Group of involvement by Unilever senior executives acting as directors of other companies outside the Unilever Group, broadening their experience and knowledge. For our Executive Directors, the number of outside directorships of listed companies is generally limited to one per individual and, in the case of publicly listed companies approval, is required from the Chairman. Outside directorships must not involve an excessive commitment or conflict of interest. Fees paid in connection with an outside directorship may be retained by the individual, reflecting that any outside directorship is the responsibility of the individual and that Unilever takes no responsibility in this regard.
INDEMNIFICATIONThe terms of NV Directors’ indemnification are provided for in NV’s Articles of Association. The power to indemnify PLC Directors is provided for in PLC’s Articles of Association and deeds of indemnity have been issued to all PLC Directors. Appropriate qualifying third-party Directors’ and Officers’ liability insurance was in place for all Unilever Directors throughout 2013 and is currently in force.
In addition, PLC provides indemnities (including, where applicable, a qualifying pension scheme indemnity provision) to the Directors of three subsidiaries which each act as trustee of a Unilever UK pension fund. Appropriate trustee liability insurance is also in place.
BORROWING POWERSThe borrowing powers of NV Directors on behalf of NV are not limited by the Articles of Association of NV. PLC Directors have the power to borrow on behalf of PLC up to three times the PLC proportion of the adjusted capital and reserves of the Unilever Group, as defined in PLC’s Articles of Association, without the approval of shareholders (by way of an ordinary resolution).
BOARD COMMITTEESThe Boards have established four Board Committees: the Audit Committee, the Compensation and Management Resources Committee, the Corporate Responsibility Committee and the Nominating and Corporate Governance Committee, all formally set up by Board resolutions with defined terms of reference which are contained within ‘The Governance of Unilever’ which is available at www.unilever.com/investorrelations/corp_governance.
The Committees are solely made up of Non-Executive Directors, report regularly to the Boards and their actions are regularly monitored by the Boards. All Committees are provided with sufficient resources to undertake their duties.
The reports of each Committee can be found on pages 53 to 83. Attendance tables can be found within each Committee Report. If Directors are unable to attend a Committee meeting, they have the opportunity beforehand to discuss any agenda itemswith the chairman of the meeting.
MANAGEMENT COMMITTEE – DISCLOSURE COMMITTEEThe Boards have set up, through the CEO, a Disclosure Committee which is responsible for helping the Boards ensure that financial and other information required to be disclosed publicly is disclosed in a timely manner and that the information disclosed is complete and accurate in all material aspects.
The Committee comprises the Controller (Chairman), the Chief Legal Officer, the Group Secretary, the Group Treasurer and the NV and PLC Deputy Secretaries.
OUR SHAREHOLDERSSHAREHOLDER MATTERS
SHAREHOLDER AND STAKEHOLDER ENGAGEMENTUnilever values open, constructive and effective communication with our shareholders. The CFO has lead responsibility for investor relations, with the active involvement of the CEO. They are supported by our Investor Relations department which organises presentations for analysts and investors. Such presentations are generally made available on our website. Briefings on quarterly results are given via teleconference and are accessible by telephone or via our website. For further information visit our website at www.unilever.com/investorrelations.
The Boards are briefed on reactions to the announcement of the Group’s quarterly results. They, or the relevant Board Committee, are briefed on any issues raised by shareholders that are relevant to their responsibilities. Our shareholders can raise issues directly with the Chairman and, if appropriate, the Vice-Chairman/Senior Independent Director. In 2013 the Chairman continued with his practice and met with a number of investors and industry representatives to answer their questions and to gain a better understanding of their policies on governance and voting.
45Unilever Annual Report and Accounts 2013 Governance
Both NV and PLC communicate with their respective shareholders at the AGMs as well as responding to their questions and enquiries during the course of the year. We take the views of our shareholders into account and, in accordance with all applicable legislation and regulations, may consult them in an appropriate way before putting proposals to our AGMs.
GENERAL MEETINGSAt the AGMs, a review is given of the progress of the business over the last year and there is a discussion of current issues. Shareholders are encouraged to attend the meetings and ask questions, and the question and answer sessions form an important part of the meetings. The business generally conducted includes approval/adoption of the Annual Report and Accounts, appointment of Directors, appointment of external auditors, and authorisation for the Boards to allot and repurchase shares.
General Meetings of NV and PLC are held at times and places decided by our Boards. NV meetings are normally held in Rotterdam and PLC meetings are normally held in London. As in 2012, the 2013 AGMs of NV and PLC were held on the same day. The CEO and Chairman attended both meetings in person, with half the Board members present attending in person in Rotterdam and the other half in person in London and a satellite link between the two venues to facilitate Directors’ attendance at both meetings. The same format will be followed for the 2014 AGMs.
The external auditors are welcomed to the AGMs and they are entitled to address the meetings.
VOTING RIGHTSNV shareholders can cast one vote for each €0.16 nominal capital that they hold. This means that they can cast one vote for each NV ordinary share or NV New York Registry Share. Shareholders can vote in person or by proxy. Similar arrangements apply to holders of depositary receipts issued for NV shares and the holders of NV preference shares. PLC shareholders can cast one vote for each 31⁄9p nominal capital that they hold. This means shareholders can cast one vote for each PLC ordinary share or PLC American Depositary Receipt of shares.
The Trustees of the PLC employee share trusts may vote or abstain in any way they think fit and in doing so may take into account both financial and non-financial interests of the beneficiaries of the employee share trusts or their dependants. Historically the Trustees tend not to exercise this right.
More information on the exercise of voting rights can be found in NV’s and PLC’s Articles of Association and in the respective Notices of Meetings which can be found on our website at www.unilever.com/agm.
SHAREHOLDER PROPOSED RESOLUTIONSShareholders of NV may propose resolutions if they individually or together hold at least 1% of NV’s issued capital in the form of shares or depositary receipts for shares. Shareholders who together represent at least 10% of the issued capital of NV can also requisition Extraordinary General Meetings to deal with specific resolutions.
Shareholders of PLC who together hold shares representing at least 5% of the total voting rights of PLC, or 100 shareholders who hold on average £100 each in nominal value of PLC share capital, can require PLC to propose a resolution at a General Meeting. PLC shareholders holding in aggregate 5% of the issued PLC ordinary shares are able to convene a General Meeting of PLC.
REQUIRED MAJORITIESResolutions are usually adopted at NV and PLC shareholder meetings by an absolute majority of votes cast, unless there are other requirements under the applicable laws or NV’s or PLC’s Articles of Association. For example, there are special requirements for resolutions relating to the alteration of the Articles of Association, the liquidation of NV or PLC and the alteration of the Equalisation Agreement.
A proposal to alter the Articles of Association of NV can only be made by the Board of NV. A proposal to alter the Articles of Association of PLC can be made either by the Board of PLC or by approval of shareholders by special resolution in accordance with the UK Companies Act 2006. Unless expressly specified to the contrary in the Articles of Association of PLC, PLC’s Articles of Association may be amended by a special resolution. Proposals to alter the provisions in the Articles of Association of NV and PLC respectively relating to the unity of management require the prior approval of meetings of the holders of the NV special ordinary shares and the PLC deferred stock. The Articles of Association of both NV and PLC can be found on our website at www.unilever.com/investorrelations/corp_governance.
RIGHT TO HOLD SHARESUnilever’s constitutional documents place no limitations on the right to hold NV and PLC shares. There are no limitations on the right to hold or exercise voting rights on the ordinary shares of NV and PLC imposed by Dutch or English law.
ELECTRONIC COMMUNICATIONShareholders of NV and PLC can electronically appoint a proxy to vote on their behalf at the respective AGM. Shareholders of PLC can also choose to receive electronic notification that the Annual Report and Accounts and Notice of AGMs have been published on our website, instead of receiving printed copies.
SHARE CAPITAL MATTERS
MARGARINE UNION (1930) LIMITED: CONVERSION RIGHTSThe first Viscount Leverhulme was the founder of the company which became PLC. When he died in 1925, he left in his will a large number of PLC shares in various trusts.
When the will trusts were varied in 1983, the interests of the beneficiaries of his will were also preserved. Four classes of special shares were created in Margarine Union (1930) Limited, a subsidiary of PLC. One of these classes can be converted at the end of the year 2038 into 70,875,000 PLC ordinary shares of 31⁄9p each. As at 3 March 2014 this represents 5.4% of PLC’s issued ordinary capital. This class of the special shares only has a right to dividends in specified circumstances, and no dividends have yet been paid.
FOUNDATION UNILEVER N.V. TRUST OFFICEThe Foundation Unilever N.V. Trust Office (Stichting Administratiekantoor Unilever N.V.) is a trust office with a board independent of Unilever. As part of its corporate objects, the Foundation issues depositary receipts in exchange for the NV ordinary shares and NV 7% preference shares. These depositary receipts are listed on Euronext Amsterdam, as are the NV ordinary and 7% preference shares themselves.
Holders of depositary receipts can under all circumstances exchange their depositary receipts for the underlying shares (and vice versa) and are entitled to dividends and all economic benefits on the underlying shares held by the Foundation. There are no limitations on their voting rights, they can attend all General Meetings of NV, either personally or by proxy, and have the right to speak. The Foundation only votes shares that are not represented
46 Unilever Annual Report and Accounts 2013Governance
CORPORATE GOVERNANCE CONTINUED
at a General Meeting. The Foundation votes in such a way as it deems to be in the interests of the holders of the depositary receipts. This voting policy is laid down in the Conditions of Administration that apply to the depositary receipts.
The Foundation’s shareholding fluctuates daily. Its holdings on 3 March 2014 were 1,336,559,664 NV ordinary shares (77.94%) and 9,776 NV 7% cumulative preference shares (33.71%).
The members of the board at the Foundation are Mr J H Schraven (chairman), Mr P P de Koning, Prof Emeritus Dr L Koopmans and Mr A A Olijslager. The Foundation reports periodically on its activities. Further information on the Foundation, including its Articles of Association and Conditions of Administration, can be found on its website at www.administratiekantoor-unilever.nl.
Unilever considers the arrangements of the Foundation appropriate and in the interests of NV and its shareholders given the size of the voting rights attached to the financing preference shares and the relatively low attendance of holders of ordinary shares at the General Meetings of NV.
Further information on the share capital of NV and PLC is given on pages 51 and 52.
OUR FOUNDATION AGREEMENTSFOUNDATION AGREEMENTSThe Unilever Group is created and maintained by a series of agreements between the parent companies, NV and PLC, together with special provisions in their respective Articles of Association, which are together known as the Foundation Agreements. These agreements enable Unilever to achieve unity of management, operations, shareholders’ rights, purpose and mission. Further information on these agreements is provided below and in the document entitled ‘The Governance of Unilever’. This document, together with NV’s and PLC’s current Articles of Association, and the other Foundation Agreements can be found on our website at www.unilever.com/investorrelations/corp_governance.
NV’s Articles of Association contain, among other things, the objects clause, which sets out the scope of activities that NV is authorised to undertake. They are drafted to give a wide scope and provide that the primary objectives are: to carry on business as a holding company; to manage any companies in which it has an interest; and to operate and carry into effect the Equalisation Agreement. At the 2010 PLC AGM, the shareholders agreed that the objects clause be removed from PLC’s Articles of Association so that there are no restrictions on its objects.
EQUALISATION AGREEMENTThe Equalisation Agreement makes the economic position of the shareholders of NV and PLC, as far as possible, the same as if they held shares in a single company. The Equalisation Agreement regulates the mutual rights of the shareholders of NV and PLC. Under the Equalisation Agreement, NV and PLC must adopt the same financial periods and accounting policies.
THE DEED OF MUTUAL COVENANTSThe Deed of Mutual Covenants provides that NV and PLC and their respective subsidiary companies shall co-operate in every way for the purpose of maintaining a common operating policy. They shall exchange all relevant information about their respective businesses – the intention being to create and maintain a common operating platform for the Unilever Group throughout the world. The Deed also contains provisions for the allocation of assets between NV and PLC.
THE AGREEMENT FOR MUTUAL GUARANTEES OF BORROWINGUnder the Agreement for Mutual Guarantees of Borrowing between NV and PLC, each company will, if asked by the other, guarantee the borrowings of the other. The two companies also jointly guarantee the borrowings of their subsidiaries. These arrangements are used, as a matter of financial policy, for certain significant public borrowings. They enable lenders to rely on our combined financial strength.
REQUIREMENTS AND COMPLIANCEREQUIREMENTS AND COMPLIANCE – GENERALUnilever is subject to corporate governance requirements (legislation, codes and/or standards) in the Netherlands, the UK and the US and in this section we report on our compliance against these.
Under the European Takeover Directive as implemented in the Netherlands and the UK, the UK Companies Act 2006 and rules of the US Securities and Exchange Commission, Unilever is required to provide information on contracts and other arrangements essential or material to the business of the Group. Other than the Foundation Agreements discussed above, we believe we do not have any such contracts or arrangements.
Our governance arrangements are designed and structured to promote and further the interests of our companies and our shareholders. The Boards, however, reserve the right, in cases where they decide such to be in the interests of the companies or our shareholders, to depart from that which is set out in the present and previous sections in relation to our corporate governance. Any such changes will be reported in future Annual Report and Accounts and, when necessary, through changes to the relevant documents published on our website. As appropriate, proposals for change will be put to our shareholders for approval.
REQUIREMENTS – THE NETHERLANDSNV complies with almost all of the principles and best practice provisions of the Dutch Corporate Governance Code (Dutch Code), a copy of which is available at www.commissiecorporategovernance.nl.
Unilever places a great deal of importance on corporate responsibility and sustainability as is evidenced by our vision to double the size of the Group while reducing our environmental footprint and increasing our positive social impact. Unilever is keen to ensure focus on key financial performance measures which we believe to be the drivers of shareholder value creation and relative total shareholder return. Unilever therefore believes that the interests of the business and shareholders are best served by linking our long-term share plans to the measures as described in the Directors’ Remuneration Report and has not included a non-financial performance indicator (Principle II.2 and bpp II.2.3).
RISK MANAGEMENT AND CONTROLWith regard to financial reporting risks, as advised by the Audit Committee (as described in its report on pages 53 to 55), the Boards believe that the risk management and control systems provide reasonable assurance that the financial statements do not contain any errors of material importance and the risk management and control systems have worked properly in 2013 (bpp II.1.5).
47Unilever Annual Report and Accounts 2013 Governance
The statements in the paragraph above are not statements in accordance with the requirements of Section 404 of the US Sarbanes-Oxley Act of 2002.
RETENTION PERIOD OF SHARESThe Dutch Code recommends that shares granted to Executive Directors must be retained for a period of at least five years (bpp II.2.5). Our remuneration policy requires Executive Directors to build and retain a personal shareholding in Unilever. In addition, the Compensation and Management Resources Committee approved that with effect from 1 January 2014 Executive Directors will be required to hold 100% of the shares needed to maintain their minimum shareholding requirement until 12 months after they leave Unilever and 50% of these shares for 24 months after they leave Unilever. The Boards believe that this is in line with the spirit of the Dutch Code.
SEVERANCE PAYIt is our policy to set the level of severance payments for Directors at no more than one year’s salary, unless the Boards, on the recommendation of the Compensation and Management Resources Committee, find this manifestly unreasonable given circumstances or unless otherwise dictated by applicable law (bpp II.2.8).
FINANCING PREFERENCE SHARESNV issued 6% and 7% cumulative preference shares between 1927 and 1964. Their voting rights are based on their nominal value, as prescribed by Dutch law. The Dutch Code recommends that the voting rights of any newly issued preference shares should be based on their economic value rather than on their nominal value (bpp IV.1.2). NV agrees with this principle but cannot unilaterally reduce voting rights of its outstanding preference shares.
ANTI-TAKEOVER CONSTRUCTIONS AND CONTROL OVER THE COMPANY NV confirms that it has no anti-takeover constructions, in the sense of constructions that are intended solely, or primarily, to block future hostile public offers for its shares (bpp IV.3.11). Nor does NV have any constructions whose specific purpose is to prevent a bidder, after acquiring 75% of the capital, from appointing or dismissing members of the Board and subsequently altering the Articles of Association. The acquisition through a public offer of a majority of the shares in a company does not, under Dutch law, preclude the continued right of the board of the company to exercise its powers.
MEETINGS OF ANALYSTS AND PRESENTATIONS TO INVESTORSWe have extensive procedures for handling relations and communicating with shareholders, investors, analysts and the media (see also pages 45 and 46). The important presentations and meetings are conducted as far as practicable in accordance with the Dutch Code (bpp IV.3.1). Due to their large number and overlap in information, some of the less important ones are not announced in advance, made accessible to everyone or put on our website.
CORPORATE GOVERNANCE STATEMENTNV is required to make a statement concerning corporate governance as referred to in article 2a of the decree on additional requirements for annual reports (Vaststellingsbesluit nadere voorschriften inhoud jaarverslag) with effect from 1 January 2010 (the ‘Decree’). The information required to be included in this corporate governance statement as described in articles 3, 3a and 3b of the Decree can be found in the following sections of this Annual Report and Accounts:
• the information concerning compliance with the Dutch Code, as required by article 3 of the Decree, can be found under ‘Corporate Governance’ within the section ‘Requirements – the Netherlands’;
• the information concerning Unilever’s risk management and control frameworks relating to the financial reporting process, as required by article 3a(a) of the Decree, can be found under ‘Risks’ on pages 34 to 39 and within the relevant sections under ‘Corporate Governance’;
• the information regarding the functioning of NV’s General Meeting, and the authority and rights of NV’s shareholders, as required by article 3a(b) of the Decree, can be found within the relevant sections under ‘Corporate Governance’;
• the information regarding the composition and functioning of NV’s Board and its Committees, as required by article 3a(c) of the Decree, can be found within the relevant sections under ‘Corporate Governance’; and
• the information concerning the inclusion of the information required by the decree Article 10 European Takeover Directive, as required by article 3b of the Decree, can be found within the relevant sections under ‘Corporate Governance’.
REQUIREMENTS – THE UNITED KINGDOMPLC, being a company that is incorporated in the UK and listed on the London Stock Exchange, is required to state how it has applied the main principles and how far it has complied with the provisions set out in the 2012 UK Corporate Governance Code (UK Code), a copy of which is available at www.frc.org.uk. In 2013, PLC complied with all UK Code provisions.
RISK MANAGEMENT AND CONTROLOur approach to risk management and systems of internal control is in line with the recommendations in the report on ‘Internal Control – Revised Guidance for Directors on the UK Combined Code’ (‘The Turnbull guidance’). It is Unilever’s practice to bring acquired companies within the Group’s governance procedures as soon as is practicable and in any event by the end of the first full year of operation.
DIRECTORS’ REPORT OF PLCFor the purposes of the UK Companies Act 2006, the Directors’ Report of Unilever PLC for the year ended 31 December 2013 comprises this paragraph to the end of the first column on page 50 and the information contained on pages 40 (directors), 51 and 52 (share capital), 45 (director indemnities), 42 to 52 (corporate governance), 109 (dividends), 141 and 145 (post-balance sheet events) and 120 to 125 (treasury risk management). The information required to be given pursuant to Section 992 of the UK Companies Act 2006 is covered elsewhere in this Annual Report and Accounts.
The Directors’ Report has been drawn up and presented in accordance with and in reliance upon English company law and liabilities of the Directors in connection with that report shall be subject to the limitations and restrictions provided by such law.
Under the UK Companies Act 2006, a safe harbour limits the liability of Directors in respect of statements in and omissions from the Directors’ Report. Under English Law the Directors would be liable to Unilever (but not to any third-party) if the Directors’ Report contained errors as a result of recklessness or knowing misstatement or dishonest concealment of a material fact, but would not otherwise be liable.
48 Unilever Annual Report and Accounts 2013Governance
CORPORATE GOVERNANCE CONTINUED
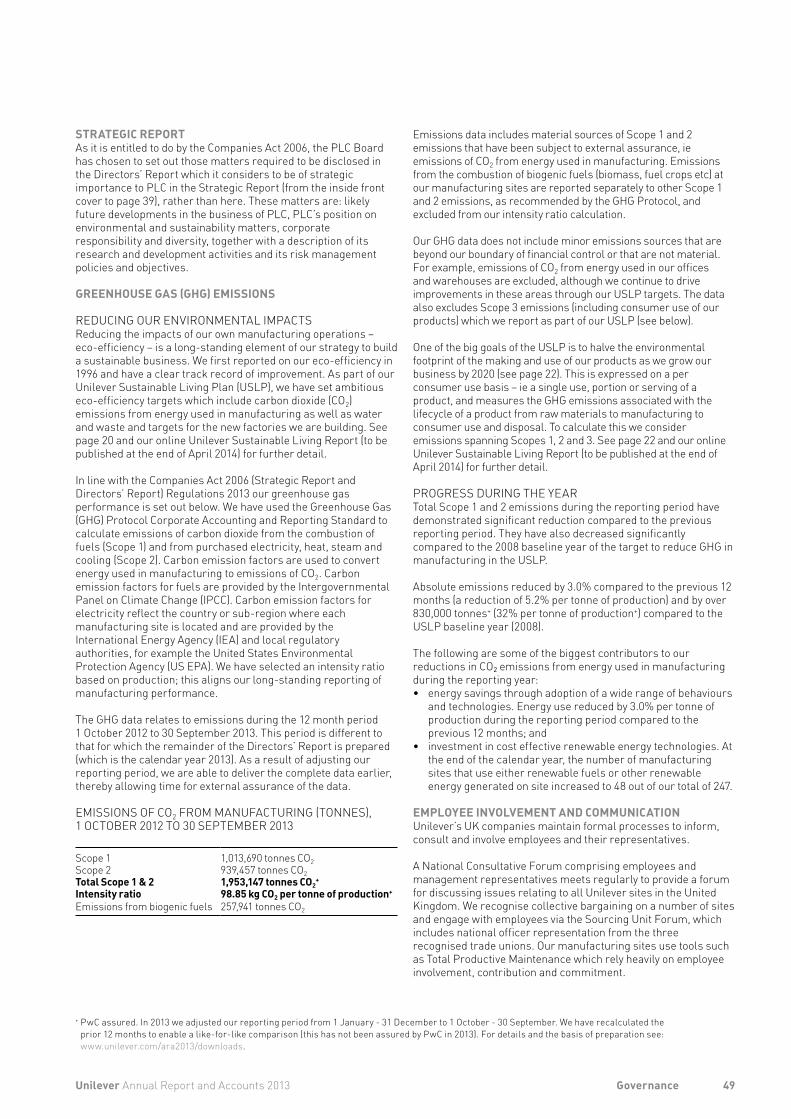
STRATEGIC REPORTAs it is entitled to do by the Companies Act 2006, the PLC Board has chosen to set out those matters required to be disclosed in the Directors’ Report which it considers to be of strategic importance to PLC in the Strategic Report (from the inside front cover to page 39), rather than here. These matters are: likely future developments in the business of PLC, PLC’s position on environmental and sustainability matters, corporate responsibility and diversity, together with a description of its research and development activities and its risk management policies and objectives.
GREENHOUSE GAS (GHG) EMISSIONS
REDUCING OUR ENVIRONMENTAL IMPACTSReducing the impacts of our own manufacturing operations – eco-efficiency – is a long-standing element of our strategy to build a sustainable business. We first reported on our eco-efficiency in 1996 and have a clear track record of improvement. As part of our Unilever Sustainable Living Plan (USLP), we have set ambitious eco-efficiency targets which include carbon dioxide (CO2) emissions from energy used in manufacturing as well as water and waste and targets for the new factories we are building. See page 20 and our online Unilever Sustainable Living Report (to be published at the end of April 2014) for further detail.
In line with the Companies Act 2006 (Strategic Report and Directors’ Report) Regulations 2013 our greenhouse gas performance is set out below. We have used the Greenhouse Gas (GHG) Protocol Corporate Accounting and Reporting Standard to calculate emissions of carbon dioxide from the combustion of fuels (Scope 1) and from purchased electricity, heat, steam and cooling (Scope 2). Carbon emission factors are used to convert energy used in manufacturing to emissions of CO2. Carbon emission factors for fuels are provided by the Intergovernmental Panel on Climate Change (IPCC). Carbon emission factors for electricity reflect the country or sub-region where each manufacturing site is located and are provided by the International Energy Agency (IEA) and local regulatory authorities, for example the United States Environmental Protection Agency (US EPA). We have selected an intensity ratio based on production; this aligns our long-standing reporting of manufacturing performance.
The GHG data relates to emissions during the 12 month period 1 October 2012 to 30 September 2013. This period is different to that for which the remainder of the Directors’ Report is prepared (which is the calendar year 2013). As a result of adjusting our reporting period, we are able to deliver the complete data earlier, thereby allowing time for external assurance of the data.
EMISSIONS OF CO2 FROM MANUFACTURING (TONNES), 1 OCTOBER 2012 TO 30 SEPTEMBER 2013
Scope 1 1,013,690 tonnes CO2 Scope 2 939,457 tonnes CO2Total Scope 1 & 2 1,953,147 tonnes CO2
+
Intensity ratio 98.85 kg CO2 per tonne of production+
Emissions from biogenic fuels 257,941 tonnes CO2
Emissions data includes material sources of Scope 1 and 2 emissions that have been subject to external assurance, ie emissions of CO2 from energy used in manufacturing. Emissions from the combustion of biogenic fuels (biomass, fuel crops etc) at our manufacturing sites are reported separately to other Scope 1 and 2 emissions, as recommended by the GHG Protocol, and excluded from our intensity ratio calculation.
Our GHG data does not include minor emissions sources that are beyond our boundary of financial control or that are not material. For example, emissions of CO2 from energy used in our offices and warehouses are excluded, although we continue to drive improvements in these areas through our USLP targets. The data also excludes Scope 3 emissions (including consumer use of our products) which we report as part of our USLP (see below).
One of the big goals of the USLP is to halve the environmental footprint of the making and use of our products as we grow our business by 2020 (see page 22). This is expressed on a per consumer use basis – ie a single use, portion or serving of a product, and measures the GHG emissions associated with the lifecycle of a product from raw materials to manufacturing to consumer use and disposal. To calculate this we consider emissions spanning Scopes 1, 2 and 3. See page 22 and our online Unilever Sustainable Living Report (to be published at the end of April 2014) for further detail.
PROGRESS DURING THE YEARTotal Scope 1 and 2 emissions during the reporting period have demonstrated significant reduction compared to the previous reporting period. They have also decreased significantly compared to the 2008 baseline year of the target to reduce GHG in manufacturing in the USLP.
Absolute emissions reduced by 3.0% compared to the previous 12 months (a reduction of 5.2% per tonne of production) and by over 830,000 tonnes+ (32% per tonne of production+) compared to the USLP baseline year (2008).
The following are some of the biggest contributors to our reductions in CO₂ emissions from energy used in manufacturing during the reporting year:• energy savings through adoption of a wide range of behaviours
and technologies. Energy use reduced by 3.0% per tonne of production during the reporting period compared to the previous 12 months; and
• investment in cost effective renewable energy technologies. At the end of the calendar year, the number of manufacturing sites that use either renewable fuels or other renewable energy generated on site increased to 48 out of our total of 247.
EMPLOYEE INVOLVEMENT AND COMMUNICATIONUnilever’s UK companies maintain formal processes to inform, consult and involve employees and their representatives.
A National Consultative Forum comprising employees and management representatives meets regularly to provide a forum for discussing issues relating to all Unilever sites in the United Kingdom. We recognise collective bargaining on a number of sites and engage with employees via the Sourcing Unit Forum, which includes national officer representation from the three recognised trade unions. Our manufacturing sites use tools such as Total Productive Maintenance which rely heavily on employee involvement, contribution and commitment.
+ PwC assured. In 2013 we adjusted our reporting period from 1 January - 31 December to 1 October - 30 September. We have recalculated the prior 12 months to enable a like-for-like comparison (this has not been assured by PwC in 2013). For details and the basis of preparation see: www.unilever.com/ara2013/downloads.
49Unilever Annual Report and Accounts 2013 Governance
A European Works Council, embracing employee and management representatives from countries within Europe, has been in existence for several years and provides a forum for discussing issues that extend across national boundaries.
The Group carries out regular and wide-ranging opinion surveys providing valuable insight into employee views, attitudes and levels of engagement.
The Directors’ Reports of the United Kingdom operating companies contain more details about how they have communicated with their employees during 2013.
EQUAL OPPORTUNITIES AND DIVERSITYIn accordance with our Code of Business Principles, Unilever aims to ensure that applications for employment from everyone are given full and fair consideration and that everyone is given access to training, development and career opportunities. Every effort is also made to retrain and support employees who become disabled while working within the Group.
Unilever continuously reviews ways in which greater diversity can be achieved across our teams in the UK. We have put in place policies which promote the achievement of diversity in our business and we review these regularly. For example, Unilever UK provides policies on home working, flexible working, maternity and paternity leave, child care provision and career breaks, which help us to meet the objective of greater employee diversity.
INDEPENDENT AUDITORS AND DISCLOSURE OF INFORMATION TO AUDITORSA resolution will be proposed at the AGM on 14 May 2014 for the appointment of KPMG LLP as auditors of PLC. PricewaterhouseCoopers LLP’s present appointment will end at the conclusion of the AGM.
To the best of each of the Directors’ knowledge and belief, and having made appropriate enquiries of other officers of the Unilever Group, all information relevant to enabling the auditors to provide their opinions on PLC’s consolidated and parent company accounts has been provided. Each of the Directors has taken all reasonable steps to ensure their awareness of any relevant audit information and to establish that Unilever PLC’s auditors are aware of any such information.
This Directors’ Report of Unilever PLC has been approved by the Board and signed on their behalf by Tonia Lovell – Group Secretary.
REQUIREMENTS – THE UNITED STATESBoth NV and PLC are listed on the New York Stock Exchange (NYSE). As such, both companies must comply with the requirements of US legislation, such as the Sarbanes-Oxley Act of 2002, regulations enacted under US securities laws and the Listing Standards of the NYSE, that are applicable to foreign private issuers, copies of which are available at www.sec.gov and www.nyse.com.
We are compliant with the Listing Standards of the NYSE applicable to foreign private issuers.
We are also required to disclose any significant ways in which our corporate governance practices differ from those typically followed by US companies listed on the NYSE. Our corporate governance practices do not significantly differ from those required of US companies listed on the NYSE. Attention is drawn to the Report of the Audit Committee on pages 53 to 55. In addition, further details about our corporate governance are provided in the document entitled ‘The Governance of Unilever’, which can be found on our website at www.unilever.com/investorrelations/corp_governance.
All senior executives and senior financial officers have declared their understanding of and compliance with Unilever’s Code of Business Principles and the related Code Policies. No waiver from any provision of the Code of Business Principles or Code Policies was granted in 2013 to any of the persons falling within the scope of the SEC requirements. The Code Policies include mandatory requirements covering, but not limited to, the following areas: accurate records, reporting and accounting; anti-bribery; avoiding conflicts of interest; gifts and entertainment; preventing insider trading; political activities and political donations; contact with government, regulators and non-governmental organisations; respect, dignity and fair treatment; and external communications (the media, investors and analysts). Our Code of Business Principles can be found on our website at www.unilever.com/investorrelations/corp_governance.
RISK MANAGEMENT AND CONTROLFollowing a review by the Disclosure Committee, Audit Committee and Boards, the CEO and the CFO concluded that the design and operation of the Group’s disclosure controls and procedures, including those defined in United States Securities Exchange Act of 1934 – Rule 13a – 15(e), as at 31 December 2013 were effective, and that subsequently until the date of the approval of the Annual Report and Accounts by the Boards, there have been no significant changes in the Group’s internal controls, or in other factors that could significantly affect those controls.
Unilever is required by Section 404 of the US Sarbanes-Oxley Act of 2002 to report on the effectiveness of its internal control over financial reporting. This requirement will be reported on separately and will form part of Unilever’s Annual Report on Form 20-F.
50 Unilever Annual Report and Accounts 2013Governance
CORPORATE GOVERNANCE CONTINUED
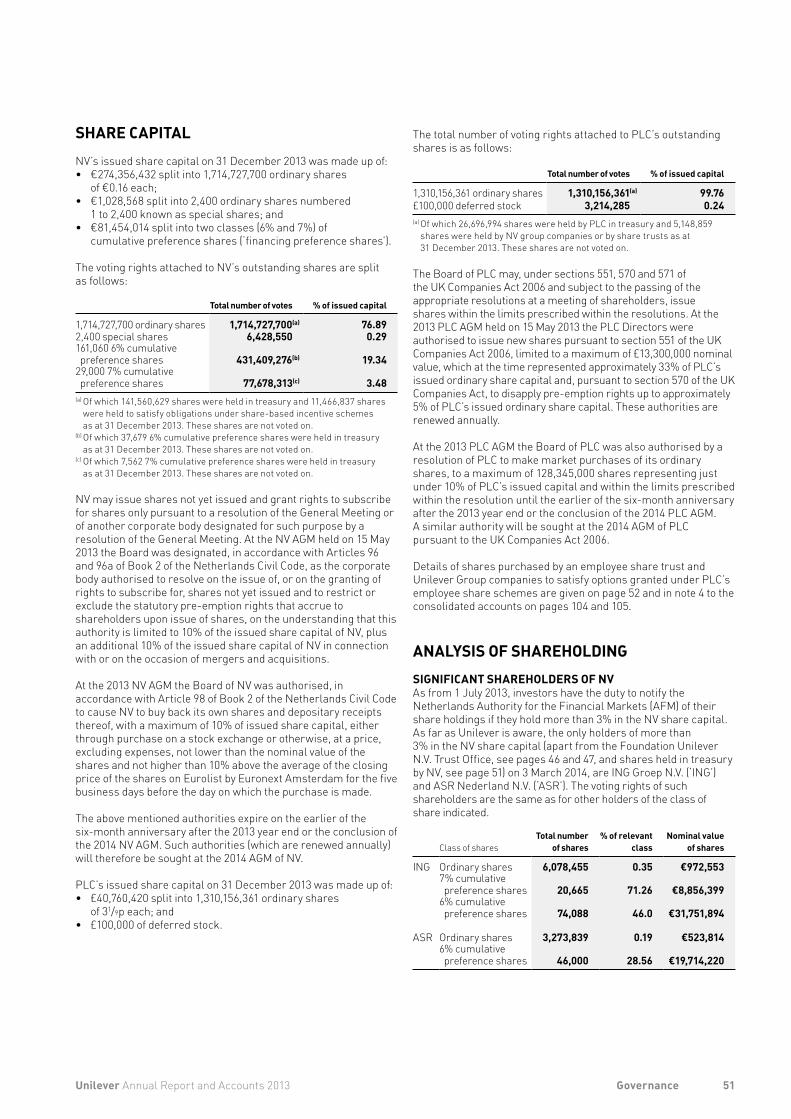
SHARE CAPITALNV’s issued share capital on 31 December 2013 was made up of:• €274,356,432 split into 1,714,727,700 ordinary shares
of €0.16 each; • €1,028,568 split into 2,400 ordinary shares numbered
1 to 2,400 known as special shares; and • €81,454,014 split into two classes (6% and 7%) of
cumulative preference shares (‘financing preference shares’).
The voting rights attached to NV’s outstanding shares are split as follows:
Total number of votes % of issued capital
1,714,727,700 ordinary shares 1,714,727,700(a) 76.892,400 special shares 6,428,550 0.29161,060 6% cumulative preference shares 431,409,276(b) 19.34
29,000 7% cumulative preference shares 77,678,313(c) 3.48
(a) Of which 141,560,629 shares were held in treasury and 11,466,837 shares were held to satisfy obligations under share-based incentive schemes as at 31 December 2013. These shares are not voted on.
(b) Of which 37,679 6% cumulative preference shares were held in treasury as at 31 December 2013. These shares are not voted on.
(c) Of which 7,562 7% cumulative preference shares were held in treasury as at 31 December 2013. These shares are not voted on.
NV may issue shares not yet issued and grant rights to subscribe for shares only pursuant to a resolution of the General Meeting or of another corporate body designated for such purpose by a resolution of the General Meeting. At the NV AGM held on 15 May 2013 the Board was designated, in accordance with Articles 96 and 96a of Book 2 of the Netherlands Civil Code, as the corporate body authorised to resolve on the issue of, or on the granting of rights to subscribe for, shares not yet issued and to restrict or exclude the statutory pre-emption rights that accrue to shareholders upon issue of shares, on the understanding that this authority is limited to 10% of the issued share capital of NV, plus an additional 10% of the issued share capital of NV in connection with or on the occasion of mergers and acquisitions.
At the 2013 NV AGM the Board of NV was authorised, in accordance with Article 98 of Book 2 of the Netherlands Civil Code to cause NV to buy back its own shares and depositary receipts thereof, with a maximum of 10% of issued share capital, either through purchase on a stock exchange or otherwise, at a price, excluding expenses, not lower than the nominal value of the shares and not higher than 10% above the average of the closing price of the shares on Eurolist by Euronext Amsterdam for the five business days before the day on which the purchase is made.
The above mentioned authorities expire on the earlier of the six-month anniversary after the 2013 year end or the conclusion of the 2014 NV AGM. Such authorities (which are renewed annually)will therefore be sought at the 2014 AGM of NV.
PLC’s issued share capital on 31 December 2013 was made up of:• £40,760,420 split into 1,310,156,361 ordinary shares
of 31/9p each; and • £100,000 of deferred stock.
The total number of voting rights attached to PLC’s outstanding shares is as follows:
Total number of votes % of issued capital
1,310,156,361 ordinary shares 1,310,156,361(a) 99.76£100,000 deferred stock 3,214,285 0.24(a) Of which 26,696,994 shares were held by PLC in treasury and 5,148,859
shares were held by NV group companies or by share trusts as at 31 December 2013. These shares are not voted on.
The Board of PLC may, under sections 551, 570 and 571 of the UK Companies Act 2006 and subject to the passing of the appropriate resolutions at a meeting of shareholders, issue shares within the limits prescribed within the resolutions. At the 2013 PLC AGM held on 15 May 2013 the PLC Directors were authorised to issue new shares pursuant to section 551 of the UK Companies Act 2006, limited to a maximum of £13,300,000 nominal value, which at the time represented approximately 33% of PLC’s issued ordinary share capital and, pursuant to section 570 of the UK Companies Act, to disapply pre-emption rights up to approximately 5% of PLC’s issued ordinary share capital. These authorities are renewed annually.
At the 2013 PLC AGM the Board of PLC was also authorised by a resolution of PLC to make market purchases of its ordinary shares, to a maximum of 128,345,000 shares representing just under 10% of PLC’s issued capital and within the limits prescribed within the resolution until the earlier of the six-month anniversary after the 2013 year end or the conclusion of the 2014 PLC AGM. A similar authority will be sought at the 2014 AGM of PLC pursuant to the UK Companies Act 2006.
Details of shares purchased by an employee share trust and Unilever Group companies to satisfy options granted under PLC’s employee share schemes are given on page 52 and in note 4 to the consolidated accounts on pages 104 and 105.
ANALYSIS OF SHAREHOLDINGSIGNIFICANT SHAREHOLDERS OF NVAs from 1 July 2013, investors have the duty to notify the Netherlands Authority for the Financial Markets (AFM) of their share holdings if they hold more than 3% in the NV share capital. As far as Unilever is aware, the only holders of more than 3% in the NV share capital (apart from the Foundation Unilever N.V. Trust Office, see pages 46 and 47, and shares held in treasury by NV, see page 51) on 3 March 2014, are ING Groep N.V. (‘ING’) and ASR Nederland N.V. (‘ASR’). The voting rights of such shareholders are the same as for other holders of the class of share indicated.
Class of sharesTotal number
of shares% of relevant
classNominal value
of shares
ING Ordinary shares 6,078,455 0.35 €972,5537% cumulative preference shares 20,665 71.26 €8,856,399
6% cumulative preference shares 74,088 46.0 €31,751,894
ASR Ordinary shares 3,273,839 0.19 €523,8146% cumulative preference shares 46,000 28.56 €19,714,220
51Unilever Annual Report and Accounts 2013 Governance
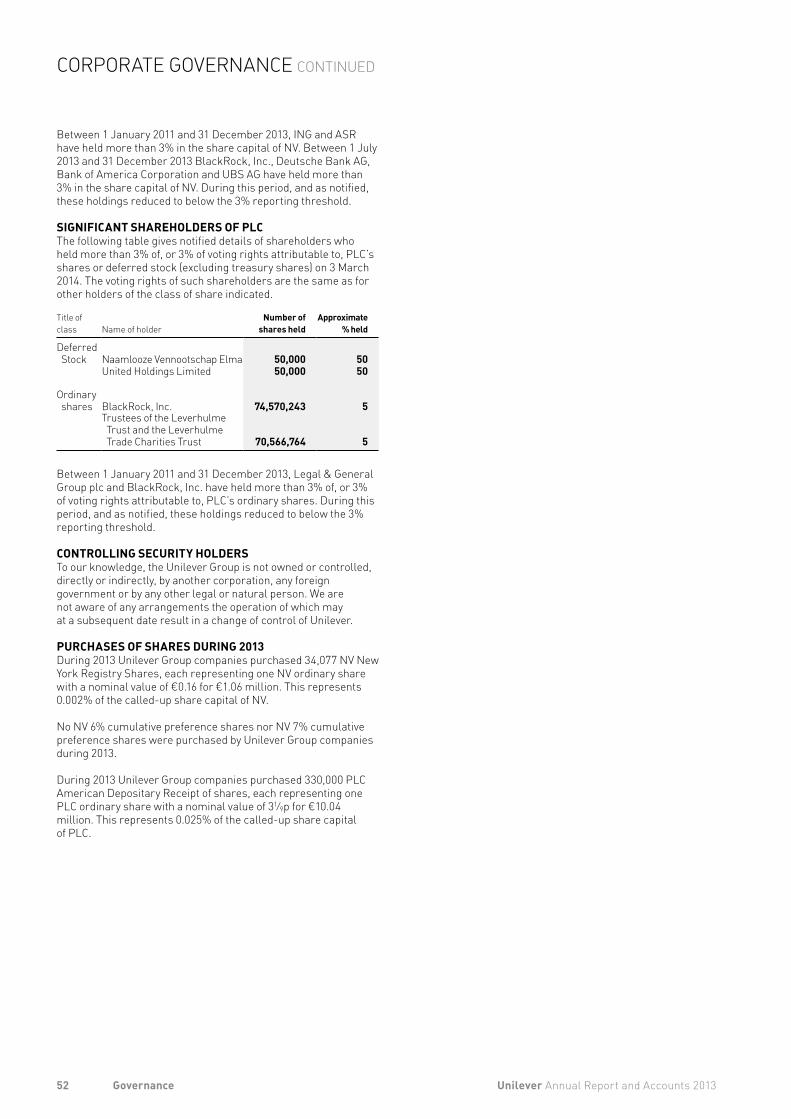
Between 1 January 2011 and 31 December 2013, ING and ASR have held more than 3% in the share capital of NV. Between 1 July 2013 and 31 December 2013 BlackRock, Inc., Deutsche Bank AG, Bank of America Corporation and UBS AG have held more than 3% in the share capital of NV. During this period, and as notified, these holdings reduced to below the 3% reporting threshold.
SIGNIFICANT SHAREHOLDERS OF PLCThe following table gives notified details of shareholders who held more than 3% of, or 3% of voting rights attributable to, PLC’s shares or deferred stock (excluding treasury shares) on 3 March 2014. The voting rights of such shareholders are the same as for other holders of the class of share indicated.
Title of class Name of holder
Number ofshares held
Approximate% held
Deferred Stock Naamlooze Vennootschap Elma 50,000 50
United Holdings Limited 50,000 50
Ordinary shares BlackRock, Inc. 74,570,243 5
Trustees of the Leverhulme Trust and the Leverhulme Trade Charities Trust 70,566,764 5
Between 1 January 2011 and 31 December 2013, Legal & General Group plc and BlackRock, Inc. have held more than 3% of, or 3% of voting rights attributable to, PLC’s ordinary shares. During this period, and as notified, these holdings reduced to below the 3% reporting threshold.
CONTROLLING SECURITY HOLDERSTo our knowledge, the Unilever Group is not owned or controlled, directly or indirectly, by another corporation, any foreign government or by any other legal or natural person. We are not aware of any arrangements the operation of which may at a subsequent date result in a change of control of Unilever.
PURCHASES OF SHARES DURING 2013During 2013 Unilever Group companies purchased 34,077 NV New York Registry Shares, each representing one NV ordinary share with a nominal value of €0.16 for €1.06 million. This represents 0.002% of the called-up share capital of NV.
No NV 6% cumulative preference shares nor NV 7% cumulative preference shares were purchased by Unilever Group companies during 2013.
During 2013 Unilever Group companies purchased 330,000 PLC American Depositary Receipt of shares, each representing one PLC ordinary share with a nominal value of 31⁄9p for €10.04 million. This represents 0.025% of the called-up share capital of PLC.
52 Unilever Annual Report and Accounts 2013Governance
CORPORATE GOVERNANCE CONTINUED
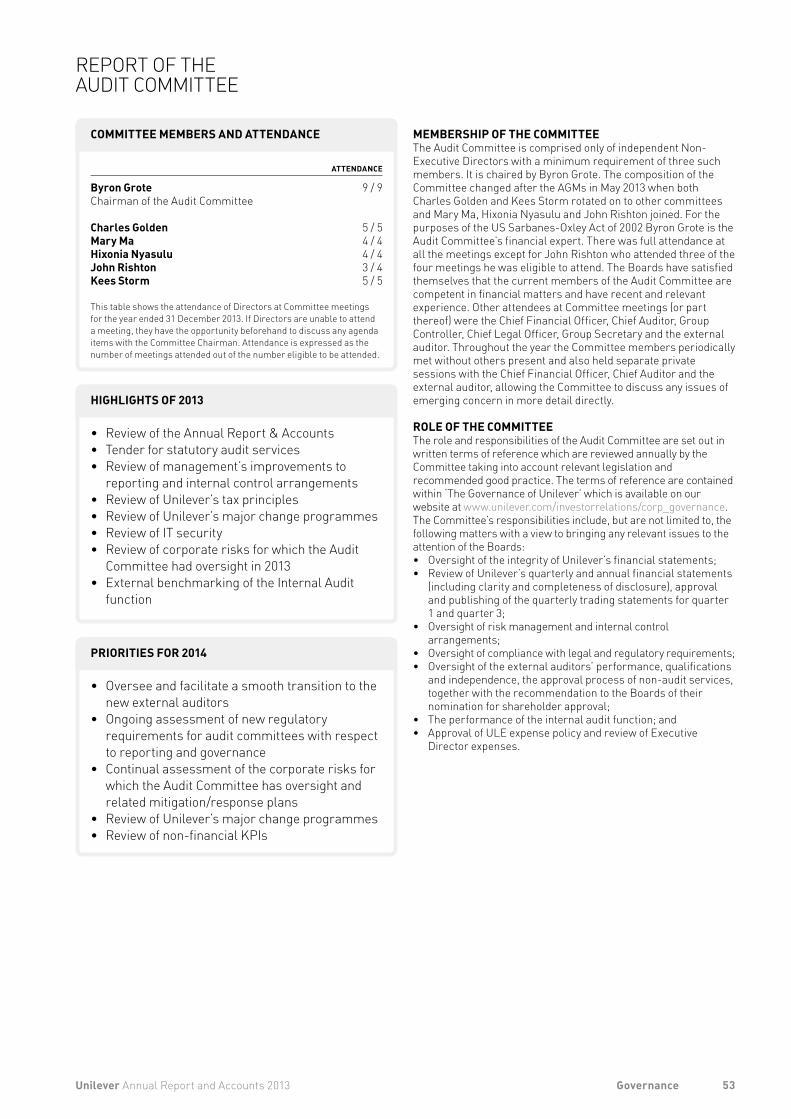
ATTENDANCE
Byron Grote 9 / 9Chairman of the Audit Committee
Charles Golden 5 / 5Mary Ma 4 / 4Hixonia Nyasulu 4 / 4John Rishton 3 / 4Kees Storm 5 / 5
This table shows the attendance of Directors at Committee meetings for the year ended 31 December 2013. If Directors are unable to attend a meeting, they have the opportunity beforehand to discuss any agenda items with the Committee Chairman. Attendance is expressed as the number of meetings attended out of the number eligible to be attended.
• Review of the Annual Report & Accounts • Tender for statutory audit services • Review of management’s improvements to
reporting and internal control arrangements• Review of Unilever’s tax principles• Review of Unilever’s major change programmes• Review of IT security• Review of corporate risks for which the Audit
Committee had oversight in 2013• External benchmarking of the Internal Audit
function
• Oversee and facilitate a smooth transition to the new external auditors
• Ongoing assessment of new regulatory requirements for audit committees with respect to reporting and governance
• Continual assessment of the corporate risks for which the Audit Committee has oversight and related mitigation/response plans
• Review of Unilever’s major change programmes• Review of non-financial KPIs
COMMITTEE MEMBERS AND ATTENDANCE
HIGHLIGHTS OF 2013
PRIORITIES FOR 2014
MEMBERSHIP OF THE COMMITTEEThe Audit Committee is comprised only of independent Non-Executive Directors with a minimum requirement of three such members. It is chaired by Byron Grote. The composition of the Committee changed after the AGMs in May 2013 when both Charles Golden and Kees Storm rotated on to other committees and Mary Ma, Hixonia Nyasulu and John Rishton joined. For the purposes of the US Sarbanes-Oxley Act of 2002 Byron Grote is the Audit Committee’s financial expert. There was full attendance at all the meetings except for John Rishton who attended three of the four meetings he was eligible to attend. The Boards have satisfied themselves that the current members of the Audit Committee are competent in financial matters and have recent and relevant experience. Other attendees at Committee meetings (or part thereof) were the Chief Financial Officer, Chief Auditor, Group Controller, Chief Legal Officer, Group Secretary and the external auditor. Throughout the year the Committee members periodically met without others present and also held separate private sessions with the Chief Financial Officer, Chief Auditor and the external auditor, allowing the Committee to discuss any issues of emerging concern in more detail directly.
ROLE OF THE COMMITTEEThe role and responsibilities of the Audit Committee are set out in written terms of reference which are reviewed annually by the Committee taking into account relevant legislation and recommended good practice. The terms of reference are contained within ‘The Governance of Unilever’ which is available on our website at www.unilever.com/investorrelations/corp_governance. The Committee’s responsibilities include, but are not limited to, the following matters with a view to bringing any relevant issues to the attention of the Boards: • Oversight of the integrity of Unilever’s financial statements; • Review of Unilever’s quarterly and annual financial statements
(including clarity and completeness of disclosure), approval and publishing of the quarterly trading statements for quarter 1 and quarter 3;
• Oversight of risk management and internal control arrangements;
• Oversight of compliance with legal and regulatory requirements; • Oversight of the external auditors’ performance, qualifications
and independence, the approval process of non-audit services, together with the recommendation to the Boards of their nomination for shareholder approval;
• The performance of the internal audit function; and• Approval of ULE expense policy and review of Executive
Director expenses.
53Unilever Annual Report and Accounts 2013 Governance
REPORT OF THE AUDIT COMMITTEE
HOW THE COMMITTEE HAS DISCHARGED ITS RESPONSIBILITIESDuring the year, the Committee’s principal activities were as follows:
FINANCIAL STATEMENTS The Committee reviewed the quarterly financial press releases together with the associated quarterly reports from the Chief Financial Officer and the Disclosure Committee, and with respect to the half-year and full-year results the external auditors’ reports, prior to their publication. They also reviewed the Annual Report and Accounts and Annual Report on Form 20-F. These reviews incorporated the accounting policies and significant judgements and estimates underpinning the financial statements as disclosed within note 1 on pages 94 and 95. Particular attention was paid to the following significant issues in relation to the financial statements:• goodwill and intangible assets – impairment testing refer to
note 9;• pensions – obligations and assumptions, refer to note 4;• provisions and contingencies, including direct and indirect tax
provisions, refer to notes 6 and 19;The external auditors have agreed the list of significant issues reported.
For each of the above areas a paper outlining the key facts and judgements, prepared by management, was circulated to the Committee prior to the meeting at which it was discussed. Members of management attended the section of the meeting of the Committee where their paper was discussed to answer any questions or challenges posed by the Committee. The issues were also discussed with the external auditor. The Committee was satisfied that these significant issues have been appropriately addressed by management.
At the request of the Board the Committee considered whether the 2013 Annual Report and Accounts was fair, balanced and understandable and whether it provided the necessary information for shareholders to assess the Group’s performance, business model and strategy. The Committee were satisfied that, taken as a whole, the 2013 Annual Report and Accounts is fair, balanced and understandable.
RISK MANAGEMENT AND INTERNAL CONTROL ARRANGEMENTSThe Committee reviewed Unilever’s overall approach to risk management and control, and its processes, outcomes and disclosure. It reviewed:• the Controller’s Quarterly Risk and Control Status Report,
including Code of Business Principles cases relating to frauds and financial crimes and significant complaints received through the Unilever Code Support Line;
• the 2013 corporate risks for which the Audit Committee had oversight and the proposed 2014 corporate risks identified by the Unilever Leadership Executive;
• management’s improvements to reporting and internal financial control arrangements;
• processes over cyber security, information management and privacy;
• tax planning, insurance arrangements and related risk management;
• treasury policies, including debt issuance and hedging; • commodity risk management, governance and derivatives
hedging; and• litigation and regulatory investigations.
The Committee reviewed the application of the requirements under Section 404 of the US Sarbanes-Oxley Act of 2002 with respect to internal controls over financial reporting. In addition, the Committee reviewed the annual financial plan and Unilever’s dividend policy and dividend proposals.
During 2013 the responsibility for overseeing the independent assurance work that is performed on a number of our Unilever Sustainable Living Plan (USLP) metrics (selected on the basis of their materiality to the USLP) was transitioned from the Corporate Responsibility Committee to the Audit Committee.
In fulfilling its oversight responsibilities in relation to risk management, internal control and the financial statements, the Committee met regularly with senior members of management and is fully satisfied with the key judgements taken.
INTERNAL AUDIT FUNCTIONThe Committee reviewed Corporate Audit’s audit plan for the year and agreed its budget and resource requirements. It reviewed interim and year-end summary reports and management’s response. The Committee carried out its own evaluation of the performance of the internal audit function together with engaging an independent third party to perform an external benchmarking study and was satisfied with the effectiveness of the function. The Committee met independently with the Chief Auditor during the year and discussed the results of the audits performed during the year.
AUDIT OF THE ANNUAL ACCOUNTSPricewaterhouseCoopers, Unilever’s external auditors and independent registered public accounting firm, reported in depth to the Committee on the scope and outcome of the annual audit, including their audit of internal controls over financial reporting as required by Section 404 of the US Sarbanes-Oxley Act of 2002. Their reports included accounting matters, governance and control, and accounting developments.
The Committee held independent meetings with the external auditors during the year and reviewed, agreed, discussed and challenged their audit plan, including their assessment of the financial reporting risk profile of the Group. The Committee discussed the views and conclusions of PricewaterhouseCoopers regarding management’s treatment of significant transactions and areas of judgement during the year and PricewaterhouseCoopers confirmed they were satisfied that these had been treated appropriately in the financial statements.
EXTERNAL AUDITORS The Committee is responsible for monitoring the performance, objectivity and independence of the external auditor, recommends the appointment of the external auditor to the Boards and approves their fees. Each year, the Committee assesses the effectiveness of the external audit process which includes gaining feedback from key stakeholders at all levels across Unilever.
PricewaterhouseCoopers has been Unilever’s sole auditor since 1987. During 2013 Unilever decided to change its auditors in order to remain at the forefront of good governance and in recognition of regulatory changes in Europe and elsewhere. A number of firms were approached to tender for the audit in July 2013 and the Audit Committee reviewed each of the audit firms’ proposals and recommended to the Boards that KPMG be proposed for appointment. As a result of the tender, PricewaterhouseCoopers’ appointment will expire at the completion of the 2014 AGMs, following which KPMG will become Unilever’s statutory auditor, subject to approval by shareholders at the 2014 AGMs (see pages 50 and 141).
54 Unilever Annual Report and Accounts 2013Governance
REPORT OF THE AUDIT COMMITTEE CONTINUED
Both Unilever and PricewaterhouseCoopers have for many years had safeguards in place to avoid the possibility that the auditors’ objectivity and independence could be compromised, such as audit partner rotation and the restriction on non-audit services that the external auditors can perform as described below. The Committee reviewed the report from PricewaterhouseCoopers on the actions they take to comply with the professional and regulatory requirements and best practice designed to ensure their independence from Unilever. Through the tender process we have also worked with KPMG to ensure that they would be independent from the beginning of the 2014 financial year.
The Committee also reviewed the statutory audit, audit related and non-audit related services provided by PricewaterhouseCoopers and compliance with Unilever’s documented approach, which prescribes in detail the types of engagements, listed below, for which the external auditors can be used:• statutory audit services, including audit of subsidiaries;• audit related engagements – services that involve attestation,
assurance or certification of factual information that may be required by external parties;
• non-audit related services – work that our auditors are best placed to undertake, which may include: – tax services – all significant tax work is put to tender; – acquisition and disposal services, including related due
diligence, audits and accountants’ reports; and – internal control reviews.
Several types of engagements are prohibited, including:• bookkeeping or similar services;• systems design and implementation related to financial
information or risk management;• valuation services;• actuarial services;• internal audit; and• staff secondments to a management function.
All audit related engagements over €250,000 and non-audit related engagements over €100,000 required specific advance approval by the Audit Committee Chairman. The Committee further approved all engagements below these levels which have been authorised by the Group Controller. These authorities are reviewed regularly and, where necessary, updated in the light of internal developments, external developments and best practice.
EVALUATION OF THE AUDIT COMMITTEEThe Boards evaluated the performance of the Committee and the Committee carried out a self-assessment of its performance, and each has concluded that the Committee is performing effectively.
Byron Grote Chairman of the Audit CommitteeMary MaHixonia NyasuluJohn Rishton
55Unilever Annual Report and Accounts 2013 Governance
TERMS OF REFERENCEThe Corporate Responsibility Committee oversees Unilever’s conduct as a responsible multinational business. The Committee is also charged with ensuring that Unilever’s reputation is protected and enhanced. A key element of the Committee’s role is the need to identify any external developments which are likely to have an influence upon Unilever’s standing in society and to bring these to the attention of the Boards.
The Committee comprises three Non-Executive Directors. In May 2013 Sir Malcolm Rifkind and Hixonia Nyasulu rotated off the Committee. Louise Fresco succeeded Sir Malcolm as Chair of the Committee and was joined by two further Non-Executive Directors: Charles Golden, who transferred to the Committee from his previous role on the Audit Committee; and Laura Cha, who was appointed as a Non-Executive Director of Unilever at the 2013 AGMs .The Chief Marketing & Communication Officer attends the Committee’s meetings.
The Committee’s discussions are informed by the perspectives of the Group’s two sustainability leadership groups, both of which are chaired by the Chief Marketing & Communication Officer. The first is the Unilever Sustainable Development Group (USDG) – a group of experts from outside the Group who advise Unilever’s senior leadership on its sustainability strategy. The second is the Unilever Sustainable Living Plan Steering Team – the group of Unilever’s senior executives who are accountable for driving sustainable growth. The insights from these groups help to keep the Boards informed of current and emerging trends and any potential risks arising from sustainability issues.
During 2013 the Boards reviewed the terms of reference of the Committee with the result that minor changes were incorporated into its terms of reference.
The Committee’s terms of reference and details of the UnileverSustainable Development Group are available on our website at www.unilever.com/investorrelations/corp_governance and www.unilever.com/sustainable-living/ourapproach/Governance respectively.
MEETINGSMeetings are held quarterly and ad hoc as required. The Committee Chairman reports the conclusions to the Boards. Four meetings were held in 2013. In addition, a further information session was arranged to brief the new and existing members of the Corporate Responsibility Committee and the Audit Committee on the Unilever Sustainable Living Plan (see below).
The Committee’s agenda comprises a number of standing items. These include the Code of Business Principles (the Code) and litigation as well as occupational safety and product safety and quality. The Committee reviews priority topics, such as the Unilever Sustainable Living Plan (USLP), the corporate risks which fall within its remit and a range of strategic and current issues. In July, the new Chair of the Committee formulated a new structure for Committee discussions, enabling members to focus in detail on these responsibilities.
CODE OF BUSINESS PRINCIPLESThe Committee is responsible for the oversight of the Code and associated Code Policies which set out the standards of conduct we expect of our employees.
The Committee ensures that the Code and Code Policies remain fit for purpose and are appropriately applied. The Audit Committee also considers the Code as part of its remit to review risk management.
ATTENDANCE
Louise Fresco 4 / 4Chairman of the Corporate Responsibility Committee
Sir Malcolm Rifkind 2 / 2Hixonia Nyasulu 2 / 2Laura Cha 2 / 2Charles Golden 2 / 2
This table shows the attendance of Directors at Committee meetings for the year ended 31 December 2013. If Directors are unable to attend a meeting, they have the opportunity beforehand to discuss any agenda items with the Committee Chairman. Attendance is expressed as the number of meetings attended out of the number eligible to be attended.
• Scrutiny of Unilever’s Code of Business Principles
• Review of the Unilever Sustainable Living Plan and its social impacts
• Compliance with Code of Business Principles, particularly by third parties
• The Unilever Sustainable Living Plan: progress on delivering the Plan and monitoring the social impacts of the Plan
• Product quality and food safety• Increased regulation
COMMITTEE MEMBERS AND ATTENDANCE
HIGHLIGHTS OF 2013
PRIORITIES FOR 2014
56 Unilever Annual Report and Accounts 2013Governance
REPORT OF THE CORPORATE RESPONSIBILITY COMMITTEE
The Committee maintains close scrutiny of the mechanisms for compliance with the Code and Code Policies as ongoing compliance is essential to promote and protect Unilever’s values and standards, and hence the good reputation of the Group.At each meeting the Committee reviews the completion of investigations into non-compliance with the Code and Code Policies and progress on training programmes as well as any trends which may emerge from reports of Code non-compliance. Following a benchmarking exercise on codes of conduct, the Committee was pleased to note that while Unilever compares well with others, it seeks continuous improvement and work is ongoing to enhance compliance with Code processes.
In July, suppliers’ and distributors’ compliance with Code policies was also studied by the Committee. The Committee noted that third parties’ compliance is essential for the protection of the reputation of Unilever and its brands and has set this as a priority for 2014.
LITIGATION REVIEWThe Chief Legal Officer reports to the Committee on litigation and regulatory matters which may have a reputational impact including environmental issues, bribery and corruption compliance and competition law compliance. For further information on ‘legal proceedings’ please see note 20 on page 131.
SAFETYThe Committee receives an analysis of occupational safety and product safety and quality at each meeting. Occupational safety continues to be a top priority for Unilever, particularly road safety where Unilever is sharing best practices and learning from a number of FTSE 100 companies. The Committee also discussed Unilever’s policies and processes for product safety, including incident management, and noted that Unilever adopts a systematic approach that focuses on prevention.
UNILEVER SUSTAINABLE LIVING PLANThe USLP is at the heart of Unilever’s vision to double the size of its business while reducing its environmental footprint and increasing its positive social impact. By making sustainability integral to how Unilever does business, the USLP provides the differentiator in Unilever’s business model. Given its strategic importance, the Committee monitors progress on the USLP and reviews any potential risks that could affect Unilever’s reputation.
During the year the Committee transitioned its responsibility for overseeing the independent assurance work that is performed on a number of our USLP metrics (selected on the basis of their materiality to the USLP) to the Audit Committee. This allows the Committee to place more focus on the USLP’s wider social, economic and environmental impacts. In September, the two Committees came together for a detailed briefing on the USLP’s targets and metrics as well as the priority issues Unilever was addressing in 2013.
One of the Committee’s priorities in 2014 is to ensure that delivery of the USLP is maintained through appropriate business strategies. In the three years since its launch at the end of 2010, much has been learned in driving the implementation of the USLP across the organisation and externally through its value chain from suppliers to consumers. Unilever is reviewing its strategy and approach to focus its attention on the areas that matter most to the business and where its contribution can achieve the greatest impact in society. This includes the extension of the Enhancing Livelihoods pillar of the USLP1, where Unilever has gained insights into the impacts of its extended value chain from working with NGO partners such as Oxfam. The Committee reviewed the findings from Oxfam’s study of Unilever in Vietnam2 and welcomed the policies and processes being developed by Unilever.
FURTHER ITEMSA number of other priority topics were considered during the year. These included topics such as obesity, progress on alternatives to animal testing, consumer confidence in the use of chemicals and responsible minerals procurement, as well as the processes in place for managing issues such as these.
EVALUATION OF THE CORPORATE RESPONSIBILITY COMMITTEEThe Boards evaluated the performance of the Committee and the Committee carried out a self-assessment of its performance, and each has concluded that the Committee is performing effectively.
Louise FrescoChairman of the Corporate Responsibility CommitteeCharles GoldenLaura Cha
1 Further details can be found in Unilever’s online Sustainable Living Report 2013, published in April 2014.
2 See Labour Rights in Unilever’s Supply Chain: from Compliance towards Good Practice at http://www.unilever.com/sustainable-living/news/news/February-2013-Unilever-puts-spotlight-on-human-and-labour-rights.aspx
57Unilever Annual Report and Accounts 2013 Governance

ATTENDANCE
Kees Storm 4 / 4Chairman of the Nominating and CorporateGovernance Committee
Ann Fudge 2 / 2Sir Malcolm Rifkind 2 / 2Michael Treschow 4 / 4Paul Walsh 2 / 2
The composition of the Committee changed after the 2013 AGMs. This table shows the attendance of Directors at Committee meetings for the year ended 31 December 2013. If Directors are unable to attend a meeting, they have the opportunity beforehand to discuss any agenda items with the Committee Chairman. Attendance is expressed as the number of meetings attended out of the number eligible to be attended.
• Board, Committee and Director performance evaluation process
• Rotation of Directors on Board Committees• Review of relevant legislative and corporate
governance changes• Review of Board Diversity Policy
• Continued focus on Director succession• External Board Evaluation• Active participation in relevant regulatory
consultations• Tracking gender metrics
COMMITTEE MEMBERS AND ATTENDANCE
HIGHLIGHTS OF 2013
PRIORITIES FOR 2014
MEMBERSHIP OF THE COMMITTEEThe Nominating and Corporate Governance Committeecomprises two Non-Executive Directors and the Chairman.It is chaired by Kees Storm. The composition of the Committee changed after the AGMs in May 2013 when both Paul Walsh and Ann Fudge left the Committee. At that time, Kees Storm took over the Chairmanship of the Committee from Paul Walsh. The other members are Sir Malcolm Rifkind and Michael Treschow. The Group Secretary acts as secretary to the Committee. The Committee met four times in 2013. All Committee members attended the meetings they were eligible to attend. Other attendees at Committee meetings (or part thereof) were the Chief Executive Officer, the Chief HR Officer and the Group Secretary.
ROLE OF THE COMMITTEEThe Committee is responsible for evaluating the balance of skills, experience, independence and knowledge on the Board and drawing up selection criteria, ongoing succession planning and appointment procedures. Executive and Non-Executive Directors offer themselves for election each year at the Annual General Meetings. The Committee is responsible for recommending candidates for nomination as Executive Directors (including the Chief Executive Officer) and Non-Executive Directors each year, based on the process of evaluations referred to below. After Directors have been appointed by shareholders, the Committee recommends to the Boards candidates for election as Chairman and Vice-Chairman/Senior Independent Director. During the year, the Committee also consulted with the Chief Executive Officer on the selection criteria and appointment procedures for senior management. It also keeps oversight of all matters relating to corporate governance, bringing any issues to the attention of the Boards. The Committee’s terms of reference are contained in ‘The Governance of Unilever’ and are also available on our website at www.unilever.com/investorrelations/corp_governance.
PROCESS FOR THE APPOINTMENT OF DIRECTORSUnilever has formal procedures for the evaluation of the Boards,the Board Committees and the individual Directors. The Chairman, in conjunction with the Vice-Chairman/Senior Independent Director, leads the process whereby the Boards assess their own performance. Each of the Directors also has an interview with the Chairman to discuss individual performance. The outcomes of the Board and individual evaluations are provided to the Committee when it discusses the nominations for re-election of Directors.
Where a vacancy arises on the Boards, the Committee may seek the services of specialist recruitment firms and other external experts to assist in finding individuals with the appropriate skills and expertise. The Committee reviews candidates presented by the recruitment firm, or recommended by Directors and members of the Unilever Leadership Executive, and all members of the Committee are involved in the interview process before making their recommendations to the full Boards for approval.
In nominating Directors, the Committee follows the agreed profile of Unilever’s Boards of Directors, which takes into account the roles of Non-Executive Directors set out in the Dutch and UK Corporate Governance Codes. The agreed Board profile, contained in ‘The Governance of Unilever’, which can be found on our website at www.unilever.com/investorrelations/corp_governance, includes that the Boards should comprise a majority of Non-Executive Directors who should be independent of Unilever and free from any conflicts of interest. With respect to composition and qualities of the Boards, they should be in keeping with the size of Unilever, its portfolio, culture and geographical spread and its status as a listed company. The objective pursued by the Boards is to have a variety of age, gender, expertise, social background and nationality and, wherever possible, the Boards should reflect Unilever’s consumer
58 Unilever Annual Report and Accounts 2013Governance
REPORT OF THE NOMINATING AND CORPORATE GOVERNANCE COMMITTEE
base and take into account the footprint and strategy of the Group. The desired experience and expertise set out in the Board profile can be found opposite. The Boards recognise the benefits of diversity throughout the Group, including gender balance. The Committee reviewed and considered relevant recommendations on diversity and is pleased that over 40% of our Non-Executive Directors are women. However, Unilever feels that gender is only one part of diversity, and Unilever Directors will continue to be selected on the basis of their wide-ranging experience, backgrounds, skills, knowledge and insight.
It is recognised that Executive Directors may be invited to become a Non-Executive Director of another company and that such an appointment, subject to the approval of the Chairman and where relevant the Chief Executive Officer, may broaden the knowledge and experience to the benefit of the Group (see page 40 for details in the Directors’ biographies).
ACTIVITIES OF THE COMMITTEE DURING THE YEARThe Committee proposed the nomination of all Directors offering themselves for re-election at the 2013 AGMs in May 2013 and, as three of the Non-Executive Directors were due to complete nine years of service in 2015, proposed the nominations of Laura Cha, Mary Ma and John Rishton as new Non-Executive Directors at the 2013 AGMs. The Committee then continued during the year to consider succession planning for the Boards.
The Committee undertook a review of Committee memberships and recommended to the Boards changes to the membership of all Committees. The Boards approved these recommendations and the new Committees were effective from the 2013 AGMs.
Revised standard terms of appointment for Non-Executive Directors containing provisions to promote the success of the company in accordance with the latest requirements of UK and Dutch company law and best practice guidelines and updated language on tenure of appointment, termination and fees were signed by all Non-Executive Directors in May 2013.
For our internal Board evaluation this year, Unilever again used Thinking Board, the web-based governance self-assessment service from Independent Audit. This provided an added external perspective when considering our approach and Independent Audit challenged us on the questions used and helped us to analyse the results. Further information on this evaluation can be found on page 44. The results of this year’s evaluation were discussed at the November 2013 Board meetings. In 2014, an externally facilitated evaluation will be carried out.
During the year, the Committee undertook a review of the Committee’s terms of reference to ensure they remained in line with relevant guidelines. The amended terms became effective on 1 January 2014.
The Boards evaluated the performance of the Committee and the Committee carried out a self-assessment of its performance, and each has concluded that the Committee is performing effectively.
Kees StormChairman of the Nominating and CorporateGovernance CommitteeSir Malcolm RifkindMichael Treschow
PROFILE OF UNILEVER’S BOARDS OF DIRECTORS
DESIRED EXPERTISE AND EXPERIENCEIn view of Unilever’s objectives and activities, it is important that the Boards have sufficient financial literacy, have at least one financial expert and are composed in such a way that the following expertise and experience are present in one ormore of its members:• Executive management experience and knowledge of
corporate governance issues at main board level with a company comparable in size and international spread of activities with multiple stock exchange listings;
• Understanding of human resources and remuneration in large international companies;
• Experience in financial administration, accounting policies and internal control;
• Risk management of multinationals with share listings;• Understanding of the markets where Unilever is active;• Experience in and understanding of the fast-moving
consumer goods (FMCG) market;• Knowledge of marketing and commercial expertise;• Awareness of corporate social responsibility issues; and• Experience with R&D in those fields where Unilever is
active.
PROFILEThis profile guides the Nominating and CorporateGovernance Committee and the Boards on the occasionof the nomination of Directors. It is reviewed and updated by the Boards periodically.
59Unilever Annual Report and Accounts 2013 Governance
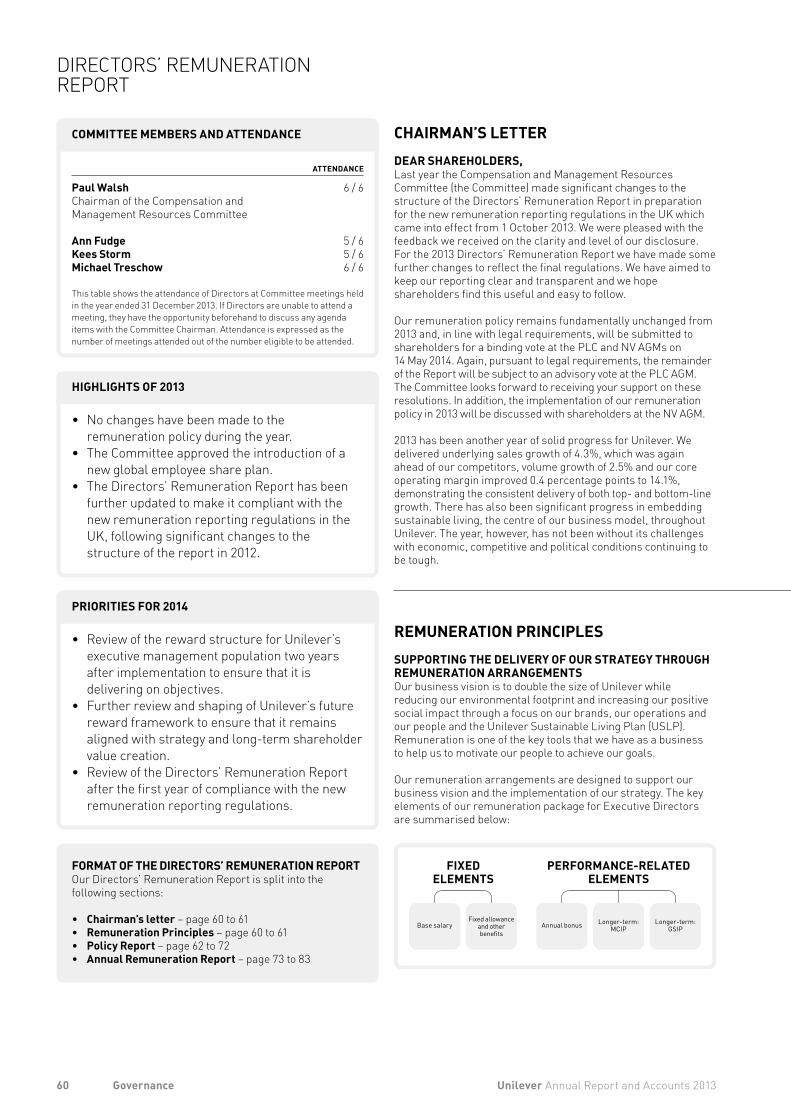
FIXED ELEMENTS
PERFORMANCE-RELATED ELEMENTS
Base salaryFixed allowance
and other benefits
Annual bonus Longer-term:GSIP
Longer-term:MCIP
ATTENDANCE
Paul Walsh 6 / 6Chairman of the Compensation and Management Resources Committee
Ann Fudge 5 / 6Kees Storm 5 / 6Michael Treschow 6 / 6
This table shows the attendance of Directors at Committee meetings held in the year ended 31 December 2013. If Directors are unable to attend a meeting, they have the opportunity beforehand to discuss any agenda items with the Committee Chairman. Attendance is expressed as the number of meetings attended out of the number eligible to be attended.
COMMITTEE MEMBERS AND ATTENDANCE
• No changes have been made to the remuneration policy during the year.
• The Committee approved the introduction of a new global employee share plan.
• The Directors’ Remuneration Report has been further updated to make it compliant with the new remuneration reporting regulations in the UK, following significant changes to the structure of the report in 2012.
• Review of the reward structure for Unilever’s executive management population two years after implementation to ensure that it is delivering on objectives.
• Further review and shaping of Unilever’s future reward framework to ensure that it remains aligned with strategy and long-term shareholder value creation.
• Review of the Directors’ Remuneration Report after the first year of compliance with the new remuneration reporting regulations.
HIGHLIGHTS OF 2013
PRIORITIES FOR 2014
CHAIRMAN’S LETTER DEAR SHAREHOLDERS,Last year the Compensation and Management Resources Committee (the Committee) made significant changes to the structure of the Directors’ Remuneration Report in preparation for the new remuneration reporting regulations in the UK which came into effect from 1 October 2013. We were pleased with the feedback we received on the clarity and level of our disclosure. For the 2013 Directors’ Remuneration Report we have made some further changes to reflect the final regulations. We have aimed to keep our reporting clear and transparent and we hope shareholders find this useful and easy to follow.
Our remuneration policy remains fundamentally unchanged from 2013 and, in line with legal requirements, will be submitted to shareholders for a binding vote at the PLC and NV AGMs on 14 May 2014. Again, pursuant to legal requirements, the remainder of the Report will be subject to an advisory vote at the PLC AGM. The Committee looks forward to receiving your support on these resolutions. In addition, the implementation of our remuneration policy in 2013 will be discussed with shareholders at the NV AGM.
2013 has been another year of solid progress for Unilever. We delivered underlying sales growth of 4.3%, which was again ahead of our competitors, volume growth of 2.5% and our core operating margin improved 0.4 percentage points to 14.1%, demonstrating the consistent delivery of both top- and bottom-line growth. There has also been significant progress in embedding sustainable living, the centre of our business model, throughout Unilever. The year, however, has not been without its challenges with economic, competitive and political conditions continuing to be tough.
REMUNERATION PRINCIPLES SUPPORTING THE DELIVERY OF OUR STRATEGY THROUGH REMUNERATION ARRANGEMENTSOur business vision is to double the size of Unilever while reducing our environmental footprint and increasing our positive social impact through a focus on our brands, our operations and our people and the Unilever Sustainable Living Plan (USLP). Remuneration is one of the key tools that we have as a business to help us to motivate our people to achieve our goals.
Our remuneration arrangements are designed to support our business vision and the implementation of our strategy. The key elements of our remuneration package for Executive Directors are summarised below:
FORMAT OF THE DIRECTORS’ REMUNERATION REPORT Our Directors’ Remuneration Report is split into the following sections:
• Chairman’s letter – page 60 to 61• Remuneration Principles – page 60 to 61• Policy Report – page 62 to 72• Annual Remuneration Report – page 73 to 83
60 Unilever Annual Report and Accounts 2013Governance
DIRECTORS’ REMUNERATION REPORT
The package has been designed based on the following key principles:
PAYING FOR PERFORMANCEThe focus of our package is on variable pay based on annual and long-term performance. Performance-related elements are structured so that target levels of reward are competitive, but Executive Directors can only earn higher rewards if they exceed the ongoing standards of performance that Unilever requires.
ALIGNING PERFORMANCE MEASURES WITH STRATEGYThe performance measures for our annual and long-term plans have been selected to support our business strategy and the ongoing enhancement of shareholder value through a focus on increasing sales value and volume, improving margin, and cash generation and generating returns for shareholders.
DELIVERING SUSTAINABLE PERFORMANCEAcknowledging that success is not only measured by delivering financial returns, we also consider the quality of performance in terms of business results and leadership, including corporate social responsibility and progress against the USLP, when determining rewards.
To ensure that remuneration arrangements fully support our sustainability agenda, the personal performance goals for the CEO under the annual bonus include USLP targets.
ALIGNMENT WITH SHAREHOLDER INTERESTSThe majority of the package for our Executive Directors is delivered in Unilever shares to ensure that the interests of executives are aligned with shareholders’. This is further supported by significant shareholding requirements ensuring that a substantial portion of each Executive Director’s personal wealth is linked to Unilever’s share price performance.
Non-Executive Directors are also encouraged to build up their personal holding of Unilever shares to ensure alignment with shareholders’ interests.
PAYING COMPETITIVELYThe overall remuneration package offered to Executive Directors is sufficiently competitive to attract and retain highly experienced and talented individuals, without paying more than is necessary.
PREVENTING INAPPROPRIATE RISK-TAKINGThe Committee believes that Unilever’s risk management process provides the necessary control to prevent inappropriate risk-taking. When the Committee reviews the structure and levels of performance-related pay for Executive Directors and other members of the ULE, it considers whether these might encourage behaviours that are incompatible with the long-term interests of Unilever and its shareholders or that may raise any environmental, social or governance risks. Where necessary, the Committee would take appropriate steps to address this.
In this context, the Committee decided to pay a bonus of 157% of salary to the CEO Paul Polman and a bonus of 105% of salary to the CFO Jean-Marc Huët. The Committee feels that this outcome fairly reflects the performance delivered in the context of challenging markets.
Over the longer term Unilever has consistently performed strongly against a range of measures enabling us to deliver over 40% in total shareholder return (TSR) over the past three years. In the same period, underlying sales growth has been 5.9% per annum which the Boards consider to be exceptional performance in the context of the recent economic climate. We have also consistently improved margin performance converting our top-line growth into profitable returns for our shareholders. Cash flow performance has also been strong funding future investment in growth. On the basis of this performance, the Committee determined that GSIP awards granted to Executive Directors in 2011 will vest at 128% of initial award levels (out of a maximum of 200% – i.e. 64% of maximum awards).
The Committee believes it is important that Executive Directors act and think as shareholders. The CEO currently holds around 14 times salary in Unilever shares with the CFO holding around six times salary. In addition, at Unilever we believe it is important that all employees, not just senior management, are shareholders in our business. During the year, therefore, the Committee approved the introduction of a new global employee share plan for those employees who do not currently participate in equity incentive arrangements. We will start the process of implementing this scheme across all the countries where we employ people from 2014.
Other key activities of the Committee during the year were:• annual review of the remuneration framework;• annual review of Unilever’s remuneration practice to ensure
that the overall remuneration structure continues to promote Unilever’s business strategy;
• determination of the remuneration packages for the Executive Directors, other members of the Unilever Leadership Executive (ULE) and the fee structure of the Non-Executive Directors, including the setting of the performance targets for the bonus, GSIP and MCIP awards;
• determination of the extent to which the performance measures for the bonus, GSIP and MCIP awards were achieved;
• determination of selection criteria for the hiring of advisers by the Committee and the assessment of performance of the Committee’s independent adviser, Deloitte LLP; and
• refinement of the Executive Directors’ minimum shareholding requirements.
The Committee remains committed to linking remuneration to the achievement of Unilever’s strategic objective.
Paul Walsh Chairman of the Compensation and Management Resources Committee
61Unilever Annual Report and Accounts 2013 Governance
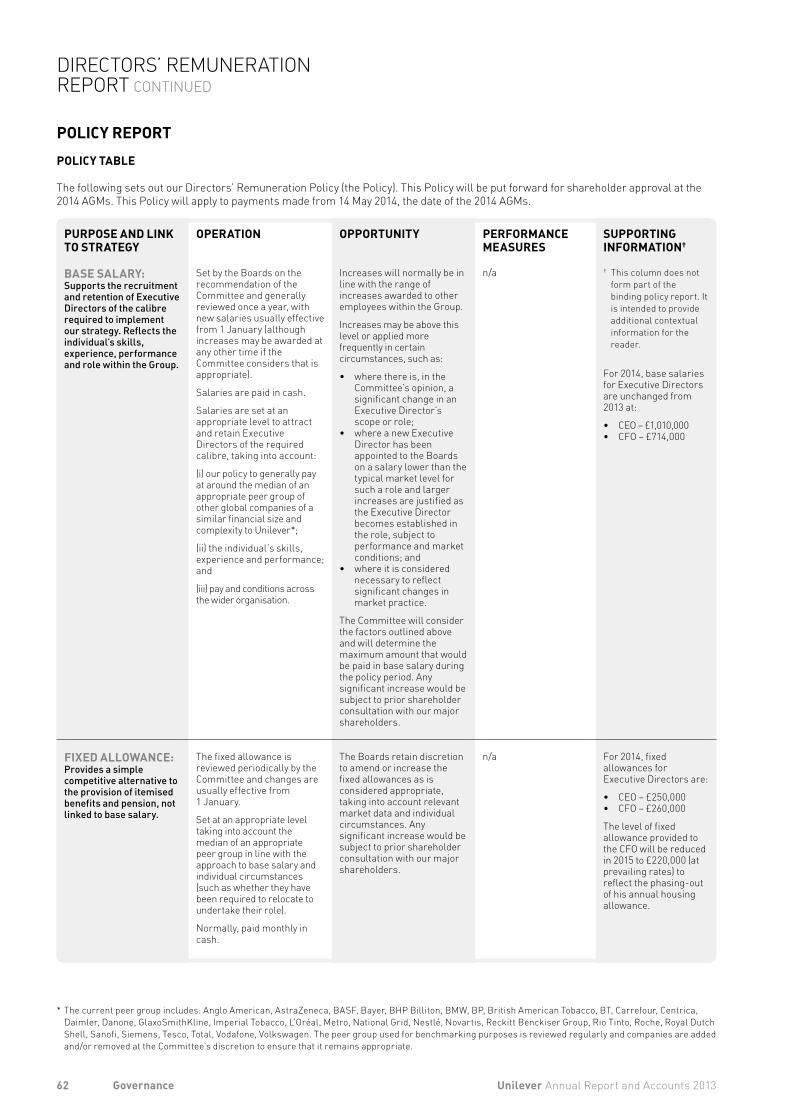
POLICY REPORTPOLICY TABLE
The following sets out our Directors’ Remuneration Policy (the Policy). This Policy will be put forward for shareholder approval at the 2014 AGMs. This Policy will apply to payments made from 14 May 2014, the date of the 2014 AGMs.
PURPOSE AND LINK TO STRATEGY
OPERATION OPPORTUNITY PERFORMANCE MEASURES
SUPPORTING INFORMATION†
BASE SALARY: Supports the recruitment and retention of Executive Directors of the calibre required to implement our strategy. Reflects the individual’s skills, experience, performance and role within the Group.
Set by the Boards on the recommendation of the Committee and generally reviewed once a year, with new salaries usually effective from 1 January (although increases may be awarded at any other time if the Committee considers that is appropriate).
Salaries are paid in cash.
Salaries are set at an appropriate level to attract and retain Executive Directors of the required calibre, taking into account:
(i) our policy to generally pay at around the median of an appropriate peer group of other global companies of a similar financial size and complexity to Unilever*;
(ii) the individual’s skills, experience and performance; and
(iii) pay and conditions across the wider organisation.
Increases will normally be in line with the range of increases awarded to other employees within the Group.
Increases may be above this level or applied more frequently in certain circumstances, such as:
• where there is, in the Committee’s opinion, a significant change in an Executive Director’s scope or role;
• where a new Executive Director has been appointed to the Boards on a salary lower than the typical market level for such a role and larger increases are justified as the Executive Director becomes established in the role, subject to performance and market conditions; and
• where it is considered necessary to reflect significant changes in market practice.
The Committee will consider the factors outlined above and will determine the maximum amount that would be paid in base salary during the policy period. Any significant increase would be subject to prior shareholder consultation with our major shareholders.
n/a † This column does not form part of the binding policy report. It is intended to provide additional contextual information for the reader.
For 2014, base salaries for Executive Directors are unchanged from 2013 at:
• CEO – £1,010,000• CFO – £714,000
FIXED ALLOWANCE:Provides a simple competitive alternative to the provision of itemised benefits and pension, not linked to base salary.
The fixed allowance is reviewed periodically by the Committee and changes are usually effective from 1 January.
Set at an appropriate level taking into account the median of an appropriate peer group in line with the approach to base salary and individual circumstances (such as whether they have been required to relocate to undertake their role).
Normally, paid monthly in cash.
The Boards retain discretion to amend or increase the fixed allowances as is considered appropriate, taking into account relevant market data and individual circumstances. Any significant increase would be subject to prior shareholder consultation with our major shareholders.
n/a For 2014, fixed allowances for Executive Directors are:
• CEO – £250,000• CFO – £260,000
The level of fixed allowance provided to the CFO will be reduced in 2015 to £220,000 (at prevailing rates) to reflect the phasing-out of his annual housing allowance.
* The current peer group includes: Anglo American, AstraZeneca, BASF, Bayer, BHP Billiton, BMW, BP, British American Tobacco, BT, Carrefour, Centrica, Daimler, Danone, GlaxoSmithKline, Imperial Tobacco, L’Oréal, Metro, National Grid, Nestlé, Novartis, Reckitt Benckiser Group, Rio Tinto, Roche, Royal Dutch Shell, Sanofi, Siemens, Tesco, Total, Vodafone, Volkswagen. The peer group used for benchmarking purposes is reviewed regularly and companies are added and/or removed at the Committee’s discretion to ensure that it remains appropriate.
62 Unilever Annual Report and Accounts 2013Governance
DIRECTORS’ REMUNERATION REPORT CONTINUED
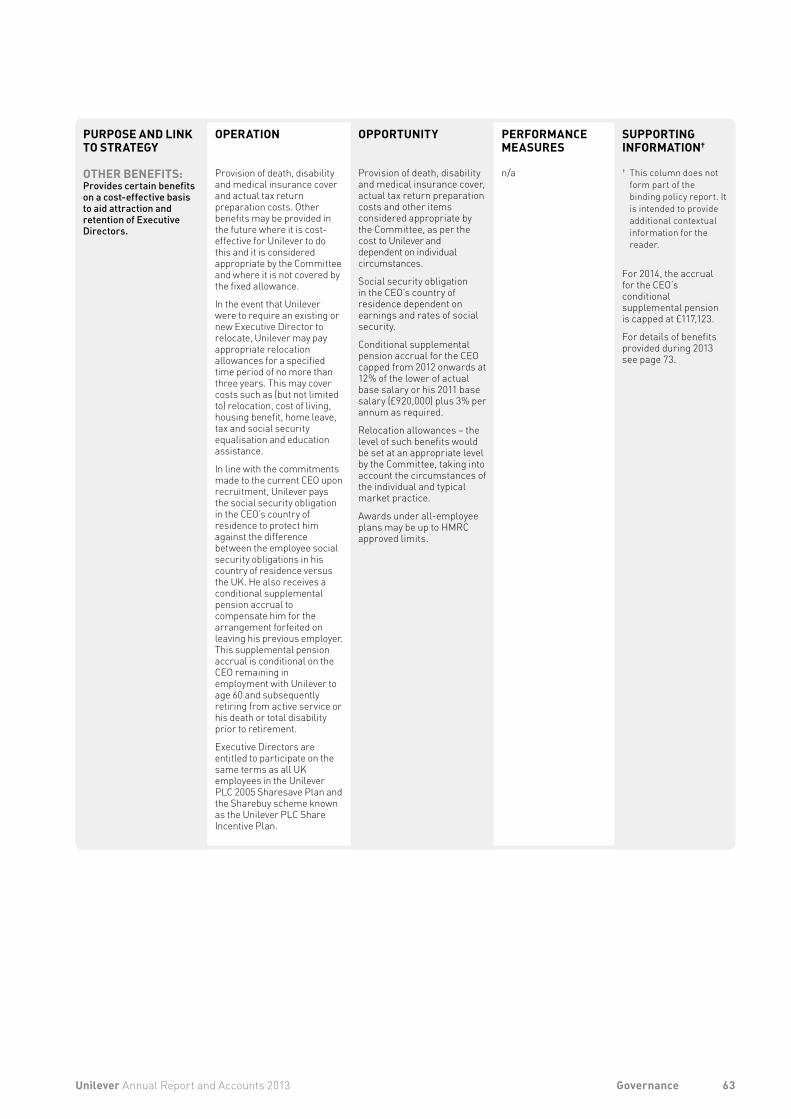
PURPOSE AND LINK TO STRATEGY
OPERATION OPPORTUNITY PERFORMANCE MEASURES
SUPPORTING INFORMATION†
OTHER BENEFITS: Provides certain benefits on a cost-effective basis to aid attraction and retention of Executive Directors.
Provision of death, disability and medical insurance cover and actual tax return preparation costs. Other benefits may be provided in the future where it is cost- effective for Unilever to do this and it is considered appropriate by the Committee and where it is not covered by the fixed allowance.
In the event that Unilever were to require an existing or new Executive Director to relocate, Unilever may pay appropriate relocation allowances for a specified time period of no more than three years. This may cover costs such as (but not limited to) relocation, cost of living, housing benefit, home leave, tax and social security equalisation and education assistance.
In line with the commitments made to the current CEO upon recruitment, Unilever pays the social security obligation in the CEO’s country of residence to protect him against the difference between the employee social security obligations in his country of residence versus the UK. He also receives a conditional supplemental pension accrual to compensate him for the arrangement forfeited on leaving his previous employer. This supplemental pension accrual is conditional on the CEO remaining in employment with Unilever to age 60 and subsequently retiring from active service or his death or total disability prior to retirement.
Executive Directors are entitled to participate on the same terms as all UK employees in the Unilever PLC 2005 Sharesave Plan and the Sharebuy scheme known as the Unilever PLC Share Incentive Plan.
Provision of death, disability and medical insurance cover, actual tax return preparation costs and other items considered appropriate by the Committee, as per the cost to Unilever and dependent on individual circumstances.
Social security obligation in the CEO’s country of residence dependent on earnings and rates of social security.
Conditional supplemental pension accrual for the CEO capped from 2012 onwards at 12% of the lower of actual base salary or his 2011 base salary (£920,000) plus 3% per annum as required.
Relocation allowances – the level of such benefits would be set at an appropriate level by the Committee, taking into account the circumstances of the individual and typical market practice.
Awards under all-employee plans may be up to HMRC approved limits.
n/a † This column does not form part of the binding policy report. It is intended to provide additional contextual information for the reader.
For 2014, the accrual for the CEO’s conditional supplemental pension is capped at £117,123.
For details of benefits provided during 2013 see page 73.
63Unilever Annual Report and Accounts 2013 Governance
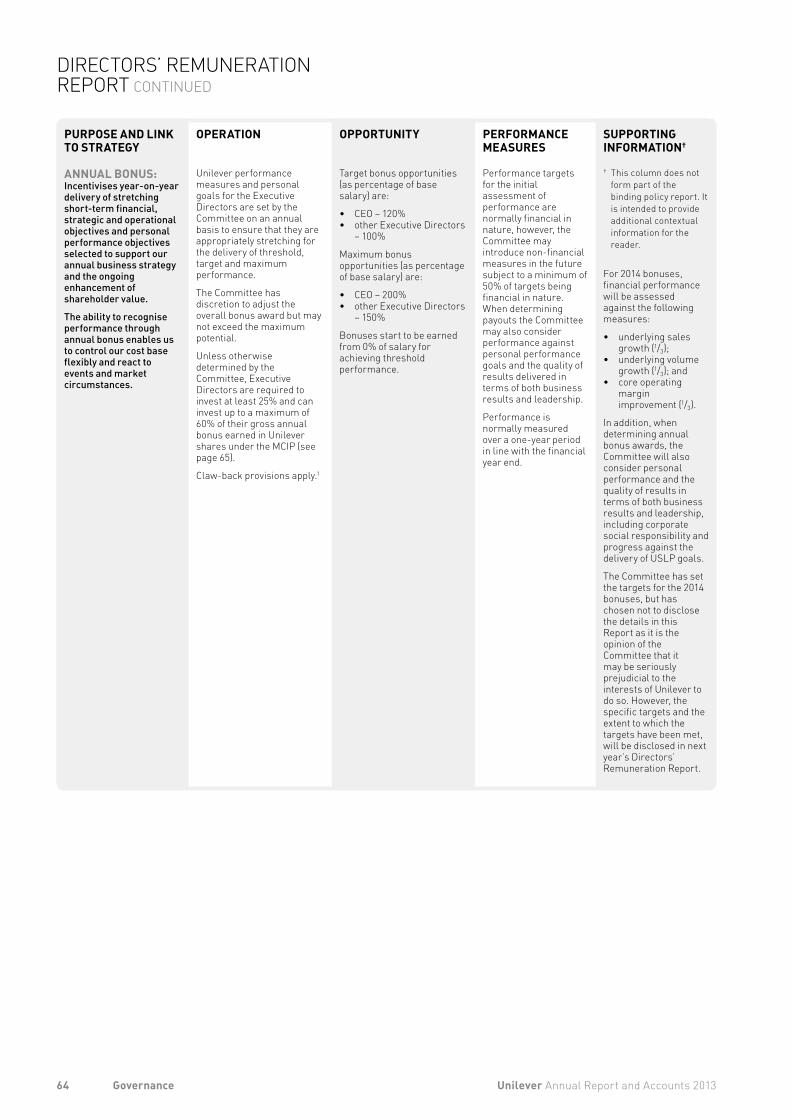
PURPOSE AND LINK TO STRATEGY
OPERATION OPPORTUNITY PERFORMANCE MEASURES
SUPPORTING INFORMATION†
ANNUAL BONUS: Incentivises year-on-year delivery of stretching short-term financial, strategic and operational objectives and personal performance objectives selected to support our annual business strategy and the ongoing enhancement of shareholder value.
The ability to recognise performance through annual bonus enables us to control our cost base flexibly and react to events and market circumstances.
Unilever performance measures and personal goals for the Executive Directors are set by the Committee on an annual basis to ensure that they are appropriately stretching for the delivery of threshold, target and maximum performance.
The Committee has discretion to adjust the overall bonus award but may not exceed the maximum potential.
Unless otherwise determined by the Committee, Executive Directors are required to invest at least 25% and can invest up to a maximum of 60% of their gross annual bonus earned in Unilever shares under the MCIP (see page 65).
Claw-back provisions apply.1
Target bonus opportunities (as percentage of base salary) are:
• CEO – 120%• other Executive Directors
– 100%
Maximum bonus opportunities (as percentage of base salary) are:
• CEO – 200%• other Executive Directors
– 150%
Bonuses start to be earned from 0% of salary for achieving threshold performance.
Performance targets for the initial assessment of performance are normally financial in nature, however, the Committee may introduce non-financial measures in the future subject to a minimum of 50% of targets being financial in nature. When determining payouts the Committee may also consider performance against personal performance goals and the quality of results delivered in terms of both business results and leadership.
Performance is normally measured over a one-year period in line with the financial year end.
† This column does not form part of the binding policy report. It is intended to provide additional contextual information for the reader.
For 2014 bonuses, financial performance will be assessed against the following measures:
• underlying sales growth (1/3);
• underlying volume growth (1/3); and
• core operating margin improvement (1/3).
In addition, when determining annual bonus awards, the Committee will also consider personal performance and the quality of results in terms of both business results and leadership, including corporate social responsibility and progress against the delivery of USLP goals.
The Committee has set the targets for the 2014 bonuses, but has chosen not to disclose the details in this Report as it is the opinion of the Committee that it may be seriously prejudicial to the interests of Unilever to do so. However, the specific targets and the extent to which the targets have been met, will be disclosed in next year’s Directors’ Remuneration Report.
64 Unilever Annual Report and Accounts 2013Governance
DIRECTORS’ REMUNERATION REPORT CONTINUED
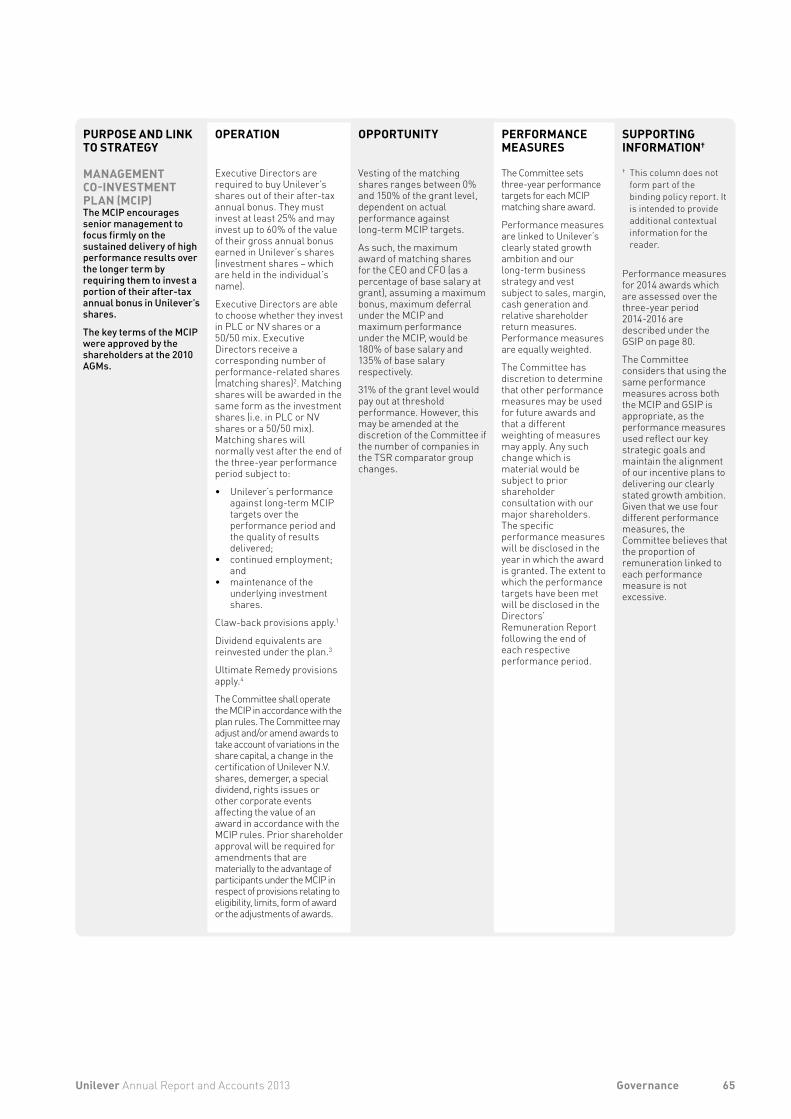
PURPOSE AND LINK TO STRATEGY
OPERATION OPPORTUNITY PERFORMANCE MEASURES
SUPPORTING INFORMATION†
MANAGEMENT CO-INVESTMENT PLAN (MCIP)The MCIP encourages senior management to focus firmly on the sustained delivery of high performance results over the longer term by requiring them to invest a portion of their after-tax annual bonus in Unilever’s shares.
The key terms of the MCIP were approved by the shareholders at the 2010 AGMs.
Executive Directors are required to buy Unilever’s shares out of their after-tax annual bonus. They must invest at least 25% and may invest up to 60% of the value of their gross annual bonus earned in Unilever’s shares (investment shares – which are held in the individual’s name).
Executive Directors are able to choose whether they invest in PLC or NV shares or a 50/50 mix. Executive Directors receive a corresponding number of performance-related shares (matching shares)2. Matching shares will be awarded in the same form as the investment shares (i.e. in PLC or NV shares or a 50/50 mix). Matching shares will normally vest after the end of the three-year performance period subject to:
• Unilever’s performance against long-term MCIP targets over the performance period and the quality of results delivered;
• continued employment; and
• maintenance of the underlying investment shares.
Claw-back provisions apply.1
Dividend equivalents are reinvested under the plan.3
Ultimate Remedy provisions apply.4
The Committee shall operate the MCIP in accordance with the plan rules. The Committee may adjust and/or amend awards to take account of variations in the share capital, a change in the certification of Unilever N.V. shares, demerger, a special dividend, rights issues or other corporate events affecting the value of an award in accordance with the MCIP rules. Prior shareholder approval will be required for amendments that are materially to the advantage of participants under the MCIP in respect of provisions relating to eligibility, limits, form of award or the adjustments of awards.
Vesting of the matching shares ranges between 0% and 150% of the grant level, dependent on actual performance against long-term MCIP targets.
As such, the maximum award of matching shares for the CEO and CFO (as a percentage of base salary at grant), assuming a maximum bonus, maximum deferral under the MCIP and maximum performance under the MCIP, would be 180% of base salary and 135% of base salary respectively.
31% of the grant level would pay out at threshold performance. However, this may be amended at the discretion of the Committee if the number of companies in the TSR comparator group changes.
The Committee sets three-year performance targets for each MCIP matching share award.
Performance measures are linked to Unilever’s clearly stated growth ambition and our long-term business strategy and vest subject to sales, margin, cash generation and relative shareholder return measures. Performance measures are equally weighted.
The Committee has discretion to determine that other performance measures may be used for future awards and that a different weighting of measures may apply. Any such change which is material would be subject to prior shareholder consultation with our major shareholders. The specific performance measures will be disclosed in the year in which the award is granted. The extent to which the performance targets have been met will be disclosed in the Directors’ Remuneration Report following the end of each respective performance period.
† This column does not form part of the binding policy report. It is intended to provide additional contextual information for the reader.
Performance measures for 2014 awards which are assessed over the three-year period 2014-2016 are described under the GSIP on page 80.
The Committee considers that using the same performance measures across both the MCIP and GSIP is appropriate, as the performance measures used reflect our key strategic goals and maintain the alignment of our incentive plans to delivering our clearly stated growth ambition. Given that we use four different performance measures, the Committee believes that the proportion of remuneration linked to each performance measure is not excessive.
65Unilever Annual Report and Accounts 2013 Governance
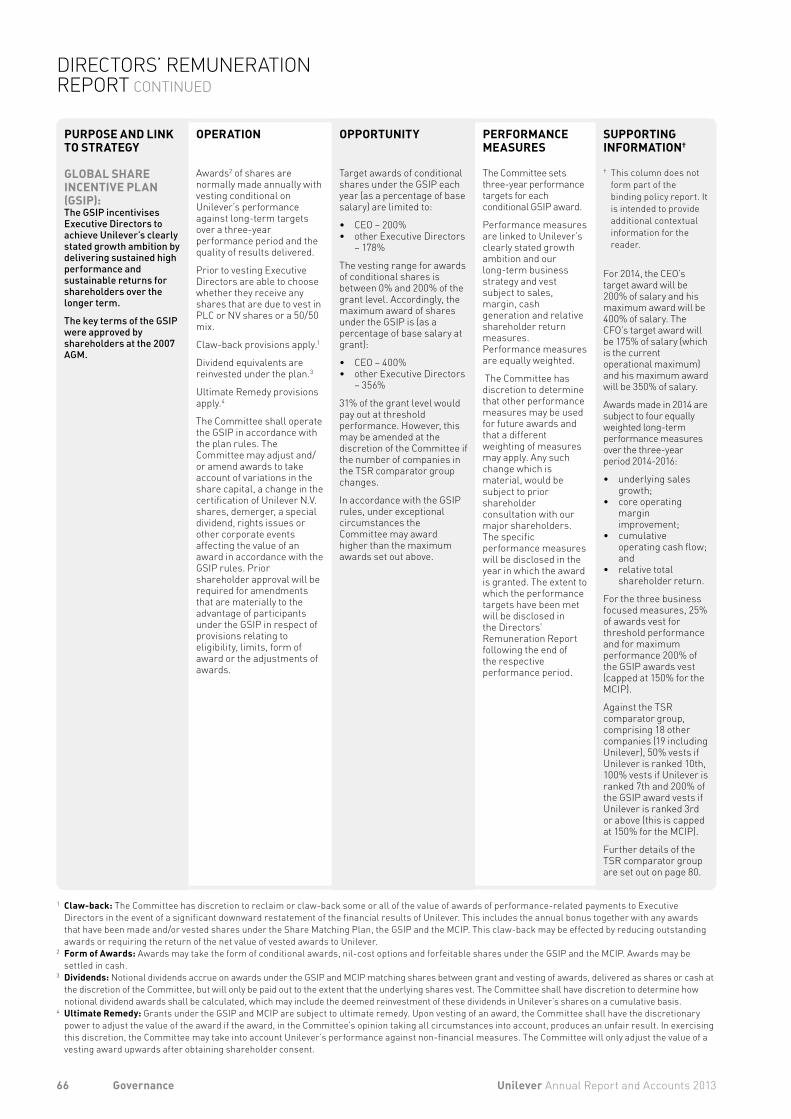
PURPOSE AND LINK TO STRATEGY
OPERATION OPPORTUNITY PERFORMANCE MEASURES
SUPPORTING INFORMATION†
GLOBAL SHARE INCENTIVE PLAN (GSIP):The GSIP incentivises Executive Directors to achieve Unilever’s clearly stated growth ambition by delivering sustained high performance and sustainable returns for shareholders over the longer term.
The key terms of the GSIP were approved by shareholders at the 2007 AGM.
Awards2 of shares are normally made annually with vesting conditional on Unilever’s performance against long-term targets over a three-year performance period and the quality of results delivered.
Prior to vesting Executive Directors are able to choose whether they receive any shares that are due to vest in PLC or NV shares or a 50/50 mix.
Claw-back provisions apply.1
Dividend equivalents are reinvested under the plan.3
Ultimate Remedy provisions apply.4
The Committee shall operate the GSIP in accordance with the plan rules. The Committee may adjust and/or amend awards to take account of variations in the share capital, a change in the certification of Unilever N.V. shares, demerger, a special dividend, rights issues or other corporate events affecting the value of an award in accordance with the GSIP rules. Prior shareholder approval will be required for amendments that are materially to the advantage of participants under the GSIP in respect of provisions relating to eligibility, limits, form of award or the adjustments of awards.
Target awards of conditional shares under the GSIP each year (as a percentage of base salary) are limited to:
• CEO – 200%• other Executive Directors
– 178%
The vesting range for awards of conditional shares is between 0% and 200% of the grant level. Accordingly, the maximum award of shares under the GSIP is (as a percentage of base salary at grant):
• CEO – 400%• other Executive Directors
– 356%
31% of the grant level would pay out at threshold performance. However, this may be amended at the discretion of the Committee if the number of companies in the TSR comparator group changes.
In accordance with the GSIP rules, under exceptional circumstances the Committee may award higher than the maximum awards set out above.
The Committee sets three-year performance targets for each conditional GSIP award.
Performance measures are linked to Unilever’s clearly stated growth ambition and our long-term business strategy and vest subject to sales, margin, cash generation and relative shareholder return measures. Performance measures are equally weighted.
The Committee has discretion to determine that other performance measures may be used for future awards and that a different weighting of measures may apply. Any such change which is material, would be subject to prior shareholder consultation with our major shareholders. The specific performance measures will be disclosed in the year in which the award is granted. The extent to which the performance targets have been met will be disclosed in the Directors’ Remuneration Report following the end of the respective performance period.
† This column does not form part of the binding policy report. It is intended to provide additional contextual information for the reader.
For 2014, the CEO’s target award will be 200% of salary and his maximum award will be 400% of salary. The CFO’s target award will be 175% of salary (which is the current operational maximum) and his maximum award will be 350% of salary.
Awards made in 2014 are subject to four equally weighted long-term performance measures over the three-year period 2014-2016:
• underlying sales growth;
• core operating margin improvement;
• cumulative operating cash flow; and
• relative total shareholder return.
For the three business focused measures, 25% of awards vest for threshold performance and for maximum performance 200% of the GSIP awards vest (capped at 150% for the MCIP).
Against the TSR comparator group, comprising 18 other companies (19 including Unilever), 50% vests if Unilever is ranked 10th, 100% vests if Unilever is ranked 7th and 200% of the GSIP award vests if Unilever is ranked 3rd or above (this is capped at 150% for the MCIP).
Further details of the TSR comparator group are set out on page 80.
1 Claw-back: The Committee has discretion to reclaim or claw-back some or all of the value of awards of performance-related payments to Executive Directors in the event of a significant downward restatement of the financial results of Unilever. This includes the annual bonus together with any awards that have been made and/or vested shares under the Share Matching Plan, the GSIP and the MCIP. This claw-back may be effected by reducing outstanding awards or requiring the return of the net value of vested awards to Unilever.
2 Form of Awards: Awards may take the form of conditional awards, nil-cost options and forfeitable shares under the GSIP and the MCIP. Awards may be settled in cash.
3 Dividends: Notional dividends accrue on awards under the GSIP and MCIP matching shares between grant and vesting of awards, delivered as shares or cash at the discretion of the Committee, but will only be paid out to the extent that the underlying shares vest. The Committee shall have discretion to determine how notional dividend awards shall be calculated, which may include the deemed reinvestment of these dividends in Unilever’s shares on a cumulative basis.
4 Ultimate Remedy: Grants under the GSIP and MCIP are subject to ultimate remedy. Upon vesting of an award, the Committee shall have the discretionary power to adjust the value of the award if the award, in the Committee’s opinion taking all circumstances into account, produces an unfair result. In exercising this discretion, the Committee may take into account Unilever’s performance against non-financial measures. The Committee will only adjust the value of a vesting award upwards after obtaining shareholder consent.
66 Unilever Annual Report and Accounts 2013Governance
DIRECTORS’ REMUNERATION REPORT CONTINUED
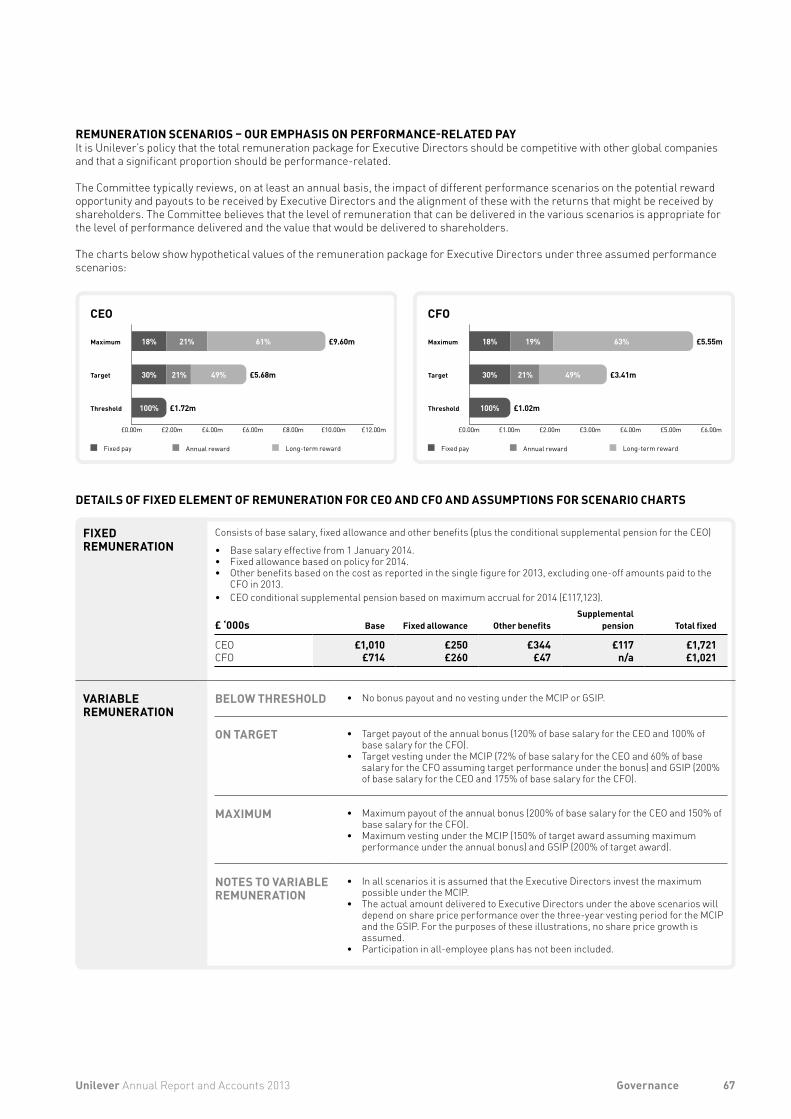
CEO
CFO
Fixed pay Annual reward Long-term reward
Fixed pay Annual reward Long-term reward
Threshold
Target
Maximum
Threshold
Target
Maximum
£0.00m £2.00m £4.00m £6.00m £8.00m £10.00m £12.00m
£0.00m £1.00m £2.00m £3.00m £4.00m £5.00m £6.00m
30% 21% 49% £5.68m
18% 21% 61% £9.60m
100% £1.72m
30% 21% 49% £3.41m
18% 19% 63% £5.55m
100% £1.02m
DETAILS OF FIXED ELEMENT OF REMUNERATION FOR CEO AND CFO AND ASSUMPTIONS FOR SCENARIO CHARTS
FIXEDREMUNERATION
Consists of base salary, fixed allowance and other benefits (plus the conditional supplemental pension for the CEO)
• Base salary effective from 1 January 2014.• Fixed allowance based on policy for 2014.• Other benefits based on the cost as reported in the single figure for 2013, excluding one-off amounts paid to the
CFO in 2013.• CEO conditional supplemental pension based on maximum accrual for 2014 (£117,123).
£ ‘000s Base Fixed allowance Other benefitsSupplemental
pension Total fixed
CEO £1,010 £250 £344 £117 £1,721CFO £714 £260 £47 n/a £1,021
VARIABLE REMUNERATION
BELOW THRESHOLD • No bonus payout and no vesting under the MCIP or GSIP.
ON TARGET • Target payout of the annual bonus (120% of base salary for the CEO and 100% of base salary for the CFO).
• Target vesting under the MCIP (72% of base salary for the CEO and 60% of base salary for the CFO assuming target performance under the bonus) and GSIP (200% of base salary for the CEO and 175% of base salary for the CFO).
MAXIMUM • Maximum payout of the annual bonus (200% of base salary for the CEO and 150% of base salary for the CFO).
• Maximum vesting under the MCIP (150% of target award assuming maximum performance under the annual bonus) and GSIP (200% of target award).
NOTES TO VARIABLE REMUNERATION
• In all scenarios it is assumed that the Executive Directors invest the maximum possible under the MCIP.
• The actual amount delivered to Executive Directors under the above scenarios will depend on share price performance over the three-year vesting period for the MCIP and the GSIP. For the purposes of these illustrations, no share price growth is assumed.
• Participation in all-employee plans has not been included.
REMUNERATION SCENARIOS – OUR EMPHASIS ON PERFORMANCE-RELATED PAYIt is Unilever’s policy that the total remuneration package for Executive Directors should be competitive with other global companies and that a significant proportion should be performance-related.
The Committee typically reviews, on at least an annual basis, the impact of different performance scenarios on the potential reward opportunity and payouts to be received by Executive Directors and the alignment of these with the returns that might be received by shareholders. The Committee believes that the level of remuneration that can be delivered in the various scenarios is appropriate for the level of performance delivered and the value that would be delivered to shareholders.
The charts below show hypothetical values of the remuneration package for Executive Directors under three assumed performance scenarios:
67Unilever Annual Report and Accounts 2013 Governance
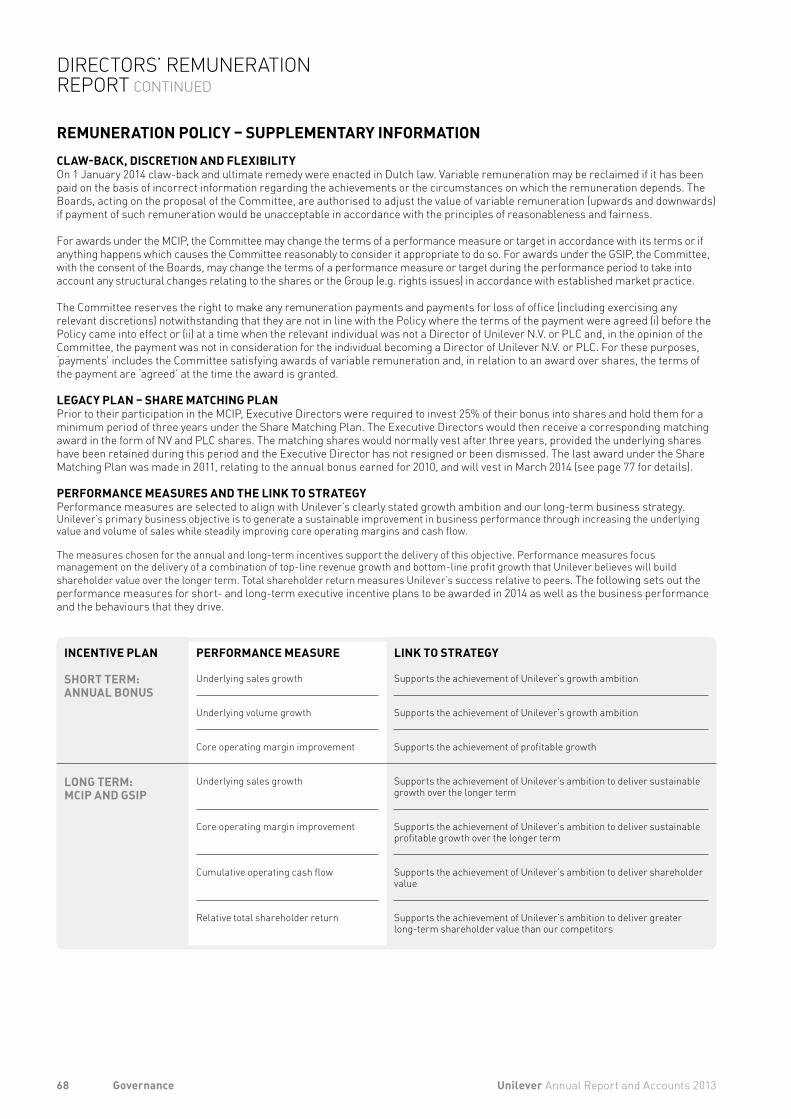
REMUNERATION POLICY – SUPPLEMENTARY INFORMATIONCLAW-BACK, DISCRETION AND FLEXIBILITYOn 1 January 2014 claw-back and ultimate remedy were enacted in Dutch law. Variable remuneration may be reclaimed if it has been paid on the basis of incorrect information regarding the achievements or the circumstances on which the remuneration depends. The Boards, acting on the proposal of the Committee, are authorised to adjust the value of variable remuneration (upwards and downwards) if payment of such remuneration would be unacceptable in accordance with the principles of reasonableness and fairness.
For awards under the MCIP, the Committee may change the terms of a performance measure or target in accordance with its terms or if anything happens which causes the Committee reasonably to consider it appropriate to do so. For awards under the GSIP, the Committee, with the consent of the Boards, may change the terms of a performance measure or target during the performance period to take into account any structural changes relating to the shares or the Group (e.g. rights issues) in accordance with established market practice.
The Committee reserves the right to make any remuneration payments and payments for loss of office (including exercising any relevant discretions) notwithstanding that they are not in line with the Policy where the terms of the payment were agreed (i) before the Policy came into effect or (ii) at a time when the relevant individual was not a Director of Unilever N.V. or PLC and, in the opinion of the Committee, the payment was not in consideration for the individual becoming a Director of Unilever N.V. or PLC. For these purposes, ‘payments’ includes the Committee satisfying awards of variable remuneration and, in relation to an award over shares, the terms of the payment are ‘agreed’ at the time the award is granted.
LEGACY PLAN – SHARE MATCHING PLANPrior to their participation in the MCIP, Executive Directors were required to invest 25% of their bonus into shares and hold them for a minimum period of three years under the Share Matching Plan. The Executive Directors would then receive a corresponding matching award in the form of NV and PLC shares. The matching shares would normally vest after three years, provided the underlying shares have been retained during this period and the Executive Director has not resigned or been dismissed. The last award under the Share Matching Plan was made in 2011, relating to the annual bonus earned for 2010, and will vest in March 2014 (see page 77 for details).
PERFORMANCE MEASURES AND THE LINK TO STRATEGY Performance measures are selected to align with Unilever’s clearly stated growth ambition and our long-term business strategy. Unilever’s primary business objective is to generate a sustainable improvement in business performance through increasing the underlying value and volume of sales while steadily improving core operating margins and cash flow.
The measures chosen for the annual and long-term incentives support the delivery of this objective. Performance measures focus management on the delivery of a combination of top-line revenue growth and bottom-line profit growth that Unilever believes will build shareholder value over the longer term. Total shareholder return measures Unilever’s success relative to peers. The following sets out the performance measures for short- and long-term executive incentive plans to be awarded in 2014 as well as the business performance and the behaviours that they drive.
INCENTIVE PLAN PERFORMANCE MEASURE LINK TO STRATEGY
SHORT TERM: ANNUAL BONUS
Underlying sales growth Supports the achievement of Unilever’s growth ambition
Underlying volume growth Supports the achievement of Unilever’s growth ambition
Core operating margin improvement Supports the achievement of profitable growth
LONG TERM:MCIP AND GSIP
Underlying sales growth Supports the achievement of Unilever’s ambition to deliver sustainable growth over the longer term
Core operating margin improvement Supports the achievement of Unilever’s ambition to deliver sustainable profitable growth over the longer term
Cumulative operating cash flow Supports the achievement of Unilever’s ambition to deliver shareholder value
Relative total shareholder return Supports the achievement of Unilever’s ambition to deliver greater long-term shareholder value than our competitors
68 Unilever Annual Report and Accounts 2013Governance
DIRECTORS’ REMUNERATION REPORT CONTINUED
APPROACH TO TARGET SETTINGThe Committee sets performance targets for incentive plans, taking into account internal budgets, business priorities and external forecasts so that the targets are sufficiently stretching. Good performance results in target payout while maximum payout is only achieved for delivering exceptional performance.
The Committee retains the discretion to amend the performance targets in exceptional circumstances. If discretion is exercised in this way, the Committee will consult with major shareholders as appropriate.
INCENTIVE AWARDS GRANTED TO EXECUTIVE DIRECTORS THAT ARE NOT SUBJECT TO PERFORMANCE MEASURES No incentive awards were made without performance measures in 2013.
SUMMARY OF ANY CHANGES TO THE REMUNERATION POLICYThere have been no changes to the remuneration policy during 2013.
DIFFERENCES IN PAY POLICY FOR DIRECTORS AND OTHER EMPLOYEES GENERALLYRemuneration arrangements are determined throughout the Group based on the same principle – that reward should support our business strategy and should be sufficient to attract and retain high-performing individuals without paying more than is necessary. Unilever is a global organisation with employees at a number of different levels of seniority and in a number of different countries and, while this principle underpins all reward arrangements, the way it is implemented varies by geography and level.
In principle, all our managers participate in the same Unilever annual bonus scheme with the same performance measures based on Unilever’s overall performance. All middle and senior management are invited to participate in the MCIP and receive awards under the GSIP. All other employees will have the opportunity to participate in the global employee share plan following its implementation.
CONSIDERATION OF CONDITIONS ELSEWHERE IN THE GROUPWhen determining the pay of Executive Directors the Committee considers the pay arrangements for other employees in the Group, including considering the average global pay review budget for the management population, to ensure that remuneration arrangements for Executive Directors remain reasonable.
Unilever employs over 170,000 people in 98 countries and, given this geographic spread and other factors, the Committee did not consider that it was appropriate to consult employees on the remuneration policy for Executive Directors during the year. However, Unilever takes the views of its employees seriously and on an ongoing basis we operate the ‘Rate-My-Reward’ survey to gauge the views of employees on the different parts of their reward package.
CONSIDERATION OF SHAREHOLDER VIEWSThe Committee takes the views of shareholders very seriously. These views have been influential in shaping our policy and practice over the last few years. We maintain an open and regular dialogue with our shareholders on remuneration matters, including consulting with our largest shareholders in the UK and the Netherlands, when we are considering making material changes to our remuneration policy.
REMUNERATION POLICY FOR NEW HIRESIn the event of hiring a new Executive Director, the Committee will align the remuneration package with the above Policy. In addition, the Committee retains the discretion to make awards to the new Executive Director to buy out on a like-for-like basis remuneration terms forfeited on leaving a previous employer (buy out awards). We will inform shareholders of any such buy out awards when announcing the appointment. For an internal appointment, any variable remuneration element awarded in respect of a prior role may be paid out according to its original terms. In addition, any other ongoing remuneration obligations existing prior to appointment to the Boards may continue to be honoured.
MINIMUM SHAREHOLDING REQUIREMENTThe remuneration arrangements applicable to our Executive Directors require them to build and retain a personal shareholding in Unilever (by the later of 2015 or five years from the date of appointment) to align their interests with those of Unilever’s long-term shareholders.
69Unilever Annual Report and Accounts 2013 Governance
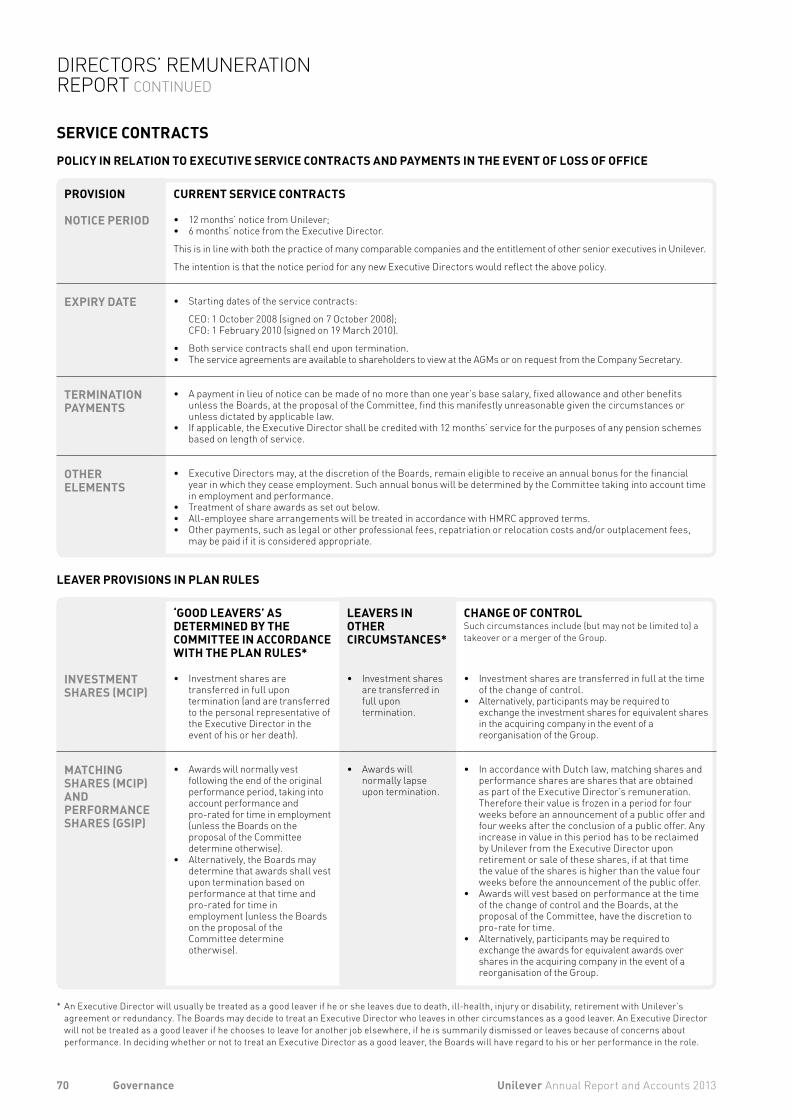
‘GOOD LEAVERS’ AS DETERMINED BY THE COMMITTEE IN ACCORDANCE WITH THE PLAN RULES*
LEAVERS IN OTHER CIRCUMSTANCES*
CHANGE OF CONTROLSuch circumstances include (but may not be limited to) a takeover or a merger of the Group.
INVESTMENT SHARES (MCIP)
• Investment shares are transferred in full upon termination (and are transferred to the personal representative of the Executive Director in the event of his or her death).
• Investment shares are transferred in full upon termination.
• Investment shares are transferred in full at the time of the change of control.
• Alternatively, participants may be required to exchange the investment shares for equivalent shares in the acquiring company in the event of a reorganisation of the Group.
MATCHING SHARES (MCIP)AND PERFORMANCE SHARES (GSIP)
• Awards will normally vest following the end of the original performance period, taking into account performance and pro-rated for time in employment (unless the Boards on the proposal of the Committee determine otherwise).
• Alternatively, the Boards may determine that awards shall vest upon termination based on performance at that time and pro-rated for time in employment (unless the Boards on the proposal of the Committee determine otherwise).
• Awards will normally lapse upon termination.
• In accordance with Dutch law, matching shares and performance shares are shares that are obtained as part of the Executive Director’s remuneration. Therefore their value is frozen in a period for four weeks before an announcement of a public offer and four weeks after the conclusion of a public offer. Any increase in value in this period has to be reclaimed by Unilever from the Executive Director upon retirement or sale of these shares, if at that time the value of the shares is higher than the value four weeks before the announcement of the public offer.
• Awards will vest based on performance at the time of the change of control and the Boards, at the proposal of the Committee, have the discretion to pro-rate for time.
• Alternatively, participants may be required to exchange the awards for equivalent awards over shares in the acquiring company in the event of a reorganisation of the Group.
* An Executive Director will usually be treated as a good leaver if he or she leaves due to death, ill-health, injury or disability, retirement with Unilever’s agreement or redundancy. The Boards may decide to treat an Executive Director who leaves in other circumstances as a good leaver. An Executive Director will not be treated as a good leaver if he chooses to leave for another job elsewhere, if he is summarily dismissed or leaves because of concerns about performance. In deciding whether or not to treat an Executive Director as a good leaver, the Boards will have regard to his or her performance in the role.
LEAVER PROVISIONS IN PLAN RULES
PROVISION CURRENT SERVICE CONTRACTS
NOTICE PERIOD • 12 months’ notice from Unilever;• 6 months’ notice from the Executive Director.
This is in line with both the practice of many comparable companies and the entitlement of other senior executives in Unilever.
The intention is that the notice period for any new Executive Directors would reflect the above policy.
EXPIRY DATE • Starting dates of the service contracts:
CEO: 1 October 2008 (signed on 7 October 2008); CFO: 1 February 2010 (signed on 19 March 2010).
• Both service contracts shall end upon termination.• The service agreements are available to shareholders to view at the AGMs or on request from the Company Secretary.
TERMINATION PAYMENTS
• A payment in lieu of notice can be made of no more than one year’s base salary, fixed allowance and other benefits unless the Boards, at the proposal of the Committee, find this manifestly unreasonable given the circumstances or unless dictated by applicable law.
• If applicable, the Executive Director shall be credited with 12 months’ service for the purposes of any pension schemes based on length of service.
OTHER ELEMENTS
• Executive Directors may, at the discretion of the Boards, remain eligible to receive an annual bonus for the financial year in which they cease employment. Such annual bonus will be determined by the Committee taking into account time in employment and performance.
• Treatment of share awards as set out below.• All-employee share arrangements will be treated in accordance with HMRC approved terms.• Other payments, such as legal or other professional fees, repatriation or relocation costs and/or outplacement fees,
may be paid if it is considered appropriate.
SERVICE CONTRACTSPOLICY IN RELATION TO EXECUTIVE SERVICE CONTRACTS AND PAYMENTS IN THE EVENT OF LOSS OF OFFICE
70 Unilever Annual Report and Accounts 2013Governance
DIRECTORS’ REMUNERATION REPORT CONTINUED
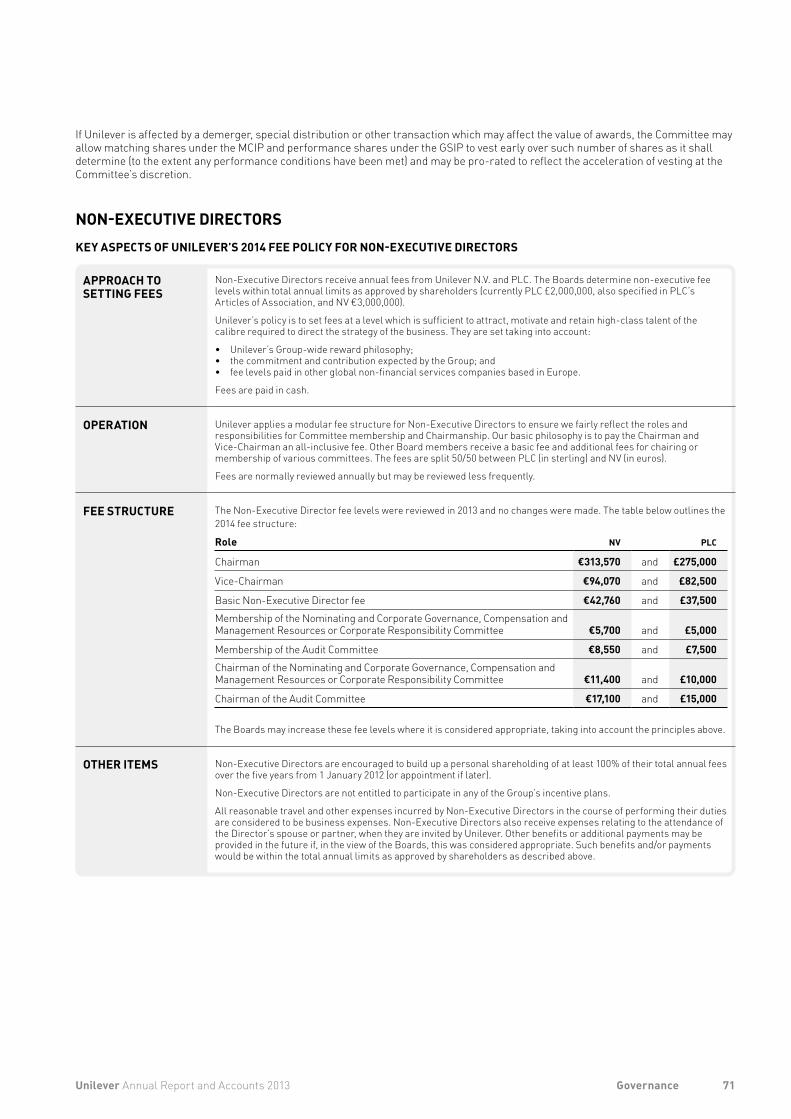
APPROACH TO SETTING FEES
Non-Executive Directors receive annual fees from Unilever N.V. and PLC. The Boards determine non-executive fee levels within total annual limits as approved by shareholders (currently PLC £2,000,000, also specified in PLC’s Articles of Association, and NV €3,000,000).
Unilever’s policy is to set fees at a level which is sufficient to attract, motivate and retain high-class talent of the calibre required to direct the strategy of the business. They are set taking into account:
• Unilever’s Group-wide reward philosophy; • the commitment and contribution expected by the Group; and • fee levels paid in other global non-financial services companies based in Europe.
Fees are paid in cash.
OPERATION Unilever applies a modular fee structure for Non-Executive Directors to ensure we fairly reflect the roles and responsibilities for Committee membership and Chairmanship. Our basic philosophy is to pay the Chairman and Vice-Chairman an all-inclusive fee. Other Board members receive a basic fee and additional fees for chairing or membership of various committees. The fees are split 50/50 between PLC (in sterling) and NV (in euros).
Fees are normally reviewed annually but may be reviewed less frequently.
FEE STRUCTURE The Non-Executive Director fee levels were reviewed in 2013 and no changes were made. The table below outlines the 2014 fee structure:
Role NV PLC
Chairman €313,570 and £275,000
Vice-Chairman €94,070 and £82,500
Basic Non-Executive Director fee €42,760 and £37,500Membership of the Nominating and Corporate Governance, Compensation and Management Resources or Corporate Responsibility Committee €5,700 and £5,000
Membership of the Audit Committee €8,550 and £7,500Chairman of the Nominating and Corporate Governance, Compensation and Management Resources or Corporate Responsibility Committee €11,400 and £10,000
Chairman of the Audit Committee €17,100 and £15,000
The Boards may increase these fee levels where it is considered appropriate, taking into account the principles above.
OTHER ITEMS Non-Executive Directors are encouraged to build up a personal shareholding of at least 100% of their total annual fees over the five years from 1 January 2012 (or appointment if later).
Non-Executive Directors are not entitled to participate in any of the Group’s incentive plans.
All reasonable travel and other expenses incurred by Non-Executive Directors in the course of performing their duties are considered to be business expenses. Non-Executive Directors also receive expenses relating to the attendance of the Director’s spouse or partner, when they are invited by Unilever. Other benefits or additional payments may be provided in the future if, in the view of the Boards, this was considered appropriate. Such benefits and/or payments would be within the total annual limits as approved by shareholders as described above.
If Unilever is affected by a demerger, special distribution or other transaction which may affect the value of awards, the Committee may allow matching shares under the MCIP and performance shares under the GSIP to vest early over such number of shares as it shall determine (to the extent any performance conditions have been met) and may be pro-rated to reflect the acceleration of vesting at the Committee’s discretion.
NON-EXECUTIVE DIRECTORSKEY ASPECTS OF UNILEVER’S 2014 FEE POLICY FOR NON-EXECUTIVE DIRECTORS
71Unilever Annual Report and Accounts 2013 Governance
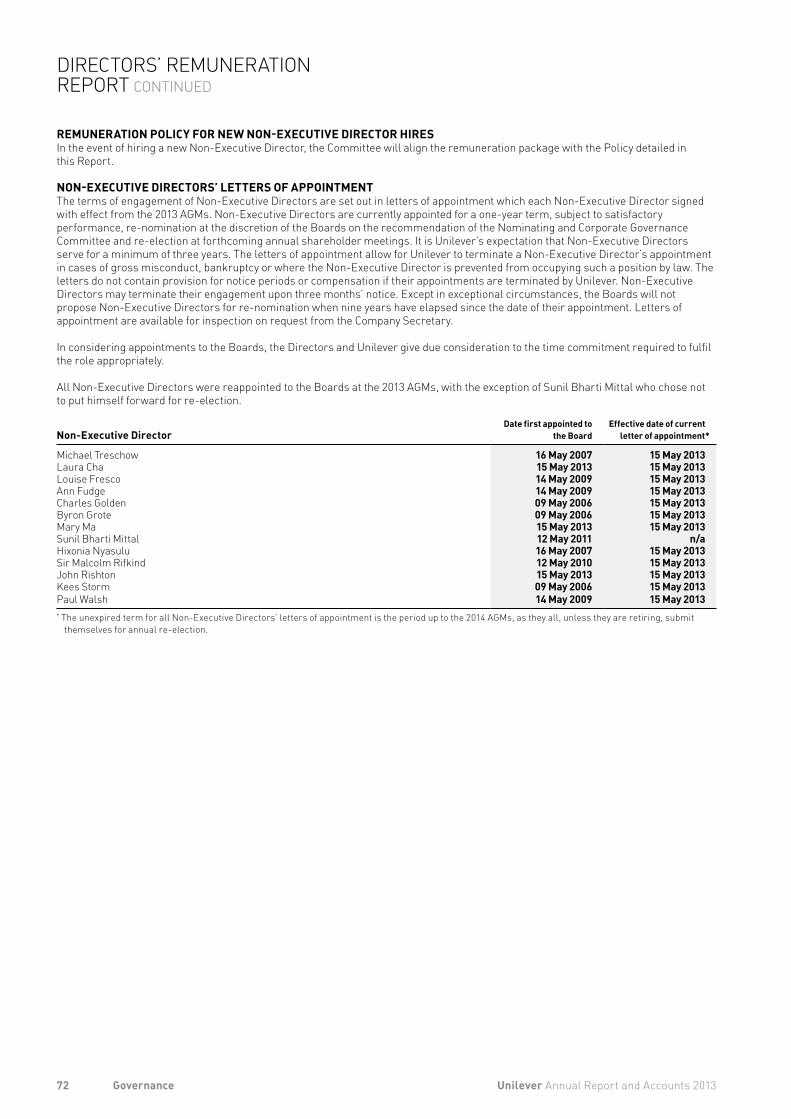
REMUNERATION POLICY FOR NEW NON-EXECUTIVE DIRECTOR HIRESIn the event of hiring a new Non-Executive Director, the Committee will align the remuneration package with the Policy detailed in this Report.
NON-EXECUTIVE DIRECTORS’ LETTERS OF APPOINTMENTThe terms of engagement of Non-Executive Directors are set out in letters of appointment which each Non-Executive Director signed with effect from the 2013 AGMs. Non-Executive Directors are currently appointed for a one-year term, subject to satisfactory performance, re-nomination at the discretion of the Boards on the recommendation of the Nominating and Corporate Governance Committee and re-election at forthcoming annual shareholder meetings. It is Unilever’s expectation that Non-Executive Directors serve for a minimum of three years. The letters of appointment allow for Unilever to terminate a Non-Executive Director’s appointment in cases of gross misconduct, bankruptcy or where the Non-Executive Director is prevented from occupying such a position by law. The letters do not contain provision for notice periods or compensation if their appointments are terminated by Unilever. Non-Executive Directors may terminate their engagement upon three months’ notice. Except in exceptional circumstances, the Boards will not propose Non-Executive Directors for re-nomination when nine years have elapsed since the date of their appointment. Letters of appointment are available for inspection on request from the Company Secretary.
In considering appointments to the Boards, the Directors and Unilever give due consideration to the time commitment required to fulfil the role appropriately.
All Non-Executive Directors were reappointed to the Boards at the 2013 AGMs, with the exception of Sunil Bharti Mittal who chose not to put himself forward for re-election.
Non-Executive DirectorDate first appointed to
the Board Effective date of current
letter of appointment*
Michael Treschow 16 May 2007 15 May 2013Laura Cha 15 May 2013 15 May 2013Louise Fresco 14 May 2009 15 May 2013Ann Fudge 14 May 2009 15 May 2013Charles Golden 09 May 2006 15 May 2013Byron Grote 09 May 2006 15 May 2013Mary Ma 15 May 2013 15 May 2013Sunil Bharti Mittal 12 May 2011 n/aHixonia Nyasulu 16 May 2007 15 May 2013Sir Malcolm Rifkind 12 May 2010 15 May 2013John Rishton 15 May 2013 15 May 2013Kees Storm 09 May 2006 15 May 2013Paul Walsh 14 May 2009 15 May 2013* The unexpired term for all Non-Executive Directors’ letters of appointment is the period up to the 2014 AGMs, as they all, unless they are retiring, submit
themselves for annual re-election.
72 Unilever Annual Report and Accounts 2013Governance
DIRECTORS’ REMUNERATION REPORT CONTINUED
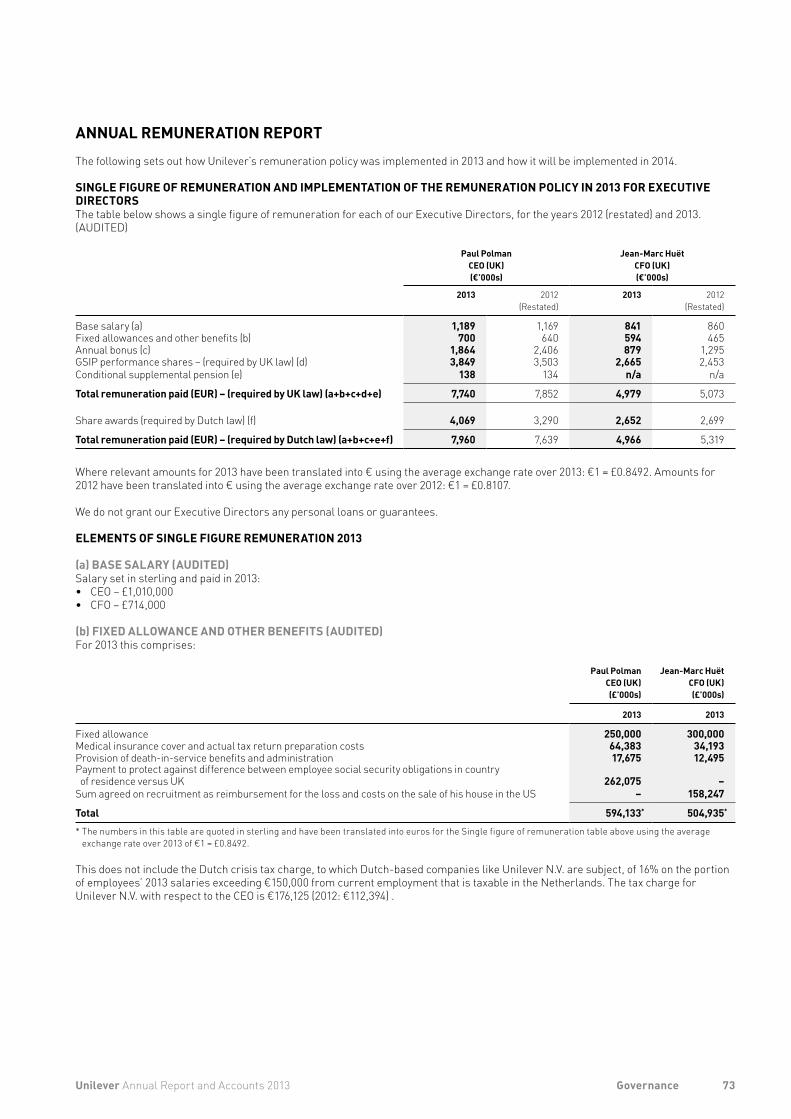
ANNUAL REMUNERATION REPORTThe following sets out how Unilever’s remuneration policy was implemented in 2013 and how it will be implemented in 2014.
SINGLE FIGURE OF REMUNERATION AND IMPLEMENTATION OF THE REMUNERATION POLICY IN 2013 FOR EXECUTIVE DIRECTORSThe table below shows a single figure of remuneration for each of our Executive Directors, for the years 2012 (restated) and 2013. (AUDITED)
Paul PolmanCEO (UK)(€’000s)
Jean-Marc HuëtCFO (UK)(€’000s)
2013 2012 (Restated)
2013 2012(Restated)
Base salary (a) 1,189 1,169 841 860Fixed allowances and other benefits (b) 700 640 594 465Annual bonus (c) 1,864 2,406 879 1,295GSIP performance shares – (required by UK law) (d) 3,849 3,503 2,665 2,453Conditional supplemental pension (e) 138 134 n/a n/a
Total remuneration paid (EUR) – (required by UK law) (a+b+c+d+e) 7,740 7,852 4,979 5,073
Share awards (required by Dutch law) (f) 4,069 3,290 2,652 2,699
Total remuneration paid (EUR) – (required by Dutch law) (a+b+c+e+f) 7,960 7,639 4,966 5,319
Where relevant amounts for 2013 have been translated into € using the average exchange rate over 2013: €1 = £0.8492. Amounts for 2012 have been translated into € using the average exchange rate over 2012: €1 = £0.8107.
We do not grant our Executive Directors any personal loans or guarantees.
ELEMENTS OF SINGLE FIGURE REMUNERATION 2013
(a) BASE SALARY (AUDITED)Salary set in sterling and paid in 2013:• CEO – £1,010,000 • CFO – £714,000
(b) FIXED ALLOWANCE AND OTHER BENEFITS (AUDITED)For 2013 this comprises:
Paul PolmanCEO (UK)(£’000s)
Jean-Marc HuëtCFO (UK)(£’000s)
2013 2013
Fixed allowance 250,000 300,000Medical insurance cover and actual tax return preparation costs 64,383 34,193Provision of death-in-service benefits and administration 17,675 12,495Payment to protect against difference between employee social security obligations in country of residence versus UK 262,075 –
Sum agreed on recruitment as reimbursement for the loss and costs on the sale of his house in the US – 158,247
Total 594,133* 504,935*
* The numbers in this table are quoted in sterling and have been translated into euros for the Single figure of remuneration table above using the average exchange rate over 2013 of €1 = £0.8492.
This does not include the Dutch crisis tax charge, to which Dutch-based companies like Unilever N.V. are subject, of 16% on the portion of employees’ 2013 salaries exceeding €150,000 from current employment that is taxable in the Netherlands. The tax charge for Unilever N.V. with respect to the CEO is €176,125 (2012: €112,394) .
73Unilever Annual Report and Accounts 2013 Governance
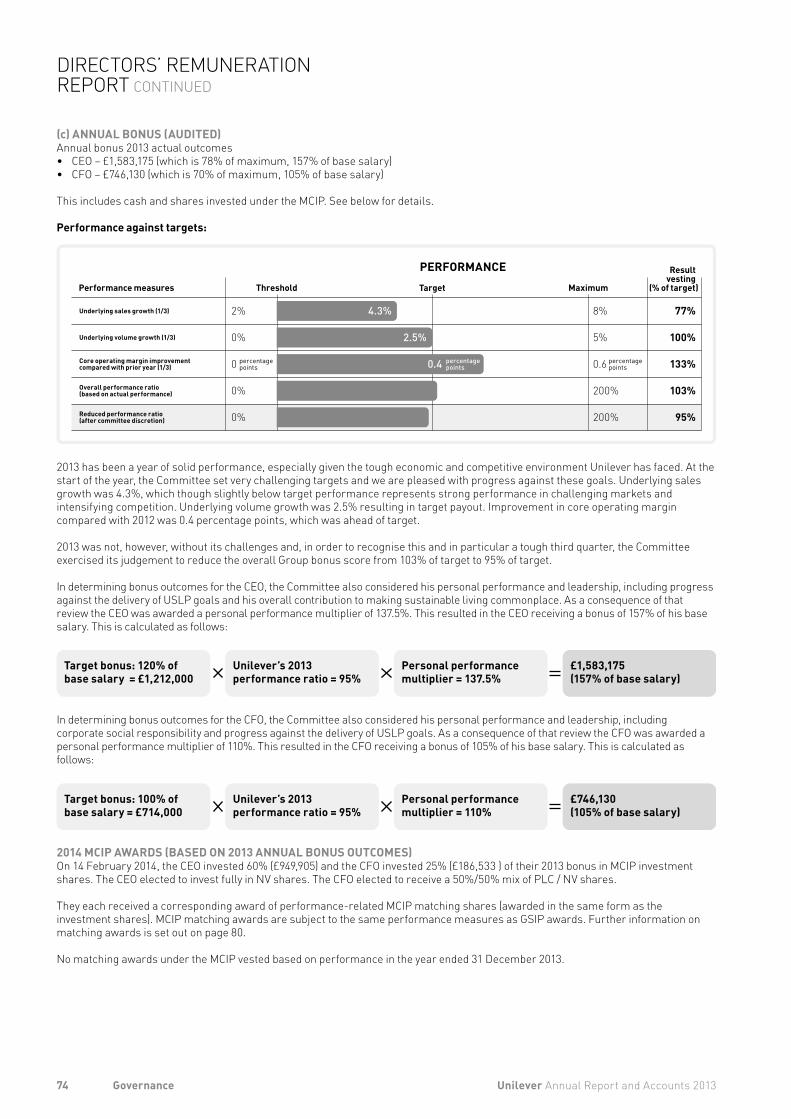
(c) ANNUAL BONUS (AUDITED)Annual bonus 2013 actual outcomes • CEO – £1,583,175 (which is 78% of maximum, 157% of base salary) • CFO – £746,130 (which is 70% of maximum, 105% of base salary)
This includes cash and shares invested under the MCIP. See below for details.
Performance against targets:
Target
PERFORMANCEPerformance measures Threshold
Result vesting
(% of target) Maximum
Core operating margin improvement compared with prior year (1/3)
Underlying volume growth (1/3)
Underlying sales growth (1/3) 4.3%
2.5%
0.4
77%8%
5%
0.60
2%
0% 100%
133%
Overall performance ratio(based on actual performance) 200%0% 103%
Reduced performance ratio(after committee discretion) 200%0% 95%
percentage points
percentage points
percentage points
2013 has been a year of solid performance, especially given the tough economic and competitive environment Unilever has faced. At the start of the year, the Committee set very challenging targets and we are pleased with progress against these goals. Underlying sales growth was 4.3%, which though slightly below target performance represents strong performance in challenging markets and intensifying competition. Underlying volume growth was 2.5% resulting in target payout. Improvement in core operating margin compared with 2012 was 0.4 percentage points, which was ahead of target.
2013 was not, however, without its challenges and, in order to recognise this and in particular a tough third quarter, the Committee exercised its judgement to reduce the overall Group bonus score from 103% of target to 95% of target.
In determining bonus outcomes for the CEO, the Committee also considered his personal performance and leadership, including progress against the delivery of USLP goals and his overall contribution to making sustainable living commonplace. As a consequence of that review the CEO was awarded a personal performance multiplier of 137.5%. This resulted in the CEO receiving a bonus of 157% of his base salary. This is calculated as follows:
Target bonus: 120% of base salary = £1,212,000
Unilever’s 2013 performance ratio = 95%
Personal performance multiplier = 137.5%
£1,583,175 (157% of base salary)
In determining bonus outcomes for the CFO, the Committee also considered his personal performance and leadership, including corporate social responsibility and progress against the delivery of USLP goals. As a consequence of that review the CFO was awarded a personal performance multiplier of 110%. This resulted in the CFO receiving a bonus of 105% of his base salary. This is calculated as follows:
Target bonus: 100% of base salary = £714,000
Unilever’s 2013 performance ratio = 95%
Personal performance multiplier = 110%
£746,130 (105% of base salary)
2014 MCIP AWARDS (BASED ON 2013 ANNUAL BONUS OUTCOMES)On 14 February 2014, the CEO invested 60% (£949,905) and the CFO invested 25% (£186,533 ) of their 2013 bonus in MCIP investment shares. The CEO elected to invest fully in NV shares. The CFO elected to receive a 50%/50% mix of PLC / NV shares.
They each received a corresponding award of performance-related MCIP matching shares (awarded in the same form as the investment shares). MCIP matching awards are subject to the same performance measures as GSIP awards. Further information on matching awards is set out on page 80.
No matching awards under the MCIP vested based on performance in the year ended 31 December 2013.
74 Unilever Annual Report and Accounts 2013Governance
DIRECTORS’ REMUNERATION REPORT CONTINUED
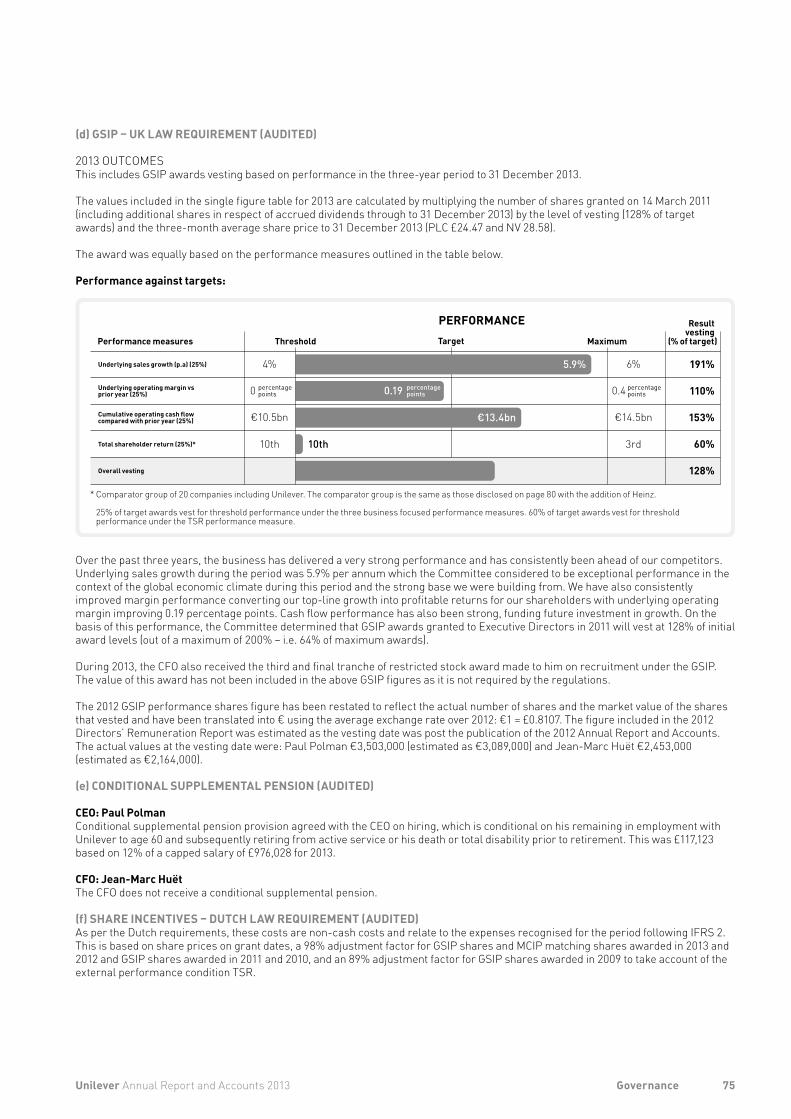
(d) GSIP – UK LAW REQUIREMENT (AUDITED)
2013 OUTCOMESThis includes GSIP awards vesting based on performance in the three-year period to 31 December 2013.
The values included in the single figure table for 2013 are calculated by multiplying the number of shares granted on 14 March 2011 (including additional shares in respect of accrued dividends through to 31 December 2013) by the level of vesting (128% of target awards) and the three-month average share price to 31 December 2013 (PLC £24.47 and NV 28.58).
The award was equally based on the performance measures outlined in the table below.
Performance against targets:
Threshold Target
PERFORMANCEPerformance measures
* Comparator group of 20 companies including Unilever. The comparator group is the same as those disclosed on page 80 with the addition of Heinz.
25% of target awards vest for threshold performance under the three business focused performance measures. 60% of target awards vest for threshold performance under the TSR performance measure.
Result vesting
(% of target) Maximum
Cumulative operating cash flowcompared with prior year (25%)
Underlying operating margin vs prior year (25%)
Total shareholder return (25%)*
Overall vesting
Underlying sales growth (p.a) (25%) 5.9%
€13.4bn
10th
191%
110%
153%
60%
128%
6%
€14.5bn
3rd
4%
€10.5bn
10th
0 percentage points 0.4 percentage
points0.19 percentage points
Over the past three years, the business has delivered a very strong performance and has consistently been ahead of our competitors. Underlying sales growth during the period was 5.9% per annum which the Committee considered to be exceptional performance in the context of the global economic climate during this period and the strong base we were building from. We have also consistently improved margin performance converting our top-line growth into profitable returns for our shareholders with underlying operating margin improving 0.19 percentage points. Cash flow performance has also been strong, funding future investment in growth. On the basis of this performance, the Committee determined that GSIP awards granted to Executive Directors in 2011 will vest at 128% of initial award levels (out of a maximum of 200% – i.e. 64% of maximum awards).
During 2013, the CFO also received the third and final tranche of restricted stock award made to him on recruitment under the GSIP. The value of this award has not been included in the above GSIP figures as it is not required by the regulations.
The 2012 GSIP performance shares figure has been restated to reflect the actual number of shares and the market value of the shares that vested and have been translated into € using the average exchange rate over 2012: €1 = £0.8107. The figure included in the 2012 Directors’ Remuneration Report was estimated as the vesting date was post the publication of the 2012 Annual Report and Accounts. The actual values at the vesting date were: Paul Polman €3,503,000 (estimated as €3,089,000) and Jean-Marc Huët €2,453,000 (estimated as €2,164,000).
(e) CONDITIONAL SUPPLEMENTAL PENSION (AUDITED)
CEO: Paul PolmanConditional supplemental pension provision agreed with the CEO on hiring, which is conditional on his remaining in employment with Unilever to age 60 and subsequently retiring from active service or his death or total disability prior to retirement. This was £117,123 based on 12% of a capped salary of £976,028 for 2013.
CFO: Jean-Marc HuëtThe CFO does not receive a conditional supplemental pension.
(f) SHARE INCENTIVES – DUTCH LAW REQUIREMENT (AUDITED)As per the Dutch requirements, these costs are non-cash costs and relate to the expenses recognised for the period following IFRS 2. This is based on share prices on grant dates, a 98% adjustment factor for GSIP shares and MCIP matching shares awarded in 2013 and 2012 and GSIP shares awarded in 2011 and 2010, and an 89% adjustment factor for GSIP shares awarded in 2009 to take account of the external performance condition TSR.
75Unilever Annual Report and Accounts 2013 Governance
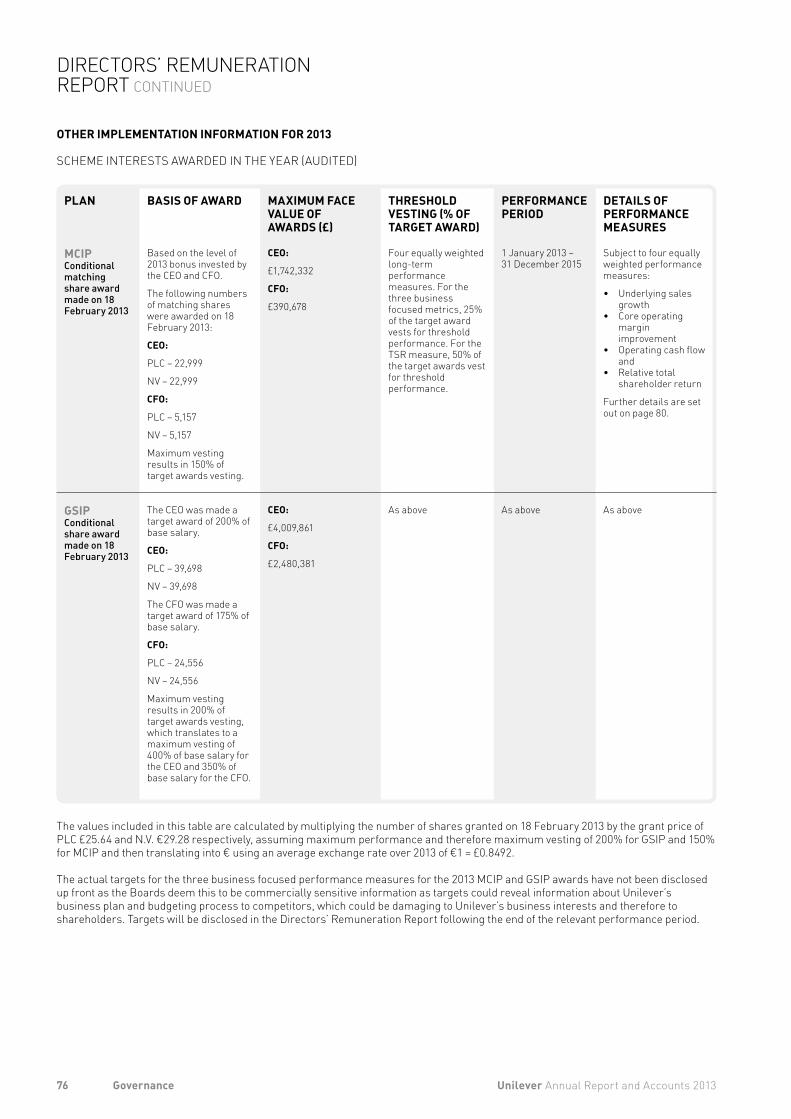
OTHER IMPLEMENTATION INFORMATION FOR 2013
SCHEME INTERESTS AWARDED IN THE YEAR (AUDITED)
PLAN BASIS OF AWARD MAXIMUM FACE VALUE OF AWARDS (£)
THRESHOLD VESTING (% OF TARGET AWARD)
PERFORMANCE PERIOD
DETAILS OF PERFORMANCE MEASURES
MCIPConditional matching share award made on 18 February 2013
Based on the level of 2013 bonus invested by the CEO and CFO.
The following numbers of matching shares were awarded on 18 February 2013:
CEO:
PLC – 22,999
NV – 22,999
CFO:
PLC – 5,157
NV – 5,157
Maximum vesting results in 150% of target awards vesting.
CEO:
£1,742,332
CFO:
£390,678
Four equally weighted long-term performance measures. For the three business focused metrics, 25% of the target award vests for threshold performance. For the TSR measure, 50% of the target awards vest for threshold performance.
1 January 2013 – 31 December 2015
Subject to four equally weighted performance measures:
• Underlying sales growth
• Core operating margin improvement
• Operating cash flow and
• Relative total shareholder return
Further details are set out on page 80.
GSIP Conditional share award made on 18 February 2013
The CEO was made a target award of 200% of base salary.
CEO:
PLC – 39,698
NV – 39,698
The CFO was made a target award of 175% of base salary.
CFO:
PLC – 24,556
NV – 24,556
Maximum vesting results in 200% of target awards vesting, which translates to a maximum vesting of 400% of base salary for the CEO and 350% of base salary for the CFO.
CEO:
£4,009,861
CFO:
£2,480,381
As above As above As above
The values included in this table are calculated by multiplying the number of shares granted on 18 February 2013 by the grant price of PLC £25.64 and N.V. €29.28 respectively, assuming maximum performance and therefore maximum vesting of 200% for GSIP and 150% for MCIP and then translating into € using an average exchange rate over 2013 of €1 = £0.8492.
The actual targets for the three business focused performance measures for the 2013 MCIP and GSIP awards have not been disclosed up front as the Boards deem this to be commercially sensitive information as targets could reveal information about Unilever’s business plan and budgeting process to competitors, which could be damaging to Unilever’s business interests and therefore to shareholders. Targets will be disclosed in the Directors’ Remuneration Report following the end of the relevant performance period.
76 Unilever Annual Report and Accounts 2013Governance
DIRECTORS’ REMUNERATION REPORT CONTINUED
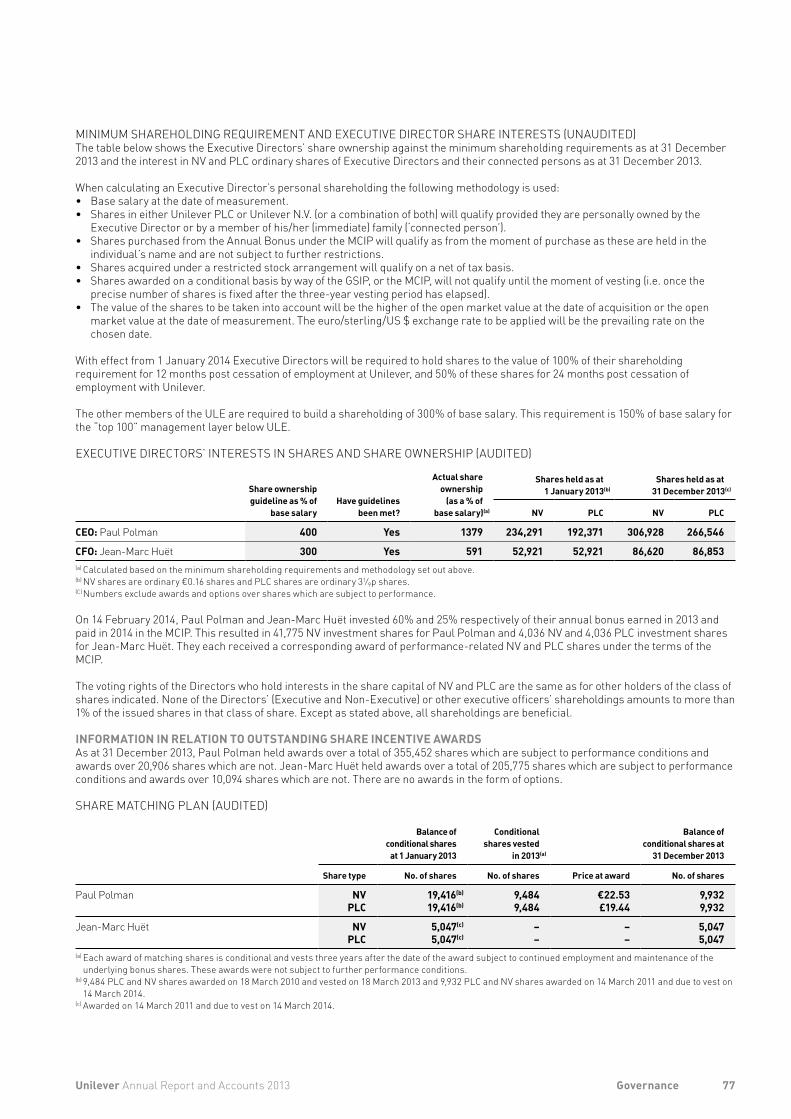
MINIMUM SHAREHOLDING REQUIREMENT AND EXECUTIVE DIRECTOR SHARE INTERESTS (UNAUDITED)The table below shows the Executive Directors’ share ownership against the minimum shareholding requirements as at 31 December 2013 and the interest in NV and PLC ordinary shares of Executive Directors and their connected persons as at 31 December 2013.
When calculating an Executive Director’s personal shareholding the following methodology is used:• Base salary at the date of measurement.• Shares in either Unilever PLC or Unilever N.V. (or a combination of both) will qualify provided they are personally owned by the
Executive Director or by a member of his/her (immediate) family (‘connected person’).• Shares purchased from the Annual Bonus under the MCIP will qualify as from the moment of purchase as these are held in the
individual’s name and are not subject to further restrictions. • Shares acquired under a restricted stock arrangement will qualify on a net of tax basis. • Shares awarded on a conditional basis by way of the GSIP, or the MCIP, will not qualify until the moment of vesting (i.e. once the
precise number of shares is fixed after the three-year vesting period has elapsed).• The value of the shares to be taken into account will be the higher of the open market value at the date of acquisition or the open
market value at the date of measurement. The euro/sterling/US $ exchange rate to be applied will be the prevailing rate on the chosen date.
With effect from 1 January 2014 Executive Directors will be required to hold shares to the value of 100% of their shareholding requirement for 12 months post cessation of employment at Unilever, and 50% of these shares for 24 months post cessation of employment with Unilever.
The other members of the ULE are required to build a shareholding of 300% of base salary. This requirement is 150% of base salary for the “top 100” management layer below ULE.
EXECUTIVE DIRECTORS’ INTERESTS IN SHARES AND SHARE OWNERSHIP (AUDITED)
Share ownership guideline as % of
base salaryHave guidelines
been met?
Actual share ownership
(as a % ofbase salary)(a)
Shares held as at 1 January 2013(b)
Shares held as at31 December 2013(c)
NV PLC NV PLC
CEO: Paul Polman 400 Yes 1379 234,291 192,371 306,928 266,546
CFO: Jean-Marc Huët 300 Yes 591 52,921 52,921 86,620 86,853(a) Calculated based on the minimum shareholding requirements and methodology set out above.(b) NV shares are ordinary €0.16 shares and PLC shares are ordinary 31⁄9p shares.(C) Numbers exclude awards and options over shares which are subject to performance.
On 14 February 2014, Paul Polman and Jean-Marc Huët invested 60% and 25% respectively of their annual bonus earned in 2013 and paid in 2014 in the MCIP. This resulted in 41,775 NV investment shares for Paul Polman and 4,036 NV and 4,036 PLC investment shares for Jean-Marc Huët. They each received a corresponding award of performance-related NV and PLC shares under the terms of the MCIP.
The voting rights of the Directors who hold interests in the share capital of NV and PLC are the same as for other holders of the class of shares indicated. None of the Directors’ (Executive and Non-Executive) or other executive officers’ shareholdings amounts to more than 1% of the issued shares in that class of share. Except as stated above, all shareholdings are beneficial.
INFORMATION IN RELATION TO OUTSTANDING SHARE INCENTIVE AWARDSAs at 31 December 2013, Paul Polman held awards over a total of 355,452 shares which are subject to performance conditions and awards over 20,906 shares which are not. Jean-Marc Huët held awards over a total of 205,775 shares which are subject to performance conditions and awards over 10,094 shares which are not. There are no awards in the form of options.
SHARE MATCHING PLAN (AUDITED)
Balance of conditional shares
at 1 January 2013
Conditional shares vested
in 2013(a)
Balance of conditional shares at
31 December 2013
Share type No. of shares No. of shares Price at award No. of shares
Paul Polman NV 19,416(b) 9,484 €22.53 9,932PLC 19,416(b) 9,484 £19.44 9,932
Jean-Marc Huët NV 5,047(c) – – 5,047PLC 5,047(c) – – 5,047
(a) Each award of matching shares is conditional and vests three years after the date of the award subject to continued employment and maintenance of the underlying bonus shares. These awards were not subject to further performance conditions.
(b) 9,484 PLC and NV shares awarded on 18 March 2010 and vested on 18 March 2013 and 9,932 PLC and NV shares awarded on 14 March 2011 and due to vest on 14 March 2014.
(c) Awarded on 14 March 2011 and due to vest on 14 March 2014.
77Unilever Annual Report and Accounts 2013 Governance
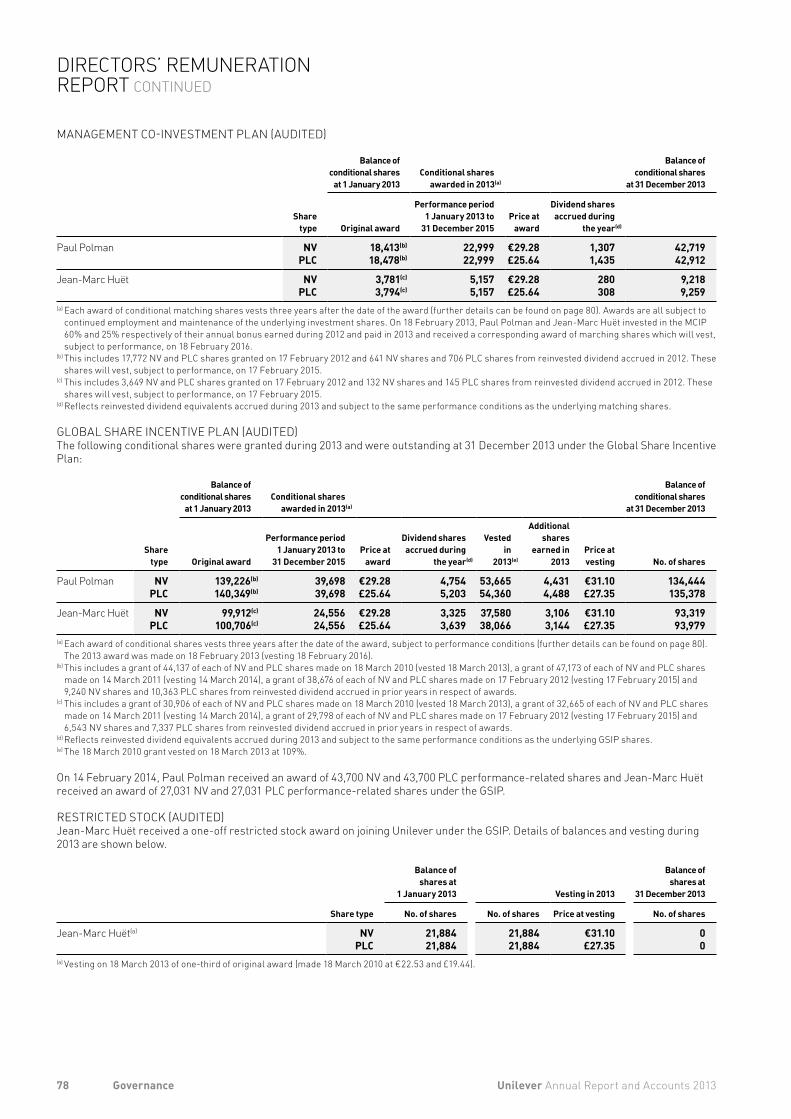
MANAGEMENT CO-INVESTMENT PLAN (AUDITED)
Balance of conditional shares
at 1 January 2013Conditional shares
awarded in 2013(a)
Balance of conditional shares
at 31 December 2013
Share
type Original award
Performance period 1 January 2013 to
31 December 2015Price at
award
Dividend shares accrued during
the year(d)
Paul Polman NV 18,413(b) 22,999 €29.28 1,307 42,719PLC 18,478(b) 22,999 £25.64 1,435 42,912
Jean-Marc Huët NV 3,781(c) 5,157 €29.28 280 9,218 PLC 3,794(c) 5,157 £25.64 308 9,259(a) Each award of conditional matching shares vests three years after the date of the award (further details can be found on page 80). Awards are all subject to
continued employment and maintenance of the underlying investment shares. On 18 February 2013, Paul Polman and Jean-Marc Huët invested in the MCIP 60% and 25% respectively of their annual bonus earned during 2012 and paid in 2013 and received a corresponding award of marching shares which will vest, subject to performance, on 18 February 2016.
(b) This includes 17,772 NV and PLC shares granted on 17 February 2012 and 641 NV shares and 706 PLC shares from reinvested dividend accrued in 2012. These shares will vest, subject to performance, on 17 February 2015.
(c) This includes 3,649 NV and PLC shares granted on 17 February 2012 and 132 NV shares and 145 PLC shares from reinvested dividend accrued in 2012. These shares will vest, subject to performance, on 17 February 2015.
(d) Reflects reinvested dividend equivalents accrued during 2013 and subject to the same performance conditions as the underlying matching shares.
GLOBAL SHARE INCENTIVE PLAN (AUDITED)The following conditional shares were granted during 2013 and were outstanding at 31 December 2013 under the Global Share Incentive Plan:
Balance of conditional shares
at 1 January 2013Conditional shares
awarded in 2013(a)
Balance of conditional shares
at 31 December 2013
Share
type Original award
Performance period 1 January 2013 to
31 December 2015Price at
award
Dividend shares accrued during
the year(d)
Vested in
2013(e)
Additional shares
earned in 2013
Price at vesting No. of shares
Paul Polman NV 139,226(b) 39,698 €29.28 4,754 53,665 4,431 €31.10 134,444PLC 140,349(b) 39,698 £25.64 5,203 54,360 4,488 £27.35 135,378
Jean-Marc Huët NV 99,912(c) 24,556 €29.28 3,325 37,580 3,106 €31.10 93,319 PLC 100,706(c) 24,556 £25.64 3,639 38,066 3,144 £27.35 93,979(a) Each award of conditional shares vests three years after the date of the award, subject to performance conditions (further details can be found on page 80).
The 2013 award was made on 18 February 2013 (vesting 18 February 2016). (b) This includes a grant of 44,137 of each of NV and PLC shares made on 18 March 2010 (vested 18 March 2013), a grant of 47,173 of each of NV and PLC shares
made on 14 March 2011 (vesting 14 March 2014), a grant of 38,676 of each of NV and PLC shares made on 17 February 2012 (vesting 17 February 2015) and 9,240 NV shares and 10,363 PLC shares from reinvested dividend accrued in prior years in respect of awards.
(c) This includes a grant of 30,906 of each of NV and PLC shares made on 18 March 2010 (vested 18 March 2013), a grant of 32,665 of each of NV and PLC shares made on 14 March 2011 (vesting 14 March 2014), a grant of 29,798 of each of NV and PLC shares made on 17 February 2012 (vesting 17 February 2015) and 6,543 NV shares and 7,337 PLC shares from reinvested dividend accrued in prior years in respect of awards.
(d) Reflects reinvested dividend equivalents accrued during 2013 and subject to the same performance conditions as the underlying GSIP shares.(e) The 18 March 2010 grant vested on 18 March 2013 at 109%.
On 14 February 2014, Paul Polman received an award of 43,700 NV and 43,700 PLC performance-related shares and Jean-Marc Huët received an award of 27,031 NV and 27,031 PLC performance-related shares under the GSIP.
RESTRICTED STOCK (AUDITED)Jean-Marc Huët received a one-off restricted stock award on joining Unilever under the GSIP. Details of balances and vesting during 2013 are shown below.
Balance ofshares at
1 January 2013 Vesting in 2013
Balance of shares at
31 December 2013
Share type No. of shares No. of shares Price at vesting No. of shares
Jean-Marc Huët(a) NV 21,884 21,884 €31.10 0 PLC 21,884 21,884 £27.35 0(a) Vesting on 18 March 2013 of one-third of original award (made 18 March 2010 at €22.53 and £19.44).
78 Unilever Annual Report and Accounts 2013Governance
DIRECTORS’ REMUNERATION REPORT CONTINUED
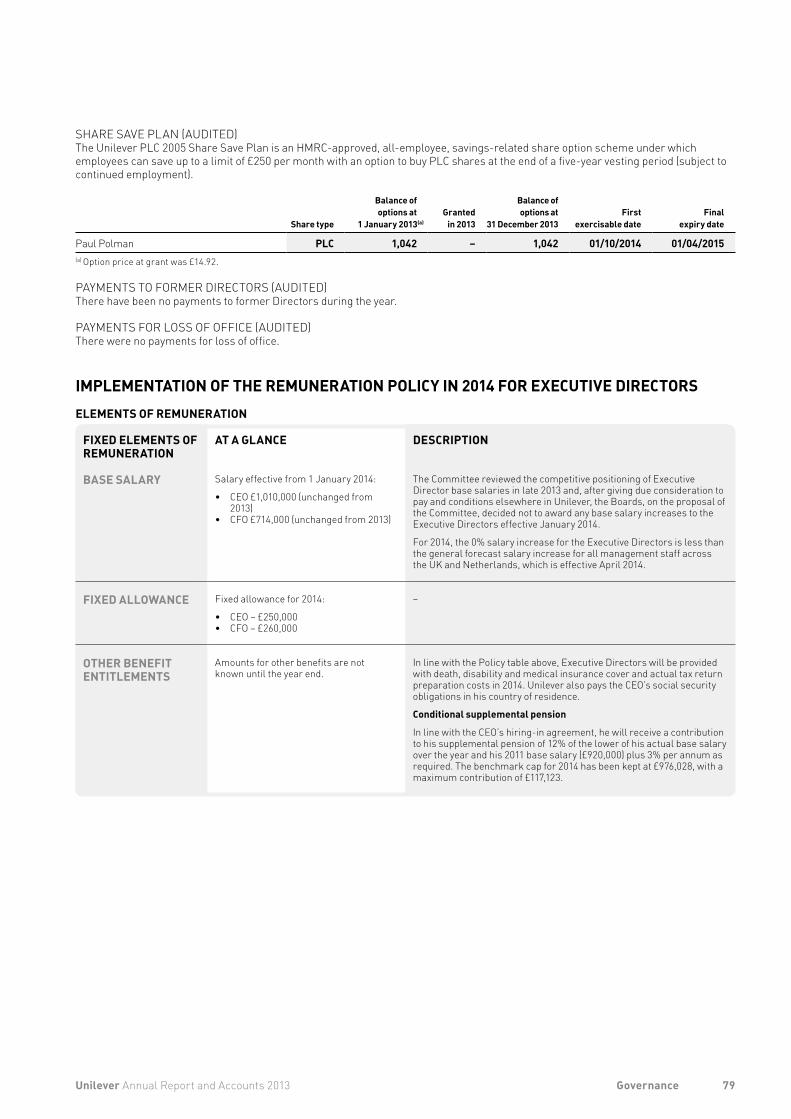
FIXED ELEMENTS OF REMUNERATION
AT A GLANCE DESCRIPTION
BASE SALARY Salary effective from 1 January 2014:
• CEO £1,010,000 (unchanged from 2013)
• CFO £714,000 (unchanged from 2013)
The Committee reviewed the competitive positioning of Executive Director base salaries in late 2013 and, after giving due consideration to pay and conditions elsewhere in Unilever, the Boards, on the proposal of the Committee, decided not to award any base salary increases to the Executive Directors effective January 2014.
For 2014, the 0% salary increase for the Executive Directors is less than the general forecast salary increase for all management staff across the UK and Netherlands, which is effective April 2014.
FIXED ALLOWANCE Fixed allowance for 2014:
• CEO – £250,000 • CFO – £260,000
–
OTHER BENEFIT ENTITLEMENTS
Amounts for other benefits are not known until the year end.
In line with the Policy table above, Executive Directors will be provided with death, disability and medical insurance cover and actual tax return preparation costs in 2014. Unilever also pays the CEO’s social security obligations in his country of residence.
Conditional supplemental pension
In line with the CEO’s hiring-in agreement, he will receive a contribution to his supplemental pension of 12% of the lower of his actual base salary over the year and his 2011 base salary (£920,000) plus 3% per annum as required. The benchmark cap for 2014 has been kept at £976,028, with a maximum contribution of £117,123.
SHARE SAVE PLAN (AUDITED)The Unilever PLC 2005 Share Save Plan is an HMRC-approved, all-employee, savings-related share option scheme under which employees can save up to a limit of £250 per month with an option to buy PLC shares at the end of a five-year vesting period (subject to continued employment).
Share type
Balance ofoptions at
1 January 2013(a)Granted in 2013
Balance of options at
31 December 2013First
exercisable dateFinal
expiry date
Paul Polman PLC 1,042 – 1,042 01/10/2014 01/04/2015(a) Option price at grant was £14.92.
PAYMENTS TO FORMER DIRECTORS (AUDITED)There have been no payments to former Directors during the year.
PAYMENTS FOR LOSS OF OFFICE (AUDITED)There were no payments for loss of office.
IMPLEMENTATION OF THE REMUNERATION POLICY IN 2014 FOR EXECUTIVE DIRECTORSELEMENTS OF REMUNERATION
79Unilever Annual Report and Accounts 2013 Governance
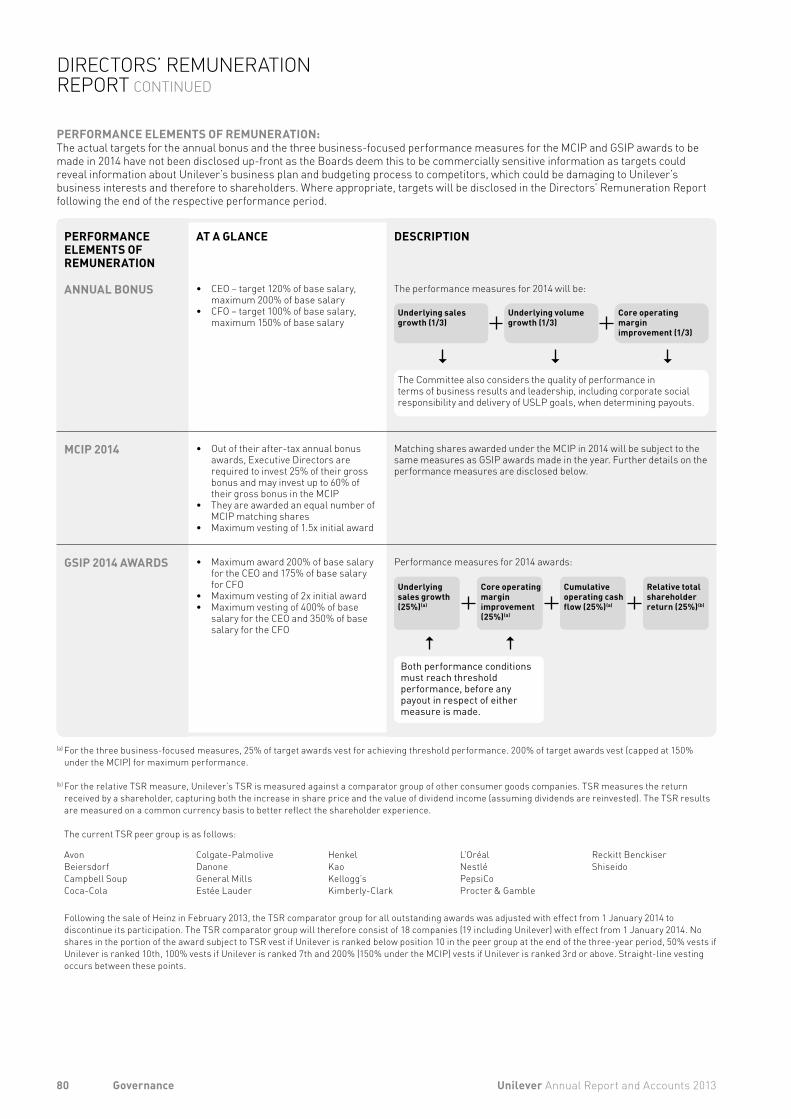
PERFORMANCE ELEMENTS OF REMUNERATION:The actual targets for the annual bonus and the three business-focused performance measures for the MCIP and GSIP awards to be made in 2014 have not been disclosed up-front as the Boards deem this to be commercially sensitive information as targets could reveal information about Unilever’s business plan and budgeting process to competitors, which could be damaging to Unilever’s business interests and therefore to shareholders. Where appropriate, targets will be disclosed in the Directors’ Remuneration Report following the end of the respective performance period.
PERFORMANCE ELEMENTS OF REMUNERATION
AT A GLANCE DESCRIPTION
ANNUAL BONUS • CEO – target 120% of base salary, maximum 200% of base salary
• CFO – target 100% of base salary, maximum 150% of base salary
The performance measures for 2014 will be:
Underlying sales growth (1/3)
The Committee also considers the quality of performance in terms of business results and leadership, including corporate social responsibility and delivery of USLP goals, when determining payouts.
Underlying volume growth (1/3)
Core operating margin improvement (1/3)
MCIP 2014 • Out of their after-tax annual bonus awards, Executive Directors are required to invest 25% of their gross bonus and may invest up to 60% of their gross bonus in the MCIP
• They are awarded an equal number of MCIP matching shares
• Maximum vesting of 1.5x initial award
Matching shares awarded under the MCIP in 2014 will be subject to the same measures as GSIP awards made in the year. Further details on the performance measures are disclosed below.
GSIP 2014 AWARDS • Maximum award 200% of base salary for the CEO and 175% of base salary for CFO
• Maximum vesting of 2x initial award • Maximum vesting of 400% of base
salary for the CEO and 350% of base salary for the CFO
Performance measures for 2014 awards:
Underlying sales growth (25%)(a)
Core operating margin improvement (25%)(a)
Cumulative operating cash flow (25%)(a)
Relative total shareholder return (25%)(b)
Both performance conditions must reach threshold performance, before any payout in respect of either measure is made.
(a) For the three business-focused measures, 25% of target awards vest for achieving threshold performance. 200% of target awards vest (capped at 150% under the MCIP) for maximum performance.
(b) For the relative TSR measure, Unilever’s TSR is measured against a comparator group of other consumer goods companies. TSR measures the return received by a shareholder, capturing both the increase in share price and the value of dividend income (assuming dividends are reinvested). The TSR results are measured on a common currency basis to better reflect the shareholder experience. The current TSR peer group is as follows: Avon Colgate-Palmolive Henkel L’Oréal Reckitt BenckiserBeiersdorf Danone Kao Nestlé Shiseido Campbell Soup General Mills Kellogg’s PepsiCoCoca-Cola Estée Lauder Kimberly-Clark Procter & Gamble
Following the sale of Heinz in February 2013, the TSR comparator group for all outstanding awards was adjusted with effect from 1 January 2014 to
discontinue its participation. The TSR comparator group will therefore consist of 18 companies (19 including Unilever) with effect from 1 January 2014. No shares in the portion of the award subject to TSR vest if Unilever is ranked below position 10 in the peer group at the end of the three-year period, 50% vests if Unilever is ranked 10th, 100% vests if Unilever is ranked 7th and 200% (150% under the MCIP) vests if Unilever is ranked 3rd or above. Straight-line vesting occurs between these points.
80 Unilever Annual Report and Accounts 2013Governance
DIRECTORS’ REMUNERATION REPORT CONTINUED
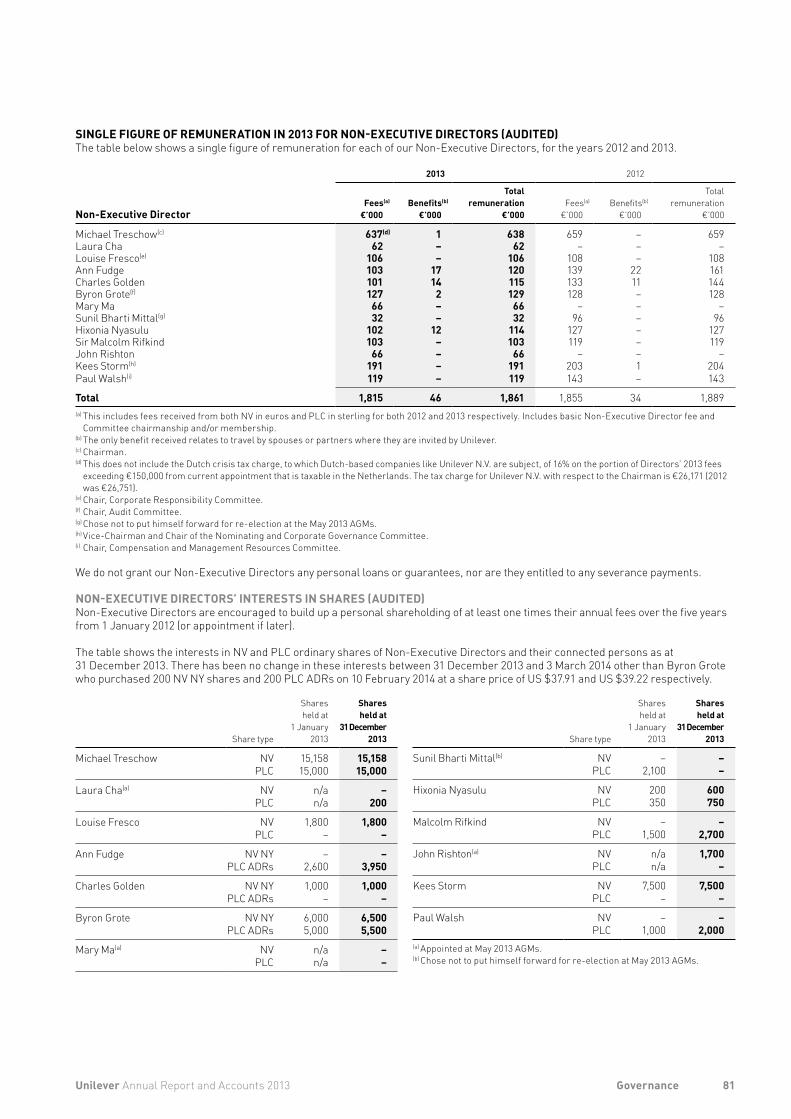
SINGLE FIGURE OF REMUNERATION IN 2013 FOR NON-EXECUTIVE DIRECTORS (AUDITED)The table below shows a single figure of remuneration for each of our Non-Executive Directors, for the years 2012 and 2013.
2013 2012
Non-Executive DirectorFees(a)
€’000Benefits(b)
€’000
Total remuneration
€’000Fees(a)
€’000Benefits(b)
€’000
Total remuneration
€’000
Michael Treschow(c) 637(d) 1 638 659 – 659Laura Cha 62 – 62 – – –Louise Fresco(e) 106 – 106 108 – 108Ann Fudge 103 17 120 139 22 161Charles Golden 101 14 115 133 11 144Byron Grote(f) 127 2 129 128 – 128Mary Ma 66 – 66 – – –Sunil Bharti Mittal(g) 32 – 32 96 – 96Hixonia Nyasulu 102 12 114 127 – 127Sir Malcolm Rifkind 103 – 103 119 – 119John Rishton 66 – 66 – – –Kees Storm(h) 191 – 191 203 1 204Paul Walsh(i) 119 – 119 143 – 143
Total 1,815 46 1,861 1,855 34 1,889(a) This includes fees received from both NV in euros and PLC in sterling for both 2012 and 2013 respectively. Includes basic Non-Executive Director fee and
Committee chairmanship and/or membership. (b) The only benefit received relates to travel by spouses or partners where they are invited by Unilever. (c) Chairman.(d) This does not include the Dutch crisis tax charge, to which Dutch-based companies like Unilever N.V. are subject, of 16% on the portion of Directors’ 2013 fees
exceeding €150,000 from current appointment that is taxable in the Netherlands. The tax charge for Unilever N.V. with respect to the Chairman is €26,171 (2012 was €26,751).
(e) Chair, Corporate Responsibility Committee.(f) Chair, Audit Committee.(g) Chose not to put himself forward for re-election at the May 2013 AGMs.(h) Vice-Chairman and Chair of the Nominating and Corporate Governance Committee.(i) Chair, Compensation and Management Resources Committee.
We do not grant our Non-Executive Directors any personal loans or guarantees, nor are they entitled to any severance payments.
NON-EXECUTIVE DIRECTORS’ INTERESTS IN SHARES (AUDITED)Non-Executive Directors are encouraged to build up a personal shareholding of at least one times their annual fees over the five years from 1 January 2012 (or appointment if later).
The table shows the interests in NV and PLC ordinary shares of Non-Executive Directors and their connected persons as at 31 December 2013. There has been no change in these interests between 31 December 2013 and 3 March 2014 other than Byron Grote who purchased 200 NV NY shares and 200 PLC ADRs on 10 February 2014 at a share price of US $37.91 and US $39.22 respectively.
Share type
Shares held at
1 January 2013
Shares held at
31 December 2013
Michael Treschow NV 15,158 15,158PLC 15,000 15,000
Laura Cha(a) NV n/a –PLC n/a 200
Louise Fresco NV 1,800 1,800PLC – –
Ann Fudge NV NY – –PLC ADRs 2,600 3,950
Charles Golden NV NY 1,000 1,000PLC ADRs – –
Byron Grote NV NY 6,000 6,500PLC ADRs 5,000 5,500
Mary Ma(a) NV n/a –PLC n/a –
Share type
Shares held at
1 January 2013
Shares held at
31 December 2013
Sunil Bharti Mittal(b) NV – –PLC 2,100 –
Hixonia Nyasulu NV 200 600PLC 350 750
Malcolm Rifkind NV – –PLC 1,500 2,700
John Rishton(a) NV n/a 1,700PLC n/a –
Kees Storm NV 7,500 7,500PLC – –
Paul Walsh NV – –PLC 1,000 2,000
(a) Appointed at May 2013 AGMs.(b) Chose not to put himself forward for re-election at May 2013 AGMs.
81Unilever Annual Report and Accounts 2013 Governance
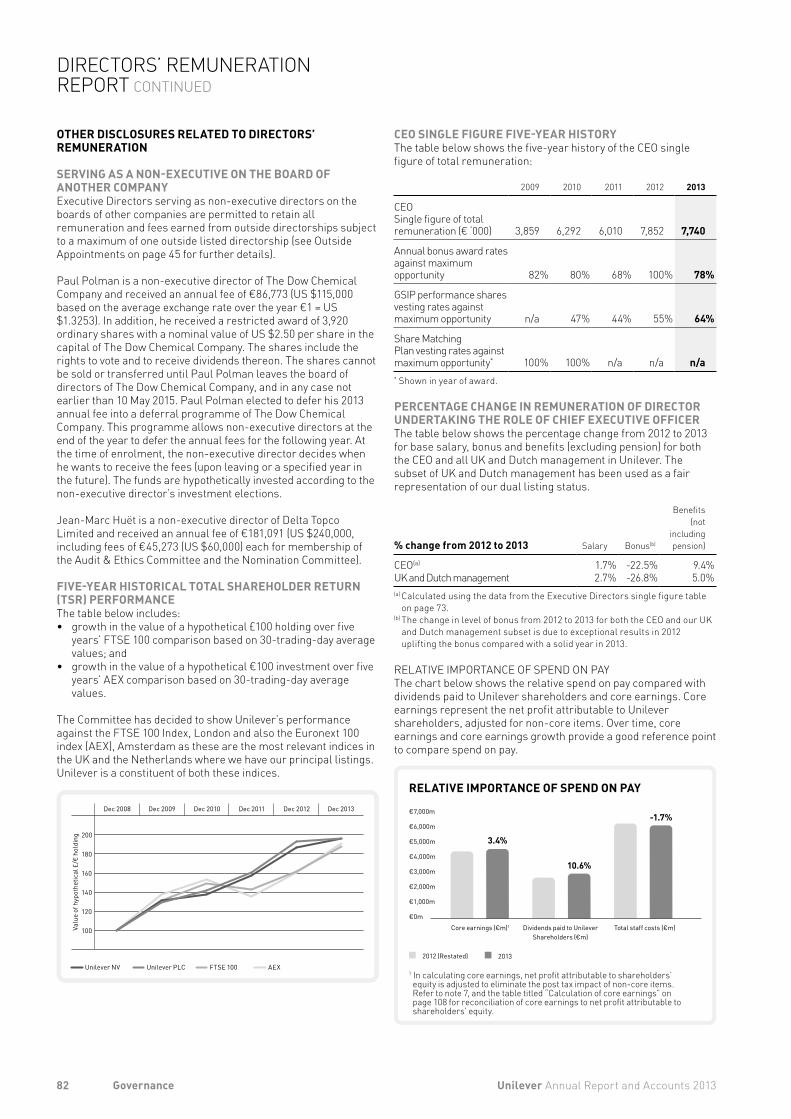
OTHER DISCLOSURES RELATED TO DIRECTORS’ REMUNERATION
SERVING AS A NON-EXECUTIVE ON THE BOARD OF ANOTHER COMPANYExecutive Directors serving as non-executive directors on the boards of other companies are permitted to retain all remuneration and fees earned from outside directorships subject to a maximum of one outside listed directorship (see Outside Appointments on page 45 for further details).
Paul Polman is a non-executive director of The Dow Chemical Company and received an annual fee of €86,773 (US $115,000 based on the average exchange rate over the year €1 = US $1.3253). In addition, he received a restricted award of 3,920 ordinary shares with a nominal value of US $2.50 per share in the capital of The Dow Chemical Company. The shares include the rights to vote and to receive dividends thereon. The shares cannot be sold or transferred until Paul Polman leaves the board of directors of The Dow Chemical Company, and in any case not earlier than 10 May 2015. Paul Polman elected to defer his 2013 annual fee into a deferral programme of The Dow Chemical Company. This programme allows non-executive directors at the end of the year to defer the annual fees for the following year. At the time of enrolment, the non-executive director decides when he wants to receive the fees (upon leaving or a specified year in the future). The funds are hypothetically invested according to the non-executive director’s investment elections.
Jean-Marc Huët is a non-executive director of Delta Topco Limited and received an annual fee of €181,091 (US $240,000, including fees of €45,273 (US $60,000) each for membership of the Audit & Ethics Committee and the Nomination Committee).
FIVE-YEAR HISTORICAL TOTAL SHAREHOLDER RETURN (TSR) PERFORMANCEThe table below includes:• growth in the value of a hypothetical £100 holding over five
years’ FTSE 100 comparison based on 30-trading-day average values; and
• growth in the value of a hypothetical €100 investment over five years’ AEX comparison based on 30-trading-day average values.
The Committee has decided to show Unilever’s performance against the FTSE 100 Index, London and also the Euronext 100 index (AEX), Amsterdam as these are the most relevant indices in the UK and the Netherlands where we have our principal listings. Unilever is a constituent of both these indices.
Unilever NV Unilever PLC FTSE 100 AEX
Valu
e of
hyp
othe
tical
£/€
hol
ding
Dec 2008 Dec 2009 Dec 2010 Dec 2011 Dec 2012 Dec 2013
100
120
140
160
180
200
CEO SINGLE FIGURE FIVE-YEAR HISTORYThe table below shows the five-year history of the CEO single figure of total remuneration:
2009 2010 2011 2012 2013
CEOSingle figure of totalremuneration (€ ‘000) 3,859 6,292 6,010 7,852 7,740
Annual bonus award rates against maximum opportunity 82% 80% 68% 100% 78%
GSIP performance shares vesting rates against maximum opportunity n/a 47% 44% 55% 64%
Share Matching Plan vesting rates against maximum opportunity* 100% 100% n/a n/a n/a* Shown in year of award.
PERCENTAGE CHANGE IN REMUNERATION OF DIRECTOR UNDERTAKING THE ROLE OF CHIEF EXECUTIVE OFFICERThe table below shows the percentage change from 2012 to 2013 for base salary, bonus and benefits (excluding pension) for both the CEO and all UK and Dutch management in Unilever. The subset of UK and Dutch management has been used as a fair representation of our dual listing status.
% change from 2012 to 2013 Salary Bonus(b)
Benefits (not
including pension)
CEO(a) 1.7% -22.5% 9.4%UK and Dutch management 2.7% -26.8% 5.0%(a) Calculated using the data from the Executive Directors single figure table
on page 73.(b) The change in level of bonus from 2012 to 2013 for both the CEO and our UK
and Dutch management subset is due to exceptional results in 2012 uplifting the bonus compared with a solid year in 2013.
RELATIVE IMPORTANCE OF SPEND ON PAY The chart below shows the relative spend on pay compared with dividends paid to Unilever shareholders and core earnings. Core earnings represent the net profit attributable to Unilever shareholders, adjusted for non-core items. Over time, core earnings and core earnings growth provide a good reference point to compare spend on pay.
RELATIVE IMPORTANCE OF SPEND ON PAY
Core earnings (€m)1 Dividends paid to Unilever Shareholders (€m)
Total staff costs (€m)
3.4%
10.6%
-1.7%
2012 (Restated) 2013
€0m
€1,000m
€2,000m
€3,000m
€4,000m
€5,000m
€6,000m
€7,000m
1 In calculating core earnings, net profit attributable to shareholders’ equity is adjusted to eliminate the post tax impact of non-core items. Refer to note 7, and the table titled “Calculation of core earnings” on page 108 for reconciliation of core earnings to net profit attributable to shareholders’ equity.
82 Unilever Annual Report and Accounts 2013Governance
DIRECTORS’ REMUNERATION REPORT CONTINUED
THE COMPENSATION AND MANAGEMENT RESOURCES COMMITTEE During 2013, the Committee comprised four Non-Executive Directors: Paul Walsh (Committee Chairman), Michael Treschow, Ann Fudge and Kees Storm.
The Committee reviewed its terms of reference during the year. The Committee is concerned with:• the remuneration policy for the ULE and senior corporate
executives;• the remuneration and benefits of the Directors and other
members of the ULE;• the design and terms of all long-term incentive plans;• leadership development, especially of the ULE and senior
corporate executives; and• performance evaluation of the members of the ULE.
The Committee’s revised terms of reference are contained within ‘The Governance of Unilever’, and are also set out on our website at www.unilever.com/investorrelations/corp_governance.
During the year, the Committee reviewed its own effectiveness and concluded that it was broadly operating effectively. Where appropriate, the Committee agreed steps to enhance its effectiveness.
ADVISERSWhile it is the Committee’s responsibility to exercise independent judgement, the Committee does request advice from management and professional advisers, as appropriate, to ensure that its decisions are fully informed given the internal and external environment.
The Committee appointed Deloitte LLP to provide independent advice on various matters it considered. Deloitte was appointed in 2011 following an interview process by the Committee. During the year, Deloitte also provided other services to Unilever primarily in relation to the Directors’ Remuneration Report. The wider Deloitte firm has also provided tax and consultancy services including tax compliance, transfer pricing, financial transformation, IT restructuring and sourcing strategies advice to Unilever. Deloitte is a member of the Remuneration Consultants Group and, as such, voluntarily operates under the code of conduct in relation to executive remuneration consulting in the UK. Further details can be found at www.remunerationconsultantsgroup.com.
The Committee is satisfied that the Deloitte LLP engagement partner and team, which provide remuneration advice to the Committee, do not have connections with Unilever N.V. or Unilever PLC that might impair their independence. The Committee reviewed the potential for conflicts of interest and judged that there were appropriate safeguards against such conflicts.
The fees paid to Deloitte LLP in relation to advice provided to the Committee in the year up to 31 December 2013 were £47,000. This figure is calculated based on time spent and expenses incurred for the majority of advice provided, but on occasion for specific projects a fixed fee may be agreed.
During the year, the Committee also sought input from the Chief Executive Officer (Paul Polman), the Chief Human Resources Officer (Doug Baillie) and the SVP Global Head of Reward (Peter Newhouse) on various subjects including the remuneration of senior management. No individual was present when his or her own remuneration was being discussed to ensure a conflict of interest did not arise. The Committee also received legal and governance advice from the Group Secretary (Tonia Lovell).
SHAREHOLDER VOTING Unilever remains committed to ongoing shareholder dialogue and takes an active interest in voting outcomes. In the event of a substantial vote against a resolution in relation to Directors’ remuneration, Unilever would seek to understand the reasons for any such vote and would set out in the following Annual Report and Accounts any actions in response to it.
The following table sets out actual voting in respect of our previous report:
Voting outcome (% of votes) For Against
2012 Directors’ Remuneration Report (2013 AGM) PLC 95.39% 4.61%
32,520,664 votes were withheld (c. 2.5% of share capital).
The Directors’ Remuneration Report is not subject to a shareholder vote in the Netherlands. With effect from 1 January 2014, the implementation of the Remuneration Policy will be a discussion item prior to the adoption of the Annual Accounts.
The Directors’ Remuneration Report has been approved by the Boards and signed on their behalf by Tonia Lovell, Group Secretary.
83Unilever Annual Report and Accounts 2013 Governance
Notes to the consolidated financial statements (continued)
15 Capital and funding 115 15A Share capital 116 15B Equity 117 15C Financial liabilities 118
16 Treasury risk management 120 16A Management of liquidity risk 120 16B Management of market risk 122 16C Derivatives and hedging 124
17 Investment and return 125 17A Financial assets 126 17B Credit risk 127
18 Financial instruments fair value risk 127
19 Provisions 129
20 Commitments and contingent liabilities 129
21 Acquisitions and disposals 131
22 Assets and liabilities held for sale 132
23 Related party transactions 133
24 Remuneration of auditors 133
25 Events after the balance sheet date 133
26 Principal group companies and non-current investments 134
Independent auditor’s report – Unilever N.V. 136
Company accounts – Unilever N.V. 137
Notes to the Company accounts – Unilever N.V. 138
Further statutory and other information – Unilever N.V. 141
Independent auditor’s report – Unilever PLC 142
Company accounts – Unilever PLC 143
Notes to the Company accounts – Unilever PLC 144
Shareholder information 146
CONTENTSStatement of Directors’ responsibilities 85
Independent auditors’ reports 86
Consolidated income statement 90
Consolidated statement of comprehensive income 90
Consolidated statement of changes in equity 91
Consolidated balance sheet 92
Consolidated cash flow statement 93
Notes to the consolidated financial statements 94
1 Accounting information and policies 94
2 Segment information 96
3 Gross profit and operating costs 98
4 Employees 99 4A Staff and management costs 99 4B Pensions and similar obligations 99 4C Share-based compensation plans 104
5 Net finance costs 105
6 Taxation 106 6A Income tax 106 6B Deferred tax 106 6C Tax on other comprehensive income 108
7 Combined earnings per share 108
8 Dividends on ordinary capital 109
9 Goodwill and intangible assets 109
10 Property, plant and equipment 111
11 Other non-current assets 112
12 Inventories 113
13 Trade and other current receivables 113
14 Trade payables and other liabilities 114
84 Unilever Annual Report and Accounts 2013Financial statements
FINANCIAL STATEMENTS
DIRECTORS’ RESPONSIBILITY STATEMENTEach of the Directors confirms that, to the best of his or her knowledge:• The Annual Report and Accounts, taken as a whole, is fair,
balanced and understandable, and provides the information necessary for shareholders to assess the Group’s performance, business model and strategy;
• The financial statements which have been prepared in accordance with International Financial Reporting Standards as adopted by the EU and as issued by the International Accounting Standards Board (in the case of the consolidated financial statements) and UK accounting standards (in the case of the PLC parent company accounts) and UK accounting standards and Part 9 of Book 2 of the Dutch Civil Code (in the case of the NV parent company accounts), give a true and fair view of the assets, liabilities, financial position and profit or loss of the Group and the NV and PLC entities taken as a whole; and
• The Strategic Report includes a fair review of the development and performance of the business and the position of the Group and the NV and PLC entities taken as a whole, together with a description of the principal risks and uncertainties they face.
The Directors and their roles are listed on pages 40 and 42.
GOING CONCERNThe activities of the Group, together with the factors likely to affect its future development, performance, the financial position of the Group, its cash flows, liquidity position and borrowing facilities are described in the Strategic Report on pages 2 to 33. In addition, we describe in notes 15 to 18 on pages 115 to 129 the Group’s objectives, policies and processes for managing its capital; its financial risk management objectives; details of its financial instruments and hedging activities and its exposures to credit and liquidity risk.
The Group has considerable financial resources together with established business relationships with many customers and suppliers in countries throughout the world. As a consequence, the Directors believe that the Group is well placed to manage its business risks successfully despite the current uncertain outlook.
After making enquiries, the Directors have a reasonable expectation that the Group has adequate resources to continue in operational existence for the foreseeable future. Accordingly, they continue to adopt the going concern basis in preparing this Annual Report and Accounts.
INTERNAL AND DISCLOSURE CONTROLS AND PROCEDURESPlease refer to pages 34 to 39 for a discussion of Unilever’s principal risk factors and to pages 36 to 39 for commentary on the Group’s approach to risk management and control.
ANNUAL ACCOUNTSThe Directors are required by Part 9 of Book 2 of the Civil Code in the Netherlands and the UK Companies Act 2006 to prepare accounts for each financial year which give a true and fair view of the state of affairs of the Unilever Group, and the NV and PLC entities, as at the end of the financial year and of the profit or loss and cash flows for that year.
The Directors consider that, in preparing the accounts, the Group and the NV and PLC entities have used the most appropriate accounting policies, consistently applied and supported by reasonable and prudent judgements and estimates, and that all International Financial Reporting Standards as adopted by the EU and as issued by the International Accounting Standards Board (in the case of the consolidated financial statements), UK accounting standards (in the case of the parent company accounts) and Dutch law (in the case of the NV parent company accounts) which they consider to be applicable have been followed.
The Directors have responsibility for ensuring that NV and PLC keep accounting records which disclose with reasonable accuracy their financial position and which enable the Directors to ensure that the accounts comply with the relevant legislation. They also have a general responsibility for taking such steps as are reasonably open to them to safeguard the assets of the Group, and to prevent and detect fraud and other irregularities.
This statement, which should be read in conjunction with the Independent Auditors’ reports, is made with a view to distinguishing for shareholders the respective responsibilities of the Directors and of the auditors in relation to the accounts.
A copy of the financial statements of the Unilever Group is placed on our website at www.unilever.com/investorrelations. The maintenance and integrity of the website are the responsibility of the Directors, and the work carried out by the auditors does not involve consideration of these matters. Accordingly, the auditors accept no responsibility for any changes that may have occurred to the financial statements since they were initially placed on the website. Legislation in the UK and the Netherlands governing the preparation and dissemination of financial statements may differ from legislation in other jurisdictions.
UK law sets out additional responsibilities for the Directors of PLC regarding disclosure of information to auditors. Disclosure in respect of these responsibilities is made on page 50.
85Unilever Annual Report and Accounts 2013 Financial statements
STATEMENT OF DIRECTORS’ RESPONSIBILITIES
We believe that the audit evidence we have obtained is sufficient and appropriate to provide a basis for our audit opinion.
OPINION WITH RESPECT TO THE CONSOLIDATED FINANCIAL STATEMENTSIn our opinion, the consolidated financial statements give a true and fair view of the financial position of Unilever Group as at 31 December 2013, and of its result and its cash flows for the year then ended in accordance with International Financial Reporting Standards as adopted by the European Union and as issued by the International Accounting Standards Board and with Part 9 of Book 2 of the Dutch Civil Code.
SEPARATE REPORT ON COMPANY ACCOUNTSWe have reported separately on the company accounts of Unilever N.V. for the year ended 31 December 2013.
OVERVIEW OF OUR AUDIT APPROACHFor an overview of our joint audit approach, which includes certain thresholds set for materiality, an overview of the scope of our audit and areas of particular audit focus, we refer to the paragraph ‘Overview of our audit approach’ in the Independent Auditor’s Report to the Members of Unilever PLC as set out on page 87.
REPORT ON OTHER LEGAL AND REGULATORY REQUIREMENTSPursuant to the legal requirement under Section 2: 393 sub 5 at e and f of the Dutch Civil Code, we have no deficiencies to report as a result of our examination whether the Report of the Directors (comprising the sections Strategic Report and Governance), to the extent we can assess, has been prepared in accordance with Part 9 of Book 2 of this Code, and whether the information as required under Section 2: 392 sub 1 at b-h has been annexed. Further we report that the Report of the Directors, to the extent we can assess, is consistent with the consolidated financial statements as required by Section 2: 391 sub 4 of the Dutch Civil Code.
Amsterdam, 4 March 2014PricewaterhouseCoopers Accountants N.V.
Original has been signed by P J van Mierlo RA
INDEPENDENT AUDITOR’S REPORTTO: THE GENERAL MEETING OF UNILEVER N.V.
REPORT ON THE CONSOLIDATED FINANCIAL STATEMENTSWe have audited the accompanying consolidated financial statements 2013 as set out on pages 90 to 135 which are part of the Annual Report and Accounts 2013 of the Unilever Group for the year ended 31 December 2013, which comprise the consolidated income statement, consolidated statement of comprehensive income, consolidated statement of changes in equity, consolidated balance sheet, consolidated cash flow statement and the notes to the consolidated financial statements, comprising a summary of significant accounting policies and other explanatory information.
DIRECTORS’ RESPONSIBILITYThe Directors are responsible for the preparation and fair presentation of these consolidated financial statements in accordance with International Financial Reporting Standards as adopted by the European Union and as issued by the International Accounting Standards Board and with Part 9 of Book 2 of the Dutch Civil Code, and for the preparation of the Report of the Directors in accordance with Part 9 of Book 2 of the Dutch Civil Code. Furthermore, the Directors are responsible for such internal control as they determine is necessary to enable the preparation of the consolidated financial statements that are free from material misstatement, whether due to fraud or error.
AUDITOR’S RESPONSIBILITYOur responsibility is to express an opinion on these consolidated financial statements based on our audit. We conducted our audit in accordance with Dutch law, including the Dutch Standards on Auditing. This requires that we comply with ethical requirements and plan and perform the audit to obtain reasonable assurance about whether the consolidated financial statements are free from material misstatement.
An audit involves performing procedures to obtain audit evidence about the amounts and disclosures in the consolidated financial statements. The procedures selected depend on the auditor’s judgement, including the assessment of the risks of material misstatement of the consolidated financial statements, whether due to fraud or error. In making those risk assessments, the auditor considers internal control relevant to the company’s preparation and fair presentation of the consolidated financial statements in order to design audit procedures that are appropriate in the circumstances, but not for the purpose of expressing an opinion on the effectiveness of the company’s internal control. An audit also includes evaluating the appropriateness of accounting policies used and the reasonableness of accounting estimates made by the Directors, as well as evaluating the overall presentation of the consolidated financial statements.
86 Unilever Annual Report and Accounts 2013Financial statements
INDEPENDENT AUDITOR’S REPORT NETHERLANDS
OVERVIEW OF OUR AUDIT APPROACH
MATERIALITYWe set certain thresholds for materiality. These helped us to determine the nature, timing and extent of our audit procedures and to evaluate the effect of misstatements, both individually and on the financial statements as a whole.
Based on our professional judgement, we determined materiality for the consolidated financial statements as a whole to be €330 million. This represents approximately 5% of profit before tax.
We agreed with the Audit Committee that we would report to them misstatements identified during our audit above €25 million as well as misstatements below that amount that, in our view, warranted reporting for qualitative reasons.
OVERVIEW OF THE SCOPE OF OUR AUDITThe Group is primarily structured and monitored across four key categories being Personal Care, Foods, Refreshment and Home Care. The consolidated financial statements are a consolidation of the Group’s reporting units which include operating businesses, centralised functions and supply chain entities.
In establishing the overall approach to the Group audit, we determined the type of work that needed to be performed at reporting units. We also determined the level of involvement we needed to have in the audit work at those reporting units to be able to conclude whether sufficient appropriate audit evidence had been obtained as a basis for our opinion on the consolidated financial statements as a whole.
Accordingly, we identified 11 operating businesses which, in our view, required an audit of their complete financial information, either due to their size or their risk characteristics. We also performed specific audit procedures on inventory at the Group’s three supply chain entities and specific risk based procedures on other financial statement line items in a further four operating businesses and three corporate centre entities.
This, together with additional procedures performed on centralised functions and at the Group level, gave us the evidence we needed for our opinion on the consolidated financial statements as a whole.
AREAS OF PARTICULAR AUDIT FOCUSIn preparing the financial statements, the Directors made a number of subjective judgements, for example in respect of significant accounting estimates that involved making assumptions and considering future events that are inherently uncertain. We primarily focused our work in these areas by assessing the Directors’ judgements against available evidence, forming our own judgements, and evaluating the disclosures in the financial statements.
In our audit, we tested and examined information, using sampling and other auditing techniques, to the extent we considered necessary to provide a reasonable basis for us to draw conclusions. We obtained audit evidence through testing the effectiveness of controls, substantive procedures or a combination of both.
We considered the following areas to be those that required particular focus in the current year. This is not a complete list of all risks or areas of focus identified by our audit. We discussed these areas of focus with the Audit Committee. Their report on those matters that they considered to be significant issues in relation to the financial statements is set out on page 53.
INDEPENDENT AUDITOR’S REPORT TO THE MEMBERS OF UNILEVER PLCREPORT ON THE CONSOLIDATED FINANCIAL STATEMENTS
OUR OPINION In our opinion the consolidated financial statements:• give a true and fair view of the state of the Group’s affairs as at
31 December 2013 and of the consolidated profit and cash flows for the year then ended;
• have been properly prepared in accordance with International Financial Reporting Standards (IFRS) as adopted by the European Union; and
• have been prepared in accordance with the requirements of the Companies Act 2006 and Article 4 of the IAS Regulation.
This opinion is to be read in the context of what we say in the remainder of the report.
SEPARATE OPINION IN RELATION TO IFRS AS ISSUED BY THE IASB As explained in note 1 to the consolidated financial statements, the Group, in addition to applying IFRS as adopted by the European Union, has also applied IFRS as issued by the International Accounting Standards Board (IASB).
In our opinion the consolidated financial statements comply with IFRS as issued by the IASB.
WHAT WE HAVE AUDITEDThe consolidated financial statements, which are prepared by Unilever PLC, comprise:• the consolidated balance sheet as at 31 December 2013;• the consolidated income statement and consolidated
statement of comprehensive income for the year then ended;• the consolidated statement of changes in equity and
consolidated cash flow statement for the year then ended; and• the notes to the consolidated financial statements.
The financial reporting framework that has been applied in their preparation comprises applicable law and IFRS as adopted by the European Union.
WHAT AN AUDIT OF FINANCIAL STATEMENTS INVOLVES We conducted our audit in accordance with International Standards on Auditing (UK and Ireland) (ISAs (UK & Ireland)).
An audit involves obtaining evidence about the amounts and disclosures in the financial statements sufficient to give reasonable assurance that the financial statements are free from material misstatement, whether caused by fraud or error. This includes an assessment of:• whether the accounting policies are appropriate to the Group’s
circumstances and have been consistently applied and adequately disclosed;
• the reasonableness of significant accounting estimates made by the Directors; and
• the overall presentation of the financial statements.
In addition, we read all the financial and non-financial information in the Annual Report and Accounts (the Annual Report) to identify material inconsistencies with the audited consolidated financial statements and to identify any information that is apparently materially incorrect based on, or materially inconsistent with, the knowledge acquired by us in the course of performing the audit. If we become aware of any apparent material misstatements or inconsistencies we consider the implications for our report.
87Unilever Annual Report and Accounts 2013 Financial statements
INDEPENDENT AUDITOR’S REPORT UNITED KINGDOM
AREA OF FOCUS HOW THE SCOPE OF OUR AUDIT ADDRESSED THE AREA OF FOCUS
Provisions and contingences – indirect tax provisionsDue to the complexity of certain local tax regimes, particularly in emerging markets, the Group has potential exposures relating to indirect taxes.
We focused on this area because certain exposures and the related provisions recorded within the financial statements are material, involve a high level of judgement and are subject to uncertainty. (Refer to note 19 to the financial statements.)
We obtained a detailed understanding of the significant potential exposures and challenged the appropriateness of management’s assumptions and resulting provisions. We assessed the levels of provisions having regard to correspondence between Unilever and local tax authorities and, where relevant, third party legal opinions.
Provisions and contingences – direct tax provisionsThe Directors are required to exercise significant judgement when determining the appropriate amount to provide in respect of potential direct tax exposures relating to challenges by the tax authorities on inter-company transfer pricing arrangements and global supply chains, particularly in emerging markets. (Refer to note 19 to the financial statements.)
We focused on this area because changes in assumptions can materially affect the levels of provisions recorded in the financial statements.
We obtained a detailed understanding of the Group’s tax strategy and assessed key technical tax risks related to business and legislative developments including reading the Group’s transfer pricing arrangements. We recalculated direct tax provisions and determined whether the calculations were in line with the Group’s methodology and principles had been applied consistently. We challenged the key underlying assumptions, particularly in territories where new tax structures are in place, having due regard to correspondence between Unilever and local tax authorities.
Pensions – obligations and assumptionsIn many countries the Group operates defined benefit pension plans, giving rise to pension plan liabilities.
We focused on this area because of the magnitude of the pension plan liability in the context of the overall balance sheet. Measurement of the balance requires a significant level of judgement and technical expertise in choosing appropriate assumptions. Changes in key assumptions can have a material impact on the liability recorded. (Refer to note 4B to the financial statements.)
For the four largest defined benefit pension plans, we considered and challenged the reasonableness of key actuarial assumptions (including pension increase, salary increases, inflation, discount rates and mortality), using benchmark ranges based on market conditions and expectations at the balance sheet date and comparison across the wider pensions industry. We also confirmed whether the methods used by management to determine key assumptions had been consistently applied year-on-year and evaluated the rationale for any changes in approach. We tested the reconciliation of the opening to closing liability for accuracy taking into account the movements in key assumptions over the year and any changes made to benefits provided within the schemes.
Goodwill and intangible assets – impairment testingThe Directors’ assess the carrying value of goodwill and indefinite lived intangible assets and conduct an annual impairment review. (Refer to note 9 to the financial statements.)
We focused on this area because of the materiality of these assets, particularly in the three cash generating units relating to Foods, and because it involves complex and subjective judgements by the Directors about near term and long term sales growth rates, commodity prices and the projected operating margins.
We evaluated the Directors’ cash flow forecasts; including comparing them to the latest Board approved budgets. We challenged the Directors’ key assumptions, including the long term growth rate and the discount rate. We performed sensitivity analysis around these assumptions to ascertain the extent of change that either individually or collectively would be required for the relevant asset to be impaired. We then considered the likelihood of such movement in those key assumptions arising.
Fraud in revenue recognition ISAs (UK & Ireland) presume there is a risk of fraud in revenue recognition because of the pressure management may feel to achieve the planned results.
Unilever’s focus on revenue targets as a key performance measure creates incentive for revenue to be recorded in the incorrect period. Therefore, we focused on whether transactions have been recorded in the period in which the Group becomes entitled to record revenue.
We challenged the appropriateness of management’s revenue recognition policies, particularly regarding the recording of sales around the year end date. We performed a combination of testing the financial controls and substantive testing of revenue recorded during the year, using sampling and data auditing techniques, and testing of sales transactions and credit notes around the year end date to determine whether the criteria for recording revenue had been met. We performed trend analysis on weekly sales and returns reports to identify unusual patterns of sales transactions before the year end date and returns after the year end date. We tested manual adjustments impacting revenue to determine whether these had occurred in the period and met the Group’s revenue recognition policies.
Risk of management override of internal controls ISAs (UK & Ireland) require that we consider this.
We tested key reconciliations and manual journal entries. We examined the significant accounting estimates and judgements for evidence of bias by the Directors that may represent a risk of material misstatement due to fraud. We assessed the overall control environment of the Group, including the arrangements for staff to “whistle-blow” inappropriate actions, and interviewed senior management and the Group’s internal audit function. We incorporated a number of unpredictable audit procedures into our work, including the audit of certain operations or balances at short notice.
88 Unilever Annual Report and Accounts 2013Financial statements
INDEPENDENT AUDITOR’S REPORT UNITED KINGDOM CONTINUED
OTHER INFORMATION IN THE ANNUAL REPORTUnder ISAs (UK & Ireland), we are required to report to you if, in our opinion, information in the Annual Report is:• materially inconsistent with the information in the audited
consolidated financial statements; or• apparently materially incorrect based on, or materially
inconsistent with, our knowledge of the Group acquired in the course of performing our audit; or
• is otherwise misleading.
We have no exceptions to report arising from this responsibility.
RESPONSIBILITIES FOR THE FINANCIAL STATEMENTS AND THE AUDIT
OUR RESPONSIBILITIES AND THOSE OF THE DIRECTORS As explained more fully in the Directors’ Responsibilities Statement set out on page 85, the Directors are responsible for the preparation of the consolidated financial statements and for being satisfied that they give a true and fair view.
Our responsibility is to audit and express an opinion on the consolidated financial statements in accordance with applicable law and ISAs (UK & Ireland). Those standards require us to comply with the Auditing Practices Board’s Ethical Standards for Auditors.
This report, including the opinions, has been prepared for and only for the Company’s members as a body in accordance with Chapter 3 of Part 16 of the Companies Act 2006 and for no other purpose. We do not, in giving these opinions, accept or assume responsibility for any other purpose or to any other person to whom this report is shown or into whose hands it may come save where expressly agreed by our prior consent in writing.
OTHER MATTER We have reported separately on the parent company financial statements of Unilever PLC for the year ended 31 December 2013 and on the information in the Directors’ Remuneration Report that is described as having been audited.
John Baker (Senior Statutory Auditor)for and on behalf of PricewaterhouseCoopers LLPChartered Accountants and Statutory AuditorsLondon4 March 2014
GOING CONCERNUnder the Listing Rules we are required to review the Directors’ statement, set out on page 85, in relation to going concern. We have nothing to report having performed our review.
As noted in the Directors’ statement, the Directors have concluded that it is appropriate to prepare the consolidated financial statements using the going concern basis of accounting. The going concern basis presumes that the Group has adequate resources to remain in operation, and that the Directors intend it to do so, for at least one year from the date the financial statements were signed. As part of our audit we have concluded that the Directors’ use of the going concern basis is appropriate.
However, because not all future events or conditions can be predicted, these statements are not a guarantee as to the Group’s ability to continue as a going concern.
OPINION ON MATTERS PRESCRIBED BY THE COMPANIES ACT 2006In our opinion the information given in the Strategic Report and the Directors’ Report for the financial year for which the consolidated financial statements are prepared is consistent with the consolidated financial statements.
OTHER MATTERS ON WHICH WE ARE REQUIRED TO REPORT BY EXCEPTION
ADEQUACY OF INFORMATION AND EXPLANATIONS RECEIVEDUnder the Companies Act 2006 we are required to report to you if, in our opinion we have not received all the information and explanations we require for our audit. We have no exceptions to report arising from this responsibility.
DIRECTORS’ REMUNERATIONUnder the Companies Act 2006 we are required to report to you if, in our opinion, certain disclosures of Directors’ remuneration specified by law have not been made, and under the Listing Rules we are required to review certain elements of the report to shareholders by the Board on Directors’ remuneration. We have no exceptions to report arising from these responsibilities.
CORPORATE GOVERNANCE STATEMENTUnder the Listing Rules we are required to review the part of the Corporate Governance Statement relating to the Parent Company’s compliance with nine provisions of the UK Corporate Governance Code (the Code). We have nothing to report having performed our review.
On page 85 of the Annual Report, as required by the Code Provision C.1.1, the Directors state that they consider the Annual Report taken as a whole to be fair, balanced and understandable and provides the information necessary for members to assess the Group’s performance, business model and strategy. On page 54, as required by C.3.8 of the Code, the Audit Committee has set out the significant issues that it considered in relation to the financial statements, and how they were addressed. Under ISAs (UK & Ireland), we are required to report to you if, in our opinion:• the statement given by the Directors is materially inconsistent
with our knowledge of the Group acquired in the course of performing our audit; or
• the section of the Annual Report describing the work of the Audit Committee does not appropriately address matters communicated by us to the Audit Committee.
We have no exceptions to report arising from this responsibility.
89Unilever Annual Report and Accounts 2013 Financial statements
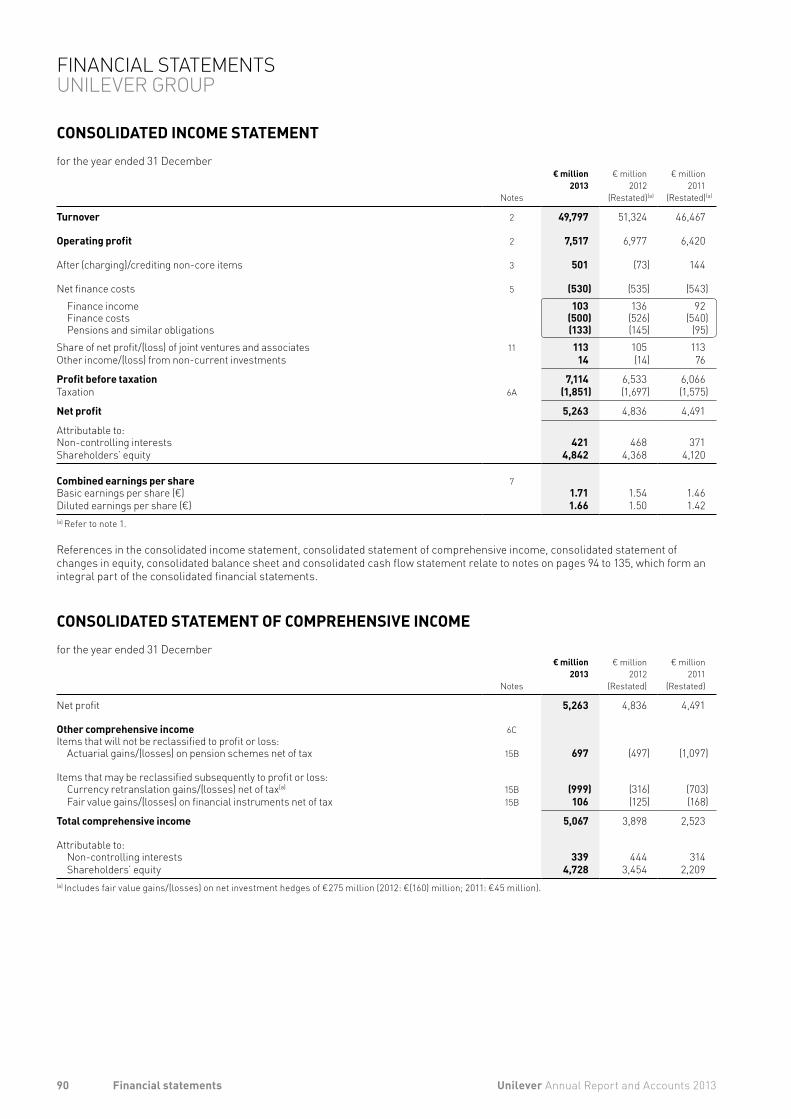
CONSOLIDATED INCOME STATEMENTfor the year ended 31 December
Notes
€ million2013
€ million2012
(Restated)(a)
€ million2011
(Restated)(a)
Turnover 2 49,797 51,324 46,467
Operating profit 2 7,517 6,977 6,420
After (charging)/crediting non-core items 3 501 (73) 144
Net finance costs 5 (530) (535) (543)Finance income 103 136 92Finance costs (500) (526) (540)Pensions and similar obligations (133) (145) (95)
Share of net profit/(loss) of joint ventures and associates 11 113 105 113Other income/(loss) from non-current investments 14 (14) 76
Profit before taxation 7,114 6,533 6,066Taxation 6A (1,851) (1,697) (1,575)
Net profit 5,263 4,836 4,491
Attributable to:Non-controlling interests 421 468 371Shareholders’ equity 4,842 4,368 4,120
Combined earnings per share 7Basic earnings per share (€) 1.71 1.54 1.46Diluted earnings per share (€) 1.66 1.50 1.42(a) Refer to note 1.
References in the consolidated income statement, consolidated statement of comprehensive income, consolidated statement of changes in equity, consolidated balance sheet and consolidated cash flow statement relate to notes on pages 94 to 135, which form an integral part of the consolidated financial statements.
CONSOLIDATED STATEMENT OF COMPREHENSIVE INCOMEfor the year ended 31 December
Notes
€ million2013
€ million2012
(Restated)
€ million2011
(Restated)
Net profit 5,263 4,836 4,491
Other comprehensive income 6CItems that will not be reclassified to profit or loss:
Actuarial gains/(losses) on pension schemes net of tax 15B 697 (497) (1,097)
Items that may be reclassified subsequently to profit or loss:Currency retranslation gains/(losses) net of tax(a) 15B (999) (316) (703)Fair value gains/(losses) on financial instruments net of tax 15B 106 (125) (168)
Total comprehensive income 5,067 3,898 2,523
Attributable to:Non-controlling interests 339 444 314Shareholders’ equity 4,728 3,454 2,209
(a) Includes fair value gains/(losses) on net investment hedges of €275 million (2012: €(160) million; 2011: €45 million).
90 Unilever Annual Report and Accounts 2013Financial statements
FINANCIAL STATEMENTS UNILEVER GROUP
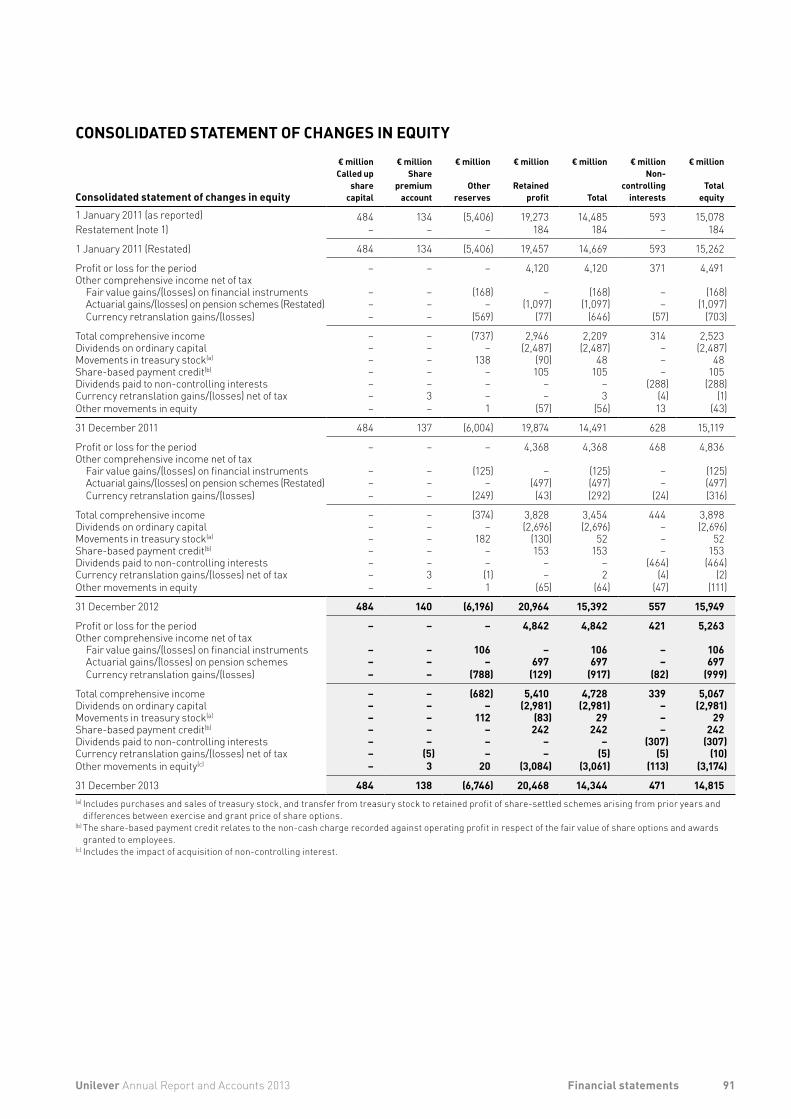
CONSOLIDATED STATEMENT OF CHANGES IN EQUITY
Consolidated statement of changes in equity
€ millionCalled up
sharecapital
€ millionShare
premiumaccount
€ million
Otherreserves
€ million
Retainedprofit
€ million
Total
€ millionNon-
controllinginterests
€ million
Totalequity
1 January 2011 (as reported) 484 134 (5,406) 19,273 14,485 593 15,078Restatement (note 1) – – – 184 184 – 184
1 January 2011 (Restated) 484 134 (5,406) 19,457 14,669 593 15,262
Profit or loss for the period – – – 4,120 4,120 371 4,491Other comprehensive income net of tax
Fair value gains/(losses) on financial instruments – – (168) – (168) – (168)Actuarial gains/(losses) on pension schemes (Restated) – – – (1,097) (1,097) – (1,097)Currency retranslation gains/(losses) – – (569) (77) (646) (57) (703)
Total comprehensive income – – (737) 2,946 2,209 314 2,523Dividends on ordinary capital – – – (2,487) (2,487) – (2,487)Movements in treasury stock(a) – – 138 (90) 48 – 48 Share-based payment credit(b) – – – 105 105 – 105 Dividends paid to non-controlling interests – – – – – (288) (288)Currency retranslation gains/(losses) net of tax – 3 – – 3 (4) (1)Other movements in equity – – 1 (57) (56) 13 (43)
31 December 2011 484 137 (6,004) 19,874 14,491 628 15,119
Profit or loss for the period – – – 4,368 4,368 468 4,836Other comprehensive income net of tax
Fair value gains/(losses) on financial instruments – – (125) – (125) – (125)Actuarial gains/(losses) on pension schemes (Restated) – – – (497) (497) – (497)Currency retranslation gains/(losses) – – (249) (43) (292) (24) (316)
Total comprehensive income – – (374) 3,828 3,454 444 3,898Dividends on ordinary capital – – – (2,696) (2,696) – (2,696)Movements in treasury stock(a) – – 182 (130) 52 – 52Share-based payment credit(b) – – – 153 153 – 153Dividends paid to non-controlling interests – – – – – (464) (464)Currency retranslation gains/(losses) net of tax – 3 (1) – 2 (4) (2)Other movements in equity – – 1 (65) (64) (47) (111)
31 December 2012 484 140 (6,196) 20,964 15,392 557 15,949
Profit or loss for the period – – – 4,842 4,842 421 5,263Other comprehensive income net of tax
Fair value gains/(losses) on financial instruments – – 106 – 106 – 106Actuarial gains/(losses) on pension schemes – – – 697 697 – 697Currency retranslation gains/(losses) – – (788) (129) (917) (82) (999)
Total comprehensive income – – (682) 5,410 4,728 339 5,067Dividends on ordinary capital – – – (2,981) (2,981) – (2,981)Movements in treasury stock(a) – – 112 (83) 29 – 29Share-based payment credit(b) – – – 242 242 – 242Dividends paid to non-controlling interests – – – – – (307) (307)Currency retranslation gains/(losses) net of tax – (5) – – (5) (5) (10)Other movements in equity(c) – 3 20 (3,084) (3,061) (113) (3,174)
31 December 2013 484 138 (6,746) 20,468 14,344 471 14,815(a) Includes purchases and sales of treasury stock, and transfer from treasury stock to retained profit of share-settled schemes arising from prior years and
differences between exercise and grant price of share options.(b) The share-based payment credit relates to the non-cash charge recorded against operating profit in respect of the fair value of share options and awards
granted to employees.(c) Includes the impact of acquisition of non-controlling interest.
91Unilever Annual Report and Accounts 2013 Financial statements
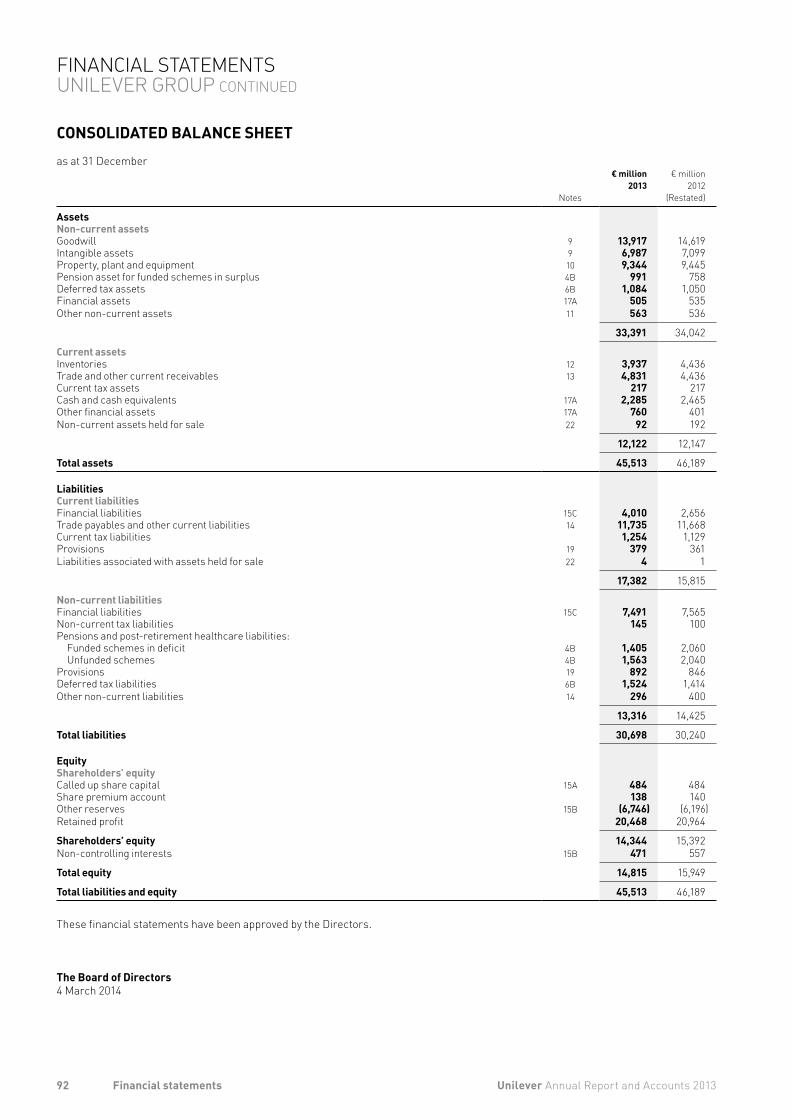
CONSOLIDATED BALANCE SHEETas at 31 December
Notes
€ million2013
€ million2012
(Restated)
AssetsNon-current assetsGoodwill 9 13,917 14,619Intangible assets 9 6,987 7,099Property, plant and equipment 10 9,344 9,445Pension asset for funded schemes in surplus 4B 991 758Deferred tax assets 6B 1,084 1,050Financial assets 17A 505 535Other non-current assets 11 563 536
33,391 34,042
Current assetsInventories 12 3,937 4,436Trade and other current receivables 13 4,831 4,436Current tax assets 217 217Cash and cash equivalents 17A 2,285 2,465Other financial assets 17A 760 401Non-current assets held for sale 22 92 192
12,122 12,147
Total assets 45,513 46,189
Liabilities Current liabilitiesFinancial liabilities 15C 4,010 2,656Trade payables and other current liabilities 14 11,735 11,668Current tax liabilities 1,254 1,129Provisions 19 379 361Liabilities associated with assets held for sale 22 4 1
17,382 15,815
Non-current liabilitiesFinancial liabilities 15C 7,491 7,565Non-current tax liabilities 145 100Pensions and post-retirement healthcare liabilities:
Funded schemes in deficit 4B 1,405 2,060Unfunded schemes 4B 1,563 2,040
Provisions 19 892 846Deferred tax liabilities 6B 1,524 1,414Other non-current liabilities 14 296 400
13,316 14,425
Total liabilities 30,698 30,240
EquityShareholders’ equityCalled up share capital 15A 484 484Share premium account 138 140Other reserves 15B (6,746) (6,196)Retained profit 20,468 20,964
Shareholders’ equity 14,344 15,392Non-controlling interests 15B 471 557
Total equity 14,815 15,949
Total liabilities and equity 45,513 46,189
These financial statements have been approved by the Directors.
The Board of Directors4 March 2014
92 Unilever Annual Report and Accounts 2013Financial statements
FINANCIAL STATEMENTS UNILEVER GROUP CONTINUED
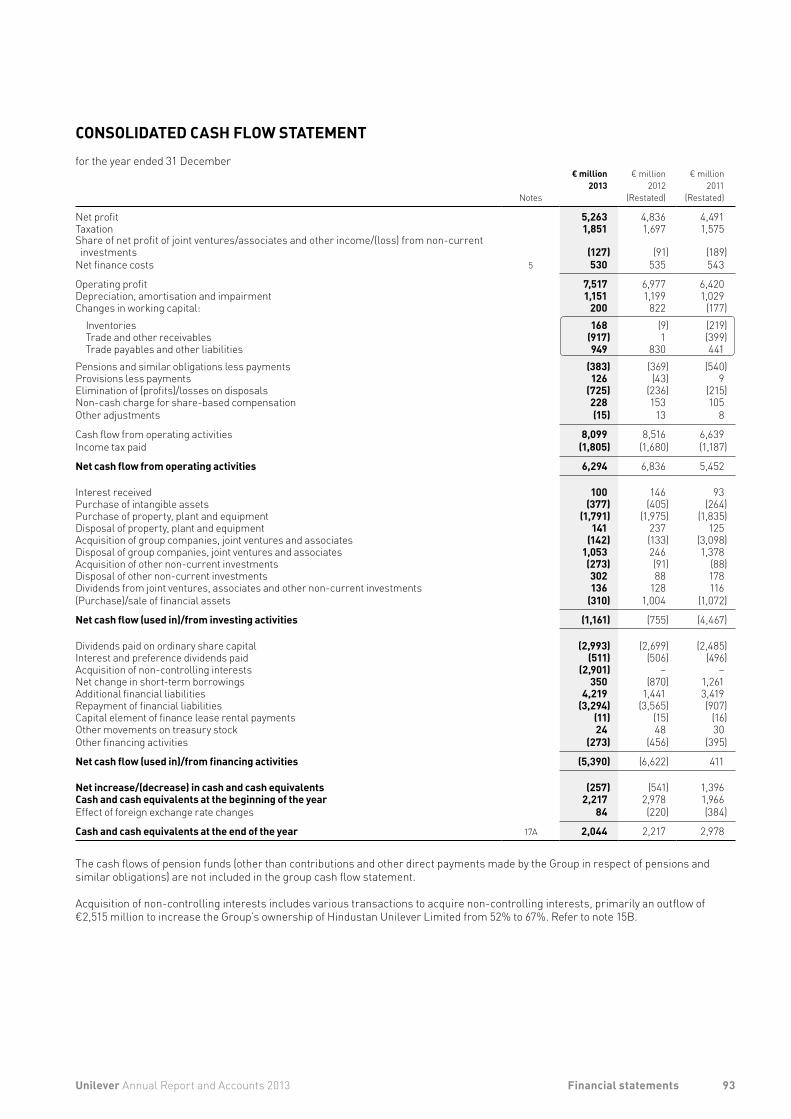
CONSOLIDATED CASH FLOW STATEMENTfor the year ended 31 December
Notes
€ million2013
€ million2012
(Restated)
€ million2011
(Restated)
Net profit 5,263 4,836 4,491Taxation 1,851 1,697 1,575Share of net profit of joint ventures/associates and other income/(loss) from non-current investments (127) (91) (189)
Net finance costs 5 530 535 543
Operating profit 7,517 6,977 6,420Depreciation, amortisation and impairment 1,151 1,199 1,029 Changes in working capital: 200 822 (177)
Inventories 168 (9) (219)Trade and other receivables (917) 1 (399)Trade payables and other liabilities 949 830 441
Pensions and similar obligations less payments (383) (369) (540)Provisions less payments 126 (43) 9 Elimination of (profits)/losses on disposals (725) (236) (215)Non-cash charge for share-based compensation 228 153 105 Other adjustments (15) 13 8
Cash flow from operating activities 8,099 8,516 6,639 Income tax paid (1,805) (1,680) (1,187)
Net cash flow from operating activities 6,294 6,836 5,452
Interest received 100 146 93 Purchase of intangible assets (377) (405) (264)Purchase of property, plant and equipment (1,791) (1,975) (1,835)Disposal of property, plant and equipment 141 237 125 Acquisition of group companies, joint ventures and associates (142) (133) (3,098)Disposal of group companies, joint ventures and associates 1,053 246 1,378 Acquisition of other non-current investments (273) (91) (88)Disposal of other non-current investments 302 88 178 Dividends from joint ventures, associates and other non-current investments 136 128 116 (Purchase)/sale of financial assets (310) 1,004 (1,072)
Net cash flow (used in)/from investing activities (1,161) (755) (4,467)
Dividends paid on ordinary share capital (2,993) (2,699) (2,485)Interest and preference dividends paid (511) (506) (496)Acquisition of non-controlling interests (2,901) – –Net change in short-term borrowings 350 (870) 1,261 Additional financial liabilities 4,219 1,441 3,419 Repayment of financial liabilities (3,294) (3,565) (907)Capital element of finance lease rental payments (11) (15) (16)Other movements on treasury stock 24 48 30 Other financing activities (273) (456) (395)
Net cash flow (used in)/from financing activities (5,390) (6,622) 411
Net increase/(decrease) in cash and cash equivalents (257) (541) 1,396 Cash and cash equivalents at the beginning of the year 2,217 2,978 1,966 Effect of foreign exchange rate changes 84 (220) (384)
Cash and cash equivalents at the end of the year 17A 2,044 2,217 2,978
The cash flows of pension funds (other than contributions and other direct payments made by the Group in respect of pensions and similar obligations) are not included in the group cash flow statement.
Acquisition of non-controlling interests includes various transactions to acquire non-controlling interests, primarily an outflow of €2,515 million to increase the Group’s ownership of Hindustan Unilever Limited from 52% to 67%. Refer to note 15B.
93Unilever Annual Report and Accounts 2013 Financial statements
FOREIGN CURRENCIESThe consolidated financial statements are presented in euros. The functional currencies of NV and PLC are euros and sterling respectively. Items included in the financial statements of individual group companies are recorded in their respective functional currency which is the currency of the primary economic environment in which each entity operates.
Foreign currency transactions in individual group companies are translated into functional currency using exchange rates at the date of the transaction. Foreign exchange gains and losses from settlement of these transactions, and from translation of monetary assets and liabilities at year-end exchange rates, are recognised in the income statement except when deferred in equity as qualifying hedges.
In preparing the consolidated financial statements, the balances in individual group companies are translated from their functional currency into euros. The income statement, the cash flow statement and all other movements in assets and liabilities are translated at average rates of exchange as a proxy for the transaction rate, or at the transaction rate itself if more appropriate. Assets and liabilities are translated at year-end exchange rates.
The ordinary share capital of NV and PLC is translated in accordance with the Equalisation Agreement. The difference between the value for PLC and the value by applying the year-end rate of exchange is taken to other reserves (see note 15B on page 117).
The effect of exchange rate changes during the year on net assets of foreign operations is recorded in equity. For this purpose net assets include loans between group companies and any related foreign exchange contracts where settlement is neither planned nor likely to occur in the foreseeable future. The Group applies hedge accounting to certain exchange differences arising between the functional currencies of a foreign operation and NV or PLC as appropriate, regardless of whether the net investment is held directly or through an intermediate parent. Differences arising on retranslation of a financial liability designated as a foreign currency net investment hedge are recorded in equity to the extent that the hedge is effective. These differences are reported within profit or loss to the extent that the hedge is ineffective.
Cumulative exchange differences arising since the date of transition to IFRS of 1 January 2004 are reported as a separate component of other reserves. In the event of disposal or part disposal of an interest in a group company either through sale or as a result of a repayment of capital, the cumulative exchange difference is recognised in the income statement as part of the profit or loss on disposal of group companies.
CRITICAL ACCOUNTING ESTIMATES AND JUDGEMENTSThe preparation of financial statements requires management to make judgements, estimates and assumptions in the application of accounting policies that affect the reported amounts of assets, liabilities, income and expenses. Actual results may differ from these estimates. Estimates and judgements are continuously evaluated and are based on historical experience and other factors, including expectations of future events that are believed to be reasonable. Revisions to accounting estimates are recognised in the period in which the estimate is revised and in any future period affected.
1. ACCOUNTING INFORMATION AND POLICIESThe accounting policies adopted are the same as those which were applied for the previous financial year, except as set out below under the heading ‘Recent accounting developments’.
UNILEVERThe two parent companies, NV and PLC, together with their group companies, operate as a single economic entity (the Unilever Group, also referred to as Unilever or the Group). NV and PLC have the same Directors and are linked by a series of agreements, including an Equalisation Agreement, which are designed so that the positions of the shareholders of both companies are as closely as possible the same as if they held shares in a single company.
The Equalisation Agreement provides that both companies adopt the same accounting principles. It also requires that dividends and other rights and benefits attaching to each ordinary share of NV, be equal in value to those rights and benefits attaching to each ordinary share of PLC, as if each such unit of capital formed part of the ordinary share capital of one and the same company.
BASIS OF CONSOLIDATIONDue to the operational and contractual arrangements referred to above, NV and PLC form a single reporting entity for the purposes of presenting consolidated financial statements. Accordingly, the financial statements of Unilever are presented by both NV and PLC as their respective consolidated financial statements. Group companies included in the consolidation are those companies controlled by NV or PLC. Control exists when the Group has the power to direct the activities of an entity so as to affect the return on investment.
The net assets and results of acquired businesses are included in the consolidated financial statements from their respective dates of acquisition, being the date on which the Group obtains control. The results of disposed businesses are included in the consolidated financial statements up to their date of disposal, being the date control ceases.
Intra-group transactions and balances are eliminated.
The company income statement for NV is included in the consolidated financial statements. An abbreviated income statement has been disclosed in the NV company accounts on page 137 in accordance with Section 402, Book 2, of the Netherlands Civil Code.
COMPANIES LEGISLATION AND ACCOUNTING STANDARDSThe consolidated financial statements have been prepared in accordance with International Financial Reporting Standards (IFRS) as adopted by the European Union (EU), IFRIC Interpretations and in accordance with Part 9 of Book 2 of the Civil Code in the Netherlands and the UK Companies Act 2006 applicable to companies reporting under IFRS. They are also in compliance with IFRS as issued by the International Accounting Standards Board (IASB).
These financial statements are prepared under the historical cost convention unless otherwise indicated.
ACCOUNTING POLICIESAccounting policies are included in the relevant notes to the consolidated financial statements. These are presented as text highlighted in grey on pages 96 to 133. The accounting policies below are applied throughout the financial statements.
94 Unilever Annual Report and Accounts 2013Financial statements
NOTES TO THE CONSOLIDATED FINANCIAL STATEMENTS UNILEVER GROUP
• IFRS 13 ‘Fair value measurement’ explains how to measure fair value and enhances fair value disclosures. The standard does not significantly change the measurement of fair value but codifies it in one place.
• Amendments to IAS 1 ‘Presentation of Financial Statements’ requires items of Other Comprehensive Income that may be reclassified to profit or loss being presented separately from items that will never be reclassified.
• Amendments to IAS 16 ‘Property, plant and equipment’ explains that servicing equipment is not classified as inventory when used for more than one year.
Amendments to IAS 36 ‘Impairment of Assets’ clarifies the disclosures required in relation to the impairment testing of goodwill. The Group has adopted this standard from 1 January 2013, which is a year earlier than required, as the changes clarify the IASB’s original intention; the impact of the standard on the Group is not material.
NOT ADOPTED BY THE GROUPThe Group is currently assessing the impact of the following new standards, amendments and interpretations that are not yet effective.
The Group does not currently believe adoption of these would have a material impact on the consolidated results or financial position of the Group. All of the following new standards, amendments and interpretations are effective from 1 January 2014 unless otherwise stated. Standards have not yet been endorsed by the EU unless otherwise stated. • IFRS 9 ‘Financial instruments’, replaces the current
classification and measurement models for financial assets with two classification categories: amortised cost and fair value. Classification is driven by the business model for managing the assets and the contractual cash flow characteristics. Financial liabilities are not affected by the changes. Effective date not set.
• Amendments to IAS 32 ‘Financial instruments: Presentation’ provides additional guidance on when financial assets and liabilities may be offset. These amendments have been endorsed by the EU.
• Amendments to IAS 39 ‘Financial Instruments: Recognition and Measurement’ removes the requirement to discontinue hedge accounting when a hedge derivative is novated, providing certain criteria are met. These amendments have been endorsed by the EU.
• Amendments to IAS 19’ Employee Benefits’ simplifies the accounting for contributions that are independent of the number of years of employee service. Effective 1 January 2015.
• IFRIC interpretation 21 ‘Levies’ provides guidance on when to recognise a liability for a levy imposed by a government.
1. ACCOUNTING INFORMATION AND POLICIES CONTINUED
Information about critical judgements in applying accounting policies, as well as estimates and assumptions that have the most significant risk of causing a material adjustment to the carrying amounts of assets and liabilities within the next financial year, are included in the following notes:• separate presentation of items in the income statement – note 3;• measurement of defined benefit obligations – note 4B;• key assumptions used in discounted cash flow projections –
note 9;• utilisation of tax losses and recognition of other deferred tax
assets – note 6B;• likelihood of occurrence of provisions and contingencies,
including tax investigations and audits – notes 19 and 20; and• measurement of consideration and assets and liabilities
acquired as part of business combinations – note 21.
RECENT ACCOUNTING DEVELOPMENTS
ADOPTED BY THE GROUPThe following new and amended standards are relevant to the Group and have been adopted for the first time in these financial statements, with no material impact: • IAS 19 ‘Employee benefits (Revised)’ changes a number of
disclosure requirements and restricts the accounting options available for defined benefit pension plans. The return on pension plan assets and finance charge have been replaced by a net interest expense, calculated by applying the liability discount rate to the net defined benefit asset or liability. Administration costs by pension funds will now be recognised as an expense when the administrative services are performed. The revised standard requires retrospective application, and amounts relating to the year ended 31 December 2012 and 2011 have been restated and labelled as such in these financial statements. The changes resulted in an increase in operating expense of €14 million for the year ended 31 December 2013 (€12 million for the year ended 31 December 2012; €13 million for the year ended 31 December 2011) and an increase in finance cost of €193 million for the year ended 31 December 2013 (€138 million for the year ended 31 December 2012; €166 million for the year ended 31 December 2011) and a reduction in the net defined benefit liability of €198 million in the restated comparative opening balance sheet as at 1 January 2012 (31 December 2012: €233 million), with a corresponding increase in actuarial gains or losses on pension schemes before tax.
• Amendments to IFRS 7 ‘Financial instruments: Disclosures’ introduces new disclosures of information about the significance of financial instruments to an entity.
• IFRS 10 ‘Consolidated financial statements’ replaces previous guidance on control and consolidation.
• IFRS 11 ‘Joint arrangements’ requires joint arrangements to be accounted for as a joint operation or as a joint venture. Equity accounting for joint ventures, previously used by Unilever, has become mandatory.
• IFRS 12 ‘Disclosure of interests in other entities’ requires enhanced disclosures of the nature, risks and financial effects associated with the Group’s interests in subsidiaries, associates, joint arrangements and unconsolidated structured entities.
95Unilever Annual Report and Accounts 2013 Financial statements
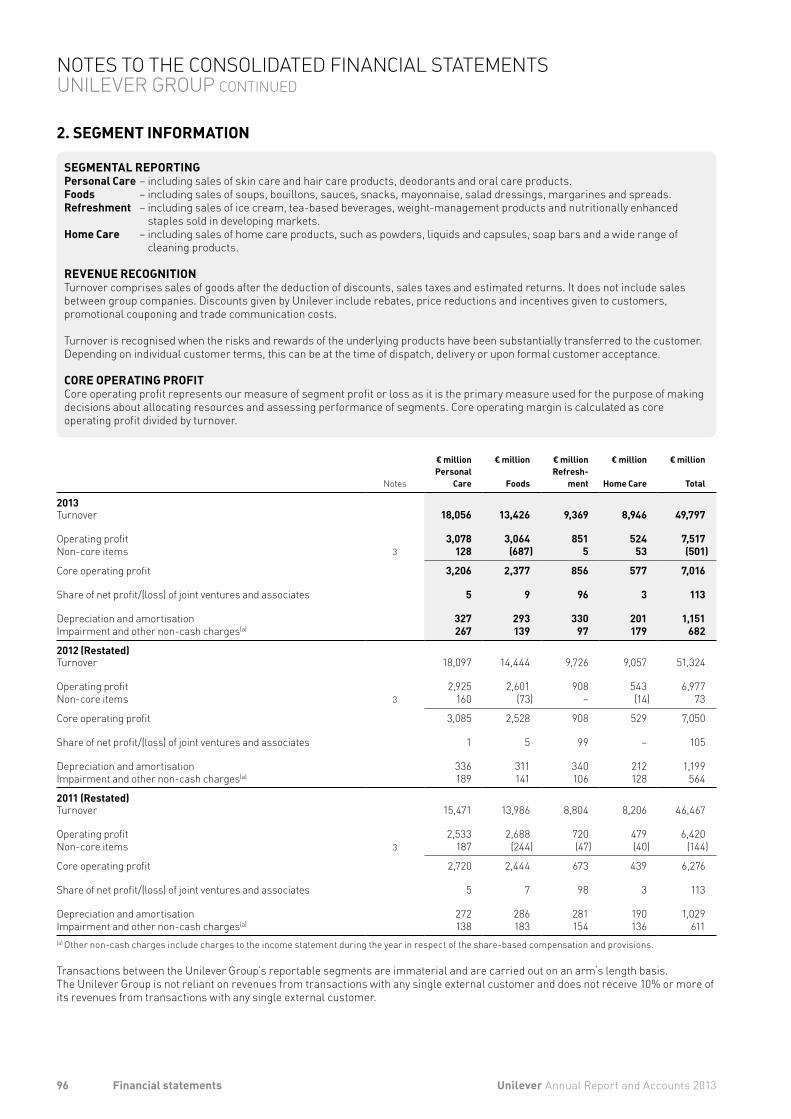
2. SEGMENT INFORMATION
SEGMENTAL REPORTINGPersonal Care – including sales of skin care and hair care products, deodorants and oral care products.Foods – including sales of soups, bouillons, sauces, snacks, mayonnaise, salad dressings, margarines and spreads.Refreshment – including sales of ice cream, tea-based beverages, weight-management products and nutritionally enhanced
staples sold in developing markets.Home Care – including sales of home care products, such as powders, liquids and capsules, soap bars and a wide range of
cleaning products.
REVENUE RECOGNITION Turnover comprises sales of goods after the deduction of discounts, sales taxes and estimated returns. It does not include sales between group companies. Discounts given by Unilever include rebates, price reductions and incentives given to customers, promotional couponing and trade communication costs.
Turnover is recognised when the risks and rewards of the underlying products have been substantially transferred to the customer. Depending on individual customer terms, this can be at the time of dispatch, delivery or upon formal customer acceptance.
CORE OPERATING PROFIT Core operating profit represents our measure of segment profit or loss as it is the primary measure used for the purpose of making decisions about allocating resources and assessing performance of segments. Core operating margin is calculated as core operating profit divided by turnover.
Notes
€ millionPersonal
Care
€ million
Foods
€ millionRefresh
ment
€ million
Home Care
€ million
Total
2013Turnover 18,056 13,426 9,369 8,946 49,797
Operating profit 3,078 3,064 851 524 7,517Non-core items 3 128 (687) 5 53 (501)
Core operating profit 3,206 2,377 856 577 7,016
Share of net profit/(loss) of joint ventures and associates 5 9 96 3 113
Depreciation and amortisation 327 293 330 201 1,151Impairment and other non-cash charges(a) 267 139 97 179 682
2012 (Restated)Turnover 18,097 14,444 9,726 9,057 51,324
Operating profit 2,925 2,601 908 543 6,977Non-core items 3 160 (73) – (14) 73
Core operating profit 3,085 2,528 908 529 7,050
Share of net profit/(loss) of joint ventures and associates 1 5 99 – 105
Depreciation and amortisation 336 311 340 212 1,199Impairment and other non-cash charges(a) 189 141 106 128 564
2011 (Restated)Turnover 15,471 13,986 8,804 8,206 46,467
Operating profit 2,533 2,688 720 479 6,420Non-core items 3 187 (244) (47) (40) (144)
Core operating profit 2,720 2,444 673 439 6,276
Share of net profit/(loss) of joint ventures and associates 5 7 98 3 113
Depreciation and amortisation 272 286 281 190 1,029Impairment and other non-cash charges(a) 138 183 154 136 611(a) Other non-cash charges include charges to the income statement during the year in respect of the share-based compensation and provisions.
Transactions between the Unilever Group’s reportable segments are immaterial and are carried out on an arm‘s length basis.The Unilever Group is not reliant on revenues from transactions with any single external customer and does not receive 10% or more of its revenues from transactions with any single external customer.
96 Unilever Annual Report and Accounts 2013Financial statements
NOTES TO THE CONSOLIDATED FINANCIAL STATEMENTS UNILEVER GROUP CONTINUED
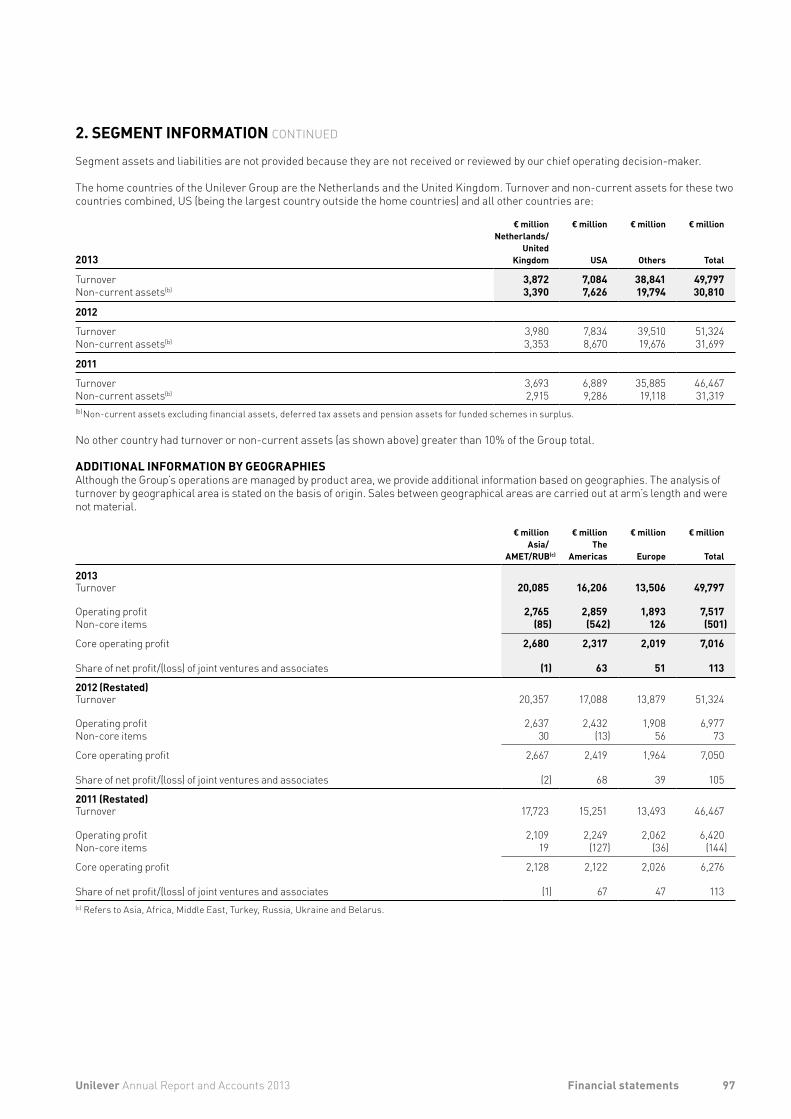
2. SEGMENT INFORMATION CONTINUED
Segment assets and liabilities are not provided because they are not received or reviewed by our chief operating decision-maker.
The home countries of the Unilever Group are the Netherlands and the United Kingdom. Turnover and non-current assets for these two countries combined, US (being the largest country outside the home countries) and all other countries are:
2013
€ millionNetherlands/
UnitedKingdom
€ million
USA
€ million
Others
€ million
Total
Turnover 3,872 7,084 38,841 49,797Non-current assets(b) 3,390 7,626 19,794 30,810
2012
Turnover 3,980 7,834 39,510 51,324Non-current assets(b) 3,353 8,670 19,676 31,699
2011
Turnover 3,693 6,889 35,885 46,467 Non-current assets(b) 2,915 9,286 19,118 31,319 (b) Non-current assets excluding financial assets, deferred tax assets and pension assets for funded schemes in surplus.
No other country had turnover or non-current assets (as shown above) greater than 10% of the Group total.
ADDITIONAL INFORMATION BY GEOGRAPHIESAlthough the Group’s operations are managed by product area, we provide additional information based on geographies. The analysis of turnover by geographical area is stated on the basis of origin. Sales between geographical areas are carried out at arm’s length and were not material.
€ millionAsia/
AMET/RUB(c)
€ millionThe
Americas
€ million
Europe
€ million
Total
2013Turnover 20,085 16,206 13,506 49,797
Operating profit 2,765 2,859 1,893 7,517Non-core items (85) (542) 126 (501)
Core operating profit 2,680 2,317 2,019 7,016
Share of net profit/(loss) of joint ventures and associates (1) 63 51 113
2012 (Restated)Turnover 20,357 17,088 13,879 51,324
Operating profit 2,637 2,432 1,908 6,977Non-core items 30 (13) 56 73
Core operating profit 2,667 2,419 1,964 7,050
Share of net profit/(loss) of joint ventures and associates (2) 68 39 105
2011 (Restated)Turnover 17,723 15,251 13,493 46,467
Operating profit 2,109 2,249 2,062 6,420Non-core items 19 (127) (36) (144)
Core operating profit 2,128 2,122 2,026 6,276
Share of net profit/(loss) of joint ventures and associates (1) 67 47 113(c) Refers to Asia, Africa, Middle East, Turkey, Russia, Ukraine and Belarus.
97Unilever Annual Report and Accounts 2013 Financial statements
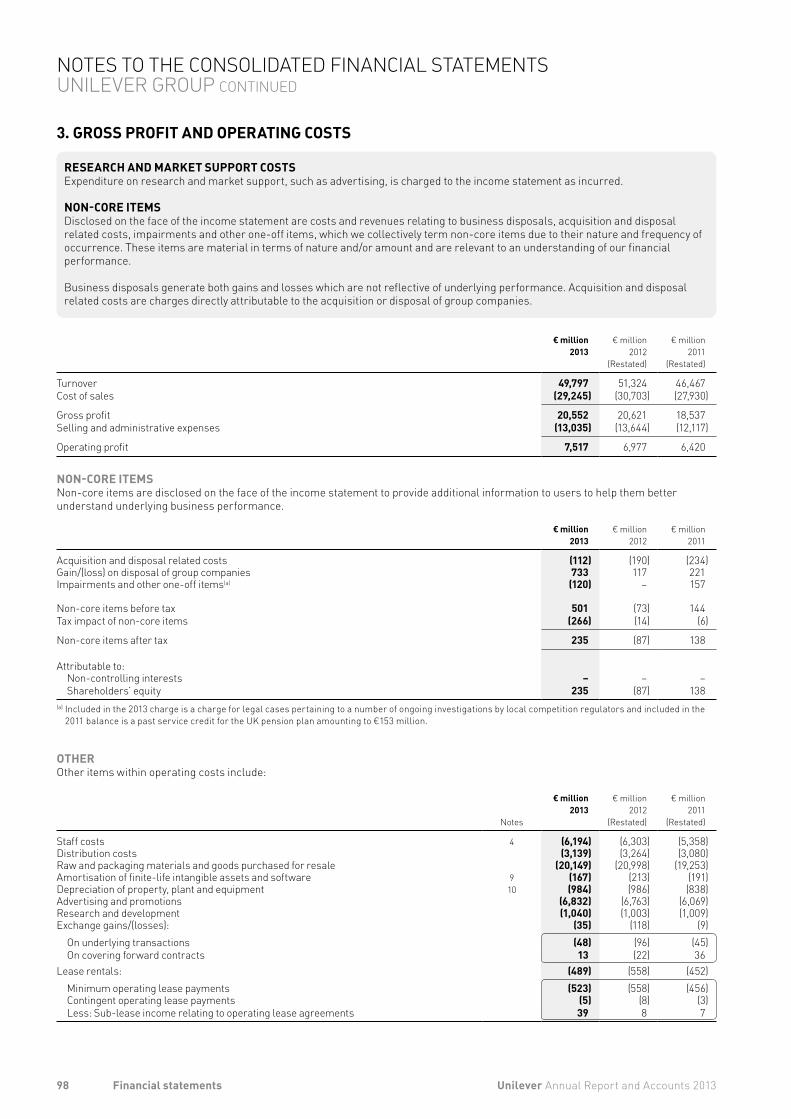
3. GROSS PROFIT AND OPERATING COSTS
RESEARCH AND MARKET SUPPORT COSTSExpenditure on research and market support, such as advertising, is charged to the income statement as incurred.
NON-CORE ITEMSDisclosed on the face of the income statement are costs and revenues relating to business disposals, acquisition and disposal related costs, impairments and other one-off items, which we collectively term non-core items due to their nature and frequency of occurrence. These items are material in terms of nature and/or amount and are relevant to an understanding of our financial performance.
Business disposals generate both gains and losses which are not reflective of underlying performance. Acquisition and disposal related costs are charges directly attributable to the acquisition or disposal of group companies.
€ million2013
€ million2012
(Restated)
€ million2011
(Restated)
Turnover 49,797 51,324 46,467 Cost of sales (29,245) (30,703) (27,930)
Gross profit 20,552 20,621 18,537 Selling and administrative expenses (13,035) (13,644) (12,117)
Operating profit 7,517 6,977 6,420
NON-CORE ITEMSNon-core items are disclosed on the face of the income statement to provide additional information to users to help them better understand underlying business performance.
€ million2013
€ million2012
€ million2011
Acquisition and disposal related costs (112) (190) (234)Gain/(loss) on disposal of group companies 733 117 221Impairments and other one-off items(a) (120) – 157
Non-core items before tax 501 (73) 144Tax impact of non-core items (266) (14) (6)
Non-core items after tax 235 (87) 138
Attributable to:Non-controlling interests – – –Shareholders’ equity 235 (87) 138
(a) Included in the 2013 charge is a charge for legal cases pertaining to a number of ongoing investigations by local competition regulators and included in the 2011 balance is a past service credit for the UK pension plan amounting to €153 million.
OTHEROther items within operating costs include:
Notes
€ million2013
€ million2012
(Restated)
€ million2011
(Restated)
Staff costs 4 (6,194) (6,303) (5,358)Distribution costs (3,139) (3,264) (3,080)Raw and packaging materials and goods purchased for resale (20,149) (20,998) (19,253)Amortisation of finite-life intangible assets and software 9 (167) (213) (191)Depreciation of property, plant and equipment 10 (984) (986) (838)Advertising and promotions (6,832) (6,763) (6,069)Research and development (1,040) (1,003) (1,009)Exchange gains/(losses): (35) (118) (9)
On underlying transactions (48) (96) (45)On covering forward contracts 13 (22) 36
Lease rentals: (489) (558) (452)Minimum operating lease payments (523) (558) (456)Contingent operating lease payments (5) (8) (3)Less: Sub-lease income relating to operating lease agreements 39 8 7
98 Unilever Annual Report and Accounts 2013Financial statements
NOTES TO THE CONSOLIDATED FINANCIAL STATEMENTS UNILEVER GROUP CONTINUED
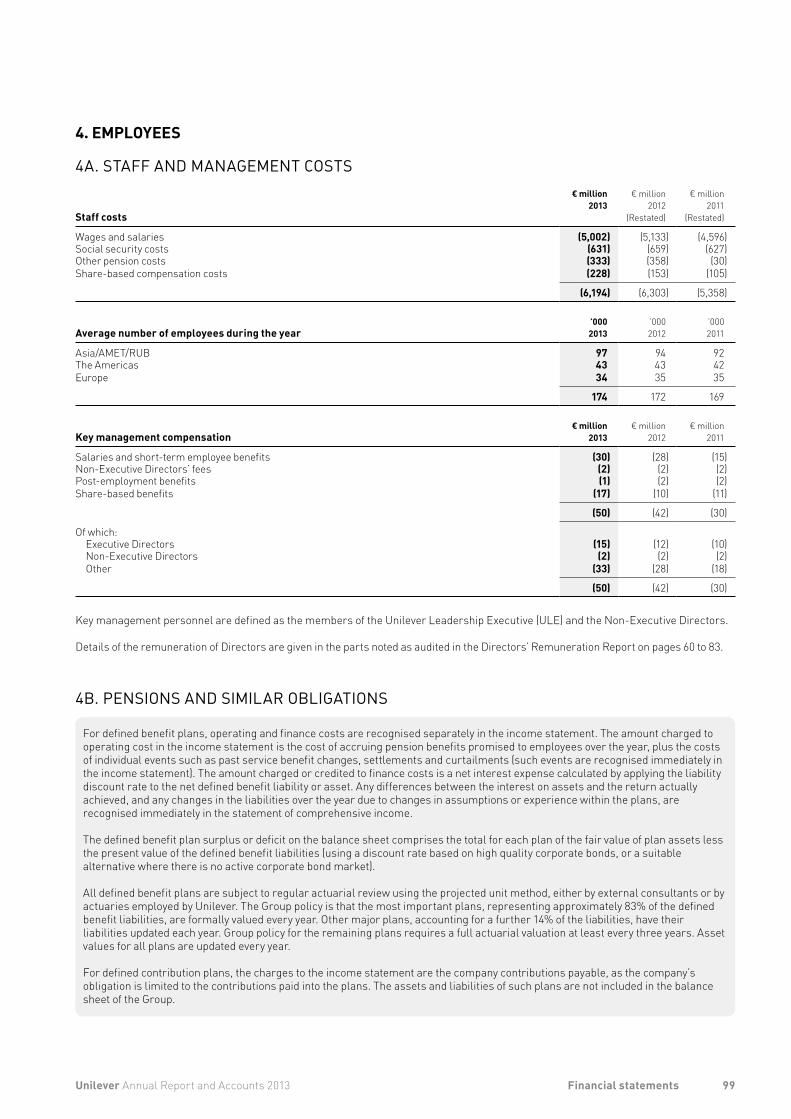
4. EMPLOYEES
4A. STAFF AND MANAGEMENT COSTS
Staff costs
€ million2013
€ million2012
(Restated)
€ million2011
(Restated)
Wages and salaries (5,002) (5,133) (4,596)Social security costs (631) (659) (627)Other pension costs (333) (358) (30)Share-based compensation costs (228) (153) (105)
(6,194) (6,303) (5,358)
Average number of employees during the year’0002013
’0002012
’0002011
Asia/AMET/RUB 97 94 92The Americas 43 43 42Europe 34 35 35
174 172 169
Key management compensation€ million
2013€ million
2012€ million
2011
Salaries and short-term employee benefits (30) (28) (15)Non-Executive Directors’ fees (2) (2) (2)Post-employment benefits (1) (2) (2)Share-based benefits (17) (10) (11)
(50) (42) (30)
Of which:Executive Directors (15) (12) (10)Non-Executive Directors (2) (2) (2)Other (33) (28) (18)
(50) (42) (30)
Key management personnel are defined as the members of the Unilever Leadership Executive (ULE) and the Non-Executive Directors.
Details of the remuneration of Directors are given in the parts noted as audited in the Directors’ Remuneration Report on pages 60 to 83.
4B. PENSIONS AND SIMILAR OBLIGATIONS
For defined benefit plans, operating and finance costs are recognised separately in the income statement. The amount charged to operating cost in the income statement is the cost of accruing pension benefits promised to employees over the year, plus the costs of individual events such as past service benefit changes, settlements and curtailments (such events are recognised immediately in the income statement). The amount charged or credited to finance costs is a net interest expense calculated by applying the liability discount rate to the net defined benefit liability or asset. Any differences between the interest on assets and the return actually achieved, and any changes in the liabilities over the year due to changes in assumptions or experience within the plans, are recognised immediately in the statement of comprehensive income.
The defined benefit plan surplus or deficit on the balance sheet comprises the total for each plan of the fair value of plan assets less the present value of the defined benefit liabilities (using a discount rate based on high quality corporate bonds, or a suitable alternative where there is no active corporate bond market).
All defined benefit plans are subject to regular actuarial review using the projected unit method, either by external consultants or by actuaries employed by Unilever. The Group policy is that the most important plans, representing approximately 83% of the defined benefit liabilities, are formally valued every year. Other major plans, accounting for a further 14% of the liabilities, have their liabilities updated each year. Group policy for the remaining plans requires a full actuarial valuation at least every three years. Asset values for all plans are updated every year.
For defined contribution plans, the charges to the income statement are the company contributions payable, as the company’s obligation is limited to the contributions paid into the plans. The assets and liabilities of such plans are not included in the balance sheet of the Group.
99Unilever Annual Report and Accounts 2013 Financial statements
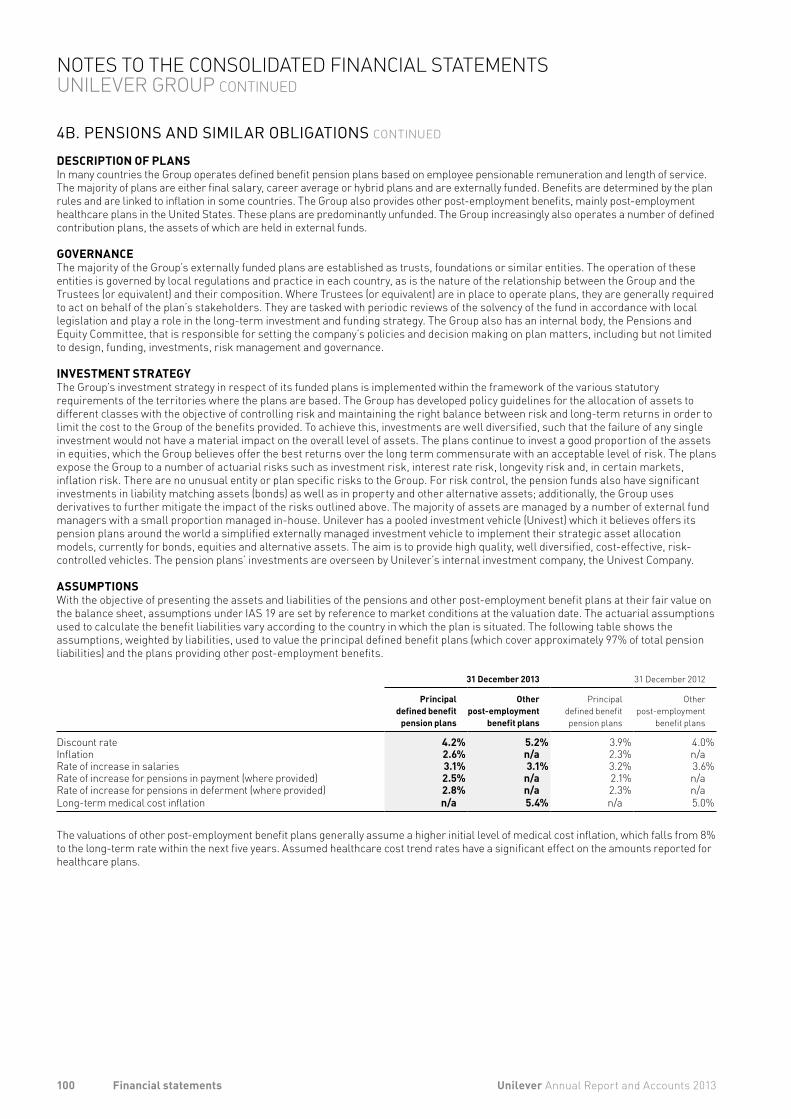
4B. PENSIONS AND SIMILAR OBLIGATIONS CONTINUED
DESCRIPTION OF PLANSIn many countries the Group operates defined benefit pension plans based on employee pensionable remuneration and length of service. The majority of plans are either final salary, career average or hybrid plans and are externally funded. Benefits are determined by the plan rules and are linked to inflation in some countries. The Group also provides other post-employment benefits, mainly post-employment healthcare plans in the United States. These plans are predominantly unfunded. The Group increasingly also operates a number of defined contribution plans, the assets of which are held in external funds.
GOVERNANCEThe majority of the Group’s externally funded plans are established as trusts, foundations or similar entities. The operation of these entities is governed by local regulations and practice in each country, as is the nature of the relationship between the Group and the Trustees (or equivalent) and their composition. Where Trustees (or equivalent) are in place to operate plans, they are generally required to act on behalf of the plan’s stakeholders. They are tasked with periodic reviews of the solvency of the fund in accordance with local legislation and play a role in the long-term investment and funding strategy. The Group also has an internal body, the Pensions and Equity Committee, that is responsible for setting the company’s policies and decision making on plan matters, including but not limited to design, funding, investments, risk management and governance.
INVESTMENT STRATEGYThe Group’s investment strategy in respect of its funded plans is implemented within the framework of the various statutory requirements of the territories where the plans are based. The Group has developed policy guidelines for the allocation of assets to different classes with the objective of controlling risk and maintaining the right balance between risk and long-term returns in order to limit the cost to the Group of the benefits provided. To achieve this, investments are well diversified, such that the failure of any single investment would not have a material impact on the overall level of assets. The plans continue to invest a good proportion of the assets in equities, which the Group believes offer the best returns over the long term commensurate with an acceptable level of risk. The plans expose the Group to a number of actuarial risks such as investment risk, interest rate risk, longevity risk and, in certain markets, inflation risk. There are no unusual entity or plan specific risks to the Group. For risk control, the pension funds also have significant investments in liability matching assets (bonds) as well as in property and other alternative assets; additionally, the Group uses derivatives to further mitigate the impact of the risks outlined above. The majority of assets are managed by a number of external fund managers with a small proportion managed in-house. Unilever has a pooled investment vehicle (Univest) which it believes offers its pension plans around the world a simplified externally managed investment vehicle to implement their strategic asset allocation models, currently for bonds, equities and alternative assets. The aim is to provide high quality, well diversified, cost-effective, risk-controlled vehicles. The pension plans’ investments are overseen by Unilever’s internal investment company, the Univest Company.
ASSUMPTIONSWith the objective of presenting the assets and liabilities of the pensions and other post-employment benefit plans at their fair value on the balance sheet, assumptions under IAS 19 are set by reference to market conditions at the valuation date. The actuarial assumptions used to calculate the benefit liabilities vary according to the country in which the plan is situated. The following table shows the assumptions, weighted by liabilities, used to value the principal defined benefit plans (which cover approximately 97% of total pension liabilities) and the plans providing other post-employment benefits.
31 December 2013 31 December 2012
Principal defined benefit
pension plans
Otherpostemployment
benefit plans
Principal defined benefit pension plans
Otherpost-employment
benefit plans
Discount rate 4.2% 5.2% 3.9% 4.0%Inflation 2.6% n/a 2.3% n/aRate of increase in salaries 3.1% 3.1% 3.2% 3.6%Rate of increase for pensions in payment (where provided) 2.5% n/a 2.1% n/aRate of increase for pensions in deferment (where provided) 2.8% n/a 2.3% n/aLong-term medical cost inflation n/a 5.4% n/a 5.0%
The valuations of other post-employment benefit plans generally assume a higher initial level of medical cost inflation, which falls from 8% to the long-term rate within the next five years. Assumed healthcare cost trend rates have a significant effect on the amounts reported for healthcare plans.
100 Unilever Annual Report and Accounts 2013Financial statements
NOTES TO THE CONSOLIDATED FINANCIAL STATEMENTS UNILEVER GROUP CONTINUED
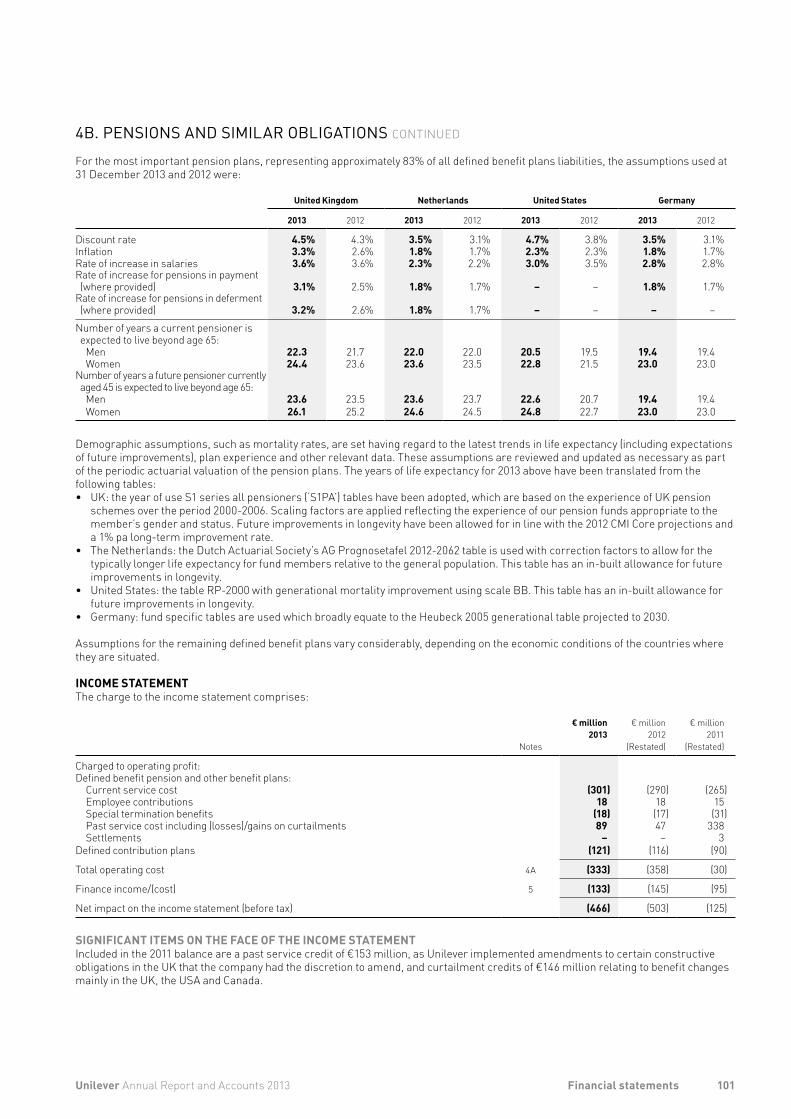
4B. PENSIONS AND SIMILAR OBLIGATIONS CONTINUED
For the most important pension plans, representing approximately 83% of all defined benefit plans liabilities, the assumptions used at 31 December 2013 and 2012 were:
United Kingdom Netherlands United States Germany
2013 2012 2013 2012 2013 2012 2013 2012
Discount rate 4.5% 4.3% 3.5% 3.1% 4.7% 3.8% 3.5% 3.1%Inflation 3.3% 2.6% 1.8% 1.7% 2.3% 2.3% 1.8% 1.7%Rate of increase in salaries 3.6% 3.6% 2.3% 2.2% 3.0% 3.5% 2.8% 2.8%Rate of increase for pensions in payment (where provided) 3.1% 2.5% 1.8% 1.7% – – 1.8% 1.7%
Rate of increase for pensions in deferment (where provided) 3.2% 2.6% 1.8% 1.7% – – – –
Number of years a current pensioner is expected to live beyond age 65:
Men 22.3 21.7 22.0 22.0 20.5 19.5 19.4 19.4Women 24.4 23.6 23.6 23.5 22.8 21.5 23.0 23.0
Number of years a future pensioner currently aged 45 is expected to live beyond age 65:
Men 23.6 23.5 23.6 23.7 22.6 20.7 19.4 19.4Women 26.1 25.2 24.6 24.5 24.8 22.7 23.0 23.0
Demographic assumptions, such as mortality rates, are set having regard to the latest trends in life expectancy (including expectations of future improvements), plan experience and other relevant data. These assumptions are reviewed and updated as necessary as part of the periodic actuarial valuation of the pension plans. The years of life expectancy for 2013 above have been translated from the following tables:• UK: the year of use S1 series all pensioners (‘S1PA’) tables have been adopted, which are based on the experience of UK pension
schemes over the period 2000-2006. Scaling factors are applied reflecting the experience of our pension funds appropriate to the member’s gender and status. Future improvements in longevity have been allowed for in line with the 2012 CMI Core projections and a 1% pa long-term improvement rate.
• The Netherlands: the Dutch Actuarial Society’s AG Prognosetafel 2012-2062 table is used with correction factors to allow for the typically longer life expectancy for fund members relative to the general population. This table has an in-built allowance for future improvements in longevity.
• United States: the table RP-2000 with generational mortality improvement using scale BB. This table has an in-built allowance for future improvements in longevity.
• Germany: fund specific tables are used which broadly equate to the Heubeck 2005 generational table projected to 2030.
Assumptions for the remaining defined benefit plans vary considerably, depending on the economic conditions of the countries where they are situated.
INCOME STATEMENTThe charge to the income statement comprises:
Notes
€ million2013
€ million2012
(Restated)
€ million2011
(Restated)
Charged to operating profit:Defined benefit pension and other benefit plans:
Current service cost (301) (290) (265)Employee contributions 18 18 15Special termination benefits (18) (17) (31)Past service cost including (losses)/gains on curtailments 89 47 338Settlements – – 3
Defined contribution plans (121) (116) (90)
Total operating cost 4A (333) (358) (30)
Finance income/(cost) 5 (133) (145) (95)
Net impact on the income statement (before tax) (466) (503) (125)
SIGNIFICANT ITEMS ON THE FACE OF THE INCOME STATEMENTIncluded in the 2011 balance are a past service credit of €153 million, as Unilever implemented amendments to certain constructive obligations in the UK that the company had the discretion to amend, and curtailment credits of €146 million relating to benefit changes mainly in the UK, the USA and Canada.
101Unilever Annual Report and Accounts 2013 Financial statements
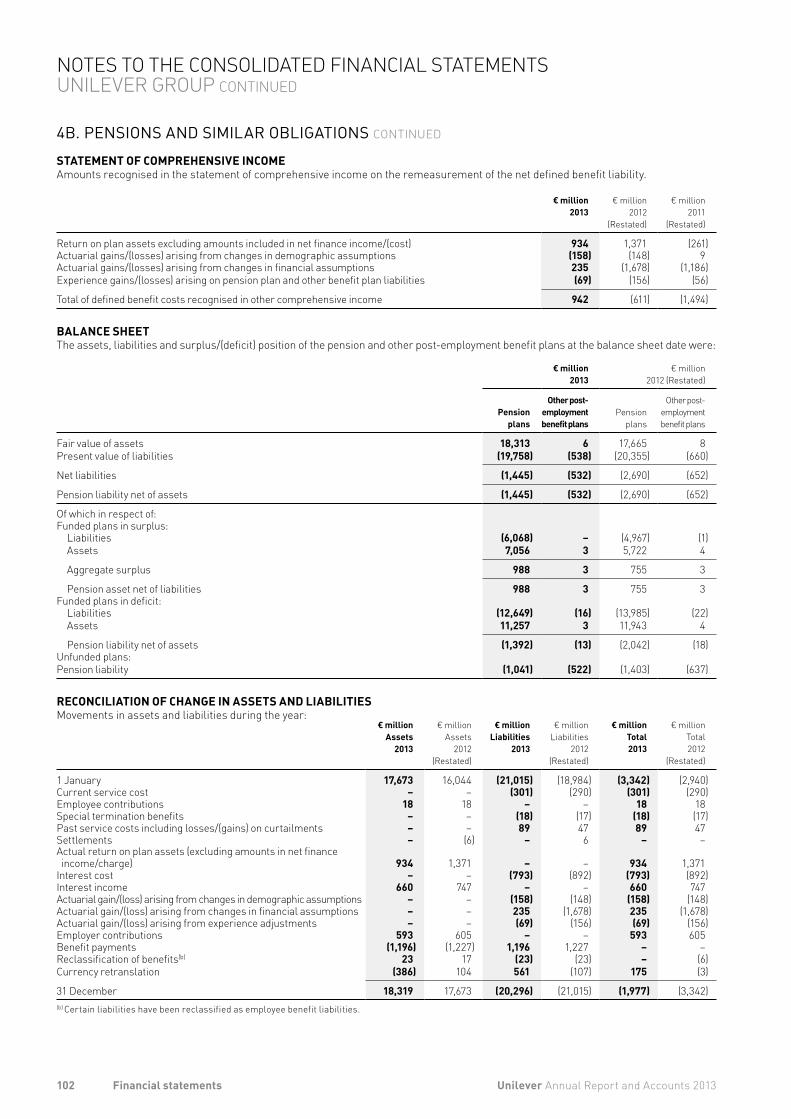
4B. PENSIONS AND SIMILAR OBLIGATIONS CONTINUED
STATEMENT OF COMPREHENSIVE INCOMEAmounts recognised in the statement of comprehensive income on the remeasurement of the net defined benefit liability.
€ million 2013
€ million 2012
(Restated)
€ million 2011
(Restated)
Return on plan assets excluding amounts included in net finance income/(cost) 934 1,371 (261)Actuarial gains/(losses) arising from changes in demographic assumptions (158) (148) 9Actuarial gains/(losses) arising from changes in financial assumptions 235 (1,678) (1,186)Experience gains/(losses) arising on pension plan and other benefit plan liabilities (69) (156) (56)
Total of defined benefit costs recognised in other comprehensive income 942 (611) (1,494)
BALANCE SHEETThe assets, liabilities and surplus/(deficit) position of the pension and other post-employment benefit plans at the balance sheet date were:
€ million 2013
€ million 2012 (Restated)
Pension
plans
Other postemploymentbenefit plans
Pension
plans
Other post-employmentbenefit plans
Fair value of assets 18,313 6 17,665 8Present value of liabilities (19,758) (538) (20,355) (660)
Net liabilities (1,445) (532) (2,690) (652)
Pension liability net of assets (1,445) (532) (2,690) (652)
Of which in respect of:Funded plans in surplus:
Liabilities (6,068) – (4,967) (1)Assets 7,056 3 5,722 4
Aggregate surplus 988 3 755 3
Pension asset net of liabilities 988 3 755 3Funded plans in deficit:
Liabilities (12,649) (16) (13,985) (22)Assets 11,257 3 11,943 4
Pension liability net of assets (1,392) (13) (2,042) (18)Unfunded plans:Pension liability (1,041) (522) (1,403) (637)
RECONCILIATION OF CHANGE IN ASSETS AND LIABILITIESMovements in assets and liabilities during the year:
€ millionAssets
2013
€ millionAssets
2012 (Restated)
€ millionLiabilities
2013
€ millionLiabilities
2012 (Restated)
€ millionTotal2013
€ millionTotal2012
(Restated)
1 January 17,673 16,044 (21,015) (18,984) (3,342) (2,940)Current service cost – – (301) (290) (301) (290)Employee contributions 18 18 – – 18 18 Special termination benefits – – (18) (17) (18) (17)Past service costs including losses/(gains) on curtailments – – 89 47 89 47 Settlements – (6) – 6 – –Actual return on plan assets (excluding amounts in net finance income/charge) 934 1,371 – – 934 1,371
Interest cost – – (793) (892) (793) (892)Interest income 660 747 – – 660 747 Actuarial gain/(loss) arising from changes in demographic assumptions – – (158) (148) (158) (148)Actuarial gain/(loss) arising from changes in financial assumptions – – 235 (1,678) 235 (1,678)Actuarial gain/(loss) arising from experience adjustments – – (69) (156) (69) (156)Employer contributions 593 605 – – 593 605 Benefit payments (1,196) (1,227) 1,196 1,227 – –Reclassification of benefits(b) 23 17 (23) (23) – (6)Currency retranslation (386) 104 561 (107) 175 (3)
31 December 18,319 17,673 (20,296) (21,015) (1,977) (3,342)(b) Certain liabilities have been reclassified as employee benefit liabilities.
102 Unilever Annual Report and Accounts 2013Financial statements
NOTES TO THE CONSOLIDATED FINANCIAL STATEMENTS UNILEVER GROUP CONTINUED
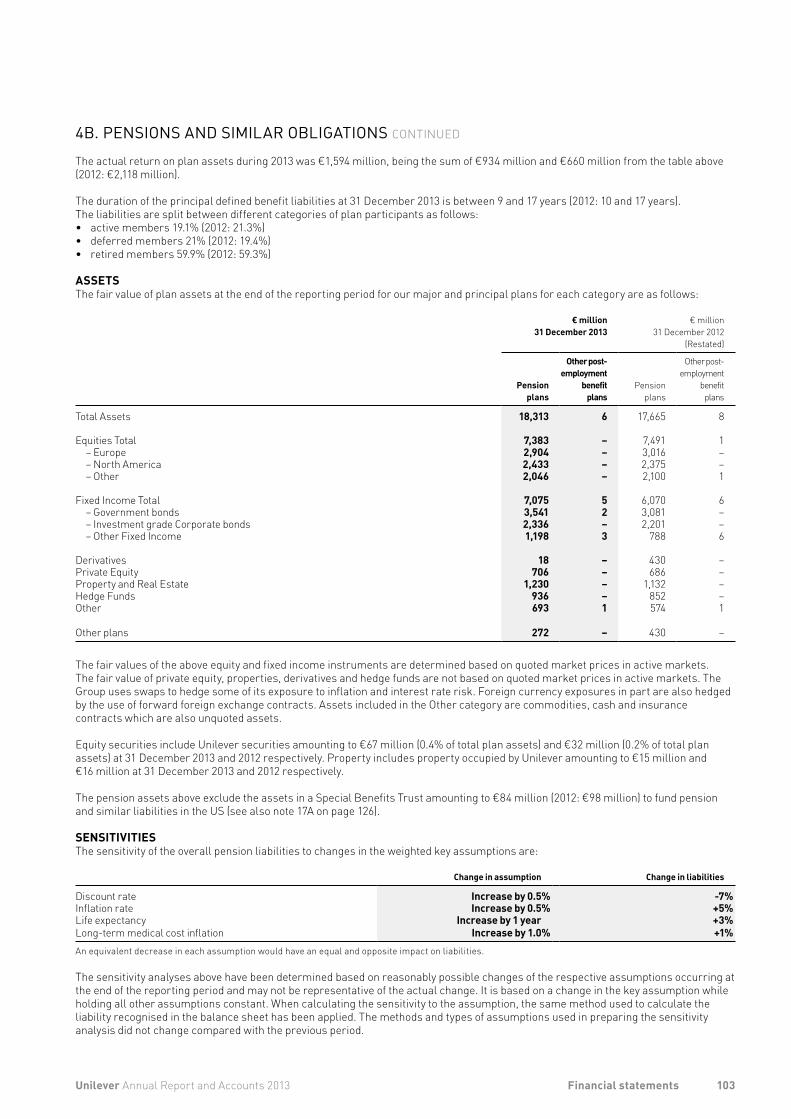
4B. PENSIONS AND SIMILAR OBLIGATIONS CONTINUED
The actual return on plan assets during 2013 was €1,594 million, being the sum of €934 million and €660 million from the table above (2012: €2,118 million).
The duration of the principal defined benefit liabilities at 31 December 2013 is between 9 and 17 years (2012: 10 and 17 years). The liabilities are split between different categories of plan participants as follows:• active members 19.1% (2012: 21.3%)• deferred members 21% (2012: 19.4%)• retired members 59.9% (2012: 59.3%)
ASSETSThe fair value of plan assets at the end of the reporting period for our major and principal plans for each category are as follows:
€ million 31 December 2013
€ million 31 December 2012
(Restated)
Pension
plans
Other postemployment
benefitplans
Pension
plans
Other post-employment
benefitplans
Total Assets 18,313 6 17,665 8
Equities Total 7,383 – 7,491 1– Europe 2,904 – 3,016 –– North America 2,433 – 2,375 –– Other 2,046 – 2,100 1
Fixed Income Total 7,075 5 6,070 6– Government bonds 3,541 2 3,081 –– Investment grade Corporate bonds 2,336 – 2,201 –– Other Fixed Income 1,198 3 788 6
Derivatives 18 – 430 –Private Equity 706 – 686 –Property and Real Estate 1,230 – 1,132 –Hedge Funds 936 – 852 –Other 693 1 574 1
Other plans 272 – 430 –
The fair values of the above equity and fixed income instruments are determined based on quoted market prices in active markets. The fair value of private equity, properties, derivatives and hedge funds are not based on quoted market prices in active markets. The Group uses swaps to hedge some of its exposure to inflation and interest rate risk. Foreign currency exposures in part are also hedged by the use of forward foreign exchange contracts. Assets included in the Other category are commodities, cash and insurance contracts which are also unquoted assets.
Equity securities include Unilever securities amounting to €67 million (0.4% of total plan assets) and €32 million (0.2% of total plan assets) at 31 December 2013 and 2012 respectively. Property includes property occupied by Unilever amounting to €15 million and €16 million at 31 December 2013 and 2012 respectively.
The pension assets above exclude the assets in a Special Benefits Trust amounting to €84 million (2012: €98 million) to fund pension and similar liabilities in the US (see also note 17A on page 126).
SENSITIVITIES The sensitivity of the overall pension liabilities to changes in the weighted key assumptions are:
Change in assumption Change in liabilities
Discount rate Increase by 0.5% 7%Inflation rate Increase by 0.5% +5%Life expectancy Increase by 1 year +3%Long-term medical cost inflation Increase by 1.0% +1%An equivalent decrease in each assumption would have an equal and opposite impact on liabilities.
The sensitivity analyses above have been determined based on reasonably possible changes of the respective assumptions occurring at the end of the reporting period and may not be representative of the actual change. It is based on a change in the key assumption while holding all other assumptions constant. When calculating the sensitivity to the assumption, the same method used to calculate the liability recognised in the balance sheet has been applied. The methods and types of assumptions used in preparing the sensitivity analysis did not change compared with the previous period.
103Unilever Annual Report and Accounts 2013 Financial statements
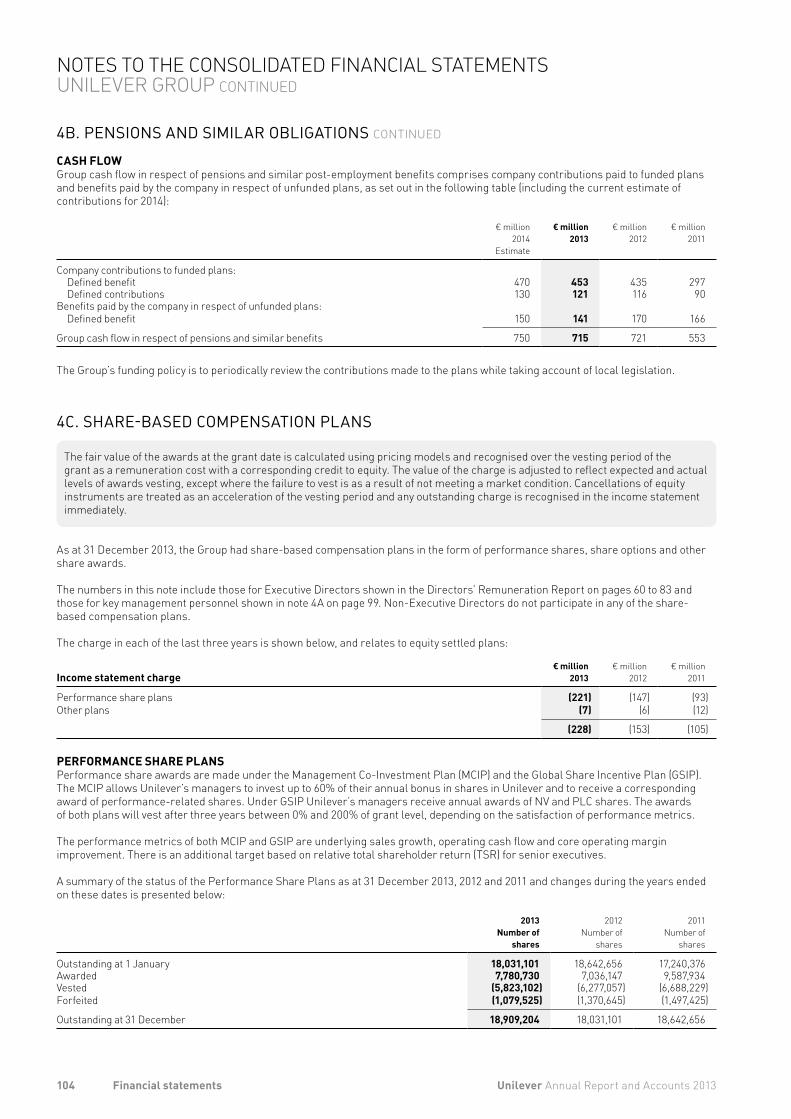
4B. PENSIONS AND SIMILAR OBLIGATIONS CONTINUED
CASH FLOWGroup cash flow in respect of pensions and similar post-employment benefits comprises company contributions paid to funded plans and benefits paid by the company in respect of unfunded plans, as set out in the following table (including the current estimate of contributions for 2014):
€ million2014
Estimate
€ million2013
€ million2012
€ million2011
Company contributions to funded plans:Defined benefit 470 453 435 297Defined contributions 130 121 116 90
Benefits paid by the company in respect of unfunded plans:Defined benefit 150 141 170 166
Group cash flow in respect of pensions and similar benefits 750 715 721 553
The Group’s funding policy is to periodically review the contributions made to the plans while taking account of local legislation.
4C. SHARE-BASED COMPENSATION PLANS
The fair value of the awards at the grant date is calculated using pricing models and recognised over the vesting period of the grant as a remuneration cost with a corresponding credit to equity. The value of the charge is adjusted to reflect expected and actual levels of awards vesting, except where the failure to vest is as a result of not meeting a market condition. Cancellations of equity instruments are treated as an acceleration of the vesting period and any outstanding charge is recognised in the income statement immediately.
As at 31 December 2013, the Group had share-based compensation plans in the form of performance shares, share options and other share awards.
The numbers in this note include those for Executive Directors shown in the Directors’ Remuneration Report on pages 60 to 83 and those for key management personnel shown in note 4A on page 99. Non-Executive Directors do not participate in any of the share-based compensation plans.
The charge in each of the last three years is shown below, and relates to equity settled plans:
Income statement charge
€ million2013
€ million2012
€ million2011
Performance share plans (221) (147) (93)Other plans (7) (6) (12)
(228) (153) (105)
PERFORMANCE SHARE PLANSPerformance share awards are made under the Management Co-Investment Plan (MCIP) and the Global Share Incentive Plan (GSIP). The MCIP allows Unilever’s managers to invest up to 60% of their annual bonus in shares in Unilever and to receive a corresponding award of performance-related shares. Under GSIP Unilever’s managers receive annual awards of NV and PLC shares. The awards of both plans will vest after three years between 0% and 200% of grant level, depending on the satisfaction of performance metrics.
The performance metrics of both MCIP and GSIP are underlying sales growth, operating cash flow and core operating margin improvement. There is an additional target based on relative total shareholder return (TSR) for senior executives.
A summary of the status of the Performance Share Plans as at 31 December 2013, 2012 and 2011 and changes during the years ended on these dates is presented below:
2013Number of
shares
2012Number of
shares
2011Number of
shares
Outstanding at 1 January 18,031,101 18,642,656 17,240,376Awarded 7,780,730 7,036,147 9,587,934Vested (5,823,102) (6,277,057) (6,688,229)Forfeited (1,079,525) (1,370,645) (1,497,425)
Outstanding at 31 December 18,909,204 18,031,101 18,642,656
104 Unilever Annual Report and Accounts 2013Financial statements
NOTES TO THE CONSOLIDATED FINANCIAL STATEMENTS UNILEVER GROUP CONTINUED
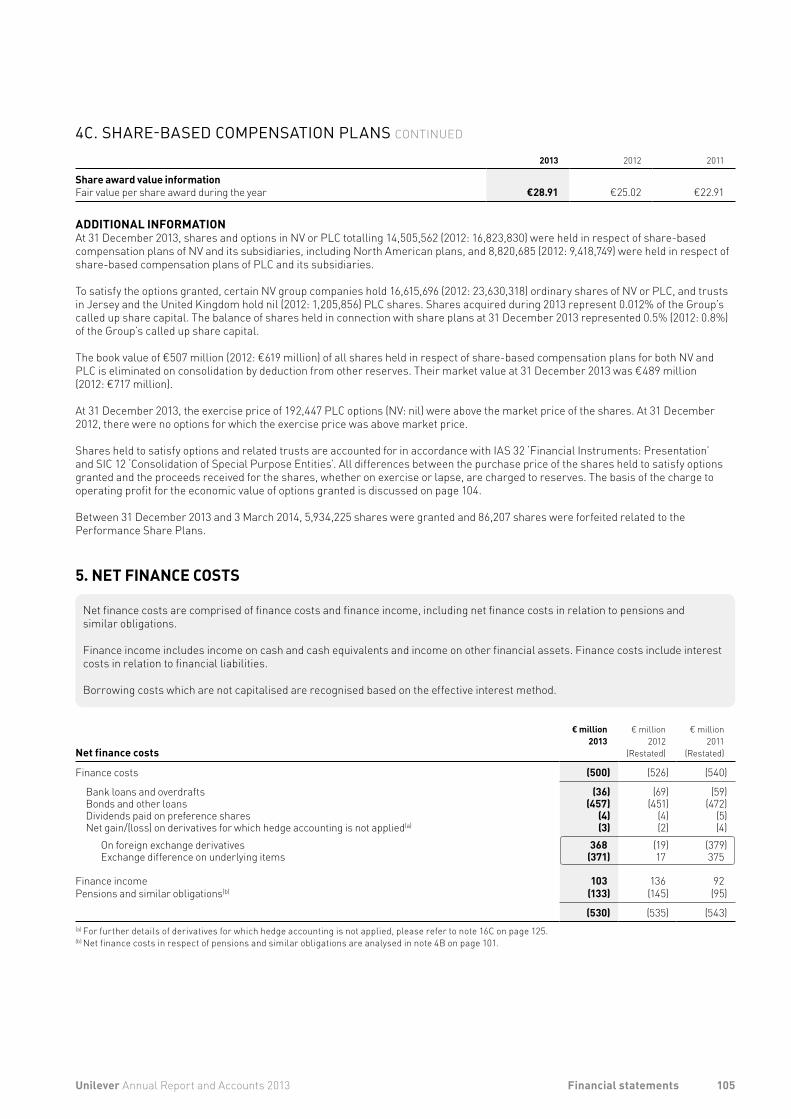
4C. SHARE-BASED COMPENSATION PLANS CONTINUED
2013 2012 2011
Share award value informationFair value per share award during the year €28.91 €25.02 €22.91
ADDITIONAL INFORMATIONAt 31 December 2013, shares and options in NV or PLC totalling 14,505,562 (2012: 16,823,830) were held in respect of share-based compensation plans of NV and its subsidiaries, including North American plans, and 8,820,685 (2012: 9,418,749) were held in respect of share-based compensation plans of PLC and its subsidiaries.
To satisfy the options granted, certain NV group companies hold 16,615,696 (2012: 23,630,318) ordinary shares of NV or PLC, and trusts in Jersey and the United Kingdom hold nil (2012: 1,205,856) PLC shares. Shares acquired during 2013 represent 0.012% of the Group’s called up share capital. The balance of shares held in connection with share plans at 31 December 2013 represented 0.5% (2012: 0.8%) of the Group’s called up share capital.
The book value of €507 million (2012: €619 million) of all shares held in respect of share-based compensation plans for both NV and PLC is eliminated on consolidation by deduction from other reserves. Their market value at 31 December 2013 was €489 million (2012: €717 million).
At 31 December 2013, the exercise price of 192,447 PLC options (NV: nil) were above the market price of the shares. At 31 December 2012, there were no options for which the exercise price was above market price.
Shares held to satisfy options and related trusts are accounted for in accordance with IAS 32 ‘Financial Instruments: Presentation’ and SIC 12 ‘Consolidation of Special Purpose Entities’. All differences between the purchase price of the shares held to satisfy options granted and the proceeds received for the shares, whether on exercise or lapse, are charged to reserves. The basis of the charge to operating profit for the economic value of options granted is discussed on page 104.
Between 31 December 2013 and 3 March 2014, 5,934,225 shares were granted and 86,207 shares were forfeited related to the Performance Share Plans.
5. NET FINANCE COSTS
Net finance costs are comprised of finance costs and finance income, including net finance costs in relation to pensions and similar obligations.
Finance income includes income on cash and cash equivalents and income on other financial assets. Finance costs include interest costs in relation to financial liabilities.
Borrowing costs which are not capitalised are recognised based on the effective interest method.
Net finance costs
€ million2013
€ million2012
(Restated)
€ million2011
(Restated)
Finance costs (500) (526) (540)
Bank loans and overdrafts (36) (69) (59)Bonds and other loans (457) (451) (472)Dividends paid on preference shares (4) (4) (5)Net gain/(loss) on derivatives for which hedge accounting is not applied(a) (3) (2) (4)
On foreign exchange derivatives 368 (19) (379)Exchange difference on underlying items (371) 17 375
Finance income 103 136 92Pensions and similar obligations(b) (133) (145) (95)
(530) (535) (543)(a) For further details of derivatives for which hedge accounting is not applied, please refer to note 16C on page 125. (b) Net finance costs in respect of pensions and similar obligations are analysed in note 4B on page 101.
105Unilever Annual Report and Accounts 2013 Financial statements
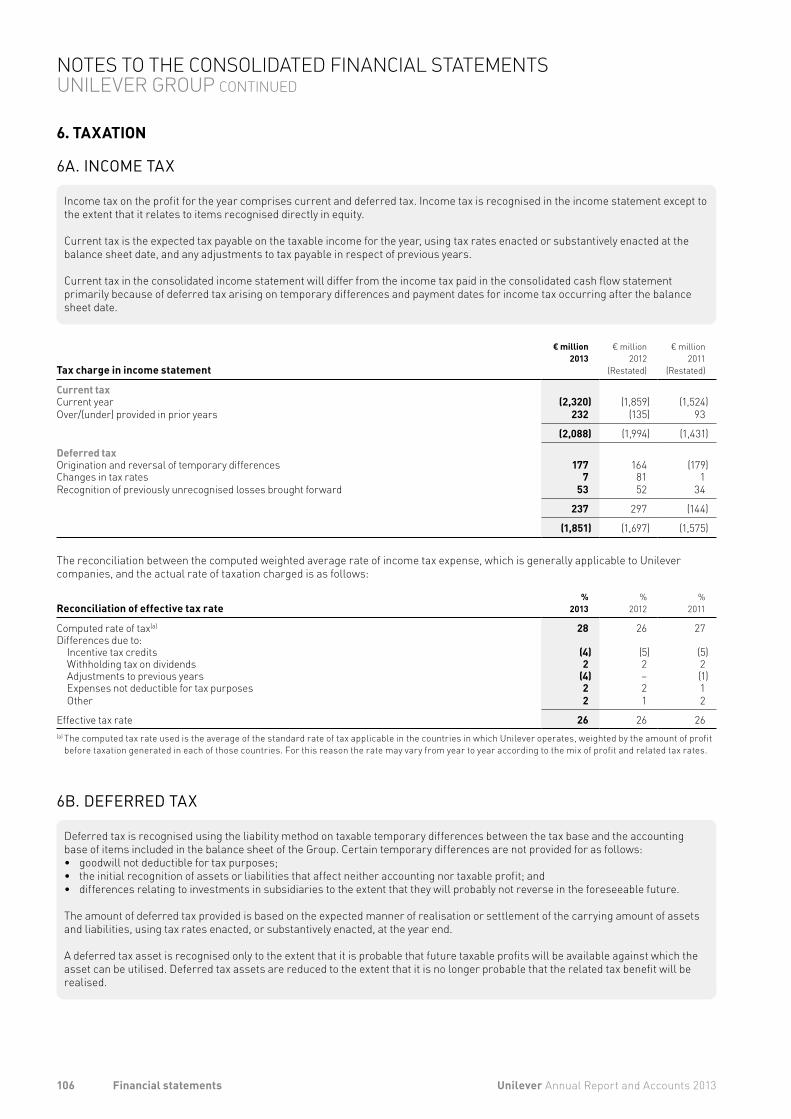
6. TAXATION
6A. INCOME TAX
Income tax on the profit for the year comprises current and deferred tax. Income tax is recognised in the income statement except to the extent that it relates to items recognised directly in equity.
Current tax is the expected tax payable on the taxable income for the year, using tax rates enacted or substantively enacted at the balance sheet date, and any adjustments to tax payable in respect of previous years.
Current tax in the consolidated income statement will differ from the income tax paid in the consolidated cash flow statement primarily because of deferred tax arising on temporary differences and payment dates for income tax occurring after the balance sheet date.
Tax charge in income statement
€ million2013
€ million2012
(Restated)
€ million2011
(Restated)
Current taxCurrent year (2,320) (1,859) (1,524)Over/(under) provided in prior years 232 (135) 93
(2,088) (1,994) (1,431)
Deferred taxOrigination and reversal of temporary differences 177 164 (179)Changes in tax rates 7 81 1 Recognition of previously unrecognised losses brought forward 53 52 34
237 297 (144)
(1,851) (1,697) (1,575)
The reconciliation between the computed weighted average rate of income tax expense, which is generally applicable to Unilever companies, and the actual rate of taxation charged is as follows:
Reconciliation of effective tax rate%
2013%
2012%
2011
Computed rate of tax(a) 28 26 27 Differences due to:
Incentive tax credits (4) (5) (5)Withholding tax on dividends 2 2 2 Adjustments to previous years (4) – (1) Expenses not deductible for tax purposes 2 2 1 Other 2 1 2
Effective tax rate 26 26 26 (a) The computed tax rate used is the average of the standard rate of tax applicable in the countries in which Unilever operates, weighted by the amount of profit
before taxation generated in each of those countries. For this reason the rate may vary from year to year according to the mix of profit and related tax rates.
6B. DEFERRED TAX
Deferred tax is recognised using the liability method on taxable temporary differences between the tax base and the accounting base of items included in the balance sheet of the Group. Certain temporary differences are not provided for as follows: • goodwill not deductible for tax purposes; • the initial recognition of assets or liabilities that affect neither accounting nor taxable profit; and • differences relating to investments in subsidiaries to the extent that they will probably not reverse in the foreseeable future.
The amount of deferred tax provided is based on the expected manner of realisation or settlement of the carrying amount of assets and liabilities, using tax rates enacted, or substantively enacted, at the year end.
A deferred tax asset is recognised only to the extent that it is probable that future taxable profits will be available against which the asset can be utilised. Deferred tax assets are reduced to the extent that it is no longer probable that the related tax benefit will be realised.
106 Unilever Annual Report and Accounts 2013Financial statements
NOTES TO THE CONSOLIDATED FINANCIAL STATEMENTS UNILEVER GROUP CONTINUED
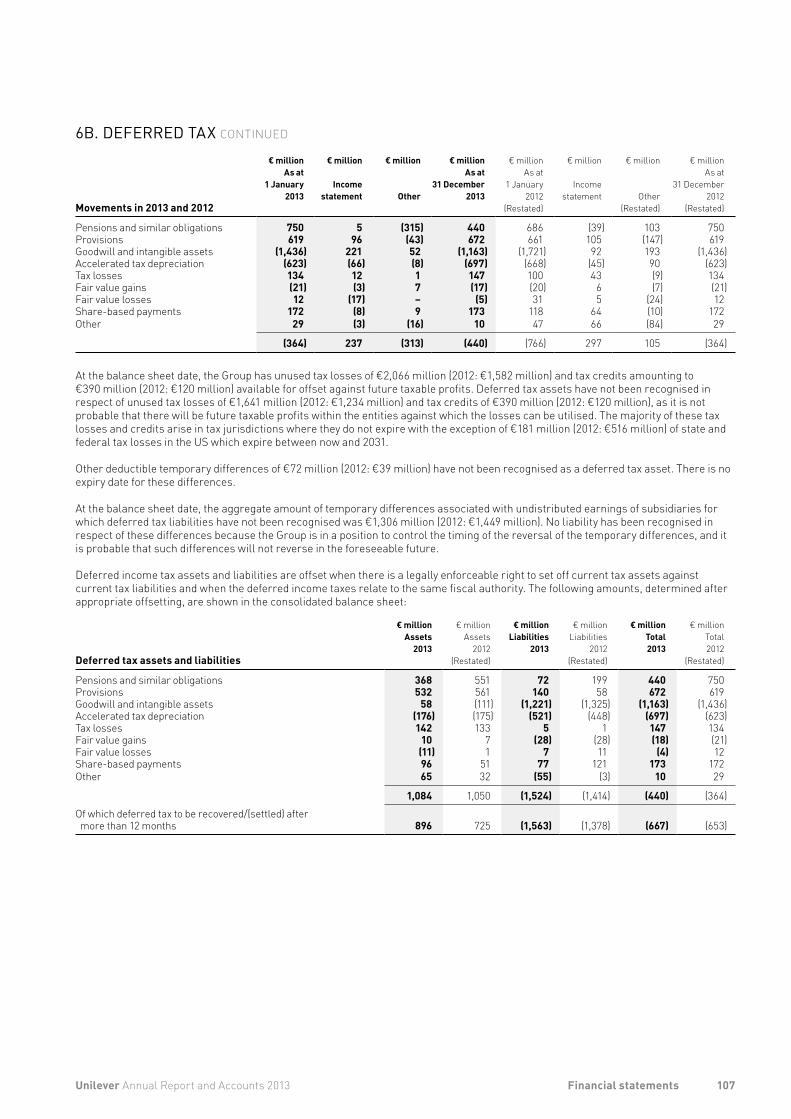
6B. DEFERRED TAX CONTINUED
Movements in 2013 and 2012
€ millionAs at
1 January2013
€ million
Incomestatement
€ million
Other
€ millionAs at
31 December2013
€ millionAs at
1 January2012
(Restated)
€ million
Incomestatement
€ million
Other (Restated)
€ millionAs at
31 December2012
(Restated)
Pensions and similar obligations 750 5 (315) 440 686 (39) 103 750Provisions 619 96 (43) 672 661 105 (147) 619Goodwill and intangible assets (1,436) 221 52 (1,163) (1,721) 92 193 (1,436)Accelerated tax depreciation (623) (66) (8) (697) (668) (45) 90 (623)Tax losses 134 12 1 147 100 43 (9) 134Fair value gains (21) (3) 7 (17) (20) 6 (7) (21)Fair value losses 12 (17) – (5) 31 5 (24) 12Share-based payments 172 (8) 9 173 118 64 (10) 172Other 29 (3) (16) 10 47 66 (84) 29
(364) 237 (313) (440) (766) 297 105 (364)
At the balance sheet date, the Group has unused tax losses of €2,066 million (2012: €1,582 million) and tax credits amounting to €390 million (2012: €120 million) available for offset against future taxable profits. Deferred tax assets have not been recognised in respect of unused tax losses of €1,641 million (2012: €1,234 million) and tax credits of €390 million (2012: €120 million), as it is not probable that there will be future taxable profits within the entities against which the losses can be utilised. The majority of these tax losses and credits arise in tax jurisdictions where they do not expire with the exception of €181 million (2012: €516 million) of state and federal tax losses in the US which expire between now and 2031.
Other deductible temporary differences of €72 million (2012: €39 million) have not been recognised as a deferred tax asset. There is no expiry date for these differences.
At the balance sheet date, the aggregate amount of temporary differences associated with undistributed earnings of subsidiaries for which deferred tax liabilities have not been recognised was €1,306 million (2012: €1,449 million). No liability has been recognised in respect of these differences because the Group is in a position to control the timing of the reversal of the temporary differences, and it is probable that such differences will not reverse in the foreseeable future.
Deferred income tax assets and liabilities are offset when there is a legally enforceable right to set off current tax assets against current tax liabilities and when the deferred income taxes relate to the same fiscal authority. The following amounts, determined after appropriate offsetting, are shown in the consolidated balance sheet:
Deferred tax assets and liabilities
€ millionAssets
2013
€ millionAssets
2012 (Restated)
€ millionLiabilities
2013
€ millionLiabilities
2012 (Restated)
€ millionTotal2013
€ millionTotal2012
(Restated)
Pensions and similar obligations 368 551 72 199 440 750Provisions 532 561 140 58 672 619Goodwill and intangible assets 58 (111) (1,221) (1,325) (1,163) (1,436)Accelerated tax depreciation (176) (175) (521) (448) (697) (623)Tax losses 142 133 5 1 147 134Fair value gains 10 7 (28) (28) (18) (21)Fair value losses (11) 1 7 11 (4) 12Share-based payments 96 51 77 121 173 172Other 65 32 (55) (3) 10 29
1,084 1,050 (1,524) (1,414) (440) (364)Of which deferred tax to be recovered/(settled) after more than 12 months 896 725 (1,563) (1,378) (667) (653)
107Unilever Annual Report and Accounts 2013 Financial statements
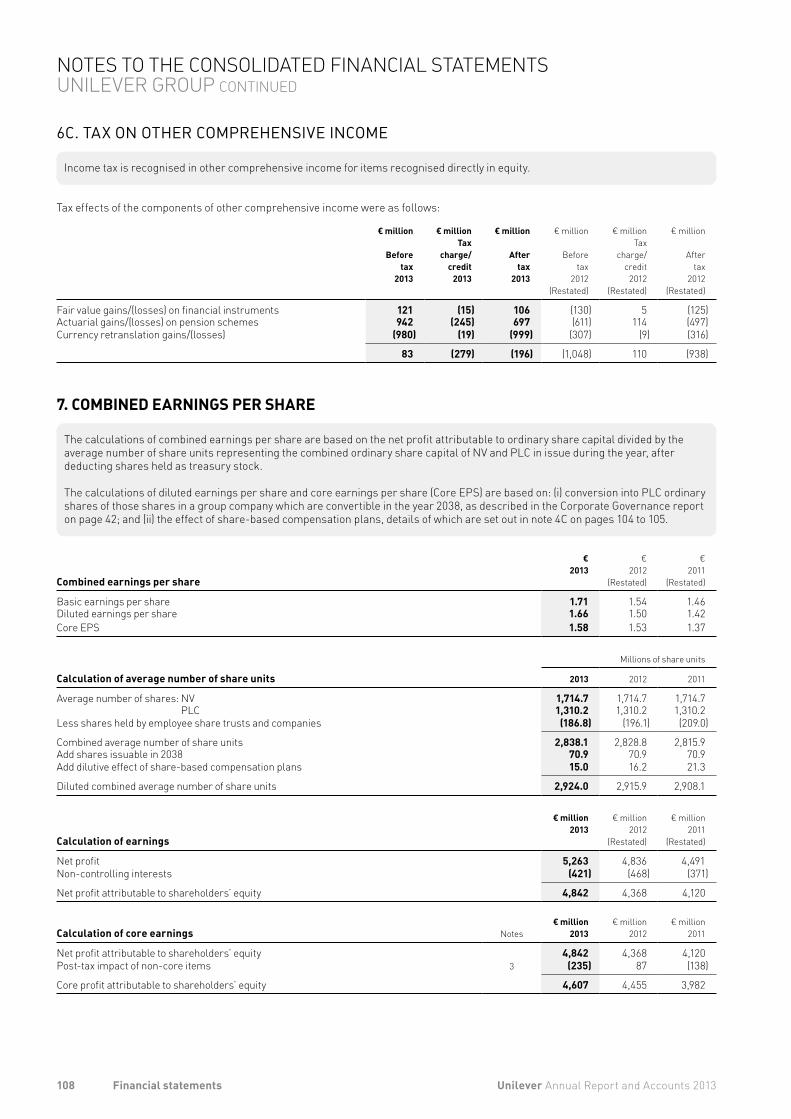
6C. TAX ON OTHER COMPREHENSIVE INCOME
Income tax is recognised in other comprehensive income for items recognised directly in equity.
Tax effects of the components of other comprehensive income were as follows:
€ million
Beforetax
2013
€ millionTax
charge/credit
2013
€ million
Aftertax
2013
€ million
Beforetax
2012 (Restated)
€ millionTax
charge/credit
2012 (Restated)
€ million
Aftertax
2012 (Restated)
Fair value gains/(losses) on financial instruments 121 (15) 106 (130) 5 (125)Actuarial gains/(losses) on pension schemes 942 (245) 697 (611) 114 (497)Currency retranslation gains/(losses) (980) (19) (999) (307) (9) (316)
83 (279) (196) (1,048) 110 (938)
7. COMBINED EARNINGS PER SHARE
The calculations of combined earnings per share are based on the net profit attributable to ordinary share capital divided by the average number of share units representing the combined ordinary share capital of NV and PLC in issue during the year, after deducting shares held as treasury stock.
The calculations of diluted earnings per share and core earnings per share (Core EPS) are based on: (i) conversion into PLC ordinary shares of those shares in a group company which are convertible in the year 2038, as described in the Corporate Governance report on page 42; and (ii) the effect of share-based compensation plans, details of which are set out in note 4C on pages 104 to 105.
Combined earnings per share
€2013
€2012
(Restated)
€2011
(Restated)
Basic earnings per share 1.71 1.54 1.46Diluted earnings per share 1.66 1.50 1.42Core EPS 1.58 1.53 1.37
Millions of share units
Calculation of average number of share units 2013 2012 2011
Average number of shares: NV 1,714.7 1,714.7 1,714.7PLC 1,310.2 1,310.2 1,310.2
Less shares held by employee share trusts and companies (186.8) (196.1) (209.0)
Combined average number of share units 2,838.1 2,828.8 2,815.9Add shares issuable in 2038 70.9 70.9 70.9Add dilutive effect of share-based compensation plans 15.0 16.2 21.3
Diluted combined average number of share units 2,924.0 2,915.9 2,908.1
Calculation of earnings
€ million2013
€ million2012
(Restated)
€ million2011
(Restated)
Net profit 5,263 4,836 4,491Non-controlling interests (421) (468) (371)
Net profit attributable to shareholders’ equity 4,842 4,368 4,120
Calculation of core earnings Notes€ million
2013€ million
2012€ million
2011
Net profit attributable to shareholders’ equity 4,842 4,368 4,120Post-tax impact of non-core items 3 (235) 87 (138)
Core profit attributable to shareholders’ equity 4,607 4,455 3,982
108 Unilever Annual Report and Accounts 2013Financial statements
NOTES TO THE CONSOLIDATED FINANCIAL STATEMENTS UNILEVER GROUP CONTINUED
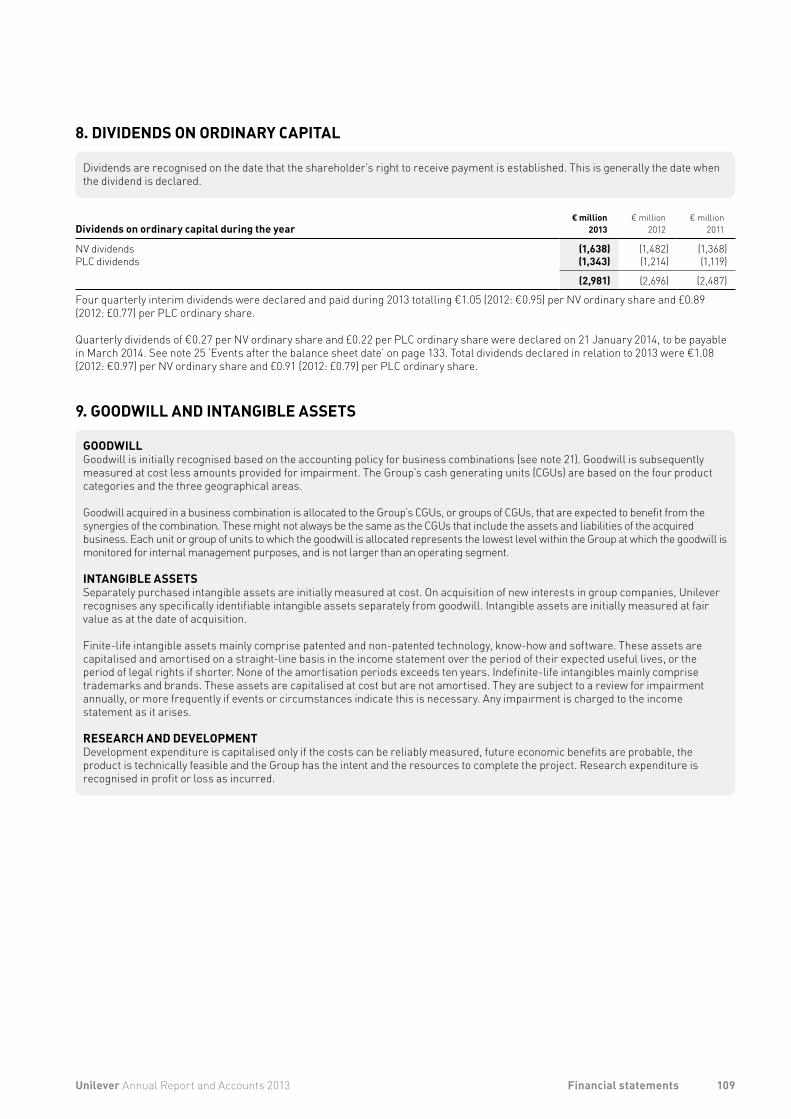
8. DIVIDENDS ON ORDINARY CAPITAL
Dividends are recognised on the date that the shareholder’s right to receive payment is established. This is generally the date when the dividend is declared.
Dividends on ordinary capital during the year€ million
2013€ million
2012€ million
2011
NV dividends (1,638) (1,482) (1,368)PLC dividends (1,343) (1,214) (1,119)
(2,981) (2,696) (2,487)
Four quarterly interim dividends were declared and paid during 2013 totalling €1.05 (2012: €0.95) per NV ordinary share and £0.89 (2012: £0.77) per PLC ordinary share.
Quarterly dividends of €0.27 per NV ordinary share and £0.22 per PLC ordinary share were declared on 21 January 2014, to be payable in March 2014. See note 25 ‘Events after the balance sheet date’ on page 133. Total dividends declared in relation to 2013 were €1.08 (2012: €0.97) per NV ordinary share and £0.91 (2012: £0.79) per PLC ordinary share.
9. GOODWILL AND INTANGIBLE ASSETS
GOODWILLGoodwill is initially recognised based on the accounting policy for business combinations (see note 21). Goodwill is subsequently measured at cost less amounts provided for impairment. The Group’s cash generating units (CGUs) are based on the four product categories and the three geographical areas.
Goodwill acquired in a business combination is allocated to the Group’s CGUs, or groups of CGUs, that are expected to benefit from the synergies of the combination. These might not always be the same as the CGUs that include the assets and liabilities of the acquired business. Each unit or group of units to which the goodwill is allocated represents the lowest level within the Group at which the goodwill is monitored for internal management purposes, and is not larger than an operating segment.
INTANGIBLE ASSETSSeparately purchased intangible assets are initially measured at cost. On acquisition of new interests in group companies, Unilever recognises any specifically identifiable intangible assets separately from goodwill. Intangible assets are initially measured at fair value as at the date of acquisition.
Finite-life intangible assets mainly comprise patented and non-patented technology, know-how and software. These assets are capitalised and amortised on a straight-line basis in the income statement over the period of their expected useful lives, or the period of legal rights if shorter. None of the amortisation periods exceeds ten years. Indefinite-life intangibles mainly comprise trademarks and brands. These assets are capitalised at cost but are not amortised. They are subject to a review for impairment annually, or more frequently if events or circumstances indicate this is necessary. Any impairment is charged to the income statement as it arises.
RESEARCH AND DEVELOPMENTDevelopment expenditure is capitalised only if the costs can be reliably measured, future economic benefits are probable, the product is technically feasible and the Group has the intent and the resources to complete the project. Research expenditure is recognised in profit or loss as incurred.
109Unilever Annual Report and Accounts 2013 Financial statements
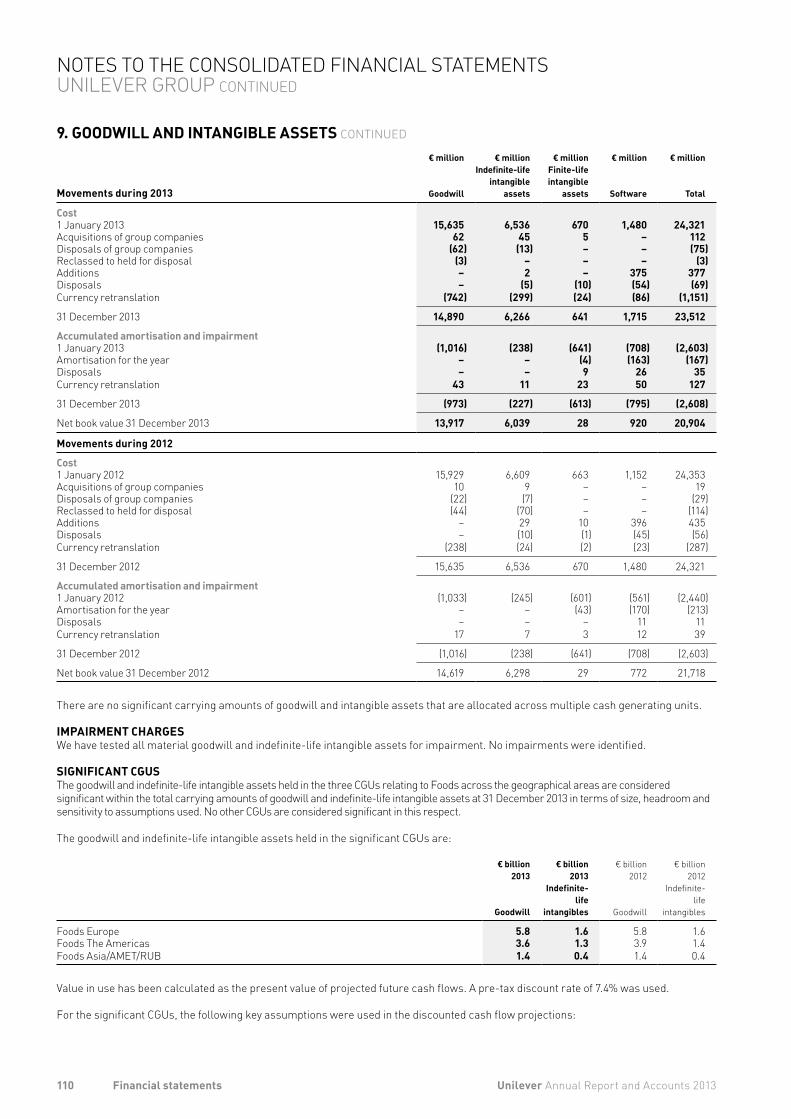
9. GOODWILL AND INTANGIBLE ASSETS CONTINUED
Movements during 2013
€ million
Goodwill
€ millionIndefinitelife
intangibleassets
€ millionFinitelifeintangible
assets
€ million
Software
€ million
Total
Cost1 January 2013 15,635 6,536 670 1,480 24,321Acquisitions of group companies 62 45 5 – 112Disposals of group companies (62) (13) – – (75)Reclassed to held for disposal (3) – – – (3)Additions – 2 – 375 377Disposals – (5) (10) (54) (69)Currency retranslation (742) (299) (24) (86) (1,151)
31 December 2013 14,890 6,266 641 1,715 23,512
Accumulated amortisation and impairment1 January 2013 (1,016) (238) (641) (708) (2,603)Amortisation for the year – – (4) (163) (167)Disposals – – 9 26 35Currency retranslation 43 11 23 50 127
31 December 2013 (973) (227) (613) (795) (2,608)
Net book value 31 December 2013 13,917 6,039 28 920 20,904
Movements during 2012
Cost1 January 2012 15,929 6,609 663 1,152 24,353Acquisitions of group companies 10 9 – – 19Disposals of group companies (22) (7) – – (29)Reclassed to held for disposal (44) (70) – – (114)Additions – 29 10 396 435Disposals – (10) (1) (45) (56)Currency retranslation (238) (24) (2) (23) (287)
31 December 2012 15,635 6,536 670 1,480 24,321
Accumulated amortisation and impairment1 January 2012 (1,033) (245) (601) (561) (2,440)Amortisation for the year – – (43) (170) (213)Disposals – – – 11 11Currency retranslation 17 7 3 12 39
31 December 2012 (1,016) (238) (641) (708) (2,603)
Net book value 31 December 2012 14,619 6,298 29 772 21,718
There are no significant carrying amounts of goodwill and intangible assets that are allocated across multiple cash generating units.
IMPAIRMENT CHARGESWe have tested all material goodwill and indefinite-life intangible assets for impairment. No impairments were identified.
SIGNIFICANT CGUSThe goodwill and indefinite-life intangible assets held in the three CGUs relating to Foods across the geographical areas are considered significant within the total carrying amounts of goodwill and indefinite-life intangible assets at 31 December 2013 in terms of size, headroom and sensitivity to assumptions used. No other CGUs are considered significant in this respect.
The goodwill and indefinite-life intangible assets held in the significant CGUs are:
€ billion2013
Goodwill
€ billion2013
Indefinite life
intangibles
€ billion2012
Goodwill
€ billion2012
Indefinite- life
intangibles
Foods Europe 5.8 1.6 5.8 1.6Foods The Americas 3.6 1.3 3.9 1.4Foods Asia/AMET/RUB 1.4 0.4 1.4 0.4
Value in use has been calculated as the present value of projected future cash flows. A pre-tax discount rate of 7.4% was used.
For the significant CGUs, the following key assumptions were used in the discounted cash flow projections:
110 Unilever Annual Report and Accounts 2013Financial statements
NOTES TO THE CONSOLIDATED FINANCIAL STATEMENTS UNILEVER GROUP CONTINUED
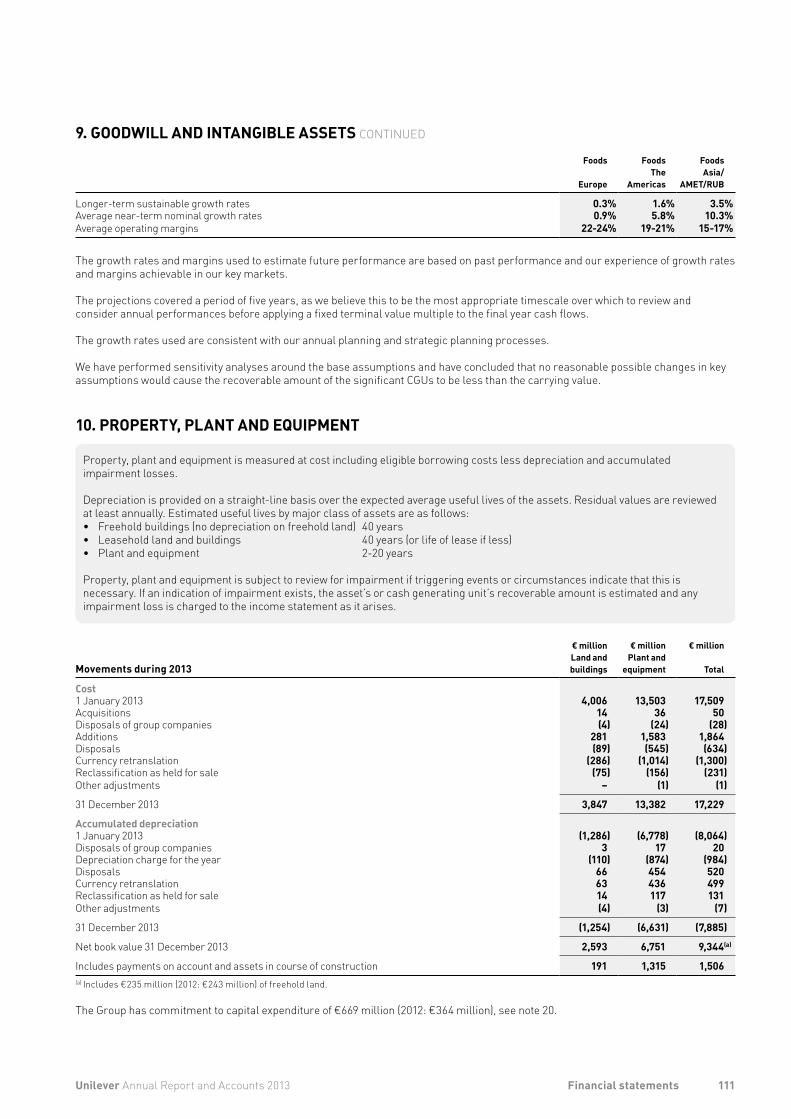
9. GOODWILL AND INTANGIBLE ASSETS CONTINUED
Foods
Europe
FoodsThe
Americas
FoodsAsia/
AMET/RUB
Longer-term sustainable growth rates 0.3% 1.6% 3.5%Average near-term nominal growth rates 0.9% 5.8% 10.3%Average operating margins 2224% 1921% 1517%
The growth rates and margins used to estimate future performance are based on past performance and our experience of growth rates and margins achievable in our key markets.
The projections covered a period of five years, as we believe this to be the most appropriate timescale over which to review and consider annual performances before applying a fixed terminal value multiple to the final year cash flows.
The growth rates used are consistent with our annual planning and strategic planning processes.
We have performed sensitivity analyses around the base assumptions and have concluded that no reasonable possible changes in key assumptions would cause the recoverable amount of the significant CGUs to be less than the carrying value.
10. PROPERTY, PLANT AND EQUIPMENT
Property, plant and equipment is measured at cost including eligible borrowing costs less depreciation and accumulated impairment losses.
Depreciation is provided on a straight-line basis over the expected average useful lives of the assets. Residual values are reviewed at least annually. Estimated useful lives by major class of assets are as follows:• Freehold buildings (no depreciation on freehold land) 40 years• Leasehold land and buildings 40 years (or life of lease if less)• Plant and equipment 2-20 years
Property, plant and equipment is subject to review for impairment if triggering events or circumstances indicate that this is necessary. If an indication of impairment exists, the asset’s or cash generating unit’s recoverable amount is estimated and any impairment loss is charged to the income statement as it arises.
Movements during 2013
€ millionLand andbuildings
€ millionPlant and
equipment
€ million
Total
Cost1 January 2013 4,006 13,503 17,509Acquisitions 14 36 50Disposals of group companies (4) (24) (28)Additions 281 1,583 1,864Disposals (89) (545) (634)Currency retranslation (286) (1,014) (1,300)Reclassification as held for sale (75) (156) (231)Other adjustments – (1) (1)
31 December 2013 3,847 13,382 17,229
Accumulated depreciation1 January 2013 (1,286) (6,778) (8,064)Disposals of group companies 3 17 20Depreciation charge for the year (110) (874) (984)Disposals 66 454 520Currency retranslation 63 436 499Reclassification as held for sale 14 117 131Other adjustments (4) (3) (7)
31 December 2013 (1,254) (6,631) (7,885)
Net book value 31 December 2013 2,593 6,751 9,344(a)
Includes payments on account and assets in course of construction 191 1,315 1,506(a) Includes €235 million (2012: €243 million) of freehold land.
The Group has commitment to capital expenditure of €669 million (2012: €364 million), see note 20.
111Unilever Annual Report and Accounts 2013 Financial statements
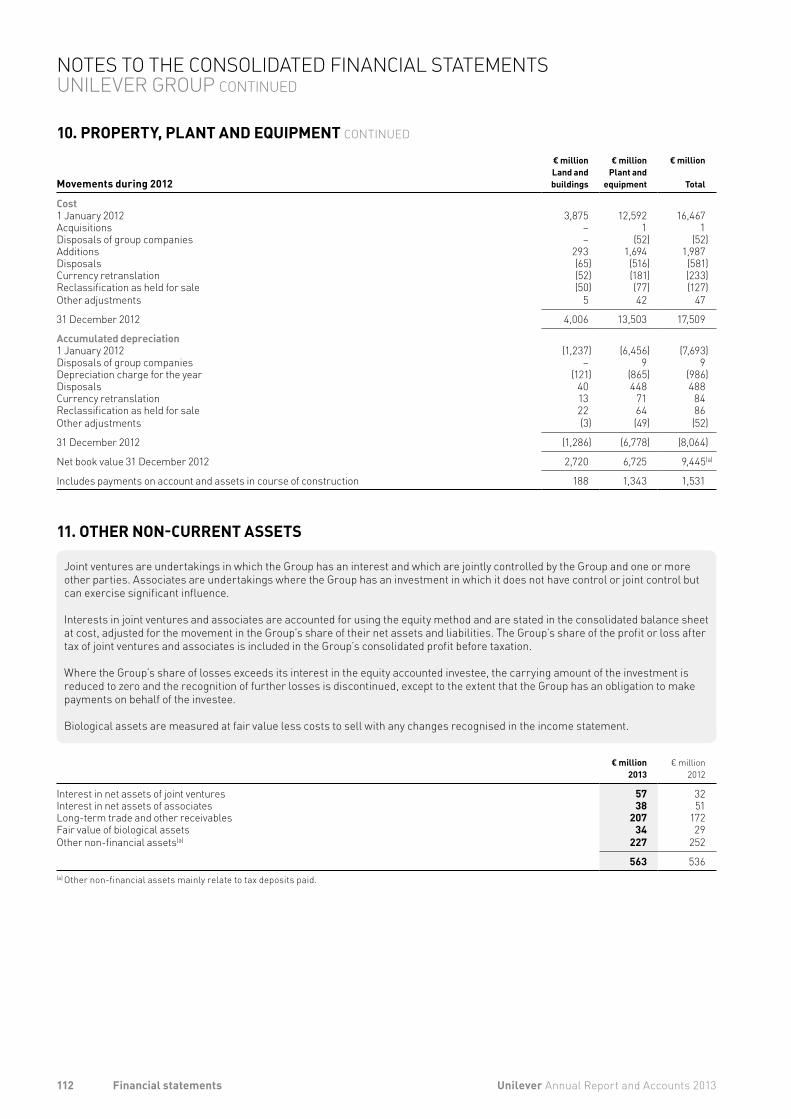
10. PROPERTY, PLANT AND EQUIPMENT CONTINUED
Movements during 2012
€ millionLand andbuildings
€ millionPlant and
equipment
€ million
Total
Cost1 January 2012 3,875 12,592 16,467Acquisitions – 1 1Disposals of group companies – (52) (52)Additions 293 1,694 1,987Disposals (65) (516) (581)Currency retranslation (52) (181) (233)Reclassification as held for sale (50) (77) (127)Other adjustments 5 42 47
31 December 2012 4,006 13,503 17,509
Accumulated depreciation1 January 2012 (1,237) (6,456) (7,693)Disposals of group companies – 9 9Depreciation charge for the year (121) (865) (986)Disposals 40 448 488Currency retranslation 13 71 84Reclassification as held for sale 22 64 86Other adjustments (3) (49) (52)
31 December 2012 (1,286) (6,778) (8,064)
Net book value 31 December 2012 2,720 6,725 9,445(a)
Includes payments on account and assets in course of construction 188 1,343 1,531
11. OTHER NON-CURRENT ASSETS
Joint ventures are undertakings in which the Group has an interest and which are jointly controlled by the Group and one or more other parties. Associates are undertakings where the Group has an investment in which it does not have control or joint control but can exercise significant influence.
Interests in joint ventures and associates are accounted for using the equity method and are stated in the consolidated balance sheet at cost, adjusted for the movement in the Group’s share of their net assets and liabilities. The Group’s share of the profit or loss after tax of joint ventures and associates is included in the Group’s consolidated profit before taxation.
Where the Group’s share of losses exceeds its interest in the equity accounted investee, the carrying amount of the investment is reduced to zero and the recognition of further losses is discontinued, except to the extent that the Group has an obligation to make payments on behalf of the investee.
Biological assets are measured at fair value less costs to sell with any changes recognised in the income statement.
€ million2013
€ million2012
Interest in net assets of joint ventures 57 32 Interest in net assets of associates 38 51 Long-term trade and other receivables 207 172Fair value of biological assets 34 29Other non-financial assets(a) 227 252
563 536 (a) Other non-financial assets mainly relate to tax deposits paid.
112 Unilever Annual Report and Accounts 2013Financial statements
NOTES TO THE CONSOLIDATED FINANCIAL STATEMENTS UNILEVER GROUP CONTINUED
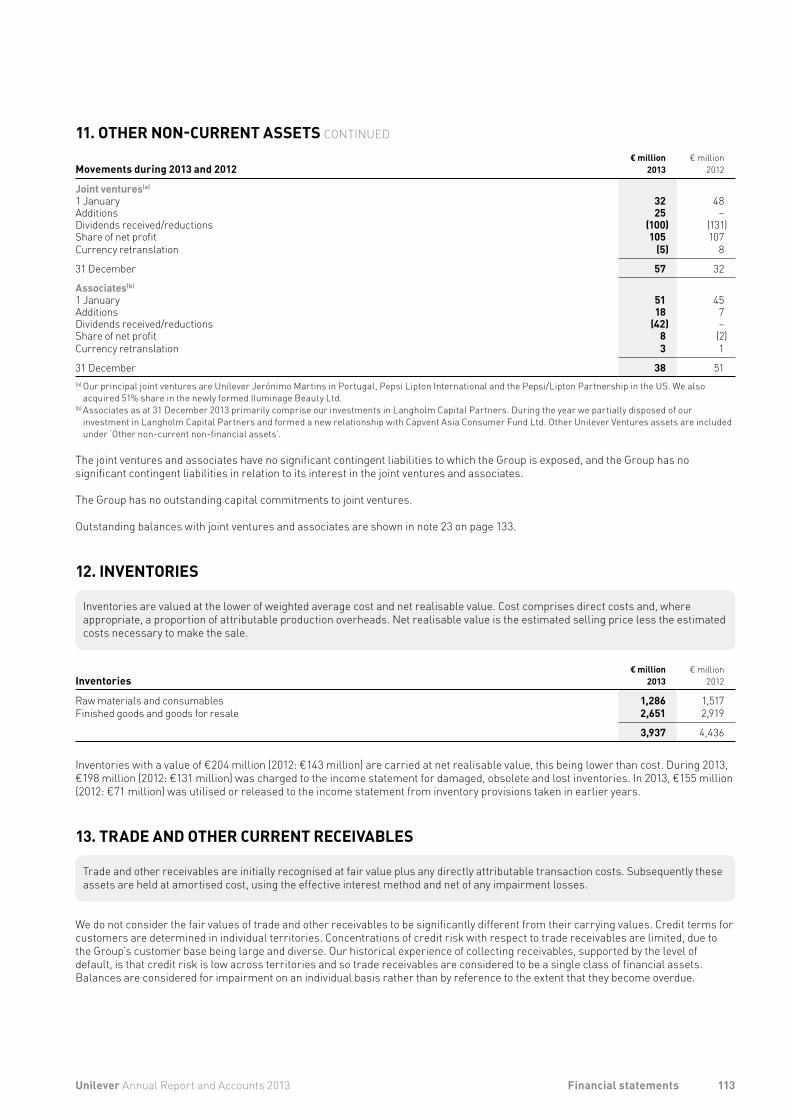
11. OTHER NON-CURRENT ASSETS CONTINUED
Movements during 2013 and 2012€ million
2013€ million
2012
Joint ventures(a)
1 January 32 48Additions 25 –Dividends received/reductions (100) (131)Share of net profit 105 107Currency retranslation (5) 8
31 December 57 32
Associates(b)
1 January 51 45Additions 18 7Dividends received/reductions (42) –Share of net profit 8 (2)Currency retranslation 3 1
31 December 38 51(a) Our principal joint ventures are Unilever Jerónimo Martins in Portugal, Pepsi Lipton International and the Pepsi/Lipton Partnership in the US. We also
acquired 51% share in the newly formed IIuminage Beauty Ltd.(b) Associates as at 31 December 2013 primarily comprise our investments in Langholm Capital Partners. During the year we partially disposed of our
investment in Langholm Capital Partners and formed a new relationship with Capvent Asia Consumer Fund Ltd. Other Unilever Ventures assets are included under ‘Other non-current non-financial assets’.
The joint ventures and associates have no significant contingent liabilities to which the Group is exposed, and the Group has no significant contingent liabilities in relation to its interest in the joint ventures and associates.
The Group has no outstanding capital commitments to joint ventures.
Outstanding balances with joint ventures and associates are shown in note 23 on page 133.
12. INVENTORIES
Inventories are valued at the lower of weighted average cost and net realisable value. Cost comprises direct costs and, where appropriate, a proportion of attributable production overheads. Net realisable value is the estimated selling price less the estimated costs necessary to make the sale.
Inventories€ million
2013€ million
2012
Raw materials and consumables 1,286 1,517Finished goods and goods for resale 2,651 2,919
3,937 4,436
Inventories with a value of €204 million (2012: €143 million) are carried at net realisable value, this being lower than cost. During 2013, €198 million (2012: €131 million) was charged to the income statement for damaged, obsolete and lost inventories. In 2013, €155 million (2012: €71 million) was utilised or released to the income statement from inventory provisions taken in earlier years.
13. TRADE AND OTHER CURRENT RECEIVABLES
Trade and other receivables are initially recognised at fair value plus any directly attributable transaction costs. Subsequently these assets are held at amortised cost, using the effective interest method and net of any impairment losses.
We do not consider the fair values of trade and other receivables to be significantly different from their carrying values. Credit terms for customers are determined in individual territories. Concentrations of credit risk with respect to trade receivables are limited, due to the Group’s customer base being large and diverse. Our historical experience of collecting receivables, supported by the level of default, is that credit risk is low across territories and so trade receivables are considered to be a single class of financial assets. Balances are considered for impairment on an individual basis rather than by reference to the extent that they become overdue.
113Unilever Annual Report and Accounts 2013 Financial statements
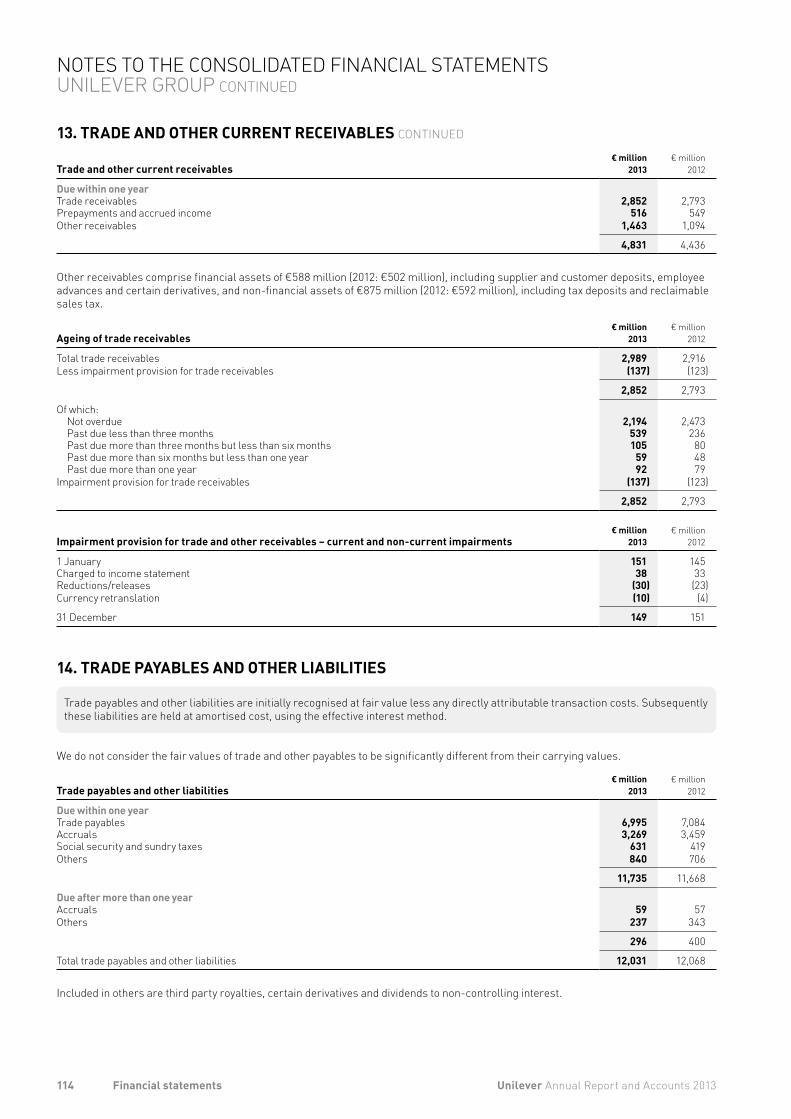
13. TRADE AND OTHER CURRENT RECEIVABLES CONTINUED
Trade and other current receivables€ million
2013€ million
2012
Due within one yearTrade receivables 2,852 2,793Prepayments and accrued income 516 549Other receivables 1,463 1,094
4,831 4,436
Other receivables comprise financial assets of €588 million (2012: €502 million), including supplier and customer deposits, employeeadvances and certain derivatives, and non-financial assets of €875 million (2012: €592 million), including tax deposits and reclaimablesales tax.
Ageing of trade receivables € million
2013€ million
2012
Total trade receivables 2,989 2,916Less impairment provision for trade receivables (137) (123)
2,852 2,793
Of which:Not overdue 2,194 2,473Past due less than three months 539 236Past due more than three months but less than six months 105 80Past due more than six months but less than one year 59 48Past due more than one year 92 79
Impairment provision for trade receivables (137) (123)
2,852 2,793
Impairment provision for trade and other receivables – current and noncurrent impairments€ million
2013€ million
2012
1 January 151 145Charged to income statement 38 33Reductions/releases (30) (23)Currency retranslation (10) (4)
31 December 149 151
14. TRADE PAYABLES AND OTHER LIABILITIES
Trade payables and other liabilities are initially recognised at fair value less any directly attributable transaction costs. Subsequently these liabilities are held at amortised cost, using the effective interest method.
We do not consider the fair values of trade and other payables to be significantly different from their carrying values.
Trade payables and other liabilities€ million
2013€ million
2012
Due within one yearTrade payables 6,995 7,084Accruals 3,269 3,459Social security and sundry taxes 631 419Others 840 706
11,735 11,668
Due after more than one yearAccruals 59 57Others 237 343
296 400
Total trade payables and other liabilities 12,031 12,068
Included in others are third party royalties, certain derivatives and dividends to non-controlling interest.
114 Unilever Annual Report and Accounts 2013Financial statements
NOTES TO THE CONSOLIDATED FINANCIAL STATEMENTS UNILEVER GROUP CONTINUED
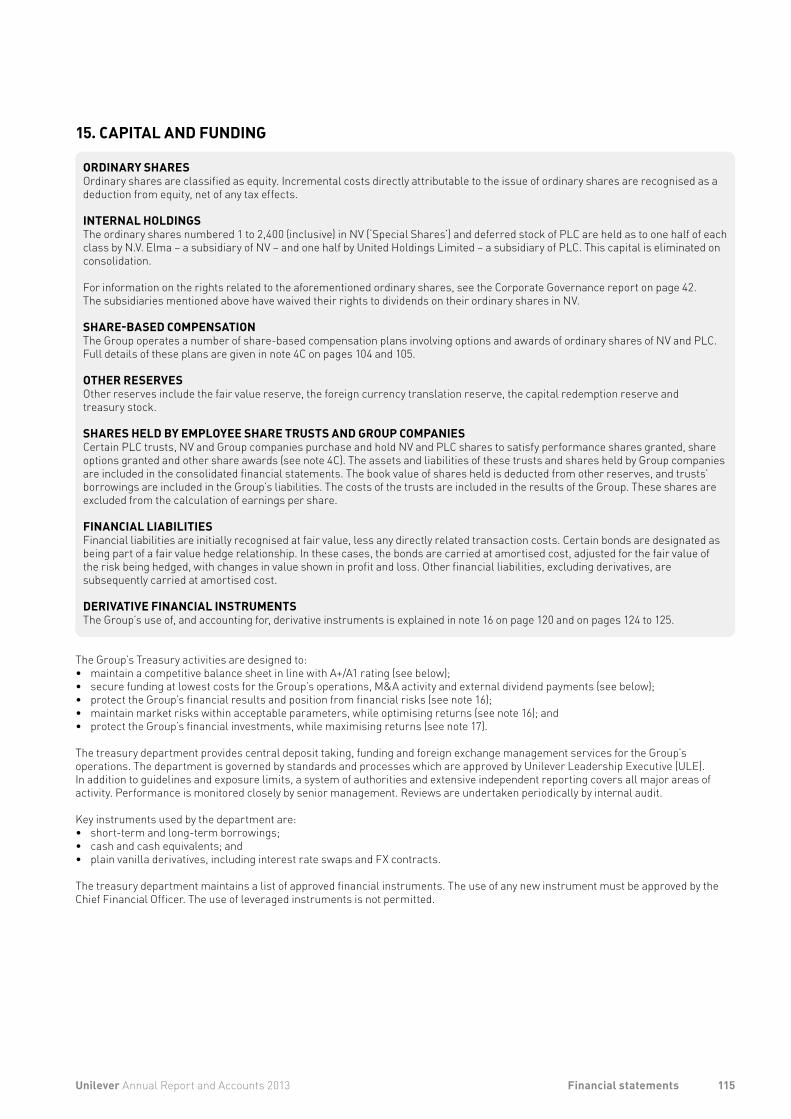
15. CAPITAL AND FUNDING
ORDINARY SHARESOrdinary shares are classified as equity. Incremental costs directly attributable to the issue of ordinary shares are recognised as a deduction from equity, net of any tax effects.
INTERNAL HOLDINGSThe ordinary shares numbered 1 to 2,400 (inclusive) in NV (‘Special Shares’) and deferred stock of PLC are held as to one half of each class by N.V. Elma – a subsidiary of NV – and one half by United Holdings Limited – a subsidiary of PLC. This capital is eliminated on consolidation.
For information on the rights related to the aforementioned ordinary shares, see the Corporate Governance report on page 42. The subsidiaries mentioned above have waived their rights to dividends on their ordinary shares in NV.
SHARE-BASED COMPENSATIONThe Group operates a number of share-based compensation plans involving options and awards of ordinary shares of NV and PLC. Full details of these plans are given in note 4C on pages 104 and 105.
OTHER RESERVESOther reserves include the fair value reserve, the foreign currency translation reserve, the capital redemption reserve and treasury stock.
SHARES HELD BY EMPLOYEE SHARE TRUSTS AND GROUP COMPANIESCertain PLC trusts, NV and Group companies purchase and hold NV and PLC shares to satisfy performance shares granted, share options granted and other share awards (see note 4C). The assets and liabilities of these trusts and shares held by Group companies are included in the consolidated financial statements. The book value of shares held is deducted from other reserves, and trusts’ borrowings are included in the Group’s liabilities. The costs of the trusts are included in the results of the Group. These shares are excluded from the calculation of earnings per share.
FINANCIAL LIABILITIESFinancial liabilities are initially recognised at fair value, less any directly related transaction costs. Certain bonds are designated as being part of a fair value hedge relationship. In these cases, the bonds are carried at amortised cost, adjusted for the fair value of the risk being hedged, with changes in value shown in profit and loss. Other financial liabilities, excluding derivatives, are subsequently carried at amortised cost.
DERIVATIVE FINANCIAL INSTRUMENTSThe Group’s use of, and accounting for, derivative instruments is explained in note 16 on page 120 and on pages 124 to 125.
The Group’s Treasury activities are designed to: • maintain a competitive balance sheet in line with A+/A1 rating (see below);• secure funding at lowest costs for the Group’s operations, M&A activity and external dividend payments (see below);• protect the Group’s financial results and position from financial risks (see note 16);• maintain market risks within acceptable parameters, while optimising returns (see note 16); and• protect the Group’s financial investments, while maximising returns (see note 17).
The treasury department provides central deposit taking, funding and foreign exchange management services for the Group’s operations. The department is governed by standards and processes which are approved by Unilever Leadership Executive (ULE). In addition to guidelines and exposure limits, a system of authorities and extensive independent reporting covers all major areas of activity. Performance is monitored closely by senior management. Reviews are undertaken periodically by internal audit.
Key instruments used by the department are: • short-term and long-term borrowings;• cash and cash equivalents; and• plain vanilla derivatives, including interest rate swaps and FX contracts.
The treasury department maintains a list of approved financial instruments. The use of any new instrument must be approved by the Chief Financial Officer. The use of leveraged instruments is not permitted.
115Unilever Annual Report and Accounts 2013 Financial statements
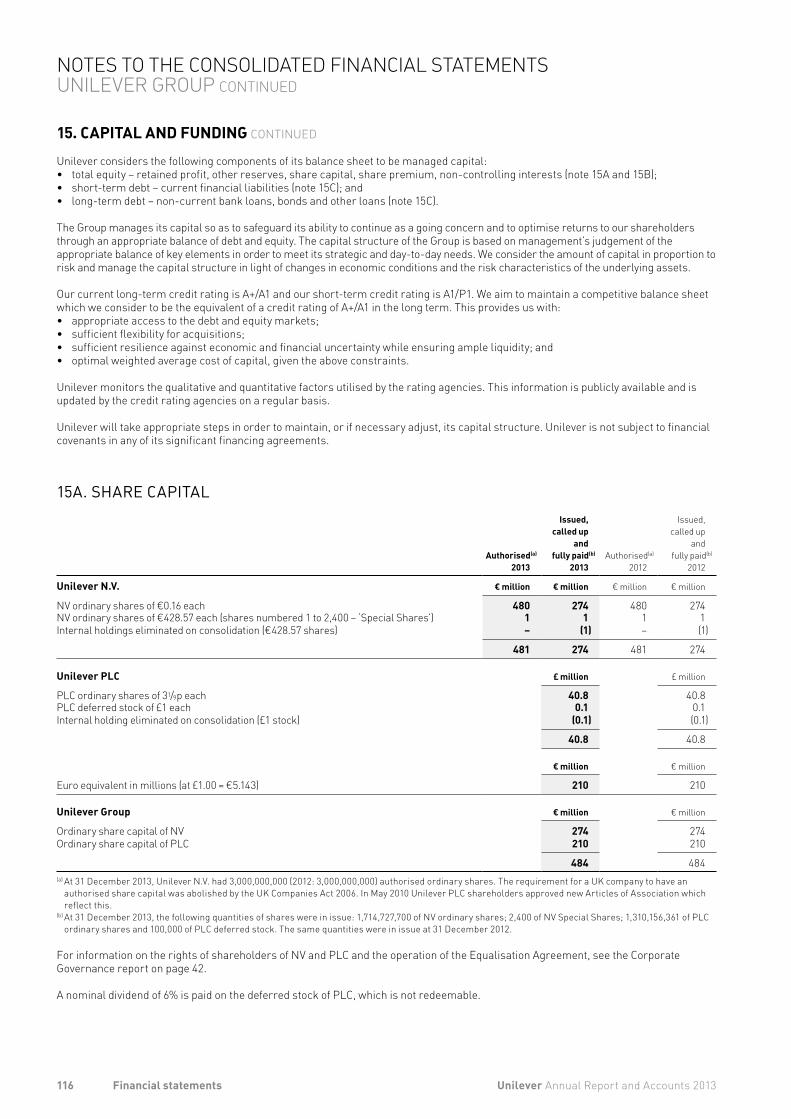
15. CAPITAL AND FUNDING CONTINUED
Unilever considers the following components of its balance sheet to be managed capital: • total equity – retained profit, other reserves, share capital, share premium, non-controlling interests (note 15A and 15B);• short-term debt – current financial liabilities (note 15C); and• long-term debt – non-current bank loans, bonds and other loans (note 15C).
The Group manages its capital so as to safeguard its ability to continue as a going concern and to optimise returns to our shareholders through an appropriate balance of debt and equity. The capital structure of the Group is based on management’s judgement of the appropriate balance of key elements in order to meet its strategic and day-to-day needs. We consider the amount of capital in proportion to risk and manage the capital structure in light of changes in economic conditions and the risk characteristics of the underlying assets.
Our current long-term credit rating is A+/A1 and our short-term credit rating is A1/P1. We aim to maintain a competitive balance sheet which we consider to be the equivalent of a credit rating of A+/A1 in the long term. This provides us with: • appropriate access to the debt and equity markets;• sufficient flexibility for acquisitions;• sufficient resilience against economic and financial uncertainty while ensuring ample liquidity; and• optimal weighted average cost of capital, given the above constraints.
Unilever monitors the qualitative and quantitative factors utilised by the rating agencies. This information is publicly available and is updated by the credit rating agencies on a regular basis.
Unilever will take appropriate steps in order to maintain, or if necessary adjust, its capital structure. Unilever is not subject to financial covenants in any of its significant financing agreements.
15A. SHARE CAPITAL
Authorised(a)
2013
Issued,called up
andfully paid(b)
2013
Authorised(a)
2012
Issued,called up
andfully paid(b)
2012
Unilever N.V. € million € million € million € million
NV ordinary shares of €0.16 each 480 274 480 274 NV ordinary shares of €428.57 each (shares numbered 1 to 2,400 – ‘Special Shares’) 1 1 1 1 Internal holdings eliminated on consolidation (€428.57 shares) – (1) – (1)
481 274 481 274
Unilever PLC £ million £ million
PLC ordinary shares of 31/9p each 40.8 40.8PLC deferred stock of £1 each 0.1 0.1Internal holding eliminated on consolidation (£1 stock) (0.1) (0.1)
40.8 40.8
€ million € million
Euro equivalent in millions (at £1.00 = €5.143) 210 210
Unilever Group € million € million
Ordinary share capital of NV 274 274 Ordinary share capital of PLC 210 210
484 484 (a) At 31 December 2013, Unilever N.V. had 3,000,000,000 (2012: 3,000,000,000) authorised ordinary shares. The requirement for a UK company to have an
authorised share capital was abolished by the UK Companies Act 2006. In May 2010 Unilever PLC shareholders approved new Articles of Association which reflect this.
(b) At 31 December 2013, the following quantities of shares were in issue: 1,714,727,700 of NV ordinary shares; 2,400 of NV Special Shares; 1,310,156,361 of PLC ordinary shares and 100,000 of PLC deferred stock. The same quantities were in issue at 31 December 2012.
For information on the rights of shareholders of NV and PLC and the operation of the Equalisation Agreement, see the Corporate Governance report on page 42.
A nominal dividend of 6% is paid on the deferred stock of PLC, which is not redeemable.
116 Unilever Annual Report and Accounts 2013Financial statements
NOTES TO THE CONSOLIDATED FINANCIAL STATEMENTS UNILEVER GROUP CONTINUED
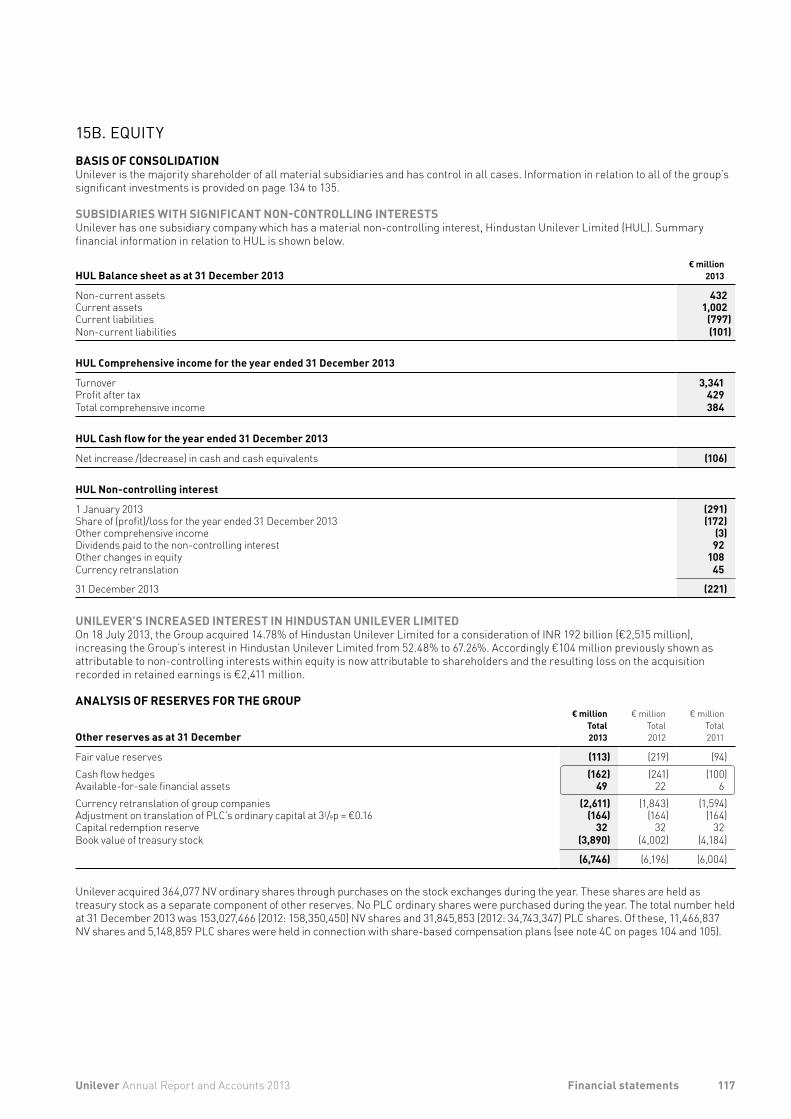
15B. EQUITYBASIS OF CONSOLIDATIONUnilever is the majority shareholder of all material subsidiaries and has control in all cases. Information in relation to all of the group’s significant investments is provided on page 134 to 135.
SUBSIDIARIES WITH SIGNIFICANT NON-CONTROLLING INTERESTSUnilever has one subsidiary company which has a material non-controlling interest, Hindustan Unilever Limited (HUL). Summary financial information in relation to HUL is shown below.
HUL Balance sheet as at 31 December 2013€ million
2013
Non-current assets 432Current assets 1,002Current liabilities (797)Non-current liabilities (101)
HUL Comprehensive income for the year ended 31 December 2013
Turnover 3,341Profit after tax 429Total comprehensive income 384
HUL Cash flow for the year ended 31 December 2013
Net increase /(decrease) in cash and cash equivalents (106)
HUL Non-controlling interest
1 January 2013 (291)Share of (profit)/loss for the year ended 31 December 2013 (172)Other comprehensive income (3)Dividends paid to the non-controlling interest 92Other changes in equity 108Currency retranslation 45
31 December 2013 (221)
UNILEVER’S INCREASED INTEREST IN HINDUSTAN UNILEVER LIMITEDOn 18 July 2013, the Group acquired 14.78% of Hindustan Unilever Limited for a consideration of INR 192 billion (€2,515 million),increasing the Group’s interest in Hindustan Unilever Limited from 52.48% to 67.26%. Accordingly €104 million previously shown asattributable to non-controlling interests within equity is now attributable to shareholders and the resulting loss on the acquisitionrecorded in retained earnings is €2,411 million.
ANALYSIS OF RESERVES FOR THE GROUP
Other reserves as at 31 December
€ millionTotal2013
€ millionTotal2012
€ millionTotal2011
Fair value reserves (113) (219) (94)Cash flow hedges (162) (241) (100)Available-for-sale financial assets 49 22 6 Currency retranslation of group companies (2,611) (1,843) (1,594)Adjustment on translation of PLC’s ordinary capital at 31/9p = €0.16 (164) (164) (164)Capital redemption reserve 32 32 32Book value of treasury stock (3,890) (4,002) (4,184)
(6,746) (6,196) (6,004)
Unilever acquired 364,077 NV ordinary shares through purchases on the stock exchanges during the year. These shares are held as treasury stock as a separate component of other reserves. No PLC ordinary shares were purchased during the year. The total number held at 31 December 2013 was 153,027,466 (2012: 158,350,450) NV shares and 31,845,853 (2012: 34,743,347) PLC shares. Of these, 11,466,837 NV shares and 5,148,859 PLC shares were held in connection with share-based compensation plans (see note 4C on pages 104 and 105).
117Unilever Annual Report and Accounts 2013 Financial statements
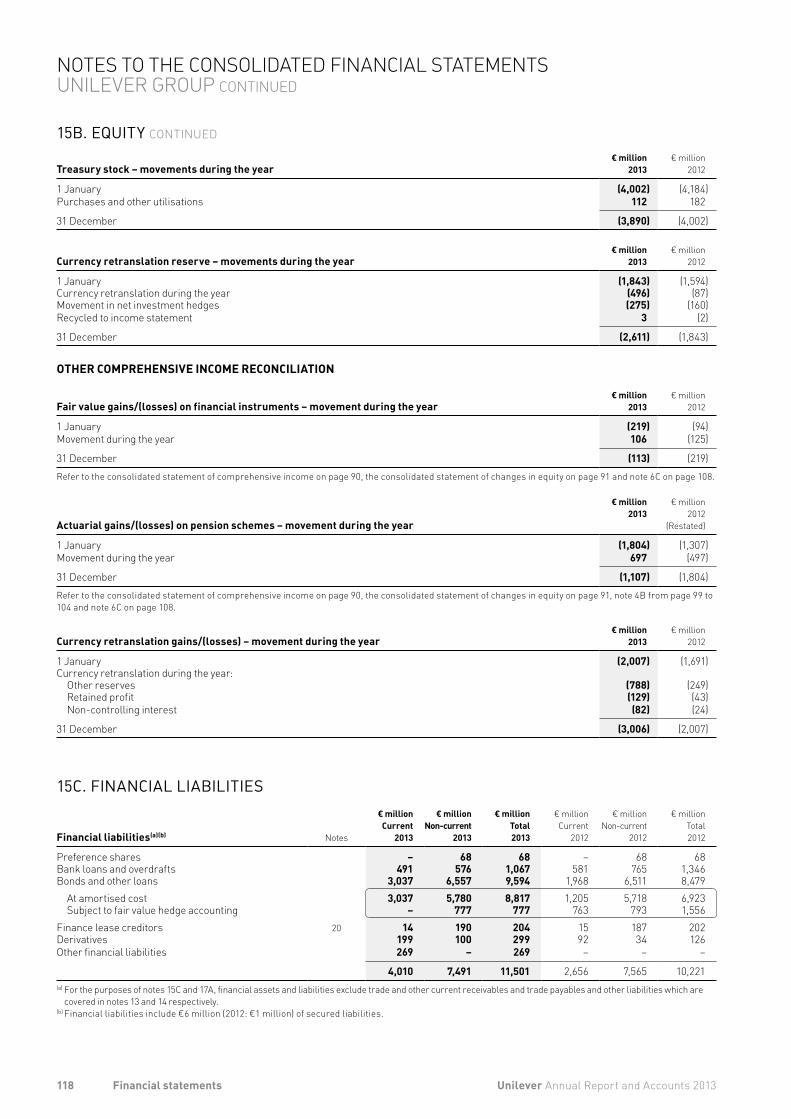
15B. EQUITY CONTINUED
Treasury stock – movements during the year€ million
2013€ million
2012
1 January (4,002) (4,184)Purchases and other utilisations 112 182
31 December (3,890) (4,002)
Currency retranslation reserve – movements during the year€ million
2013€ million
2012
1 January (1,843) (1,594)Currency retranslation during the year (496) (87)Movement in net investment hedges (275) (160)Recycled to income statement 3 (2)
31 December (2,611) (1,843)
OTHER COMPREHENSIVE INCOME RECONCILIATION
Fair value gains/(losses) on financial instruments – movement during the year€ million
2013€ million
2012
1 January (219) (94)Movement during the year 106 (125)
31 December (113) (219)Refer to the consolidated statement of comprehensive income on page 90, the consolidated statement of changes in equity on page 91 and note 6C on page 108.
Actuarial gains/(losses) on pension schemes – movement during the year
€ million2013
€ million2012
(Restated)
1 January (1,804) (1,307)Movement during the year 697 (497)
31 December (1,107) (1,804)Refer to the consolidated statement of comprehensive income on page 90, the consolidated statement of changes in equity on page 91, note 4B from page 99 to 104 and note 6C on page 108.
Currency retranslation gains/(losses) – movement during the year€ million
2013€ million
2012
1 January (2,007) (1,691)Currency retranslation during the year:
Other reserves (788) (249)Retained profit (129) (43)Non-controlling interest (82) (24)
31 December (3,006) (2,007)
15C. FINANCIAL LIABILITIES
Financial liabilities(a)(b) Notes
€ millionCurrent
2013
€ millionNon-current
2013
€ millionTotal2013
€ millionCurrent
2012
€ millionNon-current
2012
€ millionTotal2012
Preference shares – 68 68 – 68 68Bank loans and overdrafts 491 576 1,067 581 765 1,346Bonds and other loans 3,037 6,557 9,594 1,968 6,511 8,479
At amortised cost 3,037 5,780 8,817 1,205 5,718 6,923Subject to fair value hedge accounting – 777 777 763 793 1,556
Finance lease creditors 20 14 190 204 15 187 202Derivatives 199 100 299 92 34 126Other financial liabilities 269 – 269 – – –
4,010 7,491 11,501 2,656 7,565 10,221(a) For the purposes of notes 15C and 17A, financial assets and liabilities exclude trade and other current receivables and trade payables and other liabilities which are
covered in notes 13 and 14 respectively.(b) Financial liabilities include €6 million (2012: €1 million) of secured liabilities.
118 Unilever Annual Report and Accounts 2013Financial statements
NOTES TO THE CONSOLIDATED FINANCIAL STATEMENTS UNILEVER GROUP CONTINUED
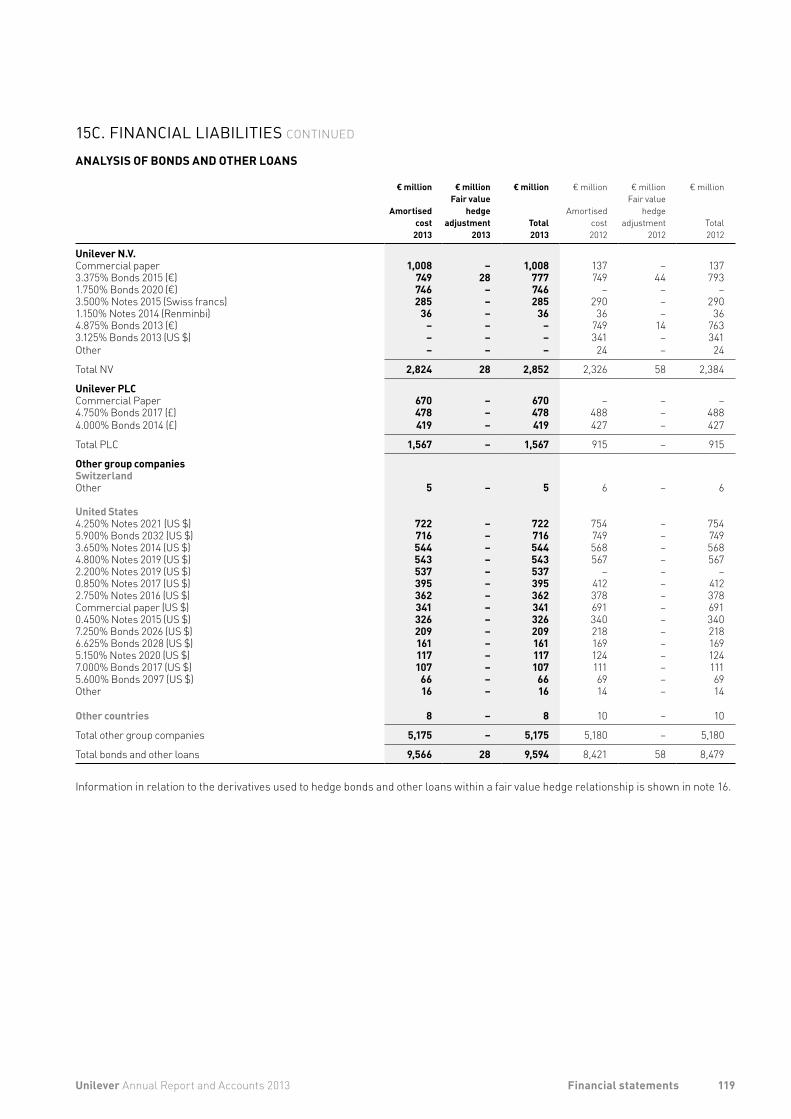
15C. FINANCIAL LIABILITIES CONTINUED
ANALYSIS OF BONDS AND OTHER LOANS
€ million
Amortisedcost
2013
€ millionFair value
hedge adjustment
2013
€ million
Total2013
€ million
Amortisedcost2012
€ millionFair value
hedge adjustment
2012
€ million
Total2012
Unilever N.V.Commercial paper 1,008 – 1,008 137 – 1373.375% Bonds 2015 (€) 749 28 777 749 44 7931.750% Bonds 2020 (€) 746 – 746 – – –3.500% Notes 2015 (Swiss francs) 285 – 285 290 – 2901.150% Notes 2014 (Renminbi) 36 – 36 36 – 364.875% Bonds 2013 (€) – – – 749 14 7633.125% Bonds 2013 (US $) – – – 341 – 341Other – – – 24 – 24
Total NV 2,824 28 2,852 2,326 58 2,384
Unilever PLCCommercial Paper 670 – 670 – – –4.750% Bonds 2017 (£) 478 – 478 488 – 4884.000% Bonds 2014 (£) 419 – 419 427 – 427
Total PLC 1,567 – 1,567 915 – 915
Other group companiesSwitzerlandOther 5 – 5 6 – 6
United States4.250% Notes 2021 (US $) 722 – 722 754 – 7545.900% Bonds 2032 (US $) 716 – 716 749 – 7493.650% Notes 2014 (US $) 544 – 544 568 – 5684.800% Notes 2019 (US $) 543 – 543 567 – 5672.200% Notes 2019 (US $) 537 – 537 – – –0.850% Notes 2017 (US $) 395 – 395 412 – 4122.750% Notes 2016 (US $) 362 – 362 378 – 378Commercial paper (US $) 341 – 341 691 – 6910.450% Notes 2015 (US $) 326 – 326 340 – 3407.250% Bonds 2026 (US $) 209 – 209 218 – 2186.625% Bonds 2028 (US $) 161 – 161 169 – 1695.150% Notes 2020 (US $) 117 – 117 124 – 1247.000% Bonds 2017 (US $) 107 – 107 111 – 1115.600% Bonds 2097 (US $) 66 – 66 69 – 69Other 16 – 16 14 – 14
Other countries 8 – 8 10 – 10
Total other group companies 5,175 – 5,175 5,180 – 5,180
Total bonds and other loans 9,566 28 9,594 8,421 58 8,479
Information in relation to the derivatives used to hedge bonds and other loans within a fair value hedge relationship is shown in note 16.
119Unilever Annual Report and Accounts 2013 Financial statements
16. TREASURY RISK MANAGEMENT
DERIVATIVES AND HEDGE ACCOUNTINGDerivatives are measured at fair value with any related transaction costs expensed as incurred. The treatment of changes in the value of derivatives depends on their use as explained below.
(I) FAIR VALUE HEDGESCertain derivatives are held to hedge the risk of changes in value of a specific bond or other loan. In these situations, the Group designates the liability and related derivative to be part of a fair value hedge relationship. The carrying value of the bond is adjusted by the fair value of the risk being hedged, with changes going to the income statement. Gains and losses on the corresponding derivative are also recognised in the income statement. The amounts recognised are offset in the income statement to the extent that the hedge is effective. When the relationship no longer meets the criteria for hedge accounting, the fair value hedge adjustment made to the bond is amortised to the income statement using the effective interest method.
(II) CASH FLOW HEDGESDerivatives are also held to hedge the uncertainty in timing or amount of future forecast cash flows. Such derivatives are classified as being part of cash flow hedge relationships. For an effective hedge, gains and losses from changes in the fair value of derivatives are recognised in equity. Any ineffective elements of the hedge are recognised in the income statement. If the hedged cash flow relates to a non-financial asset, the amount accumulated in equity is subsequently included within the carrying value of that asset. For other cash flow hedges, amounts deferred in equity are taken to the income statement at the same time as the related cash flow.
When a derivative no longer qualifies for hedge accounting, any cumulative gain or loss remains in equity until the related cash flow occurs. When the cash flow takes place, the cumulative gain or loss is taken to the income statement. If the hedged cash flow is no longer expected to occur, the cumulative gain or loss is taken to the income statement immediately.
(III) NET INVESTMENT HEDGESCertain derivatives are designated as hedges of the currency risk on the Group’s investment in foreign subsidiaries. The accounting policy for these arrangements is set out in note 1.
(IV) DERIVATIVES FOR WHICH HEDGE ACCOUNTING IS NOT APPLIEDDerivatives not classified as hedges are held in order to hedge certain balance sheet items and commodity exposures. No hedge accounting is applied to these derivatives, which are carried at fair value with changes being recognised in the income statement.
The Group is exposed to the following risks that arise from its use of financial instruments, the management of which is described in the following sections:• liquidity risk (see note 16A);• market risk (see note 16B); and• credit risk (see note 17B).
16A. MANAGEMENT OF LIQUIDITY RISKLiquidity risk is the risk that the Group will face in meeting its obligations associated with its financial liabilities. The Group’s approach to managing liquidity is to ensure that it will have sufficient funds to meet its liabilities when due without incurring unacceptable losses. In doing this, management considers both normal and stressed conditions. A material and sustained shortfall in our cash flow could undermine the Group’s credit rating, impair investor confidence and also restrict the Group’s ability to raise funds.
The Group maintained a cautious funding strategy, with a positive cash balance throughout 2013. This was the result of cash delivery from the business, coupled with the proceeds from bond issuances in 2013. This cash has been invested conservatively with low risk counter-parties at maturities of less than six months.
Cash flow from operating activities provides the funds to service the financing of financial liabilities on a day-to-day basis. The Group seeks to manage its liquidity requirements by maintaining access to global debt markets through short-term and long-term debt programmes. In addition, Unilever has committed credit facilities for general corporate use.
On 31 December 2013 Unilever had undrawn revolving 364-day bilateral credit facilities in aggregate of US $6,400 million (2012: US $6,140 million) with a 364-day term out. On 31 December 2013 Unilever had no 364-day bilateral money market commitments (2012: US $110 million). As part of the regular annual process these facilities will again be renewed in 2014.
120 Unilever Annual Report and Accounts 2013Financial statements
NOTES TO THE CONSOLIDATED FINANCIAL STATEMENTS UNILEVER GROUP CONTINUED
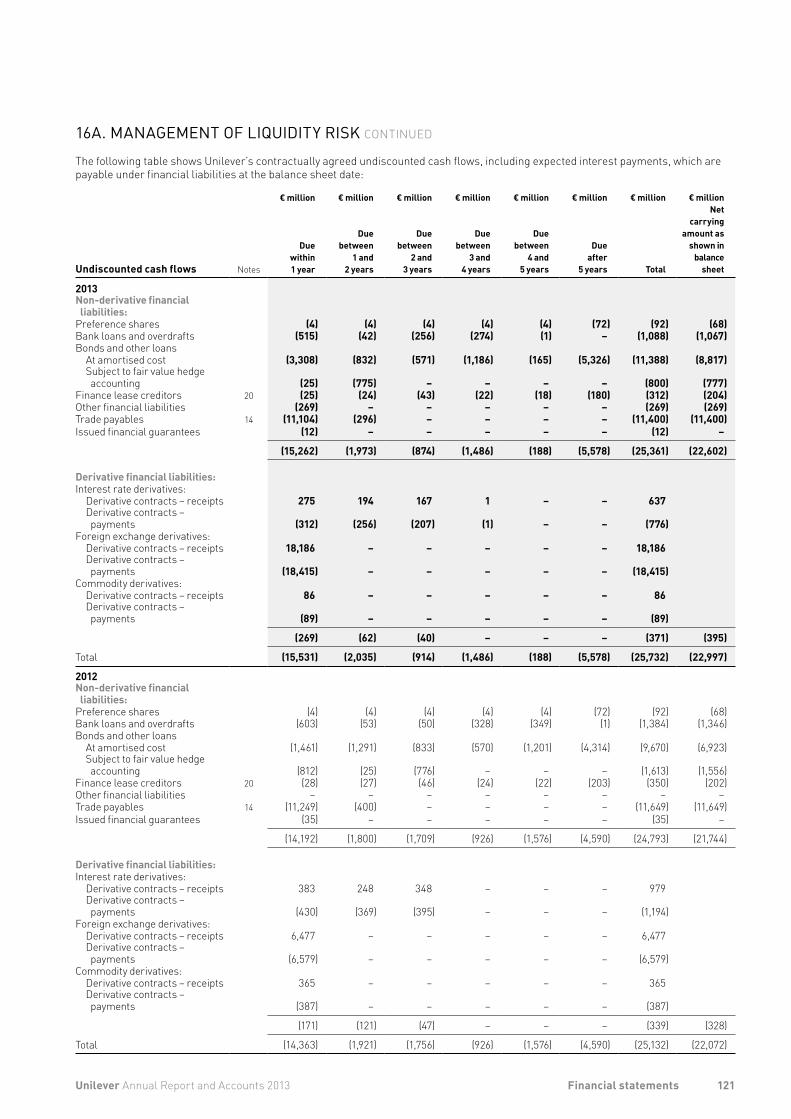
16A. MANAGEMENT OF LIQUIDITY RISK CONTINUED
The following table shows Unilever’s contractually agreed undiscounted cash flows, including expected interest payments, which are payable under financial liabilities at the balance sheet date:
Undiscounted cash flows Notes
€ million
Duewithin1 year
€ million
Duebetween
1 and2 years
€ million
Duebetween
2 and3 years
€ million
Duebetween
3 and4 years
€ million
Duebetween
4 and5 years
€ million
Dueafter
5 years
€ million
Total
€ millionNet
carryingamount as
shown in balance
sheet
2013Non-derivative financial liabilities:
Preference shares (4) (4) (4) (4) (4) (72) (92) (68)Bank loans and overdrafts (515) (42) (256) (274) (1) – (1,088) (1,067)Bonds and other loans
At amortised cost (3,308) (832) (571) (1,186) (165) (5,326) (11,388) (8,817)Subject to fair value hedge accounting (25) (775) – – – – (800) (777)
Finance lease creditors 20 (25) (24) (43) (22) (18) (180) (312) (204)Other financial liabilities (269) – – – – – (269) (269)Trade payables 14 (11,104) (296) – – – – (11,400) (11,400)Issued financial guarantees (12) – – – – – (12) –
(15,262) (1,973) (874) (1,486) (188) (5,578) (25,361) (22,602)
Derivative financial liabilities:Interest rate derivatives:
Derivative contracts – receipts 275 194 167 1 – – 637Derivative contracts – payments (312) (256) (207) (1) – – (776)
Foreign exchange derivatives:Derivative contracts – receipts 18,186 – – – – – 18,186Derivative contracts – payments (18,415) – – – – – (18,415)
Commodity derivatives:Derivative contracts – receipts 86 – – – – – 86Derivative contracts – payments (89) – – – – – (89)
(269) (62) (40) – – – (371) (395)
Total (15,531) (2,035) (914) (1,486) (188) (5,578) (25,732) (22,997)
2012Non-derivative financial liabilities:
Preference shares (4) (4) (4) (4) (4) (72) (92) (68)Bank loans and overdrafts (603) (53) (50) (328) (349) (1) (1,384) (1,346)Bonds and other loans
At amortised cost (1,461) (1,291) (833) (570) (1,201) (4,314) (9,670) (6,923)Subject to fair value hedge accounting (812) (25) (776) – – – (1,613) (1,556)
Finance lease creditors 20 (28) (27) (46) (24) (22) (203) (350) (202)Other financial liabilities – – – – – – – –Trade payables 14 (11,249) (400) – – – – (11,649) (11,649)Issued financial guarantees (35) – – – – – (35) –
(14,192) (1,800) (1,709) (926) (1,576) (4,590) (24,793) (21,744)
Derivative financial liabilities:Interest rate derivatives:
Derivative contracts – receipts 383 248 348 – – – 979Derivative contracts – payments (430) (369) (395) – – – (1,194)
Foreign exchange derivatives:Derivative contracts – receipts 6,477 – – – – – 6,477Derivative contracts – payments (6,579) – – – – – (6,579)
Commodity derivatives:Derivative contracts – receipts 365 – – – – – 365Derivative contracts – payments (387) – – – – – (387)
(171) (121) (47) – – – (339) (328)
Total (14,363) (1,921) (1,756) (926) (1,576) (4,590) (25,132) (22,072)
121Unilever Annual Report and Accounts 2013 Financial statements
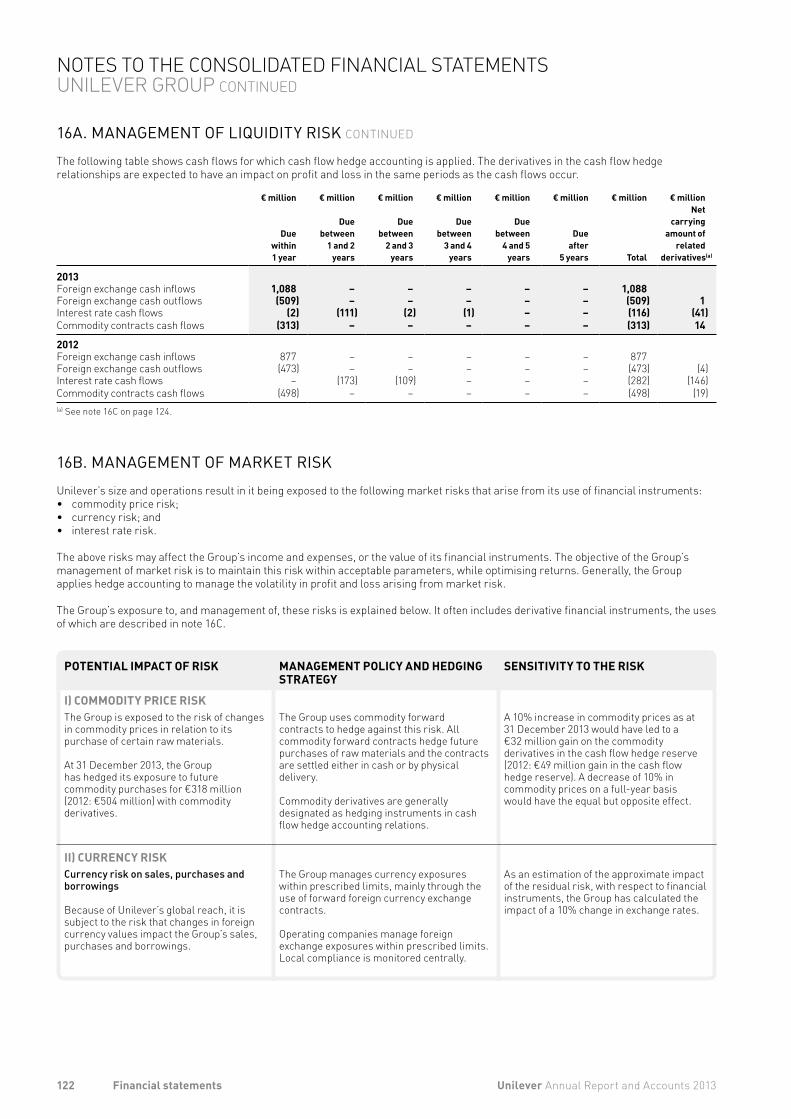
16A. MANAGEMENT OF LIQUIDITY RISK CONTINUED
The following table shows cash flows for which cash flow hedge accounting is applied. The derivatives in the cash flow hedge relationships are expected to have an impact on profit and loss in the same periods as the cash flows occur.
€ million
Duewithin1 year
€ million
Duebetween
1 and 2 years
€ million
Duebetween
2 and 3 years
€ million
Duebetween
3 and 4 years
€ million
Duebetween
4 and 5 years
€ million
Dueafter
5 years
€ million
Total
€ millionNet
carryingamount of
related derivatives(a)
2013Foreign exchange cash inflows 1,088 – – – – – 1,088Foreign exchange cash outflows (509) – – – – – (509) 1Interest rate cash flows (2) (111) (2) (1) – – (116) (41)Commodity contracts cash flows (313) – – – – – (313) 14
2012Foreign exchange cash inflows 877 – – – – – 877Foreign exchange cash outflows (473) – – – – – (473) (4)Interest rate cash flows – (173) (109) – – – (282) (146)Commodity contracts cash flows (498) – – – – – (498) (19)(a) See note 16C on page 124.
16B. MANAGEMENT OF MARKET RISKUnilever’s size and operations result in it being exposed to the following market risks that arise from its use of financial instruments:• commodity price risk;• currency risk; and• interest rate risk.
The above risks may affect the Group’s income and expenses, or the value of its financial instruments. The objective of the Group’s management of market risk is to maintain this risk within acceptable parameters, while optimising returns. Generally, the Group applies hedge accounting to manage the volatility in profit and loss arising from market risk.
The Group’s exposure to, and management of, these risks is explained below. It often includes derivative financial instruments, the uses of which are described in note 16C.
POTENTIAL IMPACT OF RISK MANAGEMENT POLICY AND HEDGING STRATEGY
SENSITIVITY TO THE RISK
I) COMMODITY PRICE RISKThe Group is exposed to the risk of changes in commodity prices in relation to its purchase of certain raw materials.
At 31 December 2013, the Group has hedged its exposure to future commodity purchases for €318 million (2012: €504 million) with commodity derivatives.
The Group uses commodity forward contracts to hedge against this risk. All commodity forward contracts hedge future purchases of raw materials and the contracts are settled either in cash or by physical delivery.
Commodity derivatives are generally designated as hedging instruments in cash flow hedge accounting relations.
A 10% increase in commodity prices as at 31 December 2013 would have led to a €32 million gain on the commodity derivatives in the cash flow hedge reserve (2012: €49 million gain in the cash flow hedge reserve). A decrease of 10% in commodity prices on a full-year basis would have the equal but opposite effect.
II) CURRENCY RISKCurrency risk on sales, purchases and borrowings
Because of Unilever’s global reach, it is subject to the risk that changes in foreign currency values impact the Group’s sales, purchases and borrowings.
The Group manages currency exposures within prescribed limits, mainly through the use of forward foreign currency exchange contracts.
Operating companies manage foreign exchange exposures within prescribed limits. Local compliance is monitored centrally.
As an estimation of the approximate impact of the residual risk, with respect to financial instruments, the Group has calculated the impact of a 10% change in exchange rates.
122 Unilever Annual Report and Accounts 2013Financial statements
NOTES TO THE CONSOLIDATED FINANCIAL STATEMENTS UNILEVER GROUP CONTINUED
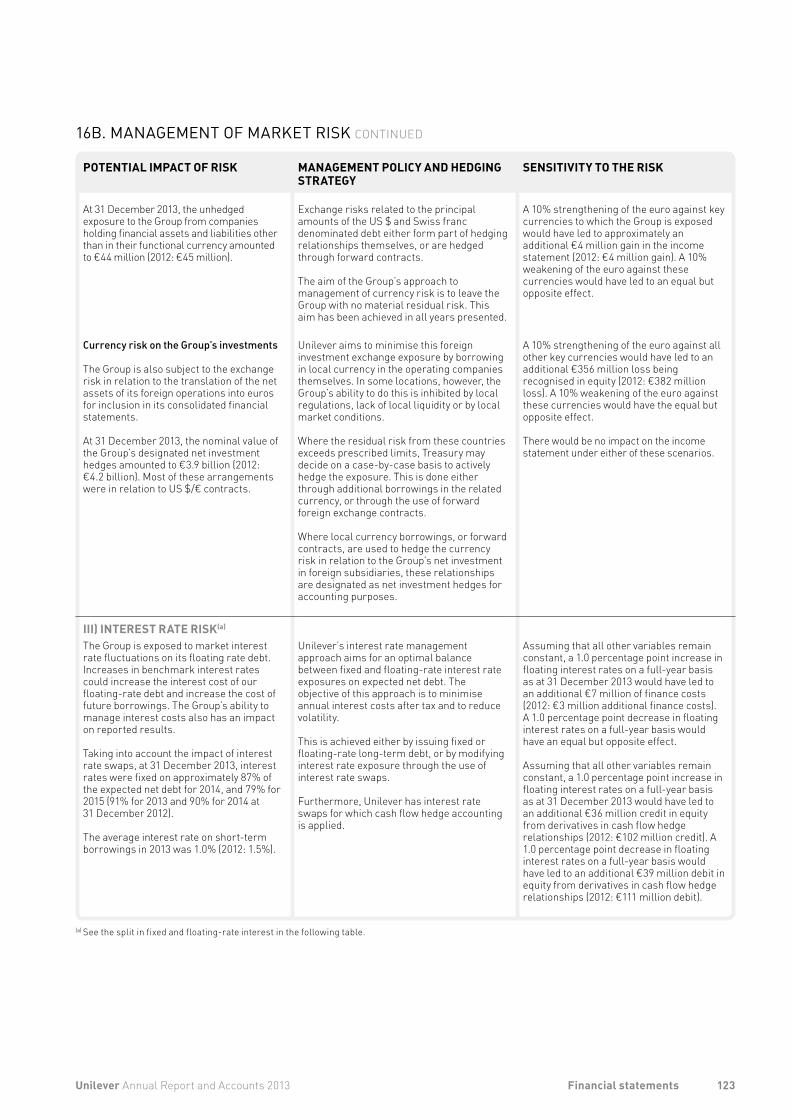
POTENTIAL IMPACT OF RISK MANAGEMENT POLICY AND HEDGING STRATEGY
SENSITIVITY TO THE RISK
At 31 December 2013, the unhedged exposure to the Group from companies holding financial assets and liabilities other than in their functional currency amounted to €44 million (2012: €45 million).
Exchange risks related to the principal amounts of the US $ and Swiss franc denominated debt either form part of hedging relationships themselves, or are hedged through forward contracts.
The aim of the Group’s approach to management of currency risk is to leave the Group with no material residual risk. This aim has been achieved in all years presented.
A 10% strengthening of the euro against key currencies to which the Group is exposed would have led to approximately an additional €4 million gain in the income statement (2012: €4 million gain). A 10% weakening of the euro against these currencies would have led to an equal but opposite effect.
Currency risk on the Group’s investments
The Group is also subject to the exchange risk in relation to the translation of the net assets of its foreign operations into euros for inclusion in its consolidated financial statements.
At 31 December 2013, the nominal value of the Group’s designated net investment hedges amounted to €3.9 billion (2012: €4.2 billion). Most of these arrangements were in relation to US $/€ contracts.
Unilever aims to minimise this foreign investment exchange exposure by borrowing in local currency in the operating companies themselves. In some locations, however, the Group’s ability to do this is inhibited by local regulations, lack of local liquidity or by local market conditions.
Where the residual risk from these countries exceeds prescribed limits, Treasury may decide on a case-by-case basis to actively hedge the exposure. This is done either through additional borrowings in the related currency, or through the use of forward foreign exchange contracts.
Where local currency borrowings, or forward contracts, are used to hedge the currency risk in relation to the Group’s net investment in foreign subsidiaries, these relationships are designated as net investment hedges for accounting purposes.
A 10% strengthening of the euro against all other key currencies would have led to an additional €356 million loss being recognised in equity (2012: €382 million loss). A 10% weakening of the euro against these currencies would have the equal but opposite effect.
There would be no impact on the income statement under either of these scenarios.
III) INTEREST RATE RISK(a)
The Group is exposed to market interest rate fluctuations on its floating rate debt. Increases in benchmark interest rates could increase the interest cost of our floating-rate debt and increase the cost of future borrowings. The Group’s ability to manage interest costs also has an impact on reported results.
Taking into account the impact of interest rate swaps, at 31 December 2013, interest rates were fixed on approximately 87% of the expected net debt for 2014, and 79% for 2015 (91% for 2013 and 90% for 2014 at 31 December 2012).
The average interest rate on short-term borrowings in 2013 was 1.0% (2012: 1.5%).
Unilever’s interest rate management approach aims for an optimal balance between fixed and floating-rate interest rate exposures on expected net debt. The objective of this approach is to minimise annual interest costs after tax and to reduce volatility.
This is achieved either by issuing fixed or floating-rate long-term debt, or by modifying interest rate exposure through the use of interest rate swaps.
Furthermore, Unilever has interest rate swaps for which cash flow hedge accounting is applied.
Assuming that all other variables remain constant, a 1.0 percentage point increase in floating interest rates on a full-year basis as at 31 December 2013 would have led to an additional €7 million of finance costs (2012: €3 million additional finance costs). A 1.0 percentage point decrease in floating interest rates on a full-year basis would have an equal but opposite effect.
Assuming that all other variables remain constant, a 1.0 percentage point increase in floating interest rates on a full-year basis as at 31 December 2013 would have led to an additional €36 million credit in equity from derivatives in cash flow hedge relationships (2012: €102 million credit). A 1.0 percentage point decrease in floating interest rates on a full-year basis would have led to an additional €39 million debit in equity from derivatives in cash flow hedge relationships (2012: €111 million debit).
(a) See the split in fixed and floating-rate interest in the following table.
123Unilever Annual Report and Accounts 2013 Financial statements
16B. MANAGEMENT OF MARKET RISK CONTINUED
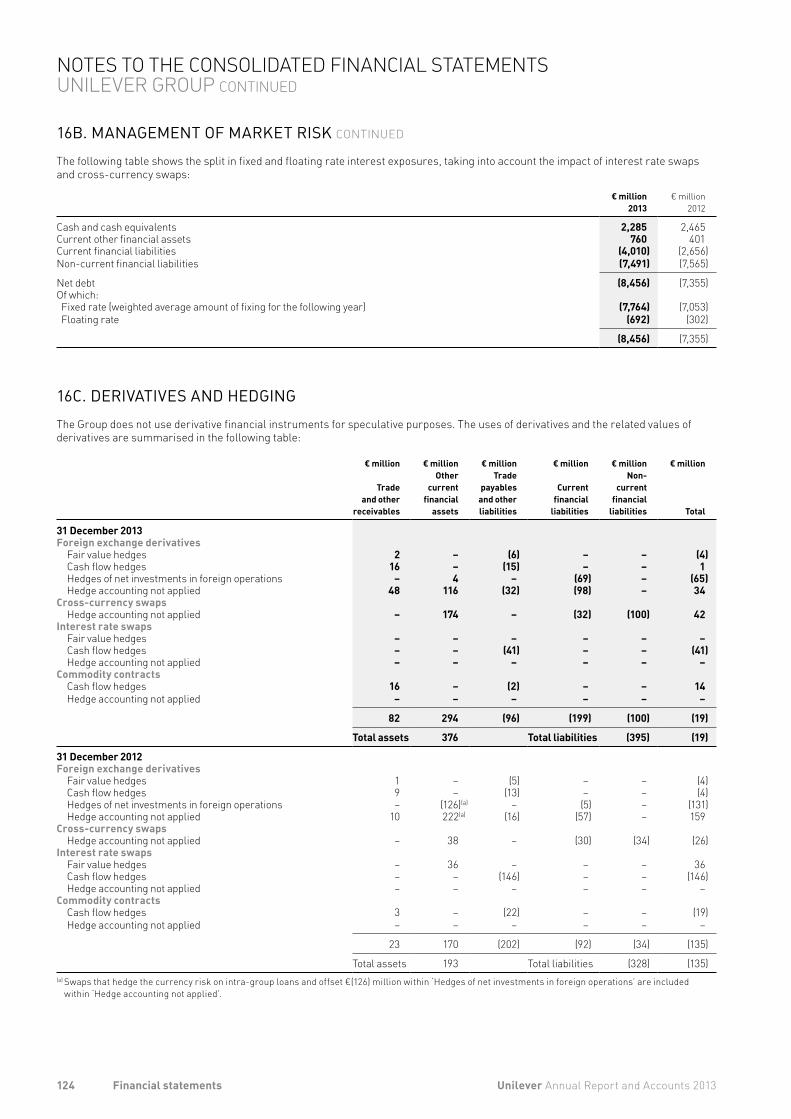
16B. MANAGEMENT OF MARKET RISK CONTINUED
The following table shows the split in fixed and floating rate interest exposures, taking into account the impact of interest rate swaps and cross-currency swaps:
€ million 2013
€ million 2012
Cash and cash equivalents 2,285 2,465Current other financial assets 760 401Current financial liabilities (4,010) (2,656)Non-current financial liabilities (7,491) (7,565)
Net debt (8,456) (7,355)Of which:Fixed rate (weighted average amount of fixing for the following year) (7,764) (7,053)Floating rate (692) (302)
(8,456) (7,355)
16C. DERIVATIVES AND HEDGINGThe Group does not use derivative financial instruments for speculative purposes. The uses of derivatives and the related values of derivatives are summarised in the following table:
€ million
Trade and other
receivables
€ millionOther
current financial
assets
€ millionTrade
payables and other liabilities
€ million
Current financial
liabilities
€ millionNon-
current financial
liabilities
€ million
Total
31 December 2013Foreign exchange derivatives
Fair value hedges 2 – (6) – – (4)Cash flow hedges 16 – (15) – – 1Hedges of net investments in foreign operations – 4 – (69) – (65)Hedge accounting not applied 48 116 (32) (98) – 34
Cross-currency swapsHedge accounting not applied – 174 – (32) (100) 42
Interest rate swapsFair value hedges – – – – – –Cash flow hedges – – (41) – – (41)Hedge accounting not applied – – – – – –
Commodity contractsCash flow hedges 16 – (2) – – 14Hedge accounting not applied – – – – – –
82 294 (96) (199) (100) (19)
Total assets 376 Total liabilities (395) (19)
31 December 2012Foreign exchange derivatives
Fair value hedges 1 – (5) – – (4)Cash flow hedges 9 – (13) – – (4)Hedges of net investments in foreign operations – (126)(a) – (5) – (131)Hedge accounting not applied 10 222(a) (16) (57) – 159
Cross-currency swapsHedge accounting not applied – 38 – (30) (34) (26)
Interest rate swapsFair value hedges – 36 – – – 36Cash flow hedges – – (146) – – (146)Hedge accounting not applied – – – – – –
Commodity contractsCash flow hedges 3 – (22) – – (19)Hedge accounting not applied – – – – – –
23 170 (202) (92) (34) (135)
Total assets 193 Total liabilities (328) (135)(a) Swaps that hedge the currency risk on intra-group loans and offset €(126) million within ‘Hedges of net investments in foreign operations’ are included
within ‘Hedge accounting not applied’.
124 Unilever Annual Report and Accounts 2013Financial statements
NOTES TO THE CONSOLIDATED FINANCIAL STATEMENTS UNILEVER GROUP CONTINUED
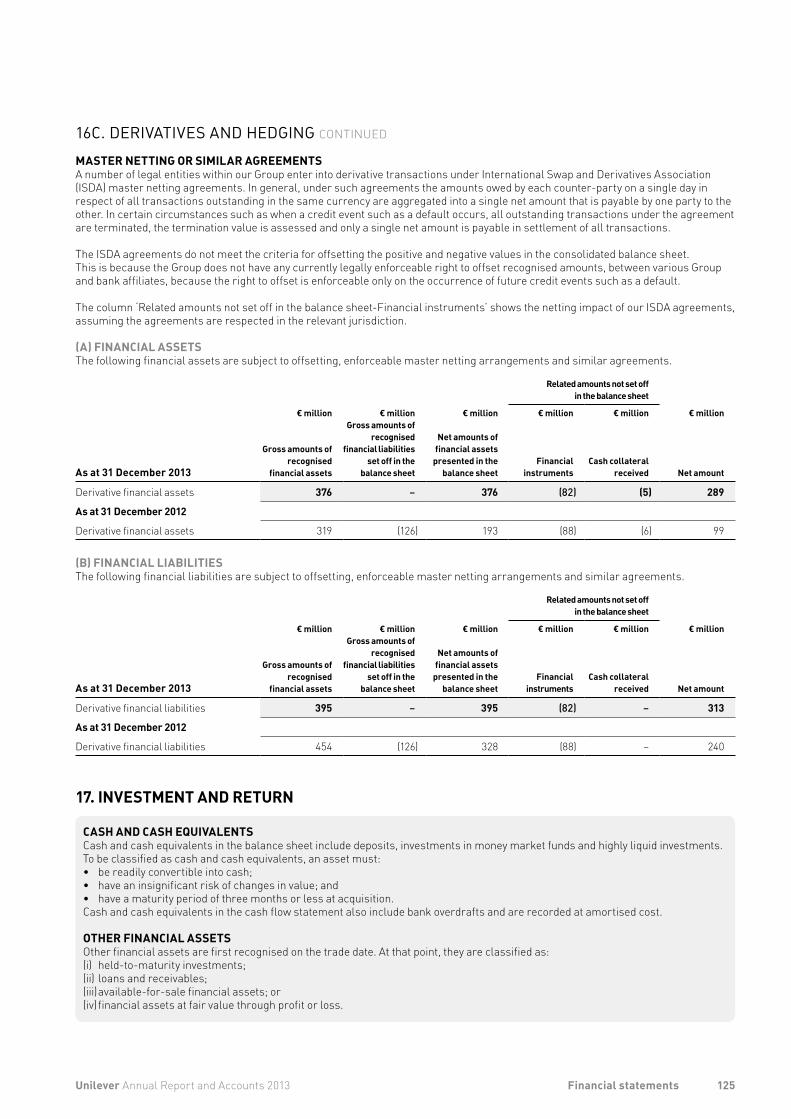
16C. DERIVATIVES AND HEDGING CONTINUED
MASTER NETTING OR SIMILAR AGREEMENTSA number of legal entities within our Group enter into derivative transactions under International Swap and Derivatives Association (ISDA) master netting agreements. In general, under such agreements the amounts owed by each counter-party on a single day in respect of all transactions outstanding in the same currency are aggregated into a single net amount that is payable by one party to the other. In certain circumstances such as when a credit event such as a default occurs, all outstanding transactions under the agreement are terminated, the termination value is assessed and only a single net amount is payable in settlement of all transactions.
The ISDA agreements do not meet the criteria for offsetting the positive and negative values in the consolidated balance sheet.This is because the Group does not have any currently legally enforceable right to offset recognised amounts, between various Group and bank affiliates, because the right to offset is enforceable only on the occurrence of future credit events such as a default.
The column ‘Related amounts not set off in the balance sheet-Financial instruments’ shows the netting impact of our ISDA agreements, assuming the agreements are respected in the relevant jurisdiction.
(A) FINANCIAL ASSETSThe following financial assets are subject to offsetting, enforceable master netting arrangements and similar agreements.
Related amounts not set off in the balance sheet
As at 31 December 2013
€ million
Gross amounts of recognised
financial assets
€ millionGross amounts of
recognised financial liabilities
set off in the balance sheet
€ million
Net amounts of financial assets
presented in the balance sheet
€ million
Financial instruments
€ million
Cash collateral received
€ million
Net amount
Derivative financial assets 376 – 376 (82) (5) 289
As at 31 December 2012
Derivative financial assets 319 (126) 193 (88) (6) 99
(B) FINANCIAL LIABILITIESThe following financial liabilities are subject to offsetting, enforceable master netting arrangements and similar agreements.
Related amounts not set off in the balance sheet
As at 31 December 2013
€ million
Gross amounts of recognised
financial assets
€ millionGross amounts of
recognised financial liabilities
set off in the balance sheet
€ million
Net amounts of financial assets
presented in the balance sheet
€ million
Financial instruments
€ million
Cash collateral received
€ million
Net amount
Derivative financial liabilities 395 – 395 (82) – 313
As at 31 December 2012
Derivative financial liabilities 454 (126) 328 (88) – 240
17. INVESTMENT AND RETURN
CASH AND CASH EQUIVALENTSCash and cash equivalents in the balance sheet include deposits, investments in money market funds and highly liquid investments. To be classified as cash and cash equivalents, an asset must:• be readily convertible into cash; • have an insignificant risk of changes in value; and• have a maturity period of three months or less at acquisition.Cash and cash equivalents in the cash flow statement also include bank overdrafts and are recorded at amortised cost.
OTHER FINANCIAL ASSETSOther financial assets are first recognised on the trade date. At that point, they are classified as: (i) held-to-maturity investments;(ii) loans and receivables;(iii) available-for-sale financial assets; or(iv) financial assets at fair value through profit or loss.
125Unilever Annual Report and Accounts 2013 Financial statements
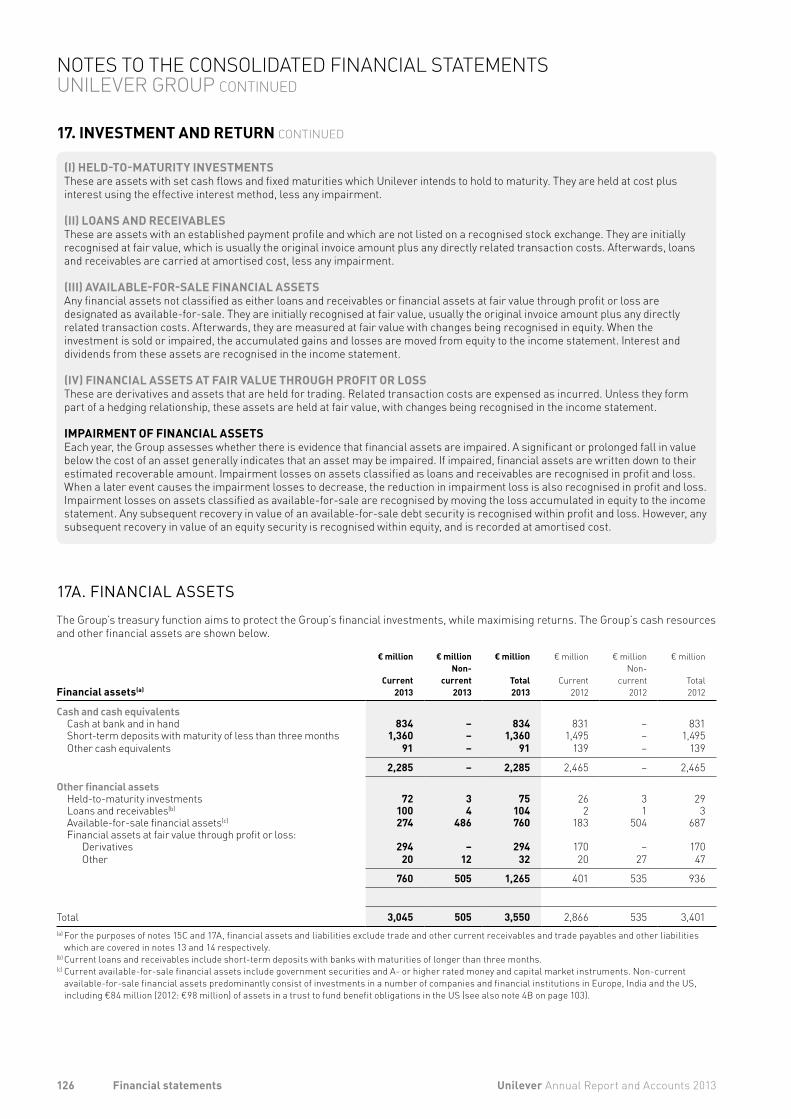
17. INVESTMENT AND RETURN CONTINUED
(I) HELD-TO-MATURITY INVESTMENTSThese are assets with set cash flows and fixed maturities which Unilever intends to hold to maturity. They are held at cost plus interest using the effective interest method, less any impairment.
(II) LOANS AND RECEIVABLESThese are assets with an established payment profile and which are not listed on a recognised stock exchange. They are initially recognised at fair value, which is usually the original invoice amount plus any directly related transaction costs. Afterwards, loans and receivables are carried at amortised cost, less any impairment.
(III) AVAILABLE-FOR-SALE FINANCIAL ASSETSAny financial assets not classified as either loans and receivables or financial assets at fair value through profit or loss are designated as available-for-sale. They are initially recognised at fair value, usually the original invoice amount plus any directly related transaction costs. Afterwards, they are measured at fair value with changes being recognised in equity. When the investment is sold or impaired, the accumulated gains and losses are moved from equity to the income statement. Interest and dividends from these assets are recognised in the income statement.
(IV) FINANCIAL ASSETS AT FAIR VALUE THROUGH PROFIT OR LOSSThese are derivatives and assets that are held for trading. Related transaction costs are expensed as incurred. Unless they form part of a hedging relationship, these assets are held at fair value, with changes being recognised in the income statement.
IMPAIRMENT OF FINANCIAL ASSETSEach year, the Group assesses whether there is evidence that financial assets are impaired. A significant or prolonged fall in value below the cost of an asset generally indicates that an asset may be impaired. If impaired, financial assets are written down to their estimated recoverable amount. Impairment losses on assets classified as loans and receivables are recognised in profit and loss. When a later event causes the impairment losses to decrease, the reduction in impairment loss is also recognised in profit and loss. Impairment losses on assets classified as available-for-sale are recognised by moving the loss accumulated in equity to the income statement. Any subsequent recovery in value of an available-for-sale debt security is recognised within profit and loss. However, any subsequent recovery in value of an equity security is recognised within equity, and is recorded at amortised cost.
17A. FINANCIAL ASSETSThe Group’s treasury function aims to protect the Group’s financial investments, while maximising returns. The Group’s cash resources and other financial assets are shown below.
Financial assets(a)
€ million
Current2013
€ millionNon-
current2013
€ million
Total2013
€ million
Current2012
€ millionNon-
current2012
€ million
Total2012
Cash and cash equivalentsCash at bank and in hand 834 – 834 831 – 831Short-term deposits with maturity of less than three months 1,360 – 1,360 1,495 – 1,495Other cash equivalents 91 – 91 139 – 139
2,285 – 2,285 2,465 – 2,465
Other financial assetsHeld-to-maturity investments 72 3 75 26 3 29Loans and receivables(b) 100 4 104 2 1 3Available-for-sale financial assets(c) 274 486 760 183 504 687Financial assets at fair value through profit or loss:
Derivatives 294 – 294 170 – 170Other 20 12 32 20 27 47
760 505 1,265 401 535 936
Total 3,045 505 3,550 2,866 535 3,401(a) For the purposes of notes 15C and 17A, financial assets and liabilities exclude trade and other current receivables and trade payables and other liabilities
which are covered in notes 13 and 14 respectively.(b) Current loans and receivables include short-term deposits with banks with maturities of longer than three months.(c) Current available-for-sale financial assets include government securities and A- or higher rated money and capital market instruments. Non-current
available-for-sale financial assets predominantly consist of investments in a number of companies and financial institutions in Europe, India and the US, including €84 million (2012: €98 million) of assets in a trust to fund benefit obligations in the US (see also note 4B on page 103).
126 Unilever Annual Report and Accounts 2013Financial statements
NOTES TO THE CONSOLIDATED FINANCIAL STATEMENTS UNILEVER GROUP CONTINUED
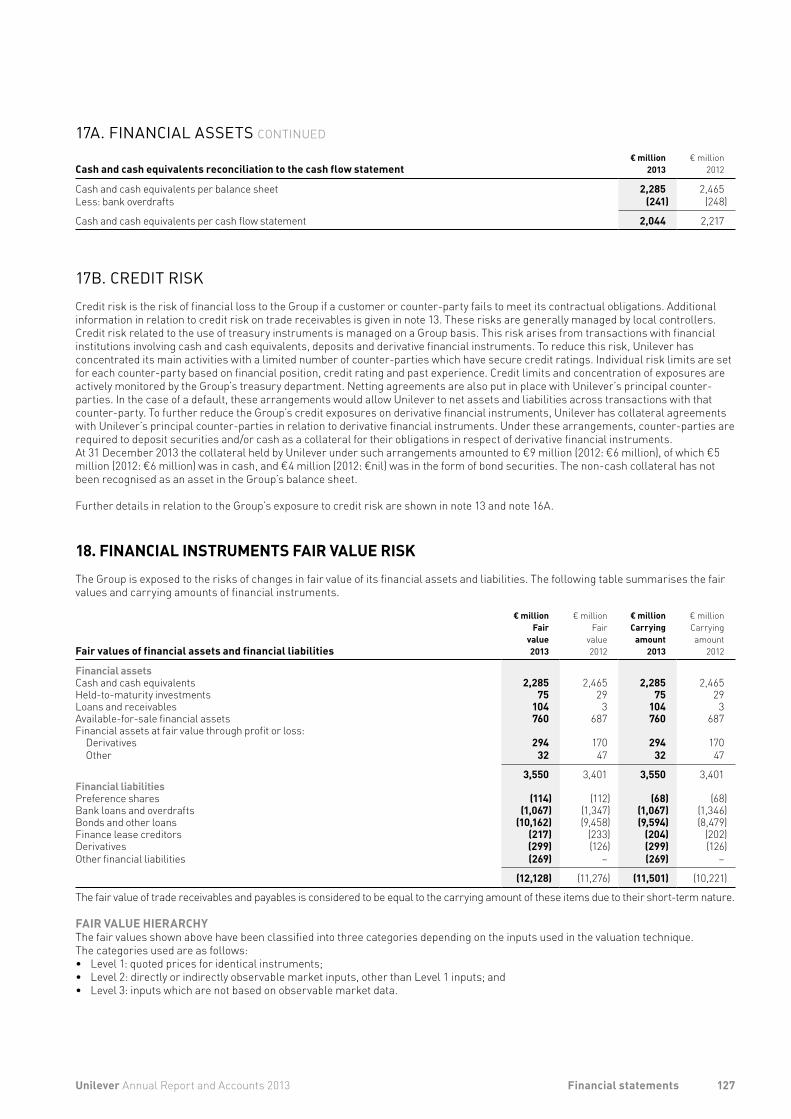
17A. FINANCIAL ASSETS CONTINUED
Cash and cash equivalents reconciliation to the cash flow statement€ million
2013€ million
2012
Cash and cash equivalents per balance sheet 2,285 2,465Less: bank overdrafts (241) (248)
Cash and cash equivalents per cash flow statement 2,044 2,217
17B. CREDIT RISKCredit risk is the risk of financial loss to the Group if a customer or counter-party fails to meet its contractual obligations. Additional information in relation to credit risk on trade receivables is given in note 13. These risks are generally managed by local controllers. Credit risk related to the use of treasury instruments is managed on a Group basis. This risk arises from transactions with financial institutions involving cash and cash equivalents, deposits and derivative financial instruments. To reduce this risk, Unilever has concentrated its main activities with a limited number of counter-parties which have secure credit ratings. Individual risk limits are set for each counter-party based on financial position, credit rating and past experience. Credit limits and concentration of exposures are actively monitored by the Group’s treasury department. Netting agreements are also put in place with Unilever’s principal counter-parties. In the case of a default, these arrangements would allow Unilever to net assets and liabilities across transactions with that counter-party. To further reduce the Group’s credit exposures on derivative financial instruments, Unilever has collateral agreements with Unilever’s principal counter-parties in relation to derivative financial instruments. Under these arrangements, counter-parties are required to deposit securities and/or cash as a collateral for their obligations in respect of derivative financial instruments. At 31 December 2013 the collateral held by Unilever under such arrangements amounted to €9 million (2012: €6 million), of which €5 million (2012: €6 million) was in cash, and €4 million (2012: €nil) was in the form of bond securities. The non-cash collateral has not been recognised as an asset in the Group’s balance sheet.
Further details in relation to the Group’s exposure to credit risk are shown in note 13 and note 16A.
18. FINANCIAL INSTRUMENTS FAIR VALUE RISKThe Group is exposed to the risks of changes in fair value of its financial assets and liabilities. The following table summarises the fair values and carrying amounts of financial instruments.
Fair values of financial assets and financial liabilities
€ millionFair
value2013
€ millionFair
value2012
€ millionCarrying
amount2013
€ millionCarryingamount
2012
Financial assetsCash and cash equivalents 2,285 2,465 2,285 2,465Held-to-maturity investments 75 29 75 29Loans and receivables 104 3 104 3Available-for-sale financial assets 760 687 760 687Financial assets at fair value through profit or loss:
Derivatives 294 170 294 170Other 32 47 32 47
3,550 3,401 3,550 3,401Financial liabilitiesPreference shares (114) (112) (68) (68)Bank loans and overdrafts (1,067) (1,347) (1,067) (1,346)Bonds and other loans (10,162) (9,458) (9,594) (8,479)Finance lease creditors (217) (233) (204) (202)Derivatives (299) (126) (299) (126)Other financial liabilities (269) – (269) –
(12,128) (11,276) (11,501) (10,221)
The fair value of trade receivables and payables is considered to be equal to the carrying amount of these items due to their short-term nature.
FAIR VALUE HIERARCHYThe fair values shown above have been classified into three categories depending on the inputs used in the valuation technique. The categories used are as follows:• Level 1: quoted prices for identical instruments;• Level 2: directly or indirectly observable market inputs, other than Level 1 inputs; and• Level 3: inputs which are not based on observable market data.
127Unilever Annual Report and Accounts 2013 Financial statements
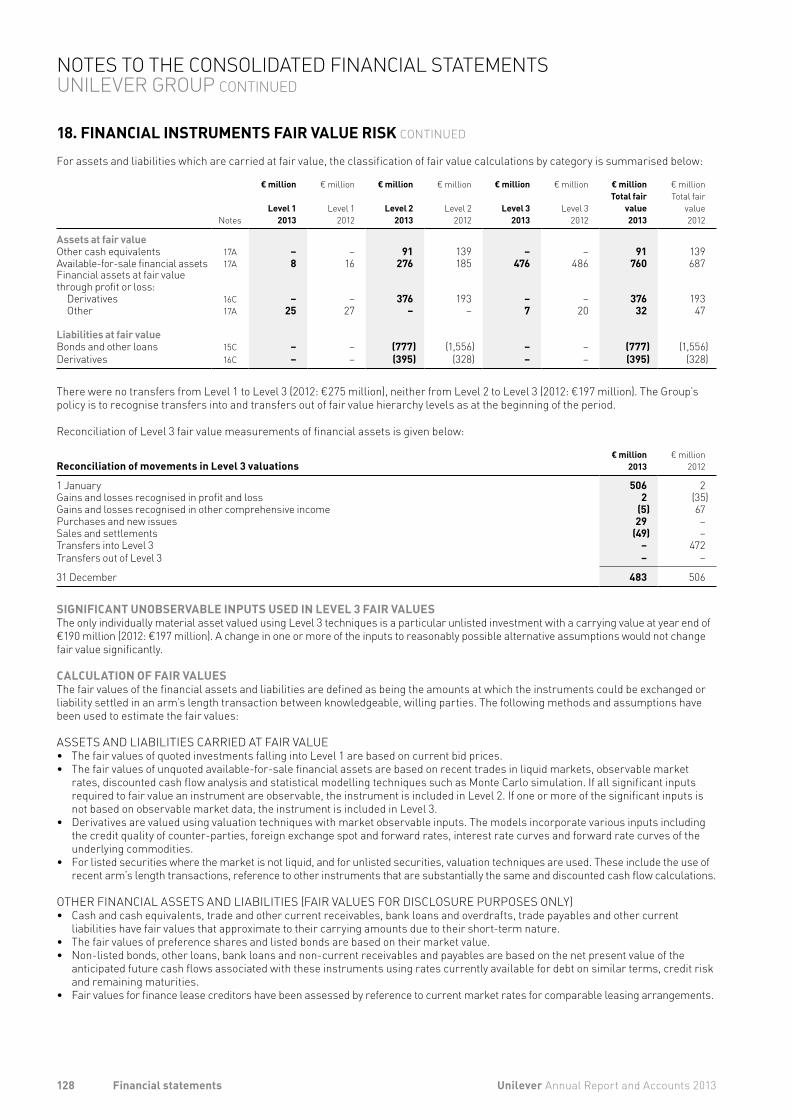
18. FINANCIAL INSTRUMENTS FAIR VALUE RISK CONTINUED
For assets and liabilities which are carried at fair value, the classification of fair value calculations by category is summarised below:
Notes
€ million
Level 12013
€ million
Level 12012
€ million
Level 22013
€ million
Level 22012
€ million
Level 3 2013
€ million
Level 3 2012
€ millionTotal fair
value 2013
€ millionTotal fair
value 2012
Assets at fair valueOther cash equivalents 17A – – 91 139 – – 91 139Available-for-sale financial assets 17A 8 16 276 185 476 486 760 687Financial assets at fair value through profit or loss:
Derivatives 16C – – 376 193 – – 376 193Other 17A 25 27 – – 7 20 32 47
Liabilities at fair valueBonds and other loans 15C – – (777) (1,556) – – (777) (1,556)Derivatives 16C – – (395) (328) – – (395) (328)
There were no transfers from Level 1 to Level 3 (2012: €275 million), neither from Level 2 to Level 3 (2012: €197 million). The Group’s policy is to recognise transfers into and transfers out of fair value hierarchy levels as at the beginning of the period.
Reconciliation of Level 3 fair value measurements of financial assets is given below:
Reconciliation of movements in Level 3 valuations€ million
2013€ million
2012
1 January 506 2Gains and losses recognised in profit and loss 2 (35)Gains and losses recognised in other comprehensive income (5) 67Purchases and new issues 29 –Sales and settlements (49) –Transfers into Level 3 – 472Transfers out of Level 3 – –
31 December 483 506
SIGNIFICANT UNOBSERVABLE INPUTS USED IN LEVEL 3 FAIR VALUESThe only individually material asset valued using Level 3 techniques is a particular unlisted investment with a carrying value at year end of €190 million (2012: €197 million). A change in one or more of the inputs to reasonably possible alternative assumptions would not change fair value significantly.
CALCULATION OF FAIR VALUESThe fair values of the financial assets and liabilities are defined as being the amounts at which the instruments could be exchanged or liability settled in an arm’s length transaction between knowledgeable, willing parties. The following methods and assumptions have been used to estimate the fair values:
ASSETS AND LIABILITIES CARRIED AT FAIR VALUE• The fair values of quoted investments falling into Level 1 are based on current bid prices. • The fair values of unquoted available-for-sale financial assets are based on recent trades in liquid markets, observable market
rates, discounted cash flow analysis and statistical modelling techniques such as Monte Carlo simulation. If all significant inputs required to fair value an instrument are observable, the instrument is included in Level 2. If one or more of the significant inputs is not based on observable market data, the instrument is included in Level 3.
• Derivatives are valued using valuation techniques with market observable inputs. The models incorporate various inputs including the credit quality of counter-parties, foreign exchange spot and forward rates, interest rate curves and forward rate curves of the underlying commodities.
• For listed securities where the market is not liquid, and for unlisted securities, valuation techniques are used. These include the use of recent arm’s length transactions, reference to other instruments that are substantially the same and discounted cash flow calculations.
OTHER FINANCIAL ASSETS AND LIABILITIES (FAIR VALUES FOR DISCLOSURE PURPOSES ONLY)• Cash and cash equivalents, trade and other current receivables, bank loans and overdrafts, trade payables and other current
liabilities have fair values that approximate to their carrying amounts due to their short-term nature.• The fair values of preference shares and listed bonds are based on their market value.• Non-listed bonds, other loans, bank loans and non-current receivables and payables are based on the net present value of the
anticipated future cash flows associated with these instruments using rates currently available for debt on similar terms, credit risk and remaining maturities.
• Fair values for finance lease creditors have been assessed by reference to current market rates for comparable leasing arrangements.
128 Unilever Annual Report and Accounts 2013Financial statements
NOTES TO THE CONSOLIDATED FINANCIAL STATEMENTS UNILEVER GROUP CONTINUED
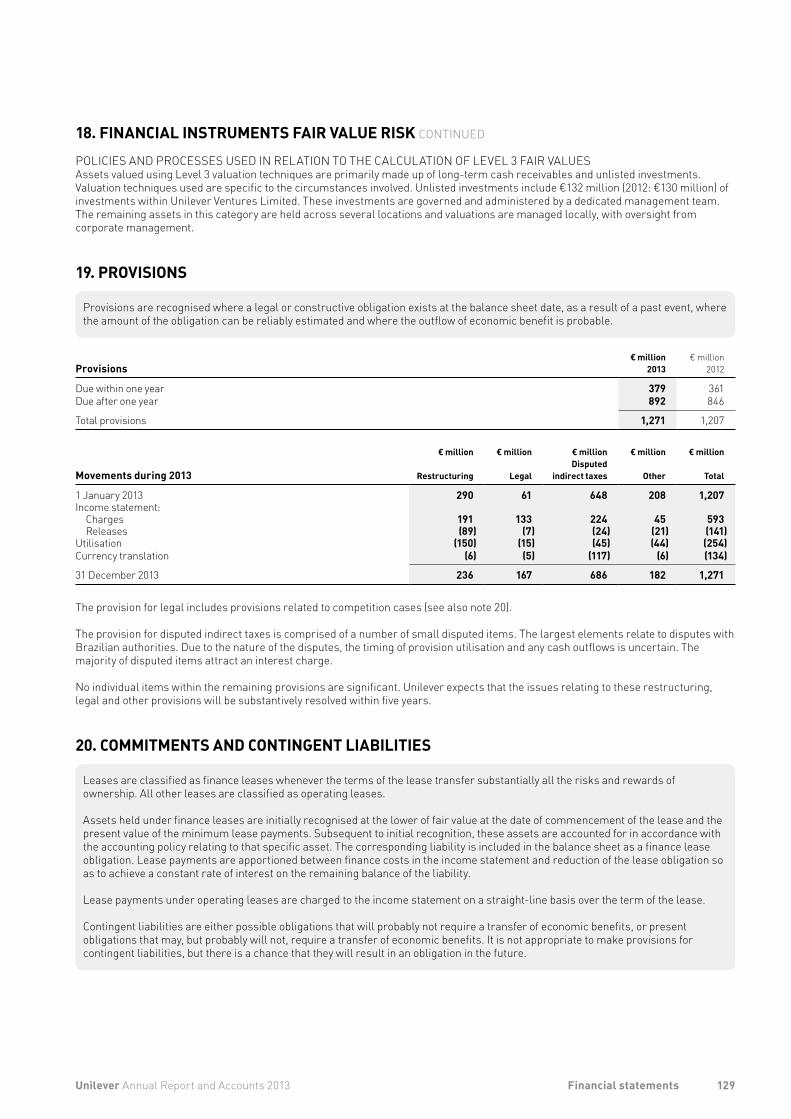
18. FINANCIAL INSTRUMENTS FAIR VALUE RISK CONTINUED
POLICIES AND PROCESSES USED IN RELATION TO THE CALCULATION OF LEVEL 3 FAIR VALUESAssets valued using Level 3 valuation techniques are primarily made up of long-term cash receivables and unlisted investments. Valuation techniques used are specific to the circumstances involved. Unlisted investments include €132 million (2012: €130 million) of investments within Unilever Ventures Limited. These investments are governed and administered by a dedicated management team. The remaining assets in this category are held across several locations and valuations are managed locally, with oversight from corporate management.
19. PROVISIONS
Provisions are recognised where a legal or constructive obligation exists at the balance sheet date, as a result of a past event, where the amount of the obligation can be reliably estimated and where the outflow of economic benefit is probable.
Provisions€ million
2013€ million
2012
Due within one year 379 361Due after one year 892 846
Total provisions 1,271 1,207
Movements during 2013
€ million
Restructuring
€ million
Legal
€ millionDisputed
indirect taxes
€ million
Other
€ million
Total
1 January 2013 290 61 648 208 1,207Income statement:
Charges 191 133 224 45 593Releases (89) (7) (24) (21) (141)
Utilisation (150) (15) (45) (44) (254)Currency translation (6) (5) (117) (6) (134)
31 December 2013 236 167 686 182 1,271
The provision for legal includes provisions related to competition cases (see also note 20).
The provision for disputed indirect taxes is comprised of a number of small disputed items. The largest elements relate to disputes with Brazilian authorities. Due to the nature of the disputes, the timing of provision utilisation and any cash outflows is uncertain. The majority of disputed items attract an interest charge.
No individual items within the remaining provisions are significant. Unilever expects that the issues relating to these restructuring, legal and other provisions will be substantively resolved within five years.
20. COMMITMENTS AND CONTINGENT LIABILITIES
Leases are classified as finance leases whenever the terms of the lease transfer substantially all the risks and rewards of ownership. All other leases are classified as operating leases.
Assets held under finance leases are initially recognised at the lower of fair value at the date of commencement of the lease and the present value of the minimum lease payments. Subsequent to initial recognition, these assets are accounted for in accordance with the accounting policy relating to that specific asset. The corresponding liability is included in the balance sheet as a finance lease obligation. Lease payments are apportioned between finance costs in the income statement and reduction of the lease obligation so as to achieve a constant rate of interest on the remaining balance of the liability.
Lease payments under operating leases are charged to the income statement on a straight-line basis over the term of the lease.
Contingent liabilities are either possible obligations that will probably not require a transfer of economic benefits, or present obligations that may, but probably will not, require a transfer of economic benefits. It is not appropriate to make provisions for contingent liabilities, but there is a chance that they will result in an obligation in the future.
129Unilever Annual Report and Accounts 2013 Financial statements
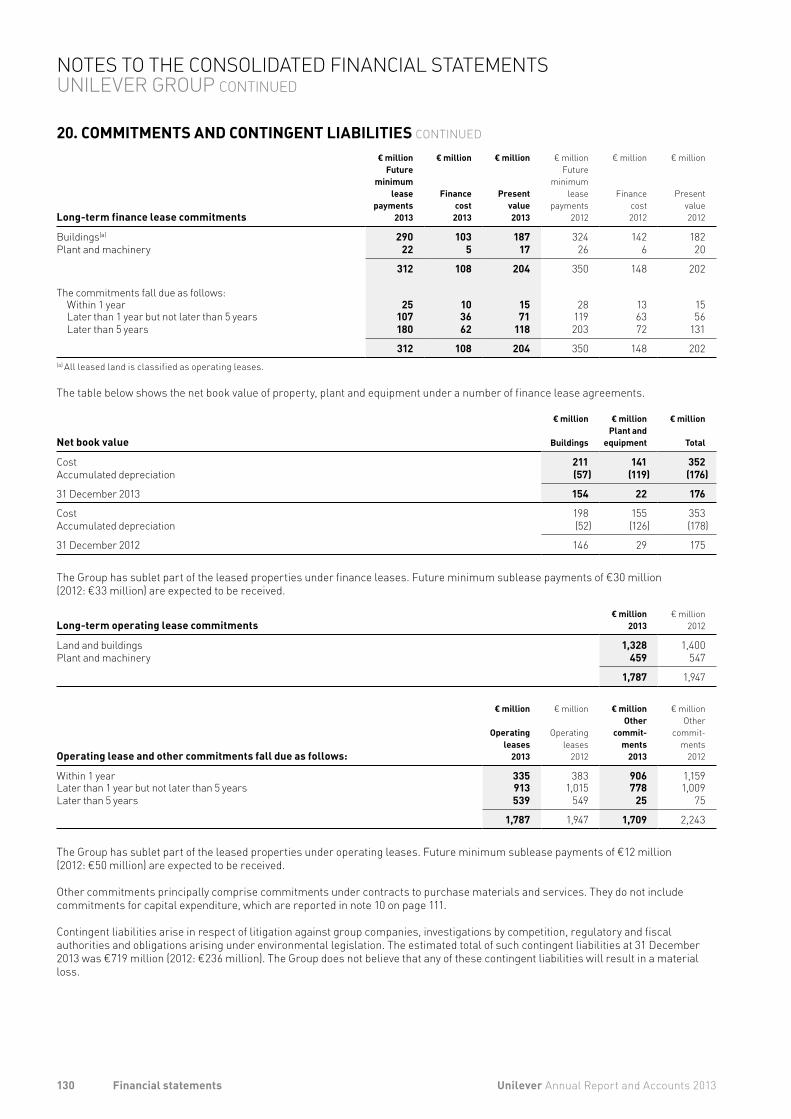
20. COMMITMENTS AND CONTINGENT LIABILITIES CONTINUED
Long-term finance lease commitments
€ millionFuture
minimumlease
payments2013
€ million
Financecost
2013
€ million
Presentvalue2013
€ millionFuture
minimumlease
payments2012
€ million
Financecost2012
€ million
Presentvalue2012
Buildings(a) 290 103 187 324 142 182Plant and machinery 22 5 17 26 6 20
312 108 204 350 148 202
The commitments fall due as follows:Within 1 year 25 10 15 28 13 15Later than 1 year but not later than 5 years 107 36 71 119 63 56Later than 5 years 180 62 118 203 72 131
312 108 204 350 148 202(a) All leased land is classified as operating leases.
The table below shows the net book value of property, plant and equipment under a number of finance lease agreements.
Net book value
€ million
Buildings
€ millionPlant and
equipment
€ million
Total
Cost 211 141 352Accumulated depreciation (57) (119) (176)
31 December 2013 154 22 176
Cost 198 155 353Accumulated depreciation (52) (126) (178)
31 December 2012 146 29 175
The Group has sublet part of the leased properties under finance leases. Future minimum sublease payments of €30 million (2012: €33 million) are expected to be received.
Long-term operating lease commitments
€ million2013
€ million2012
Land and buildings 1,328 1,400Plant and machinery 459 547
1,787 1,947
Operating lease and other commitments fall due as follows:
€ million
Operatingleases
2013
€ million
Operatingleases
2012
€ millionOther
commit-ments
2013
€ millionOther
commit-ments
2012
Within 1 year 335 383 906 1,159Later than 1 year but not later than 5 years 913 1,015 778 1,009Later than 5 years 539 549 25 75
1,787 1,947 1,709 2,243
The Group has sublet part of the leased properties under operating leases. Future minimum sublease payments of €12 million (2012: €50 million) are expected to be received.
Other commitments principally comprise commitments under contracts to purchase materials and services. They do not include commitments for capital expenditure, which are reported in note 10 on page 111.
Contingent liabilities arise in respect of litigation against group companies, investigations by competition, regulatory and fiscal authorities and obligations arising under environmental legislation. The estimated total of such contingent liabilities at 31 December 2013 was €719 million (2012: €236 million). The Group does not believe that any of these contingent liabilities will result in a material loss.
130 Unilever Annual Report and Accounts 2013Financial statements
NOTES TO THE CONSOLIDATED FINANCIAL STATEMENTS UNILEVER GROUP CONTINUED
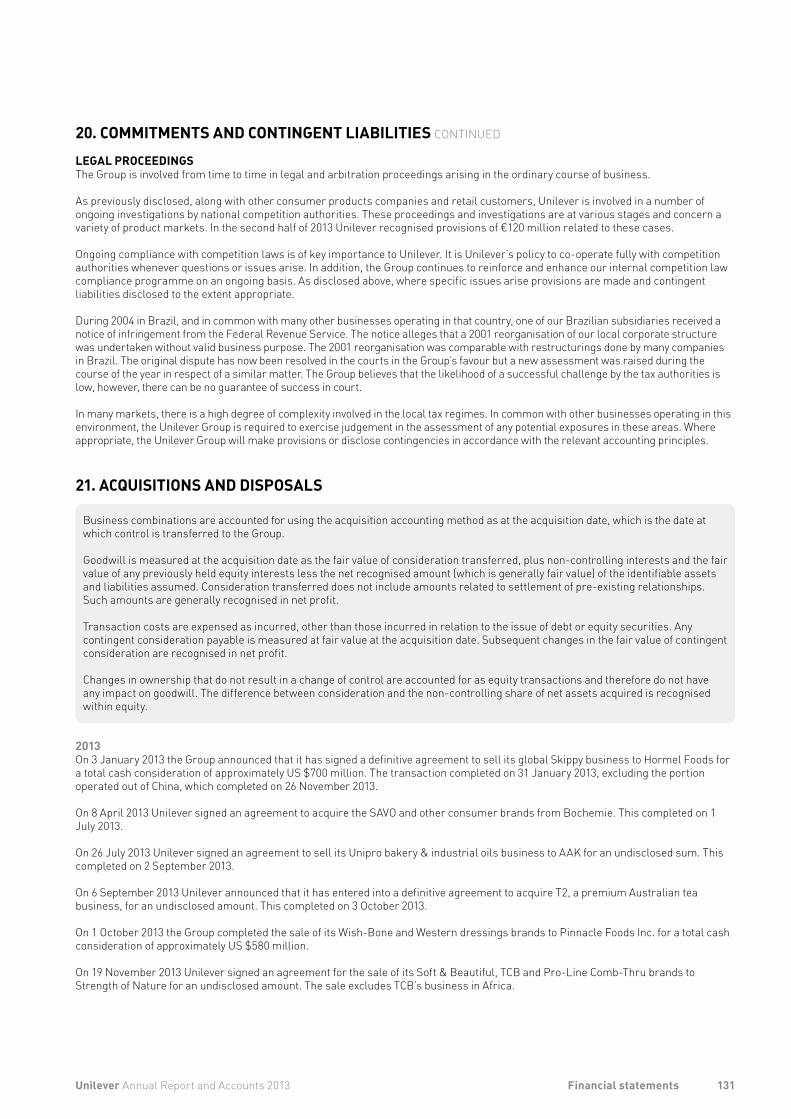
20. COMMITMENTS AND CONTINGENT LIABILITIES CONTINUED
LEGAL PROCEEDINGSThe Group is involved from time to time in legal and arbitration proceedings arising in the ordinary course of business.
As previously disclosed, along with other consumer products companies and retail customers, Unilever is involved in a number of ongoing investigations by national competition authorities. These proceedings and investigations are at various stages and concern a variety of product markets. In the second half of 2013 Unilever recognised provisions of €120 million related to these cases.
Ongoing compliance with competition laws is of key importance to Unilever. It is Unilever’s policy to co-operate fully with competition authorities whenever questions or issues arise. In addition, the Group continues to reinforce and enhance our internal competition law compliance programme on an ongoing basis. As disclosed above, where specific issues arise provisions are made and contingent liabilities disclosed to the extent appropriate.
During 2004 in Brazil, and in common with many other businesses operating in that country, one of our Brazilian subsidiaries received a notice of infringement from the Federal Revenue Service. The notice alleges that a 2001 reorganisation of our local corporate structure was undertaken without valid business purpose. The 2001 reorganisation was comparable with restructurings done by many companies in Brazil. The original dispute has now been resolved in the courts in the Group’s favour but a new assessment was raised during the course of the year in respect of a similar matter. The Group believes that the likelihood of a successful challenge by the tax authorities is low, however, there can be no guarantee of success in court. In many markets, there is a high degree of complexity involved in the local tax regimes. In common with other businesses operating in this environment, the Unilever Group is required to exercise judgement in the assessment of any potential exposures in these areas. Where appropriate, the Unilever Group will make provisions or disclose contingencies in accordance with the relevant accounting principles.
21. ACQUISITIONS AND DISPOSALS
Business combinations are accounted for using the acquisition accounting method as at the acquisition date, which is the date at which control is transferred to the Group.
Goodwill is measured at the acquisition date as the fair value of consideration transferred, plus non-controlling interests and the fair value of any previously held equity interests less the net recognised amount (which is generally fair value) of the identifiable assets and liabilities assumed. Consideration transferred does not include amounts related to settlement of pre-existing relationships. Such amounts are generally recognised in net profit.
Transaction costs are expensed as incurred, other than those incurred in relation to the issue of debt or equity securities. Any contingent consideration payable is measured at fair value at the acquisition date. Subsequent changes in the fair value of contingent consideration are recognised in net profit.
Changes in ownership that do not result in a change of control are accounted for as equity transactions and therefore do not have any impact on goodwill. The difference between consideration and the non-controlling share of net assets acquired is recognised within equity.
2013 On 3 January 2013 the Group announced that it has signed a definitive agreement to sell its global Skippy business to Hormel Foods for a total cash consideration of approximately US $700 million. The transaction completed on 31 January 2013, excluding the portion operated out of China, which completed on 26 November 2013. On 8 April 2013 Unilever signed an agreement to acquire the SAVO and other consumer brands from Bochemie. This completed on 1 July 2013. On 26 July 2013 Unilever signed an agreement to sell its Unipro bakery & industrial oils business to AAK for an undisclosed sum. This completed on 2 September 2013. On 6 September 2013 Unilever announced that it has entered into a definitive agreement to acquire T2, a premium Australian tea business, for an undisclosed amount. This completed on 3 October 2013. On 1 October 2013 the Group completed the sale of its Wish-Bone and Western dressings brands to Pinnacle Foods Inc. for a total cash consideration of approximately US $580 million. On 19 November 2013 Unilever signed an agreement for the sale of its Soft & Beautiful, TCB and Pro-Line Comb-Thru brands to Strength of Nature for an undisclosed amount. The sale excludes TCB’s business in Africa.
131Unilever Annual Report and Accounts 2013 Financial statements
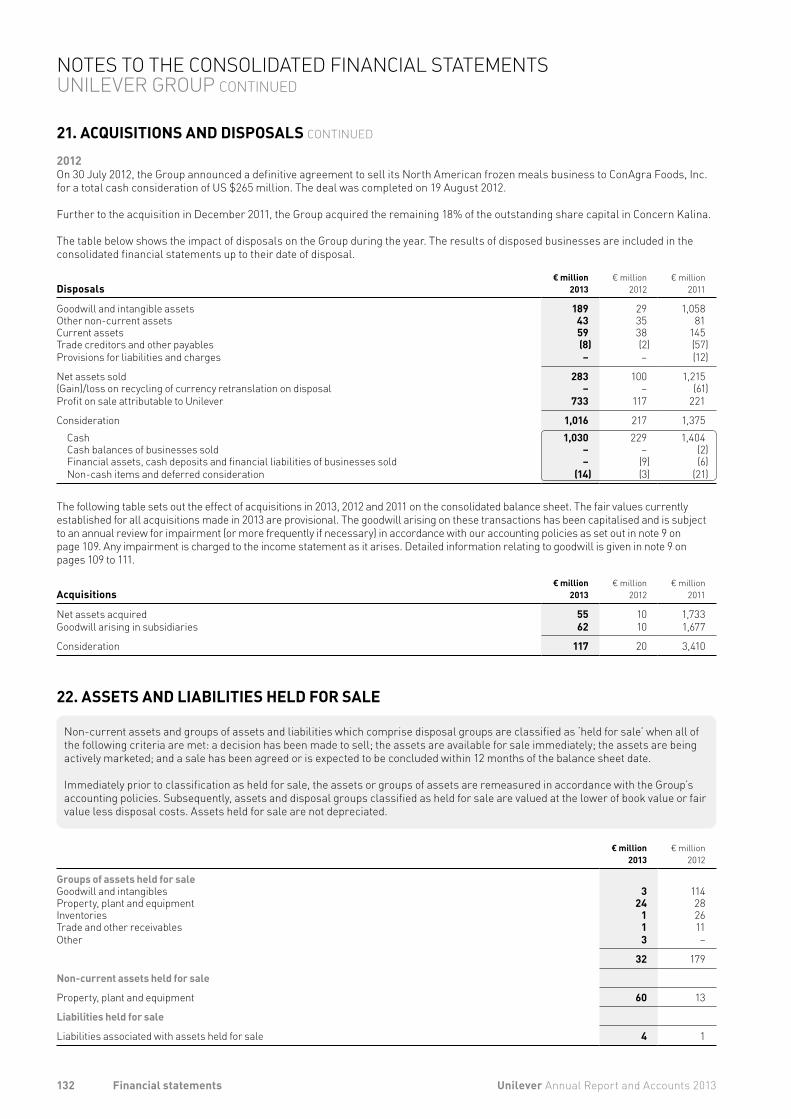
21. ACQUISITIONS AND DISPOSALS CONTINUED
2012On 30 July 2012, the Group announced a definitive agreement to sell its North American frozen meals business to ConAgra Foods, Inc. for a total cash consideration of US $265 million. The deal was completed on 19 August 2012.
Further to the acquisition in December 2011, the Group acquired the remaining 18% of the outstanding share capital in Concern Kalina.
The table below shows the impact of disposals on the Group during the year. The results of disposed businesses are included in the consolidated financial statements up to their date of disposal.
Disposals€ million
2013€ million
2012€ million
2011
Goodwill and intangible assets 189 29 1,058 Other non-current assets 43 35 81 Current assets 59 38 145 Trade creditors and other payables (8) (2) (57)Provisions for liabilities and charges – – (12)
Net assets sold 283 100 1,215 (Gain)/loss on recycling of currency retranslation on disposal – – (61)Profit on sale attributable to Unilever 733 117 221
Consideration 1,016 217 1,375Cash 1,030 229 1,404 Cash balances of businesses sold – – (2)Financial assets, cash deposits and financial liabilities of businesses sold – (9) (6)Non-cash items and deferred consideration (14) (3) (21)
The following table sets out the effect of acquisitions in 2013, 2012 and 2011 on the consolidated balance sheet. The fair values currently established for all acquisitions made in 2013 are provisional. The goodwill arising on these transactions has been capitalised and is subject to an annual review for impairment (or more frequently if necessary) in accordance with our accounting policies as set out in note 9 on page 109. Any impairment is charged to the income statement as it arises. Detailed information relating to goodwill is given in note 9 on pages 109 to 111.
Acquisitions
€ million2013
€ million2012
€ million2011
Net assets acquired 55 10 1,733Goodwill arising in subsidiaries 62 10 1,677
Consideration 117 20 3,410
22. ASSETS AND LIABILITIES HELD FOR SALE
Non-current assets and groups of assets and liabilities which comprise disposal groups are classified as ‘held for sale’ when all of the following criteria are met: a decision has been made to sell; the assets are available for sale immediately; the assets are being actively marketed; and a sale has been agreed or is expected to be concluded within 12 months of the balance sheet date.
Immediately prior to classification as held for sale, the assets or groups of assets are remeasured in accordance with the Group’s accounting policies. Subsequently, assets and disposal groups classified as held for sale are valued at the lower of book value or fair value less disposal costs. Assets held for sale are not depreciated.
€ million2013
€ million2012
Groups of assets held for saleGoodwill and intangibles 3 114Property, plant and equipment 24 28Inventories 1 26Trade and other receivables 1 11Other 3 –
32 179
Non-current assets held for sale
Property, plant and equipment 60 13
Liabilities held for sale
Liabilities associated with assets held for sale 4 1
132 Unilever Annual Report and Accounts 2013Financial statements
NOTES TO THE CONSOLIDATED FINANCIAL STATEMENTS UNILEVER GROUP CONTINUED
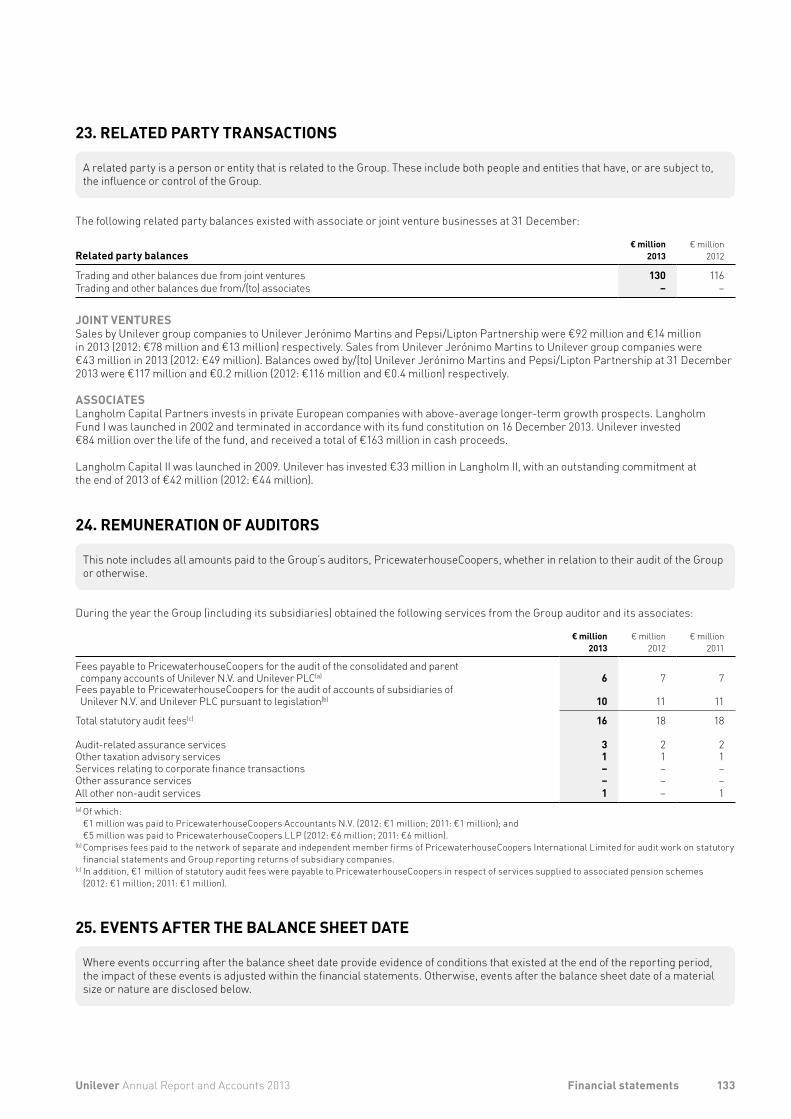
23. RELATED PARTY TRANSACTIONS
A related party is a person or entity that is related to the Group. These include both people and entities that have, or are subject to, the influence or control of the Group.
The following related party balances existed with associate or joint venture businesses at 31 December:
Related party balances
€ million2013
€ million2012
Trading and other balances due from joint ventures 130 116Trading and other balances due from/(to) associates – –
JOINT VENTURESSales by Unilever group companies to Unilever Jerónimo Martins and Pepsi/Lipton Partnership were €92 million and €14 million in 2013 (2012: €78 million and €13 million) respectively. Sales from Unilever Jerónimo Martins to Unilever group companies were €43 million in 2013 (2012: €49 million). Balances owed by/(to) Unilever Jerónimo Martins and Pepsi/Lipton Partnership at 31 December 2013 were €117 million and €0.2 million (2012: €116 million and €0.4 million) respectively.
ASSOCIATESLangholm Capital Partners invests in private European companies with above-average longer-term growth prospects. Langholm Fund I was launched in 2002 and terminated in accordance with its fund constitution on 16 December 2013. Unilever invested €84 million over the life of the fund, and received a total of €163 million in cash proceeds.
Langholm Capital II was launched in 2009. Unilever has invested €33 million in Langholm II, with an outstanding commitment at the end of 2013 of €42 million (2012: €44 million).
24. REMUNERATION OF AUDITORS
This note includes all amounts paid to the Group’s auditors, PricewaterhouseCoopers, whether in relation to their audit of the Group or otherwise.
During the year the Group (including its subsidiaries) obtained the following services from the Group auditor and its associates:
€ million2013
€ million2012
€ million2011
Fees payable to PricewaterhouseCoopers for the audit of the consolidated and parent company accounts of Unilever N.V. and Unilever PLC(a) 6 7 7
Fees payable to PricewaterhouseCoopers for the audit of accounts of subsidiaries of Unilever N.V. and Unilever PLC pursuant to legislation(b) 10 11 11
Total statutory audit fees(c) 16 18 18
Audit-related assurance services 3 2 2Other taxation advisory services 1 1 1Services relating to corporate finance transactions – – –Other assurance services – – –All other non-audit services 1 – 1(a) Of which:
€1 million was paid to PricewaterhouseCoopers Accountants N.V. (2012: €1 million; 2011: €1 million); and €5 million was paid to PricewaterhouseCoopers LLP (2012: €6 million; 2011: €6 million).
(b) Comprises fees paid to the network of separate and independent member firms of PricewaterhouseCoopers International Limited for audit work on statutory financial statements and Group reporting returns of subsidiary companies.
(c) In addition, €1 million of statutory audit fees were payable to PricewaterhouseCoopers in respect of services supplied to associated pension schemes (2012: €1 million; 2011: €1 million).
25. EVENTS AFTER THE BALANCE SHEET DATE
Where events occurring after the balance sheet date provide evidence of conditions that existed at the end of the reporting period, the impact of these events is adjusted within the financial statements. Otherwise, events after the balance sheet date of a material size or nature are disclosed below.
133Unilever Annual Report and Accounts 2013 Financial statements
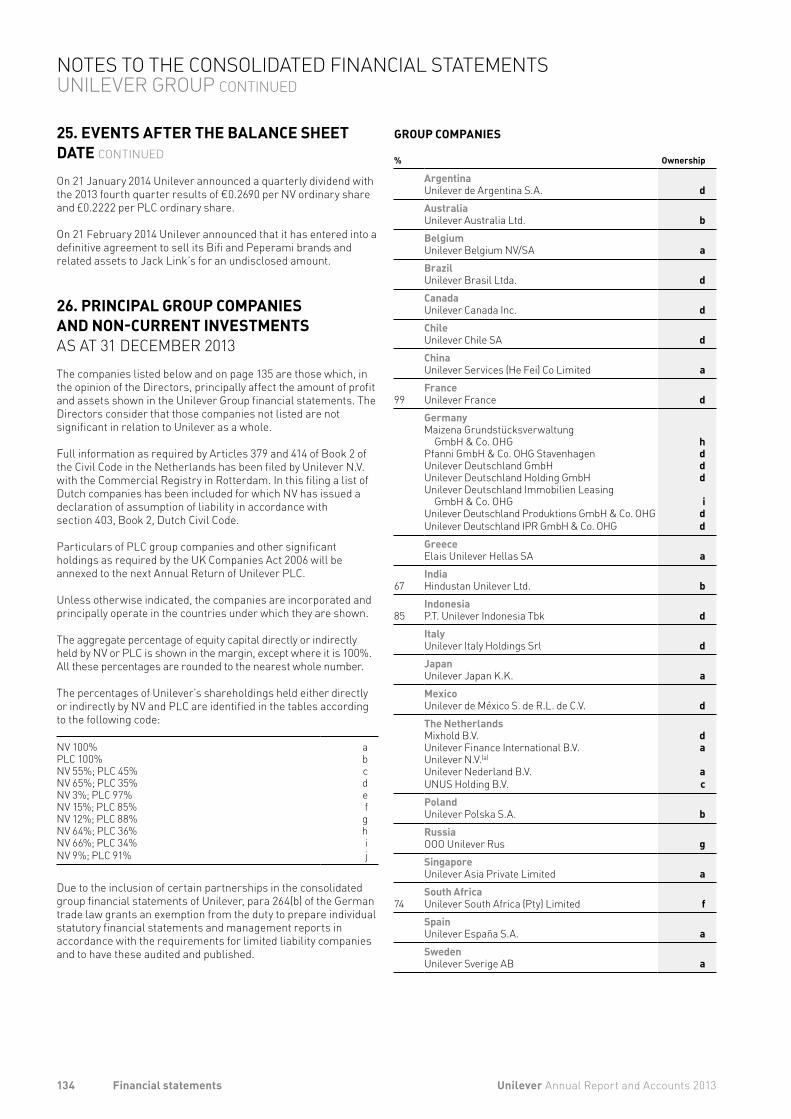
25. EVENTS AFTER THE BALANCE SHEET DATE CONTINUED
On 21 January 2014 Unilever announced a quarterly dividend with the 2013 fourth quarter results of €0.2690 per NV ordinary share and £0.2222 per PLC ordinary share.
On 21 February 2014 Unilever announced that it has entered into a definitive agreement to sell its Bifi and Peperami brands and related assets to Jack Link’s for an undisclosed amount.
26. PRINCIPAL GROUP COMPANIES AND NON-CURRENT INVESTMENTS AS AT 31 DECEMBER 2013The companies listed below and on page 135 are those which, in the opinion of the Directors, principally affect the amount of profit and assets shown in the Unilever Group financial statements. The Directors consider that those companies not listed are not significant in relation to Unilever as a whole.
Full information as required by Articles 379 and 414 of Book 2 of the Civil Code in the Netherlands has been filed by Unilever N.V. with the Commercial Registry in Rotterdam. In this filing a list of Dutch companies has been included for which NV has issued a declaration of assumption of liability in accordance with section 403, Book 2, Dutch Civil Code.
Particulars of PLC group companies and other significant holdings as required by the UK Companies Act 2006 will be annexed to the next Annual Return of Unilever PLC.
Unless otherwise indicated, the companies are incorporated and principally operate in the countries under which they are shown.
The aggregate percentage of equity capital directly or indirectly held by NV or PLC is shown in the margin, except where it is 100%. All these percentages are rounded to the nearest whole number.
The percentages of Unilever’s shareholdings held either directly or indirectly by NV and PLC are identified in the tables according to the following code:
NV 100% aPLC 100% bNV 55%; PLC 45% cNV 65%; PLC 35% dNV 3%; PLC 97% eNV 15%; PLC 85% fNV 12%; PLC 88% gNV 64%; PLC 36% hNV 66%; PLC 34% iNV 9%; PLC 91% j
Due to the inclusion of certain partnerships in the consolidated group financial statements of Unilever, para 264(b) of the German trade law grants an exemption from the duty to prepare individual statutory financial statements and management reports in accordance with the requirements for limited liability companies and to have these audited and published.
GROUP COMPANIES
% Ownership
ArgentinaUnilever de Argentina S.A. dAustraliaUnilever Australia Ltd. bBelgiumUnilever Belgium NV/SA aBrazilUnilever Brasil Ltda. dCanadaUnilever Canada Inc. dChileUnilever Chile SA dChinaUnilever Services (He Fei) Co Limited a
99FranceUnilever France dGermanyMaizena Grundstücksverwaltung
GmbH & Co. OHG hPfanni GmbH & Co. OHG Stavenhagen dUnilever Deutschland GmbH dUnilever Deutschland Holding GmbH dUnilever Deutschland Immobilien Leasing
GmbH & Co. OHG iUnilever Deutschland Produktions GmbH & Co. OHG dUnilever Deutschland IPR GmbH & Co. OHG dGreeceElais Unilever Hellas SA a
67IndiaHindustan Unilever Ltd. b
85IndonesiaP.T. Unilever Indonesia Tbk dItalyUnilever Italy Holdings Srl dJapanUnilever Japan K.K. aMexicoUnilever de México S. de R.L. de C.V. dThe NetherlandsMixhold B.V. dUnilever Finance International B.V. aUnilever N.V.(a) Unilever Nederland B.V. aUNUS Holding B.V. cPolandUnilever Polska S.A. bRussiaOOO Unilever Rus gSingapore Unilever Asia Private Limited a
74South AfricaUnilever South Africa (Pty) Limited fSpain Unilever España S.A. aSwedenUnilever Sverige AB a
134 Unilever Annual Report and Accounts 2013Financial statements
NOTES TO THE CONSOLIDATED FINANCIAL STATEMENTS UNILEVER GROUP CONTINUED
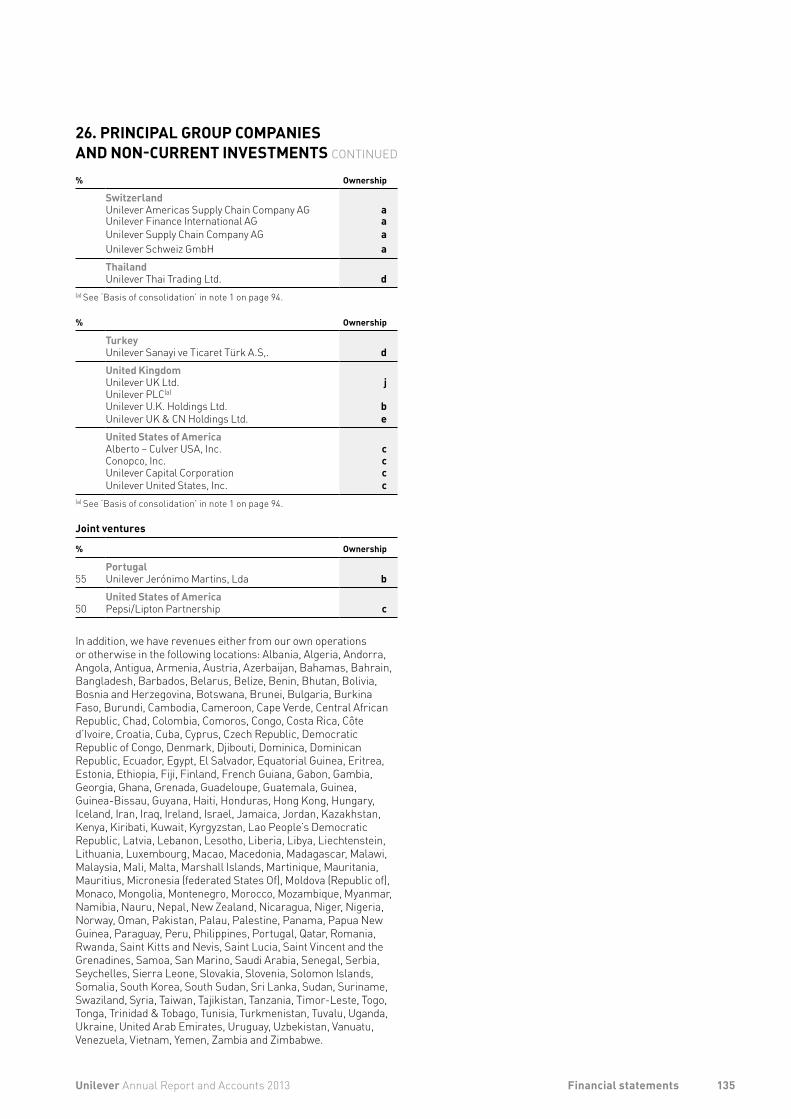
% Ownership
Switzerland Unilever Americas Supply Chain Company AG aUnilever Finance International AG aUnilever Supply Chain Company AG aUnilever Schweiz GmbH aThailandUnilever Thai Trading Ltd. d
(a) See ‘Basis of consolidation’ in note 1 on page 94.
% Ownership
Turkey Unilever Sanayi ve Ticaret Türk A.S,. dUnited Kingdom Unilever UK Ltd. jUnilever PLC(a) Unilever U.K. Holdings Ltd. bUnilever UK & CN Holdings Ltd. eUnited States of America Alberto – Culver USA, Inc. cConopco, Inc. cUnilever Capital Corporation cUnilever United States, Inc. c
(a) See ‘Basis of consolidation’ in note 1 on page 94.
Joint ventures
% Ownership
55PortugalUnilever Jerónimo Martins, Lda b
50United States of America Pepsi/Lipton Partnership c
In addition, we have revenues either from our own operations or otherwise in the following locations: Albania, Algeria, Andorra, Angola, Antigua, Armenia, Austria, Azerbaijan, Bahamas, Bahrain, Bangladesh, Barbados, Belarus, Belize, Benin, Bhutan, Bolivia, Bosnia and Herzegovina, Botswana, Brunei, Bulgaria, Burkina Faso, Burundi, Cambodia, Cameroon, Cape Verde, Central African Republic, Chad, Colombia, Comoros, Congo, Costa Rica, Côte d’Ivoire, Croatia, Cuba, Cyprus, Czech Republic, Democratic Republic of Congo, Denmark, Djibouti, Dominica, Dominican Republic, Ecuador, Egypt, El Salvador, Equatorial Guinea, Eritrea, Estonia, Ethiopia, Fiji, Finland, French Guiana, Gabon, Gambia, Georgia, Ghana, Grenada, Guadeloupe, Guatemala, Guinea, Guinea-Bissau, Guyana, Haiti, Honduras, Hong Kong, Hungary, Iceland, Iran, Iraq, Ireland, Israel, Jamaica, Jordan, Kazakhstan, Kenya, Kiribati, Kuwait, Kyrgyzstan, Lao People’s Democratic Republic, Latvia, Lebanon, Lesotho, Liberia, Libya, Liechtenstein, Lithuania, Luxembourg, Macao, Macedonia, Madagascar, Malawi, Malaysia, Mali, Malta, Marshall Islands, Martinique, Mauritania, Mauritius, Micronesia (federated States Of), Moldova (Republic of), Monaco, Mongolia, Montenegro, Morocco, Mozambique, Myanmar, Namibia, Nauru, Nepal, New Zealand, Nicaragua, Niger, Nigeria, Norway, Oman, Pakistan, Palau, Palestine, Panama, Papua New Guinea, Paraguay, Peru, Philippines, Portugal, Qatar, Romania, Rwanda, Saint Kitts and Nevis, Saint Lucia, Saint Vincent and the Grenadines, Samoa, San Marino, Saudi Arabia, Senegal, Serbia, Seychelles, Sierra Leone, Slovakia, Slovenia, Solomon Islands, Somalia, South Korea, South Sudan, Sri Lanka, Sudan, Suriname, Swaziland, Syria, Taiwan, Tajikistan, Tanzania, Timor-Leste, Togo, Tonga, Trinidad & Tobago, Tunisia, Turkmenistan, Tuvalu, Uganda, Ukraine, United Arab Emirates, Uruguay, Uzbekistan, Vanuatu, Venezuela, Vietnam, Yemen, Zambia and Zimbabwe.
26. PRINCIPAL GROUP COMPANIES AND NON-CURRENT INVESTMENTS CONTINUED
135Unilever Annual Report and Accounts 2013 Financial statements
OPINION WITH RESPECT TO THE COMPANY ACCOUNTSIn our opinion, the company accounts give a true and fair view of the financial position of Unilever N.V. as at 31 December 2013, and of its result for the year then ended in accordance with United Kingdom accounting standards and with Part 9 of Book 2 of the Dutch Civil Code.
SEPARATE REPORT ON CONSOLIDATED FINANCIAL STATEMENTSWe have reported separately on the consolidated financial statements of Unilever Group for the year ended 31 December 2013.
REPORT ON OTHER LEGAL AND REGULATORY REQUIREMENTSPursuant to the legal requirement under Section 2: 393 sub 5 at e and f of the Dutch Civil Code, we have no deficiencies to report as a result of our examination whether the Report of the Directors, (comprising the sections Strategic Report and Governance), to the extent we can assess, has been prepared in accordance with Part 9 of Book 2 of this Code, and whether the information as required under Section 2: 392 sub 1 at b-h has been annexed. Further we report that the Report of the Directors, to the extent we can assess, is consistent with the company accounts as required by Section 2: 391 sub 4 of the Dutch Civil Code.
Amsterdam, 4 March 2014PricewaterhouseCoopers Accountants N.V.
Original has been signed by P J van Mierlo RA
INDEPENDENT AUDITOR’S REPORTTO: THE GENERAL MEETING OF UNILEVER N.V.
REPORT ON THE COMPANY ACCOUNTSWe have audited the accompanying company accounts 2013 as set out on pages 137 to 140 of the Annual Report and Accounts 2013 of Unilever N.V., Rotterdam, which comprise the balance sheet as at 31 December 2013, the profit and loss account for the year then ended and the notes, comprising a summary of accounting policies and other explanatory information.
DIRECTORS’ RESPONSIBILITYThe Directors are responsible for the preparation and fair presentation of these company accounts in accordance with United Kingdom accounting standards and with Part 9 of Book 2 of the Dutch Civil Code and for the preparation of the Report of the Directors in accordance with Part 9 of Book 2 of the Dutch Civil Code. Furthermore, the Directors are responsible for such internal control as they determine is necessary to enable the preparation of the company accounts that are free from material misstatement, whether due to fraud or error.
AUDITOR’S RESPONSIBILITYOur responsibility is to express an opinion on these company accounts based on our audit. We conducted our audit in accordance with Dutch law, including the Dutch Standards on Auditing. This requires that we comply with ethical requirements and plan and perform the audit to obtain reasonable assurance about whether the company accounts are free from material misstatement.
An audit involves performing procedures to obtain audit evidence about the amounts and disclosures in the company accounts. The procedures selected depend on the auditor’s judgement, including the assessment of the risks of material misstatement of the company accounts, whether due to fraud or error. In making those risk assessments, the auditor considers internal control relevant to the company’s preparation and fair presentation of the company accounts in order to design audit procedures that are appropriate in the circumstances, but not for the purpose of expressing an opinion on the effectiveness of the company’s internal control. An audit also includes evaluating the appropriateness of accounting policies used and the reasonableness of accounting estimates made by the Directors, as well as evaluating the overall presentation of the company accounts.
We believe that the audit evidence we have obtained is sufficient and appropriate to provide a basis for our audit opinion.
136 Unilever Annual Report and Accounts 2013Financial statements
COMPANY ACCOUNTS INDEPENDENT AUDITOR’S REPORT – UNILEVER N.V.
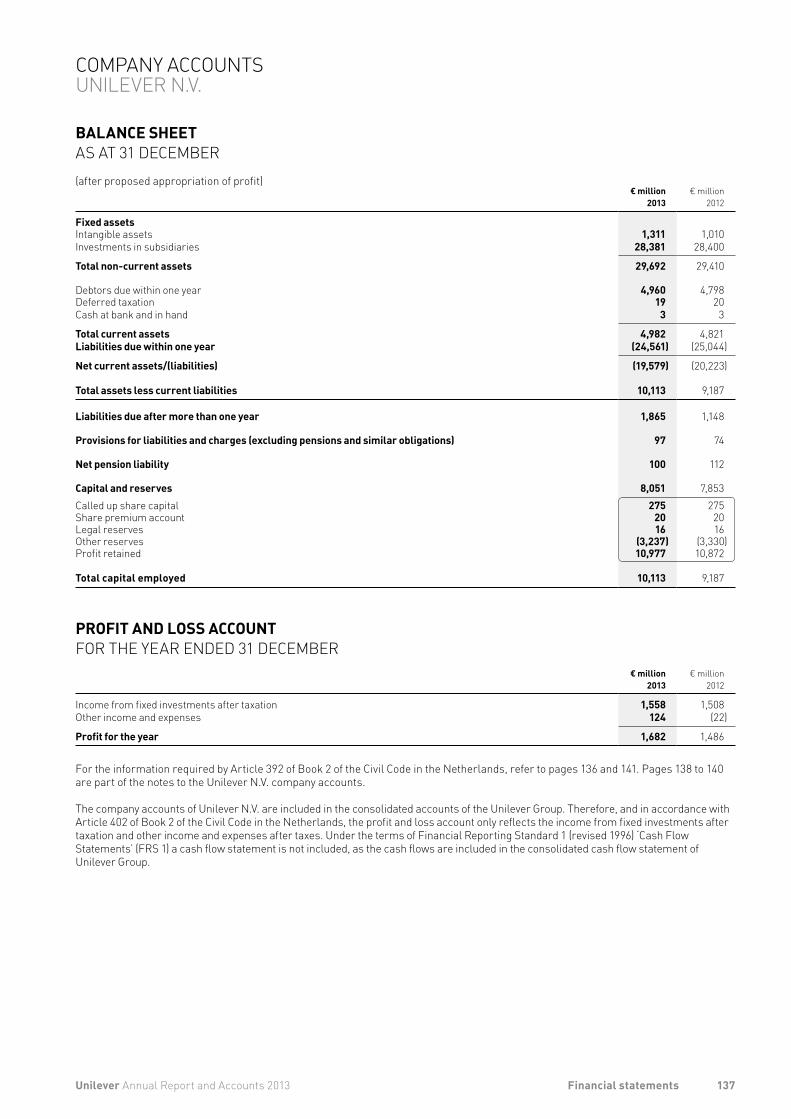
BALANCE SHEET AS AT 31 DECEMBER(after proposed appropriation of profit)
€ million2013
€ million2012
Fixed assetsIntangible assets 1,311 1,010Investments in subsidiaries 28,381 28,400
Total non-current assets 29,692 29,410
Debtors due within one year 4,960 4,798Deferred taxation 19 20Cash at bank and in hand 3 3
Total current assets 4,982 4,821Liabilities due within one year (24,561) (25,044)
Net current assets/(liabilities) (19,579) (20,223)
Total assets less current liabilities 10,113 9,187
Liabilities due after more than one year 1,865 1,148
Provisions for liabilities and charges (excluding pensions and similar obligations) 97 74
Net pension liability 100 112
Capital and reserves 8,051 7,853Called up share capital 275 275Share premium account 20 20Legal reserves 16 16Other reserves (3,237) (3,330)Profit retained 10,977 10,872
Total capital employed 10,113 9,187
PROFIT AND LOSS ACCOUNT FOR THE YEAR ENDED 31 DECEMBER
€ million2013
€ million2012
Income from fixed investments after taxation 1,558 1,508Other income and expenses 124 (22)
Profit for the year 1,682 1,486
For the information required by Article 392 of Book 2 of the Civil Code in the Netherlands, refer to pages 136 and 141. Pages 138 to 140 are part of the notes to the Unilever N.V. company accounts.
The company accounts of Unilever N.V. are included in the consolidated accounts of the Unilever Group. Therefore, and in accordance with Article 402 of Book 2 of the Civil Code in the Netherlands, the profit and loss account only reflects the income from fixed investments after taxation and other income and expenses after taxes. Under the terms of Financial Reporting Standard 1 (revised 1996) ‘Cash Flow Statements’ (FRS 1) a cash flow statement is not included, as the cash flows are included in the consolidated cash flow statement of Unilever Group.
137Unilever Annual Report and Accounts 2013 Financial statements
COMPANY ACCOUNTS UNILEVER N.V.
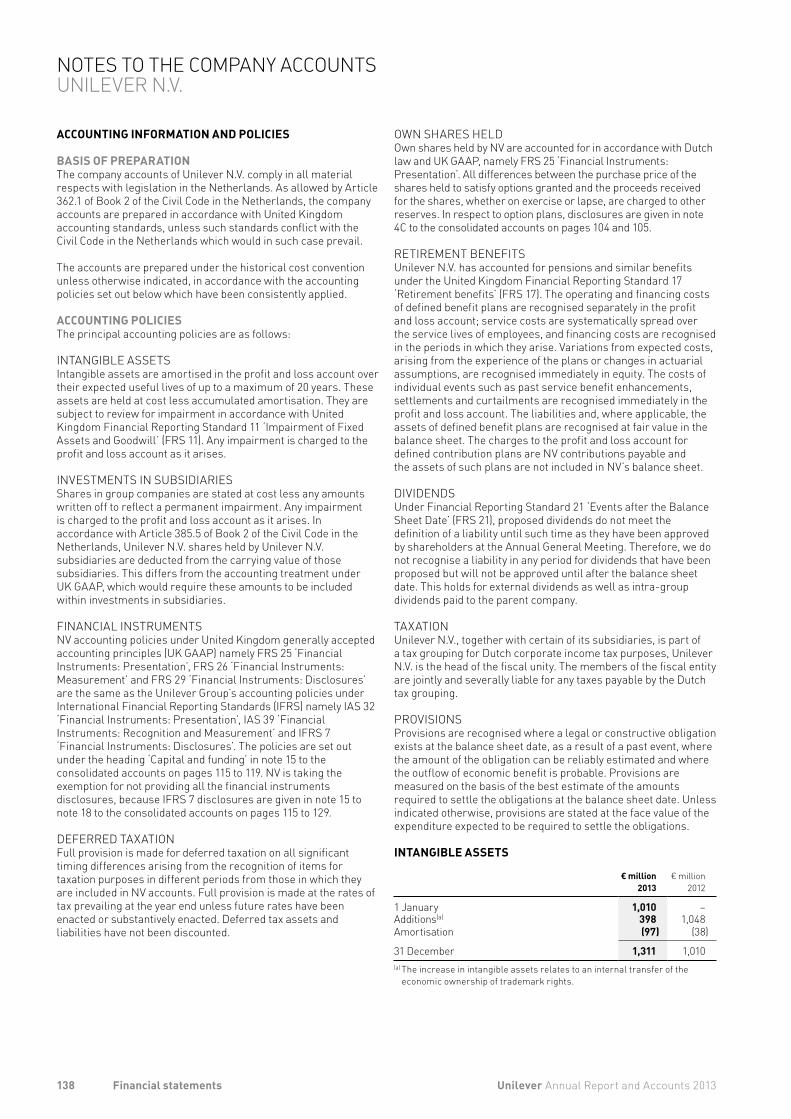
OWN SHARES HELD Own shares held by NV are accounted for in accordance with Dutch law and UK GAAP, namely FRS 25 ‘Financial Instruments: Presentation’. All differences between the purchase price of the shares held to satisfy options granted and the proceeds received for the shares, whether on exercise or lapse, are charged to other reserves. In respect to option plans, disclosures are given in note 4C to the consolidated accounts on pages 104 and 105.
RETIREMENT BENEFITSUnilever N.V. has accounted for pensions and similar benefits under the United Kingdom Financial Reporting Standard 17 ‘Retirement benefits’ (FRS 17). The operating and financing costs of defined benefit plans are recognised separately in the profit and loss account; service costs are systematically spread over the service lives of employees, and financing costs are recognised in the periods in which they arise. Variations from expected costs, arising from the experience of the plans or changes in actuarial assumptions, are recognised immediately in equity. The costs of individual events such as past service benefit enhancements, settlements and curtailments are recognised immediately in the profit and loss account. The liabilities and, where applicable, the assets of defined benefit plans are recognised at fair value in the balance sheet. The charges to the profit and loss account for defined contribution plans are NV contributions payable and the assets of such plans are not included in NV’s balance sheet.
DIVIDENDSUnder Financial Reporting Standard 21 ‘Events after the Balance Sheet Date’ (FRS 21), proposed dividends do not meet the definition of a liability until such time as they have been approved by shareholders at the Annual General Meeting. Therefore, we do not recognise a liability in any period for dividends that have been proposed but will not be approved until after the balance sheet date. This holds for external dividends as well as intra-group dividends paid to the parent company.
TAXATIONUnilever N.V., together with certain of its subsidiaries, is part of a tax grouping for Dutch corporate income tax purposes, Unilever N.V. is the head of the fiscal unity. The members of the fiscal entity are jointly and severally liable for any taxes payable by the Dutch tax grouping.
PROVISIONSProvisions are recognised where a legal or constructive obligation exists at the balance sheet date, as a result of a past event, where the amount of the obligation can be reliably estimated and where the outflow of economic benefit is probable. Provisions are measured on the basis of the best estimate of the amounts required to settle the obligations at the balance sheet date. Unless indicated otherwise, provisions are stated at the face value of the expenditure expected to be required to settle the obligations.
INTANGIBLE ASSETS
€ million2013
€ million2012
1 January 1,010 –Additions(a) 398 1,048Amortisation (97) (38)
31 December 1,311 1,010(a) The increase in intangible assets relates to an internal transfer of the
economic ownership of trademark rights.
ACCOUNTING INFORMATION AND POLICIES
BASIS OF PREPARATIONThe company accounts of Unilever N.V. comply in all material respects with legislation in the Netherlands. As allowed by Article 362.1 of Book 2 of the Civil Code in the Netherlands, the company accounts are prepared in accordance with United Kingdom accounting standards, unless such standards conflict with the Civil Code in the Netherlands which would in such case prevail.
The accounts are prepared under the historical cost convention unless otherwise indicated, in accordance with the accounting policies set out below which have been consistently applied.
ACCOUNTING POLICIESThe principal accounting policies are as follows:
INTANGIBLE ASSETSIntangible assets are amortised in the profit and loss account over their expected useful lives of up to a maximum of 20 years. These assets are held at cost less accumulated amortisation. They are subject to review for impairment in accordance with United Kingdom Financial Reporting Standard 11 ‘Impairment of Fixed Assets and Goodwill’ (FRS 11). Any impairment is charged to the profit and loss account as it arises.
INVESTMENTS IN SUBSIDIARIESShares in group companies are stated at cost less any amounts written off to reflect a permanent impairment. Any impairment is charged to the profit and loss account as it arises. In accordance with Article 385.5 of Book 2 of the Civil Code in the Netherlands, Unilever N.V. shares held by Unilever N.V. subsidiaries are deducted from the carrying value of those subsidiaries. This differs from the accounting treatment under UK GAAP, which would require these amounts to be included within investments in subsidiaries.
FINANCIAL INSTRUMENTSNV accounting policies under United Kingdom generally accepted accounting principles (UK GAAP) namely FRS 25 ‘Financial Instruments: Presentation’, FRS 26 ‘Financial Instruments: Measurement’ and FRS 29 ‘Financial Instruments: Disclosures’ are the same as the Unilever Group’s accounting policies under International Financial Reporting Standards (IFRS) namely IAS 32 ‘Financial Instruments: Presentation’, IAS 39 ‘Financial Instruments: Recognition and Measurement’ and IFRS 7 ‘Financial Instruments: Disclosures’. The policies are set out under the heading ‘Capital and funding’ in note 15 to the consolidated accounts on pages 115 to 119. NV is taking the exemption for not providing all the financial instruments disclosures, because IFRS 7 disclosures are given in note 15 to note 18 to the consolidated accounts on pages 115 to 129.
DEFERRED TAXATIONFull provision is made for deferred taxation on all significant timing differences arising from the recognition of items for taxation purposes in different periods from those in which they are included in NV accounts. Full provision is made at the rates of tax prevailing at the year end unless future rates have been enacted or substantively enacted. Deferred tax assets and liabilities have not been discounted.
138 Unilever Annual Report and Accounts 2013Financial statements
NOTES TO THE COMPANY ACCOUNTS UNILEVER N.V.
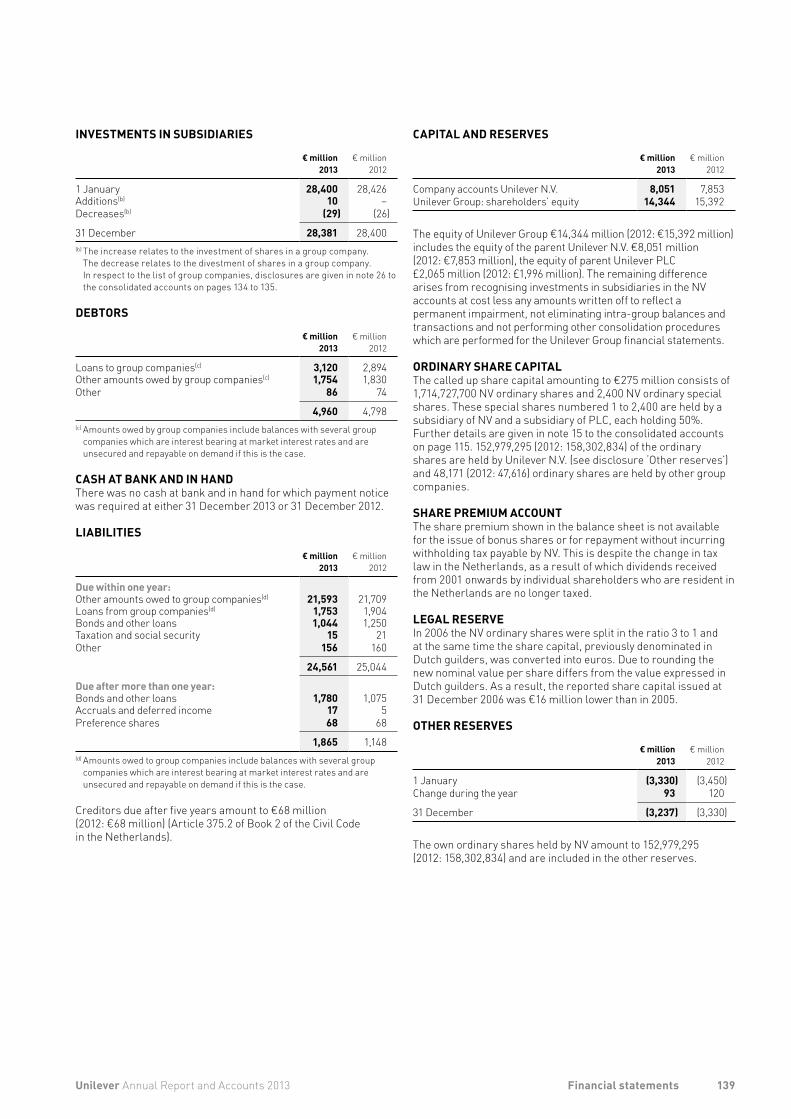
CAPITAL AND RESERVES
€ million
2013€ million
2012
Company accounts Unilever N.V. 8,051 7,853Unilever Group: shareholders’ equity 14,344 15,392
The equity of Unilever Group €14,344 million (2012: €15,392 million) includes the equity of the parent Unilever N.V. €8,051 million (2012: €7,853 million), the equity of parent Unilever PLC £2,065 million (2012: £1,996 million). The remaining difference arises from recognising investments in subsidiaries in the NV accounts at cost less any amounts written off to reflect a permanent impairment, not eliminating intra-group balances and transactions and not performing other consolidation procedures which are performed for the Unilever Group financial statements.
ORDINARY SHARE CAPITALThe called up share capital amounting to €275 million consists of 1,714,727,700 NV ordinary shares and 2,400 NV ordinary special shares. These special shares numbered 1 to 2,400 are held by a subsidiary of NV and a subsidiary of PLC, each holding 50%. Further details are given in note 15 to the consolidated accounts on page 115. 152,979,295 (2012: 158,302,834) of the ordinary shares are held by Unilever N.V. (see disclosure ‘Other reserves’) and 48,171 (2012: 47,616) ordinary shares are held by other group companies.
SHARE PREMIUM ACCOUNTThe share premium shown in the balance sheet is not available for the issue of bonus shares or for repayment without incurring withholding tax payable by NV. This is despite the change in tax law in the Netherlands, as a result of which dividends received from 2001 onwards by individual shareholders who are resident in the Netherlands are no longer taxed.
LEGAL RESERVEIn 2006 the NV ordinary shares were split in the ratio 3 to 1 and at the same time the share capital, previously denominated in Dutch guilders, was converted into euros. Due to rounding the new nominal value per share differs from the value expressed in Dutch guilders. As a result, the reported share capital issued at 31 December 2006 was €16 million lower than in 2005.
OTHER RESERVES
€ million
2013€ million
2012
1 January (3,330) (3,450)Change during the year 93 120
31 December (3,237) (3,330)
The own ordinary shares held by NV amount to 152,979,295 (2012: 158,302,834) and are included in the other reserves.
INVESTMENTS IN SUBSIDIARIES
€ million
2013€ million
2012
1 January 28,400 28,426Additions(b) 10 –Decreases(b) (29) (26)
31 December 28,381 28,400(b) The increase relates to the investment of shares in a group company.
The decrease relates to the divestment of shares in a group company. In respect to the list of group companies, disclosures are given in note 26 to the consolidated accounts on pages 134 to 135.
DEBTORS
€ million
2013€ million
2012
Loans to group companies(c) 3,120 2,894Other amounts owed by group companies(c) 1,754 1,830Other 86 74
4,960 4,798(c) Amounts owed by group companies include balances with several group
companies which are interest bearing at market interest rates and are unsecured and repayable on demand if this is the case.
CASH AT BANK AND IN HANDThere was no cash at bank and in hand for which payment notice was required at either 31 December 2013 or 31 December 2012.
LIABILITIES
€ million
2013€ million
2012
Due within one year:Other amounts owed to group companies(d) 21,593 21,709Loans from group companies(d) 1,753 1,904Bonds and other loans 1,044 1,250Taxation and social security 15 21Other 156 160
24,561 25,044
Due after more than one year:Bonds and other loans 1,780 1,075Accruals and deferred income 17 5Preference shares 68 68
1,865 1,148(d) Amounts owed to group companies include balances with several group
companies which are interest bearing at market interest rates and are unsecured and repayable on demand if this is the case.
Creditors due after five years amount to €68 million (2012: €68 million) (Article 375.2 of Book 2 of the Civil Code in the Netherlands).
139Unilever Annual Report and Accounts 2013 Financial statements
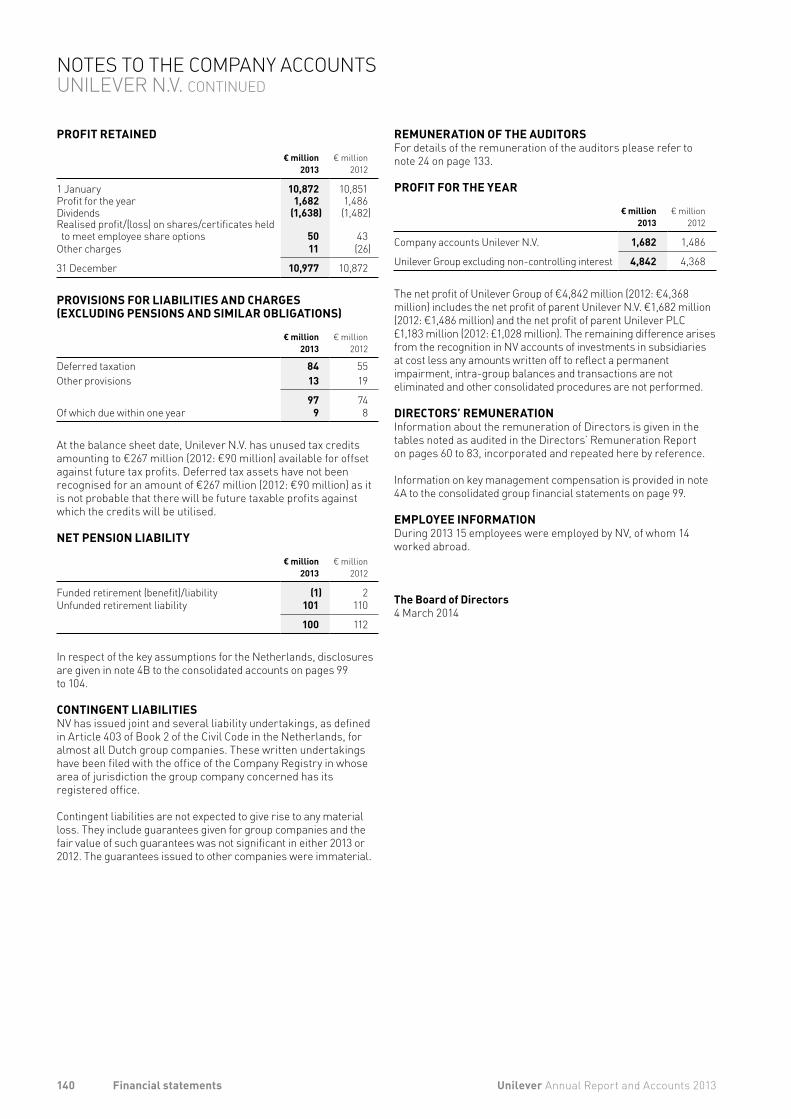
PROFIT RETAINED
€ million
2013€ million
2012
1 January 10,872 10,851Profit for the year 1,682 1,486Dividends (1,638) (1,482)Realised profit/(loss) on shares/certificates held to meet employee share options 50 43
Other charges 11 (26)
31 December 10,977 10,872
PROVISIONS FOR LIABILITIES AND CHARGES (EXCLUDING PENSIONS AND SIMILAR OBLIGATIONS)
€ million2013
€ million2012
Deferred taxation 84 55Other provisions 13 19
97 74Of which due within one year 9 8
At the balance sheet date, Unilever N.V. has unused tax credits amounting to €267 million (2012: €90 million) available for offset against future tax profits. Deferred tax assets have not been recognised for an amount of €267 million (2012: €90 million) as it is not probable that there will be future taxable profits against which the credits will be utilised.
NET PENSION LIABILITY
€ million2013
€ million2012
Funded retirement (benefit)/liability (1) 2Unfunded retirement liability 101 110
100 112
In respect of the key assumptions for the Netherlands, disclosures are given in note 4B to the consolidated accounts on pages 99to 104.
CONTINGENT LIABILITIESNV has issued joint and several liability undertakings, as defined in Article 403 of Book 2 of the Civil Code in the Netherlands, for almost all Dutch group companies. These written undertakings have been filed with the office of the Company Registry in whose area of jurisdiction the group company concerned has its registered office.
Contingent liabilities are not expected to give rise to any material loss. They include guarantees given for group companies and the fair value of such guarantees was not significant in either 2013 or 2012. The guarantees issued to other companies were immaterial.
REMUNERATION OF THE AUDITORSFor details of the remuneration of the auditors please refer to note 24 on page 133.
PROFIT FOR THE YEAR
€ million2013
€ million2012
Company accounts Unilever N.V. 1,682 1,486
Unilever Group excluding non-controlling interest 4,842 4,368
The net profit of Unilever Group of €4,842 million (2012: €4,368 million) includes the net profit of parent Unilever N.V. €1,682 million (2012: €1,486 million) and the net profit of parent Unilever PLC £1,183 million (2012: £1,028 million). The remaining difference arises from the recognition in NV accounts of investments in subsidiaries at cost less any amounts written off to reflect a permanent impairment, intra-group balances and transactions are not eliminated and other consolidated procedures are not performed.
DIRECTORS’ REMUNERATIONInformation about the remuneration of Directors is given in the tables noted as audited in the Directors’ Remuneration Report on pages 60 to 83, incorporated and repeated here by reference.
Information on key management compensation is provided in note 4A to the consolidated group financial statements on page 99.
EMPLOYEE INFORMATIONDuring 2013 15 employees were employed by NV, of whom 14 worked abroad.
The Board of Directors4 March 2014
140 Unilever Annual Report and Accounts 2013Financial statements
NOTES TO THE COMPANY ACCOUNTS UNILEVER N.V. CONTINUED
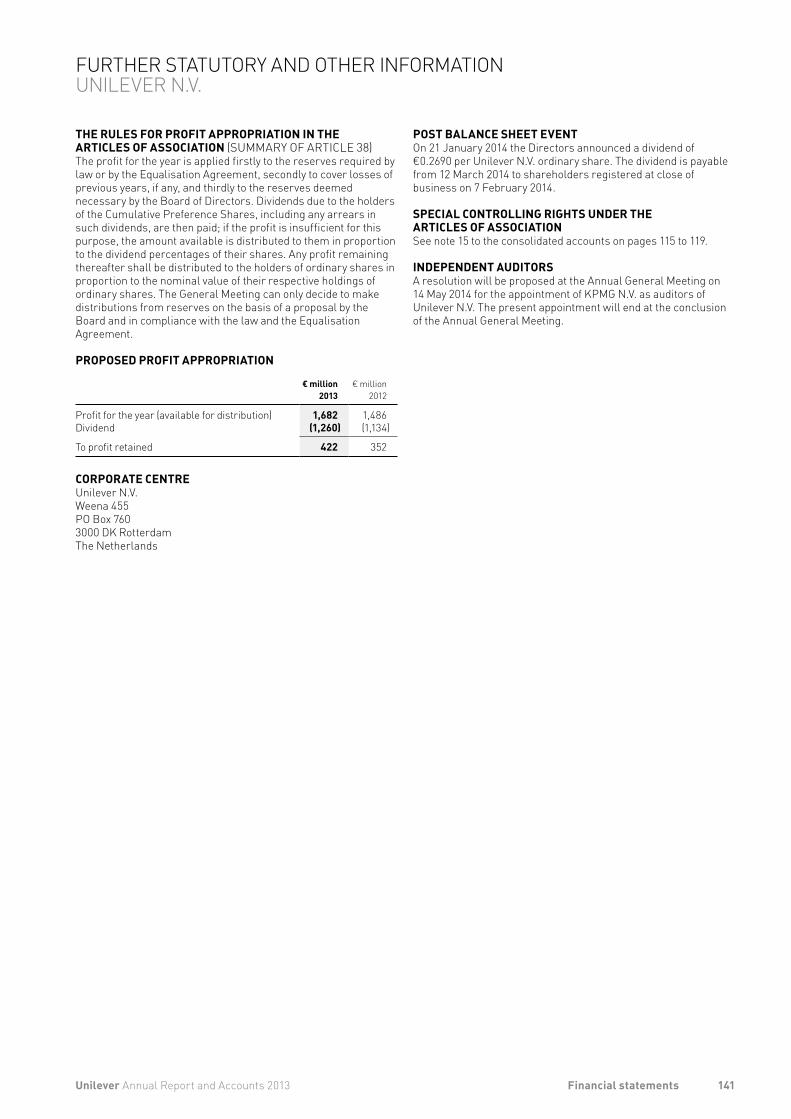
POST BALANCE SHEET EVENTOn 21 January 2014 the Directors announced a dividend of €0.2690 per Unilever N.V. ordinary share. The dividend is payable from 12 March 2014 to shareholders registered at close of business on 7 February 2014.
SPECIAL CONTROLLING RIGHTS UNDER THE ARTICLES OF ASSOCIATIONSee note 15 to the consolidated accounts on pages 115 to 119.
INDEPENDENT AUDITORSA resolution will be proposed at the Annual General Meeting on 14 May 2014 for the appointment of KPMG N.V. as auditors of Unilever N.V. The present appointment will end at the conclusion of the Annual General Meeting.
THE RULES FOR PROFIT APPROPRIATION IN THE ARTICLES OF ASSOCIATION (SUMMARY OF ARTICLE 38)The profit for the year is applied firstly to the reserves required by law or by the Equalisation Agreement, secondly to cover losses of previous years, if any, and thirdly to the reserves deemed necessary by the Board of Directors. Dividends due to the holders of the Cumulative Preference Shares, including any arrears in such dividends, are then paid; if the profit is insufficient for this purpose, the amount available is distributed to them in proportion to the dividend percentages of their shares. Any profit remaining thereafter shall be distributed to the holders of ordinary shares in proportion to the nominal value of their respective holdings of ordinary shares. The General Meeting can only decide to make distributions from reserves on the basis of a proposal by the Board and in compliance with the law and the Equalisation Agreement.
PROPOSED PROFIT APPROPRIATION
€ million2013
€ million2012
Profit for the year (available for distribution) 1,682 1,486Dividend (1,260) (1,134)
To profit retained 422 352
CORPORATE CENTREUnilever N.V.Weena 455PO Box 7603000 DK RotterdamThe Netherlands
141Unilever Annual Report and Accounts 2013 Financial statements
FURTHER STATUTORY AND OTHER INFORMATION UNILEVER N.V.
OTHER MATTERS ON WHICH WE ARE REQUIRED TO REPORT BY EXCEPTION
ADEQUACY OF ACCOUNTING RECORDS AND INFORMATION AND EXPLANATIONS RECEIVEDUnder the Companies Act 2006 we are required to report to you if, in our opinion:• we have not received all the information and explanations we
require for our audit; or• adequate accounting records have not been kept by the Parent
Company, or returns adequate for our audit have not been received from branches not visited by us; or
• the Parent Company financial statements and the part of the Directors’ Remuneration Report to be audited are not in agreement with the accounting records and returns.
We have no exceptions to report arising from this responsibility.
DIRECTORS’ REMUNERATIONUnder the Companies Act 2006 we are required to report if, in our opinion, certain disclosures of Directors’ remuneration specified by law have not been made. We have no exceptions to report arising from this responsibility.
OTHER INFORMATION IN THE ANNUAL REPORTUnder ISAs (UK and Ireland), we are required to report to you if, in our opinion, information in the Annual Report is:• materially inconsistent with the information in the audited
Parent Company financial statements; or• apparently materially incorrect based on, or materially
inconsistent with, our knowledge of the Parent Company acquired in the course of performing our audit; or
• is otherwise misleading.
We have no exceptions to report arising from this responsibility.
RESPONSIBILITIES FOR THE FINANCIAL STATEMENTS AND THE AUDIT
OUR RESPONSIBILITIES AND THOSE OF THE DIRECTORS As explained more fully in the Directors’ Responsibilities Statement set out on page 85, the Directors are responsible for the preparation of the Parent Company financial statements and for being satisfied that they give a true and fair view.
Our responsibility is to audit and express an opinion on the Parent Company financial statements in accordance with applicable law and ISAs (UK & Ireland). Those standards require us to comply with the Auditing Practices Board’s Ethical Standards for Auditors.
This report, including the opinions, has been prepared for and only for the Company’s members as a body in accordance with Chapter 3 of Part 16 of the Companies Act 2006 and for no other purpose. We do not, in giving these opinions, accept or assume responsibility for any other purpose or to any other person to whom this report is shown or into whose hands it may come save where expressly agreed by our prior consent in writing.
OTHER MATTERWe have reported separately on the Group financial statements of Unilever PLC for the year ended 31 December 2013.
John Baker(Senior Statutory Auditor)for and on behalf of PricewaterhouseCoopers LLPChartered Accountants and Statutory AuditorsLondon, United Kingdom4 March 2014
INDEPENDENT AUDITOR’S REPORT TO THE MEMBERS OF UNILEVER PLCREPORT ON THE PARENT COMPANY FINANCIAL STATEMENTS
OUR OPINION In our opinion the Parent Company financial statements:• give a true and fair view of the state of the Parent Company’s
affairs as at 31 December 2013;• have been properly prepared in accordance with United
Kingdom Generally Accepted Accounting Practice; and• have been prepared in accordance with the requirements of
the Companies Act 2006.
This opinion is to be read in the context of what we say below.
WHAT WE HAVE AUDITEDThe Parent Company financial statements, which are prepared by Unilever PLC, comprise:• the Parent Company balance sheet as at 31 December 2013; and • the notes to the Parent Company financial statements, which
include a summary of significant accounting policies and other explanatory information.
The financial reporting framework that has been applied in their preparation comprises applicable law and United Kingdom Accounting Standards (United Kingdom Generally Accepted Accounting Practice).
In applying the financial reporting framework, the Directors have made a number of subjective judgments, for example in respect of significant accounting estimates. In making such estimates, they have made assumptions and considered future events.
WHAT AN AUDIT OF FINANCIAL STATEMENTS INVOLVES We conducted our audit in accordance with International Standards on Auditing (UK and Ireland)(ISAs (UK & Ireland)). An audit involves obtaining evidence about the amounts and disclosures in the financial statements sufficient to give reasonable assurance that the financial statements are free from material misstatement, whether caused by fraud or error. This includes an assessment of:• whether the accounting policies are appropriate to the Parent
Company’s circumstances and have been consistently applied and adequately disclosed;
• the reasonableness of significant accounting estimates made by the Directors; and
• the overall presentation of the financial statements.
In addition, we read all the financial and non-financial information in the Annual Report and Accounts (the Annual Report) to identify material inconsistencies with the audited Parent Company financial statements and to identify any information that is apparently materially incorrect based on, or materially inconsistent with, the knowledge acquired by us in the course of performing the audit. If we become aware of any apparent material misstatements or inconsistencies we consider the implications for our report.
OPINIONS ON MATTERS PRESCRIBED BY THE COMPANIES ACT 2006In our opinion:• The information given in the Strategic Report and the
Directors’ Report for the financial year for which the Parent Company financial statements are prepared is consistent with the Parent Company financial statements.
• The part of the Directors’ Remuneration Report to be audited has been properly prepared in accordance with the Companies Act 2006.
142 Unilever Annual Report and Accounts 2013Financial statements
COMPANY ACCOUNTS INDEPENDENT AUDITOR’S REPORT – UNILEVER PLC
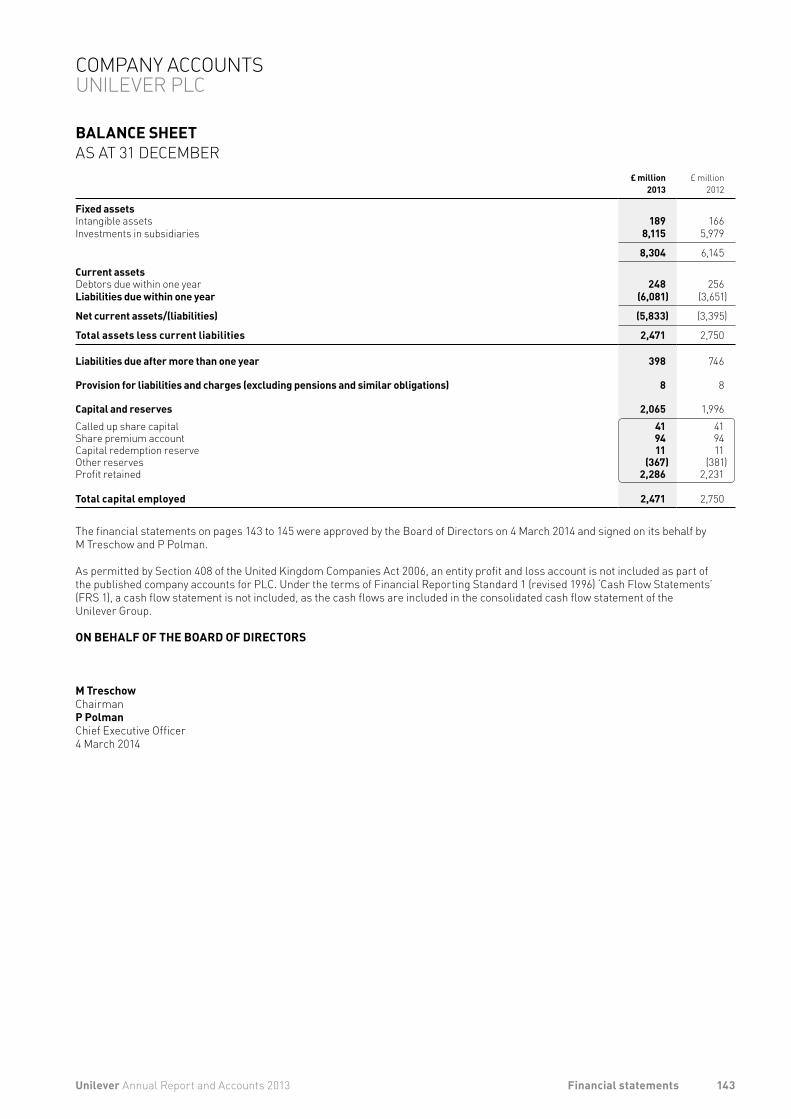
BALANCE SHEET AS AT 31 DECEMBER
£ million2013
£ million2012
Fixed assetsIntangible assets 189 166Investments in subsidiaries 8,115 5,979
8,304 6,145
Current assetsDebtors due within one year 248 256Liabilities due within one year (6,081) (3,651)
Net current assets/(liabilities) (5,833) (3,395)
Total assets less current liabilities 2,471 2,750
Liabilities due after more than one year 398 746
Provision for liabilities and charges (excluding pensions and similar obligations) 8 8
Capital and reserves 2,065 1,996Called up share capital 41 41Share premium account 94 94Capital redemption reserve 11 11Other reserves (367) (381)Profit retained 2,286 2,231
Total capital employed 2,471 2,750
The financial statements on pages 143 to 145 were approved by the Board of Directors on 4 March 2014 and signed on its behalf by M Treschow and P Polman.
As permitted by Section 408 of the United Kingdom Companies Act 2006, an entity profit and loss account is not included as part of the published company accounts for PLC. Under the terms of Financial Reporting Standard 1 (revised 1996) ‘Cash Flow Statements’ (FRS 1), a cash flow statement is not included, as the cash flows are included in the consolidated cash flow statement of the Unilever Group.
ON BEHALF OF THE BOARD OF DIRECTORS
M Treschow ChairmanP Polman Chief Executive Officer4 March 2014
143Unilever Annual Report and Accounts 2013 Financial statements
COMPANY ACCOUNTS UNILEVER PLC
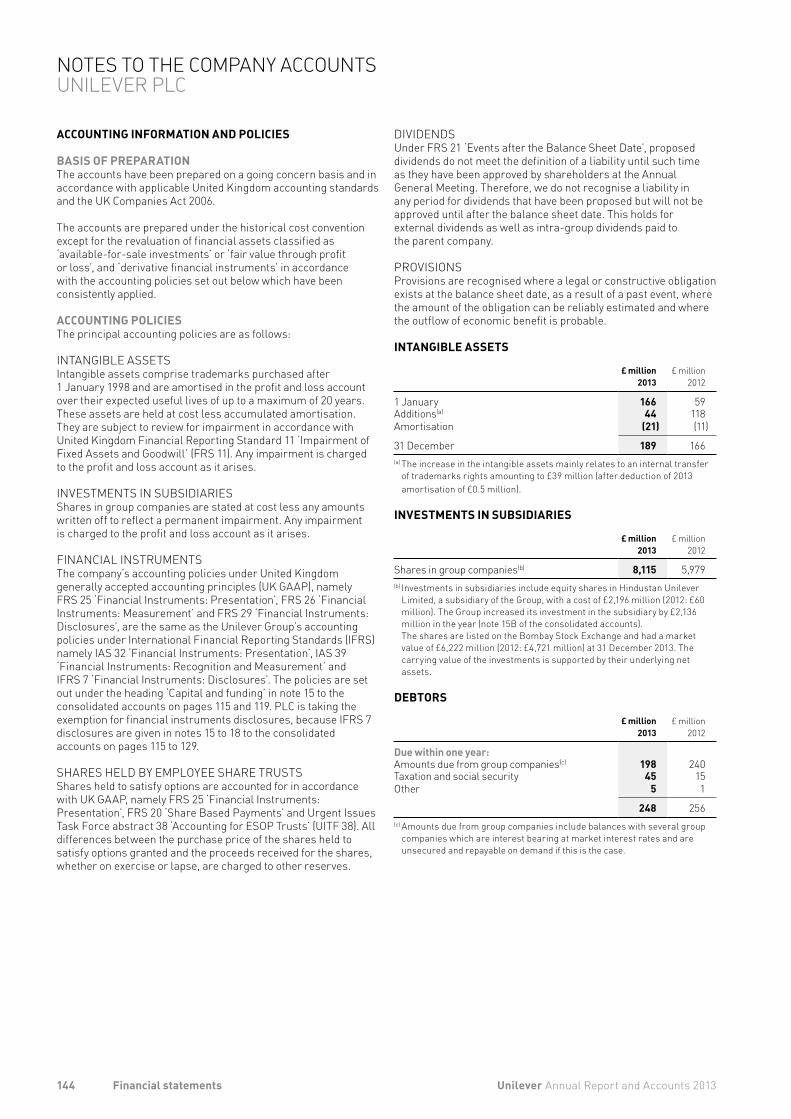
DIVIDENDSUnder FRS 21 ‘Events after the Balance Sheet Date’, proposed dividends do not meet the definition of a liability until such time as they have been approved by shareholders at the Annual General Meeting. Therefore, we do not recognise a liability in any period for dividends that have been proposed but will not be approved until after the balance sheet date. This holds for external dividends as well as intra-group dividends paid to the parent company.
PROVISIONSProvisions are recognised where a legal or constructive obligation exists at the balance sheet date, as a result of a past event, where the amount of the obligation can be reliably estimated and where the outflow of economic benefit is probable.
INTANGIBLE ASSETS
£ million2013
£ million2012
1 January 166 59Additions(a) 44 118Amortisation (21) (11)
31 December 189 166(a) The increase in the intangible assets mainly relates to an internal transfer
of trademarks rights amounting to £39 million (after deduction of 2013 amortisation of £0.5 million).
INVESTMENTS IN SUBSIDIARIES
£ million2013
£ million2012
Shares in group companies(b) 8,115 5,979(b) Investments in subsidiaries include equity shares in Hindustan Unilever
Limited, a subsidiary of the Group, with a cost of £2,196 million (2012: £60 million). The Group increased its investment in the subsidiary by £2,136 million in the year (note 15B of the consolidated accounts). The shares are listed on the Bombay Stock Exchange and had a market value of £6,222 million (2012: £4,721 million) at 31 December 2013. The carrying value of the investments is supported by their underlying net assets.
DEBTORS
£ million2013
£ million2012
Due within one year:Amounts due from group companies(c) 198 240Taxation and social security 45 15Other 5 1
248 256(c) Amounts due from group companies include balances with several group
companies which are interest bearing at market interest rates and are unsecured and repayable on demand if this is the case.
ACCOUNTING INFORMATION AND POLICIES
BASIS OF PREPARATIONThe accounts have been prepared on a going concern basis and in accordance with applicable United Kingdom accounting standards and the UK Companies Act 2006.
The accounts are prepared under the historical cost convention except for the revaluation of financial assets classified as ‘available-for-sale investments’ or ‘fair value through profit or loss’, and ‘derivative financial instruments’ in accordance with the accounting policies set out below which have been consistently applied.
ACCOUNTING POLICIESThe principal accounting policies are as follows:
INTANGIBLE ASSETSIntangible assets comprise trademarks purchased after 1 January 1998 and are amortised in the profit and loss account over their expected useful lives of up to a maximum of 20 years. These assets are held at cost less accumulated amortisation. They are subject to review for impairment in accordance with United Kingdom Financial Reporting Standard 11 ‘Impairment of Fixed Assets and Goodwill’ (FRS 11). Any impairment is charged to the profit and loss account as it arises.
INVESTMENTS IN SUBSIDIARIESShares in group companies are stated at cost less any amounts written off to reflect a permanent impairment. Any impairment is charged to the profit and loss account as it arises.
FINANCIAL INSTRUMENTS The company’s accounting policies under United Kingdom generally accepted accounting principles (UK GAAP), namely FRS 25 ‘Financial Instruments: Presentation’, FRS 26 ‘Financial Instruments: Measurement’ and FRS 29 ‘Financial Instruments: Disclosures’, are the same as the Unilever Group’s accounting policies under International Financial Reporting Standards (IFRS) namely IAS 32 ‘Financial Instruments: Presentation’, IAS 39 ‘Financial Instruments: Recognition and Measurement’ and IFRS 7 ‘Financial Instruments: Disclosures’. The policies are set out under the heading ‘Capital and funding’ in note 15 to the consolidated accounts on pages 115 and 119. PLC is taking the exemption for financial instruments disclosures, because IFRS 7 disclosures are given in notes 15 to 18 to the consolidated accounts on pages 115 to 129.
SHARES HELD BY EMPLOYEE SHARE TRUSTSShares held to satisfy options are accounted for in accordance with UK GAAP, namely FRS 25 ‘Financial Instruments: Presentation’, FRS 20 ‘Share Based Payments’ and Urgent Issues Task Force abstract 38 ‘Accounting for ESOP Trusts’ (UITF 38). All differences between the purchase price of the shares held to satisfy options granted and the proceeds received for the shares, whether on exercise or lapse, are charged to other reserves.
144 Unilever Annual Report and Accounts 2013Financial statements
NOTES TO THE COMPANY ACCOUNTS UNILEVER PLC
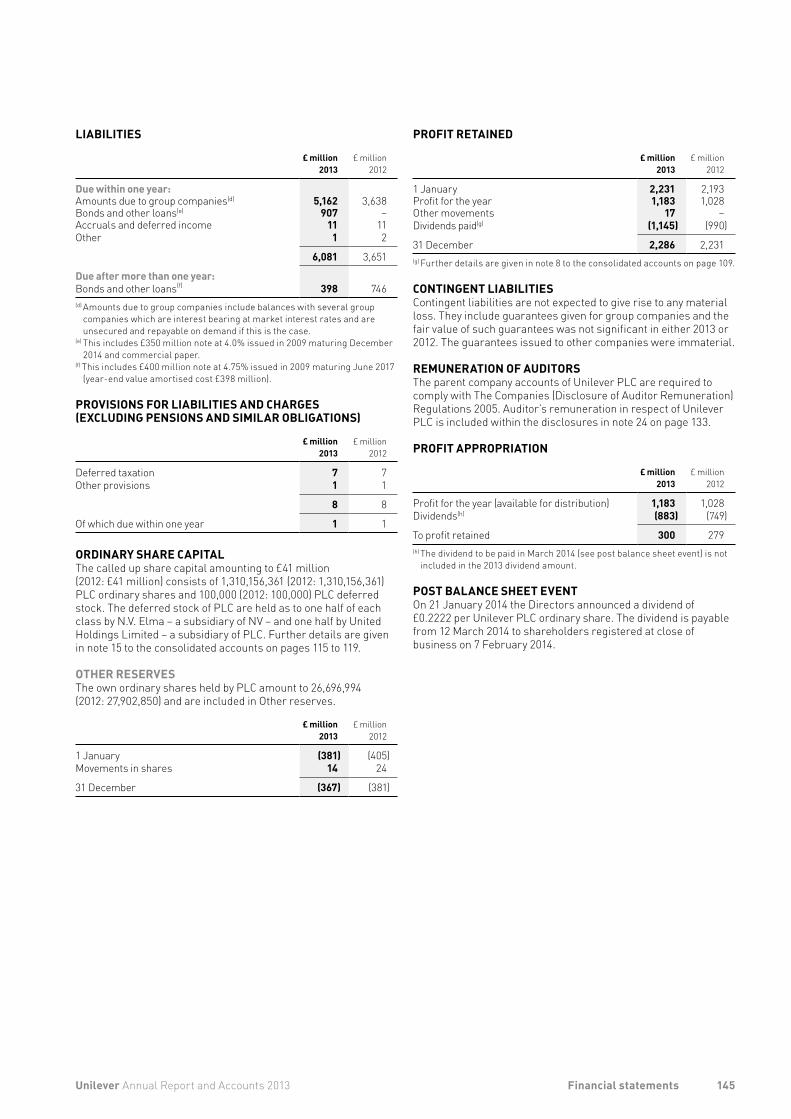
PROFIT RETAINED
£ million
2013£ million
2012
1 January 2,231 2,193Profit for the year 1,183 1,028Other movements 17 –Dividends paid(g) (1,145) (990)
31 December 2,286 2,231(g) Further details are given in note 8 to the consolidated accounts on page 109.
CONTINGENT LIABILITIESContingent liabilities are not expected to give rise to any material loss. They include guarantees given for group companies and the fair value of such guarantees was not significant in either 2013 or 2012. The guarantees issued to other companies were immaterial.
REMUNERATION OF AUDITORSThe parent company accounts of Unilever PLC are required to comply with The Companies (Disclosure of Auditor Remuneration) Regulations 2005. Auditor’s remuneration in respect of Unilever PLC is included within the disclosures in note 24 on page 133.
PROFIT APPROPRIATION
£ million
2013£ million
2012
Profit for the year (available for distribution) 1,183 1,028Dividends(h) (883) (749)
To profit retained 300 279(h) The dividend to be paid in March 2014 (see post balance sheet event) is not
included in the 2013 dividend amount.
POST BALANCE SHEET EVENTOn 21 January 2014 the Directors announced a dividend of £0.2222 per Unilever PLC ordinary share. The dividend is payable from 12 March 2014 to shareholders registered at close of business on 7 February 2014.
LIABILITIES
£ million
2013£ million
2012
Due within one year:Amounts due to group companies(d) 5,162 3,638Bonds and other loans(e) 907 –Accruals and deferred income 11 11Other 1 2
6,081 3,651
Due after more than one year:Bonds and other loans(f) 398 746(d) Amounts due to group companies include balances with several group
companies which are interest bearing at market interest rates and are unsecured and repayable on demand if this is the case.
(e) This includes £350 million note at 4.0% issued in 2009 maturing December 2014 and commercial paper.
(f) This includes £400 million note at 4.75% issued in 2009 maturing June 2017 (year-end value amortised cost £398 million).
PROVISIONS FOR LIABILITIES AND CHARGES (EXCLUDING PENSIONS AND SIMILAR OBLIGATIONS)
£ million2013
£ million2012
Deferred taxation 7 7Other provisions 1 1
8 8
Of which due within one year 1 1
ORDINARY SHARE CAPITALThe called up share capital amounting to £41 million (2012: £41 million) consists of 1,310,156,361 (2012: 1,310,156,361) PLC ordinary shares and 100,000 (2012: 100,000) PLC deferred stock. The deferred stock of PLC are held as to one half of each class by N.V. Elma – a subsidiary of NV – and one half by United Holdings Limited – a subsidiary of PLC. Further details are given in note 15 to the consolidated accounts on pages 115 to 119.
OTHER RESERVESThe own ordinary shares held by PLC amount to 26,696,994 (2012: 27,902,850) and are included in Other reserves.
£ million
2013£ million
2012
1 January (381) (405)Movements in shares 14 24
31 December (367) (381)
145Unilever Annual Report and Accounts 2013 Financial statements
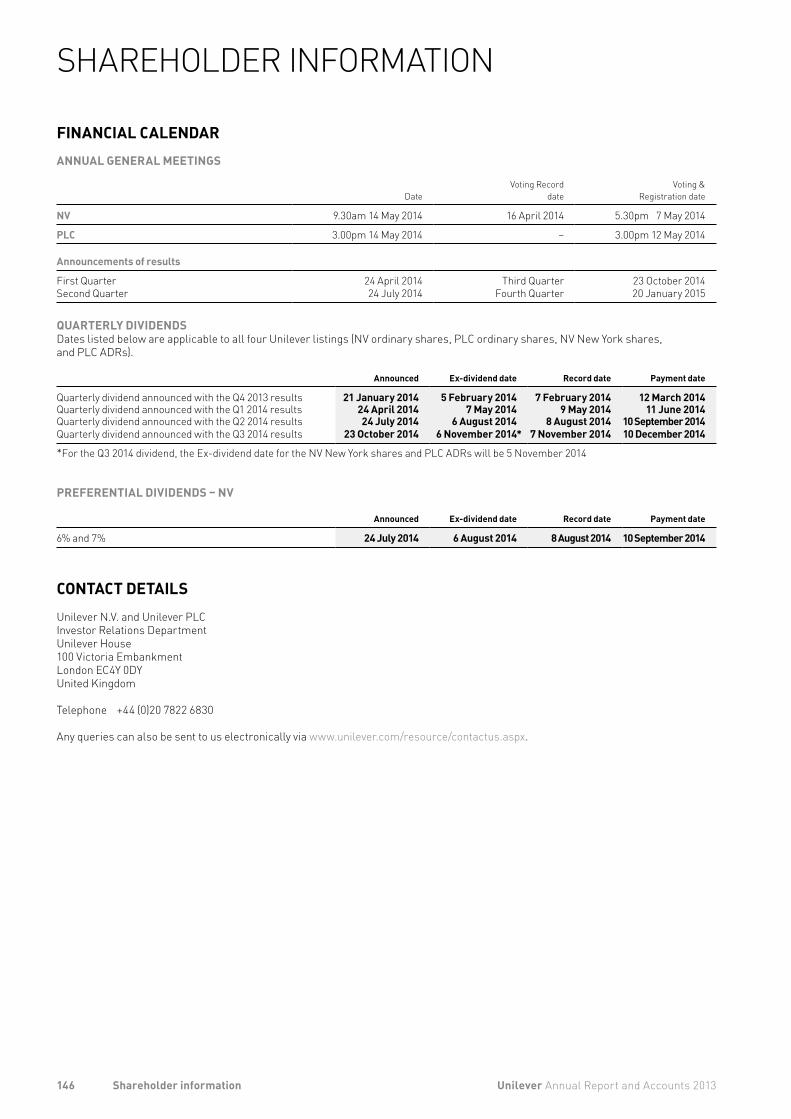
FINANCIAL CALENDARANNUAL GENERAL MEETINGS
DateVoting Record
dateVoting &
Registration date
NV 9.30am 14 May 2014 16 April 2014 5.30pm 7 May 2014
PLC 3.00pm 14 May 2014 – 3.00pm 12 May 2014
Announcements of results
First Quarter 24 April 2014 Third Quarter 23 October 2014Second Quarter 24 July 2014 Fourth Quarter 20 January 2015
QUARTERLY DIVIDENDSDates listed below are applicable to all four Unilever listings (NV ordinary shares, PLC ordinary shares, NV New York shares, and PLC ADRs).
Announced Ex-dividend date Record date Payment date
Quarterly dividend announced with the Q4 2013 results 21 January 2014 5 February 2014 7 February 2014 12 March 2014Quarterly dividend announced with the Q1 2014 results 24 April 2014 7 May 2014 9 May 2014 11 June 2014Quarterly dividend announced with the Q2 2014 results 24 July 2014 6 August 2014 8 August 2014 10 September 2014Quarterly dividend announced with the Q3 2014 results 23 October 2014 6 November 2014* 7 November 2014 10 December 2014
*For the Q3 2014 dividend, the Ex-dividend date for the NV New York shares and PLC ADRs will be 5 November 2014
PREFERENTIAL DIVIDENDS – NV
Announced Ex-dividend date Record date Payment date
6% and 7% 24 July 2014 6 August 2014 8 August 2014 10 September 2014
CONTACT DETAILSUnilever N.V. and Unilever PLCInvestor Relations DepartmentUnilever House100 Victoria EmbankmentLondon EC4Y 0DYUnited Kingdom
Telephone +44 (0)20 7822 6830
Any queries can also be sent to us electronically via www.unilever.com/resource/contactus.aspx.
146 Unilever Annual Report and Accounts 2013Shareholder information
SHAREHOLDER INFORMATION
PUBLICATIONSCopies of the following publications can be accessed directly or ordered through www.unilever.com/investorrelations or www.unilever.nl/onsbedrijf/beleggers.
UNILEVER ANNUAL REPORT AND ACCOUNTS 2013Available in English with figures in euros. It forms the basis for the Form 20-F that is filed with the United States Securities and Exchange Commission, which is also available free of charge at www.sec.gov.
QUARTERLY RESULTS ANNOUNCEMENTSAvailable in English with figures in euros.
WEBSITEShareholders are encouraged to visit our website www.unilever.com which has a wealth of information about Unilever. Any information on or linked from the website is not incorporated by reference into this Annual Report and Accounts.
There is a section designed specifically for investors at www.unilever.com/investorrelations. It includes detailed coverage of the Unilever share price, our quarterly and annual results, performance charts, financial news and investor relations speeches and presentations. It also includes conference and investor/analyst presentations.
You can also view this year’s Annual Report and Accounts, and prior years’ Annual Review and Annual Report and Accounts documents at www.unilever.com/investorrelations.
PLC shareholders can elect to receive their shareholder communications such as the Annual Report and Accounts and other shareholder documents electronically by registering at www.unilever.com/shareholderservices.
Shareholders are also able to view documents on our website.
SHARE REGISTRATIONTHE NETHERLANDSSGG Netherlands N.V.Claude Debussylaan 241082 MD Amsterdam
Telephone +31 (0)20 522 25 55 Telefax +31 (0)20 522 25 00Website www.sgggroup.comEmail [email protected]
UKComputershare Investor Services PLCThe PavilionsBridgwater RoadBristol BS99 6ZZ
Telephone +44 (0)870 600 3977Telefax +44 (0)870 703 6119Website www.investorcentre.co.uk/contactusEmail [email protected]
USCitibank Shareholder ServicesPO Box 43077Providence, RI 02940-3077
Toll free phone (inside US) 888 502 6356Toll phone (outside US) +1 781 575 4555Website www.citi.com/drEmail [email protected]
147Unilever Annual Report and Accounts 2013 Shareholder information
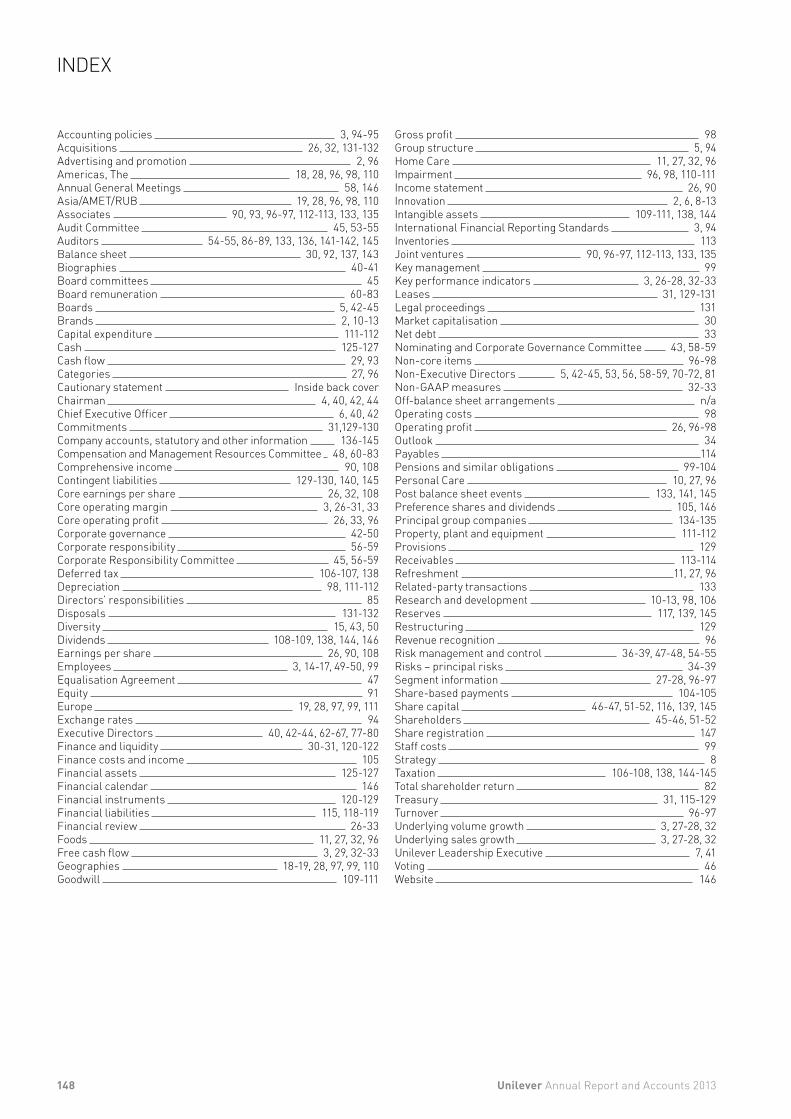
Accounting policies 3, 94-95Acquisitions 26, 32, 131-132Advertising and promotion 2, 96Americas, The 18, 28, 96, 98, 110Annual General Meetings 58, 146Asia/AMET/RUB 19, 28, 96, 98, 110Associates 90, 93, 96-97, 112-113, 133, 135Audit Committee 45, 53-55Auditors 54-55, 86-89, 133, 136, 141-142, 145 Balance sheet 30, 92, 137, 143Biographies 40-41Board committees 45Board remuneration 60-83Boards 5, 42-45Brands 2, 10-13Capital expenditure 111-112Cash 125-127Cash flow 29, 93 Categories 27, 96Cautionary statement Inside back coverChairman 4, 40, 42, 44Chief Executive Officer 6, 40, 42Commitments 31,129-130Company accounts, statutory and other information 136-145 Compensation and Management Resources Committee 48, 60-83Comprehensive income 90, 108Contingent liabilities 129-130, 140, 145Core earnings per share 26, 32, 108Core operating margin 3, 26-31, 33Core operating profit 26, 33, 96Corporate governance 42-50Corporate responsibility 56-59Corporate Responsibility Committee 45, 56-59Deferred tax 106-107, 138 Depreciation 98, 111-112Directors’ responsibilities 85Disposals 131-132Diversity 15, 43, 50Dividends 108-109, 138, 144, 146Earnings per share 26, 90, 108Employees 3, 14-17, 49-50, 99Equalisation Agreement 47Equity 91Europe 19, 28, 97, 99, 111Exchange rates 94Executive Directors 40, 42-44, 62-67, 77-80Finance and liquidity 30-31, 120-122 Finance costs and income 105Financial assets 125-127Financial calendar 146Financial instruments 120-129Financial liabilities 115, 118-119Financial review 26-33Foods 11, 27, 32, 96Free cash flow 3, 29, 32-33Geographies 18-19, 28, 97, 99, 110Goodwill 109-111
Gross profit 98Group structure 5, 94Home Care 11, 27, 32, 96Impairment 96, 98, 110-111Income statement 26, 90Innovation 2, 6, 8-13Intangible assets 109-111, 138, 144International Financial Reporting Standards 3, 94Inventories 113Joint ventures 90, 96-97, 112-113, 133, 135Key management 99Key performance indicators 3, 26-28, 32-33Leases 31, 129-131Legal proceedings 131Market capitalisation 30Net debt 33Nominating and Corporate Governance Committee 43, 58-59Non-core items 96-98Non-Executive Directors 5, 42-45, 53, 56, 58-59, 70-72, 81Non-GAAP measures 32-33Off-balance sheet arrangements n/aOperating costs 98Operating profit 26, 96-98Outlook 34Payables 114Pensions and similar obligations 99-104Personal Care 10, 27, 96Post balance sheet events 133, 141, 145Preference shares and dividends 105, 146Principal group companies 134-135Property, plant and equipment 111-112Provisions 129Receivables 113-114Refreshment 11, 27, 96Related-party transactions 133Research and development 10-13, 98, 106Reserves 117, 139, 145Restructuring 129Revenue recognition 96Risk management and control 36-39, 47-48, 54-55Risks – principal risks 34-39Segment information 27-28, 96-97Share-based payments 104-105Share capital 46-47, 51-52, 116, 139, 145Shareholders 45-46, 51-52Share registration 147Staff costs 99Strategy 8Taxation 106-108, 138, 144-145Total shareholder return 82Treasury 31, 115-129Turnover 96-97Underlying volume growth 3, 27-28, 32Underlying sales growth 3, 27-28, 32Unilever Leadership Executive 7, 41Voting 46Website 146
148 Unilever Annual Report and Accounts 2013
INDEX
OUR PURPOSE TO MAKE SUSTAINABLE LIVING COMMONPLACEWe work to create a better future every day, with brands and services that help people feel good, look good and get more out of life.
Our first priority is to our consumers – then customers, employees, suppliers and communities. When we fulfil our responsibilities to them, we believe that our shareholders will be rewarded.
UNILEVER SUSTAINABLE LIVING PLAN (USLP)Our Annual Report and Accounts 2013 will be complemented by the online Unilever Sustainable Living Report for 2013 to be published in April 2014. This will detail performance against our USLP targets for the period 1 January to 31 December 2013 except where indicated otherwise. The online report will also cover the scope of our assurance programme and a wealth of information on our approach to running a responsible business.
See www.unilever.com/sustainable-living
OTHER INFORMATIONThe brand names shown in this report are trademarks owned by or licensed to companies within the Unilever Group. This report contains certain statements that are neither reported financial results nor other historical information. These statements are forward-looking statements, including within the meaning of the United States Private Securities Litigation Reform Act of 1995. Actual results may differ materially from those disclosed in our forward-looking statements. For a description of factors that could affect future results, reference should be made to the full ‘Cautionary statement’ on the inside back cover and to the section entitled ‘Risks’ on pages 34 to 39.
For information about our non-GAAP measures, see pages 32 and 33. In this report we make reference to Unilever’s and other third-party websites, and to social media sites. Information on websites and/or social media sites is not incorporated herein and does not form part of this document. This report comprises regulated information within the meaning of sections 1:1 and 5:25c of the Act on Financial Supervision (“Wet op het financieel toezicht (Wft)”) in the Netherlands.
CAUTIONARY STATEMENTThis document may contain forward-looking statements, including ‘forward-looking statements’ within the meaning of the United States Private Securities Litigation Reform Act of 1995. Words such as ‘will’, ‘aim’, ‘expects’, ‘anticipates’, ‘intends’, ‘looks’, ‘believes’, ‘vision’, or the negative of these terms and other similar expressions of future performance or results, and their negatives, are intended to identify such forward-looking statements. These forward-looking statements are based upon current expectations and assumptions regarding anticipated developments and other factors affecting the Group. They are not historical facts, nor are they guarantees of future performance.
Because these forward-looking statements involve risks and uncertainties, there are important factors that could cause actual results to differ materially from those expressed or implied by these forward-looking statements. Among other risks and uncertainties, the material or principal factors which cause actual results to differ materially are: Unilever’s global brands not meeting consumer preferences; Unilever’s ability to innovate and remain competitive; Unilever’s investment choices in its portfolio management; inability to find sustainable solutions to support long-term growth; customer relationships; the recruitment and retention of talented employees; disruptions in our supply chain; the cost of raw materials and commodities; the production of safe and high quality products; secure and reliable IT infrastructure; successful execution of acquisitions, divestitures and business transformation projects; economic and political risks and natural disasters; financial risks; failure to meet high and ethical standards; and managing regulatory, tax and legal matters. Further details of potential risks and uncertainties affecting the Group are described in the Group’s filings with the London Stock Exchange, Euronext Amsterdam and the US Securities and Exchange Commission, including in the Group’s Annual Report on Form 20-F for the year ended 31 December 2013 and the Annual Report and Accounts 2013. These forward-looking statements speak only as of the date of this document. Except as required by any applicable law or regulation, the Group expressly disclaims any obligation or undertaking to release publicly any updates or revisions to any forward-looking statements contained herein to reflect any change in the Group’s expectations with regard thereto or any change in events, conditions or circumstances on which any such statement is based.
This document is not prepared in accordance with US GAAP and should not therefore be relied upon by readers as such. The Group’s Annual Report on Form 20-F for 2013 is separately filed with the US Securities and Exchange Commission and is available on our corporate website www.unilever.com. Any information on or linked from our or third-party websites is not incorporated by reference into this document or the Annual Report on Form 20-F. In addition, a printed copy of the Annual Report on Form 20-F is available, free of charge, upon request to Unilever, Investor Relations Department, 100 Victoria Embankment, London EC4Y 0DY, United Kingdom.
Designed and produced by Unilever Communications in conjunction with Addison Group at www.addison-group.net.
Photography by Samuel Olusegun Ajayi, Oliver Edwards, Igor Emmerich, Philip Gatward, Joseph Marcantonio, Chris Moyse, Gandhi Prabowo, Elise Romany, Rian Ardi Wakito, Jessie Watford, Yan Zhen, Na Lata (Brazil), The Edge Picture Company, The Pack Shot Company and from the Unilever image library and content hub.
Printed at Pureprint Group, ISO 14001. FSC® certified and CarbonNeutral®.
This document forms part of the Unilever Annual Report and Accounts 2013 suite of documents and is printed on Amadeus 100% Recycled Silk and Offset. These papers have been exclusively supplied by Denmaur Independent Papers which has offset the carbon produced by the production and delivery of them to the printer.
These papers are 100% recycled and manufactured using de-inked post-consumer waste. All of the pulp is bleached using an elemental chlorine free process (ECF). Printed in the UK by Pureprint using its alcofree® and pureprint® environmental printing technology. Vegetable inks were used throughout. Pureprint is a CarbonNeutral® company. Both the manufacturing mill and the printer are registered to the Environmental Management System ISO 14001 and are Forest Stewardship Council® (FSC) chain-of-custody certified. If you have finished with this document and no longer wish to retain it, please pass it on to other interested readers or dispose of it in your recycled paper waste. Thank you.

UNILEVERAN
NUAL REPORT AN
D ACCOUNTS 2013
Making sustainable living com
monplace
ANNUAL REPORT AND ACCOUNTS 2013
MAKING SUSTAINABLE LIVING COMMONPLACE
PROJECT SUNLIGHT: HELPING TO CREATE A BRIGHTER FUTURE
We believe there has never been a better time to create a better future for our children. A world where no child goes to bed hungry, where every home has clean drinking water and where preventable diseases become a thing of the past. Project Sunlight brings together the work of our brands to help as many people as possible take small sustainable steps that add up to building a world where everyone lives well and within the natural limits of the planet.
Get involved at:www.projectsunlight.com
UNILEVER N.V.Weena 455, PO Box 760 3000 DK Rotterdam The Netherlands T +31 (0)10 217 4000 F +31 (0)10 217 4798
Commercial Register Rotterdam Number: 24051830
UNILEVER PLC100 Victoria Embankment London EC4Y 0DY United Kingdom T +44 (0)20 7822 5252 F +44 (0)20 7822 5951
UNILEVER PLC REGISTERED OFFICEUnilever PLC Port Sunlight Wirral Merseyside CH62 4ZD United Kingdom
Registered in England and Wales Company Number: 41424
For further information on our social, economic and environmental performance, please visit our website:
WWW.UNILEVER.COM