unified improvement planning: school level sponsored by the colorado department of education
TRANSCRIPT

Unified Improvement Planning: School Level
Sponsored by the Colorado Department of Education
Introductions
Center for Transforming Learning and Teaching
Julie Oxenford O’Brian Mary Beth Romke
www.ctlt.org
Norms
The standards of behavior by which we
agree to operate while we are
engaged in learning together.
Introductions Introduce yourselves to the folks at your
table:
Name/Role
One question you have about Unified Improvement Planning
Select top two questions from your table to share.
Today’s Purpose
Ensure you are prepared to facilitate
your school –level planning team in data analysis as a critical
component of completing the school
level unified improvement plan.
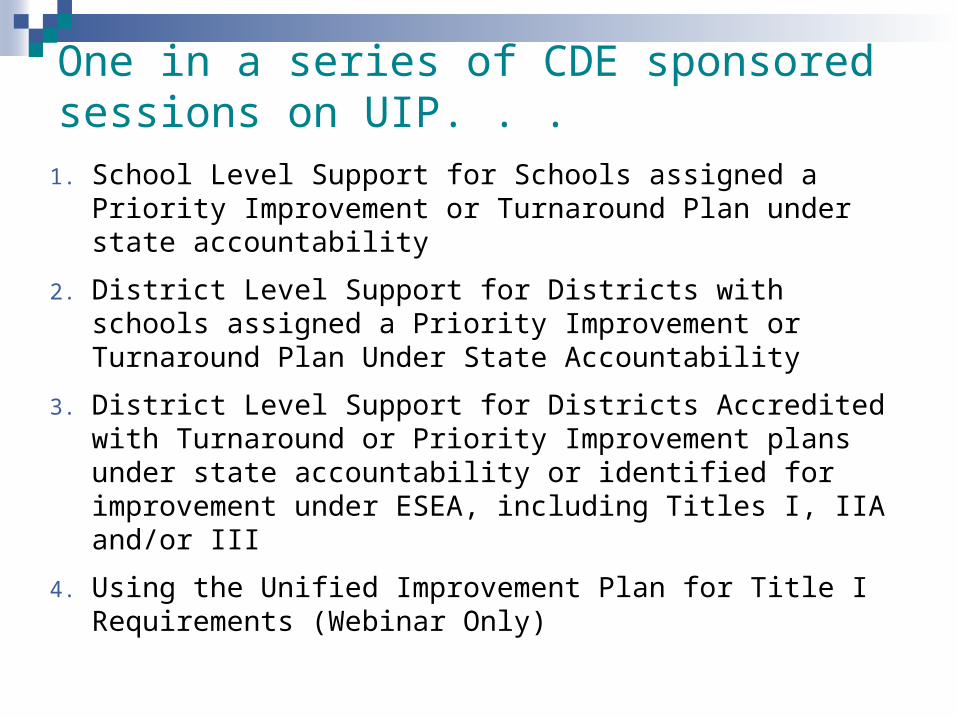
One in a series of CDE sponsored sessions on UIP. . .
1. School Level Support for Schools assigned a Priority Improvement or Turnaround Plan under state accountability
2. District Level Support for Districts with schools assigned a Priority Improvement or Turnaround Plan Under State Accountability
3. District Level Support for Districts Accredited with Turnaround or Priority Improvement plans under state accountability or identified for improvement under ESEA, including Titles I, IIA and/or III
4. Using the Unified Improvement Plan for Title I Requirements (Webinar Only)
Today is. . .
First day of two sessions focused on school-level planning.
Focused on Section III: Data Analysis.
Day two will focus on Section IV: Action Planning.

Materials
How you participate. . .
Participating from three perspectives:
Learner
Facilitator
Planner
Supporting School Planning Note Catcher
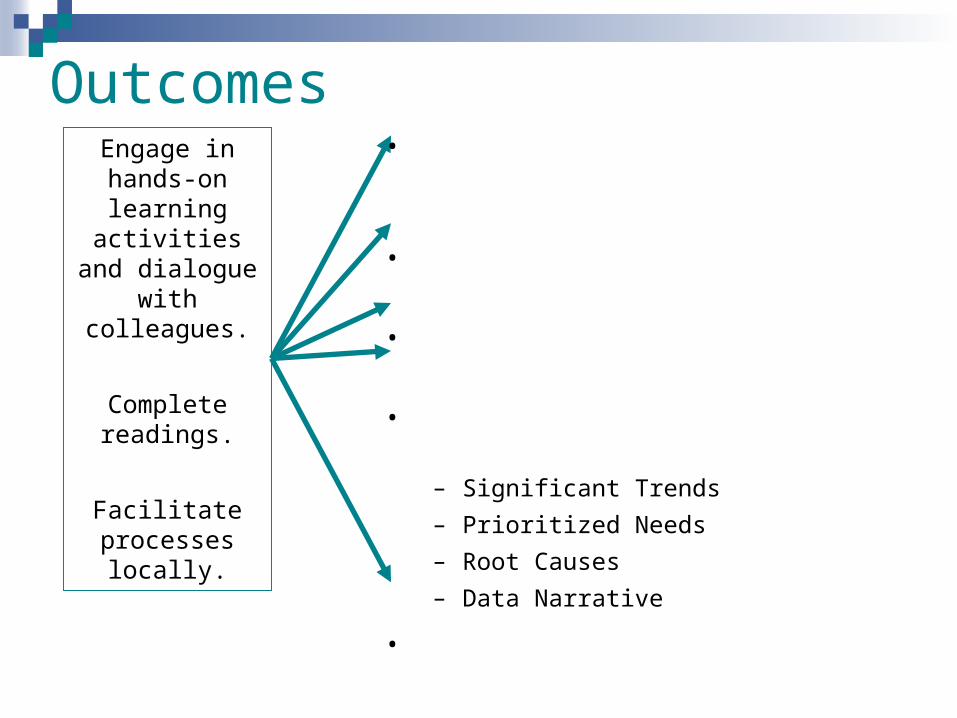
OutcomesEngage in hands-on learning
activities and dialogue with colleagues.
Complete readings.
Facilitate processes
locally.
• Understanding the key elements and processes embedded in the UIP Template
• Recognize unique requirements of TA and PI schools
• Gather and organize data for planning.
• Develop major components of Section III of the UIP:– Significant Trends
– Prioritized Needs
– Root Causes
– Data Narrative
• Apply the UIP Quality Criteria (school level).
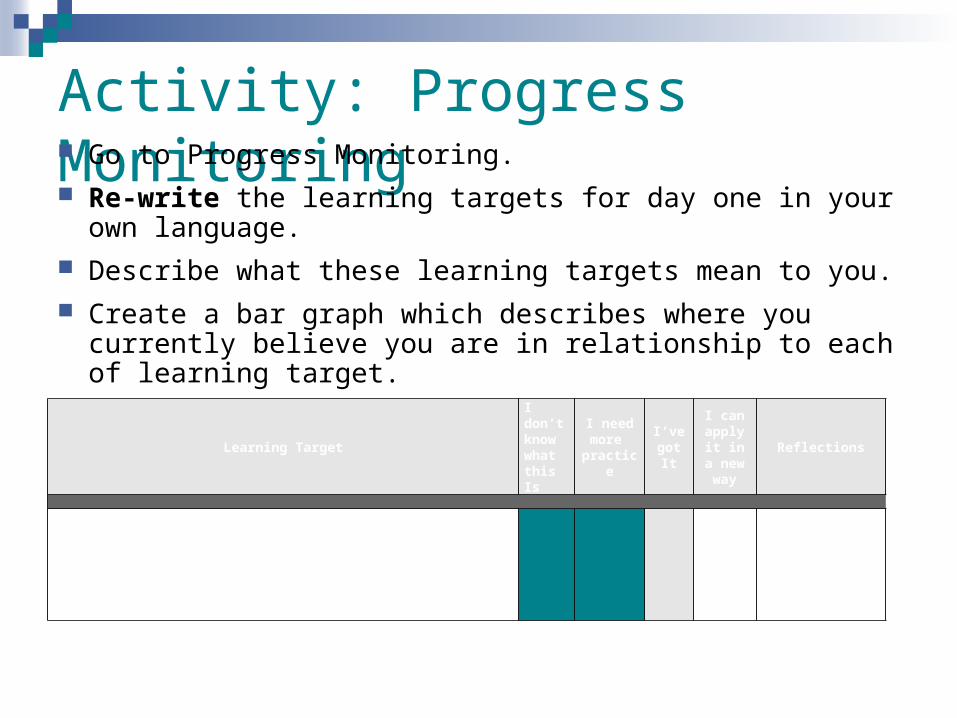
Activity: Progress Monitoring Go to Progress Monitoring. Re-write the learning targets for day one in your own
language. Describe what these learning targets mean to you. Create a bar graph which describes where you currently
believe you are in relationship to each of learning target.
Learning Target
I don’t know what this Is
I need more
practice
I’ve got It
I can apply it in a new
way
Reflections
Understand the processes Embedded in the UIP..This means:Describe what we need to do to engage in improvement planning
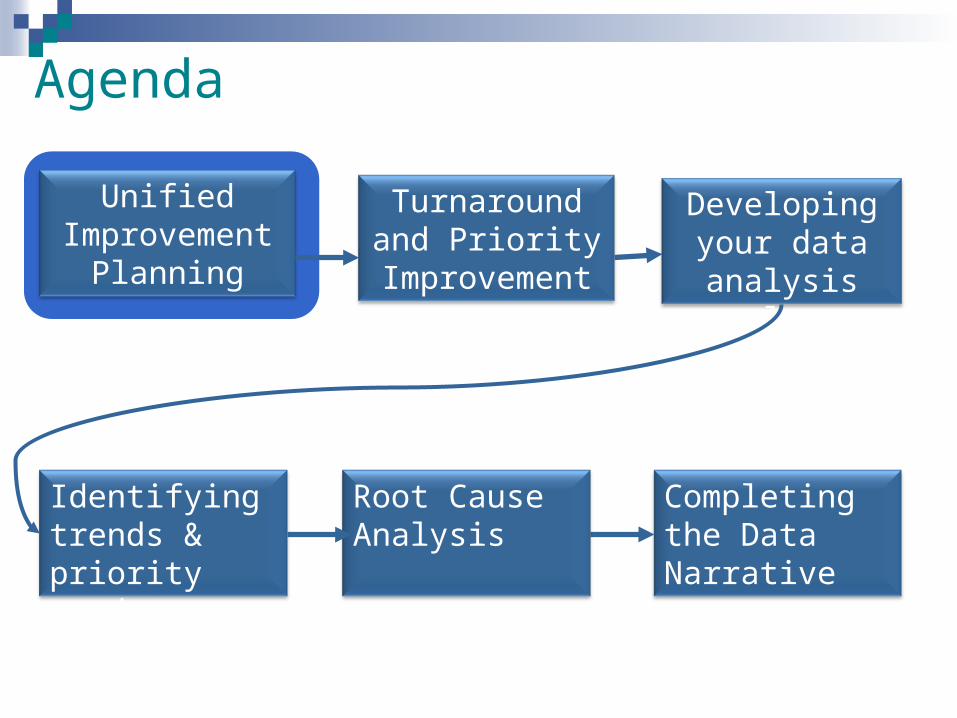
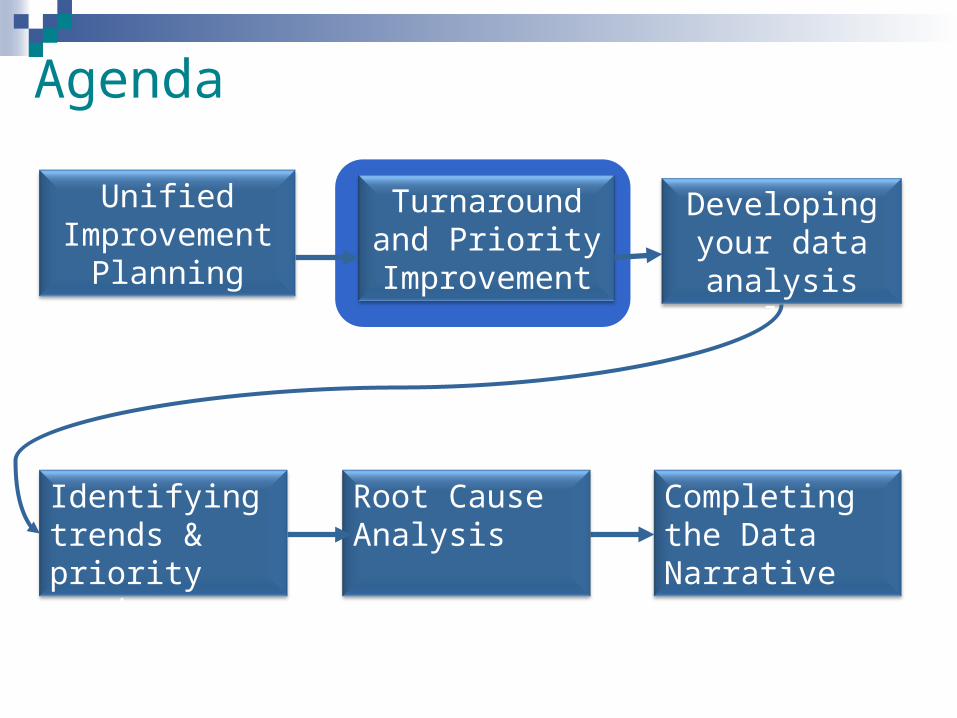
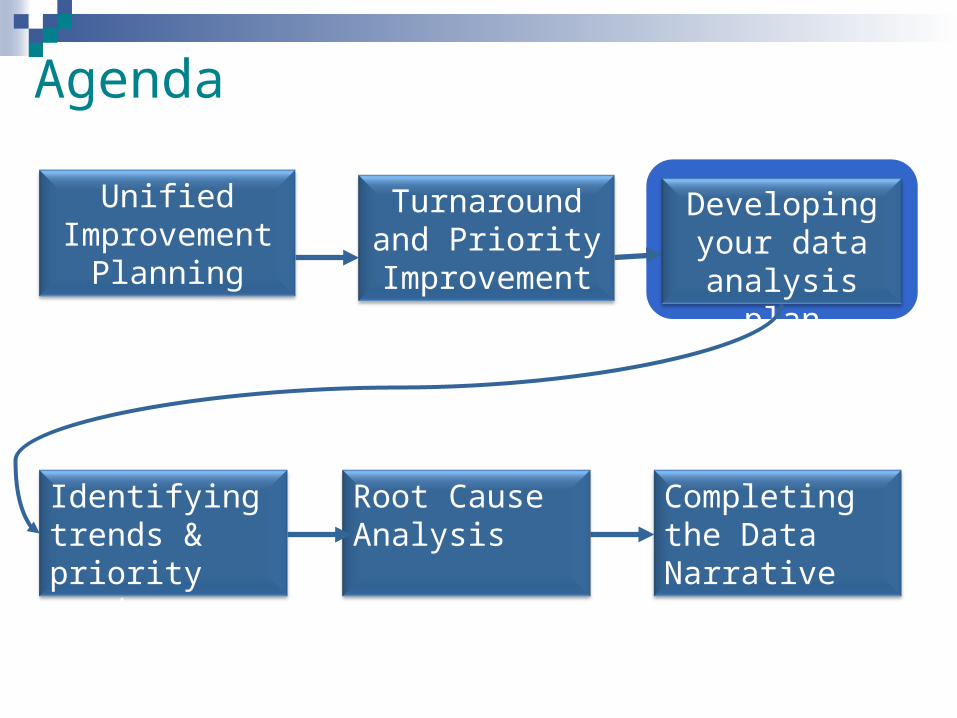
Agenda
Unified Improvement
Planning
Turnaround and Priority
Improvement
Identifying trends & priority needs
Developing your data
analysis plan
Completing the Data Narrative
Root Cause Analysis
Purposes of Unified Improvement Planning
Support school and district use of performance data to improve student learning.
Transition from planning as “an event” to planning as “continuous improvement”.
Provide a mechanism for external stakeholders to learn about schools/district improvement efforts.
Reduce the number of required improvement “plans”.
Align improvement efforts within schools and districts.
Meet state and federal accountability requirements.
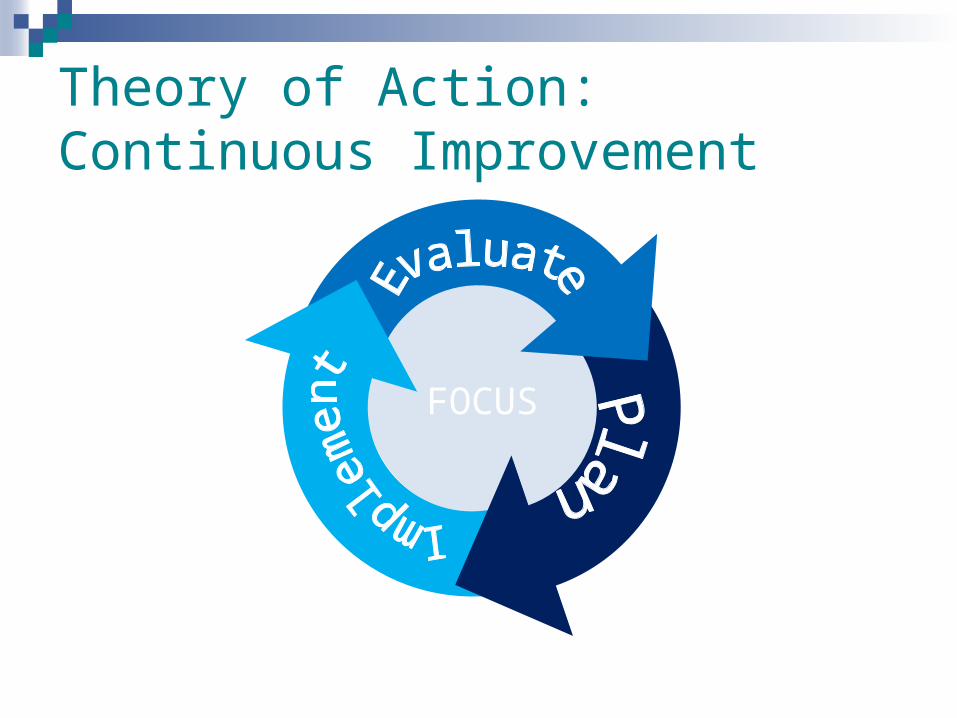
Theory of Action: Continuous Improvement
FOCUS
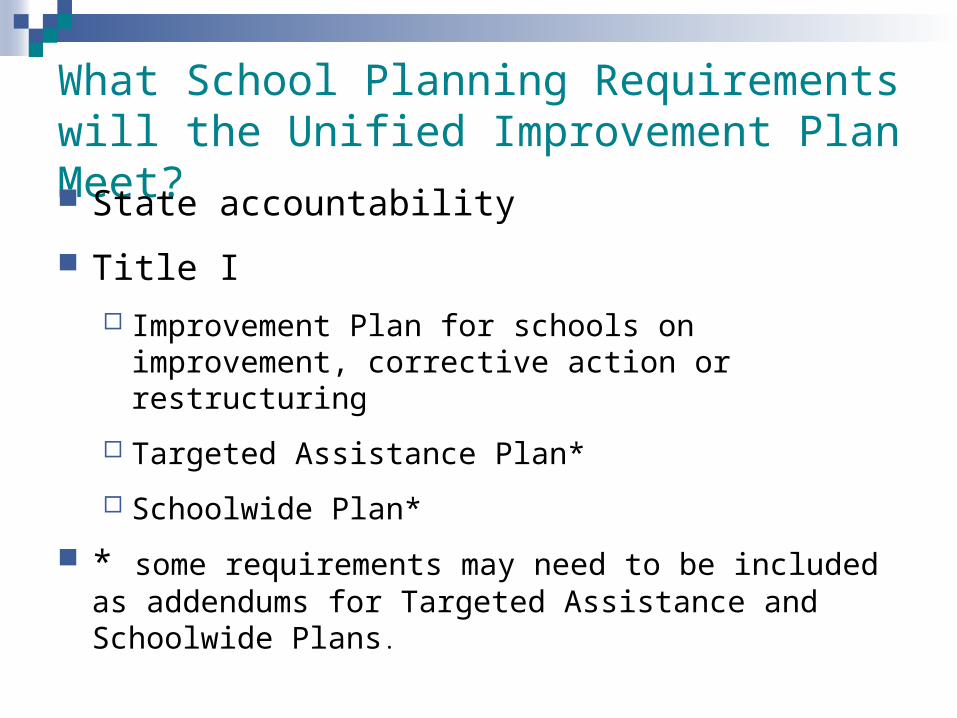
What School Planning Requirements will the Unified Improvement Plan Meet?
State accountability
Title I
Improvement Plan for schools on improvement, corrective action or restructuring
Targeted Assistance Plan*
Schoolwide Plan*
* some requirements may need to be included as addendums for Targeted Assistance and Schoolwide Plans.
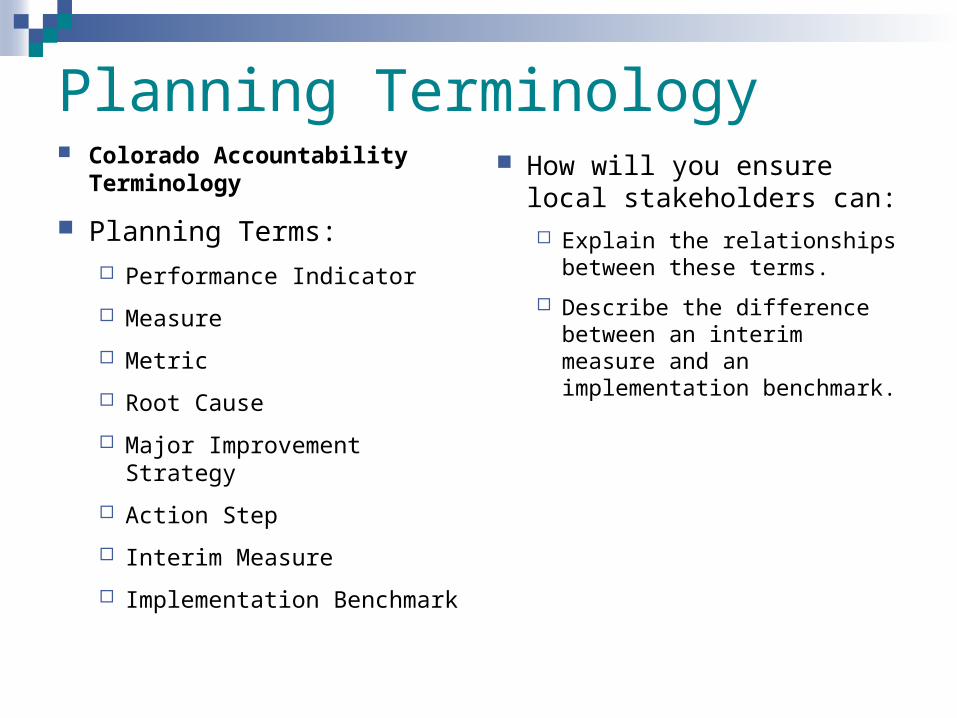
Planning Terminology Colorado Accountability
Terminology
Planning Terms: Performance Indicator
Measure
Metric
Root Cause
Major Improvement Strategy
Action Step
Interim Measure
Implementation Benchmark
How will you ensure local stakeholders can: Explain the relationships
between these terms.
Describe the difference between an interim measure and an implementation benchmark.
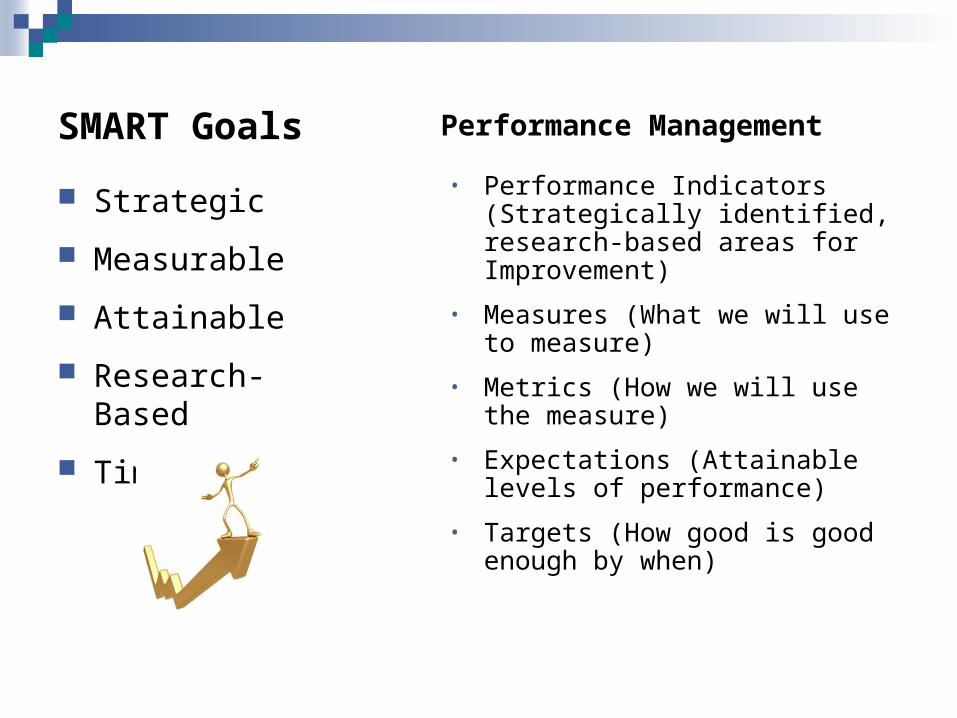
SMART Goals
Strategic
Measurable
Attainable
Research-Based
Time-Bound
Performance Management
• Performance Indicators (Strategically identified, research-based areas for Improvement)
• Measures (What we will use to measure)
• Metrics (How we will use the measure)
• Expectations (Attainable levels of performance)
• Targets (How good is good enough by when)
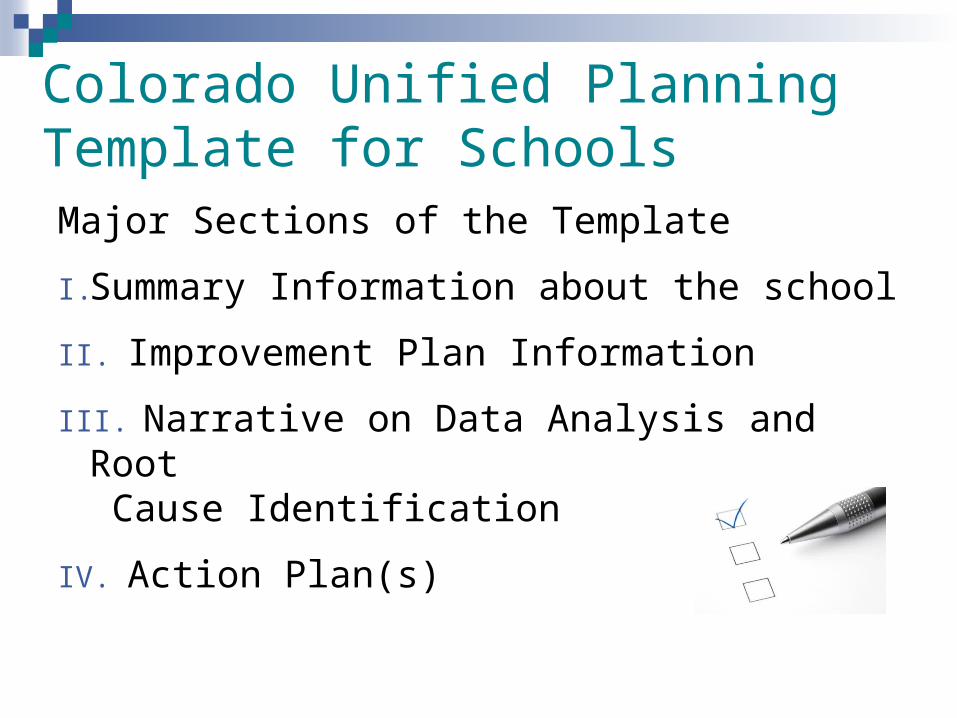
Colorado Unified Planning Template for SchoolsMajor Sections of the Template
I. Summary Information about the school
II. Improvement Plan Information
III. Narrative on Data Analysis and Root Cause Identification
IV. Action Plan(s)
Basic Steps in Improvement Planning
IV. Action Planning
III. Narrative on Data Analysis and Root Cause Identification
I. Summary Information about the school
II. Additional Information
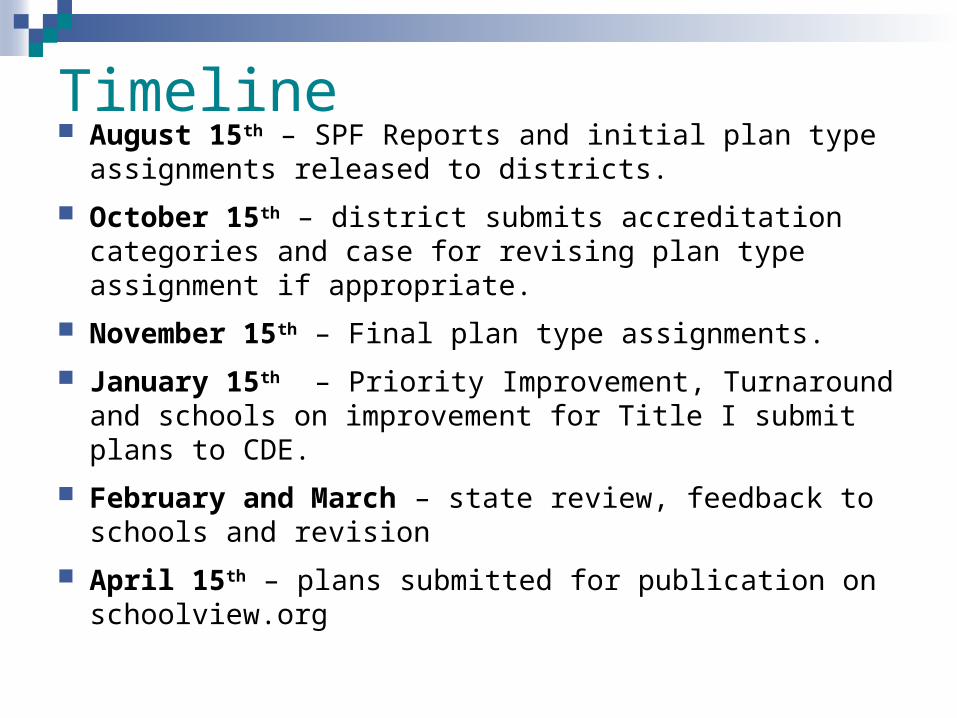
Timeline August 15th – SPF Reports and initial plan type
assignments released to districts.
October 15th – district submits accreditation categories and case for revising plan type assignment if appropriate.
November 15th – Final plan type assignments.
January 15th – Priority Improvement, Turnaround and schools on improvement for Title I submit plans to CDE.
February and March – state review, feedback to schools and revision
April 15th – plans submitted for publication on schoolview.org
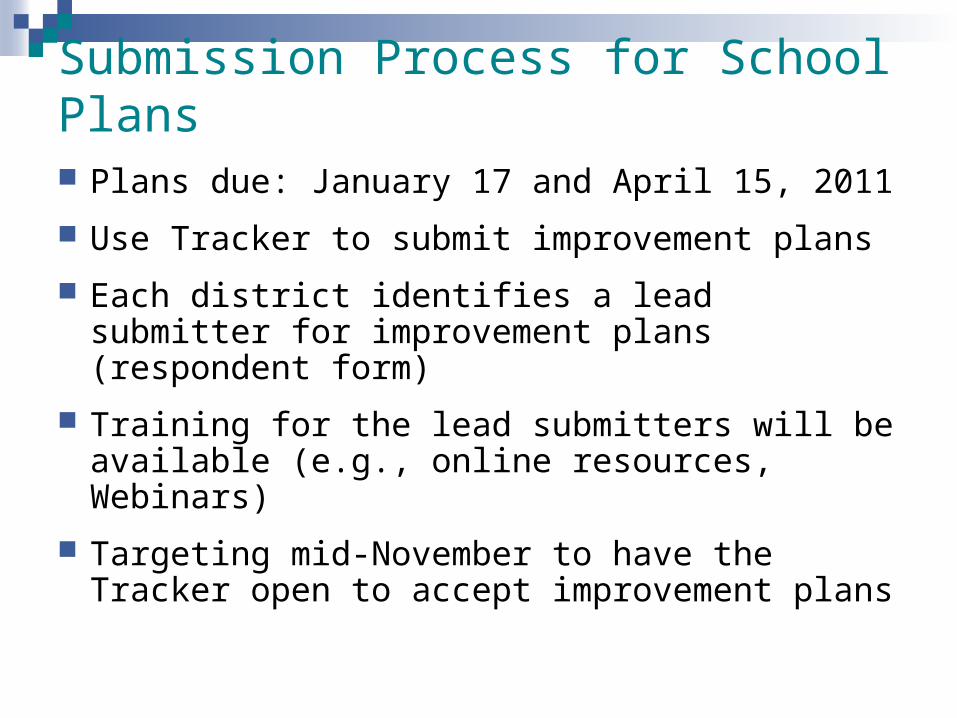
Submission Process for School Plans
Plans due: January 17 and April 15, 2011
Use Tracker to submit improvement plans
Each district identifies a lead submitter for improvement plans (respondent form)
Training for the lead submitters will be available (e.g., online resources, Webinars)
Targeting mid-November to have the Tracker open to accept improvement plans
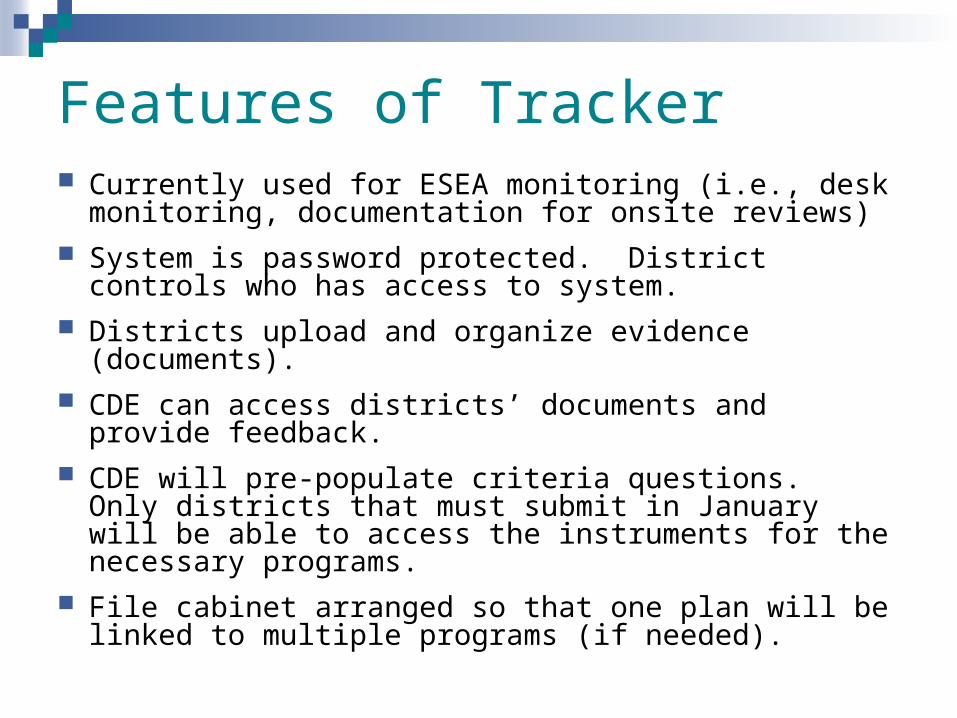
Features of Tracker Currently used for ESEA monitoring (i.e., desk
monitoring, documentation for onsite reviews) System is password protected. District controls who
has access to system. Districts upload and organize evidence (documents). CDE can access districts’ documents and provide
feedback. CDE will pre-populate criteria questions. Only districts
that must submit in January will be able to access the instruments for the necessary programs.
File cabinet arranged so that one plan will be linked to multiple programs (if needed).
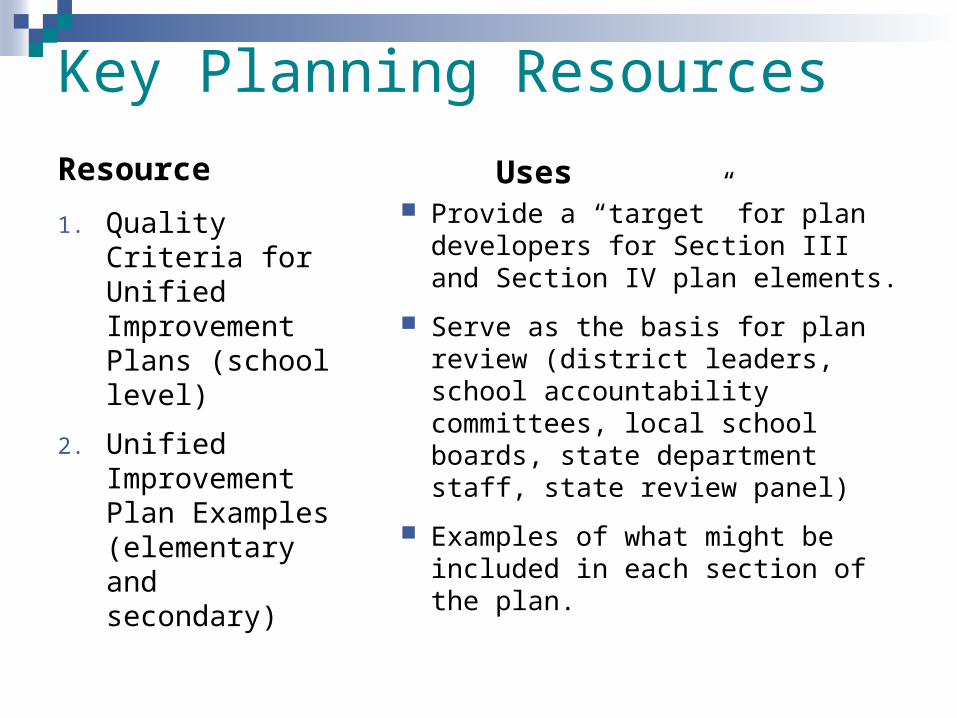
Key Planning Resources
Resource
1. Quality Criteria for Unified Improvement Plans (school level)
2. Unified Improvement Plan Examples (elementary and secondary)
Uses Provide a “target” for plan
developers for Section III and Section IV plan elements.
Serve as the basis for plan review (district leaders, school accountability committees, local school boards, state department staff, state review panel)
Examples of what might be included in each section of the plan.
Agenda
Unified Improvement
Planning
Turnaround and Priority
Improvement
Identifying trends & priority needs
Developing your data
analysis plan
Completing the Data Narrative
Root Cause Analysis
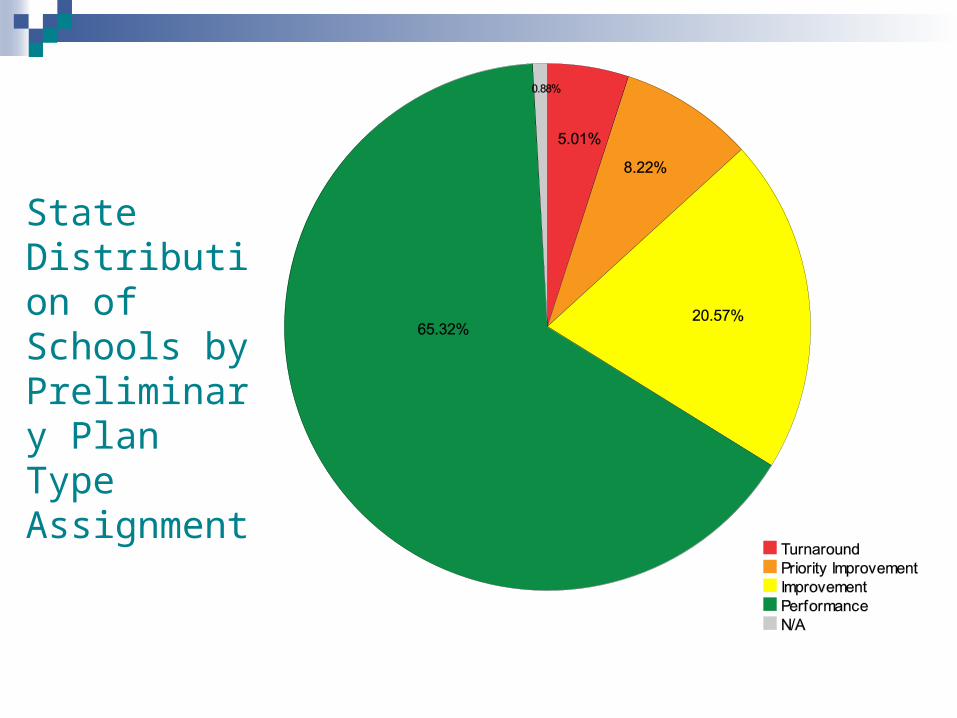
State Distribution of Schools by Preliminary Plan Type Assignment
Page 27
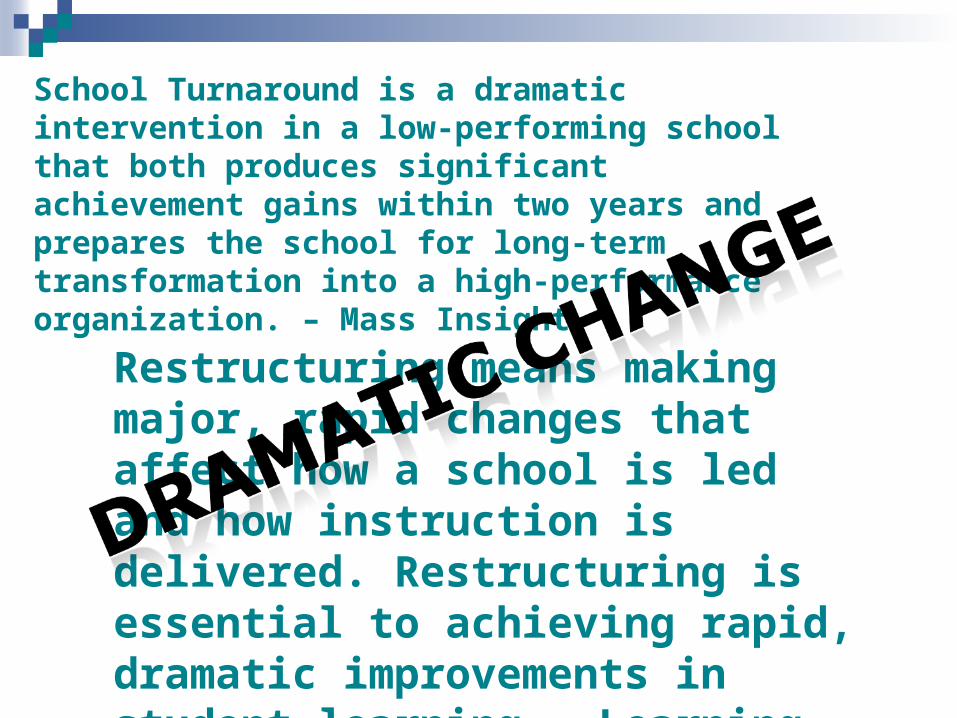
School Turnaround is a dramatic intervention in a low-performing school that both produces significant achievement gains within two years and prepares the school for long-term transformation into a high-performance organization. – Mass Insight
Restructuring means making major, rapid changes that affect how a school is led and how instruction is delivered. Restructuring is essential to achieving rapid, dramatic improvements in student learning – Learning Point Associates
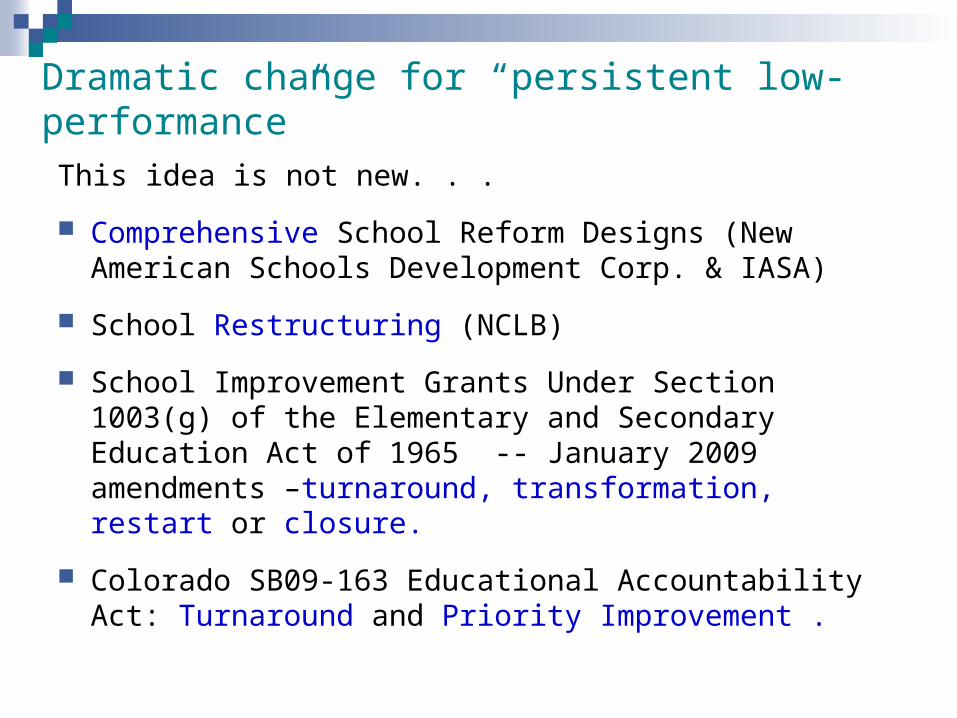
Dramatic change for “persistent low-performance”
This idea is not new. . .
Comprehensive School Reform Designs (New American Schools Development Corp. & IASA)
School Restructuring (NCLB)
School Improvement Grants Under Section 1003(g) of the Elementary and Secondary Education Act of 1965 -- January 2009 amendments –turnaround, transformation, restart or closure.
Colorado SB09-163 Educational Accountability Act: Turnaround and Priority Improvement .
Incremental vs. Dramatic Change
Work with your table. Select a recorder.
Using a flip chart page create a t-chart
Brainstorm examples of incremental changes
Brainstorm examples of dramatic changes
Incremental
Dramatic
Reviewing Turnaround Options Work with a partner. Take out “Turnaround
Options”.
Silently read one row in the chart (individually).
When each partner has completed a row, look up and “say something.” Something might be a question, a brief summary, a key point, an interesting idea or personal connection to the text.
Continue until you complete all of the rows in the chart.
Title I Requirements If your school also receives Title I funding,
additional planning requirements will apply . . .Schoolwide Title ITargeted Assistance programson improvement, corrective action or
restructuring
Quality criteria for school UIPs
Review NCLB Restructuring Options
How do the NCLB restructuring options compare to the Colorado Turnaround Options?
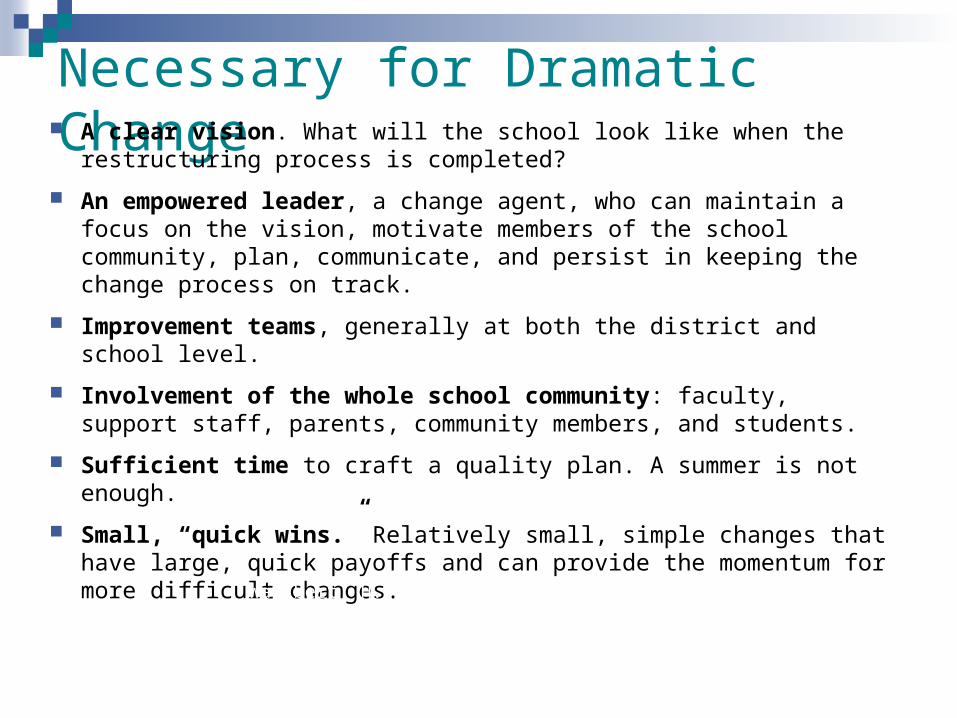
Necessary for Dramatic Change A clear vision. What will the school look like when the restructuring
process is completed?
An empowered leader, a change agent, who can maintain a focus on the vision, motivate members of the school community, plan, communicate, and persist in keeping the change process on track.
Improvement teams, generally at both the district and school level.
Involvement of the whole school community: faculty, support staff, parents, community members, and students.
Sufficient time to craft a quality plan. A summer is not enough.
Small, “quick wins.” Relatively small, simple changes that have large, quick payoffs and can provide the momentum for more difficult changes.
Wahlbert, H.J. Eds. (2007). Handbook on Restructuring and Substantial School Improvement. Lincoln, NE: Center on Innovation and Improvement.
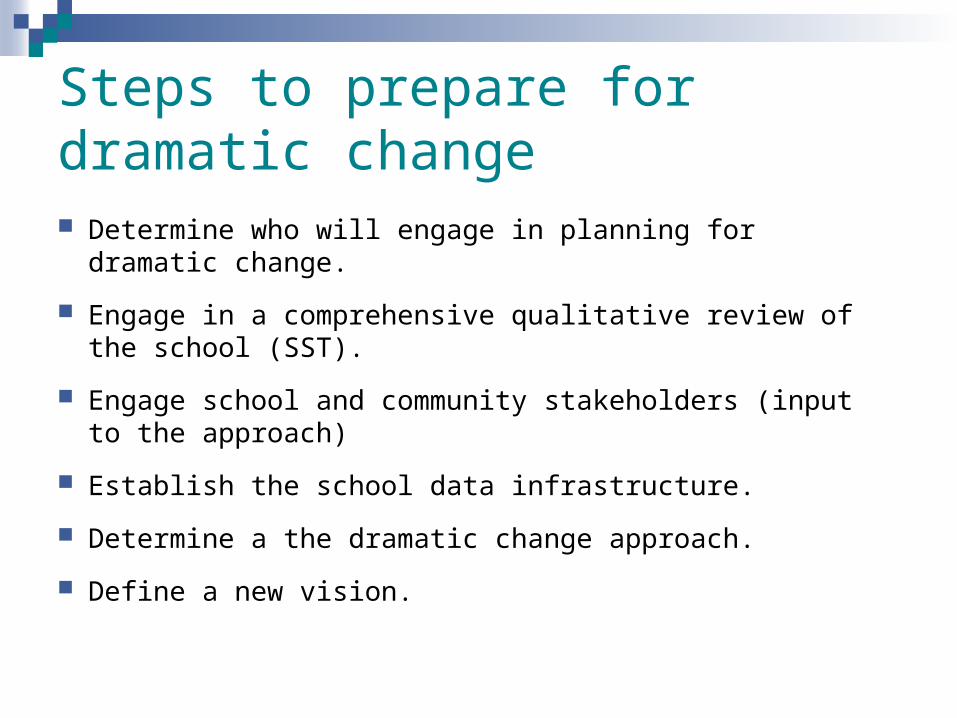
Steps to prepare for dramatic change Determine who will engage in planning for dramatic change.
Engage in a comprehensive qualitative review of the school (SST).
Engage school and community stakeholders (input to the approach)
Establish the school data infrastructure.
Determine a the dramatic change approach.
Define a new vision.
Agenda
Unified Improvement
Planning
Turnaround and Priority
Improvement
Identifying trends & priority needs
Developing your data
analysis plan
Completing the Data Narrative
Root Cause Analysis
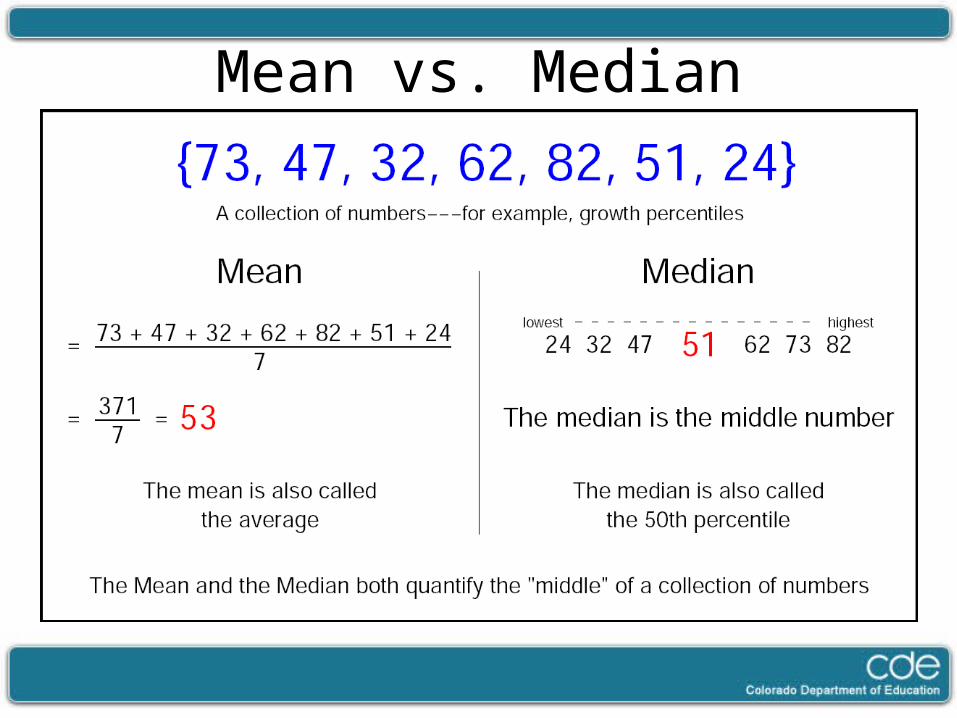
Mean vs. Median

Percentage vs. Percentile
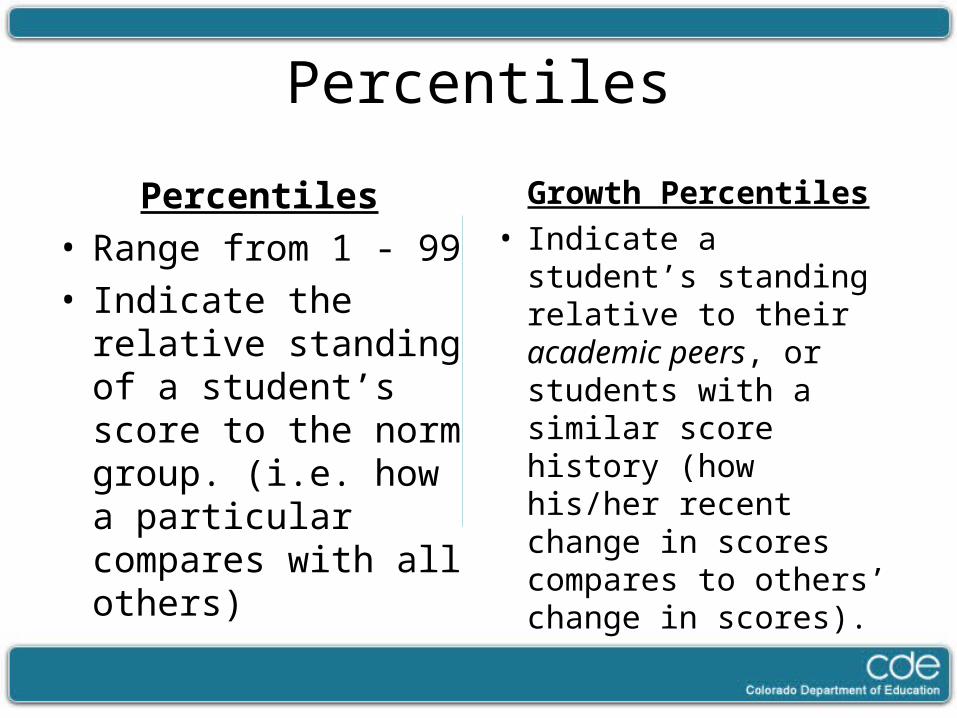
Percentiles
Percentiles• Range from 1 - 99• Indicate the relative
standing of a student’s score to the norm group. (i.e. how a particular compares with all others)
Growth Percentiles• Indicate a student’s
standing relative to their academic peers, or students with a similar score history (how his/her recent change in scores compares to others’ change in scores).
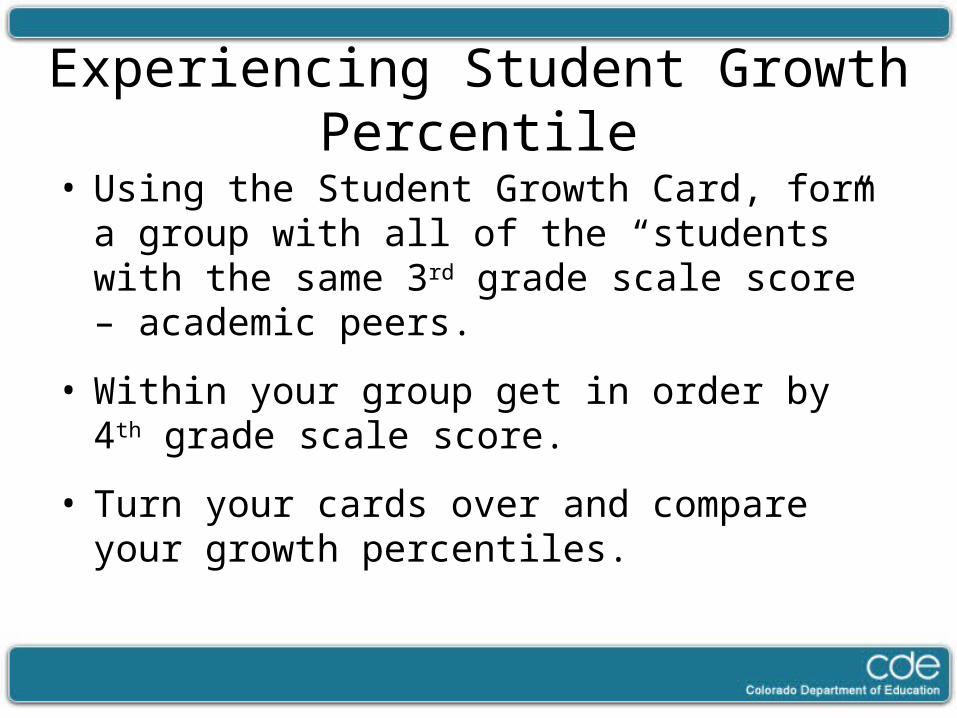
Experiencing Student Growth Percentile
• Using the Student Growth Card, form a group with all of the “students” with the same 3rd grade scale score – academic peers.
• Within your group get in order by 4th grade scale score.
• Turn your cards over and compare your growth percentiles.
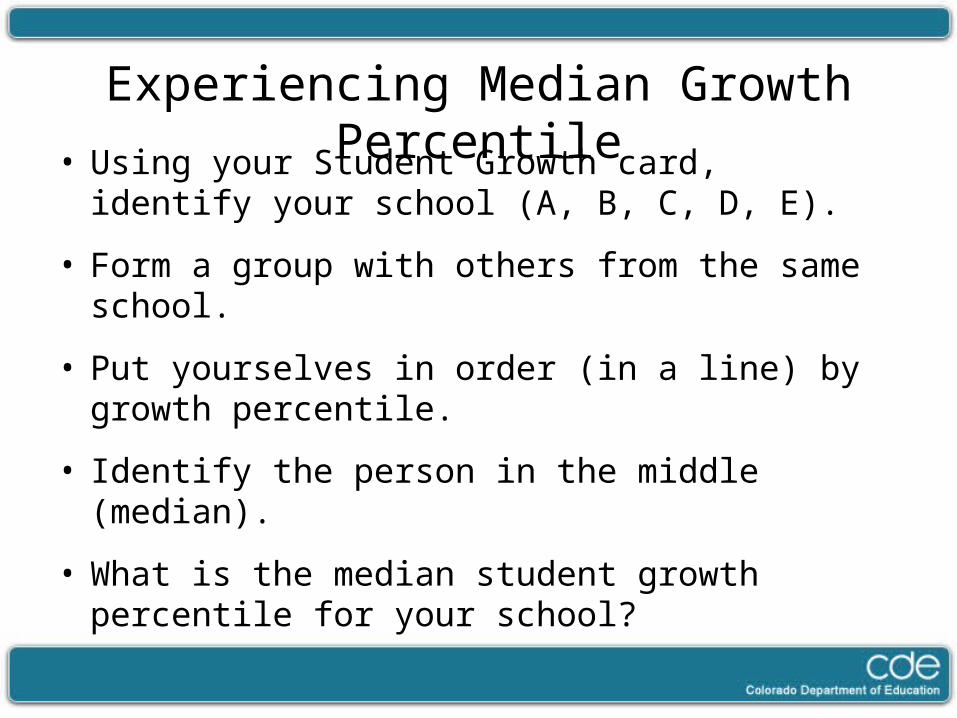
Experiencing Median Growth Percentile
• Using your Student Growth card, identify your school (A, B, C, D, E).
• Form a group with others from the same school.
• Put yourselves in order (in a line) by growth percentile.
• Identify the person in the middle (median).
• What is the median student growth percentile for your school?
Adequate Growth
• What is adequate growth?
• Based on catch-up and keep-up growth.
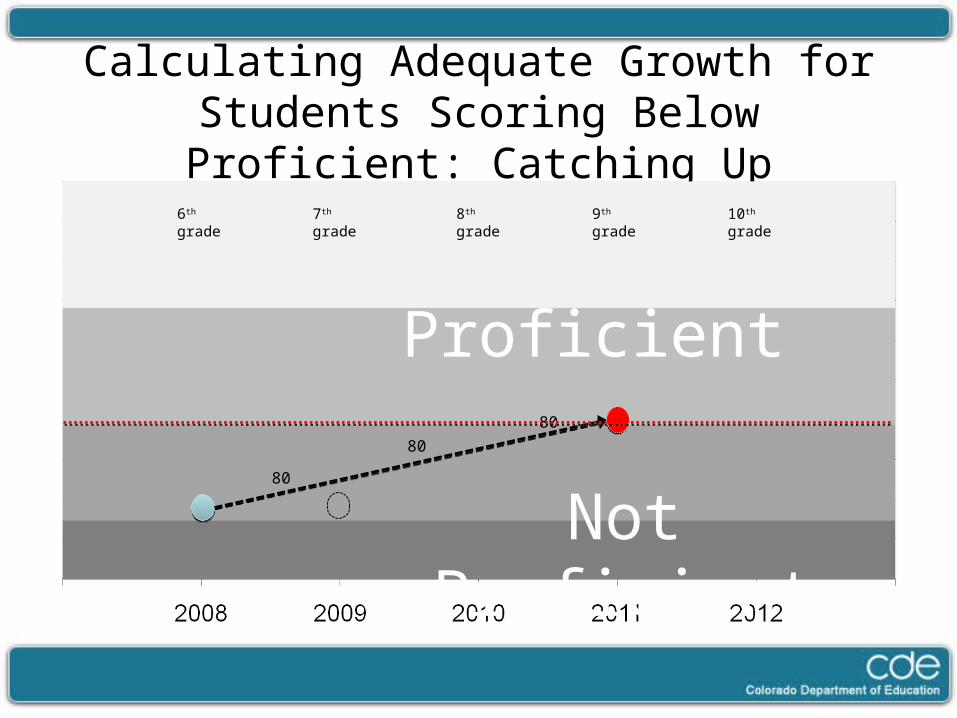
Catching Up
To be considered to be Catching Up:
• The student scores below proficient (unsatisfactory or partially proficient) in the previous year
• The student demonstrates growth adequate to reach proficient performance within the next three years or by tenth grade, whichever comes first.
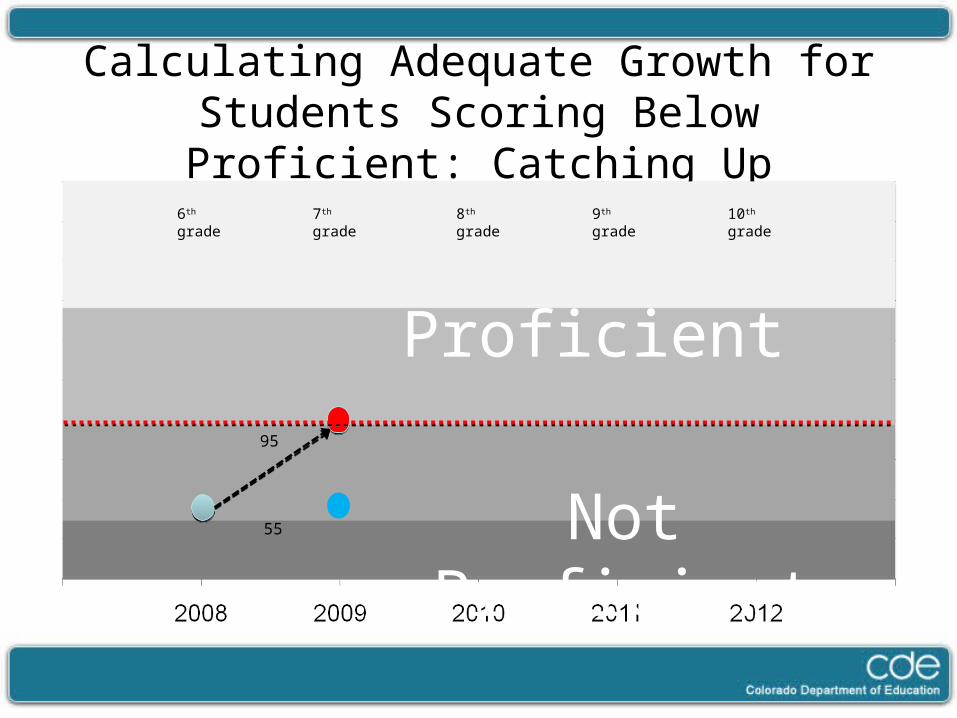
Calculating Adequate Growth for Students Scoring Below Proficient: Catching Up
95
Proficient
Not Proficient
7th grade 8th grade 9th grade 10th grade6th grade
55
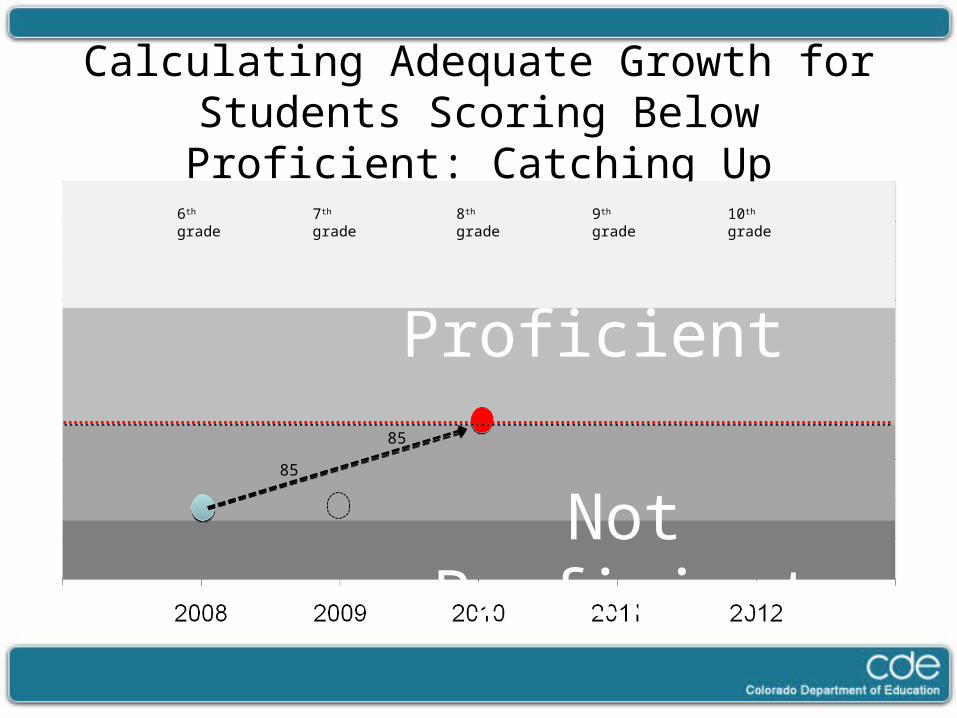
Calculating Adequate Growth for Students Scoring Below Proficient: Catching Up
Not Proficient
7th grade 8th grade 9th grade 10th grade6th grade
85
85
Proficient
Calculating Adequate Growth for Students Scoring Below Proficient: Catching Up
Not Proficient
7th grade 8th grade 9th grade 10th grade6th grade
8080
80
Proficient
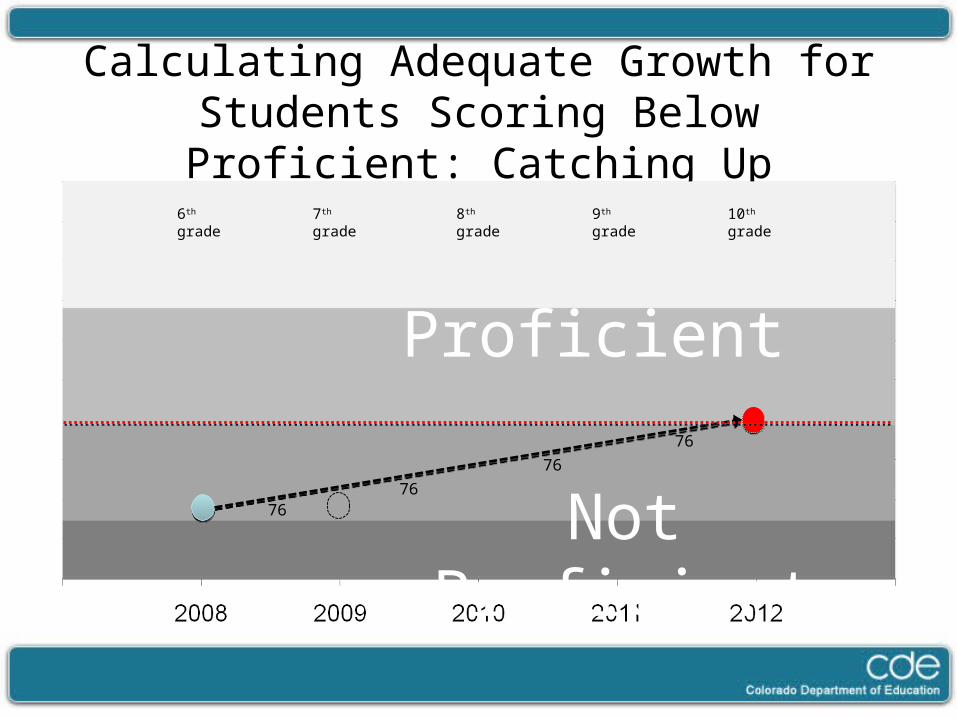
Calculating Adequate Growth for Students Scoring Below Proficient: Catching Up
Not Proficient
7th grade 8th grade 9th grade 10th grade6th grade
7676
7676
Proficient
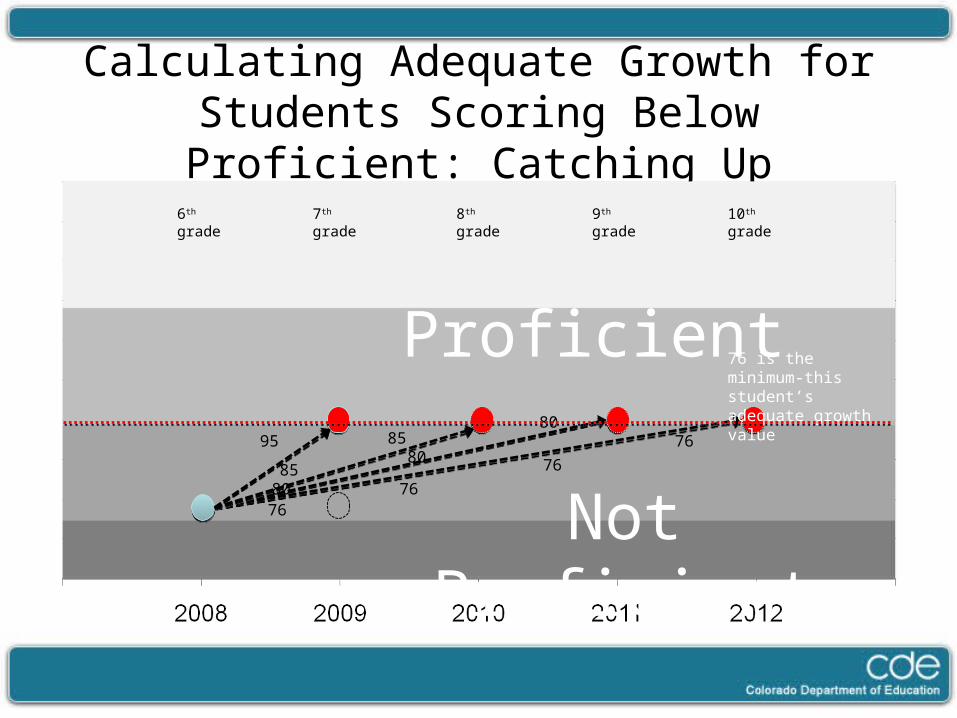
Calculating Adequate Growth for Students Scoring Below Proficient: Catching Up
95
Not Proficient
7th grade 8th grade 9th grade 10th grade6th grade
85
8580
80
80
7676
7676
76 is the minimum-this student’s adequate growth value
Proficient
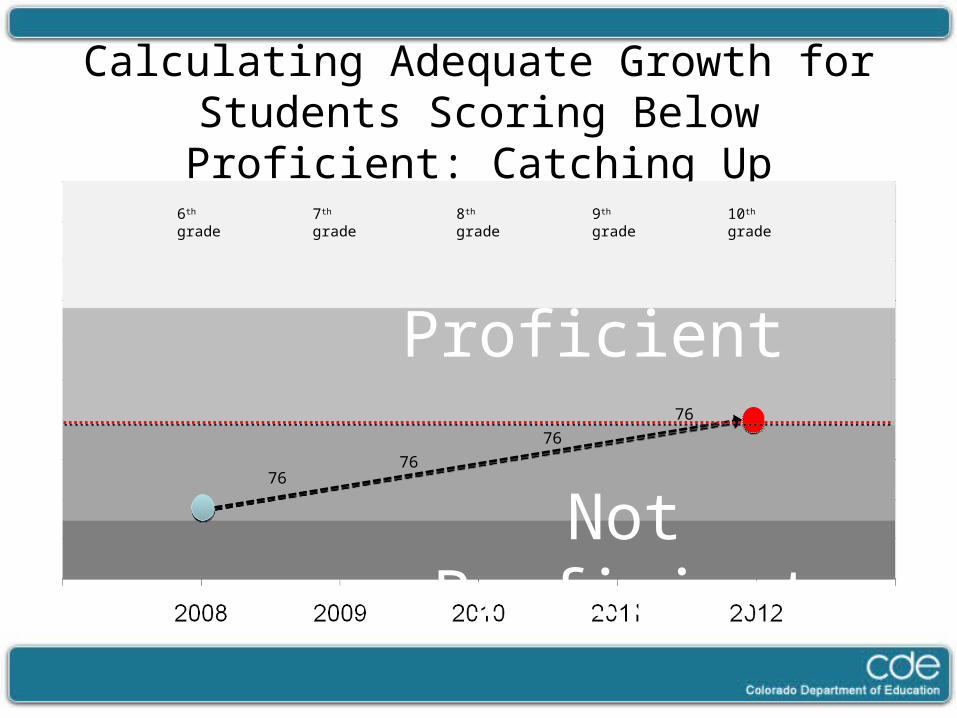
Calculating Adequate Growth for Students Scoring Below Proficient: Catching Up
Not Proficient
7th grade 8th grade 9th grade 10th grade6th grade
7676
7676
Proficient
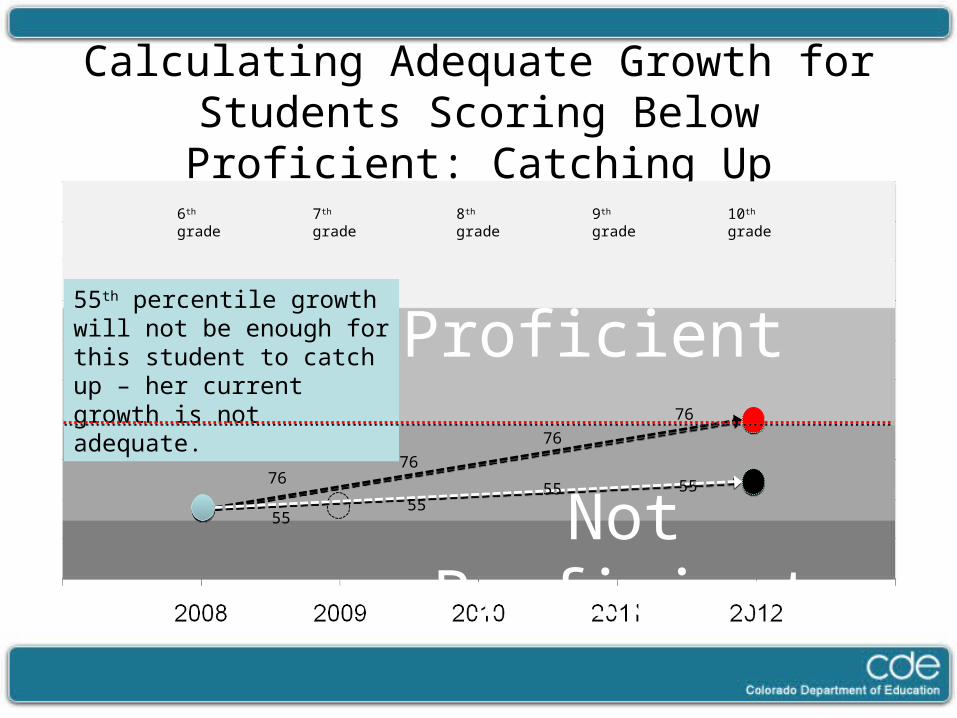
Calculating Adequate Growth for Students Scoring Below Proficient: Catching Up
Not Proficient
7th grade 8th grade 9th grade 10th grade6th grade
7676
7676
5555
55
55
55th percentile growth will not be enough for this student to catch up – her current growth is not adequate.
Proficient
Keeping Up
To be considered to be Keeping Up:
• The student scores at the proficient or advanced level in the previous year.
• The student demonstrates growth adequate to maintain proficiency for the next three years or until tenth grade, whichever comes first.
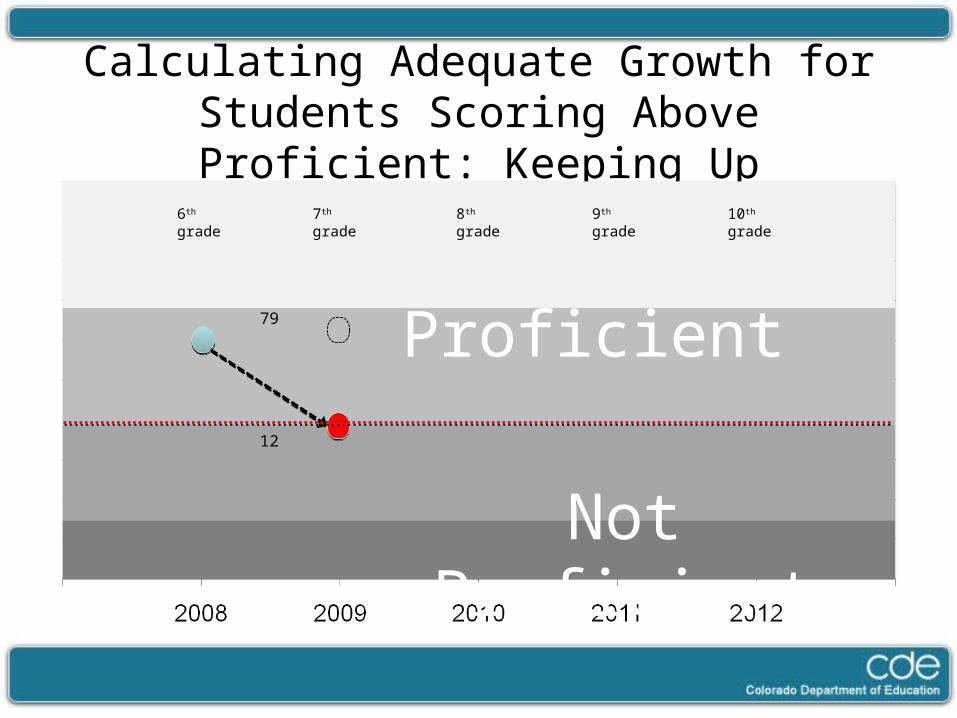
Calculating Adequate Growth for Students Scoring Above Proficient: Keeping Up
12
Not Proficient
7th grade 8th grade 9th grade 10th grade6th grade
79 Proficient
Calculating Adequate Growth for Students Scoring Above Proficient: Keeping Up
Not Proficient
7th grade 8th grade 9th grade 10th grade6th grade
25
25
Proficient
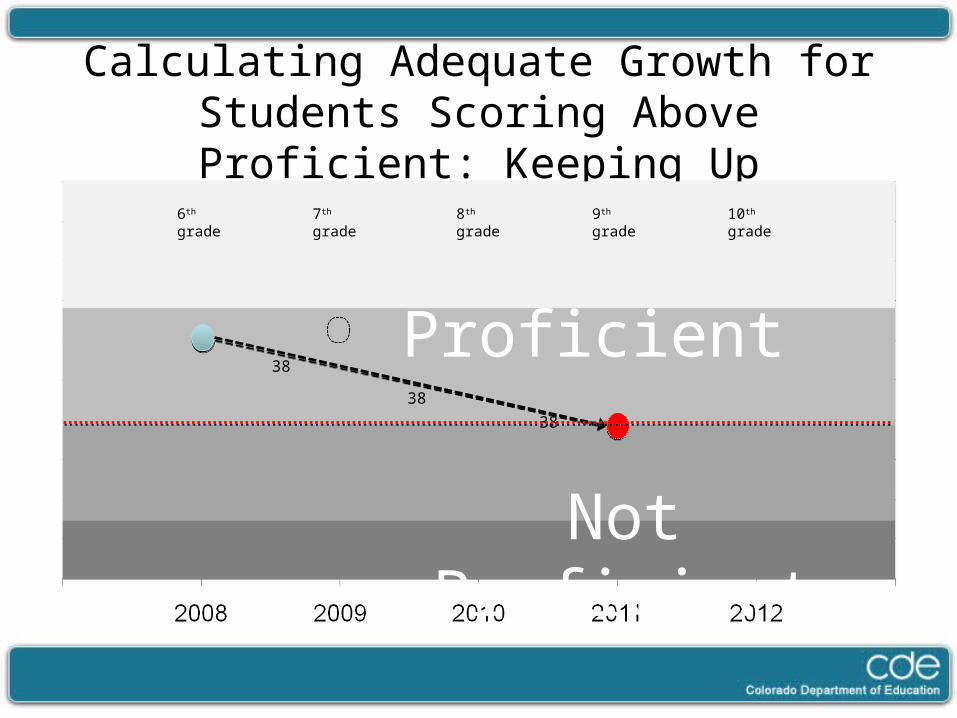
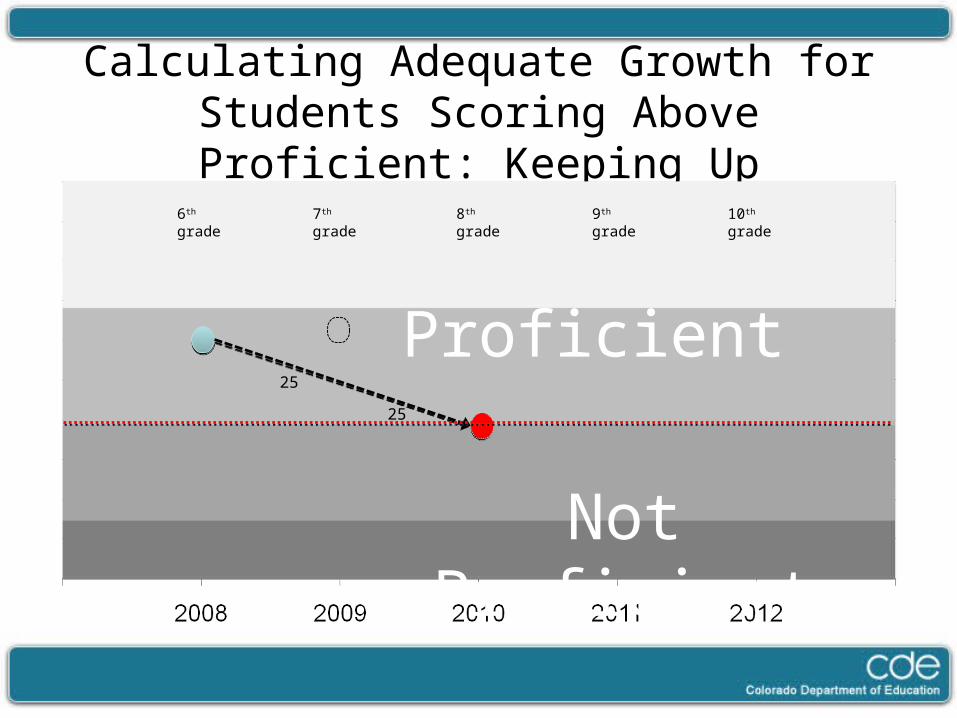
Calculating Adequate Growth for Students Scoring Above Proficient: Keeping Up
Not Proficient
7th grade 8th grade 9th grade 10th grade6th grade
3838
38Proficient

Calculating Adequate Growth for Students Scoring Above Proficient: Keeping Up
Not Proficient
7th grade 8th grade 9th grade 10th grade6th grade
50
5050
50Proficient
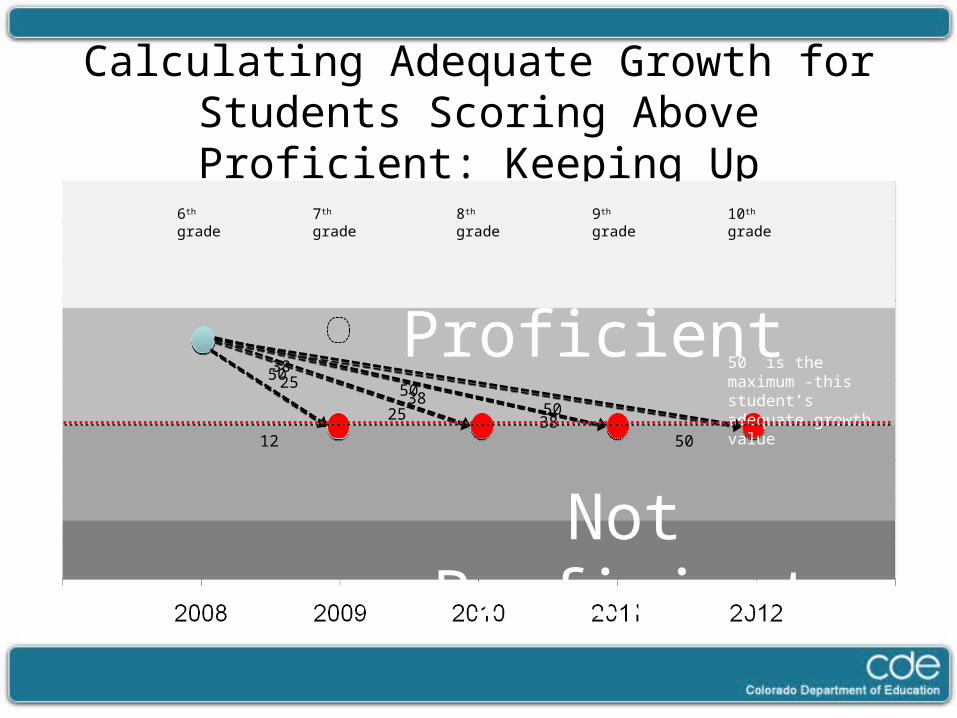
Calculating Adequate Growth for Students Scoring Above Proficient: Keeping Up
12
Not Proficient
7th grade 8th grade 9th grade 10th grade6th grade
25
25 3838
38
50
5050
5050 is the maximum -this student’s adequate growth value
Proficient
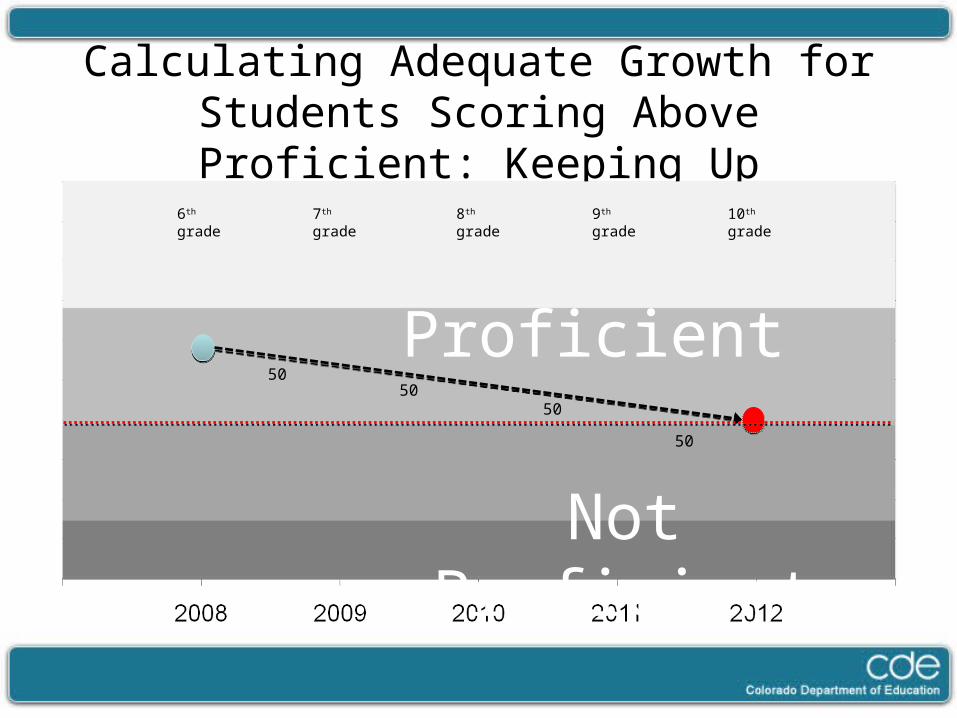
Calculating Adequate Growth for Students Scoring Above Proficient: Keeping Up
Not Proficient
7th grade 8th grade 9th grade 10th grade6th grade
50
5050
50Proficient

Calculating Adequate Growth for Students Scoring Above Proficient: Keeping Up
Not Proficient
7th grade 8th grade 9th grade 10th grade6th grade
50
5050
50
79 7979
79
Proficient79th percentile growth will be enough for this student to keep up – his current growth is adequate.
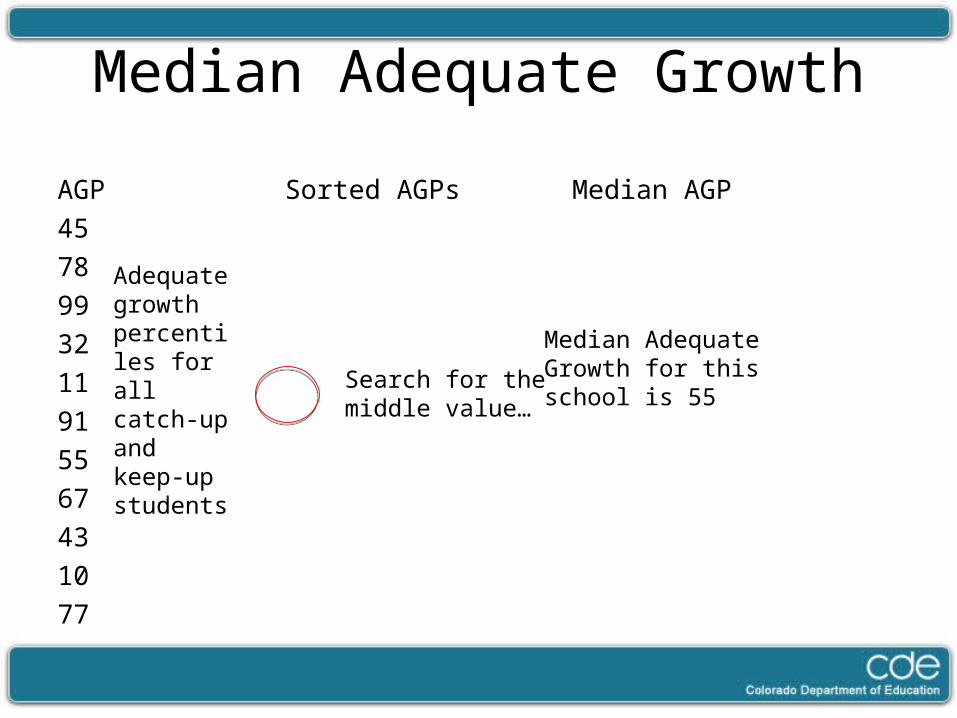
Median Adequate Growth
AGP Sorted AGPs Median AGP4578993211915567431077
Median Adequate Growth for this school is 55
Search for the middle value…
Adequate growth percentiles for all catch-up and keep-up students
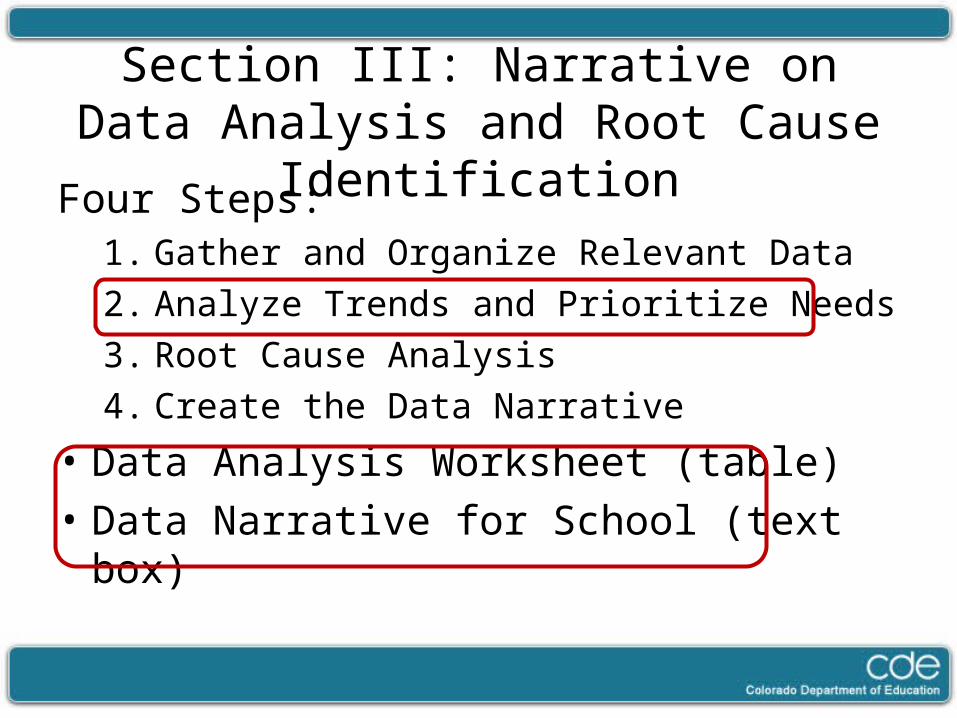
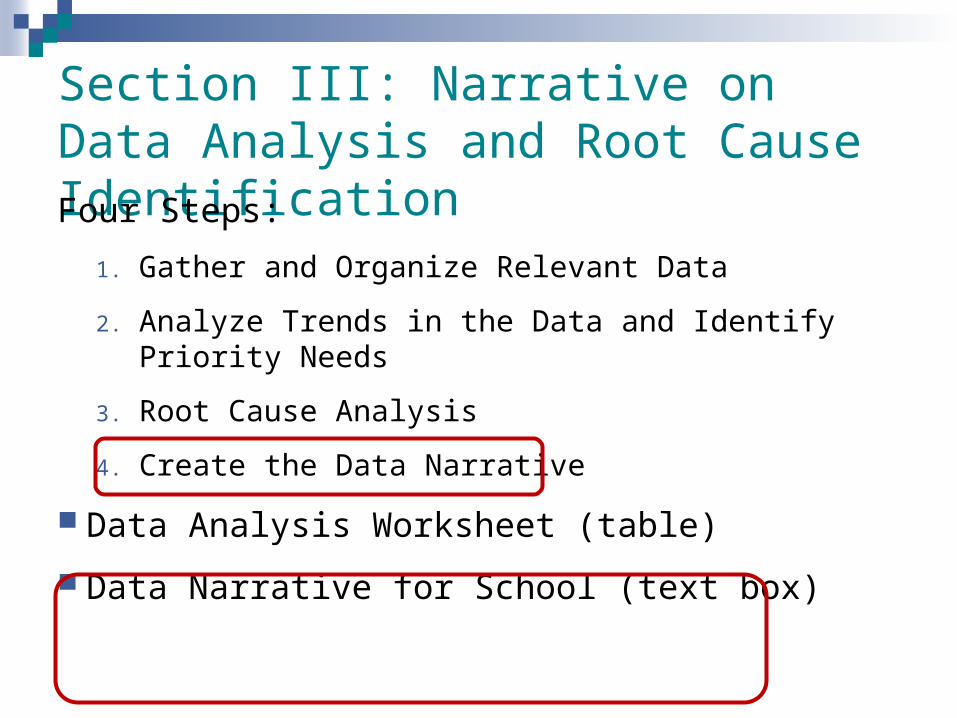
Section III: Narrative on Data Analysis and Root Cause Identification
Four Steps:
1. Gather and Organize Relevant Data
2. Analyze Trends and Prioritize Needs
3. Root Cause Analysis
4. Create the Data Narrative
Data Analysis Worksheet (table)
Data Narrative for School (text box)
Section III, Step One: Gather and Organize Relevant Data
Consider: “Required reports.” and “Suggested local data
sources” UIP Template, Section III
Team Discussion: Have you accessed all of the required state reports? To which local data sources do you have access? Highlight all of the “local data sources” that you
currently use.
State Performance Data Sources
School Growth Summary, District Growth Summary
CSAP score reporting
Colorado Growth Model (both public and private)
Student-level CSAP files (from CTB)
Student-level flat files (growth, CSAPA, PSWR) from CEDAR
Multiple measures must be considered and used to understand the multifaceted world of learning from the perspective of everyone involved.
-Victoria Bernhardt
What types of data do we have?
• Demographics
• Perceptions
• Student Learning
• School Processes
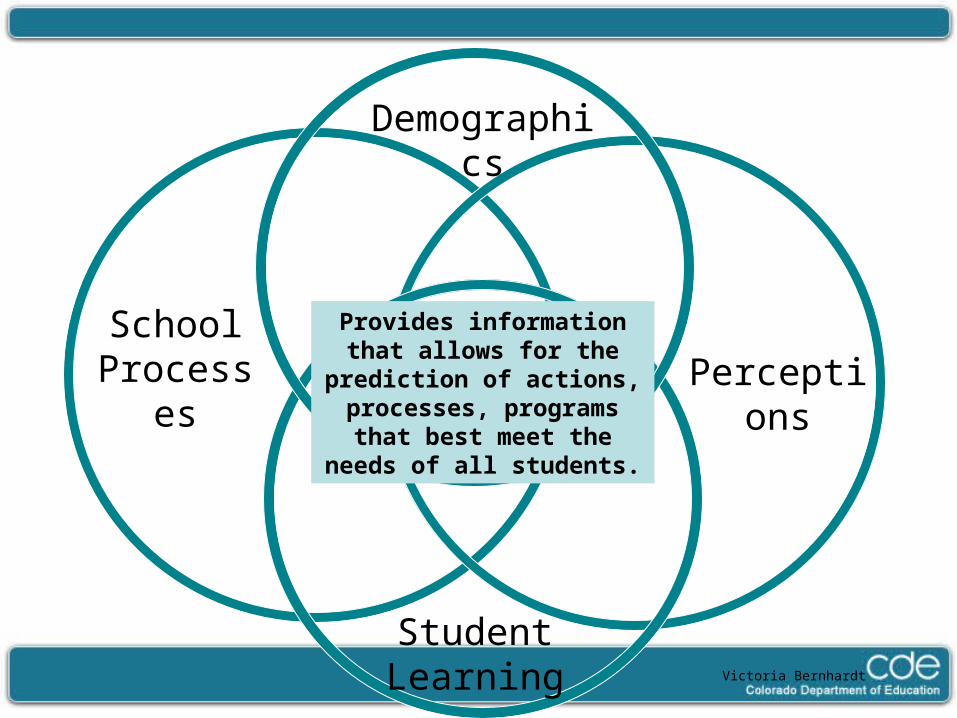
Student Learning
School Processe
sPerceptio
ns
Demographics
Provides information that allows for the prediction of
actions, processes, programs that best meet the
needs of all students.
Victoria Bernhardt
For what do you use multiple data sources in UIP?
• To answer questions about performance: – Significant trends – Priority needs
• To determine why school performance is what it is (root causes)?
• To monitor school progress towards annual targets (interim measures).
• To monitor implementation of improvement strategies (implementation benchmarks).
Performance Measures
Process Measures
Using Multiple Data Sources
• To answer questions about performance: – Significant trends – Priority needs
• To determine why school performance is what it is (root causes)?
• To monitor school progress towards annual targets (interim measures).
• To monitor implementation of improvement strategies (implementation benchmarks).
Inventory Local Performance Data
• Consider the following tools:– Survey of Assessment Data Example– Survey of Assessment Data Template
• Working with your school team, answer: – Do you know what assessment data sources are
available to your school?– Do you have a comprehensive inventory of available
performance data?
Practice: Drilling-Down into Performance Data
• Consider Data Analysis: Drilling Down
• Choose a sub-indicator for which your school did not meet state expectations.
• Select questions that would help your school staff to “drill-down” to better understand performance in that indicator area.
Develop a Data Analysis Plan
• Consider the data analysis plan template
• Capture critical questions for your team to drill down in one indicator or sub-indicator area.
• Determine what state and local data reports will your team review as part of this data analysis plan.
Using Multiple Data Sources
• To answer questions about performance: – Significant rends – Priority needs)?
• To determine why school performance is what it is (root causes)?
• To monitor school progress towards annual targets (interim measures).
• To monitor implementation of improvement strategies (implementation benchmarks).
If you’re only looking at Student Learning, you’re missing 65% of
the data. – Victoria Bernhardt
Root Cause Analysis Data Needs
• Root cause analysis will require your team to consider types of data other than performance data.
• Consider the SST Evidence List
• Do you have access to or could you gather these data for your school?
Using Multiple Data Sources
• To answer questions about performance: – Significant rends – Priority needs)?
• To determine why school performance is what it is (root causes)?
• To monitor school progress towards annual targets (interim measures).
• To monitor implementation of improvement strategies (implementation benchmarks).
Data Sources Calendar• Monitoring progress over time requires your
team to know when different data become available.
• Consider the sample Data Sources Calendar.
– What are the benefits of having timing attached to a survey of available data sources?
– What would you add, delete from this template?
– How will you facilitate organization of your data sources over time?
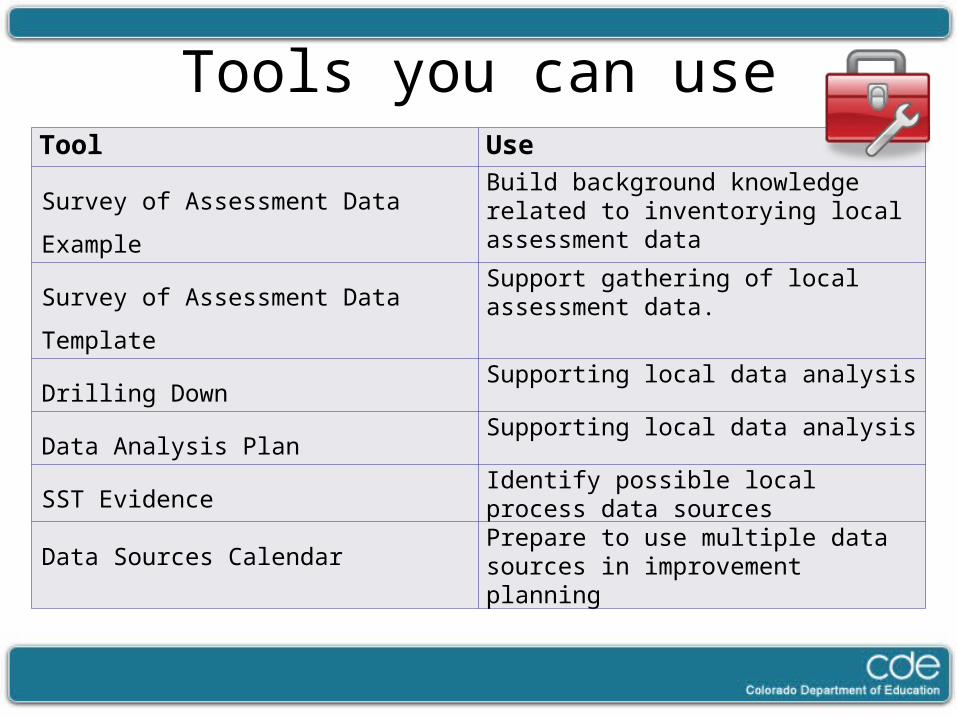
Tools you can useTool Use
Survey of Assessment Data ExampleBuild background knowledge related to inventorying local assessment data
Survey of Assessment Data TemplateSupport gathering of local assessment data.
Drilling DownSupporting local data analysis
Data Analysis PlanSupporting local data analysis
SST EvidenceIdentify possible local process data sources
Data Sources CalendarPrepare to use multiple data sources in improvement planning
Integrating your Thinking
• Take out, Supporting School Planning Notecatcher
• Make notes about your next steps in gathering and organizing data.
• What tools will you use?
Quality Criteria for Unified Improvement Planning
• Choose a partner. Take out: UIP Quality Criteria, Section III
• Read individually the in the table related to data narrative, significant trends, priority needs, and root causes analysis.
• When each partner has completed reading the first row, look up and “say something.” Something might be a question, a brief summary, a key point, an interesting idea or personal connection to the text.
• Continue until you complete all rows in Section III.
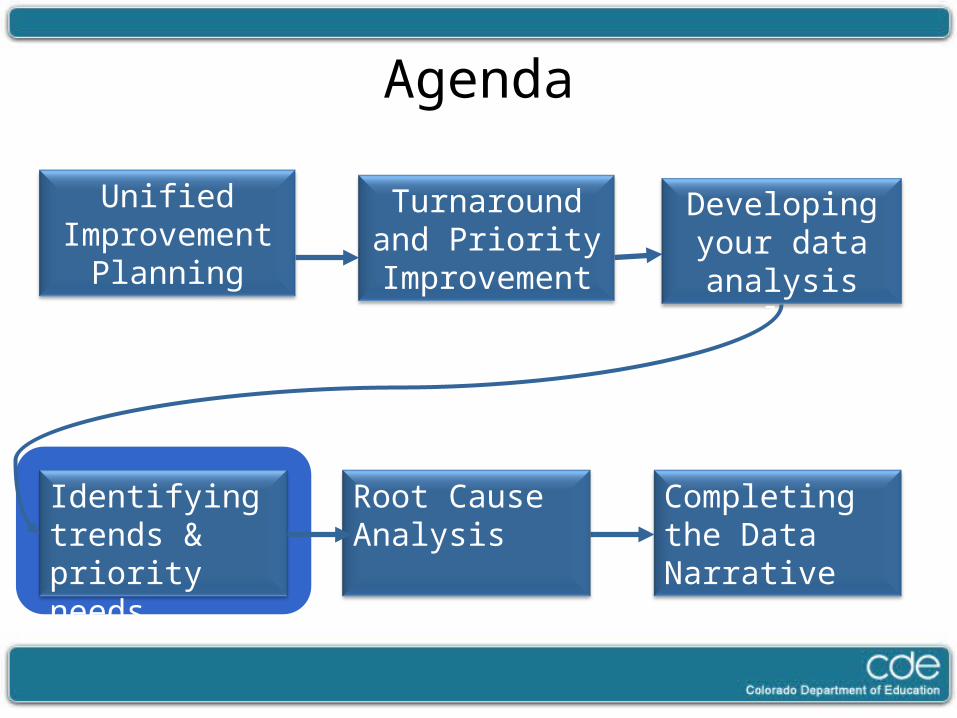
Agenda
Unified Improvement
Planning
Turnaround and Priority
Improvement
Identifying trends & priority needs
Developing your data
analysis plan
Completing the Data Narrative
Root Cause Analysis
Section III: Narrative on Data Analysis and Root Cause Identification
Four Steps:1. Gather and Organize Relevant Data
2. Analyze Trends and Prioritize Needs
3. Root Cause Analysis
4. Create the Data Narrative
• Data Analysis Worksheet (table)
• Data Narrative for School (text box)
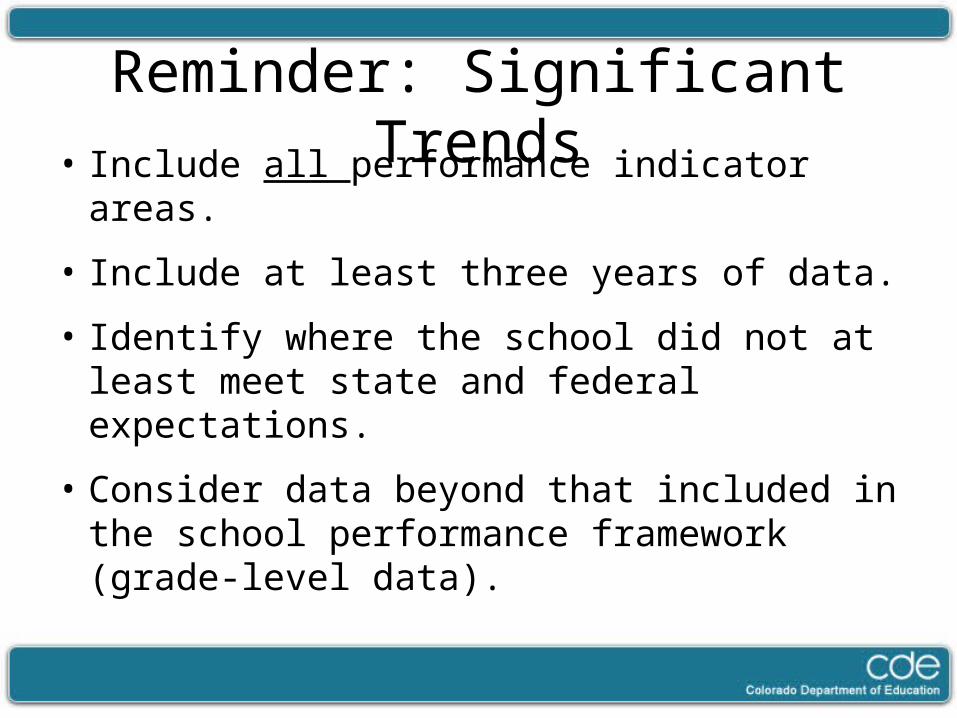
Reminder: Significant Trends
• Include all performance indicator areas.
• Include at least three years of data.
• Identify where the school did not at least meet state and federal expectations.
• Consider data beyond that included in the school performance framework (grade-level data).
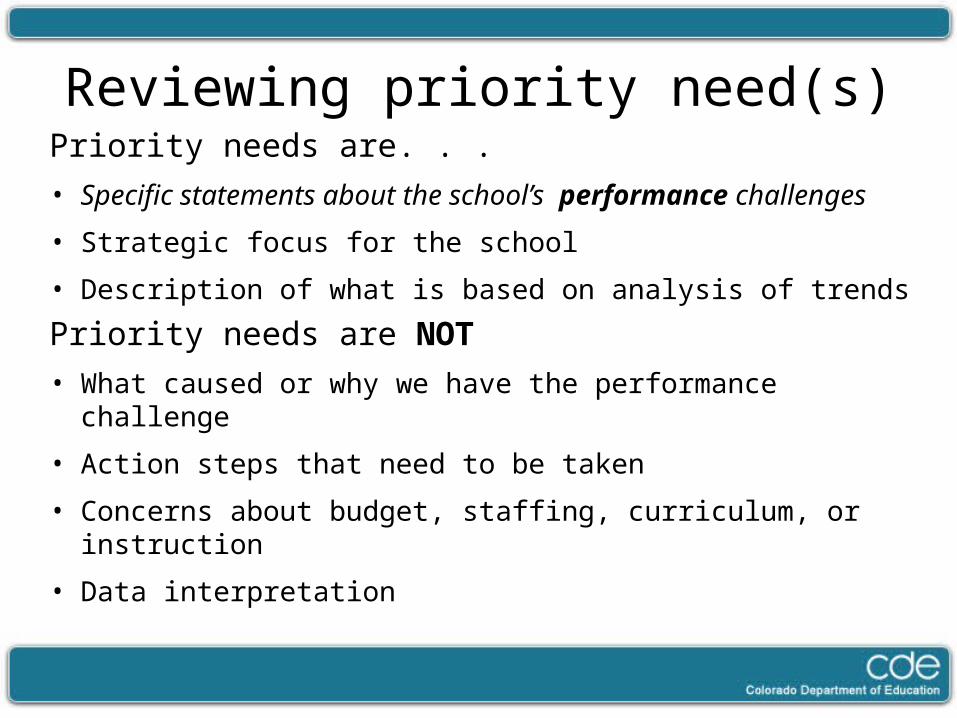
Reviewing priority need(s)Priority needs are. . .
• Specific statements about the school’s performance challenges
• Strategic focus for the school
• Description of what is based on analysis of trends
Priority needs are NOT
• What caused or why we have the performance challenge
• Action steps that need to be taken
• Concerns about budget, staffing, curriculum, or instruction
• Data interpretation
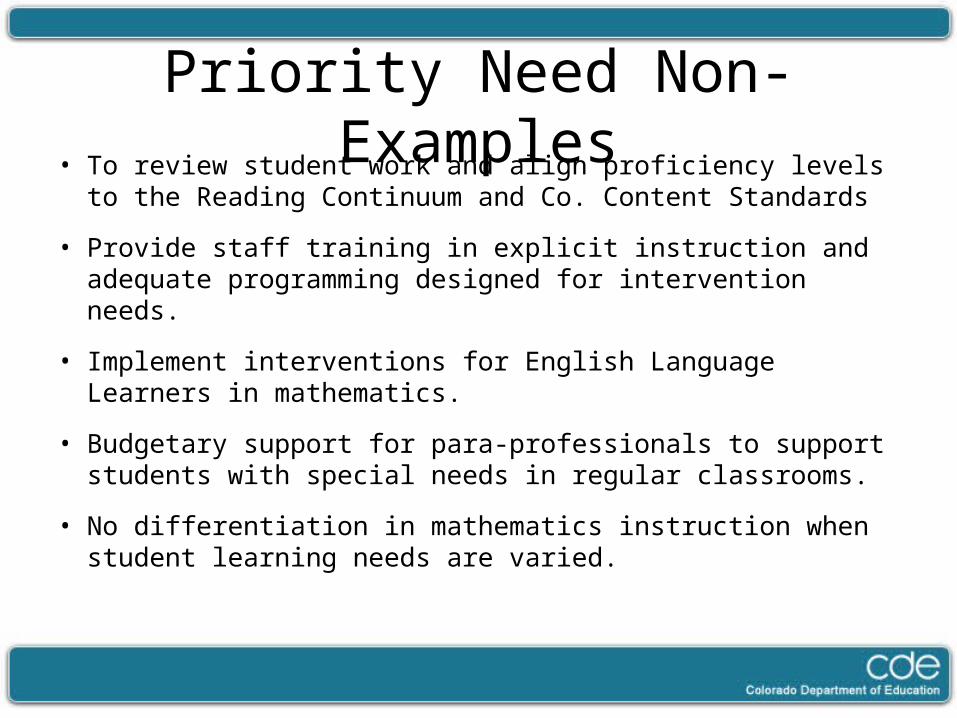
Priority Need Non-Examples
• To review student work and align proficiency levels to the Reading Continuum and Co. Content Standards
• Provide staff training in explicit instruction and adequate programming designed for intervention needs.
• Implement interventions for English Language Learners in mathematics.
• Budgetary support for para-professionals to support students with special needs in regular classrooms.
• No differentiation in mathematics instruction when student learning needs are varied.
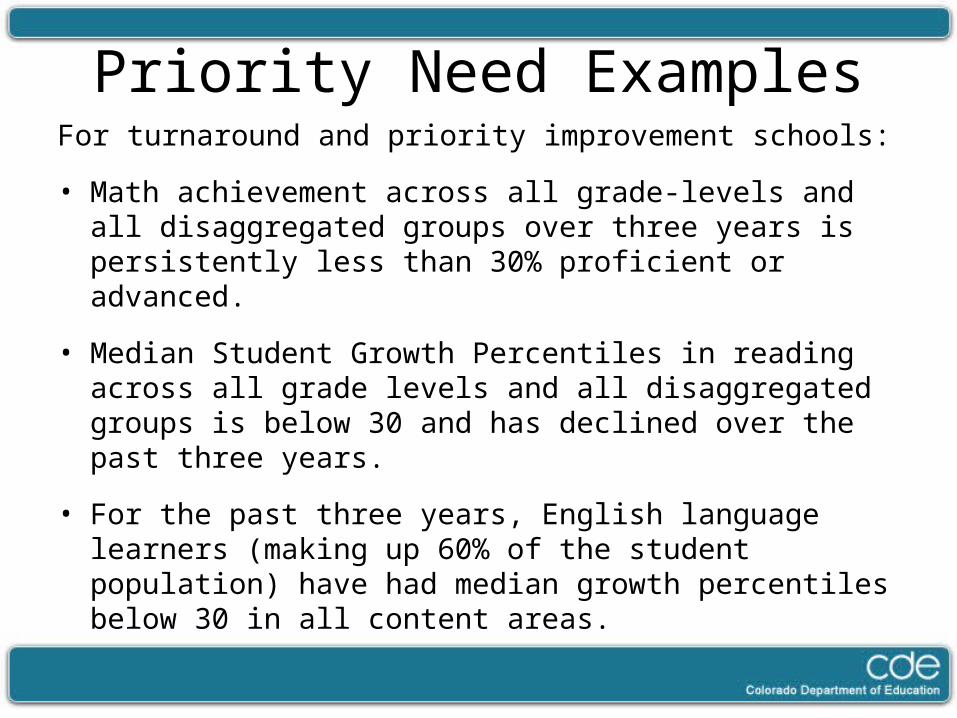
Priority Need ExamplesFor turnaround and priority improvement schools:
• Math achievement across all grade-levels and all disaggregated groups over three years is persistently less than 30% proficient or advanced.
• Median Student Growth Percentiles in reading across all grade levels and all disaggregated groups is below 30 and has declined over the past three years.
• For the past three years, English language learners (making up 60% of the student population) have had median growth percentiles below 30 in all content areas.
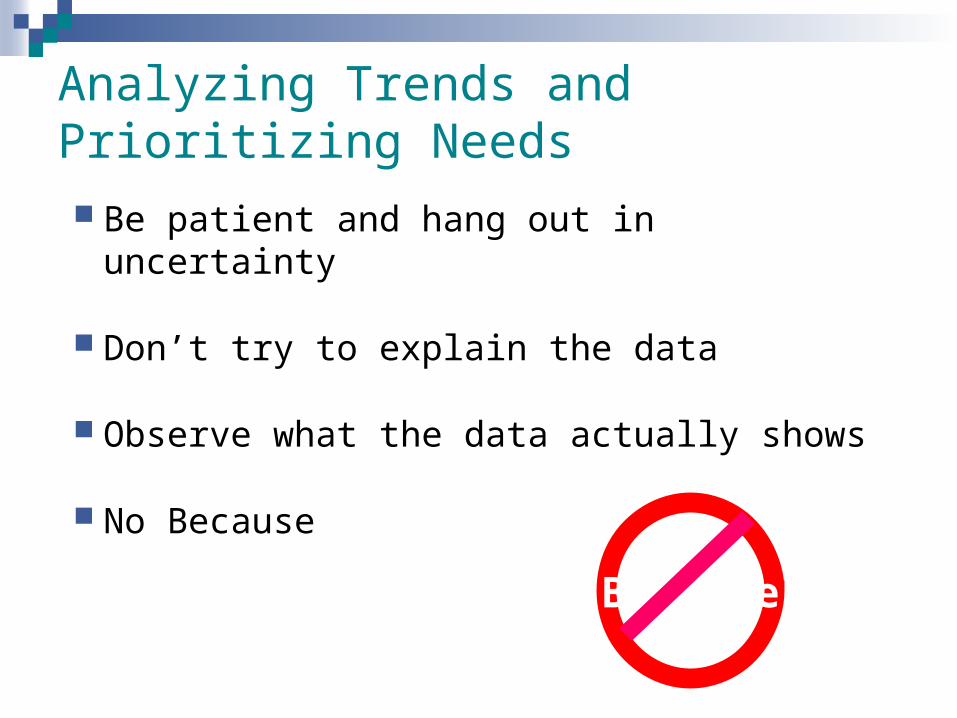
Be patient and hang out in uncertainty
Don’t try to explain the data
Observe what the data actually shows
No Because
Analyzing Trends and Prioritizing Needs
Because
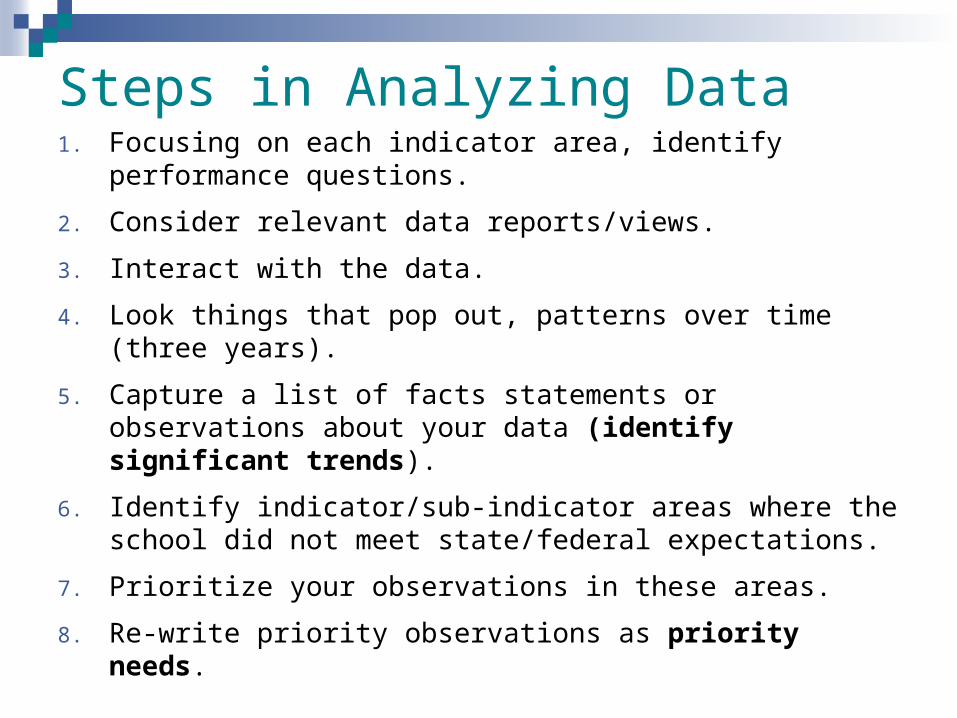
Steps in Analyzing Data1. Focusing on each indicator area, identify performance
questions.
2. Consider relevant data reports/views.
3. Interact with the data.
4. Look things that pop out, patterns over time (three years).
5. Capture a list of facts statements or observations about your data (identify significant trends).
6. Identify indicator/sub-indicator areas where the school did not meet state/federal expectations.
7. Prioritize your observations in these areas.
8. Re-write priority observations as priority needs.
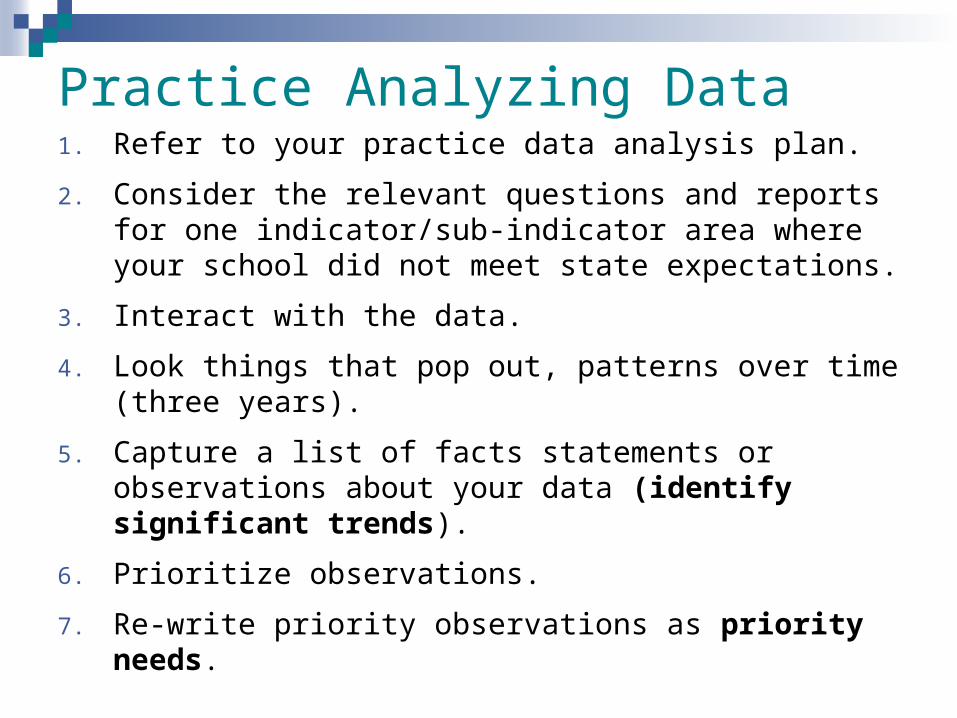
Practice Analyzing Data1. Refer to your practice data analysis plan.
2. Consider the relevant questions and reports for one indicator/sub-indicator area where your school did not meet state expectations.
3. Interact with the data.
4. Look things that pop out, patterns over time (three years).
5. Capture a list of facts statements or observations about your data (identify significant trends).
6. Prioritize observations.
7. Re-write priority observations as priority needs.
Practice Interacting with data Consider strategies for interacting with data:
Highlight (color coded) based on a legend.
Do origami – fold the paper so you can compare columns.
Create graphic representations
Agree on an approach. How will you interact with your data?
Plan to include a visual representation (Interacting with Data Job Aide)
As a group, interact with your data

Analyze Trends1. Review the highlighted data reports
and graphical representations.
2. Look for things that jump out.
3. Identify patterns over time (3-years).
4. List your significant trends.
5. Post to your data wall.
Prioritizing Needs
Vote
Consensus
Apply Criteria (Prioritizing Need Areas)
Your strategies?
Practice: Prioritize Observations
1. Prioritize (each table group member votes 2 times for their priority).
2. Restate/rewrite as a need (priority needs).
Observations may already be written as needs. If not, reword.
3. Post at least one priority-need to your data wall.
Capturing your Data Analysis in the UIP template
Capture significant trends and priority needs in the data analysis worksheet
Data narrative will include:
What data you reviewed
The process in which your team engaged to analyze the school’s data
The results of the analysis
Apply Quality Criteria Section III: Significant Trends and Priority Needs Use the Quality Criteria for Unified Improvement
Planning, Significant Trends and Priority Needs
Use your school plan,consider:
How are the significant trends and priority needs similar and/or different from that reflected in quality criteria
How could these sections be improved on this example plan (what they might do next)?
Integrating your Thinking
Take out, Supporting School Planning Notecatcher
Make notes about your next steps to identify significant trends and prioritize needs.
What tools will you use?
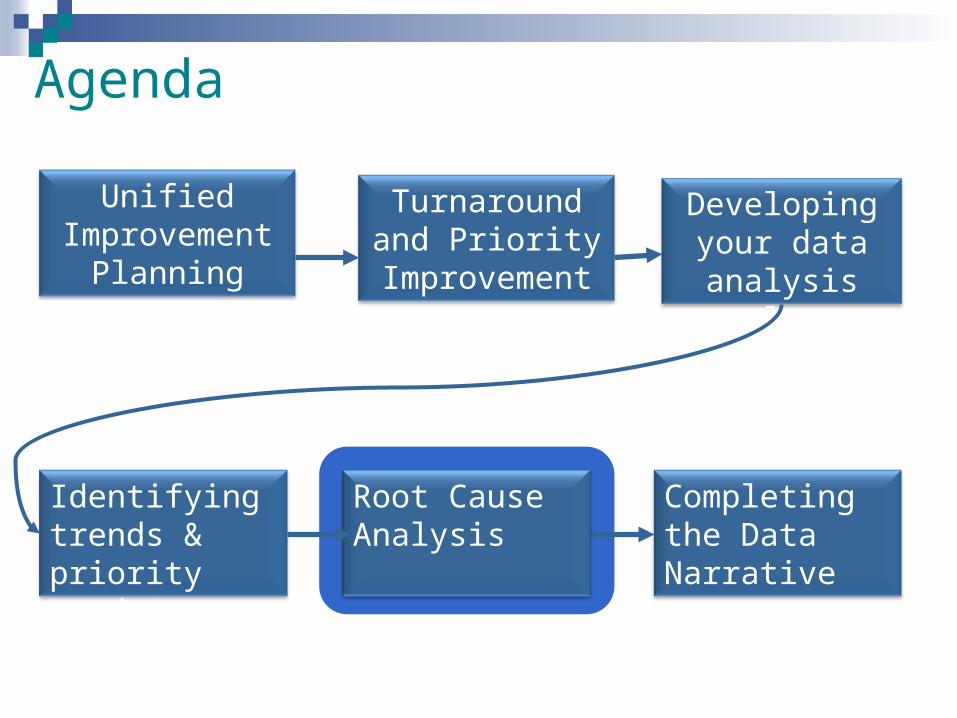
Agenda
Unified Improvement
Planning
Turnaround and Priority
Improvement
Identifying trends & priority needs
Developing your data
analysis plan
Completing the Data Narrative
Root Cause Analysis
Section III: Narrative on Data Analysis and Root Cause IdentificationFour Steps:
1. Gather and Organize Relevant Data
2. Analyze Trends in the Data and Identify Priority Needs
3. Root Cause Analysis
4. Create the Data Narrative
Data Analysis Worksheet (table)
Data Narrative for School (text box)
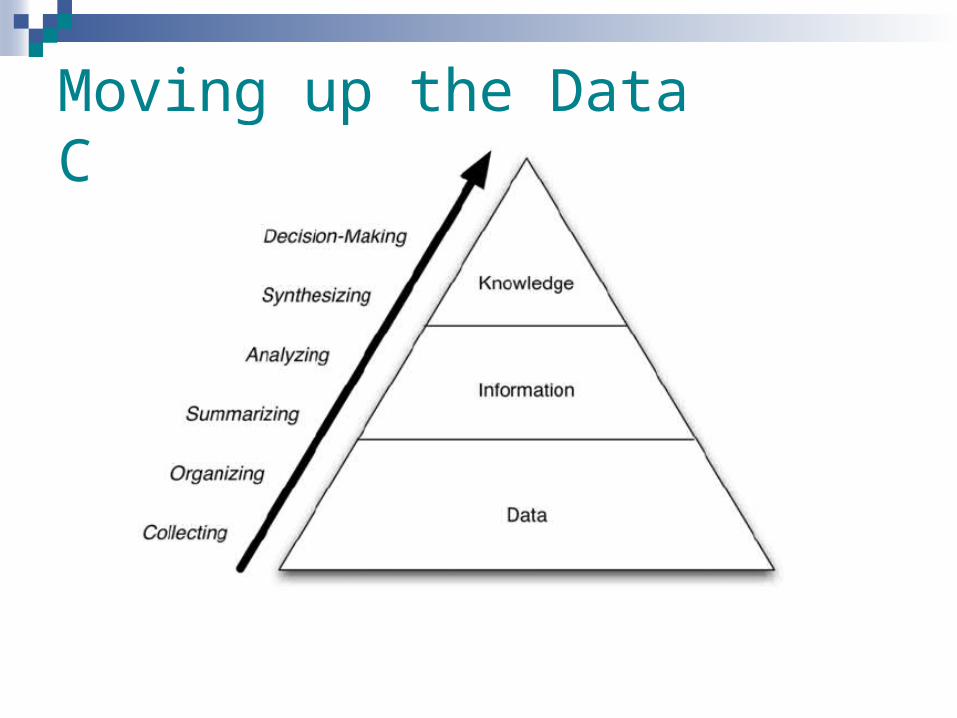
Moving up the Data Continuum
Brieter & Light, Light, Wexlar, Heinze, 2004
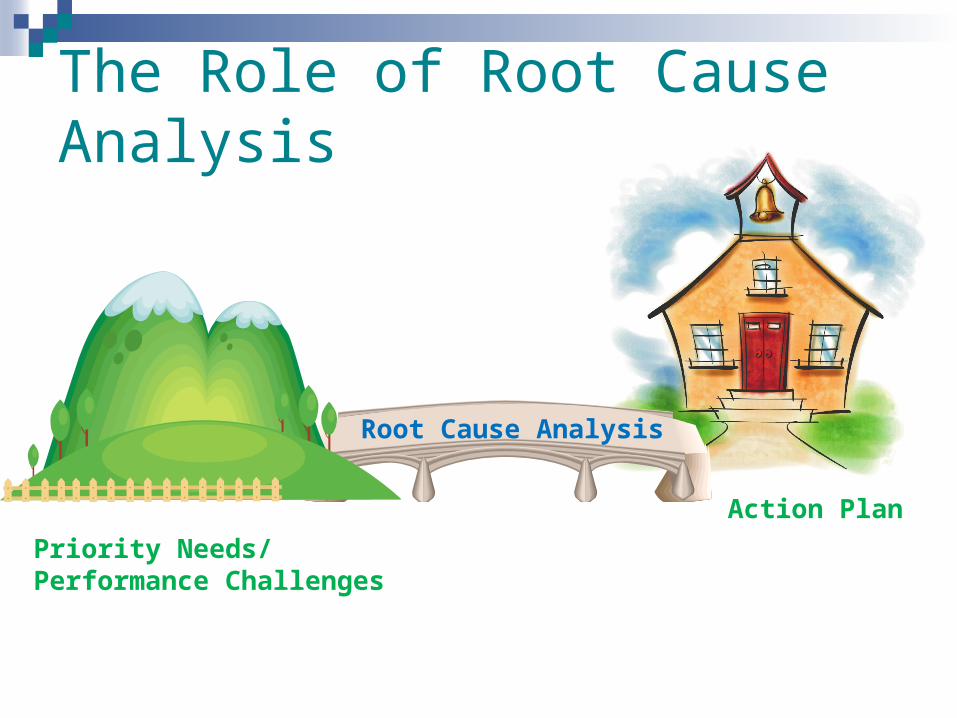
The Role of Root Cause Analysis
Root Cause Analysis
Priority Needs/Performance Challenges
Action Plan
Root Causes are. . . Statements describing the deepest underlying
cause, or causes, of performance challenges.
Causes that if dissolved would result in elimination, or substantial reduction of the performance challenge(s).
Why. . .
Things we can change and need to change
The focus of our major improvement strategies.
Non-examples of Root Causes
What is NOT a root cause?
Student attributes (poverty level)
Student motivation
With your table, identify two explanations that might appear to be root causes but don’t qualify (2 min).
How to engage in Root Cause Analysis
Stay open to multiple possibilities.
Keep multiple voices in the conversations.
Generate possible theories of causation (testable explanations).
Dig deeper to organize and integrate our thoughts.
Identify additional data sources to confirm causal theories.
Steps in Root Cause Analysis
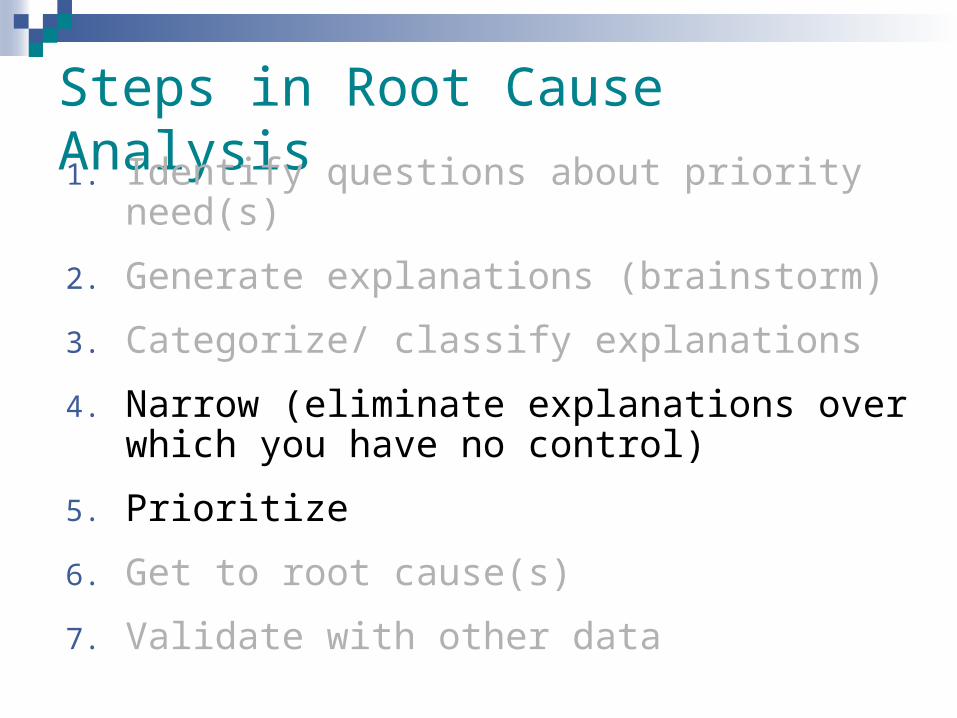
1. Identify questions about the priority need.
2. Generate explanations (brainstorm)
3. Categorize/ classify explanations
4. Narrow (eliminate explanations over which you have no control)
5. Prioritize
6. Get to root cause(s)
7. Validate with other data
Steps in Root Cause Analysis
1. Identify questions about the priority need.
2. Generate explanations (brainstorm)
3. Categorize/ classify explanations
4. Narrow (eliminate explanations over which you have no control)
5. Prioritize
6. Get to root cause(s)
7. Validate with other data
Activity: Brainstorm Explanations
1. Write your priority need on a flip chart.
2. Brainstorm testable explanations for your priority need.
3. Formulate as many explanations or theories of causation as possible
4. Post those on your data wall
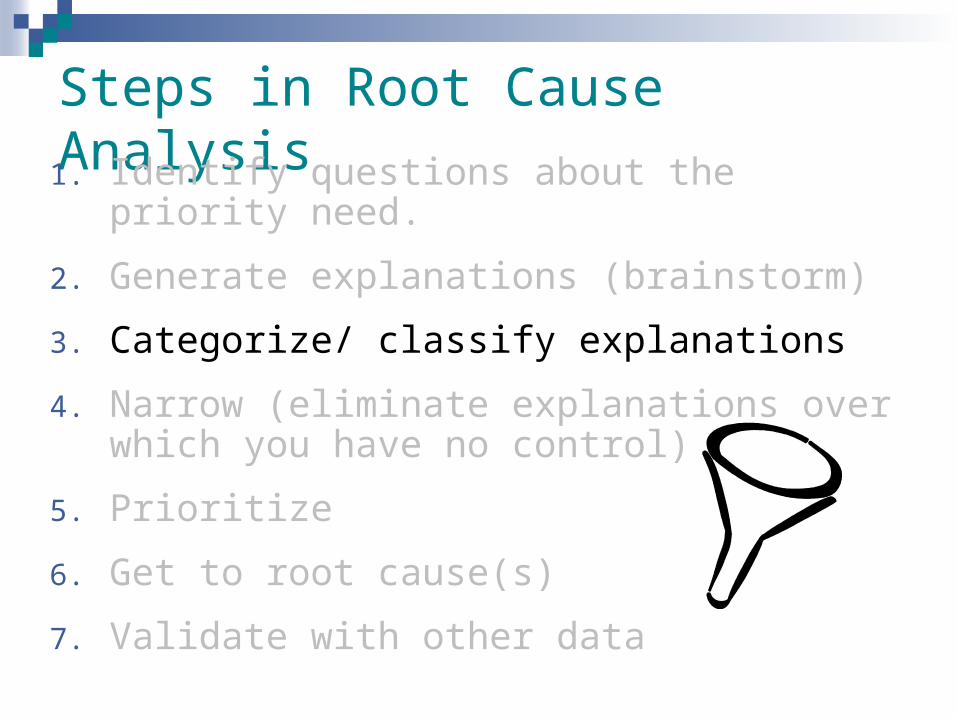
Steps in Root Cause Analysis
1. Identify questions about the priority need.
2. Generate explanations (brainstorm)
3. Categorize/ classify explanations
4. Narrow (eliminate explanations over which you have no control)
5. Prioritize
6. Get to root cause(s)
7. Validate with other data

Background
Read: Levels of Root Cause
Do a “whip around” at your table, sharing one key idea
Can you categorize the explanations you identified by level?
What is helpful about this?
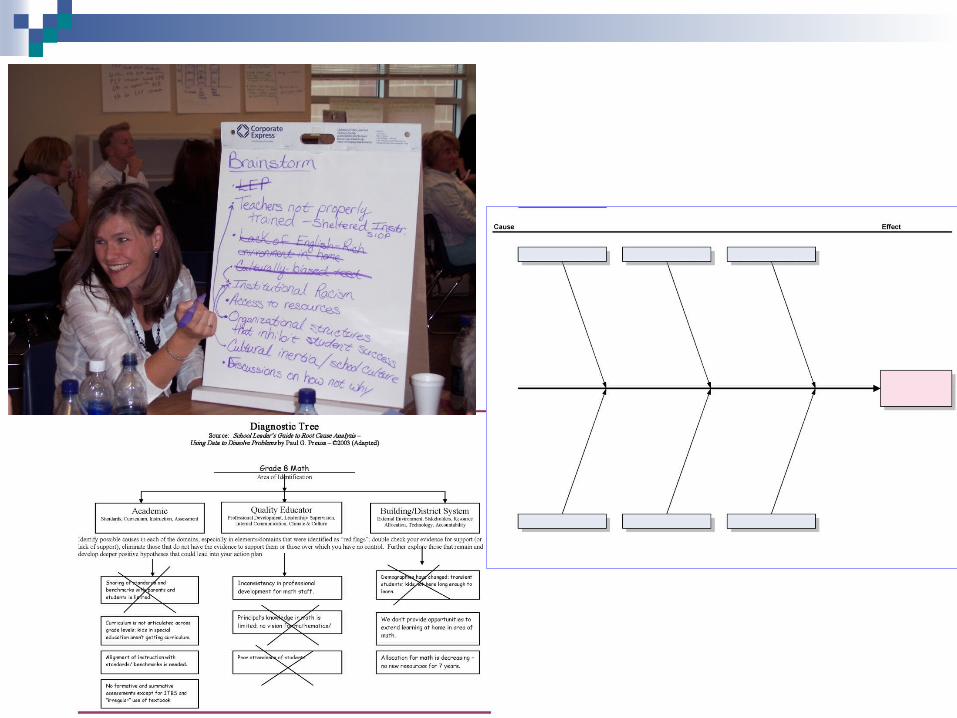
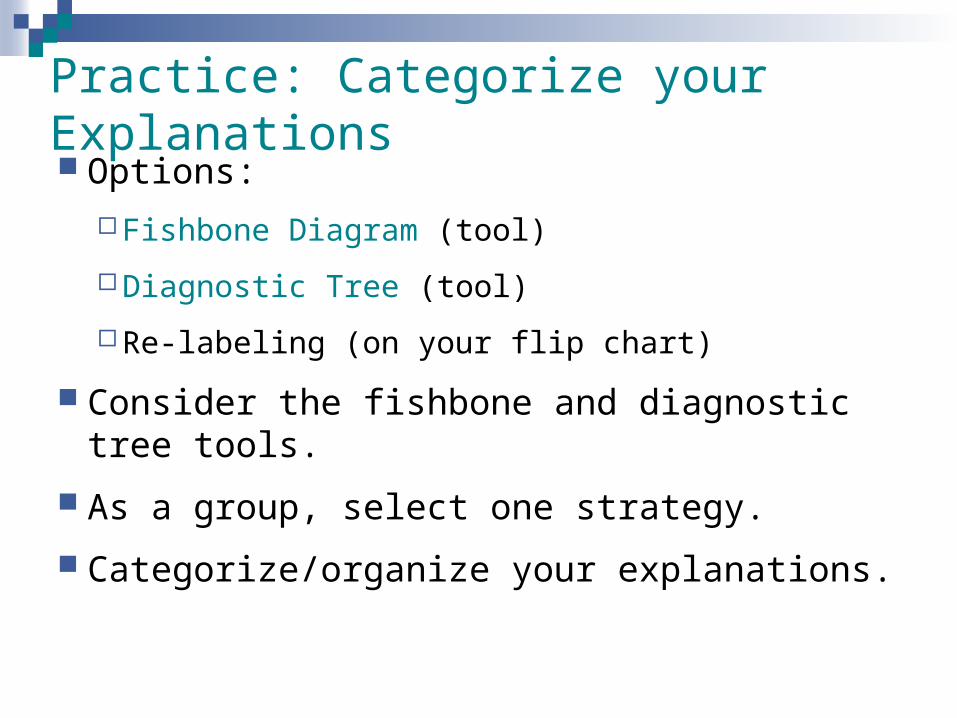
Practice: Categorize your Explanations
Options:
Fishbone Diagram (tool)
Diagnostic Tree (tool)
Re-labeling (on your flip chart)
Consider the fishbone and diagnostic tree tools.
As a group, select one strategy.
Categorize/organize your explanations.
Steps in Root Cause Analysis
1. Identify questions about priority need(s)
2. Generate explanations (brainstorm)
3. Categorize/ classify explanations
4. Narrow (eliminate explanations over which you have no control)
5. Prioritize
6. Get to root cause(s)
7. Validate with other data
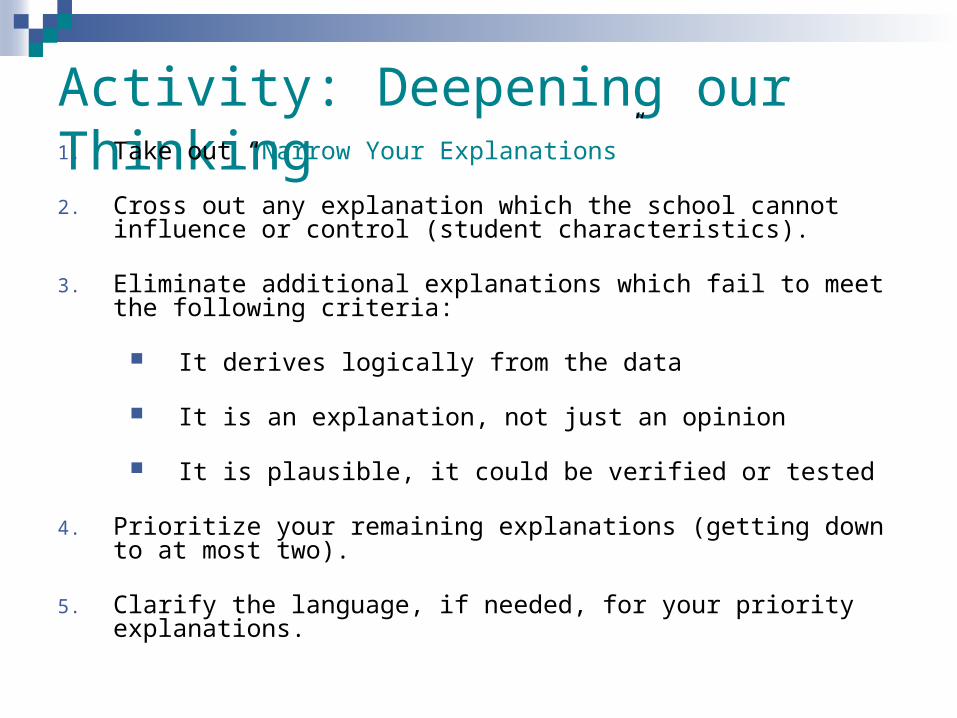
Activity: Deepening our Thinking1. Take out “Narrow Your Explanations”
2. Cross out any explanation which the school cannot influence or control (student characteristics).
3. Eliminate additional explanations which fail to meet the following criteria:
It derives logically from the data
It is an explanation, not just an opinion
It is plausible, it could be verified or tested
4. Prioritize your remaining explanations (getting down to at most two).
5. Clarify the language, if needed, for your priority explanations.
Steps in Root Cause Analysis1. Identify questions priority needs
2. Generate explanations (brainstorm)
3. Categorize/ classify explanations
4. Narrow (eliminate explanations over which you have no control)
5. Prioritize
6. Get to root cause(s)
7. Validate with other data
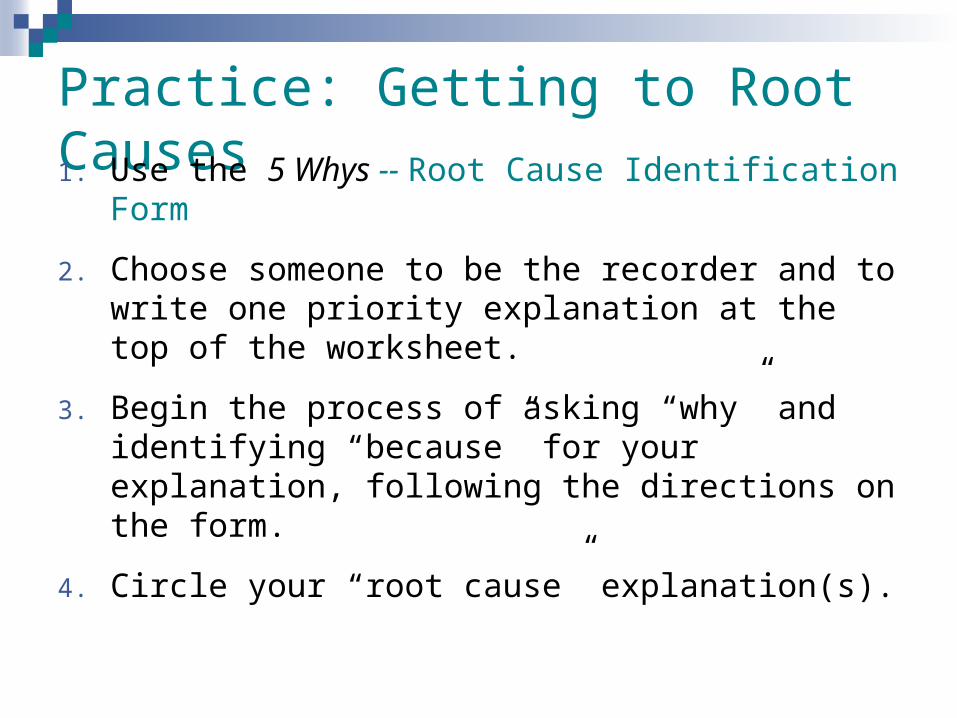
Practice: Getting to Root Causes
1. Use the 5 Whys -- Root Cause Identification Form
2. Choose someone to be the recorder and to write one priority explanation at the top of the worksheet.
3. Begin the process of asking “why” and identifying “because” for your explanation, following the directions on the form.
4. Circle your “root cause” explanation(s).
Practice: Are we at “root cause(s)” Ask the key questions for identifying a root
cause of your explanations Would the problem have occurred if the cause had
not been present? Will the problem reoccur if the cause is corrected or
dissolved? Will correction of dissolution of the cause lead to
similar events?
Make revisions to your root cause explanation if needed.
Steps in Root Cause Analysis
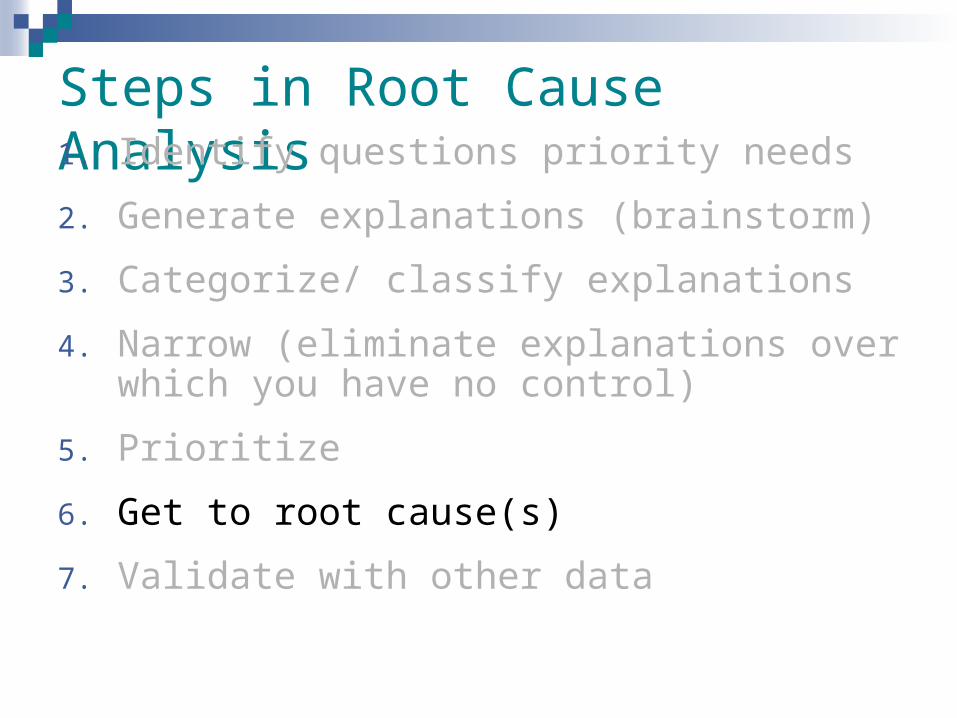
1. Identify questions about priority needs
2. Generate explanations (brainstorm)
3. Categorize/ classify explanations
4. Narrow (eliminate explanations over which you have no control)
5. Prioritize
6. Get to root cause
7. Validate with other data.
What additional information do we need to validate our “root cause” explanations?

Demonstrating the thinking. . .Priority Need Explanations Questions to
ExploreData Sources
School’s reading scores in grades 4 and 5 have declined for 3 years.
K-3 is using new teaching strategies, 4-5 are not.
What strategies are primary vs. intermediate teachers using ?
Curriculum materials and Instructional plans for each grade.
Less time given to direct reading instruction in 4-5
How much time is devoted to reading in primary v. intermediate grades?
Daily schedule in each grade level.
More ELL students in grades 4 & 5
Is there a difference between ELL and other students scores?
NWEA results disaggregated by ELL status.
Activity: Validating Our Theories
1. Use the “Validating with Data” job aide to identify additional data needed to verify your explanations
2. Identify at least two additional data sources that could help validate your explanation.
3. Post a list of your additional data needs to your data wall.
Data Wall Chart
Priority Need:
Root Cause Explanation:
Questions to explore:
Data sources:
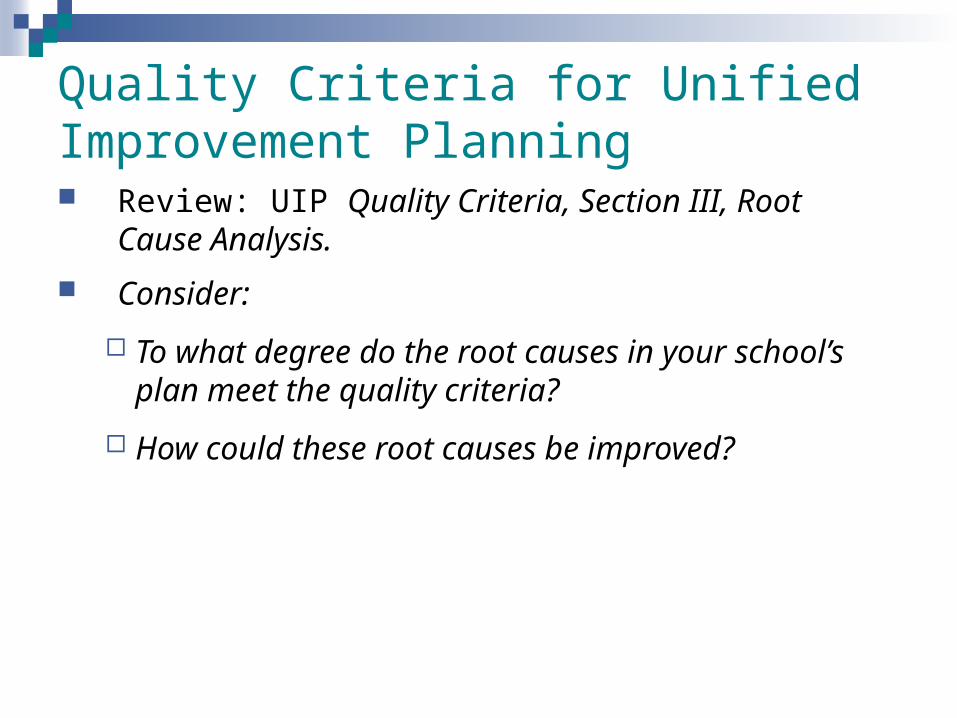
Quality Criteria for Unified Improvement Planning Review: UIP Quality Criteria, Section III, Root Cause
Analysis.
Consider:
To what degree do the root causes in your school’s plan meet the quality criteria?
How could these root causes be improved?

Tools you can useTool/ Resource UseRoot Cause Questions Spur thinking for brainstorming
Levels of Root Causes Support categorizing root causes.
Diagnostic Tree Support organizing and categorizing root causes.
Fishbone Diagram (Blank) Brainstorming in categories
Narrowing Explanations (CTLT, 2009) Apply criteria to eliminate explanations that are not actionable
The five why’s Deepen thinking about root causes
Validate with Data (CTLT, 2009) Identify additional data sources to use to validate root causes
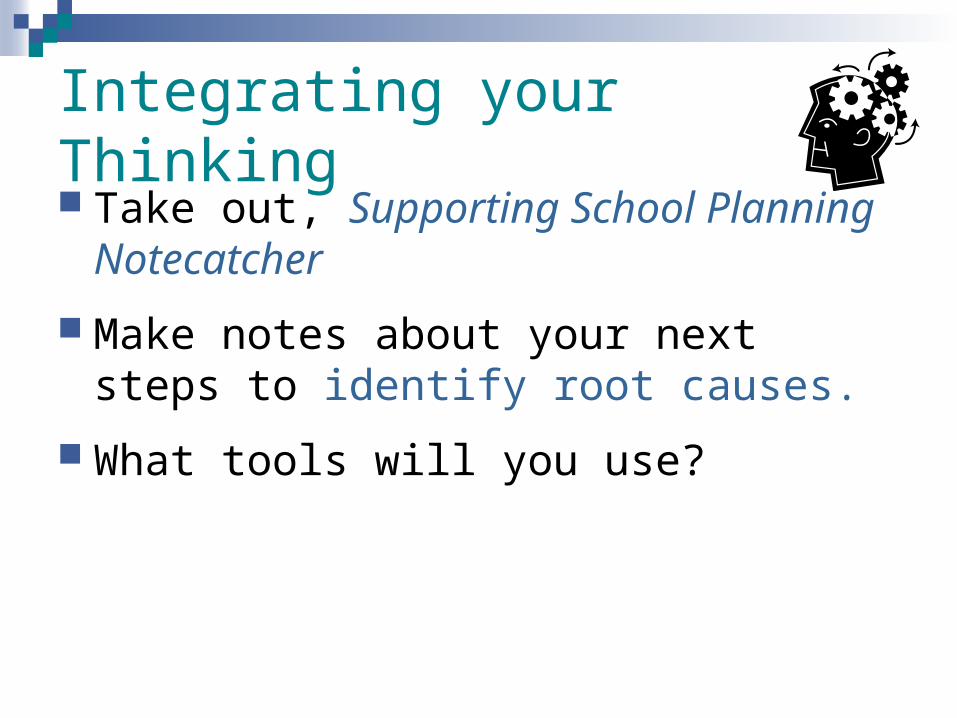
Integrating your Thinking
Take out, Supporting School Planning Notecatcher
Make notes about your next steps to identify root causes.
What tools will you use?
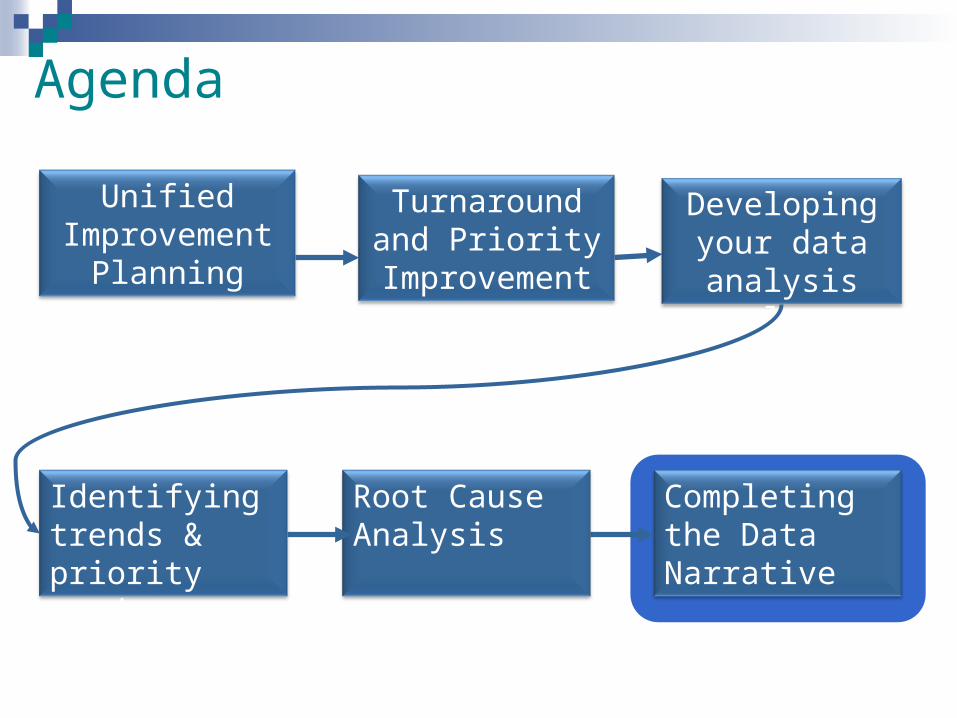
Agenda
Unified Improvement
Planning
Turnaround and Priority
Improvement
Identifying trends & priority needs
Developing your data
analysis plan
Completing the Data Narrative
Root Cause Analysis
Data Narrative Tells the story of the school’s data.
Describes the process in which the school planning team engaged to identify trends, priority needs and root causes.
Identifies data that was analyzed
Provides a Description of: Trend Analysis and Priority Needs
Root Cause Analysis
Verification of Root Causes
Generating a Data Narrative1. Identify critical elements of the data narrative
2. A small group (or individual) generate a draft of data narrative based on data analysis and root causes analysis notes.
3. Reach consensus among all planning participants that the narrative:
tells the “data story” for the school.
meets state criteria
4. Revise data narrative as needed.
Before we meet again
Complete Section III: Data Analysis
Bring:
Data Analysis Worksheet
Data Narrative
Your Feedback!!! Written:
Take out several sticky notes.
Identify additional support needs (one per sticky note)
For the parking lot + the aspects of this session that you liked or worked for you.
The things you will change in your work or would change about this session.
? Questions that you still have
Light bulb: ideas, a-has, innovations
Oral: Your current thinking