understanding why curriculum innovations succeed or fail
TRANSCRIPT
Understanding Why Curriculum InnovationsSucceed or Fail*
Robert K. JamesCollege of Education
Kansas State UniversityManhattan, Kansas 66506
INTRODUCTION
The National Science Foundation (NSF) has recently published the re-sults of three studies (Weiss, I. R., 1979; Helgeson, S. L., BIosser, P. E.,and Howe, R. W., 1978; and Stake, R. E. and Easley 1978) in an at-tempt to answer the question, "What is the status of science education?"Weiss did a survey based on a selected sample of schools. Helgeson,BIosser and Howe completed a study of the literature from 1955 to 1975.Stake and Easely conducted case studies based on school visits. The vo-luminous reports of these studies are readily available, but the answer tothe question about status is not so clear.
Weiss (1978) reports, "A major purpose of this national survey was todetermine the current extent of use of the NSF supported curriculummaterials." The results show that as many as 60% of the school districtsreport "using" one or more of these materials, with 40% "using" morethan one. In no case is one program reported as "used" by more than 25percent of the districts responding, with only 5 of the K-12 projects(ESS, IPS, BSCS (Green), BSCS (Yellow) and Chem Study) being re-ported by more than 12 percent of the schools.One might logically question what is really meant by the term "used"
and the extent to which these projects are actually being implemented. Inany case, it seems obvious that these figures set upper limits for estimatesof implementation and it is likely that if these "uses" were judgedagainst a reasonable standard of the extent of implementation by class-room, that the values would be somewhat less than those reported. Thefact that the data are reported by "district" rather than by classroom,would inflate the percent of "use" since schools "not using" would beincluded in districts who report "using" these programs.What then can be said about the implementation of the programs de-
veloped by NSF? There is a need to ask questions which go beyond thatof "use" as described in the Weiss study. This paper addresses the needto establish the extent to which these programs have been implementedand suggests strategies for measuring that. Further, this paper presents areview of the Concerns Based Adoption Model and describes how the fa-
*Paper Presented At School Science and Mathematics Association, National Convention, November I, 2, & 3, 1979,Kansas City, Missouri.
487
488 School Science and Mathematics
cilitators of science curricula might use that model to gain understandingof the implementation process and better manage implementation ef-forts.
BACKGROUND
The Concerns Based Adoption Model (CBAM) (Hall, Wallace, andDossett, 1973) was developed by the Research and Development Centerat the University of Texas at Austin. This model is based on their exten-sive study of the implementation of educational innovations in schooland college settings.
Stages of Concern
This model grew out of the observations of the late Francis Fuller(1969) in her work on the mental health of student teachers. She observedthat the concerns of student teachers changed in a developmental fashionbeginning with a predominance of concerns about self (<<! wonder if Ican do it?"); moving on to concerns about the task ("I take all night toprepare these lesson plans!"); and finally to impact concerns ("Are thekids learning what they need?").
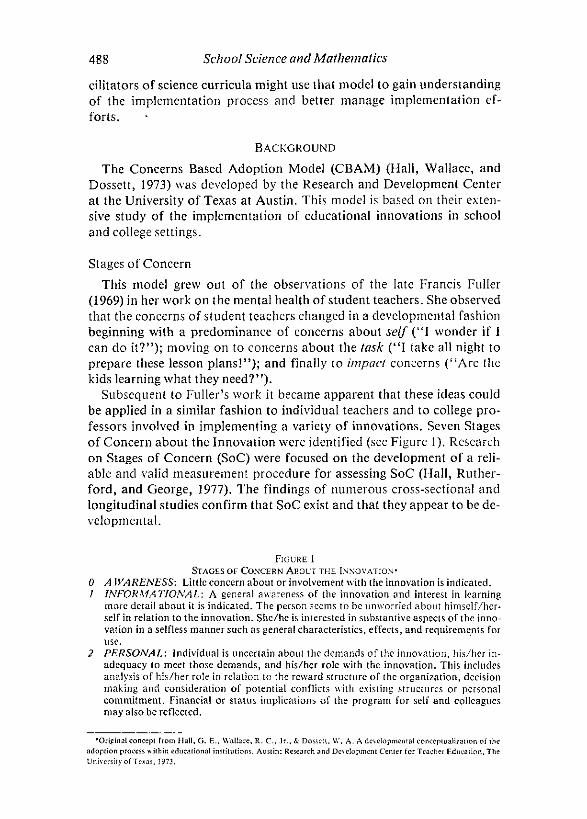
Subsequent to Fuller’s work it became apparent that these ideas couldbe applied in a similar fashion to individual teachers and to college pro-fessors involved in implementing a variety of innovations. Seven Stagesof Concern about the Innovation were identified (see Figure 1). Researchon Stages of Concern (SoC) were focused on the development of a reli-able and valid measurement procedure for assessing SoC (Hall, Ruther-ford, and George, 1977). The findings of numerous cross-sectional andlongitudinal studies confirm that SoC exist and that they appear to be de-velopmental.
FIGURE iSTAGES OF CONCERN ABOUT THE INNOVATION*
0 ABARENESS: Little concern about or involvement with the innovation is indicated.7 INFORMATIONAL: A general awareness of the innovation and interest in learning
more detail about it is indicated. The person seems to be unworried about himself/her-self in relation to the innovation. She/he is interested in substantive aspects of the inno-vation in a selfless manner such as general characteristics, effects, and requirements foruse.
2 PERSONAL: Individual is uncertain about the demands of the innovation, his/her in-adequacy to meet those demands, and his/her role with the innovation. This includesanalysis of his/her role in relation to the reward structure of the organization, decisionmaking and consideration of potential conflicts with existing structures or personalcommitment. Financial or status implications of the program for self and colleaguesmay also be reflected.
^Original concept from Hall, G. E., Wallace, R. C., Jr., & Dosseti, W. A. A developmental conceptualization of theadoption process within educational institutions. Austin: Research and Development Center for Teacher Education, TheUniversity of Texas, 1973.
Curriculum Innovations 489
3 MANAGEMENT: Attention is focused on the processes and tasks of using the innova-tion and the best use of information and resources. Issues related to efficiency, organiz-ing, managing, scheduling, and time demands are utmost.
4 CONSEQUENCE: Attention focuses on impact of the innovation on students inhis/her immediate sphere of influence. The focus is on relevance of the innovation forstudents, evaluation of student outcomes, including performance and competencies,and changes needed to increase student outcomes.
5 COLLABORATION: The focus is on coordination and cooperation with others re-garding use of the innovation.
6 REFOCUSING: The focus is on exploration of more universal benefits from the inno-vation, including the possibility of major changes or replacement with a more powerfulalternative. Individual has definite ideas about alternatives to the proposed or existingform of the innovation.
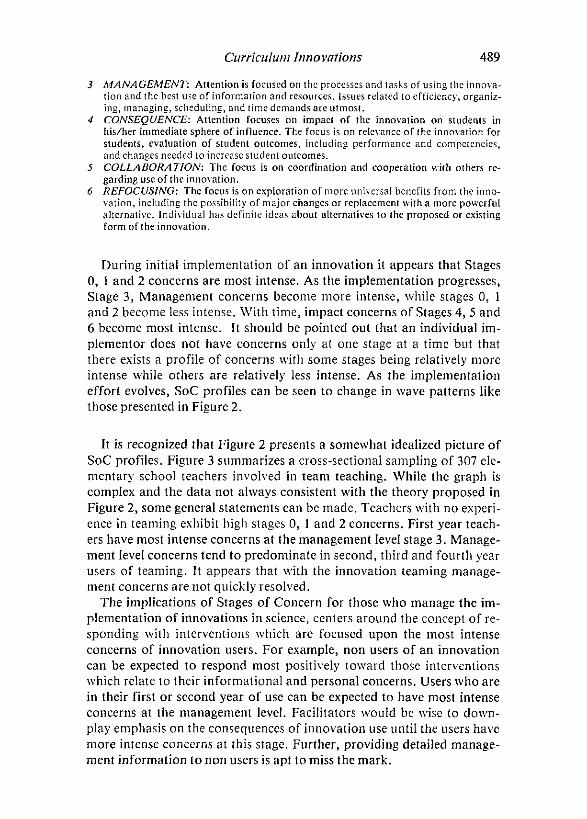
During initial implementation of an innovation it appears that Stages0, 1 and 2 concerns are most intense. As the implementation progresses,Stage 3, Management concerns become more intense, while stages 0, 1and 2 become less intense. With time, impact concerns of Stages 4, 5 and6 become most intense. It should be pointed out that an individual im-plementor does not have concerns only at one stage at a time but thatthere exists a profile of concerns with some stages being relatively moreintense while others are relatively less intense. As the implementationeffort evolves, SoC profiles can be seen to change in wave patterns likethose presented in Figure 2.
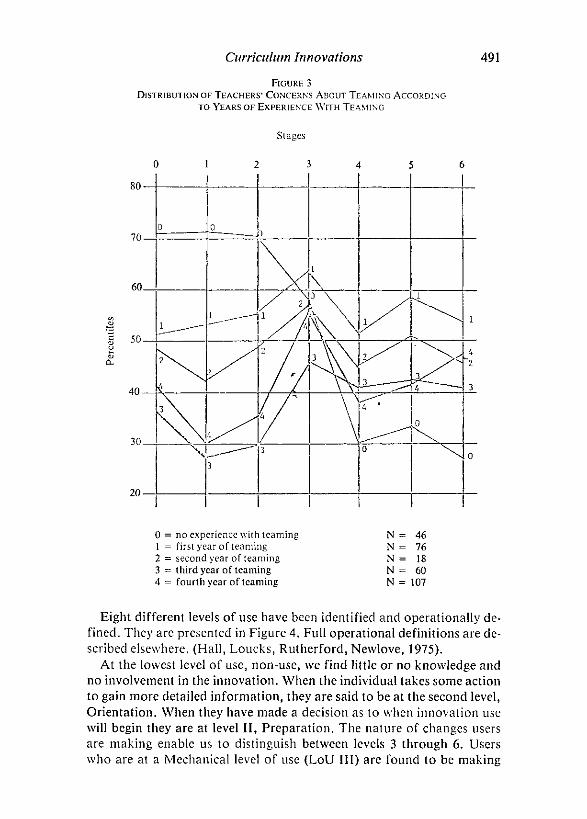
It is recognized that Figure 2 presents a somewhat idealized picture ofSoC profiles. Figure 3 summarizes a cross-sectional sampling of 307 ele-mentary school teachers involved in team teaching. While the graph iscomplex and the data not always consistent with the theory proposed inFigure 2, some general statements can be made. Teachers with no experi-ence in teaming exhibit high stages 0, 1 and 2 concerns. First year teach-ers have most intense concerns at the management level stage 3. Manage-ment level concerns tend to predominate in second, third and fourth yearusers of teaming. It appears that with the innovation teaming manage-ment concerns are not quickly resolved.The implications of Stages of Concern for those who manage the im-
plementation of innovations in science, centers around the concept of re-sponding with interventions which are focused upon the most intenseconcerns of innovation users. For example, non users of an innovationcan be expected to respond most positively toward those interventionswhich relate to their informational and personal concerns. Users who arein their first or second year of use can be expected to have most intenseconcerns at the management level. Facilitators w^uld be wise to down-play emphasis on the consequences of innovation use until the users havemore intense concerns at this stage. Further, providing detailed manage-ment information to non users is apt to miss the mark.
490School Science and Mathematics
FIGURE 2HYPOTHESIZED DEVELOPMENT OF STAGES OF CONCERN
3 4
Stages of Concern= Nonuser= Inexperienced User
-������ = Experienced User�+-+++= Renewing User
Levels of Use
A second key dimension mode of the CBAM deals with how does theteacher behave in relation to the innovation. The SoC dimension focusesupon the users perceptions, feelings, and attitudes. This second part ofthe model, Levels of Use of the innovation (LoU), provides data aboutuser behavior and performance.
Curriculum Innovations 491
FIGURE 3DISTRIBUTION OF TEACHERS’ CONCERNS ABOUT TEAMING ACCORDING
TO YEARS OF EXPERIENCE WITH TEAMING
Stages
0 = no experience with teaming1 = first year of teaming2 = second year of teaming3 = third year of teaming4 = fourth year of teaming
N = 46N = 76N = 18N = 60N = 107
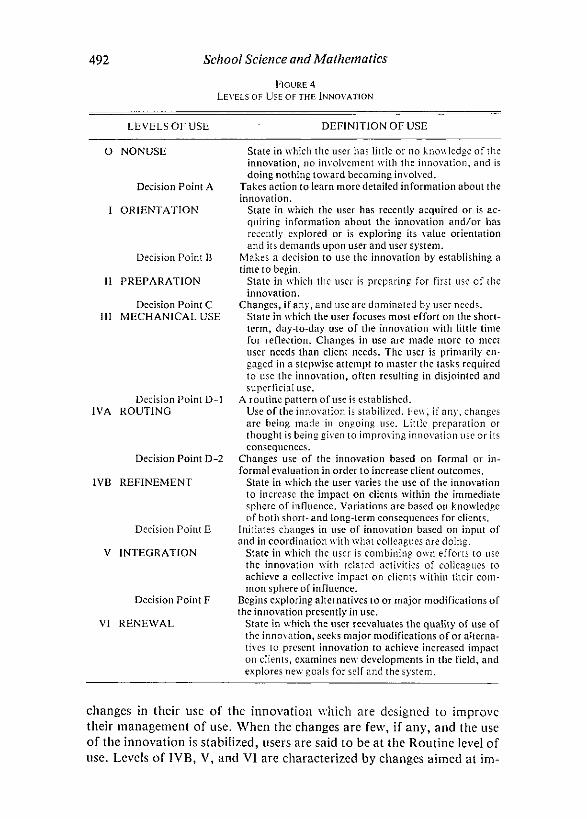
Eight different levels of use have been identified and operationally de-fined. They are presented in Figure 4. Full operational definitions are de-scribed elsewhere. (Hall, Loucks, Rutherford, Newlove, 1975).At the lowest level of use, non-use, we find little or no knowledge and
no involvement in the innovation. When the individual takes some actionto gain more detailed information, they are said to be at the second level,Orientation. When they have made a decision as to when innovation usewill begin they are at level II, Preparation. The nature of changes usersare making enable us to distinguish between levels 3 through 6. Usersw^ho are at a Mechanical level of use (LoU III) are found to be making
492School Science and Mathematics
FIGURE 4LEVELS OF USE OF THE INNOVATION
LEVELS OFUSEDEFINITIONOF USE
0 NONUSE
Decision Point A
I ORIENTATION
Decision Point B
II PREPARATION
Decision Point CIII MECHANICAL USE
Decision Point D-lIVA ROUTING
Decision Point D-2
IVB REFINEMENT
Decision Point E
V INTEGRATION
Decision Point F
VI RENEWAL
State in which the user has little or no knowledge of theinnovation, no involvement with the innovation, and isdoing nothing toward becoming involved.
Takes action to learn more detailed information about theinnovation.State in which the user has recently acquired or is ac-quiring information about the innovation and/or hasrecently explored or is exploring its value orientationand its demands upon user and user system.
Makes a decision to use the innovation by establishing atime to begin.State in which the user is preparing for first use of theinnovation.
Changes, if any, and use are dominated by user needs.State in which the user focuses most effort on the short-term, day-to-day use of the innovation with little timefor reflection. Changes in use are made more to meetuser needs than client needs. The user is primarily en-gaged in a stepwise attempt to master the tasks requiredto use the innovation, often resulting in disjointed andsuperficial use.
A routine pattern of use is established.Use of the innovation is stabilized. Few, if any, changesare being made in ongoing use. Little preparation orthought is being given to improving innovation use or itsconsequences.
Changes use of the innovation based on formal or in-formal evaluation in order to increase client outcomes.State in which the user varies the use of the innovationto increase the impact on clients within the immediatesphere of influence. Variations are based on knowledgeof both short- and long-term consequences for clients.
Initiates changes in use of innovation based on input ofand in coordination with what colleagues are doing.State in which the user is combining own efforts to usethe innovation with related activities of colleagues toachieve a collective impact on clients within their com-mon sphere of influence.
Begins exploring alternatives to or major modifications ofthe innovation presently in use.State in which the user reevaluates the quality of use ofthe innovation, seeks major modifications of or alterna-tives to present innovation to achieve increased impacton clients, examines new developments in the field, andexplores new goals for self and the system.
changes in their use of the innovation which are designed to improvetheir management of use. When the changes are few, if any, and the useof the innovation is stabilized, users are said to be at the Routine level ofuse. Levels of IVB, V, and VI are characterized by changes aimed at im-
Curriculum Innovations 493
proving client outcomes. When those changes are somewhat limited andwithin the immediate sphere of influence, the teacher is said to be at theRefinement level. When the user is combining her efforts with those ofcolleagues to improve impact on clients within the common sphere of in-fluence, the user is said to be at the Integration level. At Level VI,Renewal, the user is re-evaluating the use of the innovation, seekingmodifications or alternatives and exploring new^ goals for self and thesystem.
A focused interview has been developed (Loucks, Newlove and Hall,1975) to measure LoU. The interviewer uses a branched format to probethe subject on the use of the innovation. Based on the informationgathered in the interview and the operational definitions and decisionpoints of LoU, the individual is rated on overall LoU and in seven cate-gories that represent a more detailed breakdown of each of the levels.
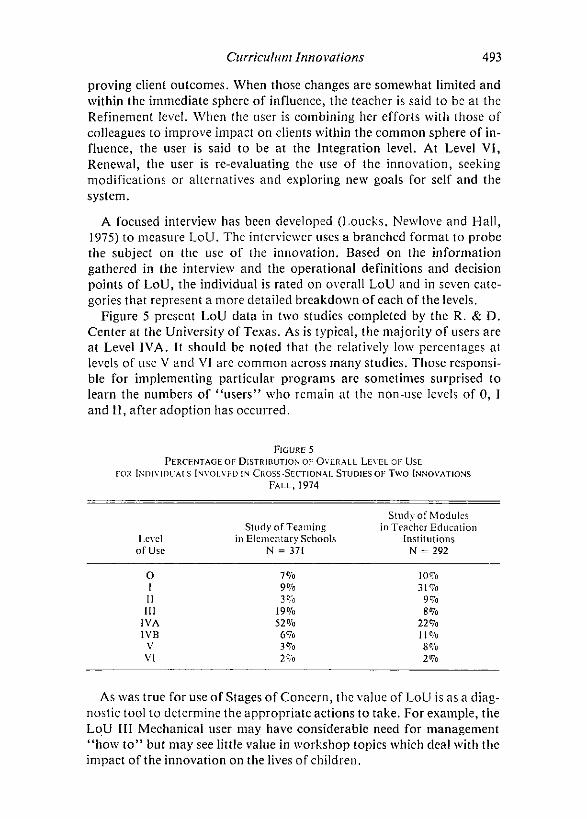
Figure 5 present LoU data in two studies completed by the R. & D.Center at the University of Texas. As is typical, the majority of users areat Level IVA. It should be noted that the relatively low percentages atlevels of use V and VI are common across many studies. Those responsi-ble for implementing particular programs are sometimes surprised tolearn the numbers of "users" who remain at the non-use levels of 0, Iand II, after adoption has occurred.
FIGURE 5PERCENTAGE OF DISTRIBUTION OF OVERALL LEVEL OF USE
FOR INDIVIDUALS INVOLVED IN CROSS-SECTIONAL STUDIES OF TWO INNOVATIONSFALL,1974
Levelof Use
0IIIIIIIVAIVBVVI
Studyin Eleme
N
7%9%3%19%52%6%3%2%
of Teamingntary Schools= 371
Studyin Teach
InsiN
10%31%9%8%22%11%8%2%
of Modulesier Educationtitutions= 292
As was true for use of Stages of Concern, the value of LoU is as a diag-nostic tool to determine the appropriate actions to take. For example, theLoU III Mechanical user may have considerable need for management"how to" but may see little value in workshop topics which deal w^ith theimpact of the innovation on the lives of children.
494 School Science and Mathematics
As science educators, we often make assumptions about the extent ofimplementation. For one large scale study (Hall and Loucks, 1977) it wasclearly documented that 20% of the teachers who were supposedly usingthe innovation were, in fact, non users. By comparison, another studysupposedly involving non users, found that 49% were users. These dataalert us to the fact that assumptions frequently made about innovationuse have little basis in fact.
IMPLICATIONS OF CBAM FOR SCIENCE EDUCATORS
Based on CBAM assumptions (Hall, 1978) and the findings acrossmany studies of implementation, the following items should receive theattention of science educators and those who facilitate implementationof science innovations.
1. Change is a process. It takes time. Therefore, the one or two day workshop cannot
be expected to provide the kind of support necessary to resolve teacher concerns at
the lower levels or to move teachers to a Routine level of use. What is needed is along term plan for implementation including careful monitoring of user concernsand their level of use.
2. Individuals must have changed before institutions change. Therefore, individualsmust be the primary focus of the interventions the change facilitator might make.This implies knowing w^here individuals are with respect to SoC and LoU.
3. Concerns of users of innovations are developmental in nature and can be expected to
move in a wave motion with the peaks of most intense concerns moving from infor-mational/personal through management to consequence and refocusing. This pat-tern may be expected to occur provided the implementation process is managed sothat users resolve their lower stage concerns. If lower stage concerns are not re-solved, it is likely that some combination of personal/management and refocusingconcerns will result in the termination or drastic modification of use of the innova-tion.
4. Teacher to teacher concerns may be expected to vary widely, necessitating the indi-vidualization of the innovation support systems to some degree.
5. In their management of implementation, change facilitators will need to diagnoseStages of Concerns and Levels of Use for "users" and to focus their interventions onthe result of their diagnosis.
The CBAM provides a valuable strategy for understanding and man-aging the change process. Science educators, and educators in general,should examine and use this model in the implementation of new pro-grams.
REFERENCES
FULLER, F. F. Concerns of teachers: a developmental conceptualization. American Educa-tional Research Journal. 1969, 6{2), 207-226.
HALL, GENE E. Concerns-Based Inservice Teacher Training: An Overview of the Concepts,Research and Practice. Austin: Research and Development Center for Teacher Educa-tion, the University of Texas, 1978.
HALL, G. E., GEORGE, A. A., and RUTHERFORD, W. L. Measuring stages of concern aboutthe innovation: a manual for use of the SoC questionnaire. Austin: Research and Devel-opment Center for Teacher Education, the University of Texas, 1977.
Curriculum Innovations 495
HALL, G. E., WALLACE, R. C., and DOSSETT, W. A. A developmental conceptualizationof the adoption process within educational institutions. Austin: Research and Develop-ment Center for Teacher Education, the University of Texas, 1973.
HELGESON, S. L., BLOSSER, P. E., and HOWE, R. N. The Status of Pro-College Science,Mathematics and Social Science Education: 1955-1975: Volume I Science Education (SE78-73 Vol. I). Columbus: Center for the Study of Science and Mathematics Education,the Ohio State University, 1978.
LOUCKS. S. F., NEWLOVE, B. W., and HALL, G. E. Measuring levels of use of the innova-tion: a manual for trainers, interviewers, and raters. Austin: Research and DevelopmentCenter for Teacher Education, the University of Texas, 1975.
STAKE, R. E., and EASLEY, J., et al. Case Studies in Education: Volume I: The Case Re-ports (SE 78-74 Vol. I), Volume //; Design Overview and General Findings (SE 78-74Vol. II). Urbana: Center for Instructional Research and Curriculum Evaluation, Univer-sityoflll., 1978.
WEISS, I. R. Report of the 1977 National Survey of Science, Mathematics and Social Stud-ies Education (SE 78-72). Research Triangle Park, North Carolina: Center for Educa-tional Research, Research Triangle Institute, 1978.
IT’S ALOHA FOR NEUTRINOS
The blue water of Hawaii, a playground for tourists and home of exotic sealife, is now part of an effort to penetrate the mysteries of the universe.
University of Wisconsin-Madison physicists Ugo Camerini, David B. Cline,Robert H. March and graduate student Andrew Szentgyorgi explain that theocean floor close to Hawaii’s beaches will be the location for a device that de-tects neutrinos�subatomic particles similar to electrons that bombard earthfrom space.Most telescopes, including the hand-held kind, detect another kind of particle
called photons. The light that enables us to see consists of photons, as do radiowaves and x-rays. But photons reaching earth have radiated from the surface ofstars and do not reveal much about the interior of stars and other heavenlybodies.
Neutrinos, on the other hand, travel straight from the centers of stars andcores of galaxies to reach earth at the speed of light. These cosmic neutrinos,created by violent nuclear reactions, could supply new data about the structureof the universe. They may be an especially good source of information about twotypes of distant and immensely energetic members of the universe known as qua-sars and Siefert galaxies.
But neutrinos are elusive little particles. Unlike their fellow particles, they canpass through almost anything, making them extremely hard to detect. The few^devices that scientists have built to capture neutrinos coming from the sun relyon many tons of material. They are located in deep mines to screen out interfer-ence by cosmic rays. But even these devices are too small to detect neutrinosfrom elsewhere in the universe."To record neutrinos coming from outside the solar system we need at least 1
million tons of matter," says March. "Seawater is cheap and works well to elim-inate interference."
Hawaii is the proposed site because the ocean floor slants sharply and water isvery deep close to shore, allowing cables to be strung from the underwater ap-paratus to computers on land. An international team of physicists and oceanog-raphers is now trying to determine a specific location for what has becomeknown as DUMAND�Deep Underwater Neutrino Detector.