understanding economics for ncea level three: … · understanding economics for ncea level three:...
TRANSCRIPT

210 x 297
Understanding Economics for NCEA Level Three: Externals1st EditionDan Rennie
Typeset by BookNZ
Any URLs contained in this publication were checked for currency duringthe production process. Note, however, that the publisher cannot vouchfor the ongoing currency of URLs.
AcknowledgementsThank you to the following who assisted in various waysto make this publication possible:- my family - Sue, Nicole, Jacob and Brooke.- Jane for her typing- Sally for proof reading
© 2012 Rennie Resources Ltd
Copyright NoticeCopyright: Apart from fair dealing for the purposes of study, research,criticism or review, or as permitted under Part III of the Copyright Act 1994,no part of this Work may be reproduced, copied, stored in a retrieval system,or transmitted in any form or by any means without prior written permissionof the Publisher. Copyright Licences: Should you wish to make multiplecopies of parts of this Work, you may apply for a licence through theCopyright Licensing Limited (CLL). You will need to supply a remunerationnotice to CLL and pay any fees. These licences are granted subject to strictconditions. For details of CLL licenses and remuneration notices pleasecontact CLL at PO Box 331488, Takapuna, North Shore City 0740. Phone 64 9486 6250, Fax: 64 9 486 6260. Email: [email protected]
For product information and technology assistance,in Australia call 1300 790 853;in New Zealand call 0800 449 725
For permission to use material from this text or product, please [email protected]
National Library of New Zealand Cataloguing-in-Publication DataRennie, Dan, 1959-Understanding economics NCEA level three. Externals / DanRennie.ISBN 978-017023-419-11. Economics. 2. Economics—Problems, exercises, etc.I. Title.330.076—dc 23
Cengage Learning AustraliaLevel 7, 80 Dorcas StreetSouth Melbourne, Victoria Australia 3205
Cengage Learning New ZealandUnit 4B Rosedale Office Park331 Rosedale Road, Albany, North Shore 0632, NZ
For learning solutions, visit cengage.com.au
Printed in China by R R Donnelly.1 2 3 4 5 6 7 16 15 14 13 12

ContentsIntroductionNotes to the studentLearning activities
Achievement Standard 3.1 Demonstrate understanding of the efficiency of market equilibrium (4 credits, external)
1 The economic problem and production possibility curves 6 2 Demand and consumer surplus 16 3 Supply and producer surplus 26 4 Market demand and market supply 36 5 Market equilibrium and changes in the market 43 6 Allocative efficiency 54 7 Sales tax and the market 63 8 Subsidy and the market 74 9 Trade and the market 8410 Price controls and the market 96
Achievement Standard 3.2Demonstrate understanding of the efficiency of different market structures using marginal analysis (4 credits, external)
11 Types of market structure 10512 Strategies that firms use 11313 Revenue curves 11914 Cost and cost curves relationships 12915 Determining profit 14716 The long run for a monopoly 16417 Natural monopoly 17418 The long run for a perfect competitor 185
Achievement Standard 3.5Demonstrate understanding of influences on the New Zealand economy (6 credits, external)
19 Real and nominal values 19420 Circular flow model 20321 Economic growth 21222 The current account 22523 Exchange rates 23424 Aggregate demand and aggregate supply 24325 The AD/AS model 25626 Monetary policy 26627 Fiscal policy 27828 International trade 28929 The Business Cycle 30430 Influences on economic activity 315
PHOTOCOPYING PROHIBITED 978 017023-419-1978 017023-420-7
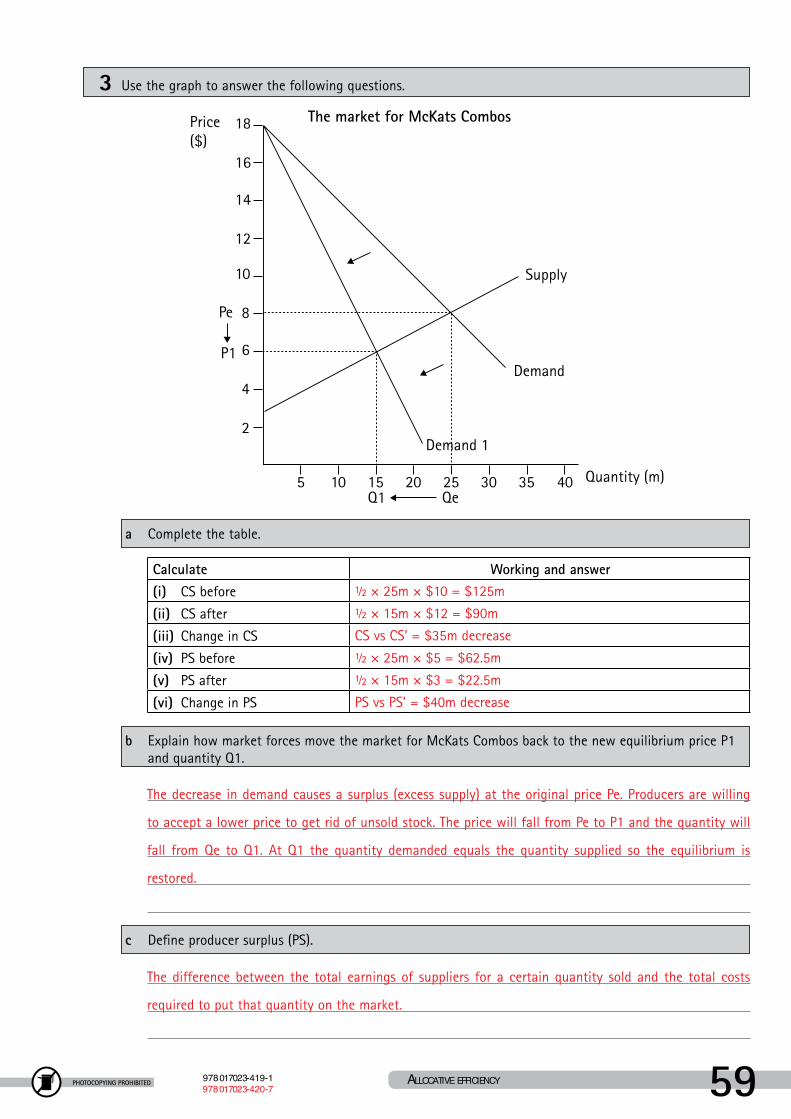
3 Use the graph to answer the following questions.
Pe
QeQ1
Price($)
Quantity (m)
P1
5 10 15 20 25 30 35 40
4
2
6
8
10
12
14
16
18
Supply
The market for McKats Combos
Demand
Demand 1
a Complete the table.
Calculate Working and answer(i) CS before ½ × 25m × $10 = $125m
(ii) CS after ½ × 15m × $12 = $90m
(iii) Change in CS CS vs CS’ = $35m decrease
(iv) PS before ½ × 25m × $5 = $62.5m
(v) PS after ½ × 15m × $3 = $22.5m
(vi) Change in PS PS vs PS’ = $40m decrease
b Explain how market forces move the market for McKats Combos back to the new equilibrium price P1 and quantity Q1.
The decrease in demand causes a surplus (excess supply) at the original price Pe. Producers are willing
to accept a lower price to get rid of unsold stock. The price will fall from Pe to P1 and the quantity will
fall from Qe to Q1. At Q1 the quantity demanded equals the quantity supplied so the equilibrium is
restored.
c Define producer surplus (PS).
The difference between the total earnings of suppliers for a certain quantity sold and the total costs
required to put that quantity on the market.
10 0 17 013190 4 allocaTive efficiency 59

PHOTOCOPYING PROHIBITED978 017023-419-1978 017023-420-7
revIew questIons1 Firms view the resources used to produce goods and services as costs of production. These form part of a
firm’s economic and accounting costs. Compare and contrast economic costs and accounting costs. In your answer you should • Defineaccountingcostsandgiveappropriateexamples. • Defineeconomiccostsandgiveappropriateexamples.
• Explainwhyeconomic cost is greater than accounting cost for some firms than it is for others.
Accounting costs are the actual (or explicit) costs involved in production – mortgage, rent, power, raw
materials, wages, and so on.
Economic costs are the actual (explicit) or accounting costs as well as the opportunity costs (implied or
implicit) of the resources used. Economic costs would include the lost salary of a teacher who starts a lawn-
mowing round. The rent lost by the owner of a factory whose firm currently uses the building is another
economic cost. Economic costs include the lost interest that could have been earned by the owner(s) if they
had the funds in a bank account rather than in a business. Economic costs are always greater than accounting
costs.
Economic costs include accounting costs plus implicit costs. Some producers own a larger proportion of the
resources used than other producers, so their economic costs are much greater than their accounting costs.
cosT and cosT curves relaTionships144
PHOTOCOPYING PROHIBITED978 017023-419-1978 017023-420-7
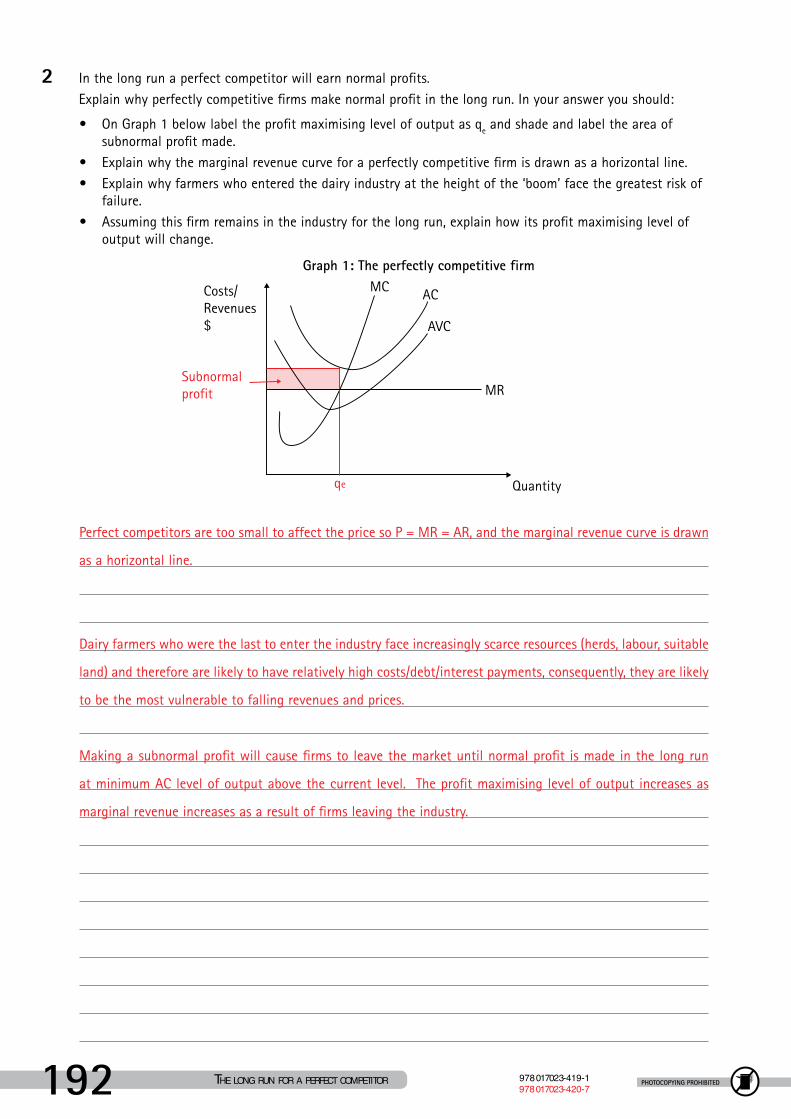
2 In the long run a perfect competitor will earn normal profits. Explain why perfectly competitive firms make normal profit in the long run. In your answer you should:
• OnGraph1belowlabeltheprofitmaximisinglevelofoutputasqe and shade and label the area of subnormal profit made.
• Explainwhythemarginalrevenuecurveforaperfectlycompetitivefirmisdrawnasahorizontalline. • Explainwhyfarmerswhoenteredthedairyindustryattheheightofthe‘boom’facethegreatestriskof
failure. • Assumingthisfirmremainsintheindustryforthelongrun,explainhowitsprofitmaximisinglevelof
output will change.
Quantity
Graph 1: The perfectly competitive firm
Costs/Revenues$
AC
AVC
qe
Subnormalprofit
MC
MR
Perfect competitors are too small to affect the price so P = MR = AR, and the marginal revenue curve is drawn
as a horizontal line.
Dairy farmers who were the last to enter the industry face increasingly scarce resources (herds, labour, suitable
land) and therefore are likely to have relatively high costs/debt/interest payments, consequently, they are likely
to be the most vulnerable to falling revenues and prices.
Making a subnormal profit will cause firms to leave the market until normal profit is made in the long run
at minimum AC level of output above the current level. The profit maximising level of output increases as
marginal revenue increases as a result of firms leaving the industry.
The long run for a perfecT compeTiTor192
PHOTOCOPYING PROHIBITED 978 017023-419-1978 017023-420-7
aggregaTe demand and aggregaTe supply 255
3 Export receipts look set to increase when new free trade agreements are signed … Compare and contrast the impact of increased export receipts on various sectors in the economy. In your
answer you should:
• Explaintheimpactontheproducersector. • Explaintheimpactontheconsumersector.
• Explaintheimpactonthegovernmentsectorandtheoveralllevelofeconomicactivity.
When a free trade agreement is signed export receipts increase as export firms find that demand for their
products increases. As export firms increase production/supply to satisfy increased sales they will need to
employ additional workers or pay existing workers overtime. Export firms are likely to switch production to
the overseas market rather than the domestic market because it is relatively more profitable. Producers in
the export sector may have to offer higher wages to attract the workers they need to increase output. As
confidence in the export sector rises firms are likely to buy new capital to expand their current production, so
investment spending will increase.
Households will have increased income, either as a result of increased employment or because they derive
some income from higher profits. Consumption spending is likely to increase.
The government sector will increase its revenue because of increases in direct tax (from greater employment),
increases in company tax from increasing profits and higher consumption spending will result in increased
GST receipts. Overall as C ↑, I ↑, and X↑ aggregate demand will increase which will cause an increase in real
output GDP (economic growth) and an increase in the general price level (inflation).
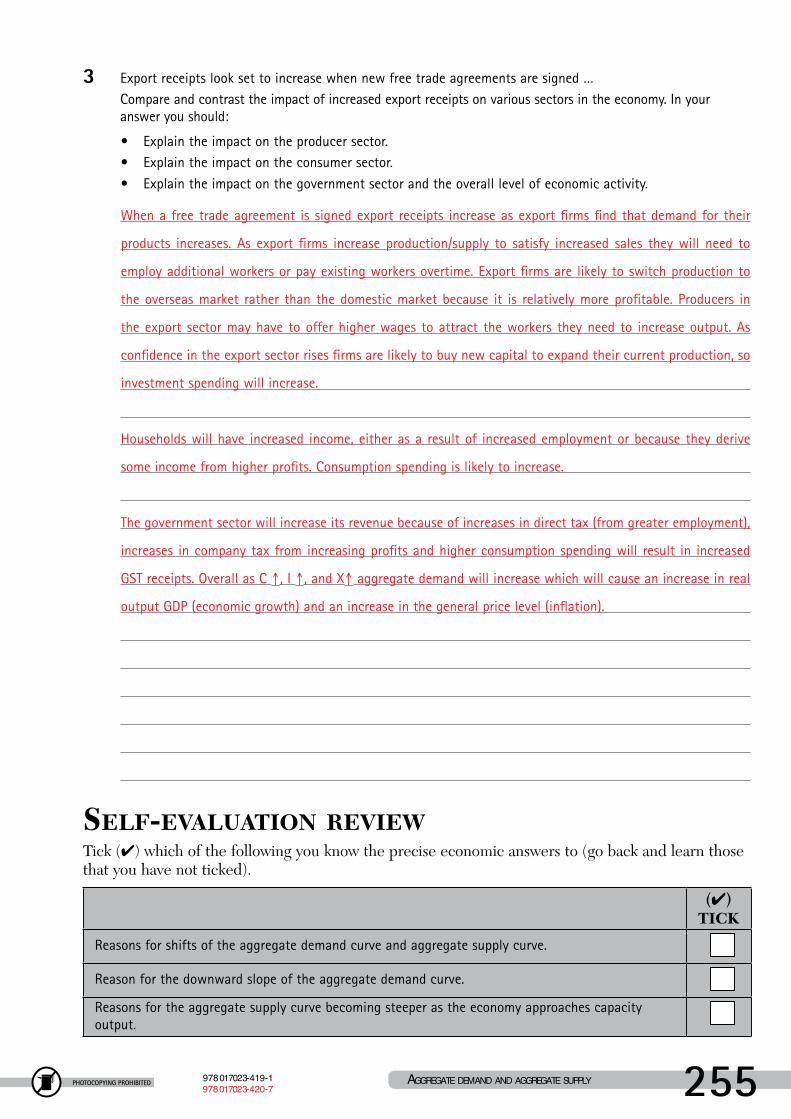
seLf-evaLuatIon revIewTick (✔) which of the following you know the precise economic answers to (go back and learn those that you have not ticked).
(✔)tICK
Reasons for shifts of the aggregate demand curve and aggregate supply curve.
Reason for the downward slope of the aggregate demand curve.
Reasons for the aggregate supply curve becoming steeper as the economy approaches capacity output.