underground water impact report nappamerri trough natural ... · table 3 - atp 855 test production...
TRANSCRIPT
Underground Water Impact Report
Nappamerri Trough Natural Gas ATP 855
Prepared for: Beach Energy Ltd 19 February 2016
Hydrogeologic Pty Ltd
ABN 51 877 660 235
PO Box 383, Highgate
South Australia 5063

Middlemis_2016_UWIR_ATP855.docx 2
SYNOPSIS Queensland petroleum legislation and regulations require tenure holders to monitor water
extraction from oil and gas wells, and prepare an Underground Water Impact Report (UWIR) to
provide information about underground conditions and the effects of water extraction.
Beach Energy completed the Stage 1 exploration and testing program as operator of the Authority
to Prospect 855 (ATP 855), Cooper Basin, south-west Queensland. The Nappamerri Trough Natural
Gas (NTNG) joint venture is investigating a shale gas and basin-centred gas prospect via deep wells
(3350 to 4200 metres) in the Permian sediments of the Cooper Basin, below the regional seal
(aquitard) formed by the thick Nappamerri Group separating the Cooper and Eromanga Basin (GAB)
sediments. Basin-centred gas systems are defined as low-permeability, gas-saturated reservoirs that
are abnormally pressured, regionally pervasive, and lack down-dip water contacts (Law, 2002).
Underground water extractions relating to the NTNG Stage 1 operations in ATP 855 have involved:
production testing from Cooper Basin (Permian) sediments at five sites (Halifax-1, Hervey-1,
Etty-1, Redland-1, and Geoffrey-1); a total of 30 ML was injected and 24 ML extracted
(Keppel-1 was not stimulated but was plugged and abandoned due to high gas flow).
water extractions totalling 68 ML from the 65 m deep sub-artesian Winton Formation
(Eromanga Basin) water supply bore at the Halifax site; of which 20 ML was injected for the
Halifax-1 fracture stimulation and 48 ML was input to the RO treatment plant to generate 28
ML of treated water for stimulation operations spread across the four other sites.
Conservative analytical modelling identifies an affected area of less than 3 km. Monitoring at the
Halifax water bore did not show any pressure or flow effects during test production. There are no
third party bores within 3 km of any Beach site and the nearest GAB springs are more than 200 km
to the south-east. The formations accessed for these extractions are not listed in the Management
Areas/Units and Aquifers for the Central Management Zone under Schedule 4 of the Water Resource
(GAB) Plan 2006. Test production to date has been low volume, and as the timing of future
production testing is very uncertain, a monitoring plan is considered not required.
Nevertheless, Beach commits to reviewing this UWIR annually and to provide a summary of the
outcome of each review to the Chief Executive of the relevant department (DEHP at the time of
writing). The first annual review is scheduled to occur one year after approval of this UWIR, and a
new UWIR will be compiled every 3 years and submitted to DEHP.
This report is submitted in accordance with the Water Act 2000 and it shows that petroleum
operations and the related exercise of underground water rights at ATP 855 have had negligible
impact on underground water in the region. This applies to both the Cooper Basin reservoir unit
from which short term test production has been extracted, and to the shallow aquifers that third
parties might use boreholes from which to extract water. There are no plans to undertake
production or testing in the near future.
Middlemis_2016_UWIR_ATP855.docx 3
CONTENTS
1. INTRODUCTION .............................................................................................. 5
1.1 Basin-Centred Gas and Shale Gas Targets ......................................................... 5
1.2 Nappamerri Trough Natural Gas (NTNG) Project ................................................. 6
1.3 Underground Water Impact Report (UWIR) ........................................................ 7
1.4 Data Sources and Assessment Methods ............................................................. 8
2. PART A – UNDERGROUND WATER EXTRACTIONS ........................................................ 9
2.1 Water Supply for Fracture Stimulation Operations ............................................... 9
2.2 Production Testing Flowback ....................................................................... 10
3. PART B – AQUIFER INFORMATION ........................................................................ 15
3.1 Project Area Physiography .......................................................................... 15
3.2 Cooper / Eromanga Basin Overview ............................................................... 18
3.3 Nappamerri Trough Overview....................................................................... 20
3.4 Great Artesian Basin (GAB) Overview ............................................................. 24
3.5 Shallow Aquifer Systems Overview................................................................. 25
3.6 Groundwater Flow System Characteristics ....................................................... 26
3.6.1 Cooper and GAB Underground Water Level Trends ........................................ 26
3.6.2 NTNG Fracture Stimulation and Production Testing in ATP 855 .......................... 28
3.6.3 Fracture Stimulation Additives ................................................................ 28
3.6.4 Fracture Stimulation Diagnostics ............................................................. 29
3.7 Affected Areas ........................................................................................ 32
3.7.1 Affected Areas due to Cooper Basin Operations ............................................ 32
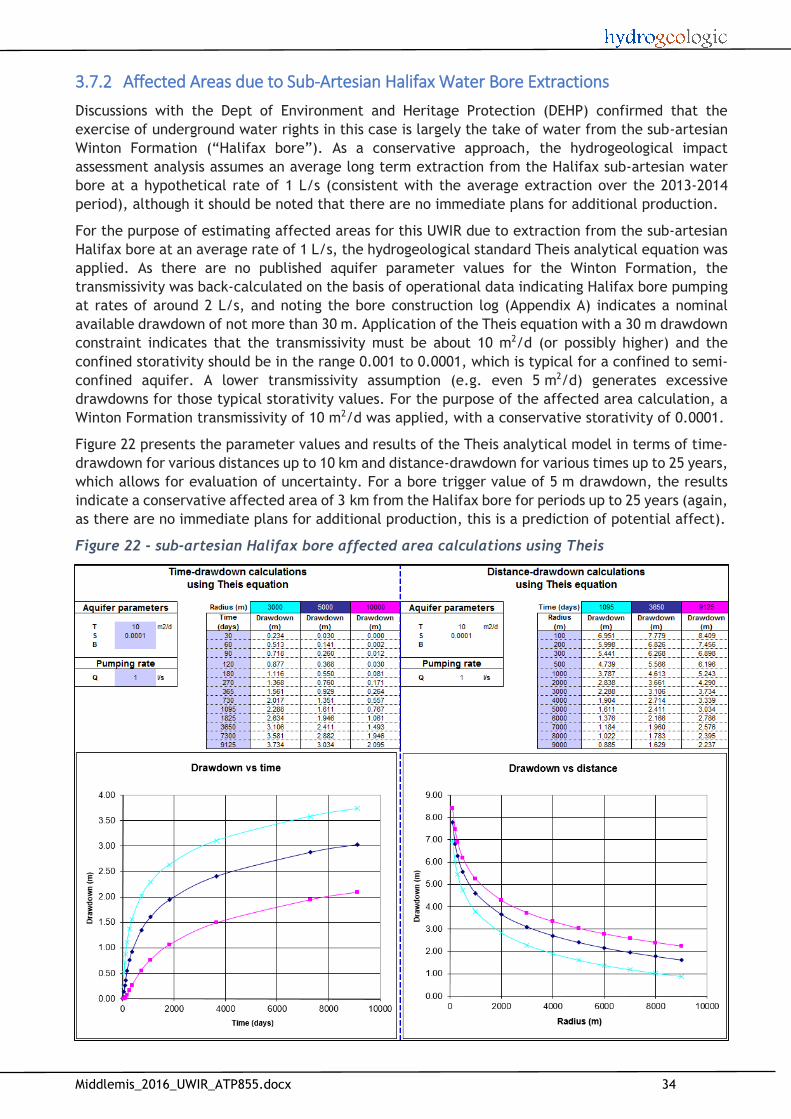
3.7.2 Affected Areas due to Sub-Artesian Halifax Water Bore Extractions .................... 34
4. PART C – MAPPING AFFECTED AREAS .................................................................... 35
5. PART D – WATER MONITORING STRATEGY .............................................................. 38
6. PART E – SPRING IMPACT MANAGEMENT STRATEGY ................................................... 39
7. PART F - CUMULATIVE MANAGEMENT AREA ............................................................ 40
8. REFERENCES ................................................................................................ 41
TABLES
Table 1 – NTNG Stage 1 (ATP 855) summary ............................................................... 7
Table 2 – sub-artesian Halifax water bore (Winton Formation) extractions summary ............. 10
Table 3 - ATP 855 test production summary ............................................................. 11
Table 4 - Porosity and permeability of GAB units in Central Eromanga Basin (CSIRO, 2012a) .... 25
Table 5 - Summary of Diagnostics applied to ATP 855 wells ........................................... 29
Middlemis_2016_UWIR_ATP855.docx 4
FIGURES
Figure 1 – Beach operated ATP 855 tenement and wells (also showing Ex PEL 218 in SA) ........... 5
Figure 2 - Conventional and unconventional play types (after Schenk and Pollastro 2002) ......... 6
Figure 3 - Flowback and production testing process (after Beach, 2012a) .......................... 10
Figure 4 - Halifax-1 fracture stimulation flowback ...................................................... 12
Figure 5 - Hervey-1 fracture stimulation flowback ...................................................... 12
Figure 6 - Etty-1 fracture stimulation flowback ......................................................... 13
Figure 7 - Redland-1 fracture stimulation flowback .................................................... 13
Figure 8 - Geoffrey-1 fracture stimulation flowback.................................................... 14
Figure 9 - ATP 855 gas wells and water bores ........................................................... 16
Figure 10 - ATP 855 and registered GAB springs ......................................................... 17
Figure 11 - Regional Basin structure (after CSIRO, 2012c) ............................................. 18
Figure 12 - Cooper Basin and Eromanga Basin stratigraphy ............................................ 19
Figure 13 – Major structural geological elements of the Nappamerri Trough and Cooper Basin .. 21
Figure 14 - Nappamerri Trough over-pressured character ............................................. 22
Figure 15 - Nappamerri Trough – area of over-pressured character .................................. 23
Figure 16 - Section through Nappamerri Trough showing ATP 855 wells and stimulated units ... 23
Figure 17 - 3D view of GAB showing principal flow paths relatively stagnant in depocentre above
Cooper Basin (after CSIRO 2012b, Figure 8.9) .............................................. 27
Figure 18 - Beach gas well design schematic ............................................................. 28
Figure 19 - Additive components in a typical fracturing operation on a deep shale gas well in the
Cooper Basin (Beach 2012a, Figure 21) ..................................................... 29
Figure 20 - ATP855 Micro-Seismic Event Azimuth ....................................................... 30
Figure 21 - ATP855 Micro-Seismic Event Magnitude ..................................................... 31
Figure 22 - sub-artesian Halifax bore affected area calculations using Theis ....................... 34
Figure 23 - Halifax-1 logger data from pressure buildup test .......................................... 37
APPENDICES
Appendix A – Halifax water bore driller’s log and government bore database tables
Prepared
by:
Hydrogeologic Pty Ltd (ABN 51 877 660 235)
PO Box 383, Highgate, 5063, South Australia
email: [email protected]
mobile: +61 438 983 005
Author Hugh Middlemis, Principal Groundwater Engineer, Hydrogeologic
Version 1.1 17 November 2015 Initial draft for review by client
Version 1.2 2 December 2015 Updated to clarify certain details on testing
Version 1.3 4 December 2015 Updated Tables 5 & 6, Figure 22 and Section 3.6
Version 1.4 11 December 2015 Minor editorial refinements
Version 1.5 19 February 2016 Updated with analytical drawdown assessments on Halifax water bore and other minor edits
THIS REPORT SHOULD BE CITED/ATTRIBUTED AS:
Middlemis, H. (2016). Underground Water Impact Report Nappamerri Trough Natural Gas ATP 855. Prepared by Hydrogeologic for Beach
Energy Ltd. February 2016.

Middlemis_2016_UWIR_ATP855.docx 5
1. INTRODUCTION
Petroleum legislation and associated regulations require that petroleum tenure holders in
Queensland monitor their water extraction from petroleum and gas wells (State of Queensland,
2015), and prepare an Underground Water Impact Report (UWIR) to describe, make predictions
about and manage the impacts of extraction of underground water where production testing or
production is taking place. The UWIR must document the water volumes produced, as well as the
projected production over the next three years.
During the period 2012-2015, Beach Energy has completed Stage 1 of an exploration and production
testing program as operator of the Authority to Prospect 855 (ATP 855), Cooper Basin, south-west
Queensland (Figure 1). The Nappamerri Trough Natural Gas (NTNG) joint venture is investigating the
Permian shale gas and basin-centred gas prospect.
Figure 1 – Beach operated ATP 855 tenement and wells (also showing Ex PEL 218 in SA)
1.1 BASIN-CENTRED GAS AND SHALE GAS TARGETS
The NTNG Stage 1 exploration targets fall within the category of ‘tight’ gas or ‘unconventional’ gas
as they have lower permeability than conventional oil and gas reservoirs (Beach, 2012a). The wells
are located at depths of about 3350 to 4200 metres in the Permian sediments of the Cooper Basin,
below the regional seal (aquitard) formed by the thick Nappamerri Group of the upper Cooper Basin
and underlying the Eromanga Basin (Great Artesian Basin) sediments.
Shale gas, tight gas and basin-centred gas are generally termed as unconventional gas however the
term ‘unconventional’ does not refer to either the gas itself or the methods used to extract it
(Beach, 2012a). There is no difference between gas produced from conventional reservoirs and that
produced from basin-centred or shale gas. The gas is still sourced from organic matter and is natural
gas that can be processed and distributed. The methods of extraction have been in common use for
conventional oil and gas for decades, including in the Cooper Basin.
The difference between conventional and unconventional gas refers to where the gas is found and
produced from underground. Exploration for unconventional targets focuses on shale and tight oil
and gas systems where hydrocarbons have been generated but have not been able to migrate, rather
than on underground structures such as anticlines and highly permeable sandstones that are
targeted by ‘conventional’ gas plays (Figure 2).

Middlemis_2016_UWIR_ATP855.docx 6
Figure 2 - Conventional and unconventional play types (after Schenk and Pollastro 2002)
Due to the very low permeability of the source rock or surrounding strata adjacent to the source,
the gas in unconventional plays becomes regionally trapped by an inability to migrate further, rather
than a geological structure (Figure 2 above depicts the presence of shale gas and basin-centred gas
in a deep trough not confined by a structure). As the gas is not pooled in discrete traps, these
“unconventional” hydrocarbon accumulations are also known as continuous plays. The shales and
tight gas intervals tend to extend over vast distances; in the case of the Nappamerri Trough,
extending over several thousands of square kilometres (Figure 1). In summary, basin-centred gas
systems are defined as low-permeability, gas-saturated reservoirs that are abnormally pressured,
regionally pervasive, and lack down-dip water contacts (Law, 2002).
1.2 NAPPAMERRI TROUGH NATURAL GAS (NTNG) PROJECT
The fracture stimulation of NTNG gas wells involves the injection of fluid, mostly water, to create
small cracks or fractures in the low permeability sandstone and shales formations near the gas well,
which allow gas to flow to the well more easily (Beach, 2012a).
Fracture stimulation of conventional oil and gas reservoirs has been carried out in several hundred
wells in the Cooper Basin since 1968, to improve the commerciality of lower permeability zones.
These are the same formations that Beach is now exploring for basin-centred gas in the Nappamerri
Trough. It is considered to be a relatively routine and low risk component of oil and gas drilling and
well operations in this basin.
Beach has announced (www.beachenergy.com.au) that it considers that the NTNG Stage 1 exploration
phase has achieved its primary technical objectives, including:
Improve the geological understanding and delineate (geographically and vertically) the
target zones (6 wells have been drilled across ATP 855; another 12 wells have been drilled
on SA permit Ex PEL 218)
Test fracture stimulation techniques and technologies for optimal design

Middlemis_2016_UWIR_ATP855.docx 7
Identify and prioritise basin-centred gas play type for future appraisal activities (Daralingie
and Patchawarra sand plays)
Complete short term production testing to flow gas and test deliverability (all wells in ATP
855 flowed gas to surface).
As explained in Section 1.3 below, this UWIR presents information relating to the effects of
underground water extractions in ATP 855.
Table 1 summarises the NTNG Stage 1 program in ATP 855. Beach is reviewing the data and outcomes
with its joint venture partner (Icon Energy), and is preparing the scope and objectives for future
stages of exploration. The Stage 2 exploration scope is planned to be confirmed by late 2016, subject
to ongoing discussions with current and potential future joint venture partners of Beach Energy.
Table 1 – NTNG Stage 1 (ATP 855) summary
ATP 855
Gas Well
[Formation at
Total Depth]
Drilled
Total
Drilled
Depth
(m)
[Cased
Depth
Comp-
letion]
Fracture Stimulation Intervals/Stages,
Formations and Water Source Test Production Date
[Total Volumes of Water
Injected and Produced
via Flowback [ML]]
Patc
haw
arr
a
Murt
ere
e
Epsi
lon
Rose
neath
Dara
lingie
Toola
chee Water Source:
(Halifax Bore,
65m deep,
Winton
Formation)
Halifax-1
[Patchawarra] Dec-12 4266
[4205] 7 1 2 2 1 1 Halifax Bore
Jan-Aug 2013
[19.9 ML injected
15.7 ML flowback]
Hervey-1
[Patchawarra] Sept-14 4269
[3692] 1 - - - 1 3
Halifax bore,
RO treated
Oct-Nov 2014
[3.7 ML injected
2.4 ML flowback]
Etty-1
[Patchawarra] Oct-14 3807
[3354] - - - - 1 3
Halifax bore,
RO treated
Oct-14 – Jan-15
[2.3 ML injected
2.5 ML flowback]
Redland-1
[Daralingie] Oct-14 3804
[3763] - - - - 1 3
Halifax bore,
RO treated
Dec-14
[1.7 ML injected
0.5 ML flowback]
Geoffrey-1
[Patchawarra] Nov-14 4124
[4119] 4 - 1 - - -
Halifax bore,
RO treated
Dec-14 - Jan-15
[2.6 ML injected
2.5 ML flowback]
Keppel-1
[Epsilon] June-13 3898
[plugged] - - - - - - Not stimulated
(Plugged and Abandoned;
well control, high gas
flow)
1.3 UNDERGROUND WATER IMPACT REPORT (UWIR)
Petroleum and gas companies in Queensland do not require a water authorisation under the Water
Act 2000 to take water for fracture stimulation as the industry has a right to underground water
subject to obligations established under Chapter 3 of that legislation. As a result, the Plan (Water
Resource (Great Artesian Basin) Plan 2006) has no role in defining water access arrangements for
the shale gas industry (State of Queensland, 2015).
Middlemis_2016_UWIR_ATP855.docx 8
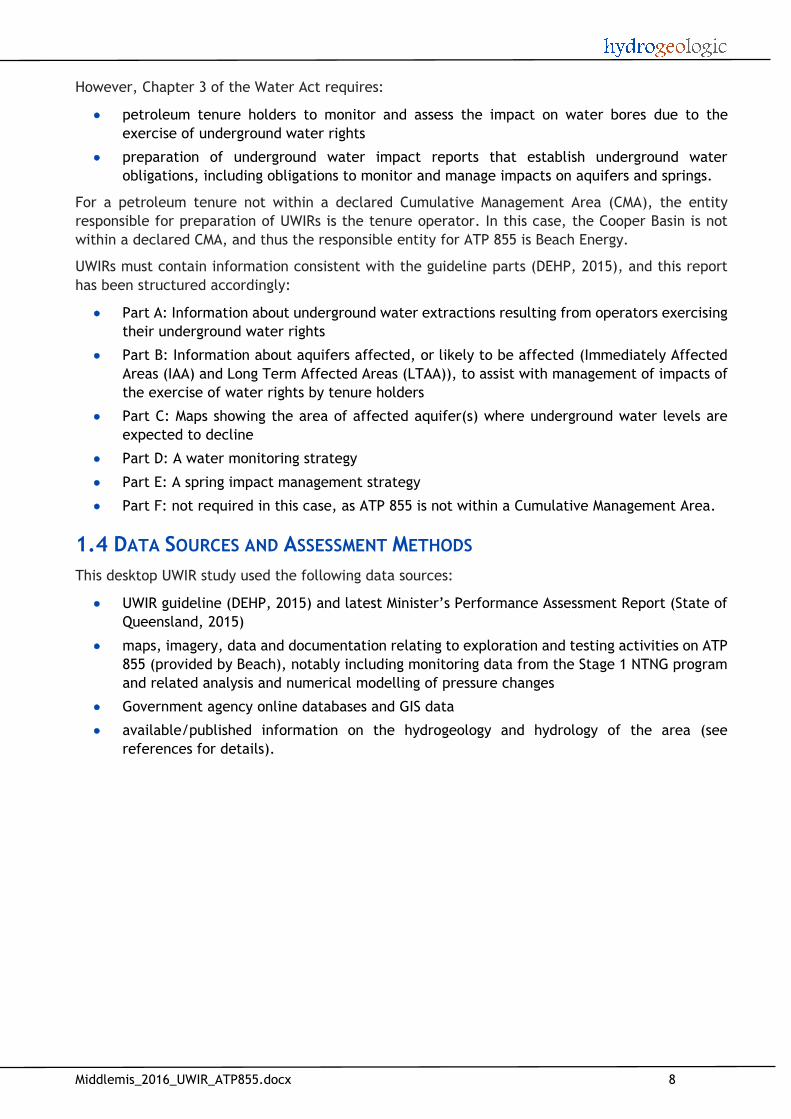
However, Chapter 3 of the Water Act requires:
petroleum tenure holders to monitor and assess the impact on water bores due to the
exercise of underground water rights
preparation of underground water impact reports that establish underground water
obligations, including obligations to monitor and manage impacts on aquifers and springs.
For a petroleum tenure not within a declared Cumulative Management Area (CMA), the entity
responsible for preparation of UWIRs is the tenure operator. In this case, the Cooper Basin is not
within a declared CMA, and thus the responsible entity for ATP 855 is Beach Energy.
UWIRs must contain information consistent with the guideline parts (DEHP, 2015), and this report
has been structured accordingly:
Part A: Information about underground water extractions resulting from operators exercising
their underground water rights
Part B: Information about aquifers affected, or likely to be affected (Immediately Affected
Areas (IAA) and Long Term Affected Areas (LTAA)), to assist with management of impacts of
the exercise of water rights by tenure holders
Part C: Maps showing the area of affected aquifer(s) where underground water levels are
expected to decline
Part D: A water monitoring strategy
Part E: A spring impact management strategy
Part F: not required in this case, as ATP 855 is not within a Cumulative Management Area.
1.4 DATA SOURCES AND ASSESSMENT METHODS
This desktop UWIR study used the following data sources:
UWIR guideline (DEHP, 2015) and latest Minister’s Performance Assessment Report (State of
Queensland, 2015)
maps, imagery, data and documentation relating to exploration and testing activities on ATP
855 (provided by Beach), notably including monitoring data from the Stage 1 NTNG program
and related analysis and numerical modelling of pressure changes
Government agency online databases and GIS data
available/published information on the hydrogeology and hydrology of the area (see
references for details).

Middlemis_2016_UWIR_ATP855.docx 9
2. PART A – UNDERGROUND WATER EXTRACTIONS
The NTNG Stage 1 program in ATP 855 involved fracture stimulation activities at Halifax-1, Hervey-1,
Etty-1, Redland-1, and Geoffrey-1, in that order (see Figure 1 and Table 1 previously). Production
testing was also undertaken at these five sites. At the sixth site, Keppel-1 was drilled but then was
plugged and abandoned.
Underground water extractions relating to the NTNG Stage 1 operations in ATP 855 have involved:
production testing from the deep (Permian) sediments of the Cooper Basin at five sites
extractions totalling 68 ML over two years (2013-2014) from the 65 m deep sub-artesian
(Winton Formation) water supply bore at Halifax.
The formations accessed for these extractions are not listed in the Management Areas, Management
Units and Aquifers for the Central Management Zone under Schedule 4 of the Water Resource (Great
Artesian Basin) Plan 2006.
There has been no full scale production to date, and there are no immediate plans for additional
production testing from ATP 855.
Discussions with the Department of Environment and Heritage Protection (DEHP) regarding the
development of UWIRs for unconventional exploration activities have confirmed that the exercise
of underground water rights in this case is largely the take of water from the sub-artesian Winton
Formation (“Halifax bore”), and that this should be the focus of this UWIR. Hence, this report
incorporates a hydrogeological impact assessment analysis (section 3.7) assuming a hypothetical
average extraction from the Halifax sub-artesian water bore of 1 L/s, although there are no
immediate plans for additional production. The other information presented herein on the fracture
stimulation operations is retained for completeness.
2.1 WATER SUPPLY FOR FRACTURE STIMULATION OPERATIONS
The 65 m deep (Winton Formation) sub-artesian water supply bore at the Halifax site (“Halifax
bore”) was used as the source water for the five stimulation treatments on ATP 855. Extractions
from the sub-artesian Halifax bore do not have potential to materially impact on GAB bores or
springs given the low volumes involved and horizontal and vertical isolation factors (more detailed
assessment of Affected Areas is provided later in section 3.7):
the Halifax site is the most westerly of the ATP 855 wells, located about 7 km from the SA
border, and hence is very remote from the nearest registered GAB springs (which are in
excess of 200 km away), as shown later in Figure 10
the Halifax bore is completed in the Winton Formation to a depth of about 65 m (see
Appendix A); extraction rates lie in the range 1-5 L/s for intermittent periods within a total
period of 2 years, totalling 68 ML to date (i.e. averaging 1 L/s over 2 years)
the shallow sub-artesian Winton formation is vertically isolated from the main GAB aquifers
that occur between about 1700 m and 2300 m depth (at Halifax-1) by the aquitard units of
the Mackunda Formation and Allaru Mudstone, and notably by the 300-400 m thick regional
seal (aquitard) of the Wallumbilla Formation (Bulldog Shale).
The total dissolved solids (TDS) in the Halifax bore water ranges from 12,300 to 13,100 mg/L (i.e.
suitable for industrial purposes only). For the first stimulation stage at Halifax-1 (14 stages in total),
the sub-artesian Halifax bore source water was not treated.
To reduce scale buildup even further, a RO water treatment plant was commissioned. As the Halifax
bore water quality was deemed to be as good as if not better than that from the other shallow bores
drilled in ATP 855, it was used as the RO feed water. The RO permeate (treated) water had a salinity

Middlemis_2016_UWIR_ATP855.docx 10
of 50-100 mg/L TDS (equivalent to rainfall) and was used in the fracture stimulation treatments at
the other sites. A total of 68 ML was extracted from the sub-artesian Halifax water bore for the
NTNG Stage 1 program. The RO permeate was stored in additional ponds constructed on site at
Halifax. Treated water was trucked to water holding ponds at the other four sites (Hervey-1, Etty-
1, Redland-1, and Geoffrey-1) for use in the fracture stimulation operations. The RO plant was
decommissioned on 2 November 2014.
The fracture stimulation and production testing activities for the NTNG Stage 1 operation since 2012
were summarised previously in Table 1. The total water volume extracted from the sub-artesian
Halifax bore (Winton Formation) to support these activities amounts to 68 ML (Table 2), based on
analysis of RO plant daily reports and fracture stimulation operation reports.
Table 2 – sub-artesian Halifax water bore (Winton Formation) extractions summary
Extraction from sub-artesian Halifax water bore Period Volume (ML)
Untreated volume injected to Halifax-1 January to August 2013 20
Metered volumes of RO permeate produced for treatments at: Hervey-1, Etty-1, Redland-1, and Geoffrey-1
August to November 2014 28
RO reject (estimated at 70% of permeate volume) August to November 2014 20
Total extracted from sub-artesian Halifax water bore January 2013 to January 2015 68
2.2 PRODUCTION TESTING FLOWBACK
Production testing was undertaken following installation of the tubing string in the gas well. As the
initial flow back was predominantly recovered stimulation fluid, production was directed to a lined
pond adjacent to the flare pit well (Figure 3, after Beach 2012a). Once the well began to recover
gas, the flow was directed to the separator. The gas from the top of the separator was metered and
sent to the flare where it was burnt. The water from the bottom of the separator was metered and
directed to one of the lined temporary water storage ponds used to hold water for the fracture
treatment. The gas stream was sampled for composition and contaminants. The recovered water
was also sampled on a regular basis to evaluate its composition, and samples were also obtained
from lined storage ponds for analysis.
Figure 3 - Flowback and production testing process (after Beach, 2012a)
During the flowback period the rate of production of the recovered fluid gradually reduced, as
shown in the time series plots of Figure 4 to Figure 8 for each of the wells in ATP 855 (in chronological
order of testing). The volumes involved are summarised (in ML) in Table 3. The following conclusions
may be drawn:
Middlemis_2016_UWIR_ATP855.docx 11
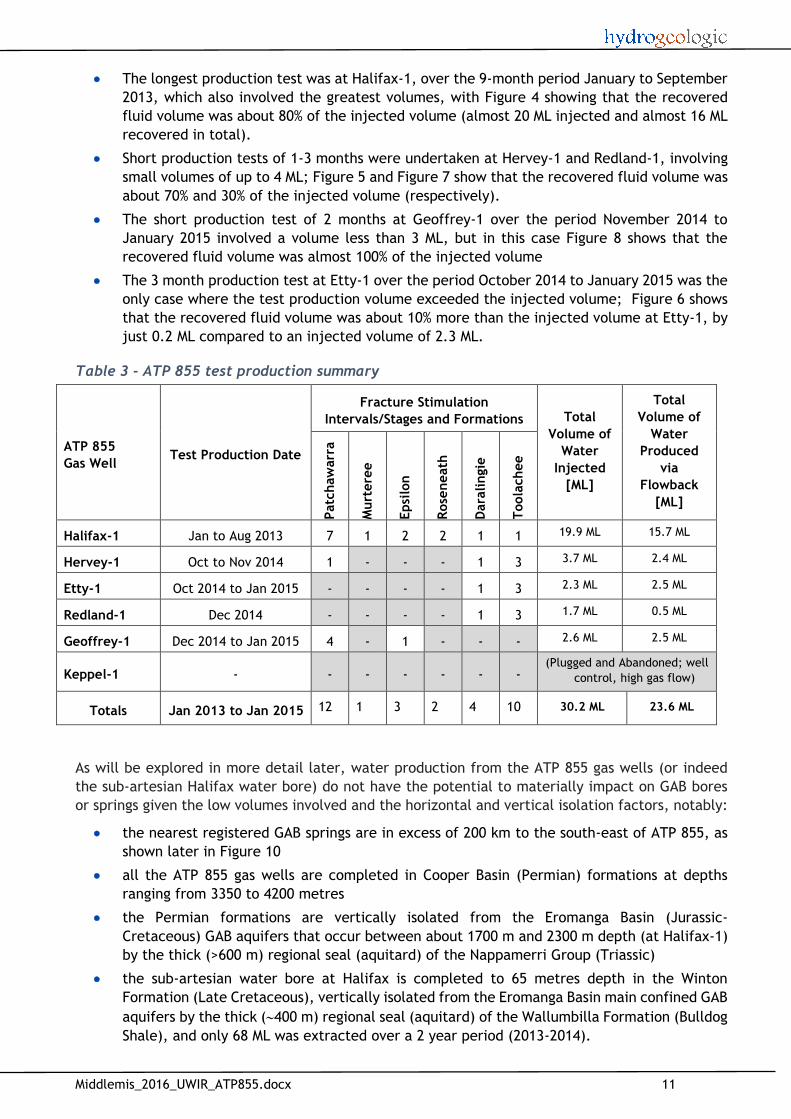
The longest production test was at Halifax-1, over the 9-month period January to September
2013, which also involved the greatest volumes, with Figure 4 showing that the recovered
fluid volume was about 80% of the injected volume (almost 20 ML injected and almost 16 ML
recovered in total).
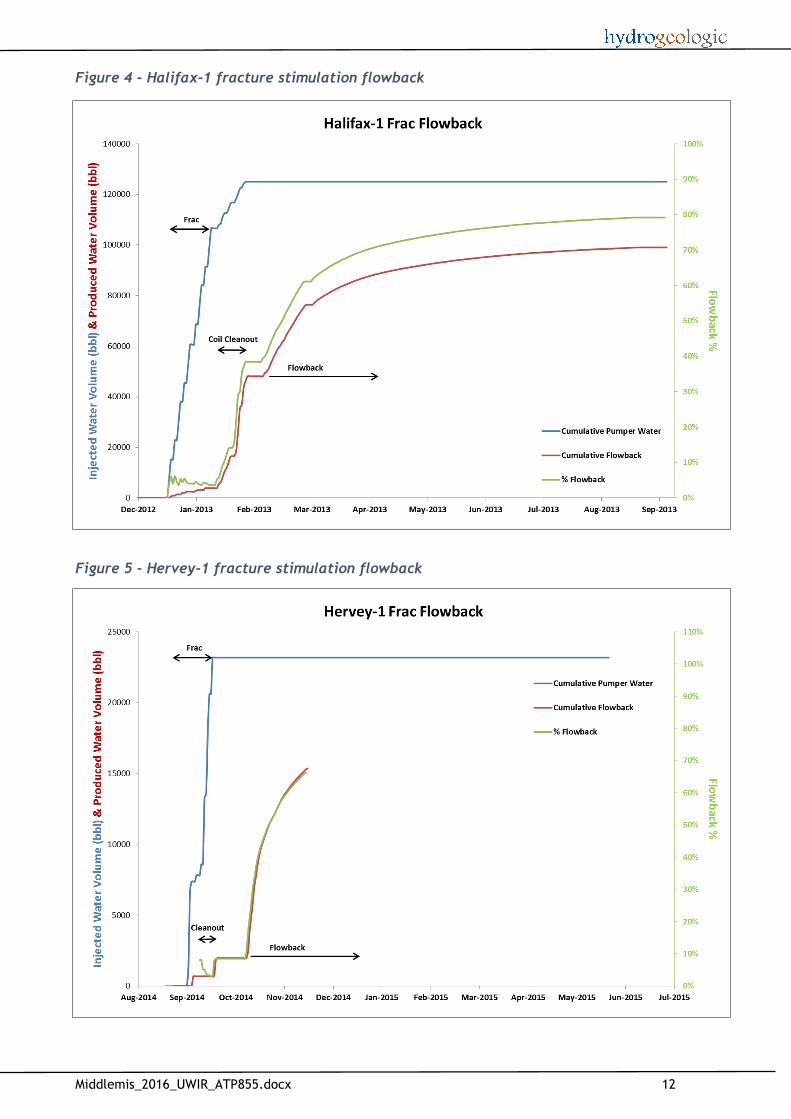
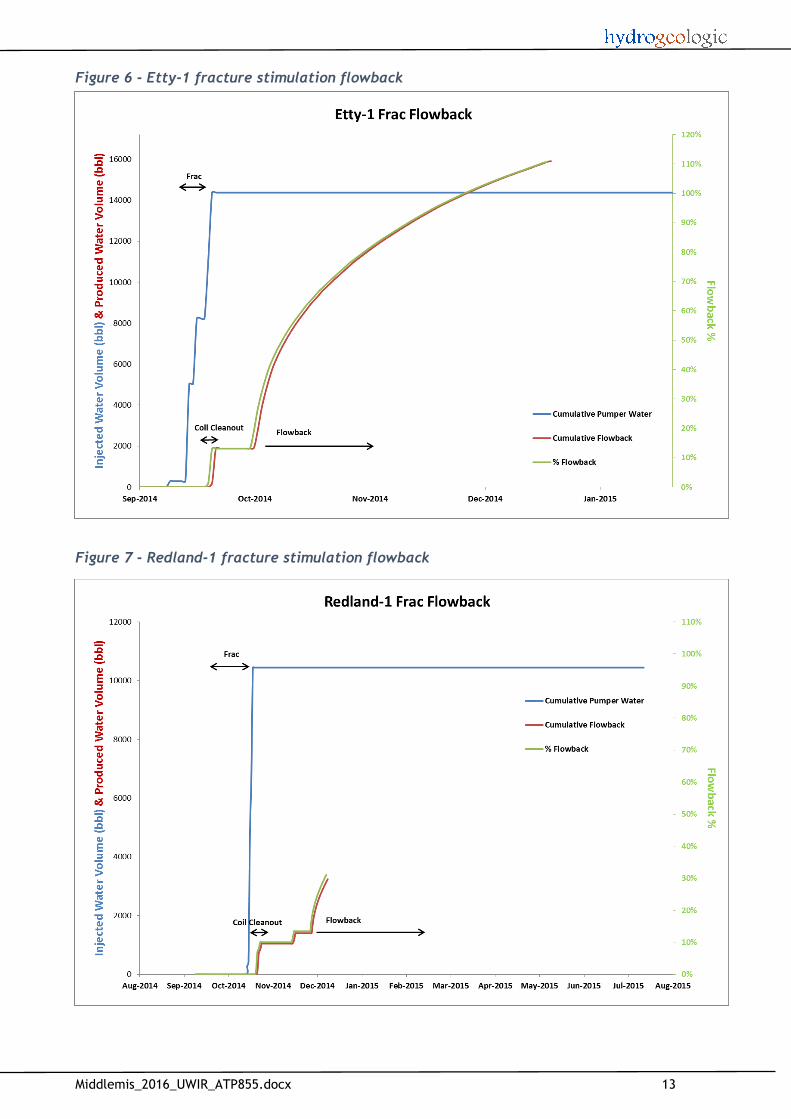
Short production tests of 1-3 months were undertaken at Hervey-1 and Redland-1, involving
small volumes of up to 4 ML; Figure 5 and Figure 7 show that the recovered fluid volume was
about 70% and 30% of the injected volume (respectively).
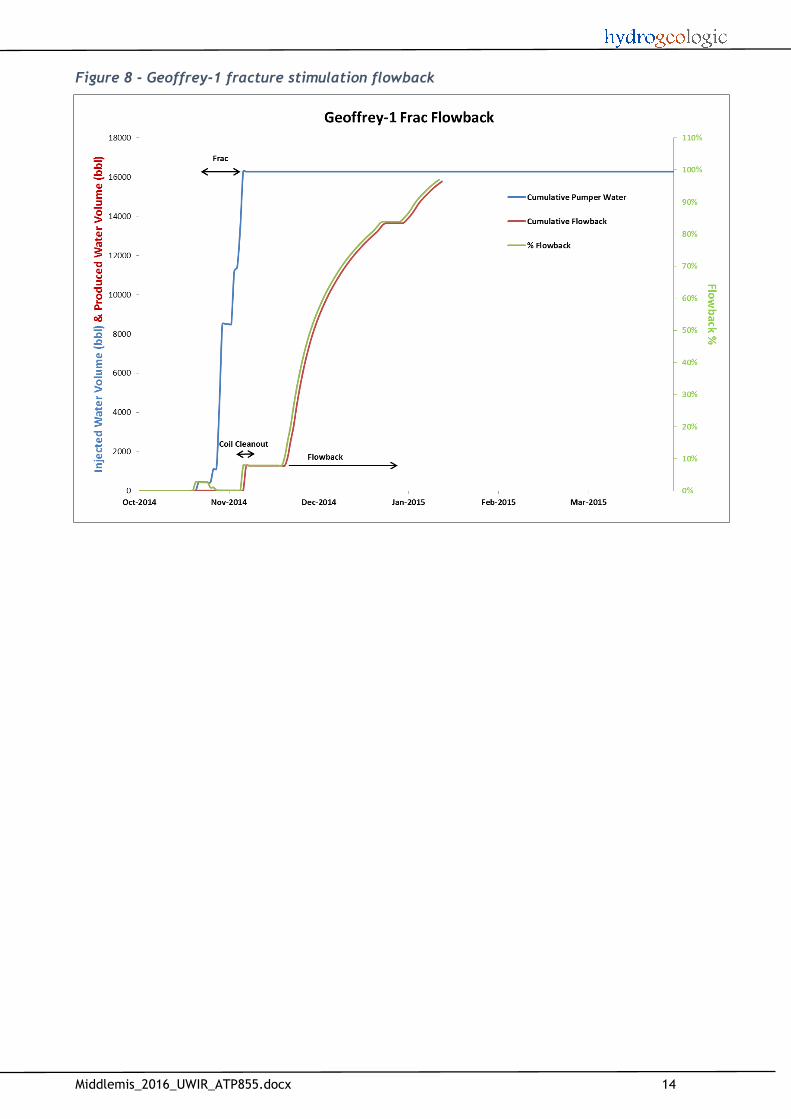
The short production test of 2 months at Geoffrey-1 over the period November 2014 to
January 2015 involved a volume less than 3 ML, but in this case Figure 8 shows that the
recovered fluid volume was almost 100% of the injected volume
The 3 month production test at Etty-1 over the period October 2014 to January 2015 was the
only case where the test production volume exceeded the injected volume; Figure 6 shows
that the recovered fluid volume was about 10% more than the injected volume at Etty-1, by
just 0.2 ML compared to an injected volume of 2.3 ML.
Table 3 - ATP 855 test production summary
ATP 855
Gas Well Test Production Date
Fracture Stimulation
Intervals/Stages and Formations Total
Volume of
Water
Injected
[ML]
Total
Volume of
Water
Produced
via
Flowback
[ML]
Patc
haw
arr
a
Murt
ere
e
Epsi
lon
Rose
neath
Dara
lingie
Toola
chee
Halifax-1 Jan to Aug 2013 7 1 2 2 1 1 19.9 ML 15.7 ML
Hervey-1 Oct to Nov 2014 1 - - - 1 3 3.7 ML 2.4 ML
Etty-1 Oct 2014 to Jan 2015 - - - - 1 3 2.3 ML 2.5 ML
Redland-1 Dec 2014 - - - - 1 3 1.7 ML 0.5 ML
Geoffrey-1 Dec 2014 to Jan 2015 4 - 1 - - - 2.6 ML 2.5 ML
Keppel-1 - - - - - - - (Plugged and Abandoned; well
control, high gas flow)
Totals Jan 2013 to Jan 2015 12 1 3 2 4 10 30.2 ML 23.6 ML
As will be explored in more detail later, water production from the ATP 855 gas wells (or indeed
the sub-artesian Halifax water bore) do not have the potential to materially impact on GAB bores
or springs given the low volumes involved and the horizontal and vertical isolation factors, notably:
the nearest registered GAB springs are in excess of 200 km to the south-east of ATP 855, as
shown later in Figure 10
all the ATP 855 gas wells are completed in Cooper Basin (Permian) formations at depths
ranging from 3350 to 4200 metres
the Permian formations are vertically isolated from the Eromanga Basin (Jurassic-
Cretaceous) GAB aquifers that occur between about 1700 m and 2300 m depth (at Halifax-1)
by the thick (>600 m) regional seal (aquitard) of the Nappamerri Group (Triassic)
the sub-artesian water bore at Halifax is completed to 65 metres depth in the Winton
Formation (Late Cretaceous), vertically isolated from the Eromanga Basin main confined GAB
aquifers by the thick (400 m) regional seal (aquitard) of the Wallumbilla Formation (Bulldog
Shale), and only 68 ML was extracted over a 2 year period (2013-2014).
Middlemis_2016_UWIR_ATP855.docx 12
Figure 4 - Halifax-1 fracture stimulation flowback
Figure 5 - Hervey-1 fracture stimulation flowback
Middlemis_2016_UWIR_ATP855.docx 13
Figure 6 - Etty-1 fracture stimulation flowback
Figure 7 - Redland-1 fracture stimulation flowback
Middlemis_2016_UWIR_ATP855.docx 14
Figure 8 - Geoffrey-1 fracture stimulation flowback

Middlemis_2016_UWIR_ATP855.docx 15
3. PART B – AQUIFER INFORMATION
The Permian (Cooper Basin) and late Cretaceous (Eromanga Basin) formations accessed for the
extractions from ATP 855 are not listed in the Management Areas, Management Units and Aquifers
for the Central Management Zone under Schedule 4 of the Water Resource (Great Artesian Basin)
Plan 2006. Extractions have occurred from the Permian formations underlying the Jurassic-
Cretaceous GAB (Eromanga Basin) aquifers, and the sub-artesian late Cretaceous aquifers of the
upper GAB. Both have poor hydraulic connection with the main confined GAB aquifer systems
(despite the over-pressured Cooper Basin formations). Appendix A presents summary information
from government database records.
3.1 PROJECT AREA PHYSIOGRAPHY
ATP 855 is located in the remote Channel Country of south-west Queensland (Figure 9) which is
sparsely populated, with the nearest notable feature being Nappa Merrie Station, located 30 km
north-west of Hervey-1. Land uses in ATP 855 comprise pastoral station operations, oil and gas
exploration, production and processing, and conservation and tourism.
The Cooper region of south-west Queensland is arid, with low rainfall and high evaporation during
hot dry summers and mild dry winters. Rainfall in the area is highly erratic, with no distinct seasonal
rainfall pattern. Silo data indicates annual average rainfall of around 200 mm, but this can be
recorded in a single rainfall event due to localised, intense rainfalls associated with thunderstorm
activity. Pan evaporation exceeds 3000 mm per year.
The Cooper Creek system is a vast, ephemeral, braided channel and floodplain system, forming the
significant surface water feature in ATP 855. Flows originate due to sporadic occurrences of heavy
rainfall over catchments in south-west Queensland. Typically, when flow events occur, most water
flows south-westerly into the Ramsar-listed Coongie Lakes in South Australia. If flows are large
enough to fill these lakes, additional water may flow down the main branch of Cooper Creek and
eventually discharge into Lake Eyre in SA.
Significant local rainfall events can also result in shallow inundation of floodplains, inter-dune
claypans and other areas of poorly drained impermeable soil, which can persist for days to weeks.
Local rainfall and run-off can also result in short duration, low volume flow events in minor tributary
ephemeral watercourses in this area that drain into the Cooper Creek system. For example, Hervey-1
is located adjacent to a small un-named watercourse, which sporadically flows into Milthaminnie
Creek and ultimately into Cooper Creek.
The Santos EIR report (2003) cites Puckridge et al (1999), who analysed Cooper Creek stream gauge
data at Cullyamurra (near Innamincka in SA), and identified that most of the flow (80% to 90%) is
from its upstream catchment (i.e. there is very little flow contribution from local runoff). They also
found that, while the Cooper typically flows every year (volumes ranging from 14,000 to 40,000
ML/a), several months usually pass without flow.
Groundwater in the region is generally very limited, with typically more than 5 metres depth to the
sub-artesian water table. This indicates low potential for hydraulic connections between
groundwater and surface water systems, other than ephemeral recharge during stream flow events.
Water bores are very sparsely located across the lease area (Figure 9).
The nearest GAB springs to ATP 855 are part of the Yowah Creek spring complex, located more than
200 km to the south-east (Figure 10). The results of the most recent spring monitoring (State of
Queensland, 2015, citing Negus et al 2015) confirmed that the Yowah Creek spring complex total
extent in 2014 was about 2.5 ha, the same as in 2008 (towards the end of the “Millennium drought”
period), but slightly less than the larger extent of 2.8 ha in 2011, which is interpreted as due to the
very high rainfall over 2010-11.

!
E
D
E
D
!(
ED!(
!(?
? ?
E
D
D
D
E
E
E
E
E
E
D
E
!(
!(
!(
!(
!(
!(
SOUT
H AU
STRA
LIAQU
EENS
LAND
COOPER CREEK SYSTEMEtty-1
Keppel-1
Hervey-1
Redland-1
Halifax-1
Geoffrey-1
DIO CHALLUM 1- 23258
FPN TALLALIA 1- 22740
DIO INNAMINCKA 2- 16768
12661
116076116059
TEST HOLE- 116395
KILUMBRAILI- 6054
DIO CHALLUM 5- 23749
DIO CHALLUM 4- 23713
DIO CHALLUM 3- 23539
HONEYMOON WELL- 50355
NARYILCO NO2 W/WELL- 22667
116331
116306
116274
116273
116272
DIG TREE 1- 116263
KOOKOONA BORE- 6056
BEACH ENERGY- 160485
MUALAWARRA BORE- 6052SANDY CREEK BORE- 50087
NARYILCO NO 1 W/WELL- 22666KARMONA
485000
485000
495000
495000
505000
505000
515000
515000
525000
525000
535000
535000
545000
545000
555000
555000
565000
565000
575000
575000
585000
585000
595000
595000
6918
000
6928
000
6928
000
6938
000
6938
000
6948
000
6948
000
6958
000
6958
000
6968
000
6968
000
6978
000
6978
000
FIGURE 9ATP 855 gas wells
and water boresDATA SOURCESHydrogeologic, Geoscience AustraliaDisclaimer: While all reasonable care has been taken to ensure the information contained onthis map is up to date and accurate, no guarantee is given that the information portrayed isfree from error or omission. Please verify the accuracy of all information prior to use.
!
!
!
!
!
!
SA
QLD
NSW
QUILPIE
LYNDHURST
TIBOOBURRA
THARGOMINDAH
±
APPROX SCALE @ A31:300,000
GDA 1994 MGA Zone 54
5 0 5 10
Kilometres
LEGEND
!( GAB BoreATP 855 boundaryATP 855 Buffer (10km)
! LocalityState BoundaryDrainageRoads
Petroleum Tenements
!( Shale Gas Well
Nappamerri TroughAbandoned BoreSub Artesian Bore
Abandoned GAB Bore?
D
E

!
!
!
!
!
!
!
!
!
!
!
!
!
!
!
!R!R!R!R!R
!R
!R!R!R
!R!R!R
!R
!R!R!R
!R
!R
!R
!R
!R
!R!R!R
!R!R!R!R!R
!R!R!R
!R !R!R
!R
!R!R!R
!R!R!R!R!R!R!R
!R!R!R
!R!R!R!R!R!R!R
!R!R!R
!R!R!R !R!R!R
!R!R
!R!R!R!R!R
!R!R
!R
!R!R!R!R!R!R
!R
!R
!R
!R!R
!R
!R
!R!R
!R
!R
!R
!(
!( !(???
!(
!(
!(!(
!(
!(
SOUT
H AU
STRA
LIA
QUEE
NSLA
ND
NEW SOUTH WALES
COOPER CREEKSYSTEM
YOWAH CREEKGAB SPRING COMPLEX
UN-NAMED SPRING
ROCKY SPRING
Etty-1
Keppel-1
Hervey-1
Redland-1
Halifax-1
Geoffrey-1
DIO CHALLUM 1- 23258FPN TALLALIA 1- 22740
DIO INNAMINCKA 2- 16768
DIO CHALLUM 5- 23749DIO CHALLUM 4- 23713
DIO CHALLUM 3- 23539
GOOMILLA
CONNULPIE
BARRINGUN
CONGIE GAP
CARRAWEENA BRINDINGABBA
MOOMBA
COONGIE
KANOWANA
LAKE HOPE
INNAMINCKA
OLD BUNDEENA
RAINBOW PLAINELIZABETH RIDGE
385000
385000
485000
485000
585000
585000
685000
685000
785000
785000
885000
885000
985000
985000
6808
000
6808
000
6908
000
6908
000
7008
000
7008
000
7108
000
7108
000
FIGURE 10ATP 855
Registered GAB SpringsDATA SOURCESHydrogeologic, Geoscience AustraliaDisclaimer: While all reasonable care has been taken to ensure the information contained onthis map is up to date and accurate, no guarantee is given that the information portrayed isfree from error or omission. Please verify the accuracy of all information prior to use.
!
!
!
!
!
!
!!
!
!
!
!
!
!
!
!
!
!
SA
QLD
NSW
TAMBO
BOURKE
QUILPIE
GOODOOGA
MITCHELL
LYNDHURST
TIBOOBURRA
CUNNAMULLA
AUGATHELLA
BREWARRINA
LEIGH CREEK
CHARLEVILLE
THARGOMINDAH
WHITE CLIFFS
LIGHTNING RIDGE
±
APPROX SCALE @ A31:1,750,000
GDA 1994 MGA Zone 54
20 0 20 40
Kilometres
LEGEND
!( GAB BoreATP 855 boundaryATP 855 Buffer (10km)
! Locality
State BoundaryDrainage
Petroleum TenementsRegistered GAB Spring!R
!( Shale Gas Well
Nappamerri TroughAbandoned GAB Bore?
Middlemis_2016_UWIR_ATP855.docx 18
The results of the most recent spring monitoring (State of Queensland, 2015, citing Negus et al 2015)
noted that “the current method of monitoring springs by mapping the extent of permanent wetland
vegetation has not been able to confirm whether flows to discharge springs are being protected
because the contributions of groundwater flows to the changes in mapped extents have not been
able to be identified.” In other words;
the extents of the spring complexes are a useful analogue for spring health, showing a steady
trend generally and measureable responses to the significant climatic variability over 2008-
2011, with ongoing monitoring activities (State of Queensland, 2015)
there is inadequate data on the spring discharge flows themselves and related aquifer
pressures to establish a sound understanding about the flow contributions to springs and
relationships with pressure conditions in GAB aquifers, but further investigations have been
proposed (State of Queensland, 2015).
There are four operational sub-artesian bores (and two decommissioned bores) located within the
ATP 855 lease area, but none of the (third party) operational water bores identified lie within a
3 km radius of any of the ATP 855 well sites drilled (Figure 9). There are six operational sub-artesian
bores located outside the ATP 855 area itself but within 10 km of the northern boundary of ATP 855,
and five decommissioned sub-artesian bores in that area.
There are no GAB bores located within the ATP 855 lease area, but there are three operational GAB
bores located within 10 km of the northern boundary of ATP 855 (see Figure 9: RN16768, RN22740
and RN23258), along with three decommissioned GAB bores in that area.
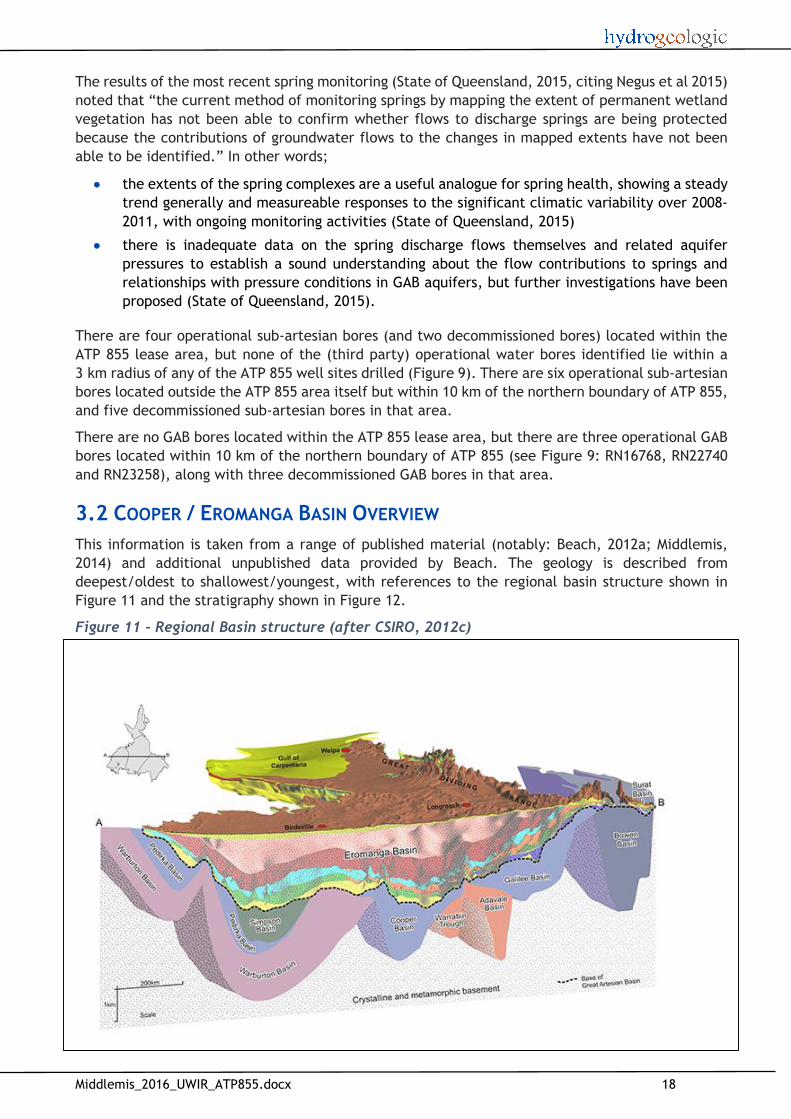
3.2 COOPER / EROMANGA BASIN OVERVIEW
This information is taken from a range of published material (notably: Beach, 2012a; Middlemis,
2014) and additional unpublished data provided by Beach. The geology is described from
deepest/oldest to shallowest/youngest, with references to the regional basin structure shown in
Figure 11 and the stratigraphy shown in Figure 12.
Figure 11 - Regional Basin structure (after CSIRO, 2012c)

Middlemis_2016_UWIR_ATP855.docx 19
Figure 12 - Cooper Basin and Eromanga Basin stratigraphy

Middlemis_2016_UWIR_ATP855.docx 20
The Cooper Basin is a south-west to north-east trending basin that extends from north-east of South
Australia into south-west Queensland (see Figure 11 and Figure 13). The Permian age Cooper Basin
is underlain by pre-Permian basement and overlain (unconformably) by the Mesozoic age Eromanga
Basin. The Cooper Basin sediments are characterised by fluvial, deltaic, and swamp deposits that
include some coal measures. The sediments contain petroleum reservoirs (mainly gas) and some
aquifers, with sediment accumulations exceeding 1,500 m thickness in some places. In the ATP 855
area, the Cooper Basin sediments are 600-750 m thick, to depths to about 4300 m.
The Nappamerri Trough is the deepest and largest of three south-west to north-east trending
depocentres (sites where sediment has deposited and accumulated) within the Cooper Basin. The
upper Cooper Basin sediments of the Nappamerri Group (Triassic) have substantial thickness in most
places and form a major aquitard and regional seal (Figure 12) between the underlying Cooper Basin
(Permian) sediments and the overlying Eromanga Basin (Jurassic-Cretaceous).
The Eromanga Basin unconformably overlies the Cooper Basin, and extends over a large area across
parts of Queensland, New South Wales, South Australia and the south-east corner of the Northern
Territory (Figure 11). The Mesozoic age Eromanga Basin sediments were deposited under fluvial
(river), lacustrine (lake) and later shallow-marine conditions, and are broadly continuous across the
Basin. These sediments are gently folded in some areas and contain a succession of geographically
extensive sandstone formations that serve as oil reservoirs and as regional aquifers of the Great
Artesian Basin (GAB).
The Eromanga Basin sediments in the ATP 855 area are typically around 600 m thick, to depths of
1700-2300 m. There are no GAB (artesian) bores located within the ATP 855 lease area, but there
are three GAB bores within 10 km of its northern boundary (Figure 9).
The near-surface Cenozoic sediments of the Lake Eyre Basin consist generally of floodplains,
wetlands, tablelands, gibbers and salt pans. However, at most sites within ATP 855, the Winton
Formation (late Cretaceous, Eromanga Basin) is logged from near-surface (typically within 10 m),
and comprises sandstones, siltstones, claystones and shales and thicknesses of up to 900 m. The
Winton Formation is targeted by sub-artesian bores for the purpose of stock and domestic water
supplies, and for industrial purposes to support oil and gas drilling activities (Figure 9). The 65 m
deep Halifax water bore is completed into the Winton Formation.
3.3 NAPPAMERRI TROUGH OVERVIEW
The information in this section is taken largely from Trembath, Elliot and Pitkin (2012). The
Nappamerri Trough is the deepest and largest of three southwest-northeast trending depocentres
within the Late Carboniferous to Middle Triassic aged Cooper Basin (Figure 13). The Nappamerri
Trough contains a thick Permian-Triassic section of sandstones, coals, siltstones and shales
deposited in a cold climate fluvio-lacustrine setting. Changes in depositional environments between
fluvial, lacustrine and deltaic have resulted in stacked multiple targets within a proven hydrocarbon
province. Extensive drilling in the southwest portion and on the flanks of the trough proved up many
commercial Permian gas fields.
The Permian age units of the Roseneath Shale, Epsilon Formation and Murteree Shale (REM package
– see Figure 12) were initially the focus of shale gas assessment in the Nappamerri Trough. The thick
shale units of the Roseneath and Murteree are considered regional seals (in addition to the major
regional seal formed by the Triassic Nappamerri Group of the upper Cooper Basin). The main source
units for the Cooper Basin were thought to be the coals and organically rich shales within the
Patchawarra and Toolachee Formations; however, more recent geochemical investigations reveal
that both the Roseneath and Murteree Shales have also been a significant source of hydrocarbons
within the Nappamerri Trough. World-wide, there are no pre-existing analogues for the Nappamerri
Trough shale play because all of the commercially produced shale gas plays in North America involve
marine rather than lacustrine shales.
Middlemis_2016_UWIR_ATP855.docx 21
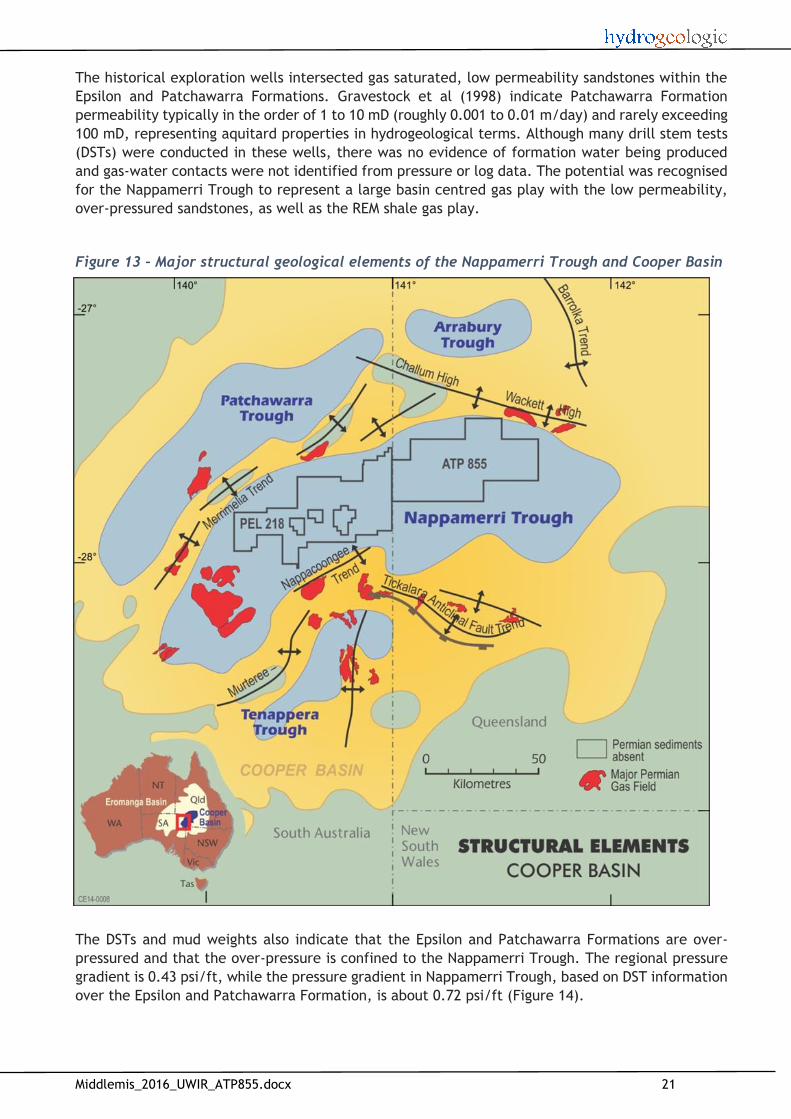
The historical exploration wells intersected gas saturated, low permeability sandstones within the
Epsilon and Patchawarra Formations. Gravestock et al (1998) indicate Patchawarra Formation
permeability typically in the order of 1 to 10 mD (roughly 0.001 to 0.01 m/day) and rarely exceeding
100 mD, representing aquitard properties in hydrogeological terms. Although many drill stem tests
(DSTs) were conducted in these wells, there was no evidence of formation water being produced
and gas-water contacts were not identified from pressure or log data. The potential was recognised
for the Nappamerri Trough to represent a large basin centred gas play with the low permeability,
over-pressured sandstones, as well as the REM shale gas play.
Figure 13 – Major structural geological elements of the Nappamerri Trough and Cooper Basin
The DSTs and mud weights also indicate that the Epsilon and Patchawarra Formations are over-
pressured and that the over-pressure is confined to the Nappamerri Trough. The regional pressure
gradient is 0.43 psi/ft, while the pressure gradient in Nappamerri Trough, based on DST information
over the Epsilon and Patchawarra Formation, is about 0.72 psi/ft (Figure 14).

Middlemis_2016_UWIR_ATP855.docx 22
Figure 14 - Nappamerri Trough over-pressured character
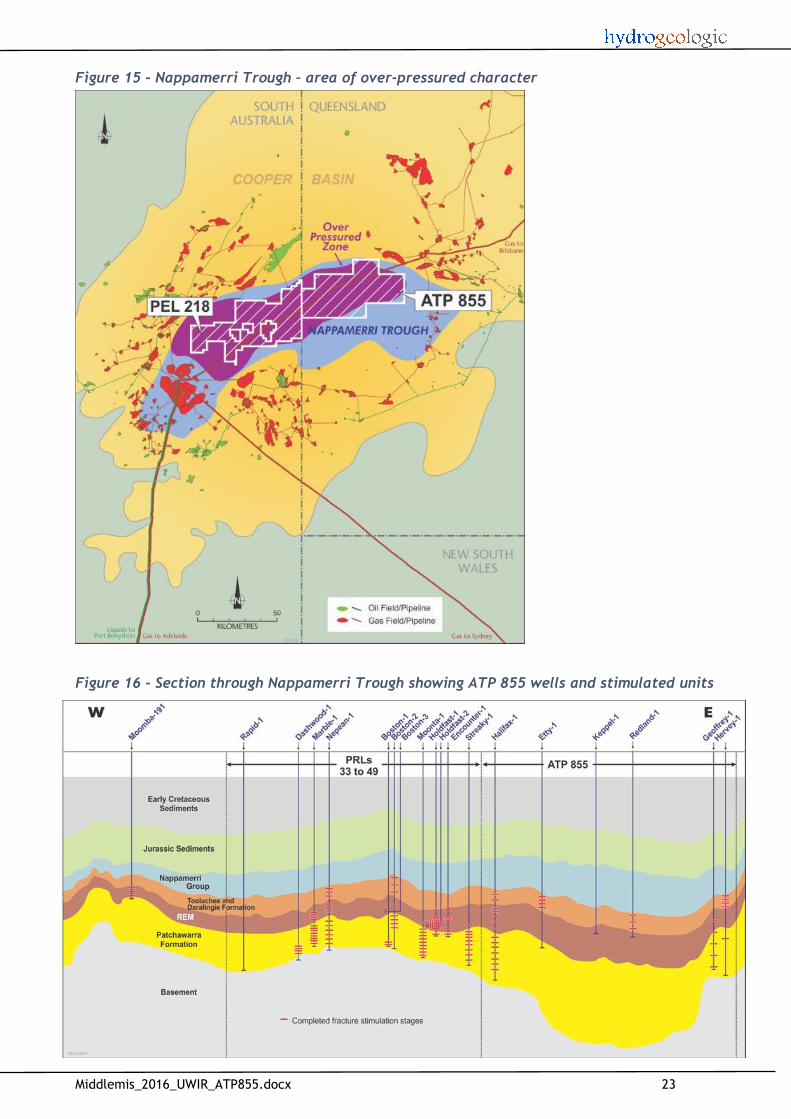
The extent of over-pressure in the Nappamerri Trough covers almost all of the ATP 855 area (Figure
15). The over-pressure character indicates that it is not in hydrodynamic connection with other
regional aquifers (e.g. the GAB system), and that the permeability is sufficiently low to trap the gas
accumulations (i.e. in the absence of structural features). The very low permeability formations
require fracture stimulation for gas production. The wells are pressure tested prior to commencing
fracture stimulation, to confirm the integrity of the casing and cement.
Figure 16 shows a cross-section through the Nappamerri Trough (from SA into QLD), indicating the
locations of the wells drilled in ATP 855 and the rough locations of the stimulation treatments. It
also shows the relationships of the Permian Cooper Basin sediments to the regional seal (aquitard)
of the Triassic Nappamerri Group and the overlying Jurassic to Cretaceous sediments of the
Eromanga Basin.
Over-pressured zone: Gas not trapped in conventional reservoir; very low permeability results in pressure
isolation.
Normal pressure zone: Conventional Cooper Basin (Permian) gas reservoirs are ‘normally pressured’, similar
to or common with overlying Eromanga Basin (Jurassic).
Middlemis_2016_UWIR_ATP855.docx 23
Figure 15 - Nappamerri Trough – area of over-pressured character
Figure 16 - Section through Nappamerri Trough showing ATP 855 wells and stimulated units

Middlemis_2016_UWIR_ATP855.docx 24
3.4 GREAT ARTESIAN BASIN (GAB) OVERVIEW
Much of this information is drawn from CSIRO studies (2012). The Great Artesian Basin is a complex,
geographically extensive system comprising multiple aquifers within a number of geological basins
and sub-basins. It consists of alternating layers of water-bearing (permeable) sandstone aquifers
and non-water-bearing (impermeable) siltstones and mudstones. The overlying impermeable rocks
confine the aquifers and cause the groundwater to be pressurised. Although artesian conditions exist
across most of the Basin, sub-artesian conditions exist on the edges of the Basin and in some other
areas of higher elevation.
The aquifers of the Basin are recharged by infiltration of rainfall and leakage from streams into
sandstone outcrops located mainly along the western slopes of the Great Dividing Range.
Groundwater flows under gravity generally to the west and south-west towards springs, some of
which are located at great distances from the recharge areas. In the north of the Basin, it flows to
the north and north-west. Groundwater moves slowly through the Basin, typically at rates in the
order of 1 to 2 metres per year, and much slower in the depocentre (the project area).
Across the Eromanga Basin, the major GAB confined aquifer and aquitard systems are identified
(CSIRO, 2012b) as the following, from shallow to deep:
the “Upper Confined Aquifer (Cretaceous)” sediments of the Winton and Mackunda
Formations (generally confined by the clays and shales of the Winton Formation itself and
the overlying sediments of the Lake Eyre Basin) – the “upper GAB aquifer system”
the intervening “Main Aquitard (Cretaceous)” units of the Wallumbilla Formation (Bulldog
Shale and Oodnadatta Formation in SA)
the “Main Confined Aquifer (Lower Cretaceous-Jurassic)” sediments of the Cadna-owie
Formation and the Hutton Sandstone – the “main confined GAB aquifer system” (generally
underlain by the Nappamerri Group aquitard and regional seal).
The upper GAB aquifer system is not artesian and is not as widely utilised as the deeper and better
quality artesian aquifers of the main confined GAB aquifer system. To the east of the Birdsville
Track Ridge, the Central Eromanga Basin overlies the Cooper Basin in the ATP 855 area. The main
confined GAB aquifer units in this area are the Cadna-owie Formation and the Hutton Sandstone.
Other units in the package include the Murta Formation (aquitard), Namur Sandstone, Westbourne
Formation (aquitard), Adori Sandstone and Birkhead Formation.
An analysis of porosity and permeability data contained within the Petroleum Exploration and
Production System (South Australia) and the Queensland Petroleum Exploration databases has been
undertaken by CSIRO (2012a) for the Central Eromanga region (Table 4).
The CSIRO study (2012a,b; summarised in Table 4) concluded that the geological formations that
contain GAB aquifers have average permeability values between 100 and 1000 mD (roughly 0.1 to 1
m/d in aquifer terms), with a few measurements below 10 mD. These are low values for an aquifer,
equivalent to about 0.1 to 1 m per year of advective horizontal groundwater movement (CSIRO
2012b). These permeability characteristics would be “better described as an aquitard” (CSIRO,
2012b), and Table 4 bears this out, showing little material difference in the mean permeability for
units that are classified as either nominal aquifers or aquitards. For example, the upper Wyandra
Sandstone member of the Cadna-owie is identified in regional terms as a nominal aquifer (CSIRO
2012b), but in some areas of the Eromanga Basin, explorers and producers have encountered serious
difficulty trying to recover water or oil from the Cadna-owie.
Aquifer storage coefficient information is limited. Storage coefficients calculated from petroleum
well log data and independently from bore testing range from 1x10⁻⁴ to 1x10⁻⁵ (GABCC, 2010), which
is at the low end of the expected range for a productive aquifer.
Middlemis_2016_UWIR_ATP855.docx 25
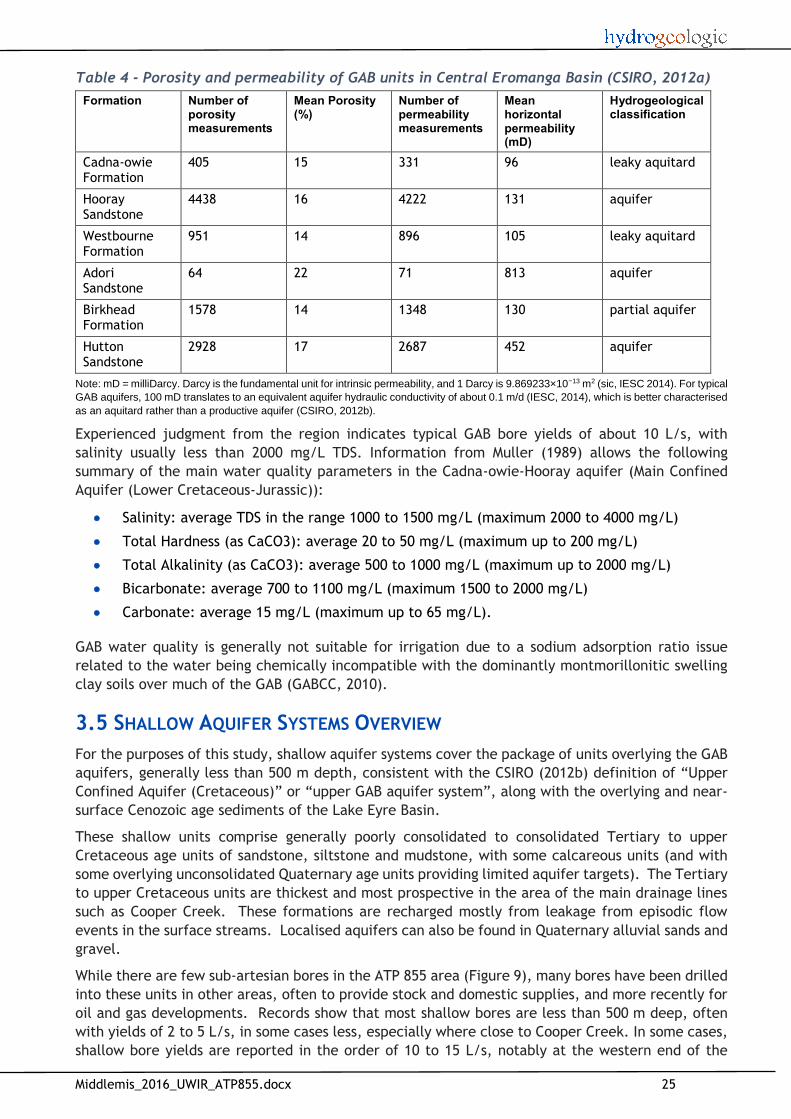
Table 4 - Porosity and permeability of GAB units in Central Eromanga Basin (CSIRO, 2012a)
Formation Number of porosity measurements
Mean Porosity (%)
Number of permeability measurements
Mean horizontal permeability (mD)
Hydrogeological classification
Cadna-owie Formation
405 15 331 96 leaky aquitard
Hooray Sandstone
4438 16 4222 131 aquifer
Westbourne Formation
951 14 896 105 leaky aquitard
Adori Sandstone
64 22 71 813 aquifer
Birkhead Formation
1578 14 1348 130 partial aquifer
Hutton Sandstone
2928 17 2687 452 aquifer
Note: mD = milliDarcy. Darcy is the fundamental unit for intrinsic permeability, and 1 Darcy is 9.869233×10⁻¹³ m2 (sic, IESC 2014). For typical
GAB aquifers, 100 mD translates to an equivalent aquifer hydraulic conductivity of about 0.1 m/d (IESC, 2014), which is better characterised
as an aquitard rather than a productive aquifer (CSIRO, 2012b).
Experienced judgment from the region indicates typical GAB bore yields of about 10 L/s, with
salinity usually less than 2000 mg/L TDS. Information from Muller (1989) allows the following
summary of the main water quality parameters in the Cadna-owie-Hooray aquifer (Main Confined
Aquifer (Lower Cretaceous-Jurassic)):
Salinity: average TDS in the range 1000 to 1500 mg/L (maximum 2000 to 4000 mg/L)
Total Hardness (as CaCO3): average 20 to 50 mg/L (maximum up to 200 mg/L)
Total Alkalinity (as CaCO3): average 500 to 1000 mg/L (maximum up to 2000 mg/L)
Bicarbonate: average 700 to 1100 mg/L (maximum 1500 to 2000 mg/L)
Carbonate: average 15 mg/L (maximum up to 65 mg/L).
GAB water quality is generally not suitable for irrigation due to a sodium adsorption ratio issue
related to the water being chemically incompatible with the dominantly montmorillonitic swelling
clay soils over much of the GAB (GABCC, 2010).
3.5 SHALLOW AQUIFER SYSTEMS OVERVIEW
For the purposes of this study, shallow aquifer systems cover the package of units overlying the GAB
aquifers, generally less than 500 m depth, consistent with the CSIRO (2012b) definition of “Upper
Confined Aquifer (Cretaceous)” or “upper GAB aquifer system”, along with the overlying and near-
surface Cenozoic age sediments of the Lake Eyre Basin.
These shallow units comprise generally poorly consolidated to consolidated Tertiary to upper
Cretaceous age units of sandstone, siltstone and mudstone, with some calcareous units (and with
some overlying unconsolidated Quaternary age units providing limited aquifer targets). The Tertiary
to upper Cretaceous units are thickest and most prospective in the area of the main drainage lines
such as Cooper Creek. These formations are recharged mostly from leakage from episodic flow
events in the surface streams. Localised aquifers can also be found in Quaternary alluvial sands and
gravel.
While there are few sub-artesian bores in the ATP 855 area (Figure 9), many bores have been drilled
into these units in other areas, often to provide stock and domestic supplies, and more recently for
oil and gas developments. Records show that most shallow bores are less than 500 m deep, often
with yields of 2 to 5 L/s, in some cases less, especially where close to Cooper Creek. In some cases,
shallow bore yields are reported in the order of 10 to 15 L/s, notably at the western end of the
Middlemis_2016_UWIR_ATP855.docx 26
Nappamerri Trough around Moomba in South Australia. Salinity records are sparse, but are typically
the shallow aquifer salinity lies in the 10,000 to 20,000 mg/L TDS range, especially for bores less
than 500 m deep, although there are also some areas where salinity is less than 10,000 mg/L.
Information from Muller (1989) allows the following summary of other water quality parameters in
the shallow (non-GAB) aquifers:
Total Hardness: (as CaCO3) typically 500 mg/L (maximum over 4000 mg/L)
Total Alkalinity: (as CaCO3) typically 200 mg/L (maximum over 500 mg/L)
Bicarbonate: typically 200 mg/L (maximum over 500 mg/L)
Carbonate: typically <10 mg/L (maximum over 30 mg/L).
The Halifax sub-artesian water bore is distant from Cooper Creek, drilled to 65 m depth in the
Winton Formation, and exhibits a salinity of around 12,000 mg/L. Although the Halifax bore is
shallow, it is completed in the Winton Formation, which is late Cretaceous age. The Halifax bore is
thus completed in the sub-artesian part of the upper GAB aquifer system (see section 3.4 for GAB
aquifer definitions), and should not be confused with the younger, near-surface Cenozoic age
(Tertiary-Quaternary) Lake Eyre Basin formations. A total volume of 68 ML has been extracted from
the Halifax water bore to support fracture stimulation operations in ATP 855 over the period from
January 2013 to January 2015.
3.6 GROUNDWATER FLOW SYSTEM CHARACTERISTICS
3.6.1 Cooper and GAB Underground Water Level Trends
There is almost no hydrogeological information currently available on the properties of the Cooper
Basin aquifer and aquitard units, mainly due to the drilling depth and cost involved, and the lower
yield and brackish to saline water quality.
In terms of water quality, analyses for several ATP 855 wells from flowback after stimulation (which
are affected by the stimulation fluids and thus are not representative of the Cooper Basin) indicate
a salinity of 6,000-7,000 mg/L and pH of 7.6 to 7.8.
While there is a Bioregional Assessment study in progress (funded by the Federal Government) that
will improve hydrogeological understanding (bioregionalassessments.gov.au/bioregions/leb.shtml), most
hydrogeological information in the ATP 855 area currently relates to the Eromanga Basin (e.g. from
the 2012 CSIRO studies). This is due to the importance, quality and accessibility of the GAB
groundwater system compared to the effectively undeveloped Cooper Basin (in groundwater terms).
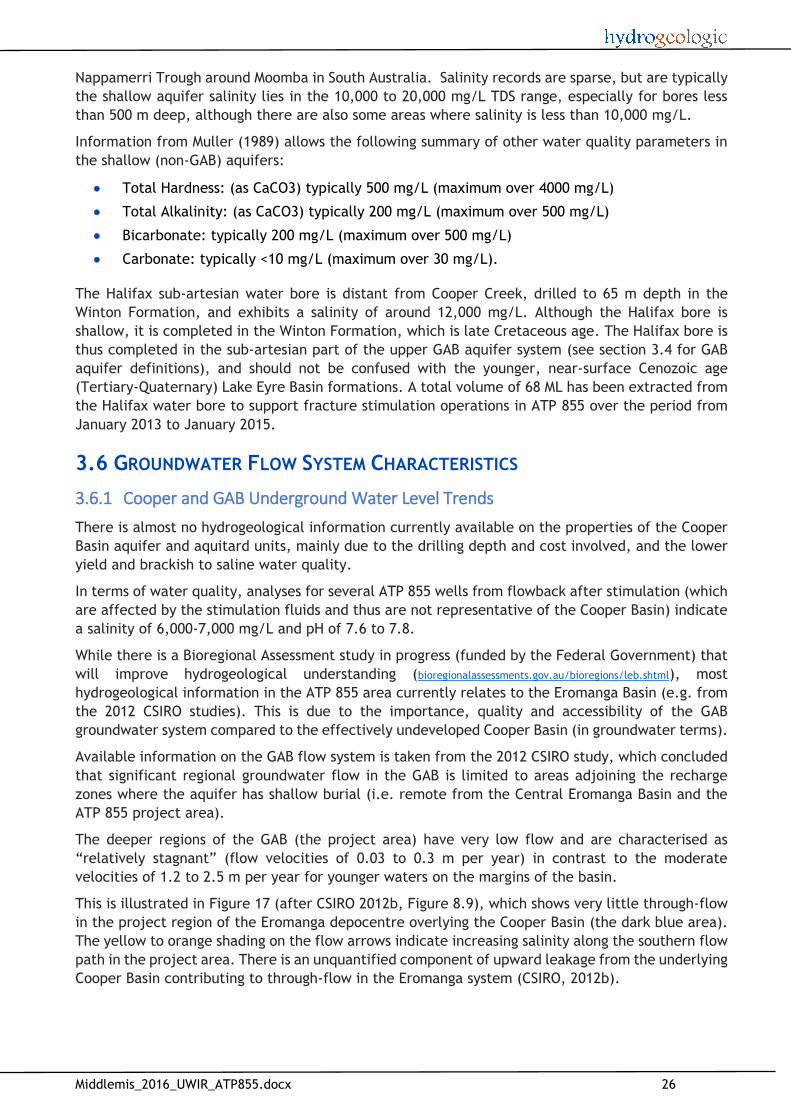
Available information on the GAB flow system is taken from the 2012 CSIRO study, which concluded
that significant regional groundwater flow in the GAB is limited to areas adjoining the recharge
zones where the aquifer has shallow burial (i.e. remote from the Central Eromanga Basin and the
ATP 855 project area).
The deeper regions of the GAB (the project area) have very low flow and are characterised as
“relatively stagnant” (flow velocities of 0.03 to 0.3 m per year) in contrast to the moderate
velocities of 1.2 to 2.5 m per year for younger waters on the margins of the basin.
This is illustrated in Figure 17 (after CSIRO 2012b, Figure 8.9), which shows very little through-flow
in the project region of the Eromanga depocentre overlying the Cooper Basin (the dark blue area).
The yellow to orange shading on the flow arrows indicate increasing salinity along the southern flow
path in the project area. There is an unquantified component of upward leakage from the underlying
Cooper Basin contributing to through-flow in the Eromanga system (CSIRO, 2012b).

Middlemis_2016_UWIR_ATP855.docx 27
Figure 17 - 3D view of GAB showing principal flow paths relatively stagnant in depocentre above Cooper Basin (after CSIRO 2012b, Figure 8.9)
The latest Minister’s statement (State of Queensland, 2015) includes this summary information on
artesian and sub-artesian aquifer systems of the GAB:
“The hydrographs from monitored artesian bores in most plan aquifers indicate that
groundwater pressure appears to be stable or rising” (except for the Surat, Surat East, or
Surat North management areas); the “implications of these trends are yet to be fully
understood and more detailed analysis of the pressure data will be undertaken during 2015
via a hydrogeological study that will inform the preparation of the new plan.”
“Stable or rising groundwater pressure trends suggest that in the majority of plan aquifers,
the reliability of water supply is being maintained and protected. The capping of more than
676 uncontrolled bores to date through programs such as the Great Artesian Basin
Sustainability Initiative (GABSI) is facilitating the recovery of groundwater pressure across
plan aquifers.”
“There are no obvious trends in the water levels in subartesian aquifers; however, there
may be some climatic influences. The hydrogeological study will also make a detailed
examination of the water level data.”
Middlemis_2016_UWIR_ATP855.docx 28
3.6.2 NTNG Fracture Stimulation and Production Testing in ATP 855
3.6.2.1 NTNG Well Design
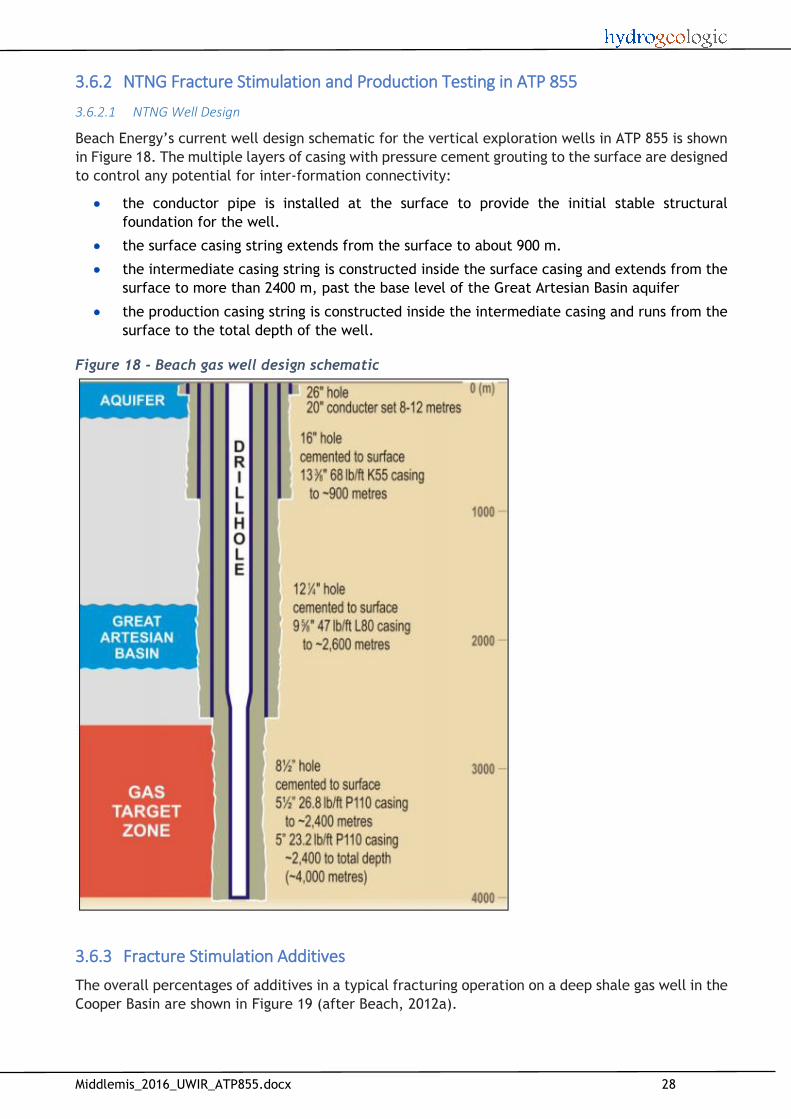
Beach Energy’s current well design schematic for the vertical exploration wells in ATP 855 is shown
in Figure 18. The multiple layers of casing with pressure cement grouting to the surface are designed
to control any potential for inter-formation connectivity:
the conductor pipe is installed at the surface to provide the initial stable structural
foundation for the well.
the surface casing string extends from the surface to about 900 m.
the intermediate casing string is constructed inside the surface casing and extends from the
surface to more than 2400 m, past the base level of the Great Artesian Basin aquifer
the production casing string is constructed inside the intermediate casing and runs from the
surface to the total depth of the well.
Figure 18 - Beach gas well design schematic
3.6.3 Fracture Stimulation Additives
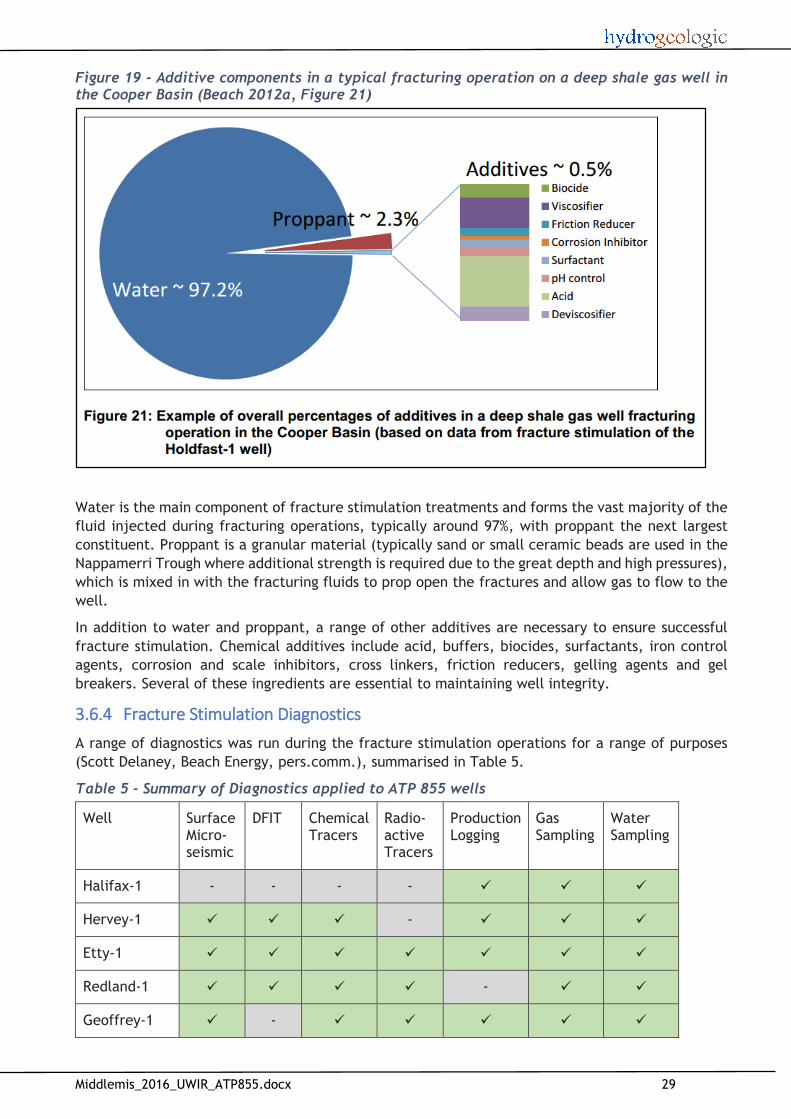
The overall percentages of additives in a typical fracturing operation on a deep shale gas well in the
Cooper Basin are shown in Figure 19 (after Beach, 2012a).
Middlemis_2016_UWIR_ATP855.docx 29
Figure 19 - Additive components in a typical fracturing operation on a deep shale gas well in the Cooper Basin (Beach 2012a, Figure 21)
Water is the main component of fracture stimulation treatments and forms the vast majority of the
fluid injected during fracturing operations, typically around 97%, with proppant the next largest
constituent. Proppant is a granular material (typically sand or small ceramic beads are used in the
Nappamerri Trough where additional strength is required due to the great depth and high pressures),
which is mixed in with the fracturing fluids to prop open the fractures and allow gas to flow to the
well.
In addition to water and proppant, a range of other additives are necessary to ensure successful
fracture stimulation. Chemical additives include acid, buffers, biocides, surfactants, iron control
agents, corrosion and scale inhibitors, cross linkers, friction reducers, gelling agents and gel
breakers. Several of these ingredients are essential to maintaining well integrity.
3.6.4 Fracture Stimulation Diagnostics
A range of diagnostics was run during the fracture stimulation operations for a range of purposes
(Scott Delaney, Beach Energy, pers.comm.), summarised in Table 5.
Table 5 - Summary of Diagnostics applied to ATP 855 wells
Well Surface Micro-seismic
DFIT Chemical Tracers
Radio-active Tracers
Production Logging
Gas Sampling
Water Sampling
Halifax-1 - - - -
Hervey-1 -
Etty-1
Redland-1 -
Geoffrey-1 -
Middlemis_2016_UWIR_ATP855.docx 30
3.6.4.1 Surface Micro-Seismic Mapping
Surface micro-seismic mapping monitors fracture growth, azimuth, stimulated rock volume and
propped stimulated rock volume. It involves placing a sensitive set of listening devices (geophones)
at the surface during the stimulation of the target well. During stimulation, small movements of
rocks are detected at the monitoring well and the location of those movements is determined by
triangulation.
The technique is accurate enough to assist geologists and engineers to understand such things as
the height of fracture growth of a treatment and whether the fracture treatment is breaking new
rock or has grown back into a previously placed fracture treatment (Beach 2012a).
Mapping the extent of the fracture treatment also aids in understanding how much of the rock may
be connected back to the well bore, which in turn assists in assessing the potential quantity of gas
that might be drained by the well. It also helps in determining the distance required between wells
to maximise stimulation of the rock and increase recovery of the gas.
Prior to using surface micro-seismic at ATP 855, the chance of success for the technology was
considered low due to the target depth and the presence of Toolachee coals at the top of the
interval that were expected to absorb the signal. The expected chance of success was even lower
in sandstone than shale as sands were expected to produce lower magnitude events. However, all
surveys recorded a significant number of events and were operationally successful.
The geophones in ATP855 were trenched where geographically possible to minimise the noise,
however there was no clear difference in the noise observed at the trenched locations compared to
the surface locations.
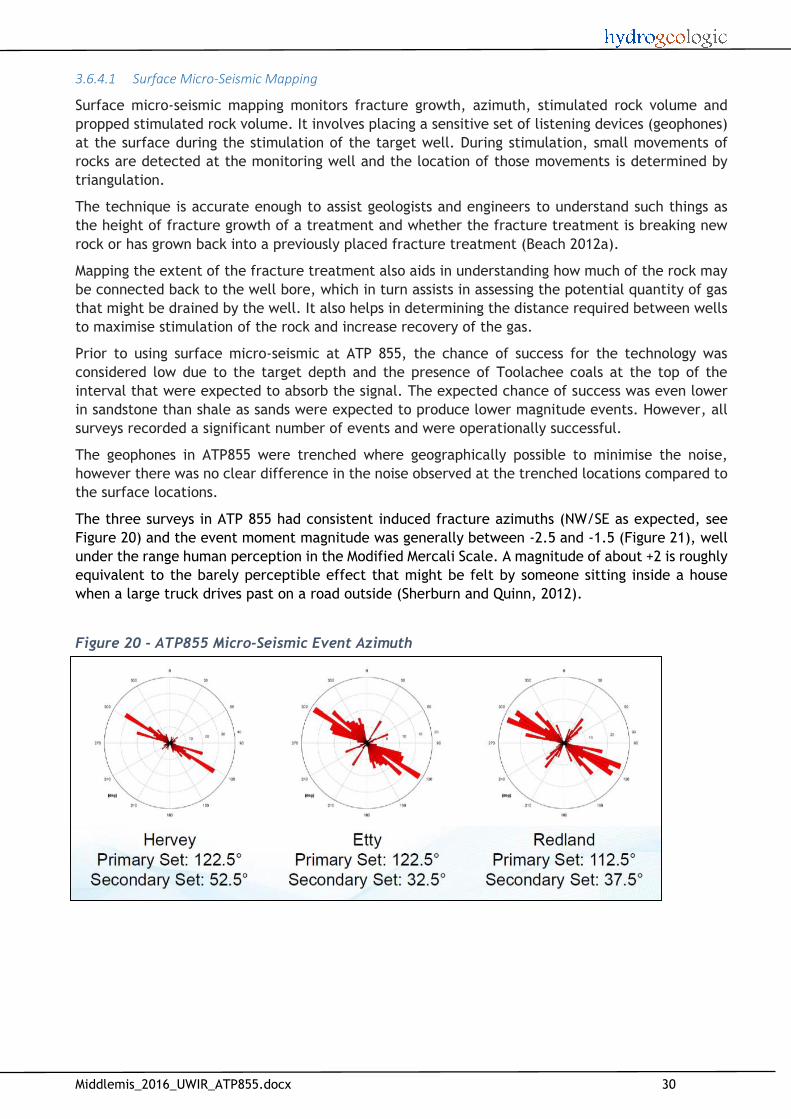
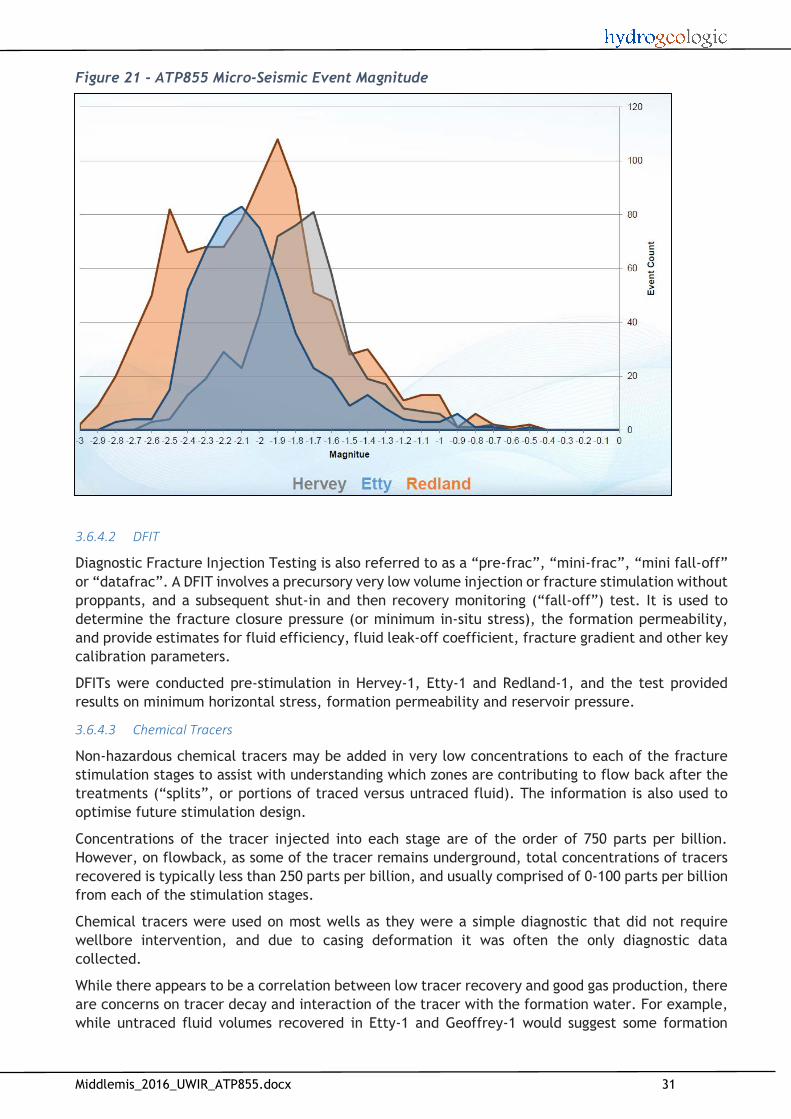
The three surveys in ATP 855 had consistent induced fracture azimuths (NW/SE as expected, see
Figure 20) and the event moment magnitude was generally between -2.5 and -1.5 (Figure 21), well
under the range human perception in the Modified Mercali Scale. A magnitude of about +2 is roughly
equivalent to the barely perceptible effect that might be felt by someone sitting inside a house
when a large truck drives past on a road outside (Sherburn and Quinn, 2012).
Figure 20 - ATP855 Micro-Seismic Event Azimuth
Middlemis_2016_UWIR_ATP855.docx 31
Figure 21 - ATP855 Micro-Seismic Event Magnitude
3.6.4.2 DFIT
Diagnostic Fracture Injection Testing is also referred to as a “pre-frac”, “mini-frac”, “mini fall-off”
or “datafrac”. A DFIT involves a precursory very low volume injection or fracture stimulation without
proppants, and a subsequent shut-in and then recovery monitoring (“fall-off”) test. It is used to
determine the fracture closure pressure (or minimum in-situ stress), the formation permeability,
and provide estimates for fluid efficiency, fluid leak-off coefficient, fracture gradient and other key
calibration parameters.
DFITs were conducted pre-stimulation in Hervey-1, Etty-1 and Redland-1, and the test provided
results on minimum horizontal stress, formation permeability and reservoir pressure.
3.6.4.3 Chemical Tracers
Non-hazardous chemical tracers may be added in very low concentrations to each of the fracture
stimulation stages to assist with understanding which zones are contributing to flow back after the
treatments (“splits”, or portions of traced versus untraced fluid). The information is also used to
optimise future stimulation design.
Concentrations of the tracer injected into each stage are of the order of 750 parts per billion.
However, on flowback, as some of the tracer remains underground, total concentrations of tracers
recovered is typically less than 250 parts per billion, and usually comprised of 0-100 parts per billion
from each of the stimulation stages.
Chemical tracers were used on most wells as they were a simple diagnostic that did not require
wellbore intervention, and due to casing deformation it was often the only diagnostic data
collected.
While there appears to be a correlation between low tracer recovery and good gas production, there
are concerns on tracer decay and interaction of the tracer with the formation water. For example,
while untraced fluid volumes recovered in Etty-1 and Geoffrey-1 would suggest some formation

Middlemis_2016_UWIR_ATP855.docx 32
water contribution, there is doubt due to the impact of tracer decay. Further investigation into the
tracer stability and interaction with the formation is required.
3.6.4.4 Radioactive Tracers
Radioactive Tracers are components of the proppant that are tagged with Scandium, Iridium and/or
Antimony that are used to identify fracture height growth near the wellbore. A gamma ray
geophysical tool was run post-frac to identify where the tracer-tagged proppants are placed.
Published radioactive tracer data across the Cooper Basin suggested that induced fractures were
extremely well contained.
Radioactive tracer diagnostics were run post-frac at Etty-1, Redland-1 and Geoffrey-1 to improve
the understanding of the effectiveness of fracture stimulation of clusters of perforations and assist
in confirming where proppant was placed. These aspects are important in understanding post-
stimulation flow performance and optimising perforation and stimulation design in future wells.
Etty-1 and Geoffrey-1 were the only wells that collected good radioactive tracer data. The tracer
data was of most use identifying which clusters of perforations were stimulated.
The height growth data was very constrained, in line with expectations. It also confirmed that the
cement bond was competent around the stimulated intervals.
Computer based model simulations populated with stress data estimated from observed rock
parameters were unable to model the limited height growth in induced fractures shown by the
radioactive tracers (as per regional experience).
3.6.4.5 Production Logging
Production Logging uses downhole spinner and other tools to identify zonal contributions of water
and gas, and changes with time where multiple logs are run.
3.6.4.6 Tiltmeters
Tiltmeter diagnostics were not run in ATP 855 wells, but they were applied by Beach to the Holdfast-
1 and Encounter-1 wells in SA in PEL 218 (Figure 1). Tiltmeter data is used in vertical wells to
determine the orientation of fracture stimulation growth (horizontally or vertically).
3.7 AFFECTED AREAS
Although the focus of this UWIR is the take of water from the sub-artesian Halifax bore (section
3.7.2), for completeness, information is also presented on the impacts due to fracture stimulation
operations in the Cooper Basin.
3.7.1 Affected Areas due to Cooper Basin Operations
There is low potential for the petroleum sector operations to impact on existing water users, based
on the GAB Resource Study Update (GABCC, 2010):
“There is little immediate scope for conflict between the interests of the rural users of water from
the GAB and those of the petroleum sector. As a general rule, petroleum is produced from the GAB
at depths greater than 1300 metres—that is, from only the deepest of the aquifers or from those of
the upper aquifers which lie below the general economic depth for the drilling of water bores. The
combination of these factors means that, with rare exception, there is limited scope for petroleum
operations to influence the productivity of nearby water bores through changes in aquifer pressure—
they generally do not connect with water-bearing aquifers. In addition, water produced from oil
reservoirs can be of poor quality or saline.”
Note that these comments apply to petroleum sector operations in Eromanga Basin aquifers
(Jurassic-Cretaceous age), whereas the ATP 855 fracture stimulation operations are undertaken on
deeper and low permeability Cooper Basin (Permian age) tight gas plays. The intervening thick
regional seal (aquitard) formed by the Triassic Nappamerri Group tends to isolate any effects on the

Middlemis_2016_UWIR_ATP855.docx 33
overlying GAB due to extraction of what are quite small volumes of water from the low permeability
Permian sediments in the Nappamerri Trough.
For the purpose of estimating affected areas for this UWIR due to fracture stimulation operations,
the de Glee steady state leaky aquifer analytical equation was applied to evaluate the potential
pressure effect of extraction directly from the GAB formations (rather than from the deeper Permian
formations that were actually tested in ATP 855). The de Glee equation was selected because it has
been applied in the Far North Water Allocation Plan in South Australia (SAALNRM Board, 2009) as a
simple method to estimate drawdown impacts, and it has also been used to estimate impacts
relating to Cooper Basin unconventional gas operations in SA (Middlemis, 2014).
Data from the ATP 855 investigations were used in the calculation of affected areas. For example,
the longest test was undertaken at Halifax-1 (about 200 days between January and August 2013 -
see Table 3), involving the largest volumes of injection (20 ML) and flowback (16 ML), with an
average extraction of 40 kL/day. Testing at Halifax-1 indicated average permeability in the micro-
Darcy order of magnitude. For the purpose of this conservative calculation, a value of 6x10⁻⁶ m/day
was adopted as the horizontal hydraulic conductivity (Kh), and a value of 6.0x10⁻⁷ m/day was applied
to the vertical hydraulic conductivity (Kv).
Other conservative factors were applied for the conservative calculation, including:
aquifer thickness of 100 m was assumed (Halifax-1 shows almost 500 m of Patchawarra, but
the lithology shows a range of sandstone and siltstone and not all horizons produce water)
extraction rate of 40 kL/d (equivalent to the average rate during the Halifax test, noting
that most of this water was recovered water from the injection, not formation water)
aquitard package thickness of 100 m (noting that the main GAB aquitard (Wallumbilla
Formation) is 400 m thick at Halifax-1; and noting that Permian aquitard thicknesses above
the Permian formations actually tested at Halifax-1 include the Nappamerri Group 600 m,
Roseneath Shale 240 m and Murteree Shale 80 m).
The result of the steady state de Glee calculation (applied conceptually and conservatively to GAB
aquifers) is a steady state drawdown prediction of 0.3 m at a radial distance of 3000 m from the
well, as outlined in the spreadsheet
screenshot opposite. A steady state
drawdown calculation is a valid
prediction of maximum long term
aquifer responses, consistent with the
modelling guidelines (Barnett et al,
2012).
This indicates a maximum potential
affected area due to fracture
stimulation operations of less than 3 km
(i.e. a Long Term Affected Area (LTAA)
of less than 3,000 ha). For the sake of
simplicity, the Immediately Affected
Area (IAA) estimate can also be taken
as 3 km in this case due to fracture
stimulation operations.
It is noted that there are no GAB springs
within the ATP 855 tenement and there
are no third party bores within 3 km of
any Beach well in ATP 855.
Middlemis_2016_UWIR_ATP855.docx 34
3.7.2 Affected Areas due to Sub-Artesian Halifax Water Bore Extractions
Discussions with the Dept of Environment and Heritage Protection (DEHP) confirmed that the
exercise of underground water rights in this case is largely the take of water from the sub-artesian
Winton Formation (“Halifax bore”). As a conservative approach, the hydrogeological impact
assessment analysis assumes an average long term extraction from the Halifax sub-artesian water
bore at a hypothetical rate of 1 L/s (consistent with the average extraction over the 2013-2014
period), although it should be noted that there are no immediate plans for additional production.
For the purpose of estimating affected areas for this UWIR due to extraction from the sub-artesian
Halifax bore at an average rate of 1 L/s, the hydrogeological standard Theis analytical equation was
applied. As there are no published aquifer parameter values for the Winton Formation, the
transmissivity was back-calculated on the basis of operational data indicating Halifax bore pumping
at rates of around 2 L/s, and noting the bore construction log (Appendix A) indicates a nominal
available drawdown of not more than 30 m. Application of the Theis equation with a 30 m drawdown
constraint indicates that the transmissivity must be about 10 m2/d (or possibly higher) and the
confined storativity should be in the range 0.001 to 0.0001, which is typical for a confined to semi-
confined aquifer. A lower transmissivity assumption (e.g. even 5 m2/d) generates excessive
drawdowns for those typical storativity values. For the purpose of the affected area calculation, a
Winton Formation transmissivity of 10 m2/d was applied, with a conservative storativity of 0.0001.
Figure 22 presents the parameter values and results of the Theis analytical model in terms of time-
drawdown for various distances up to 10 km and distance-drawdown for various times up to 25 years,
which allows for evaluation of uncertainty. For a bore trigger value of 5 m drawdown, the results
indicate a conservative affected area of 3 km from the Halifax bore for periods up to 25 years (again,
as there are no immediate plans for additional production, this is a prediction of potential affect).
Figure 22 - sub-artesian Halifax bore affected area calculations using Theis

Middlemis_2016_UWIR_ATP855.docx 35
4. PART C – MAPPING AFFECTED AREAS
As this is the first UWIR produced for ATP 855, there are no maps to review as required by the Water
Act. As there are no plans to undertake production or testing in the near future, it is presumed that
a future UWIR will not be required until such time as Beach plan to initiate operations on ATP 855.
The UWIR bore trigger threshold is a 5 metre drawdown, and the very local scale affected areas
have been calculated as less than 3 km from any well within ATP 855 (Section 3.7):
the de Glee model of steady state drawdown was used to calculate a maximum drawdown
of 0.3 m at 3 km radius from any site due to a long term extraction rate of 40 kL per day,
conceptually from a GAB aquifer (under a range of very conservative assumptions), due to
fracture stimulation operations (section 3.7.1)
the Theis analytical model was used to calculate a conservative affected area (short term
and long term) of less than 3 km due to extraction from the sub-artesian Halifax bore at a
rate of 1 L/s (section 3.7.2 and Figure 22).
There are no GAB springs within the ATP 855 tenement and there are no third party bores within
3 km of any Beach well in ATP 855 (Figure 9 and Figure 10). The map at Figure 1 shows green squares
around each site in ATP 855 (the 2C resource areas) that correspond approximately to the 3 km
potentially affected areas.
The latest Minister’s statement (State of Queensland, 2015) provides some insights on artesian and
sub-artesian aquifer systems of the GAB:
“The hydrographs from monitored artesian bores in most plan aquifers indicate that
groundwater pressure appears to be stable or rising” (except for the Surat, Surat East, or
Surat North management areas); the “implications of these trends are yet to be fully
understood and more detailed analysis of the pressure data will be undertaken during 2015
via a hydrogeological study that will inform the preparation of the new plan.”
“Stable or rising groundwater pressure trends suggest that in the majority of plan aquifers,
the reliability of water supply is being maintained and protected. The capping of more than
676 uncontrolled bores to date through programs such as the Great Artesian Basin
Sustainability Initiative (GABSI) is facilitating the recovery of groundwater pressure across
plan aquifers.”
“There are no obvious trends in the water levels in subartesian aquifers; however, there
may be some climatic influences. The hydrogeological study will also make a detailed
examination of the water level data.”
While there is a reasonable level of broad hydrogeological knowledge in the region, notably
documented in the 2012 CSIRO studies of the GAB (cited herein), there is very little specific
hydrogeological data or mapping available on Cooper Basin aquifer and aquitard systems in the
project area. Some information that is available has been presented in Section 3 (Part B – Aquifer
Information), and there is a Bioregional Assessment study in progress (funded by the Federal
Government) that will improve hydrogeological understanding on the Cooper Basin through 2016,
when improved mapping may be possible: bioregionalassessments.gov.au/bioregions/leb.shtml.
In regard to the affected areas calculation for the Cooper Basin fracture stimulation operations, it
should also be noted that the drawdown registered in the overlying GAB aquifer system would be
effectively not measurable due to the influence of the intervening main GAB aquitard of the
Wallumbilla Formation. In fact, drawdown would likely not be measureable in the GAB formations
as a result of extractions from the underlying Permian units accessed in ATP 855, due to the 400 m
plus thickness of intervening aquitard (regional seal) of the Nappamerri Formation.
Middlemis_2016_UWIR_ATP855.docx 36
Furthermore, pressure logger data provided by Beach provides some insights to the reservoir
pressure changes at Halifax-1 (tested over almost 200 days to August 2013, and involving the
greatest volumes of 20 ML injected and 16 ML flowback). The pressure logger installed on the tubing
provided data on pressures during the stimulation treatment and flowback (i.e. until about 4700
hours on the plot, indicating the 195 day test duration from January to August 2013), as well as the
subsequent shut-in wellhead pressure converted to an equivalent bottomhole pressure (Figure 23).
The data logger remained installed on the tubing and at 20 January 2015 (512 days later) the shut-
in pressure was 3678 psig (or equivalent calculated bottom hole pressure of almost 5200 psia).
Similar results were obtained from the other tests, and all tests indicated 80%-90% pressure recovery
to pre-test levels within a post-test recovery period of about three times the duration of the
pressure buildup test (i.e. no long term reservoir effects).
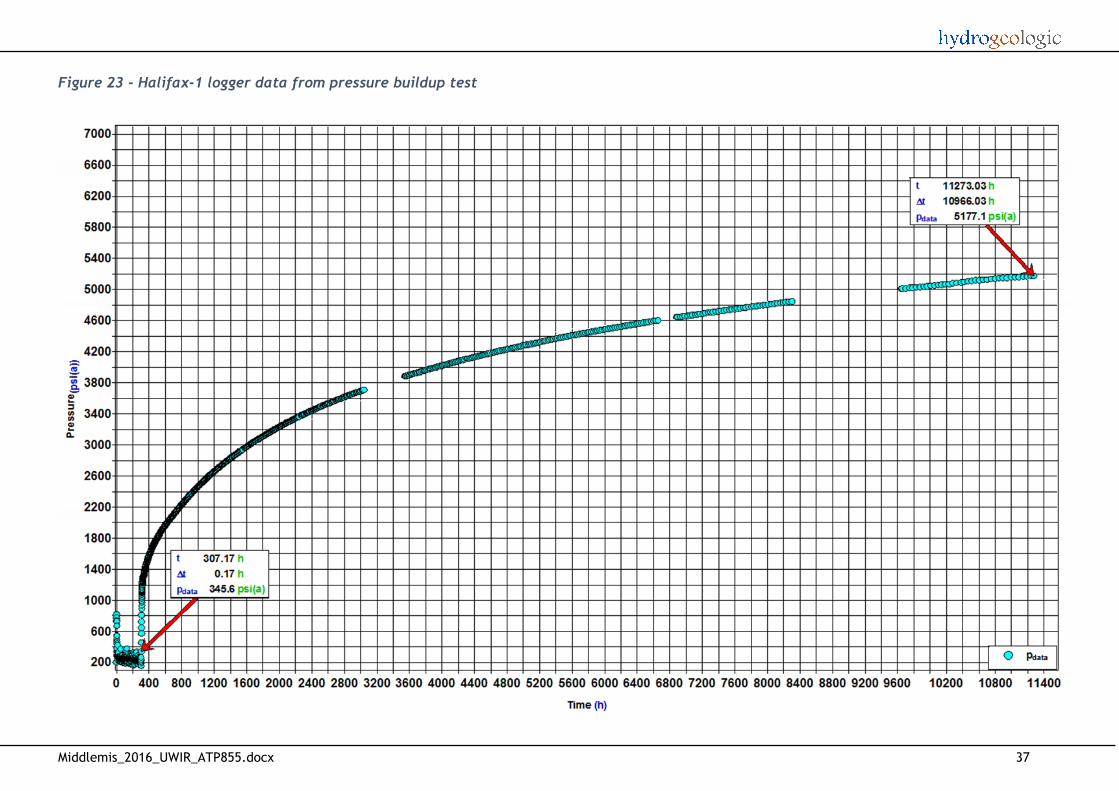
Middlemis_2016_UWIR_ATP855.docx 37
Figure 23 - Halifax-1 logger data from pressure buildup test
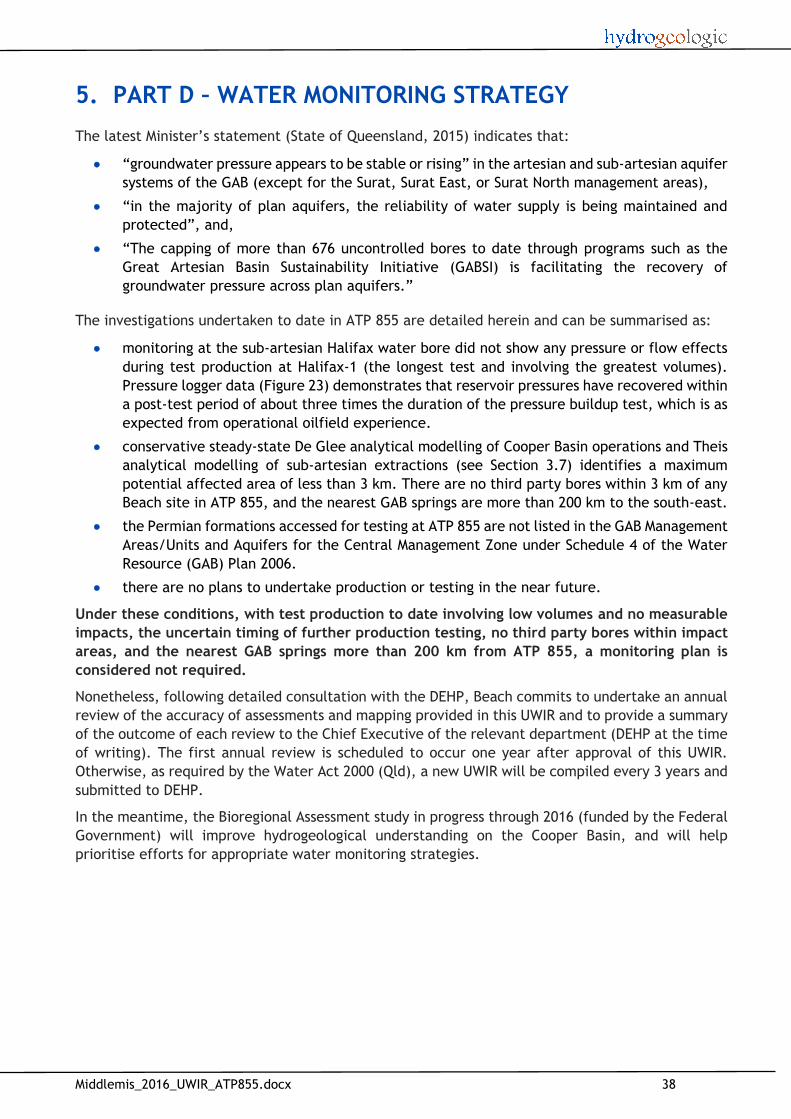
Middlemis_2016_UWIR_ATP855.docx 38
5. PART D – WATER MONITORING STRATEGY
The latest Minister’s statement (State of Queensland, 2015) indicates that:
“groundwater pressure appears to be stable or rising” in the artesian and sub-artesian aquifer
systems of the GAB (except for the Surat, Surat East, or Surat North management areas),
“in the majority of plan aquifers, the reliability of water supply is being maintained and
protected”, and,
“The capping of more than 676 uncontrolled bores to date through programs such as the
Great Artesian Basin Sustainability Initiative (GABSI) is facilitating the recovery of
groundwater pressure across plan aquifers.”
The investigations undertaken to date in ATP 855 are detailed herein and can be summarised as:
monitoring at the sub-artesian Halifax water bore did not show any pressure or flow effects
during test production at Halifax-1 (the longest test and involving the greatest volumes).
Pressure logger data (Figure 23) demonstrates that reservoir pressures have recovered within
a post-test period of about three times the duration of the pressure buildup test, which is as
expected from operational oilfield experience.
conservative steady-state De Glee analytical modelling of Cooper Basin operations and Theis
analytical modelling of sub-artesian extractions (see Section 3.7) identifies a maximum
potential affected area of less than 3 km. There are no third party bores within 3 km of any
Beach site in ATP 855, and the nearest GAB springs are more than 200 km to the south-east.
the Permian formations accessed for testing at ATP 855 are not listed in the GAB Management
Areas/Units and Aquifers for the Central Management Zone under Schedule 4 of the Water
Resource (GAB) Plan 2006.
there are no plans to undertake production or testing in the near future.
Under these conditions, with test production to date involving low volumes and no measurable
impacts, the uncertain timing of further production testing, no third party bores within impact
areas, and the nearest GAB springs more than 200 km from ATP 855, a monitoring plan is
considered not required.
Nonetheless, following detailed consultation with the DEHP, Beach commits to undertake an annual
review of the accuracy of assessments and mapping provided in this UWIR and to provide a summary
of the outcome of each review to the Chief Executive of the relevant department (DEHP at the time
of writing). The first annual review is scheduled to occur one year after approval of this UWIR.
Otherwise, as required by the Water Act 2000 (Qld), a new UWIR will be compiled every 3 years and
submitted to DEHP.
In the meantime, the Bioregional Assessment study in progress through 2016 (funded by the Federal
Government) will improve hydrogeological understanding on the Cooper Basin, and will help
prioritise efforts for appropriate water monitoring strategies.

Middlemis_2016_UWIR_ATP855.docx 39
6. PART E – SPRING IMPACT MANAGEMENT STRATEGY
The GAB springs are the key identified groundwater dependent ecosystems (GDEs), and they are
dependent on piezometric pressures in the GAB aquifers. A key issue for GAB aquifer management
is the limits imposed on drawdowns at springs in Queensland. Specifically, a 5 km buffer zone
applies around springs, where cumulative drawdown must not exceed 400 mm vertically.
There are no mapped springs within ATP 855. The nearest spring complex to ATP 855 is the Yowah
spring complex, located more than 200 km to the south-east (Figure 10). The closest ATP 855 well
to the Yowah complex is Geoffrey-1, located at 277 km distance. There is another un-named spring
to the north-west of ATP 855, and the closest well is again Geoffrey-1 at 220 km.
As no springs exist within ATP 855 or within any potentially affected area, a spring management
strategy is not required for this UWIR:
Connectivity between the spring and the aquifer - not applicable.
Management of Impacts - not applicable.
Timetable for Strategy - not applicable.
Reporting Program - not applicable.

Middlemis_2016_UWIR_ATP855.docx 40
7. PART F - CUMULATIVE MANAGEMENT AREA
As ATP 855 is not part of a Cumulative Management Area, responsibility for the preparation of a
UWIR rests with the petroleum tenure holder (Beach Energy).
Middlemis_2016_UWIR_ATP855.docx 41
8. REFERENCES
Beach Energy. (2012a). Environmental Impact Report - Fracture Stimulation of Deep Shale and Tight Gas Targets in the Nappamerri Trough (Cooper Basin), South Australia. July 2012. Beach Energy, Adelaide.
Beach Energy (2012b). Statement of Environmental Objectives - Fracture Stimulation of Deep Shale and Tight Gas Targets in the Nappamerri Trough (Cooper Basin), South Australia. July 2012. Beach Energy, Adelaide.
CSIRO (2012a). Hydrostratigraphy, hydrogeology and system conceptualisation of the Great Artesian
Basin. A technical report to the Australian Government from the CSIRO Great Artesian Basin Water
Resource Assessment. Edited by Ransley, T.R. and Smerdon, B.D. CSIRO Water for a Healthy Country
Flagship, Australia.
CSIRO (2012b). Water resource assessment for the Central Eromanga region. A report to the
Australian Government from the CSIRO Great Artesian Basin Water Resource Assessment. Edited by
Smerdon, B.D. and Ransley, T.R. CSIRO Water for a Healthy Country Flagship.
Draper, J.J. (2002). Geology of the Cooper and Eromanga Basins, Queensland. Queensland Minerals
and Energy Review Series. Queensland Department of Natural Resources and Mines.
Great Artesian Basin Consultative Committee (GABCC) (2010). GAB Resource Study Update 2010. www.gabcc.org.au/public/content/ViewCategory.aspx?id=91
Gravestock, D.I., Alexander, E.M., Morton, J.G.G., and Sun, X. (1998). Reservoirs and Seals. Chapter
10 in The Petroleum Geology of South Australia, Volume 4: Cooper Basin. Edited by D.I. Gravestock,
J.E. Hibburt and J.F. Drexel. Dept of Primary Industries & Resources Report Book 98/9. Nov. 1998.
Middlemis, H. (2014). Hydrogeological Assessment for Multi-Well Exploration and Appraisal
Production Testing from Deep Coal in PEL96, Cooper Basin. Prepared by Hydrogeologic Pty Ltd for
Strike Energy Limited and JBS&G Pty Ltd. www.petroleum.dmitre.sa.gov.au/__data/assets/pdf_file/0003/231933/20141216_-
_61.017.1e_PEL96_Multiwell_ProdTest_Groundwater_201412163.pdf
Muller, P.J. (1989). Hydrogeology of the southwestern Eromanga Basin, Queensland. Queensland
Department of Mines Record 1989/16. September 1990.
Puckridge, J.T., Costello, J.F. and Walker, K.F. (1999). DRY/WET: Effects of Changed Hydrological
Regime on the Fauna of Arid Zone Wetlands (CD-ROM model and documentation). Report to National
Wetlands Research and Development Program: Environment Australia and Land and Water Resources
Research & Development Corporation, Canberra.
SAALNRM Board. (2009). Water Allocation Plan for the Far North Prescribed Wells Area. A partnership
between The Department for Environment and Heritage and South Australian Arid Lands Natural
Resources Management Board. South Australian Arid Lands Natural Resources Management Board.
Santos Ltd (2003). South Australia Cooper Basin Joint Venture. Environmental Impact Report:
Production and Processing Operations. February, 2003.
Sherburn, S, Quinn, R. (2012). An assessment of the effects of hydraulic fracturing on seismicity in
the Taranaki. GNS Science Consultancy Report 2012/50. 28pp.
Trembath, C., Elliott, L., and Pitkin M. (2012). The Nappamerri Trough, Cooper Basin
unconventional plays: proving a hypothesis (abs.). APPEA Conference. 13–16 May, 2012, Adelaide.
Youngs, B.C. (1971). The Hydrology of the Gidgealpa Formation of the western and central Cooper
Basin. Department of Mines, South Australia, Adelaide.
Middlemis_2016_UWIR_ATP855.docx 42
STATE OF QUEENSLAND:
Department of Environment and Heritage Protection (2015). Guideline. Underground Water Impact
Reports and Final Reports. www.ehp.qld.gov.au/management/non-mining/documents/uwir-guideline.pdf
Department of Natural Resources and Mines (2005). Hydrogeological Framework Report for the
Great Artesian Basin Water Resource Plan Area Version 1.0. State of Queensland.
Great Artesian Basin Resource Operations Plan. February 2007. Amended November 2012.
Department of Natural Resources and Mines. State of Queensland.
Minister’s Performance Assessment Report (2015). Water Resource (Great Artesian Basin) Plan 2006
and Great Artesian Basin Resource Operations Plan 2007. September 2015. State of Queensland.
Water Resource (Cooper Creek) Plan 2011. Current as at 27 June 2014. State of Queensland.
Water Resource (Great Artesian Basin) Plan 2006. Current as at 11 September 2015. State of
Queensland.

Middlemis_2016_UWIR_ATP855.docx 43
Appendix A - Halifax water bore driller’s log and government database records
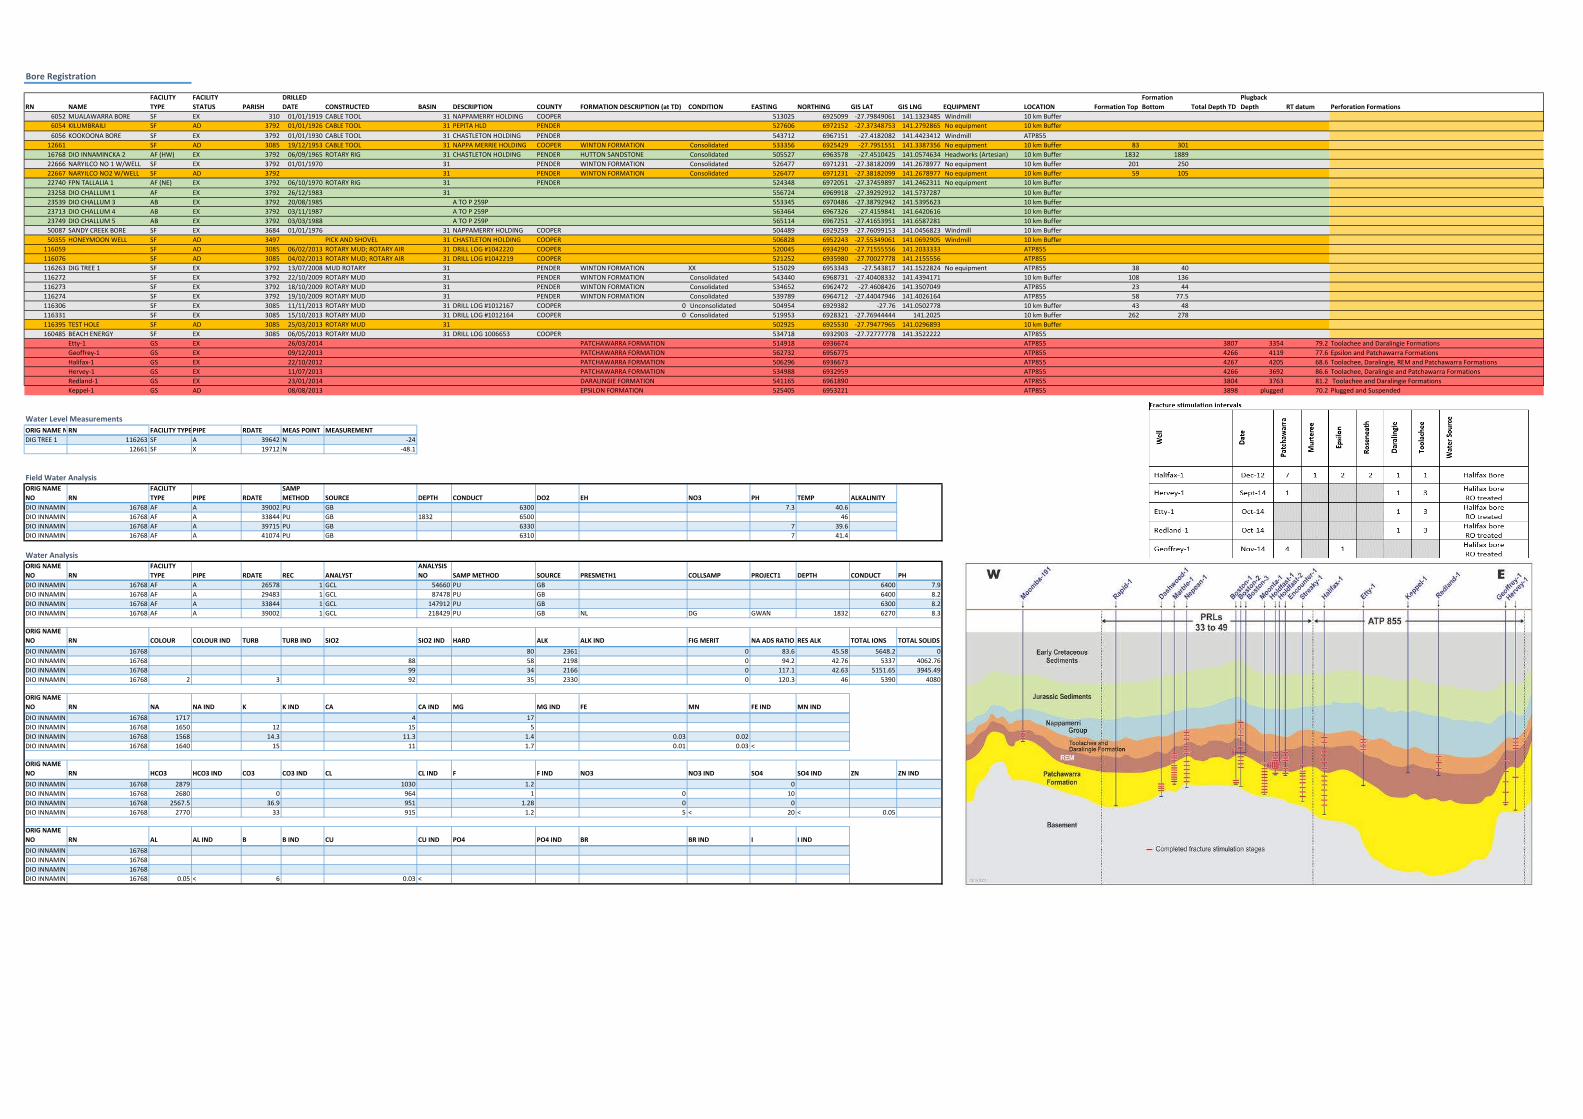
Bore Registration
RN NAME
FACILITY
TYPE
FACILITY
STATUS PARISH
DRILLED
DATE CONSTRUCTED BASIN DESCRIPTION COUNTY FORMATION DESCRIPTION (at TD) CONDITION EASTING NORTHING GIS LAT GIS LNG EQUIPMENT LOCATION Formation Top
Formation
Bottom Total Depth TD
Plugback
Depth RT datum Perforation Formations
6052 MUALAWARRA BORE SF EX 310 01/01/1919 CABLE TOOL 31 NAPPAMERRY HOLDING COOPER 513025 6925099 -27.79849061 141.1323485 Windmill 10 km Buffer
6054 KILUMBRAILI SF AD 3792 01/01/1926 CABLE TOOL 31 PEPITA HLD PENDER 527606 6972152 -27.37348753 141.2792865 No equipment 10 km Buffer
6056 KOOKOONA BORE SF EX 3792 01/01/1930 CABLE TOOL 31 CHASTLETON HOLDING PENDER 543712 6967151 -27.4182082 141.4423412 Windmill ATP855
12661 SF AD 3085 19/12/1953 CABLE TOOL 31 NAPPA MERRIE HOLDING COOPER WINTON FORMATION Consolidated 533356 6925429 -27.7951551 141.3387356 No equipment 10 km Buffer 83 301
16768 DIO INNAMINCKA 2 AF (HW) EX 3792 06/09/1965 ROTARY RIG 31 CHASTLETON HOLDING PENDER HUTTON SANDSTONE Consolidated 505527 6963578 -27.4510425 141.0574634 Headworks (Artesian) 10 km Buffer 1832 1889
22666 NARYILCO NO 1 W/WELL SF EX 3792 01/01/1970 31 PENDER WINTON FORMATION Consolidated 526477 6971231 -27.38182099 141.2678977 No equipment 10 km Buffer 201 250
22667 NARYILCO NO2 W/WELL SF AD 3792 31 PENDER WINTON FORMATION Consolidated 526477 6971231 -27.38182099 141.2678977 No equipment 10 km Buffer 59 105
22740 FPN TALLALIA 1 AF (NE) EX 3792 06/10/1970 ROTARY RIG 31 PENDER 524348 6972051 -27.37459897 141.2462311 No equipment 10 km Buffer
23258 DIO CHALLUM 1 AF EX 3792 26/12/1983 31 556724 6969918 -27.39292912 141.5737287 10 km Buffer
23539 DIO CHALLUM 3 AB EX 3792 20/08/1985 A TO P 259P 553345 6970486 -27.38792942 141.5395623 10 km Buffer
23713 DIO CHALLUM 4 AB EX 3792 03/11/1987 A TO P 259P 563464 6967326 -27.4159841 141.6420616 10 km Buffer
23749 DIO CHALLUM 5 AB EX 3792 03/03/1988 A TO P 259P 565114 6967251 -27.41653951 141.6587281 10 km Buffer
50087 SANDY CREEK BORE SF EX 3684 01/01/1976 31 NAPPAMERRY HOLDING COOPER 504489 6929259 -27.76099153 141.0456823 Windmill 10 km Buffer
50355 HONEYMOON WELL SF AD 3497 PICK AND SHOVEL 31 CHASTLETON HOLDING COOPER 506828 6952243 -27.55349061 141.0692905 Windmill 10 km Buffer
116059 SF AD 3085 06/02/2013 ROTARY MUD; ROTARY AIR 31 DRILL LOG #1042220 COOPER 520045 6934290 -27.71555556 141.2033333 ATP855
116076 SF AD 3085 04/02/2013 ROTARY MUD; ROTARY AIR 31 DRILL LOG #1042219 COOPER 521252 6935980 -27.70027778 141.2155556 ATP855
116263 DIG TREE 1 SF EX 3792 13/07/2008 MUD ROTARY 31 PENDER WINTON FORMATION XX 515029 6953343 -27.543817 141.1522824 No equipment ATP855 38 40
116272 SF EX 3792 22/10/2009 ROTARY MUD 31 PENDER WINTON FORMATION Consolidated 543440 6968731 -27.40408332 141.4394171 10 km Buffer 108 136
116273 SF EX 3792 18/10/2009 ROTARY MUD 31 PENDER WINTON FORMATION Consolidated 534652 6962472 -27.4608426 141.3507049 ATP855 23 44
116274 SF EX 3792 19/10/2009 ROTARY MUD 31 PENDER WINTON FORMATION Consolidated 539789 6964712 -27.44047946 141.4026164 ATP855 58 77.5
116306 SF EX 3085 11/11/2013 ROTARY MUD 31 DRILL LOG #1012167 COOPER 0 Unconsolidated 504954 6929382 -27.76 141.0502778 10 km Buffer 43 48
116331 SF EX 3085 15/10/2013 ROTARY MUD 31 DRILL LOG #1012164 COOPER 0 Consolidated 519953 6928321 -27.76944444 141.2025 10 km Buffer 262 278
116395 TEST HOLE SF AD 3085 25/03/2013 ROTARY MUD 31 502925 6925530 -27.79477965 141.0296893 10 km Buffer
160485 BEACH ENERGY SF EX 3085 06/05/2013 ROTARY MUD 31 DRILL LOG 1006653 COOPER 534718 6932903 -27.72777778 141.3522222 ATP855
Etty-1 GS EX 26/03/2014 PATCHAWARRA FORMATION 514918 6936674 ATP855 3807 3354 79.2 Toolachee and Daralingie Formations
Geoffrey-1 GS EX 09/12/2013 PATCHAWARRA FORMATION 562732 6956775 ATP855 4266 4119 77.6 Epsilon and Patchawarra Formations
Halifax-1 GS EX 22/10/2012 PATCHAWARRA FORMATION 506296 6936673 ATP855 4267 4205 68.6 Toolachee, Daralingie, REM and Patchawarra Formations
Hervey-1 GS EX 11/07/2013 PATCHAWARRA FORMATION 534988 6932959 ATP855 4266 3692 86.6 Toolachee, Daralingie and Patchawarra Formations
Redland-1 GS EX 23/01/2014 DARALINGIE FORMATION 541165 6961890 ATP855 3804 3763 81.2 Toolachee and Daralingie Formations
Keppel-1 GS AD 08/08/2013 EPSILON FORMATION 525405 6953221 ATP855 3898 plugged 70.2 Plugged and Suspended
Water Level Measurements
ORIG NAME NORN FACILITY TYPE PIPE RDATE MEAS POINT MEASUREMENT
DIG TREE 1 116263 SF A 39642 N -24
12661 SF X 19712 N -48.1
Field Water AnalysisORIG NAME
NO RN
FACILITY
TYPE PIPE RDATE
SAMP
METHOD SOURCE DEPTH CONDUCT DO2 EH NO3 PH TEMP ALKALINITY
DIO INNAMINCKA 2 16768 AF A 39002 PU GB 6300 7.3 40.6
DIO INNAMINCKA 2 16768 AF A 33844 PU GB 1832 6500 46
DIO INNAMINCKA 2 16768 AF A 39715 PU GB 6330 7 39.6
DIO INNAMINCKA 2 16768 AF A 41074 PU GB 6310 7 41.4
Water AnalysisORIG NAME
NO RN
FACILITY
TYPE PIPE RDATE REC ANALYST
ANALYSIS
NO SAMP METHOD SOURCE PRESMETH1 COLLSAMP PROJECT1 DEPTH CONDUCT PH
DIO INNAMINCKA 2 16768 AF A 26578 1 GCL 54660 PU GB 6400 7.9
DIO INNAMINCKA 2 16768 AF A 29483 1 GCL 87478 PU GB 6400 8.2
DIO INNAMINCKA 2 16768 AF A 33844 1 GCL 147912 PU GB 6300 8.2
DIO INNAMINCKA 2 16768 AF A 39002 1 GCL 218429 PU GB NL DG GWAN 1832 6270 8.3
ORIG NAME
NO RN COLOUR COLOUR IND TURB TURB IND SIO2 SIO2 IND HARD ALK ALK IND FIG MERIT NA ADS RATIO RES ALK TOTAL IONS TOTAL SOLIDS
DIO INNAMINCKA 2 16768 80 2361 0 83.6 45.58 5648.2 0
DIO INNAMINCKA 2 16768 88 58 2198 0 94.2 42.76 5337 4062.76
DIO INNAMINCKA 2 16768 99 34 2166 0 117.1 42.63 5151.65 3945.49
DIO INNAMINCKA 2 16768 2 3 92 35 2330 0 120.3 46 5390 4080
ORIG NAME
NO RN NA NA IND K K IND CA CA IND MG MG IND FE MN FE IND MN IND
DIO INNAMINCKA 2 16768 1717 4 17
DIO INNAMINCKA 2 16768 1650 12 15 5
DIO INNAMINCKA 2 16768 1568 14.3 11.3 1.4 0.03 0.02
DIO INNAMINCKA 2 16768 1640 15 11 1.7 0.01 0.03 <
ORIG NAME
NO RN HCO3 HCO3 IND CO3 CO3 IND CL CL IND F F IND NO3 NO3 IND SO4 SO4 IND ZN ZN IND
DIO INNAMINCKA 2 16768 2879 1030 1.2 0
DIO INNAMINCKA 2 16768 2680 0 964 1 0 10
DIO INNAMINCKA 2 16768 2567.5 36.9 951 1.28 0 0
DIO INNAMINCKA 2 16768 2770 33 915 1.2 5 < 20 < 0.05
ORIG NAME
NO RN AL AL IND B B IND CU CU IND PO4 PO4 IND BR BR IND I I IND
DIO INNAMINCKA 2 16768
DIO INNAMINCKA 2 16768
DIO INNAMINCKA 2 16768
DIO INNAMINCKA 2 16768 0.05 < 6 0.03 <
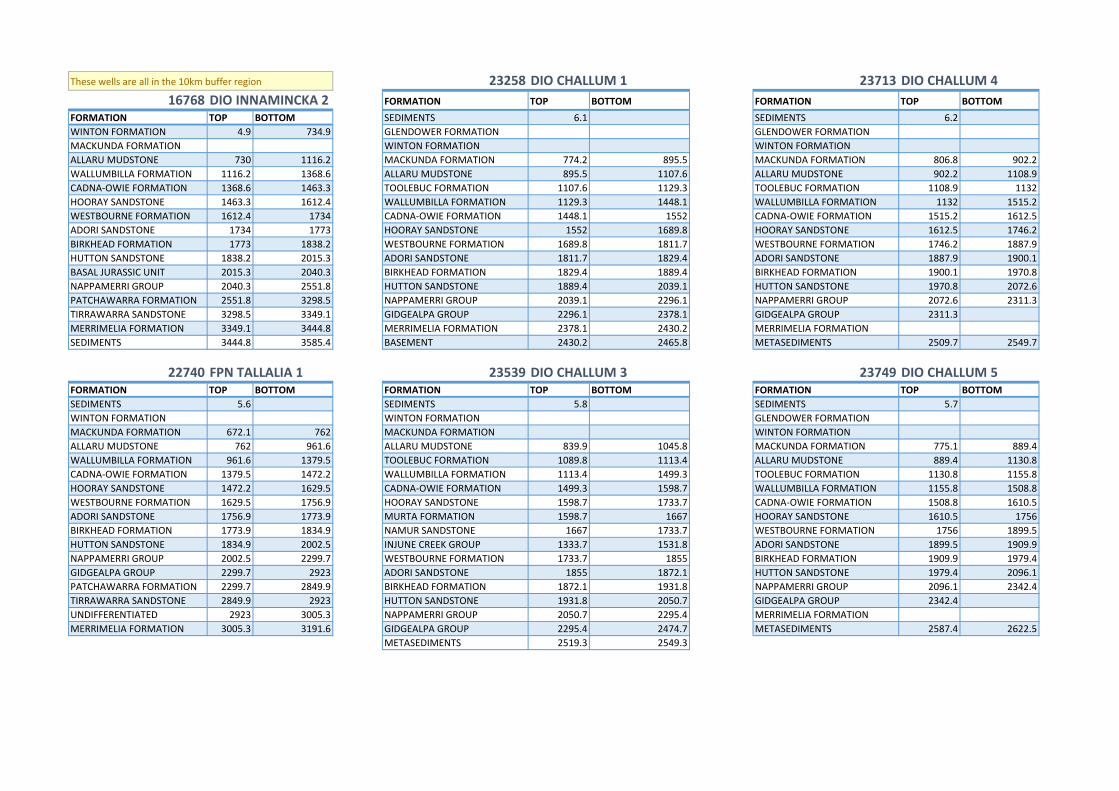
These wells are all in the 10km buffer region 23258 DIO CHALLUM 1 23713 DIO CHALLUM 4
16768 DIO INNAMINCKA 2 FORMATION TOP BOTTOM FORMATION TOP BOTTOM
FORMATION TOP BOTTOM SEDIMENTS 6.1 SEDIMENTS 6.2
WINTON FORMATION 4.9 734.9 GLENDOWER FORMATION GLENDOWER FORMATION
MACKUNDA FORMATION WINTON FORMATION WINTON FORMATION
ALLARU MUDSTONE 730 1116.2 MACKUNDA FORMATION 774.2 895.5 MACKUNDA FORMATION 806.8 902.2
WALLUMBILLA FORMATION 1116.2 1368.6 ALLARU MUDSTONE 895.5 1107.6 ALLARU MUDSTONE 902.2 1108.9
CADNA-OWIE FORMATION 1368.6 1463.3 TOOLEBUC FORMATION 1107.6 1129.3 TOOLEBUC FORMATION 1108.9 1132
HOORAY SANDSTONE 1463.3 1612.4 WALLUMBILLA FORMATION 1129.3 1448.1 WALLUMBILLA FORMATION 1132 1515.2
WESTBOURNE FORMATION 1612.4 1734 CADNA-OWIE FORMATION 1448.1 1552 CADNA-OWIE FORMATION 1515.2 1612.5
ADORI SANDSTONE 1734 1773 HOORAY SANDSTONE 1552 1689.8 HOORAY SANDSTONE 1612.5 1746.2
BIRKHEAD FORMATION 1773 1838.2 WESTBOURNE FORMATION 1689.8 1811.7 WESTBOURNE FORMATION 1746.2 1887.9
HUTTON SANDSTONE 1838.2 2015.3 ADORI SANDSTONE 1811.7 1829.4 ADORI SANDSTONE 1887.9 1900.1
BASAL JURASSIC UNIT 2015.3 2040.3 BIRKHEAD FORMATION 1829.4 1889.4 BIRKHEAD FORMATION 1900.1 1970.8
NAPPAMERRI GROUP 2040.3 2551.8 HUTTON SANDSTONE 1889.4 2039.1 HUTTON SANDSTONE 1970.8 2072.6
PATCHAWARRA FORMATION 2551.8 3298.5 NAPPAMERRI GROUP 2039.1 2296.1 NAPPAMERRI GROUP 2072.6 2311.3
TIRRAWARRA SANDSTONE 3298.5 3349.1 GIDGEALPA GROUP 2296.1 2378.1 GIDGEALPA GROUP 2311.3
MERRIMELIA FORMATION 3349.1 3444.8 MERRIMELIA FORMATION 2378.1 2430.2 MERRIMELIA FORMATION
SEDIMENTS 3444.8 3585.4 BASEMENT 2430.2 2465.8 METASEDIMENTS 2509.7 2549.7
22740 FPN TALLALIA 1 23539 DIO CHALLUM 3 23749 DIO CHALLUM 5FORMATION TOP BOTTOM FORMATION TOP BOTTOM FORMATION TOP BOTTOM
SEDIMENTS 5.6 SEDIMENTS 5.8 SEDIMENTS 5.7
WINTON FORMATION WINTON FORMATION GLENDOWER FORMATION
MACKUNDA FORMATION 672.1 762 MACKUNDA FORMATION WINTON FORMATION
ALLARU MUDSTONE 762 961.6 ALLARU MUDSTONE 839.9 1045.8 MACKUNDA FORMATION 775.1 889.4
WALLUMBILLA FORMATION 961.6 1379.5 TOOLEBUC FORMATION 1089.8 1113.4 ALLARU MUDSTONE 889.4 1130.8
CADNA-OWIE FORMATION 1379.5 1472.2 WALLUMBILLA FORMATION 1113.4 1499.3 TOOLEBUC FORMATION 1130.8 1155.8
HOORAY SANDSTONE 1472.2 1629.5 CADNA-OWIE FORMATION 1499.3 1598.7 WALLUMBILLA FORMATION 1155.8 1508.8
WESTBOURNE FORMATION 1629.5 1756.9 HOORAY SANDSTONE 1598.7 1733.7 CADNA-OWIE FORMATION 1508.8 1610.5
ADORI SANDSTONE 1756.9 1773.9 MURTA FORMATION 1598.7 1667 HOORAY SANDSTONE 1610.5 1756
BIRKHEAD FORMATION 1773.9 1834.9 NAMUR SANDSTONE 1667 1733.7 WESTBOURNE FORMATION 1756 1899.5
HUTTON SANDSTONE 1834.9 2002.5 INJUNE CREEK GROUP 1333.7 1531.8 ADORI SANDSTONE 1899.5 1909.9
NAPPAMERRI GROUP 2002.5 2299.7 WESTBOURNE FORMATION 1733.7 1855 BIRKHEAD FORMATION 1909.9 1979.4
GIDGEALPA GROUP 2299.7 2923 ADORI SANDSTONE 1855 1872.1 HUTTON SANDSTONE 1979.4 2096.1
PATCHAWARRA FORMATION 2299.7 2849.9 BIRKHEAD FORMATION 1872.1 1931.8 NAPPAMERRI GROUP 2096.1 2342.4
TIRRAWARRA SANDSTONE 2849.9 2923 HUTTON SANDSTONE 1931.8 2050.7 GIDGEALPA GROUP 2342.4
UNDIFFERENTIATED 2923 3005.3 NAPPAMERRI GROUP 2050.7 2295.4 MERRIMELIA FORMATION
MERRIMELIA FORMATION 3005.3 3191.6 GIDGEALPA GROUP 2295.4 2474.7 METASEDIMENTS 2587.4 2622.5
METASEDIMENTS 2519.3 2549.3
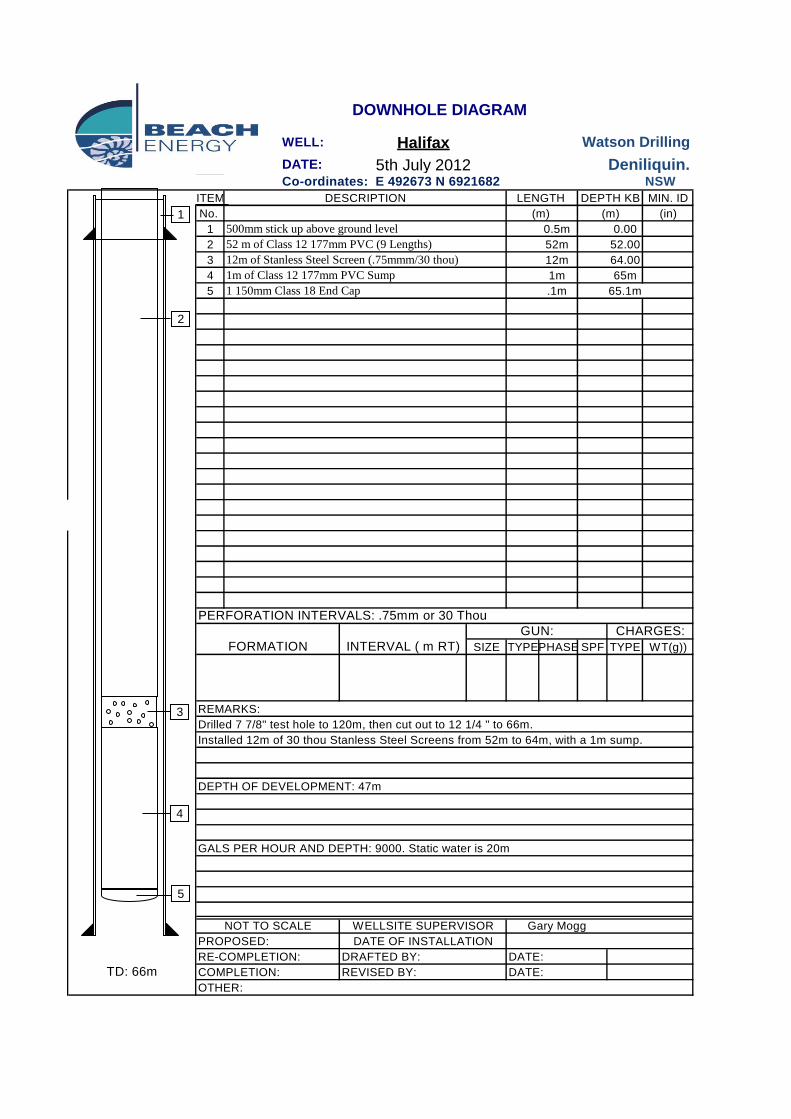
WELL: Halifax
DATE:
Co-ordinates: E 492673 N 6921682 NSW
ITEM DESCRIPTION LENGTH DEPTH KB MIN. ID
No. (m) (m) (in)
1 500mm stick up above ground level 0.5m 0.00
2 52 m of Class 12 177mm PVC (9 Lengths) 52m 52.00
3 12m of Stanless Steel Screen (.75mmm/30 thou) 12m 64.00
4 1m of Class 12 177mm PVC Sump 1m 65m
5 1 150mm Class 18 End Cap .1m 65.1m
PERFORATION INTERVALS: .75mm or 30 Thou
GUN: CHARGES:
FORMATION INTERVAL ( m RT) SIZE TYPEPHASE SPF TYPE WT(g))
REMARKS:
Drilled 7 7/8" test hole to 120m, then cut out to 12 1/4 " to 66m.
Installed 12m of 30 thou Stanless Steel Screens from 52m to 64m, with a 1m sump.
DEPTH OF DEVELOPMENT: 47m
GALS PER HOUR AND DEPTH: 9000. Static water is 20m
NOT TO SCALE WELLSITE SUPERVISOR Gary Mogg
PROPOSED: DATE OF INSTALLATION
RE-COMPLETION: DRAFTED BY: DATE:
TD: 66m COMPLETION: REVISED BY: DATE:
OTHER:
DOWNHOLE DIAGRAM
5th July 2012
Watson Drilling
Deniliquin.
2
1
4
5
3