uncertainties in future projections of extreme precipitation in the indian monsoon region
TRANSCRIPT

ATMOSPHERIC SCIENCE LETTERSAtmos. Sci. Let. 10: 152–158 (2009)Published online 3 June 2009 in Wiley InterScience(www.interscience.wiley.com) DOI: 10.1002/asl.223
Uncertainties in future projections of extremeprecipitation in the Indian monsoon region
A. G. Turner1* and J. M. Slingo2,1,†
1NCAS-Climate, Walker Institute for Climate System Research, University of Reading, UK2Met Office, Exeter, UK
*Correspondence to:A. G. Turner, Department ofMeteorology, University ofReading, Earley Gate, RG6 6BB,UK.E-mail: [email protected]
†The contribution of J. M. Slingowas written in the course of heremployment at the Met Office,UK and is published with thepermission of the controller ofHMSO and the Queen’s Printerfor Scotland.
Received: 18 January 2009Revised: 2 April 2009Accepted: 8 April 2009
AbstractUncertainties in changes to the spatial distribution and magnitude of the heaviest extremesof daily monsoon rainfall over India are assessed in the doubled CO2 climate changescenarios in the IPCC Fourth Assessment Report. Results show diverse changes to thespatial pattern of the 95th and 99th subseasonal percentiles, which are strongly tied to themean precipitation change during boreal summer. In some models, the projected increase inheaviest rainfall over India at CO2 doubling is entirely predictable based upon the surfacewarming and the Clausius–Clapeyron relation, a result which may depend upon the choiceof convection scheme. Copyright 2009 Royal Meteorological Society and Crown Copyright
Keywords: Asian monsoon; climate change; extremes
1. Introduction
The Indian summer monsoon represents one of thelargest annual variations of the global climate systemand supplies around 80% of the region’s annualrainfall total, making its correct forecast essentialfor agriculture and industry. Variations on interannualtimescales, however, are surprisingly small (standarddeviation in summer all-India rainfall is around 10%),whereas much shorter timescale events can be muchmore damaging. For example, during the monsoonbreak of July 2002, India received only around halfits normal rainfall (Annamalai et al., 2007), whereasin late July 2005 Mumbai received nearly 1 m ofrainfall in a single day (Lal et al., 2006). Therefore,a key goal of monsoon climate change research is toquantify the possible changes to extremes of monsoonrainfall in order to mitigate their associated impactson groundwater, agriculture, waterborne disease, etc.
Several studies have examined changes to the meanIndian summer monsoon and its interannual variabil-ity under anthropogenic greenhouse warming scenar-ios. Turner et al. (2007) showed the Indian mon-soon to be quite robust using a doubled CO2 experi-ment in the Met Office Hadley Centre coupled model(HadCM3). Mean summer (JJAS) rainfall increasedby 3.5% over the Indian land surface, or just over5% when measured over a broader region encompass-ing the Bay of Bengal. In HadCM3, these increases
mainly occur over north India, the southern penin-sula and in the Bay of Bengal. Others such as Huet al. (2000) noted increases over only the peninsula,while Ashrit et al. (2003) describe increased rainfallover the dry northwest and far south in similar exper-iments. In the third Coupled Model IntercomparisonProject (CMIP3) multi-model database used for theIntergovernmental Panel for Climate Change FourthAssessment report (hereafter IPCC AR4), Meehl et al.(2007a) showed JJA mean precipitation projections for2080–2099 in the A1B emissions scenario and found,for the Indian region, that the inter-model spread ofprojections (noise) was larger than the mean pre-cipitation increase (signal). It should be noted thatmost modelling studies, including those in the CMIP3database, have neglected the effects of increasingblack carbon and other aerosol forcings which maylead to decreases in monsoon rainfall (Ramanathanet al. 2005; Lau et al. 2006) or a shift in seasonality(increasing the pre-monsoon at the expense of rain-fall during summer; Meehl et al. 2008). Hence therestill remains considerable uncertainty among state-of-the-art coupled general circulation models (GCMs) inmean projections of monsoon rainfall.
Relatively few studies have examined the projectedchanges to rainfall extremes. Although examiningIndia only in the global context, Meehl et al. (2005)showed a general increase in precipitation intensityover the land surface, attributable to increases in watervapour. Tebaldi et al. (2006) further showed that mean
Copyright 2009 Royal Meteorological Society and Crown Copyright

Future projections of extreme precipitation in the Indian monsoon 153
precipitation was a function of precipitation intensityand the number of wet days. Turner and Slingo (2009)considered changes to precipitation extremes duringthe Indian summer monsoon in HadCM3 at doubledCO2. We showed changes to subseasonal monsoonrainfall extremes with a pattern qualitatively similar tochanges in the mean, but of larger magnitude. Turnerand Slingo (2009) hypothesized that the close rela-tionship between changes to subseasonal extremes andmean projections would be evident in other models,and this paper aims to test that hypothesis. In addition,Turner and Slingo (2009) examined the proposition ofAllen and Ingram (2002) that changes to the magnitudeof the heaviest rainfall events were entirely predictablebased on the degree of surface warming (the climatesensitivity) and Clausius–Clapeyron-related increasesin moisture content of the atmospheric column. Turnerand Slingo (2009) showed that this predictive rela-tionship not only worked globally but also locallyfor the Indian monsoon region during summer. Thisresult is consistent with observed changes in rain-fall extremes over India reported by Goswami et al.(2006). Whether such a relationship exists in othercoupled GCMs under increased greenhouse warminghas not so far been addressed.
This paper aims to extend the work of Turnerand Slingo (2009) using the CMIP3 multi-modeldatabase to test whether changes to the spatial patternof subseasonal extremes can be qualitatively relatedwith those in mean summer rainfall. In addition, weexamine if the thermodynamic predictive relationshipfor the heaviest extremes in Indian monsoon rainfallapplies across all the CMIP3 models, and possiblereasons why this holds in only some cases.
The model data used are described in Section 2,while results are shown in Section 3. Discussionfollows in Section 4.
2. Model data
Coupled model data submitted to the IPCC AR4 havebeen obtained from the CMIP3 database archivedat the Program for Climate Model Diagnostics andIntercomparison (PCMDI) and described in Meehlet al. (2007b).
Only those 15 models for which daily precip-itation diagnostics were available for control and1pctto2x integrations have been used in this study, andthese models are named in Figure 1. The 1pcttto2xexperiment ramps up atmospheric CO2 concentrationat 1% per year from control conditions and after70 years CO2 concentration is fixed for the remain-der of the integration. For most modelling groups,the control integration used pre-industrial levels ofCO2 (hereafter picntrl); however the miub echo g andmri cgcm2 3 2a simulations started from present daycontrol conditions (pdcntrl). Daily data provided forpicntrl covered typically 40 years, while 20 years cen-tred on the time of CO2 doubling (i.e. years 60–80) of
the 1pctto2x integrations were available. Nine modelsalso provide 20 years of data from the end of their1pctto2x integrations, after the stabilization period.This data is assessed separately.
Surface air temperature data derived from the samemodel experiments and time periods were used tocalculate changes in local climate sensitivity (thearea averaged temperature response to CO2 doubling).Zonal wind data were also used to assess changes inwindshear. Only boreal summer (JJA) data were used.
3. Results
3.1. Spatial distribution of subseasonal extremes
To assess the range of projections in the regional distri-bution of Indian summer monsoon subseasonal rainfallextremes at time of CO2 doubling, we calculate var-ious upper percentiles at each gridpoint and for eachseason, before averaging over the number of avail-able years. We emphasize that in this section we aredescribing changes to those extreme events that hap-pen every year (for example, the 99th percentile is oneevent per 100 days, which we sample approximatelyonce per season). In this way, the influence of anyclustering of extreme events (e.g. in ENSO years) canbe reduced. For comparison, we also show changes toJJA mean rainfall.
Projected changes in mean precipitation and in the95th and 99th subseasonal percentiles at the time ofCO2 doubling are shown in Figure 1 for the 15 mod-els. Immediately clear from the upper panel is thepredominant strengthening of mean monsoon rain-fall over the broad Asian monsoon region. In somecases this occurs mainly over the Indian land sur-face (e.g. cnrm cm3, mri cgcm2 3 2a), while in oth-ers the precipitation increase is more widespread(e.g. cccma cgcm3 1, miroc3 2 medres). Some mod-els demonstrate similar greenhouse warming-inducedprecipitation changes to HadCM3 (Turner et al., 2007;Turner and Slingo, 2009), with precipitation increasesover north India and the head of the Bay of Bengal(e.g. bccr bcm2 0, gfdl cm2 0). Among the 15 testedmodels, decreases in mean summer monsoon rainfallover India are rare (e.g. giss model e r).
An examination of the changes to the subseasonalprecipitation extremes (middle and bottom panels ofFigure 1) confirms that the pattern of changes toextreme rainfall days in each monsoon season isclosely tied to that of mean rainfall. However, thechanges in the magnitude of the 95th and 99th per-centiles far exceed those in the mean. Thus the Indianmonsoon region will suffer, almost exclusively amongthese models, much heavier extremes of monsoon rain-fall at the upper percentiles.
To examine the relationship between the spa-tial patterns of change to mean monsoon rainfalland those of subseasonal extremes more closely,we analyse pattern correlations between mean and
Copyright 2009 Royal Meteorological Society and Crown Copyright Atmos. Sci. Let. 10: 152–158 (2009)DOI: 10.1002/asl

154 A. G. Turner and J. M. Slingo
-4.0 -3.0 -2.0 -1.0 -0.5 0.5 1.0 2.0 3.0 4.0mean precipitation difference (mm/day)
bccr_bcm2_0 cccma_cgcm3_1 cnrm_cm3 csiro_mk3_0 csiro_mk3_5
-32.0 -16.0 -8.0 -4.0 -2.0 2.0 4.0 8.0 16.0 32.0extreme precipitation difference (mm/day)
-4.0 -3.0 -2.0 -1.0 -0.5 0.5 1.0 2.0 3.0 4.0mean precipitation difference (mm/day)
gfdl_cm2_0 gfdl_cm2_1 giss_model_e_r ingv_echam4 inmcm3_0
-32.0 -16.0 -8.0 -4.0 -2.0 2.0 4.0 8.0 16.0 32.0extreme precipitation difference (mm/day)
-4.0 -3.0 -2.0 -1.0 -0.5 0.5 1.0 2.0 3.0 4.0mean precipitation difference (mm/day)
ipsl_cm4 miroc3_2_hires miroc3_2_medres miub_echo_g mri_cgcm2_3_2a
-32.0 -16.0 -8.0 -4.0 -2.0 2.0 4.0 8.0 16.0 32.0extreme precipitation difference (mm/day)
Figure 1. JJA precipitation differences between control and 1pctto2x at time of CO2 doubling: (top) mean, (middle) 95thpercentile (bottom) 99th percentile. Positive contours are solid, negative contours are dashed. Shown as three blocks of fivemodels.
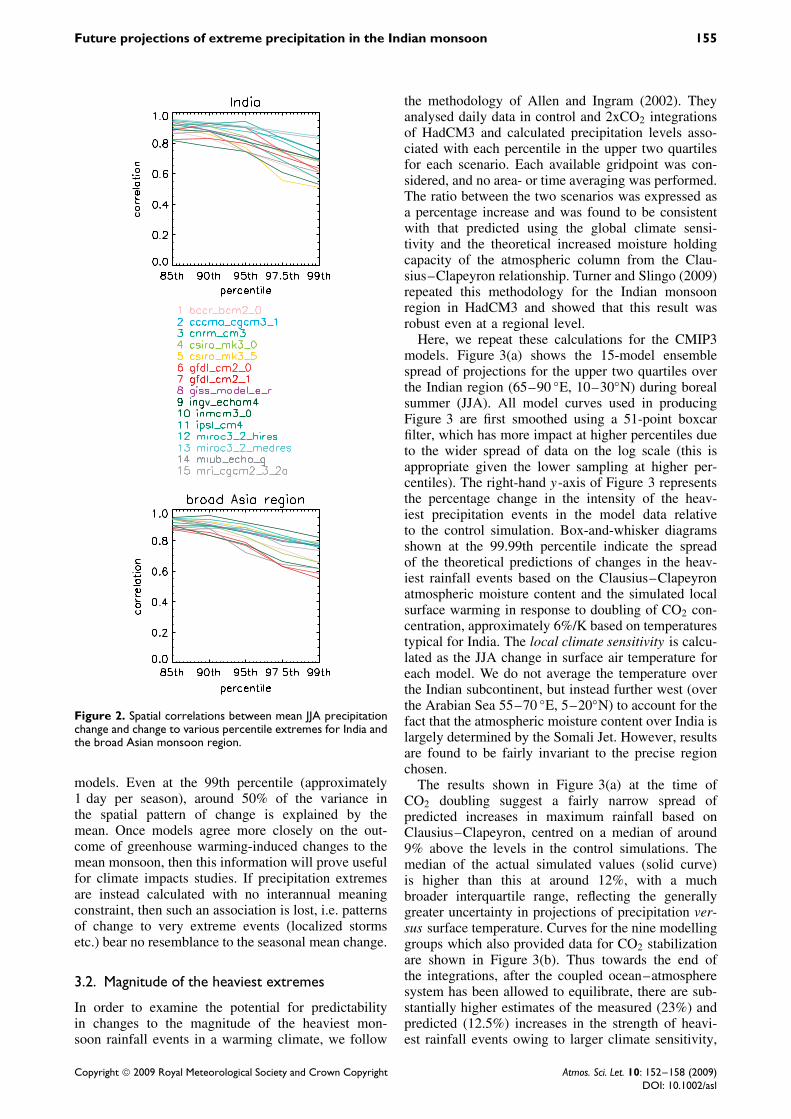
extreme changes at various upper percentiles for India(65–90 ◦E, 10–30◦N) and the broad Asia monsoonregion (40–180 ◦E, 25 ◦S–40◦N) after Annamalaiet al., (2007). The correlations in Figure 2 reveal that
roughly 80% of the spatial pattern of change in the90th percentile can be explained by changes in themean, for both India and the much broader Asianregion. There is considerable consistency between
Copyright 2009 Royal Meteorological Society and Crown Copyright Atmos. Sci. Let. 10: 152–158 (2009)DOI: 10.1002/asl
Future projections of extreme precipitation in the Indian monsoon 155
Figure 2. Spatial correlations between mean JJA precipitationchange and change to various percentile extremes for India andthe broad Asian monsoon region.
models. Even at the 99th percentile (approximately1 day per season), around 50% of the variance inthe spatial pattern of change is explained by themean. Once models agree more closely on the out-come of greenhouse warming-induced changes to themean monsoon, then this information will prove usefulfor climate impacts studies. If precipitation extremesare instead calculated with no interannual meaningconstraint, then such an association is lost, i.e. patternsof change to very extreme events (localized stormsetc.) bear no resemblance to the seasonal mean change.
3.2. Magnitude of the heaviest extremes
In order to examine the potential for predictabilityin changes to the magnitude of the heaviest mon-soon rainfall events in a warming climate, we follow
the methodology of Allen and Ingram (2002). Theyanalysed daily data in control and 2xCO2 integrationsof HadCM3 and calculated precipitation levels asso-ciated with each percentile in the upper two quartilesfor each scenario. Each available gridpoint was con-sidered, and no area- or time averaging was performed.The ratio between the two scenarios was expressed asa percentage increase and was found to be consistentwith that predicted using the global climate sensi-tivity and the theoretical increased moisture holdingcapacity of the atmospheric column from the Clau-sius–Clapeyron relationship. Turner and Slingo (2009)repeated this methodology for the Indian monsoonregion in HadCM3 and showed that this result wasrobust even at a regional level.
Here, we repeat these calculations for the CMIP3models. Figure 3(a) shows the 15-model ensemblespread of projections for the upper two quartiles overthe Indian region (65–90 ◦E, 10–30◦N) during borealsummer (JJA). All model curves used in producingFigure 3 are first smoothed using a 51-point boxcarfilter, which has more impact at higher percentiles dueto the wider spread of data on the log scale (this isappropriate given the lower sampling at higher per-centiles). The right-hand y-axis of Figure 3 representsthe percentage change in the intensity of the heav-iest precipitation events in the model data relativeto the control simulation. Box-and-whisker diagramsshown at the 99.99th percentile indicate the spreadof the theoretical predictions of changes in the heav-iest rainfall events based on the Clausius–Clapeyronatmospheric moisture content and the simulated localsurface warming in response to doubling of CO2 con-centration, approximately 6%/K based on temperaturestypical for India. The local climate sensitivity is calcu-lated as the JJA change in surface air temperature foreach model. We do not average the temperature overthe Indian subcontinent, but instead further west (overthe Arabian Sea 55–70 ◦E, 5–20◦N) to account for thefact that the atmospheric moisture content over India islargely determined by the Somali Jet. However, resultsare found to be fairly invariant to the precise regionchosen.
The results shown in Figure 3(a) at the time ofCO2 doubling suggest a fairly narrow spread ofpredicted increases in maximum rainfall based onClausius–Clapeyron, centred on a median of around9% above the levels in the control simulations. Themedian of the actual simulated values (solid curve)is higher than this at around 12%, with a muchbroader interquartile range, reflecting the generallygreater uncertainty in projections of precipitation ver-sus surface temperature. Curves for the nine modellinggroups which also provided data for CO2 stabilizationare shown in Figure 3(b). Thus towards the end ofthe integrations, after the coupled ocean–atmospheresystem has been allowed to equilibrate, there are sub-stantially higher estimates of the measured (23%) andpredicted (12.5%) increases in the strength of heavi-est rainfall events owing to larger climate sensitivity,
Copyright 2009 Royal Meteorological Society and Crown Copyright Atmos. Sci. Let. 10: 152–158 (2009)DOI: 10.1002/asl

156 A. G. Turner and J. M. Slingo
Figure 3. Model spread of precipitation magnitude increase due to greenhouse warming for the upper two quartiles for all pointsin the Indian region: (a) at time of CO2 doubling; (b) at CO2 stabilization. Thick curves show median; spread gives interquartilerange. Boxplots indicate max/min, interquartile range and median of the predicted increases to the heaviest rainfall.
Table I. List of CMIP3 models used showing measured and predicted increases in intensity of the heaviest rainfall, and ranked bytheir ratio.
Model Measured (%) Predicted (%) Ratio Convection ∆Shear (m/s)gfdl cm2 0 50.71 8.65 5.86 Moorthi-Suarez relaxed AS −1.84csiro mk3 0 34.16 9.97 3.43 Gregory-Rowntree mass flux −1.51gfdl cm2 1 30.24 9.30 3.25 Moorthi-Suarez relaxed AS −2.74cccma cgcm3 1 27.26 10.26 2.66 Zhang-MacFarlane variant on AS −4.66miroc3 2 medres 24.72 13.02 1.90 Pan-Randall prognostic AS −6.47miroc3 2 hires 23.33 14.81 1.58 Pan-Randall prognostic AS −11.27miub echo g 15.89 11.11 1.43 Tiedke mass flux −1.96csiro mk3 5 7.09 5.23 1.36 Gregory-Rowntree mass flux −1.51mr i cgcm2 3 2a 12.07 10.79 1.12 Pan-Randall prognostic AS −9.51cnrm cm3 8.92 9.78 0.91 mass flux with Kuo closure 2.63ingv echam4 8.87 9.93 0.89 Tiedke mass flux −5.19inmcm3 0 0.72 Betts; convective adjustment −0.71bccr bcm2 0 1.87 8.15 0.23 mass flux with Kuo closure −0.82ipsl cm4 −1.06 11.31 −0.09 Grandpeix variant on Emanuel mass flux −2.87giss model e r −1.33 12.21 −0.11 Del Genio-Yao mass flux −12.01
6.15 8.51
Models are split into three categories as described in the text. Detailed references for convection schemes can be found at http://www-pcmdi.llnl.gov/ipcc/model documentation/ipcc model documentation.php Colouring indicates models using identical convection schemes. ‘AS’ indicatesArakawa–Schubert. Also shown are changes in wind shear (U850 − U200; for region see text).
although greater uncertainty is shown by the interquar-tile range.
To examine whether there is any predictability inprojected changes to the heaviest monsoon rainfall assuggested in Turner and Slingo (2009), Table I liststhe models used ranked in descending order based onthe ratio of measured increase in heaviest rainfall tothe Clausius–Clapeyron predictions. We stratify themodels according to whether the simulated changes inthe heaviest events fall below (ratio <0.5; three mod-els), are close to (0.5 < ratio <1.5; six models) or farexceed (ratio >1.5; six models) those expected fromthe Clausius–Clapeyron relationship. Here we attemptto partially explain the diverse behaviour based onthe convective parameterization used. We suggest thatthose models in the former two categories predomi-nantly (though not exclusively) feature bulk mass-fluxschemes (e.g. cnrm cm3 with Kuo closure). Thesestrongly depend on surface evaporation (e.g. Slingoet al., 1994; Pattanaik and Satyan, 2000) and con-sist of single entraining plumes reliant on adiabatic
ascent from the lowest model level – hence surfacetemperature changes provide a strong constraint. Oth-ers such as the Betts scheme (in inmcm3 0) employconvective adjustment to a defined thermodynamic ref-erence profile (as described in Slingo et al., 1994)and are also strongly constrained. Such simple clas-sification fails to explain why some models shouldhave near-zero changes to the heaviest rainfall despitewarming temperatures. While the giss e r model evenshowed clear decreases in mean rainfall over India,no such monsoon weakening occurred in bccr bcm2 0and ipsl cm4. None of these three models was judgedto successfully simulate the seasonal cycle of the mon-soon in Annamalai et al. (2007), however. The resultfrom the six near-Clausius–Clapeyron models sug-gests that in their case the increase in the heaviestrainfall is predictable based on the moisture hold-ing capacity of the atmospheric column and the localsurface warming. Given that there is currently muchgreater predictability in changes to future mean sur-face temperature than mean precipitation, this result
Copyright 2009 Royal Meteorological Society and Crown Copyright Atmos. Sci. Let. 10: 152–158 (2009)DOI: 10.1002/asl

Future projections of extreme precipitation in the Indian monsoon 157
indicates that the degree of change to very extrememonsoon rainfall may, in some way, also be pre-dictable.
In contrast, the super-thermodynamic categorymainly features variants on the Arakawa–Schubert(AS) scheme (relaxed as in the GFDL models –Moorthi and Suarez, 1992; or prognostic closure asin the MIROC models – Pan and Randall, 1998). TheZhang–McFarlane scheme is also of similar concept(Zhang and McFarlane, 1995). These schemes param-eterize deep convection with plume ensembles ableto initiate from several levels in the vertical and arehence not so constrained by changes in surface condi-tions. In a direct comparison of the impact of cumu-lus parameterization on the Indian monsoon, Pattanaikand Satyan (2000) used the COLA GCM to demon-strate much stronger convective latent heating ratesand mean precipitation over the Indian region usingthe relaxed AS scheme compared to the Kuo mass flux,consistent with the results here. In addition, testing therelaxed AS scheme from the GFDL models as part ofa non-rotating radiative-convective model, Held et al.(2007) demonstrated increasing large-scale precipita-tion in the tropics with temperature, above a criticalthreshold. This may explain why the thermodynamicrelationship may not hold for the GFDL models. Thoseauthors suggest that such changes in these ‘gridpoint’storms may have an undesirable impact on model cli-mate response. Allan and Soden (2008) compared theoccurrence of extreme rainfall events in the tropics inobservations during cold and warm periods and noted aclear link between rainfall extremes and temperature.Using gfdl cm2 1 as an example, they also suggestthat GCMs may be under-predicting the increase inheavy event (frequency) during warm periods whencompared to observations. The results presented here,however, suggest that gfdl cm2 1 is an outlier com-pared to the other GCMs in the CMIP3 database (withheaviest rainfall increasing by around 30% at CO2doubling). We note, however, that its basic monsoonsimulation was judged by Annamalai et al. (2007) tobe one of the six best performers.
A clear anomaly in Table I is that of the twoCSIRO models, which feature identical bulk mass-flux convection scheme (and the same as HadCM3).The csiro mk3 0 model is strongly super-thermo-dynamic, while the level of heavy rainfall in csiromk3 5 is quite predictable, suggesting that otherfactors play a role. Other model pairs such as GFDLand MIROC behave similarly, however.
Other factors were also examined. A cursory analy-sis of horizontal resolution in the models’ atmosphericcomponent (not shown) reveals no clear bias in mag-nitude of the heaviest events (or in spatial changesto extremes). Simple metrics of wind behaviour overthe monsoon domain were also examined. As anexample, the table lists changes in mean JJA zonalwindshear (U850 − U200) over the broad Asian region(40–110 ◦E, 5–20◦N). One might expect those modelswith strong decreases in zonal windshear to undergo
greater increases in tropical storms (as noted in theobserved record by Muni Krishna, 2009). However,no such relationship is seen.
4. Discussion and conclusions
This study has examined the uncertainty in pro-jected changes to the spatial pattern and magnitudeof rainfall extremes during the Indian summer mon-soon in the 1pctto2x scenario of the CMIP3 mod-els. In an earlier study based on a single model,Turner and Slingo (2009) raised some questions whichthis paper has sought to address. Firstly, to whatextent are changes to subseasonal extremes of mon-soon precipitation under greenhouse gas warmingtied to changes in the mean rainfall, and secondly,whether regional surface warming (local climate sen-sitivity) may lend predictability to changes in mag-nitude of the heaviest rainfall events, in this caseover the Indian monsoon region, through the Clau-sius–Clapeyron relationship.
Despite much uncertainty in their local distribution,mean rainfall changes over the Indian monsoon regionpredominantly range from zero to positive, and arenegative in only one model (we reiterate the caveatthat black carbon and some other aerosol forcings arenot represented in these model outputs). As hypoth-esized, changes to subseasonal precipitation extremesoccurring in each season are quite predictable basedon the model-dependent pattern of mean change.
The CMIP3 database was also examined to deter-mine whether models other than HadCM3 display aclose relationship between simulated changes in theheaviest monsoon rainfall events and theoretical pre-dictions based on local surface warming and the Clau-sius–Clapeyron relationship. We have shown here that6 of the 15 models tested suggest this to be the case.Of the remainder, six show that measured increases inthe strength of the heaviest rainfall events exceed pre-dicted changes by quite some margin, suggesting thatthere is some additional contribution to these extremeswhich is unrelated to local surface warming. This isin agreement with a hypothesis of Turner and Slingo(2009) that the local warming may provide a lowerbound to the increase in the heaviest monsoon rain-fall. It is intriguing why there is a small subset ofmodels that do not even obey this lower bound andshow virtually no change in heaviest rainfall despite,in some cases, an increase in the mean.
Although we have suggested that differences inthe convective parameterization used may be at theroot of this diversity, there remains scope for morecareful analysis of these results. Of most interest isthat some models that generally feature variants onthe AS scheme show an additional component in theirheaviest extremes, whereas others using bulk mass-flux schemes are more closely dependent on surfacethermodynamic changes. Clearly, the reasons for suchdifferences and the suitability of different schemes
Copyright 2009 Royal Meteorological Society and Crown Copyright Atmos. Sci. Let. 10: 152–158 (2009)DOI: 10.1002/asl

158 A. G. Turner and J. M. Slingo
for the climate change problem need to be urgentlyaddressed. An authoritative comparison of differentconvective parameterizations in a range of differentGCMs would further this goal. In the multi-modelframework used here, there may also be other factorsthat influence the differences in behaviour.
Finally, it should be stressed that this study onlyapplies to extremes over the Indian region, whichrepresents an environment that is well supplied byatmospheric moisture through the southwest monsoonflow, such that the Clausius–Clapeyron relationshipis likely to be a major constraint. It is not obviousthat this result can be extended to more continentalenvironments which are moisture limited and wherechanges in advection and dynamical feedbacks maybe more critical.
Acknowledgements
We acknowledge the modelling groups, the PCMDI and theWCRP’s Working Group on Coupled Modelling (WGCM)for their roles in making available the WCRP CMIP3 multi-model dataset. Support of this dataset is provided by theOffice of Science, U.S. Department of Energy. A.G. Turneris a member of the NERC National Centre for AtmosphericScience-Climate Directorate and was funded through the EU-ENSEMBLES project. The authors wish to thank the Editor(Alan Gadian), G. Meehl, and a further anonymous reviewerfor their constructive comments.
References
Allen MR, Ingram WJ. 2002. Constraints on future changes inclimate and the hydrologic cycle. Nature 419: 224–232.DOI:10.1038/nature01092.
Allan RP, Soden BJ. 2008. Atmospheric warming and the amplifi-cation of precipitation extremes. Science 321(5895): 1481–1484.DOI:10.1126/science.1160787.
Annamalai H, Hamilton K, Sperber KR. 2007. The South Asiansummer monsoon and its relationship with ENSO in theIPCC AR4 simulations. Journal of Climate 20: 1071–1092.DOI:10.1175/JCLI4035.1.
Ashrit R, Douville H, Kumar K. 2003. Response of the Indian mon-soon and ENSO-monsoon teleconnection to enhanced greenhouseeffect in the CNRM coupled model. Journal of the MeteorologicalSociety of Japan 81: 779–803. DOI:10.2151/jmsj.81.779.
Goswami BN, Venugopal V, Sengupta D, Madhusoodanan MS,Xavier PK. 2006. Increasing trend of extreme rain events overIndia in a warming environment. Science 314: 1442–1445.DOI:10.1126/science.1132027.
Held IM, Zhao M, Wyman B. 2007. Dynamic radiative-convectiveequilibria using GCM column physics. Journal of the AtmosphericSciences 64: 228–238.
Hu ZZ, Latif M, Roeckner E, Bengtsson L. 2000. Intensified Asiansummer monsoon and its variability in a coupled model forcedby increasing greenhouse gas concentrations. Geophysical ResearchLetters 27: 2618–2684. DOI:10.1029/2000GL011550.
Lal B, Jayanthi N, Prasad T, Rajeevan M, Devi S, Srivastava AK,Pai DS. 2006. Monsoon 2005: A Report . National Climate Centre,Indian Meteorological Department: Pune.
Lau KM, Kim MK, Kim KM. 2006. Asian summer monsoonanomalies induced by aerosol direct forcing: the role of the TibetanPlateau. Climate Dynamics 26: 855–864.
Meehl GA, Arblaster JM, Tebaldi C. 2005. Understanding future pat-terns of precipitation extremes in climate model simulations. Geo-physical Research Letters 32: L18719. DOI:10.1029/2005GL023680.
Meehl G, Stocker T, Collins W, Friedlingstein P, Gaye A, Gregory J,Kitoh A, Knutti R, Murphy J, Noda A, Raper S, Watterson I,Weaver A, Zhao ZC. 2007a. Global climate projections, chapter 10.In: Climate Change 2007: The Physical Science Basis. Contributionof Working Group I to the Fourth Assessment Report of theIntergovernmental Panel on Climate Change. Solomon S, Qin D,Manning M, Chen Z, Marquis M, Averyt KB, Tignor M, Miller HL(eds). Cambridge University Press: Cambridge, New York; 747–846.
Meehl GA, Covey C, Delworth T, Latif M, McAveney B,Mitchell JFB, Stouffer RJ, Taylor KE. 2007b. The WCRPCMIP3 mutli-model dataset: a new era in climate changeresearch. Bulletin of the American Meteorological Society 88:1383–1394.
Meehl GA, Arblaster JM, Collins WD. 2008. Effects of black carbonaerosols on the Indian monsoon. Journal of Climate 21: 2869–2882.
Moorthi S, Suarez MJ. 1992. Relaxed Arakawa-Schubert: a parameter-ization of moist convection for general circulation models. MonthlyWeather Review 120: 978–1002.
Muni Krishna K. 2009. Intensifying tropical cyclones over the northIndian Ocean during summer monsoon-global warming. Global andPlanetary Change 65: 12–16.
Pan D-M, Randall D. 1998. A cumulus parameterization with aprognostic closure. Quarterly Journal of the Royal MeteorologicalSociety 124: 949–981.
Pattanaik DR, Satyan V. 2000. Effect of cumulus parameterizationon the Indian summer monsoon simulated by the COLA generalcirculation model. Journal of the Meteorological Society of Japan78: 701–717.
Ramanathan V, Chung C, Kim D, Bettge T, Buja L, Kiehl JT,Washington WM, Fu Q, Sikka DR, Wild M. 2005. Atmosphericbrown clouds: impacts on South Asian climate and hydrologicalcycle. Proceedings of the National Academy of Sciences of the UnitedStates of America 102: 5326–5333.
Slingo J, Blackburn M, Betts A, Brugge R, Hodges K, Hoskins B,Miller M, Steenman-Clark L, Thuburn J. 1994. Mean climate andtranscience in the tropics of the UGAMP GCM: sensitivityto convective parameterization. Quarterly Journal of the RoyalMeteorological Society 120: 881–922.
Tebaldi C, Arblaster JM, Hayhoe K, Meehl GA. 2006. Going to theextremes: an intercomparison of model-simulated historical andfuture changes in extreme events. Climatic Change 79: 185–211.DOI:10.1007/s10584-006-9051-4.
Turner AG, Inness PM, Slingo JM. 2007. The effect of doubled CO2
and model basic state biases on the monsoon-ENSO system. I: meanresponse and interannual variability. Quarterly Journal of the RoyalMeteorological Society 133: 1143–1157. DOI:10.1002/qj.82.
Turner AG, Slingo JM. 2009. Subseasonal extremes of precipitationand active-break cycles of the Indian summer monsoon in a climatechange scenario. Quarterly Journal of the Royal MeteorologicalSociety 135: 549–567. DOI:10.1002/qj.401.
Zhang GJ, McFarlane NA. 1995. Sensitivity of climate simulations tothe parameterization of cumulus convection in the Canadian climatecentre general circulation model. Atmosphere-Ocean 33: 407–446.
Copyright 2009 Royal Meteorological Society and Crown Copyright Atmos. Sci. Let. 10: 152–158 (2009)DOI: 10.1002/asl