unaudited interim condensed consolidated financial ... · gamenet group unaudited interim condensed...
TRANSCRIPT
GAMENET GROUP
UNAUDITED INTERIM CONDENSED CONSOLIDATED
FINANCIAL STATEMENTS
AS OF MARCH 31, 2017 AND FOR THE THREE MONTHS ENDED
MARCH 31, 2017 AND 2016
The following information is confidential and does not constitute an offer to sell or a solicitation of an offer to buy any securities of Gamenet Group S.p.A. or any of its subsidiaries or affiliates. Any such securities may not be offered or sold in the United States absent registration unless pursuant to an applicable exemption from the registration requirements of the U.S. Securities Act and other applicable securities laws. The information provided on the following pages is not intended for distribution into or within the United States of America or to U.S. persons other than to “qualified institutional buyers” as defined under Rule 144A of the U.S. Securities Act. Statements on the following pages which are not historical facts are forward-looking statements. All forward-looking statements involve risks and uncertainties which could affect Gamenet Group S.p.A.’s actual results and could cause its actual results to differ materially from those expressed in any forward-looking statements made by, or on behalf of, Gamenet Group S.p.A..
Management’s report on the Group’s result at March 31, 2017
BASIS OF PRESENTATION Gamenet Group S.p.A. (hereafter ‘‘Gamenet Group’’, the ‘‘Company’’ or the ‘‘Parent’’ and together with its subsidiaries and associates the ‘‘Group’’ or “Gamenet Group”) is a company incorporated and domiciled in Italy, with registered offices in Rome, Corso d’Italia 6, organized under the laws of the Republic of Italy. The Company was incorporated on June 21, 2016 to effect the acquisition (hereafter the ‘‘Acquisition”) on June 27, 2016 of Intralot Holding & Services S.p.A. (hereafter ‘‘Intralot”) by Gamenet S.p.A. (hereafter ‘‘Gamenet”).
The Company is controlled by TCP Lux Euroinvest S.à.r.l. (hereafter ‘‘TCP”), which holds 79.1% of the share capital; the remaining share capital is held 20% by the Dutch company Intralot Italian Investments B.V. (hereafter “Intralot B.V.”) and 0.9% by Stefano Francolini. Gamenet Group is one of the largest operators in the Italian public gaming sector, which is regulated by the Customs and
Monopolies Agency (Agenzia delle Dogane e dei Monopoli hereafter “ADM”). The Group is an active gaming concessionaire and
has a product offering ranging from AWP (Amusement With Prizes) and VLT (Video Lottery Terminals), to management of
its nationwide network of variously branded company owned points of sales, betting and online as well as service provision
to business partners.
This report on operations has been prepared to provide additional information and offer a more complete representation of the Group’s financial position and economic results.
OVERVIEW
We are one of the largest players in the gaming industry in Italy based on total bet and distribution network with Euro 1.8 billion in bets collected in the three months ended March 31, 2017 across a network of approximately 14,000 points of sale.
As of March 31, 2017, our distribution network included 781 gaming halls. Of the 781 gaming halls in our distribution network, we owned (or held a majority interest) in 64. In these gaming halls, we hold the required authorizations and the lease contracts.
The Group operates in four main business areas: (i) video lottery terminal (“VLT”), (ii) amusement with prize (“AWP”), (iii) betting and online (“Betting and online”), (iv) company owned gaming halls and direct AWP operations (“Retail and Street Operations”).
VLT
VLTs were first introduced to Italy in August 2010 and to date they represent the most innovative and attractive gaming solution for players, due to the wide variety of games offered and a high average payout ratio. They also offer the chance to win jackpots of up to Euro 500,000.
At present, Gamenet offers three VLT platforms, Spielo, Novomatic and Inspired, which differ in terms of the games on offer and whether or not jackpots are foreseen.
Group VLTs accept Euro 0.50, Euro 1 and Euro 2 coins as well as Euro 5, Euro 10, Euro 20, Euro 50 and Euro 100 notes. In each game, bets may range from a minimum of Euro 0.50 to a maximum of Euro 10.
The percentage of bets paid out as winnings may not be lower than 85%, with reference both to the gaming system as a whole and to each individual game.
The maximum payout for a single game is Euro 5,000. However, in the case of the Spielo VLTs, higher winnings are possible as a result of the Jackpot mechanism referred to above.
As of March 31, 2017 we operated 8,225 VLTs.
MANAGEMENT’S REPORT ON THE GROUP’S RESULT AT
MARCH 31, 2017
AWP
AWPs are traditional slot machines that offer players a good level of interaction, using a graphical reel containing pictures; they also offer controlled-win games that pay cash to winners.
The maximum cost of each single game is Euro 1.00 and the maximum win is set at Euro 100.00. Each game must last at least 4 seconds and any winnings must be distributed immediately after the game (only) in coins.
Winnings, which are calculated by the machines on a random basis over a cycle comprising a maximum of 140,000 games, must not fall below 70% of the amounts bet. New slot machines may not reproduce the game of poker nor, even partially, its basic rules.
AWPs may be installed in all authorized betting shops pursuant to Articles 86 or 88 of the TULPS, including bars, coffee shops and similar outlets, public gaming halls, horse racing and sports betting shops and corners, etc.
As of March 31, 2017 we provided network connection services to 40,384 AWPs.
Betting and online
Gamenet Group is active in the betting and online segment through a network of around 750 sport betting rights e 58 horse betting rights. The Company operates through its subsidiaries Gamenet Scommesse S.p.A. Intralot Italia S.p.A. and Veneta Servizi which offer their customers a wide range of games mainly including sports betting, virtual games and horse racing through 683 active points of sale. In addition, a wide variety of online products including poker casino games, bingo and prediction games are offered through the websites Gamenet.it and Intralot.it.
Retail and Street Operations
In 2012, Gamenet Group began to pursue a strategy of vertical integration in the retail segment by establishing a company, Gamenet Entertainment S.r.l., to conduct gaming hall business. Significant efforts have resulted in the Group now directly managing 64 company-owned gaming halls (7 of which are large-size gaming halls).
More recently, the Group continued pursuing its vertical integration strategy through:
• Retail: the acquisition, in March 2015, of 51% of Billions Italia S.r.l. (which opened two additional gaming halls during 2016); the acquisition through Gamenet Entertainment S.r.l. of 100% of Gamecity S.r.l. in August 2016; Verve S.p.A.’s company owned gaming hall started operations in 2016 (as also disclosed later in this document, the Group in April 2016 increased its equity interest in Verve from 51% to 100%); the acquisition, in March 2017, through Gamenet Entertainment, of 60% of La Chance S.r.l., which owns the entire share capital of Slot Planet S.r.l.
• Street Operations: the acquisition of 100% of Gnetwork S.r.l. in August 2015; the acquisition of 70% of Jolly Videogiochi S.r.l. and 51% of NewMatic S.r.l. in June 2016, all aimed at developing the Group’s position in the AWP Street Operations business.
• Service providing: the acquisition in July 2016 of 60% of Agesoft S.r.l., a company specialized in the development of software for the AWP business.
Significant events
Relating to Gamenet Group S.p.A.
On March 23, 2017 Intralot Global Holdings B.V., which held 20% of the issued and paid up share capital of Gamenet Group S.p.A., contributed and transferred the full legal and beneficial right, title and interest in and to Intralot Italian Investments B.V., in which Intralot Global Holdings B.V. holds the entire issued share capital. Relating to Gamenet S.p.A. / Intralot Gaming Machines S.p.A. / Intralot Holdigs & Services S.p.A
• On January 31, 2017, 2% of the share capital of Intralot Gaming Machines S.p.A., owned by Gamenet S.p.A., was transferred to Intralot Holding & Services S.p.A.. As a result of this operation, the company's share capital is now 100% owned by Intralot Holding & Services S.p.A..

MANAGEMENT’S REPORT ON THE GROUP’S RESULT AT
MARCH 31, 2017
• During the first quarter of 2017, the board of directors of Gamenet S.p.A. / Intralot Holdings & Services S.pA. / Intralot Gaming Machines S.p.A. approved the merger project (“Progetto di Fusione”) of both Intralot Gaming Machines S.p.A. and Intralot Holdings & Services S.p.A. into Gamenet S.p.A. The merger, which is expected to be completed during the second quarter of 2017, is meant to streamline the existing corporate structure.
Relating to Gamenet Entertainment S.r.l.
On March 2, 2017 Gamenet Entertainment S.r.l. acquired 60% of the share capital of La Chance S.r.l., which owns the entire share capital of Slot Planet S.r.l.. These companies are active in the public gaming sector through the management of VLT gaming halls.
MANAGEMENT’S REPORT ON THE GROUP’S RESULT AT
MARCH 31, 2017
ECONOMIC TRENDS
The following tables set forth key information relating to the Italian economy trend:
For the three months ended March 31, June 30, September 30 and December 31 Gross Domestic I Q II Q III Q IV Q I Q II Q III Q IV Q I Q II Q III Q IV Q I Q
product1 2014 2014 2014 2014 2015 2015 2015 2015 2016 2016 2016 2016 2017
-0.5% -0.3% -0.1% 0.0% 0.4% 0.3% 0.2% 0.1% 0.3% 0.0% 0.3% 0.2% 0.2%
First quarter’s 2017 Italian GDP increased by 0.2 per cent with respect to the fourth quarter of 2016 and by 0.8 per cent in comparison with the first quarter of 2016.
The inflation rate in the first quarter 2017 in comparison with the first quarter of 2016 is set below:
Three months ended March 31,
2016 2017
Inflation rate23 0.5% 1.4%
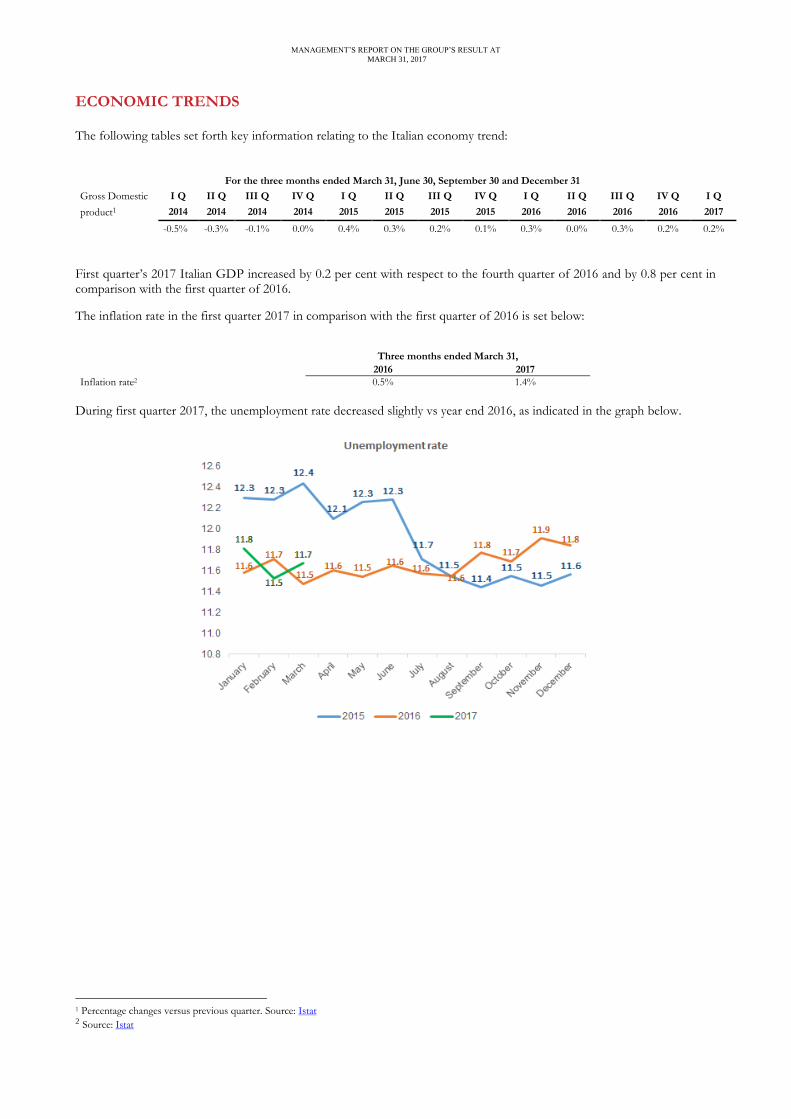
During first quarter 2017, the unemployment rate decreased slightly vs year end 2016, as indicated in the graph below.
1 Percentage changes versus previous quarter. Source: Istat 2 Source: Istat
MANAGEMENT’S REPORT ON THE GROUP’S RESULT AT
MARCH 31, 2017
OPERATING INFORMATION
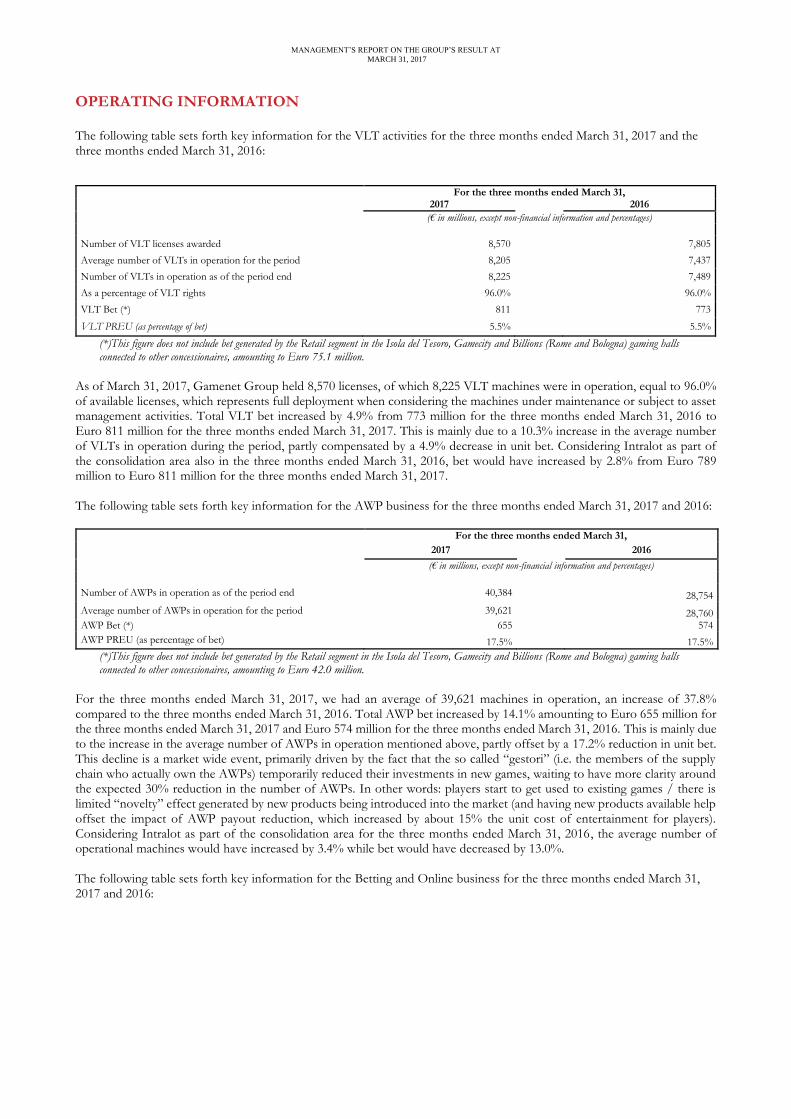
The following table sets forth key information for the VLT activities for the three months ended March 31, 2017 and the three months ended March 31, 2016:
For the three months ended March 31, 2017 2016
(€ in millions, except non-financial information and percentages)
Number of VLT licenses awarded 8,570
7,805
Average number of VLTs in operation for the period 8,205
7,437
Number of VLTs in operation as of the period end 8,225
7,489
As a percentage of VLT rights 96.0%
96.0%
VLT Bet (*) 811
773
VLT PREU (as percentage of bet) 5.5% 5.5%
(*)This figure does not include bet generated by the Retail segment in the Isola del Tesoro, Gamecity and Billions (Rome and Bologna) gaming halls connected to other concessionaires, amounting to Euro 75.1 million.
As of March 31, 2017, Gamenet Group held 8,570 licenses, of which 8,225 VLT machines were in operation, equal to 96.0% of available licenses, which represents full deployment when considering the machines under maintenance or subject to asset management activities. Total VLT bet increased by 4.9% from 773 million for the three months ended March 31, 2016 to Euro 811 million for the three months ended March 31, 2017. This is mainly due to a 10.3% increase in the average number of VLTs in operation during the period, partly compensated by a 4.9% decrease in unit bet. Considering Intralot as part of the consolidation area also in the three months ended March 31, 2016, bet would have increased by 2.8% from Euro 789 million to Euro 811 million for the three months ended March 31, 2017. The following table sets forth key information for the AWP business for the three months ended March 31, 2017 and 2016:
For the three months ended March 31,
2017 2016
(€ in millions, except non-financial information and percentages)
Number of AWPs in operation as of the period end 40,384 28,754
Average number of AWPs in operation for the period 39,621 28,760
AWP Bet (*) 655 574
AWP PREU (as percentage of bet) 17.5% 17.5%
(*)This figure does not include bet generated by the Retail segment in the Isola del Tesoro, Gamecity and Billions (Rome and Bologna) gaming halls connected to other concessionaires, amounting to Euro 42.0 million.
For the three months ended March 31, 2017, we had an average of 39,621 machines in operation, an increase of 37.8% compared to the three months ended March 31, 2016. Total AWP bet increased by 14.1% amounting to Euro 655 million for the three months ended March 31, 2017 and Euro 574 million for the three months ended March 31, 2016. This is mainly due to the increase in the average number of AWPs in operation mentioned above, partly offset by a 17.2% reduction in unit bet. This decline is a market wide event, primarily driven by the fact that the so called “gestori” (i.e. the members of the supply chain who actually own the AWPs) temporarily reduced their investments in new games, waiting to have more clarity around the expected 30% reduction in the number of AWPs. In other words: players start to get used to existing games / there is limited “novelty” effect generated by new products being introduced into the market (and having new products available help offset the impact of AWP payout reduction, which increased by about 15% the unit cost of entertainment for players). Considering Intralot as part of the consolidation area for the three months ended March 31, 2016, the average number of operational machines would have increased by 3.4% while bet would have decreased by 13.0%. The following table sets forth key information for the Betting and Online business for the three months ended March 31, 2017 and 2016:
MANAGEMENT’S REPORT ON THE GROUP’S RESULT AT
MARCH 31, 2017
For the three months ended March 31,
2017 2016
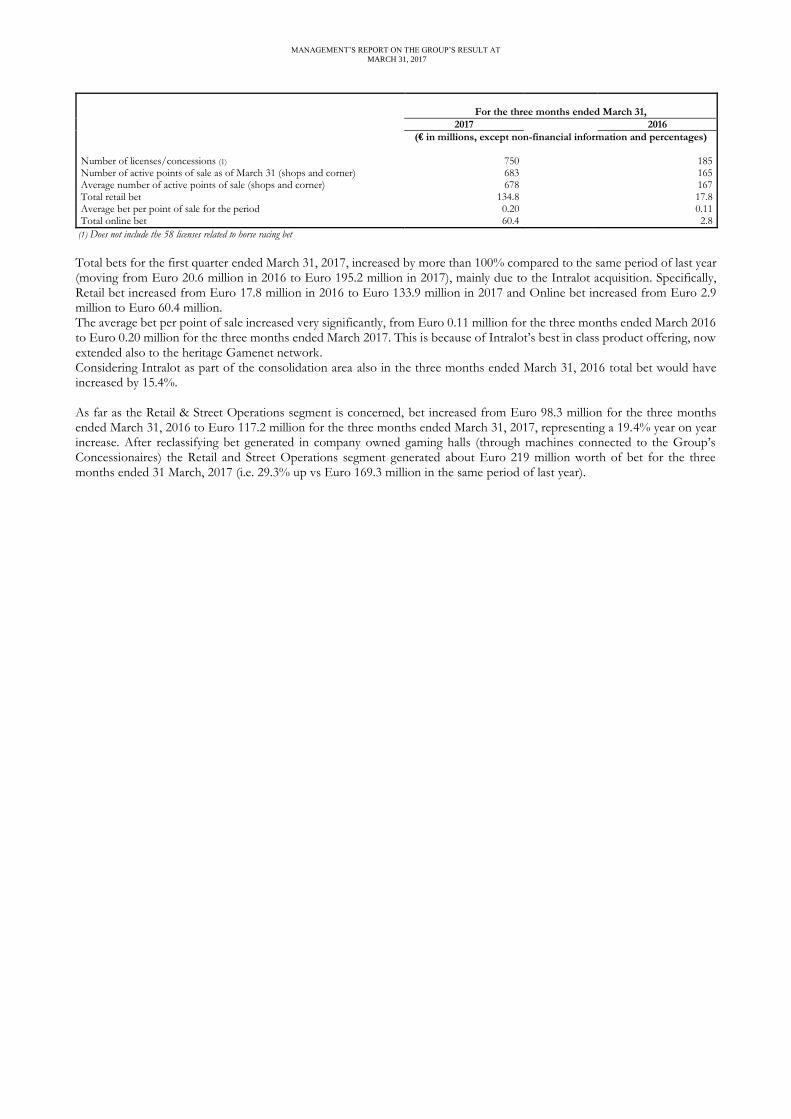
(€ in millions, except non-financial information and percentages) Number of licenses/concessions (1) 750 185 Number of active points of sale as of March 31 (shops and corner) 683 165 Average number of active points of sale (shops and corner) 678 167 Total retail bet 134.8 17.8 Average bet per point of sale for the period 0.20 0.11 Total online bet 60.4 2.8
(1) Does not include the 58 licenses related to horse racing bet Total bets for the first quarter ended March 31, 2017, increased by more than 100% compared to the same period of last year (moving from Euro 20.6 million in 2016 to Euro 195.2 million in 2017), mainly due to the Intralot acquisition. Specifically, Retail bet increased from Euro 17.8 million in 2016 to Euro 133.9 million in 2017 and Online bet increased from Euro 2.9 million to Euro 60.4 million. The average bet per point of sale increased very significantly, from Euro 0.11 million for the three months ended March 2016 to Euro 0.20 million for the three months ended March 2017. This is because of Intralot’s best in class product offering, now extended also to the heritage Gamenet network. Considering Intralot as part of the consolidation area also in the three months ended March 31, 2016 total bet would have increased by 15.4%. As far as the Retail & Street Operations segment is concerned, bet increased from Euro 98.3 million for the three months ended March 31, 2016 to Euro 117.2 million for the three months ended March 31, 2017, representing a 19.4% year on year increase. After reclassifying bet generated in company owned gaming halls (through machines connected to the Group’s Concessionaires) the Retail and Street Operations segment generated about Euro 219 million worth of bet for the three months ended 31 March, 2017 (i.e. 29.3% up vs Euro 169.3 million in the same period of last year).
MANAGEMENT’S REPORT ON THE GROUP’S RESULT AT
MARCH 31, 2017
KEY FINANCIAL INDICATORS
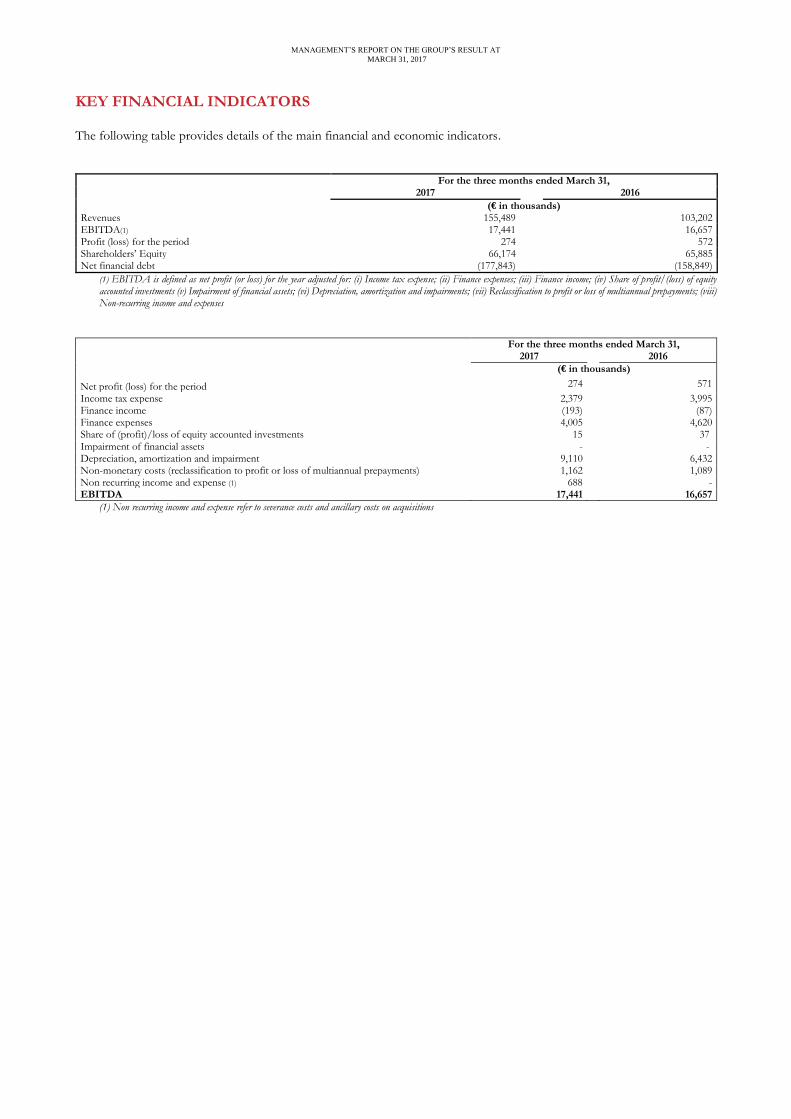
The following table provides details of the main financial and economic indicators.
For the three months ended March 31, 2017 2016
(€ in thousands) Revenues 155,489 103,202 EBITDA(1) 17,441 16,657 Profit (loss) for the period 274 572 Shareholders’ Equity 66,174 65,885 Net financial debt (177,843) (158,849)
(1) EBITDA is defined as net profit (or loss) for the year adjusted for: (i) Income tax expense; (ii) Finance expenses; (iii) Finance income; (iv) Share of profit/(loss) of equity accounted investments (v) Impairment of financial assets; (vi) Depreciation, amortization and impairments; (vii) Reclassification to profit or loss of multiannual prepayments; (viii) Non-recurring income and expenses
For the three months ended March 31, 2017 2016
(€ in thousands)
Net profit (loss) for the period 274
571
Income tax expense 2,379 3,995 Finance income (193) (87) Finance expenses 4,005 4,620 Share of (profit)/loss of equity accounted investments 15 37 Impairment of financial assets - - Depreciation, amortization and impairment 9,110 6,432 Non-monetary costs (reclassification to profit or loss of multiannual prepayments) 1,162 1,089 Non recurring income and expense (1) 688 - EBITDA 17,441 16,657
(1) Non recurring income and expense refer to severance costs and ancillary costs on acquisitions
MANAGEMENT’S REPORT ON THE GROUP’S RESULT AT
MARCH 31, 2017
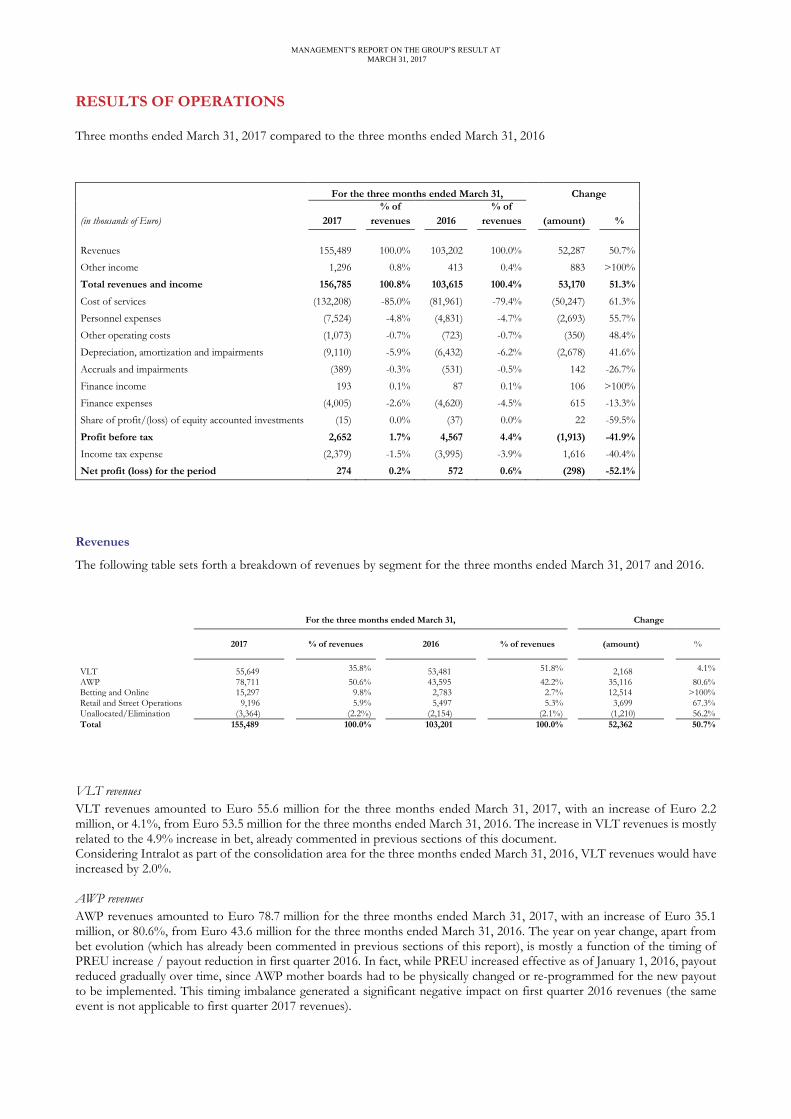
RESULTS OF OPERATIONS
Three months ended March 31, 2017 compared to the three months ended March 31, 2016
For the three months ended March 31, Change
% of % of (in thousands of Euro) 2017 revenues 2016 revenues (amount) %
Revenues 155,489 100.0% 103,202 100.0% 52,287 50.7%
Other income 1,296 0.8% 413 0.4% 883 >100%
Total revenues and income 156,785 100.8% 103,615 100.4% 53,170 51.3%
Cost of services (132,208) -85.0% (81,961) -79.4% (50,247) 61.3%
Personnel expenses (7,524) -4.8% (4,831) -4.7% (2,693) 55.7%
Other operating costs (1,073) -0.7% (723) -0.7% (350) 48.4%
Depreciation, amortization and impairments (9,110) -5.9% (6,432) -6.2% (2,678) 41.6%
Accruals and impairments (389) -0.3% (531) -0.5% 142 -26.7%
Finance income 193 0.1% 87 0.1% 106 >100%
Finance expenses (4,005) -2.6% (4,620) -4.5% 615 -13.3%
Share of profit/(loss) of equity accounted investments (15) 0.0% (37) 0.0% 22 -59.5%
Profit before tax 2,652 1.7% 4,567 4.4% (1,913) -41.9%
Income tax expense (2,379) -1.5% (3,995) -3.9% 1,616 -40.4%
Net profit (loss) for the period 274 0.2% 572 0.6% (298) -52.1%
Revenues
The following table sets forth a breakdown of revenues by segment for the three months ended March 31, 2017 and 2016.
For the three months ended March 31, Change
2017
% of revenues
2016
% of revenues
(amount)
%
VLT 55,649 35.8% 53,481 51.8%
2,168 4.1%
AWP 78,711 50.6% 43,595 42.2% 35,116 80.6% Betting and Online 15,297 9.8% 2,783 2.7% 12,514 >100% Retail and Street Operations 9,196 5.9% 5,497 5.3% 3,699 67.3% Unallocated/Elimination (3,364) (2.2%) (2,154) (2.1%) (1,210) 56.2%
Total 155,489 100.0% 103,201 100.0% 52,362 50.7%
VLT revenues
VLT revenues amounted to Euro 55.6 million for the three months ended March 31, 2017, with an increase of Euro 2.2 million, or 4.1%, from Euro 53.5 million for the three months ended March 31, 2016. The increase in VLT revenues is mostly related to the 4.9% increase in bet, already commented in previous sections of this document. Considering Intralot as part of the consolidation area for the three months ended March 31, 2016, VLT revenues would have increased by 2.0%. AWP revenues
AWP revenues amounted to Euro 78.7 million for the three months ended March 31, 2017, with an increase of Euro 35.1 million, or 80.6%, from Euro 43.6 million for the three months ended March 31, 2016. The year on year change, apart from bet evolution (which has already been commented in previous sections of this report), is mostly a function of the timing of PREU increase / payout reduction in first quarter 2016. In fact, while PREU increased effective as of January 1, 2016, payout reduced gradually over time, since AWP mother boards had to be physically changed or re-programmed for the new payout to be implemented. This timing imbalance generated a significant negative impact on first quarter 2016 revenues (the same event is not applicable to first quarter 2017 revenues).
MANAGEMENT’S REPORT ON THE GROUP’S RESULT AT
MARCH 31, 2017
Considering Intralot as part of the consolidation area for the three months ended March 31, 2016 AWPs revenues would have increased by 33.2%.
Betting & Online Revenues
Betting & Online revenues amounted to Euro 15.3 million for the three months ended March 31, 2017, with an increase of Euro 12.5 million, or more than 100%, compared to Euro 2.8 million for the three months ended March 31, 2016. As already commented, the key driver of this year on year increase is the Intralot acquisition. Considering Intralot as part of the consolidation area for the three months ended March 31, 2016 betting and online revenues would have decreased by 29.2%. This is primarily a function of the market wide evolution in payout (with Retail Sport Betting payout moving from 79.9% in first quarter 2016 to 88.6% in first quarter 2017). Retail & Street Operations Revenues
Retail & Street Operations revenues amounted to Euro 9.2 million for the three months ended March 31, 2017, with an increase of Euro 3.7 million, or 67.3%, compared to Euro 5.5 million for the three months ended March 31, 2016. The increase essentially reflects the impact of acquisitions finalized in the period, as well as organic growth / improved performance of existing operations.
Other income
Other income amounted to Euro 1.3 million for the three months ended March 31, 2017, with an increase of Euro 0.9 million, from Euro 0.4 million for the three months ended March 31, 2016. The year on year increase in mainly attributable to the impact of new acquisitions and other miscellaneous items (including penalties).
Cost of services
Cost of services amounted to Euro 132.2 million for the three months ended March 31, 2017, with an increase of Euro 50.2 million, or 61.3%, from Euro 82.0 million for the three months ended March 31, 2016. As a percentage of revenues, cost of services accounted to 85.0% for the three months ended March 31, 2017 compared to 79.4% for the three months ended March 31, 2016. Cost of services mainly relate to the compensation paid to the distribution network, which amounted to Euro 112.4 million for the three months ended March 31, 2017, with an increase of Euro 43.7 million, or 63.6%, from Euro 68.7 million for the three months ended March 31, 2016. This increase is mainly a function of the evolution in first quarter’s 2016 revenues which has been commented earlier (as a reminder, revenues were negatively impacted by the timing of PREU increase vis-à-vis payout reduction). Since the AWP contractual structure is largely pass through vis-à-vis revenue changes, lower revenues translate into lower distribution costs. First quarter 2017 is not impacted by these dynamics. The year on year increase in Distribution Network Compensation is also explained by higher Betting & Online wagers, following the Intralot acquisition. This factor is worth Euro 10.6 million.
Cost of services also includes the ADM concession fee which amounted to Euro 5.9 million for the three months ended March 31, 2017, with an increase of Euro 1.7 million, or 40.1% compared to Euro 4.2 million for the three months ended March 31, 2016. The ADM concession fee, calculated as a percentage of AWP, VLT and Betting and online wagers, accounted to 0.36% for the three months ended March 31, 2017 compared to 0.31% for the three months ended March 31, 2016. The year on year increase refers primarily to the increase in betting wagers which carry a higher concession fee.
Fee on VLT platform licenses amounted to Euro 3.2 million for the three months ended March 31, 2017, an increase of Euro 0.4 million, or 15.7%, from Euro 2.8 million for the three months ended March 31, 2016. Percentage wise, the year on year increase in VLT platform license costs exceeds bet increase. This is due to a mix effect with a higher proportion of bet from platforms with higher unit costs.
Other cost of services increased from Euro 6.3 million for the three months ended March 31, 2016 to Euro 10.7 million for the three months ended March 31, 2017. Among the drivers, increased lease, marketing and utility costs, linked to the Intralot acquisition as well as to the full year impact of recently finalized acquisitions within the Retail and Street Operations segment.
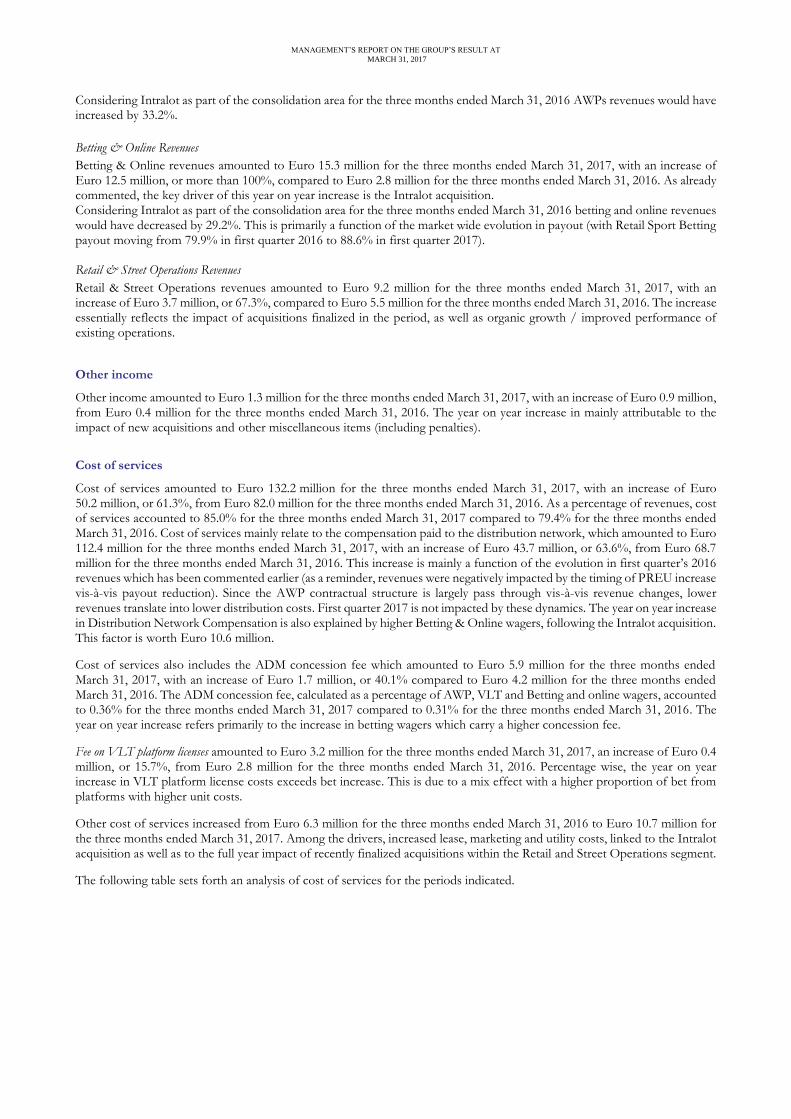
The following table sets forth an analysis of cost of services for the periods indicated.
MANAGEMENT’S REPORT ON THE GROUP’S RESULT AT
MARCH 31, 2017
For the three months ended March 31,
Change
(in thousands of Euro) 2017
% of 2016
% of (amount) %
revenues
revenues
Distribution network compensation (112,414) -72.3% (68,697) -66.6% (43,717) 63.6%
Concession Fee (5,911) -3.8% (4,220) -4.1% (1,691) 40.1%
Fee on VLT platform licenses (3,184) -2.0% (2,752) -2.7% (432) 15.7%
Other (10,699) -6.9% (6,292) -6.1% (4,407) 70.0%
(132,208) -85.0% (81,961) -79.4% (50,247) 61.3%
Considering Intralot as part of the consolidation area for the three months ended March 31, 2016 cost of services would have increased by 17.9%.
Other operating costs
Other operating costs amounted to Euro 1.1 million for the three months ended March 31, 2017, with an increase of Euro 0.4 million, or 48.4%, from Euro 0.7 million for the three months ended March 31, 2016. The increase is primarily driven by the Intralot acquisition.
Personnel expenses
Personnel expenses amounted to Euro 7.5 million for the three months ended March 31, 2017, an increase of Euro 2.7 million, or 55.7%, from Euro 4.8 million for the three months ended March 31, 2016, mainly due to an increase in the average number of employees driven by acquisitions.
Specifically, the impact associated to the Intralot acquisition is worth Euro 1.8 million, while the impact associated with the other acquisitions is worth Euro 0.5 million.
The average number of employees increased from 319 for the three months ended March 31, 2016 to 542 for the three months ended March 31, 2017. If Intralot had been part of the consolidation area also in the three months ended March 31, 2016, the average number of employees would have been 479. The remaining delta is explained by the other acquisitions.
Accruals and provisions
Accruals and provisions amounted to Euro 0.4 million for the three months ended March 31, 2017, a decrease of 26.7%, from Euro 0.5 million for the three months ended March 31, 2016. The decrease mainly relates to the use of the provision for technological innovation.
Depreciation, amortization and impairments
Depreciation, amortization and impairments amounted to Euro 9.1 million for the three months ended March 31, 2017, with an increase of Euro 2.7 million (+41.6%) with respect to the total of Euro 6.4 million booked in the three months ended March 31, 2016. The increase is mainly related to the Intralot acquisition. If Intralot had been part of the consolidation area also in the three months ended March 31, 2016, this line item would have decreased by 14.6%, from Euro 10.7 million. It mostly depends on the fact that the economic useful life of the Betting rights, initially expected to expire in June 2016, was then extended by one year following ADM indications.
Operating profit
Operating profit amounted to Euro 6.5 million for the three months ended March 31, 2017, with a decrease of Euro 2.3 million, or 29.1%, compared to Euro 9.1 million for the three months ended March 31, 2016. The year on year decrease is mostly attributable to the market wide negative payout evolution within the Betting & Online segment (with Retail Sports Betting payout moving from 79.9% in first quarter 2016 to 88.6% in first quarter 2017).
MANAGEMENT’S REPORT ON THE GROUP’S RESULT AT
MARCH 31, 2017
Finance expenses
Finance expenses amounted to Euro 4.0 million for the three months ended March 31, 2017, a decrease of Euro 0.6 million, or 13.3%, from Euro 4.6 million for the three months ended March 31, 2016. The decrease mainly relates to the lower interest rate applicable to the Euro 200 million senior secured notes due 2021 issued by Gamenet Group S.p.A. on August 15, 2016.
Profit before tax
Profit before tax amounted to Euro 2.7 million for the three months ended March 31, 2017, with a decrease of Euro 1.9 million from the profit of Euro 4.6 million for the three months ended March 31, 2016. The drivers of this year on year decrease have been commented earlier.
Income tax
Income tax amounted to Euro 2.4 million for the three months ended March 31, 2017, with a decrease of Euro 1.6 million, or -40.4%, from Euro 4.0 million for the three months ended March 31, 2016.
Profit for the period
As a result of the factors explained above, the profit for the period amounted to Euro 0.3 million for the three months ended March 31, 2017, with a decrease of Euro 0.3 million from Euro 0.6 million for the three months ended March 31, 2016.
MANAGEMENT’S REPORT ON THE GROUP’S RESULT AT
MARCH 31, 2017
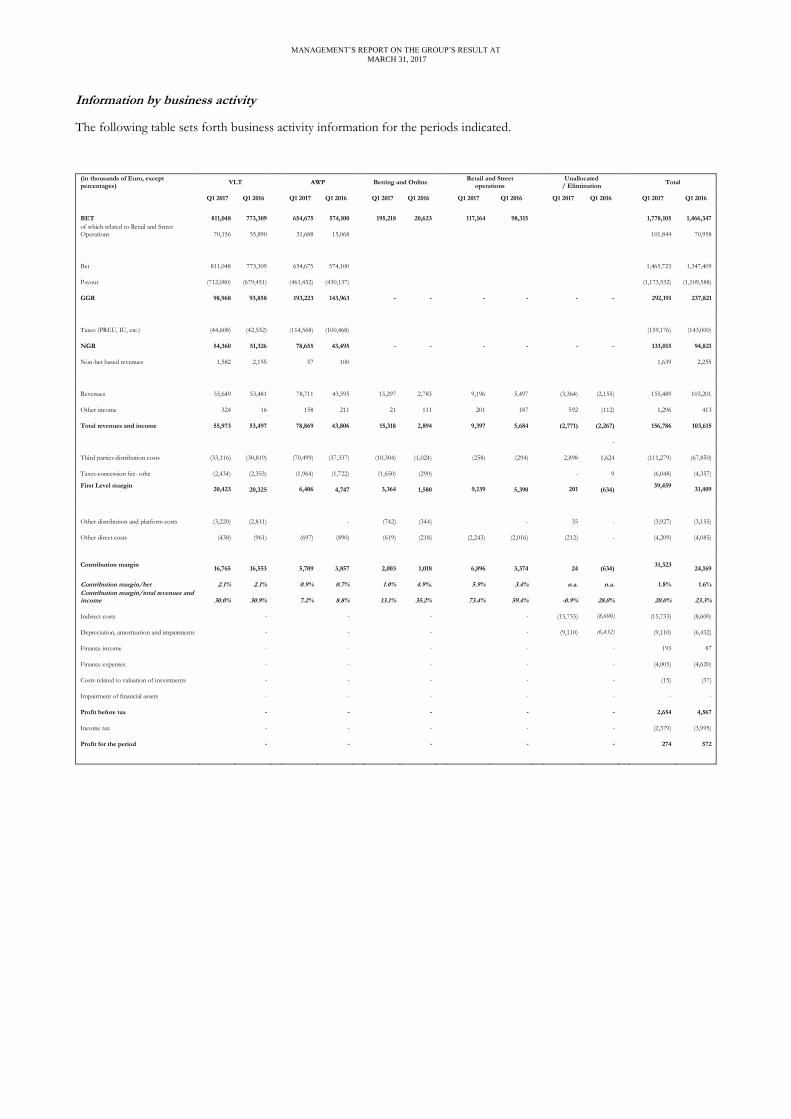
Information by business activity
The following table sets forth business activity information for the periods indicated.
(in thousands of Euro, except percentages)
VLT AWP
Betting and Online
Retail and Street operations
Unallocated / Elimination
Total
Q1 2017 Q1 2016 Q1 2017 Q1 2016 Q1 2017 Q1 2016 Q1 2017 Q1 2016 Q1 2017 Q1 2016 Q1 2017 Q1 2016
BET
811,048
773,309
654,675
574,100
195,218
20,623
117,164
98,315 1,778,105
1,466,347
of which related to Retail and Street Operations
70,156
55,890
31,688
15,068 101,844
70,958
Bet
811,048
773,309
654,675
574,100 1,465,723
1,347,409
Payout
(712,080)
(679,451)
(461,452)
(430,137) (1,173,532)
(1,109,588)
GGR
98,968
93,858
193,223
143,963
-
-
-
-
-
- 292,191
237,821
Taxes (PREU, IU, etc.)
(44,608)
(42,532)
(114,568)
(100,468) (159,176)
(143,000)
NGR
54,360
51,326
78,655
43,495
-
-
-
-
-
- 133,015
94,821
Non-bet based revenues
1,582
2,155
57
100 1,639
2,255
Revenues
55,649
53,481
78,711
43,595
15,297
2,783
9,196
5,497
(3,364)
(2,155) 155,489
103,201
Other income
324
16
158
211
21
111
201
187
592
(112) 1,296
413
Total revenues and income
55,973
53,497
78,869
43,806
15,318
2,894
9,397
5,684
(2,771)
(2,267) 156,786
103,615
-
Third parties distribution costs
(33,116)
(30,819)
(70,499)
(37,337)
(10,304)
(1,024)
(258)
(294)
2,898
1,624 (111,279)
(67,850)
Taxes-concession fee- othe
(2,434)
(2,353)
(1,964)
(1,722)
(1,650)
(290)
-
9 (6,048)
(4,357)
First Level margin
20,423
20,325
6,406
4,747
3,364
1,580
9,139
5,390
201
(634)
39,459
31,409
Other distribution and platform costs
(3,220)
(2,811)
-
(742)
(344)
-
35
- (3,927)
(3,155)
Other direct costs
(438)
(961)
(697)
(890)
(619)
(218)
(2,243)
(2,016)
(212)
- (4,209)
(4,085)
Contribution margin
16,765
16,553
5,709
3,857
2,003
1,018
6,896
3,374
24
(634) 31,323
24,169
Contribution margin/bet 2.1% 2.1% 0.9% 0.7% 1.0% 4.9%. 5.9% 3.4% n.a. n.a. 1.8% 1.6%
Contribution margin/total revenues and income 30.0% 30.9% 7.2% 8.8% 13.1% 35.2% 73.4% 59.4% -0.9% 28.0% 20.0% 23.3%
Indirect costs
-
-
-
-
(15,733)
(8,600) (15,733)
(8,600)
Depreciation, amortization and impairments
-
-
-
-
(9,110)
(6,432) (9,110)
(6,432)
Finance income
-
-
-
-
- 193
87
Finance expenses
-
-
-
-
- (4,005)
(4,620)
Costs related to valuation of investments
-
-
-
-
-
(15)
(37)
Impairment of financial assets
-
-
-
-
- -
-
Profit before tax
-
-
-
-
- 2,654
4,567
Income tax
-
-
-
-
-
(2,379)
(3,995)
Profit for the period
-
-
-
-
- 274
572
MANAGEMENT’S REPORT ON THE GROUP’S RESULT AT
MARCH 31, 2017
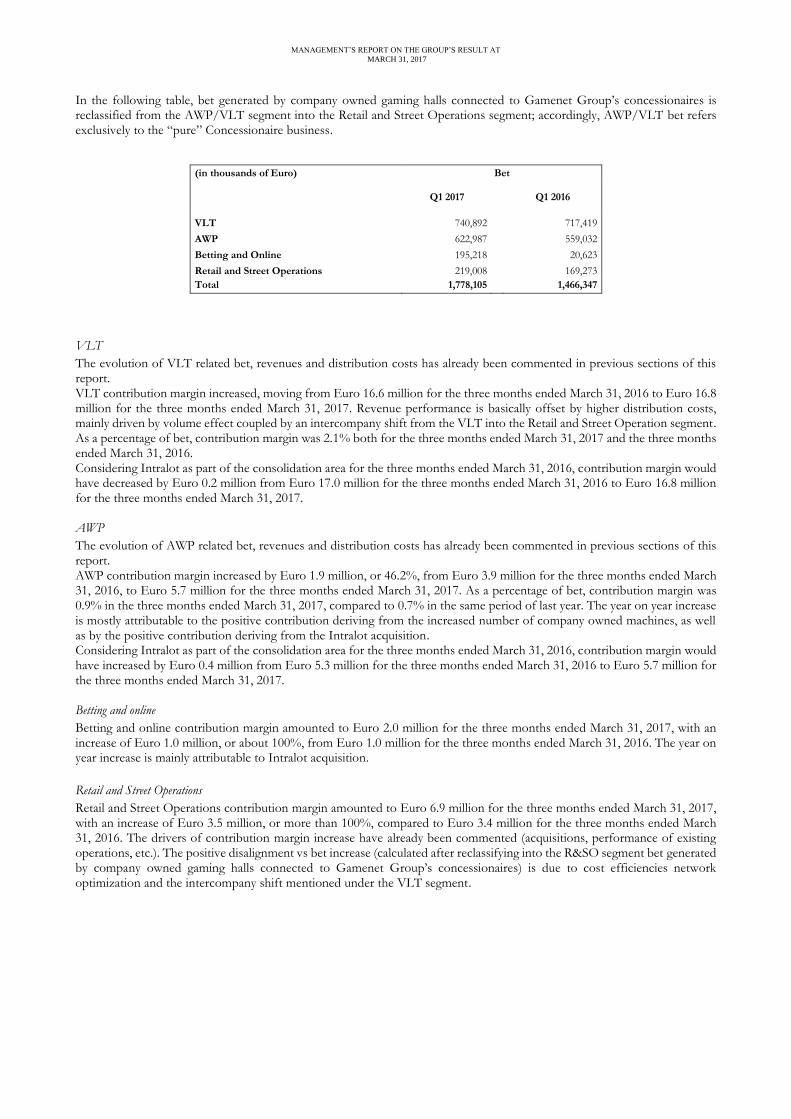
In the following table, bet generated by company owned gaming halls connected to Gamenet Group’s concessionaires is reclassified from the AWP/VLT segment into the Retail and Street Operations segment; accordingly, AWP/VLT bet refers exclusively to the “pure” Concessionaire business.
(in thousands of Euro) Bet
Q1 2017
Q1 2016
VLT 740,892 717,419
AWP 622,987 559,032
Betting and Online 195,218 20,623
Retail and Street Operations 219,008 169,273
Total 1,778,105 1,466,347
VLT
The evolution of VLT related bet, revenues and distribution costs has already been commented in previous sections of this report. VLT contribution margin increased, moving from Euro 16.6 million for the three months ended March 31, 2016 to Euro 16.8 million for the three months ended March 31, 2017. Revenue performance is basically offset by higher distribution costs, mainly driven by volume effect coupled by an intercompany shift from the VLT into the Retail and Street Operation segment. As a percentage of bet, contribution margin was 2.1% both for the three months ended March 31, 2017 and the three months ended March 31, 2016. Considering Intralot as part of the consolidation area for the three months ended March 31, 2016, contribution margin would have decreased by Euro 0.2 million from Euro 17.0 million for the three months ended March 31, 2016 to Euro 16.8 million for the three months ended March 31, 2017. AWP
The evolution of AWP related bet, revenues and distribution costs has already been commented in previous sections of this report. AWP contribution margin increased by Euro 1.9 million, or 46.2%, from Euro 3.9 million for the three months ended March 31, 2016, to Euro 5.7 million for the three months ended March 31, 2017. As a percentage of bet, contribution margin was 0.9% in the three months ended March 31, 2017, compared to 0.7% in the same period of last year. The year on year increase is mostly attributable to the positive contribution deriving from the increased number of company owned machines, as well as by the positive contribution deriving from the Intralot acquisition. Considering Intralot as part of the consolidation area for the three months ended March 31, 2016, contribution margin would have increased by Euro 0.4 million from Euro 5.3 million for the three months ended March 31, 2016 to Euro 5.7 million for the three months ended March 31, 2017. Betting and online
Betting and online contribution margin amounted to Euro 2.0 million for the three months ended March 31, 2017, with an increase of Euro 1.0 million, or about 100%, from Euro 1.0 million for the three months ended March 31, 2016. The year on year increase is mainly attributable to Intralot acquisition.
Retail and Street Operations
Retail and Street Operations contribution margin amounted to Euro 6.9 million for the three months ended March 31, 2017, with an increase of Euro 3.5 million, or more than 100%, compared to Euro 3.4 million for the three months ended March 31, 2016. The drivers of contribution margin increase have already been commented (acquisitions, performance of existing operations, etc.). The positive disalignment vs bet increase (calculated after reclassifying into the R&SO segment bet generated by company owned gaming halls connected to Gamenet Group’s concessionaires) is due to cost efficiencies network optimization and the intercompany shift mentioned under the VLT segment.
MANAGEMENT’S REPORT ON THE GROUP’S RESULT AT
MARCH 31, 2017
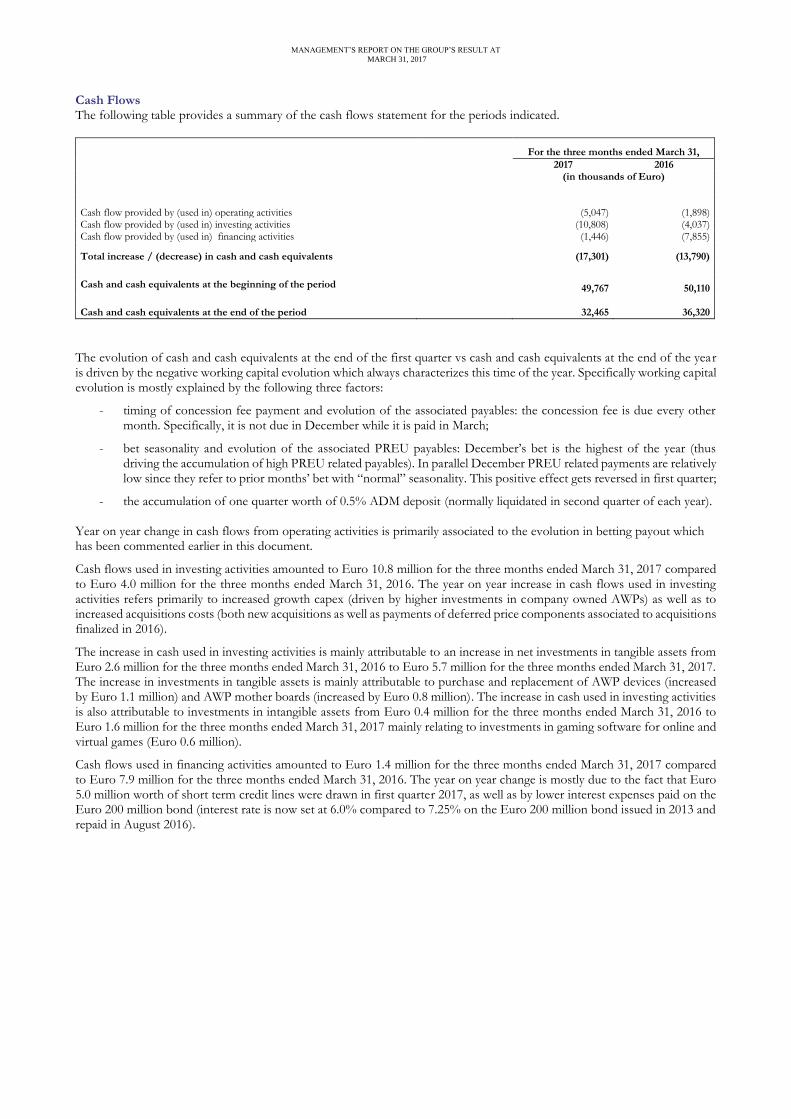
Cash Flows The following table provides a summary of the cash flows statement for the periods indicated.
For the three months ended March 31,
2017 2016 (in thousands of Euro)
Cash flow provided by (used in) operating activities (5,047)
(1,898) Cash flow provided by (used in) investing activities (10,808) (4,037) Cash flow provided by (used in) financing activities (1,446) (7,855)
Total increase / (decrease) in cash and cash equivalents (17,301) (13,790)
Cash and cash equivalents at the beginning of the period 49,767 50,110
Cash and cash equivalents at the end of the period 32,465 36,320
The evolution of cash and cash equivalents at the end of the first quarter vs cash and cash equivalents at the end of the year is driven by the negative working capital evolution which always characterizes this time of the year. Specifically working capital evolution is mostly explained by the following three factors:
- timing of concession fee payment and evolution of the associated payables: the concession fee is due every other month. Specifically, it is not due in December while it is paid in March;
- bet seasonality and evolution of the associated PREU payables: December’s bet is the highest of the year (thus driving the accumulation of high PREU related payables). In parallel December PREU related payments are relatively low since they refer to prior months’ bet with “normal” seasonality. This positive effect gets reversed in first quarter;
- the accumulation of one quarter worth of 0.5% ADM deposit (normally liquidated in second quarter of each year).
Year on year change in cash flows from operating activities is primarily associated to the evolution in betting payout which has been commented earlier in this document.
Cash flows used in investing activities amounted to Euro 10.8 million for the three months ended March 31, 2017 compared to Euro 4.0 million for the three months ended March 31, 2016. The year on year increase in cash flows used in investing activities refers primarily to increased growth capex (driven by higher investments in company owned AWPs) as well as to increased acquisitions costs (both new acquisitions as well as payments of deferred price components associated to acquisitions finalized in 2016).
The increase in cash used in investing activities is mainly attributable to an increase in net investments in tangible assets from Euro 2.6 million for the three months ended March 31, 2016 to Euro 5.7 million for the three months ended March 31, 2017. The increase in investments in tangible assets is mainly attributable to purchase and replacement of AWP devices (increased by Euro 1.1 million) and AWP mother boards (increased by Euro 0.8 million). The increase in cash used in investing activities is also attributable to investments in intangible assets from Euro 0.4 million for the three months ended March 31, 2016 to Euro 1.6 million for the three months ended March 31, 2017 mainly relating to investments in gaming software for online and virtual games (Euro 0.6 million).
Cash flows used in financing activities amounted to Euro 1.4 million for the three months ended March 31, 2017 compared to Euro 7.9 million for the three months ended March 31, 2016. The year on year change is mostly due to the fact that Euro 5.0 million worth of short term credit lines were drawn in first quarter 2017, as well as by lower interest expenses paid on the Euro 200 million bond (interest rate is now set at 6.0% compared to 7.25% on the Euro 200 million bond issued in 2013 and repaid in August 2016).
MANAGEMENT’S REPORT ON THE GROUP’S RESULT AT
MARCH 31, 2017
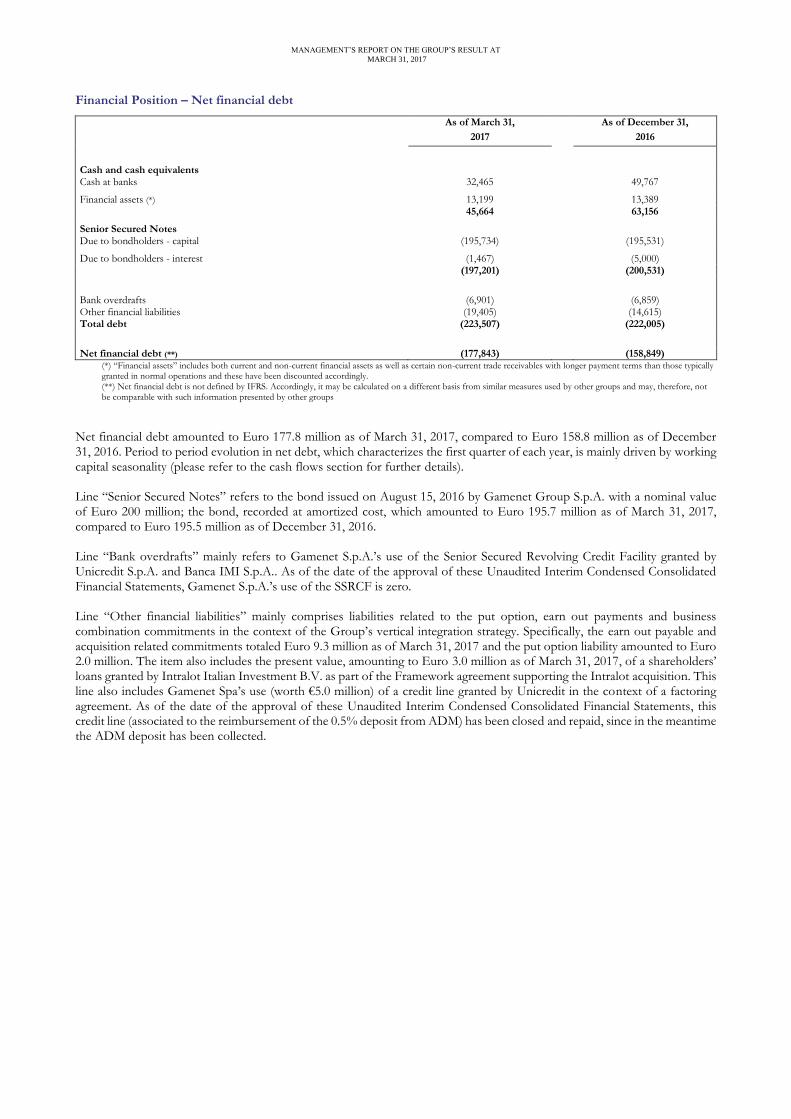
Financial Position – Net financial debt
As of March 31, As of December 31,
2017 2016
Cash and cash equivalents Cash at banks 32,465 49,767
Financial assets (*) 13,199 13,389 45,664 63,156
Senior Secured Notes Due to bondholders - capital (195,734) (195,531)
Due to bondholders - interest (1,467) (5,000) (197,201) (200,531)
Bank overdrafts (6,901) (6,859) Other financial liabilities (19,405) (14,615) Total debt (223,507) (222,005)
Net financial debt (**) (177,843) (158,849)
(*) “Financial assets” includes both current and non-current financial assets as well as certain non-current trade receivables with longer payment terms than those typically granted in normal operations and these have been discounted accordingly. (**) Net financial debt is not defined by IFRS. Accordingly, it may be calculated on a different basis from similar measures used by other groups and may, therefore, not be comparable with such information presented by other groups
Net financial debt amounted to Euro 177.8 million as of March 31, 2017, compared to Euro 158.8 million as of December 31, 2016. Period to period evolution in net debt, which characterizes the first quarter of each year, is mainly driven by working capital seasonality (please refer to the cash flows section for further details). Line “Senior Secured Notes” refers to the bond issued on August 15, 2016 by Gamenet Group S.p.A. with a nominal value of Euro 200 million; the bond, recorded at amortized cost, which amounted to Euro 195.7 million as of March 31, 2017, compared to Euro 195.5 million as of December 31, 2016. Line “Bank overdrafts” mainly refers to Gamenet S.p.A.’s use of the Senior Secured Revolving Credit Facility granted by Unicredit S.p.A. and Banca IMI S.p.A.. As of the date of the approval of these Unaudited Interim Condensed Consolidated Financial Statements, Gamenet S.p.A.’s use of the SSRCF is zero. Line “Other financial liabilities” mainly comprises liabilities related to the put option, earn out payments and business combination commitments in the context of the Group’s vertical integration strategy. Specifically, the earn out payable and acquisition related commitments totaled Euro 9.3 million as of March 31, 2017 and the put option liability amounted to Euro 2.0 million. The item also includes the present value, amounting to Euro 3.0 million as of March 31, 2017, of a shareholders’ loans granted by Intralot Italian Investment B.V. as part of the Framework agreement supporting the Intralot acquisition. This line also includes Gamenet Spa’s use (worth €5.0 million) of a credit line granted by Unicredit in the context of a factoring agreement. As of the date of the approval of these Unaudited Interim Condensed Consolidated Financial Statements, this credit line (associated to the reimbursement of the 0.5% deposit from ADM) has been closed and repaid, since in the meantime the ADM deposit has been collected.
1
Unaudited Interim Condensed Consolidated Financial Statements
as of March 31, 2017 and for the three months ended March 31,
2017 and 2016
2
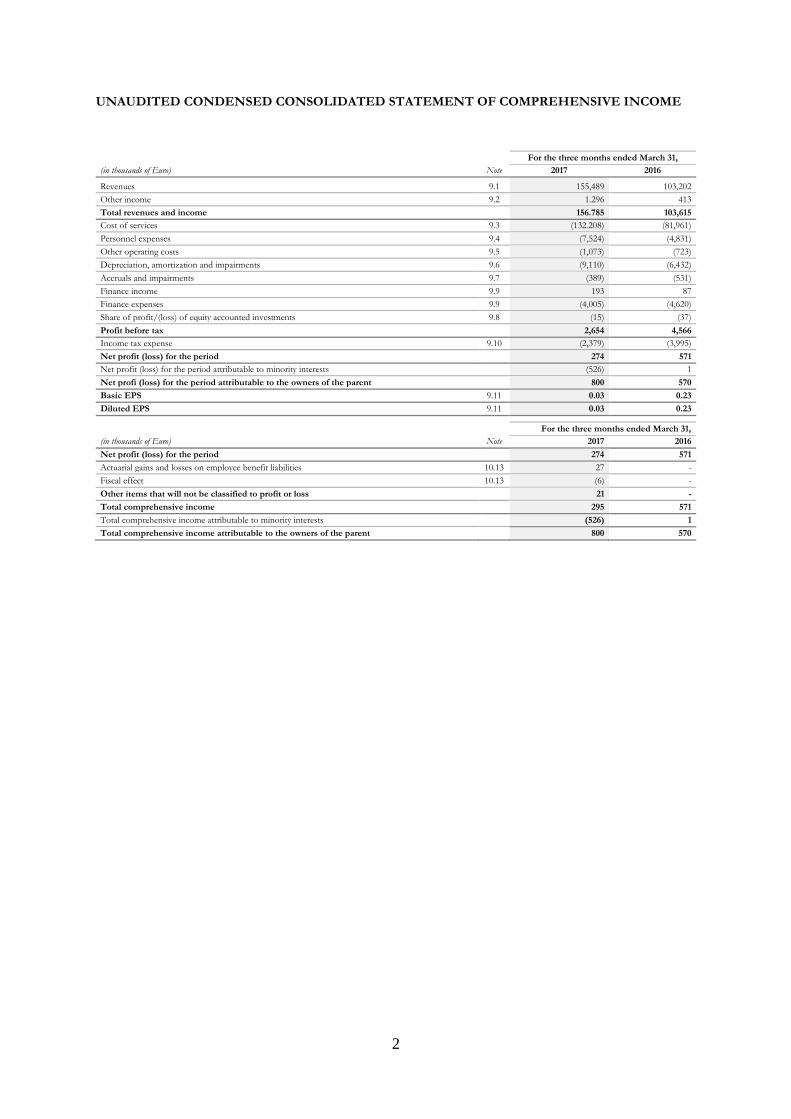
UNAUDITED CONDENSED CONSOLIDATED STATEMENT OF COMPREHENSIVE INCOME
For the three months ended March 31,
(in thousands of Euro) Note 2017 2016
Revenues 9.1 155,489 103,202
Other income 9.2 1.296 413
Total revenues and income 156.785 103,615
Cost of services 9.3 (132.208) (81,961)
Personnel expenses 9.4 (7,524) (4,831)
Other operating costs 9.5 (1,073) (723)
Depreciation, amortization and impairments 9.6 (9,110) (6,432)
Accruals and impairments 9.7 (389) (531)
Finance income 9.9 193 87
Finance expenses 9.9 (4,005) (4,620)
Share of profit/(loss) of equity accounted investments 9.8 (15) (37)
Profit before tax 2,654 4,566
Income tax expense 9.10 (2,379) (3,995)
Net profit (loss) for the period 274 571
Net profit (loss) for the period attributable to minority interests (526) 1
Net profi (loss) for the period attributable to the owners of the parent 800 570
Basic EPS 9.11 0.03 0.23
Diluted EPS 9.11 0.03 0.23
For the three months ended March 31,
(in thousands of Euro) Note 2017 2016
Net profit (loss) for the period 274 571
Actuarial gains and losses on employee benefit liabilities 10.13 27 -
Fiscal effect 10.13 (6) -
Other items that will not be classified to profit or loss 21 -
Total comprehensive income 295 571
Total comprehensive income attributable to minority interests (526) 1
Total comprehensive income attributable to the owners of the parent 800 570
3
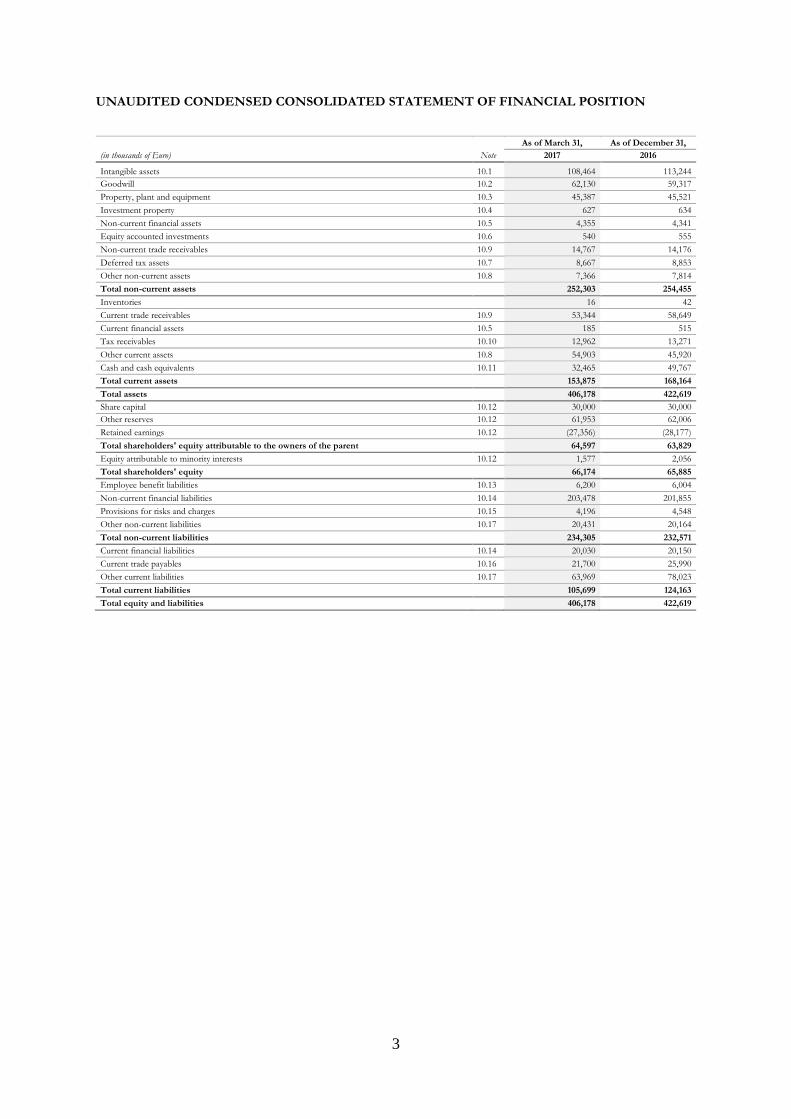
UNAUDITED CONDENSED CONSOLIDATED STATEMENT OF FINANCIAL POSITION
As of March 31, As of December 31,
(in thousands of Euro) Note 2017 2016
Intangible assets 10.1 108,464 113,244
Goodwill 10.2 62,130 59,317
Property, plant and equipment 10.3 45,387 45,521
Investment property 10.4 627 634
Non-current financial assets 10.5 4,355 4,341
Equity accounted investments 10.6 540 555
Non-current trade receivables 10.9 14,767 14,176
Deferred tax assets 10.7 8,667 8,853
Other non-current assets 10.8 7,366 7,814
Total non-current assets 252,303 254,455
Inventories 16 42
Current trade receivables 10.9 53,344 58,649
Current financial assets 10.5 185 515
Tax receivables 10.10 12,962 13,271
Other current assets 10.8 54,903 45,920
Cash and cash equivalents 10.11 32,465 49,767
Total current assets 153,875 168,164
Total assets 406,178 422,619
Share capital 10.12 30,000 30,000
Other reserves 10.12 61,953 62,006
Retained earnings 10.12 (27,356) (28,177)
Total shareholders' equity attributable to the owners of the parent 64,597 63,829
Equity attributable to minority interests 10.12 1,577 2,056
Total shareholders' equity 66,174 65,885
Employee benefit liabilities 10.13 6,200 6,004
Non-current financial liabilities 10.14 203,478 201,855
Provisions for risks and charges 10.15 4,196 4,548
Other non-current liabilities 10.17 20,431 20,164
Total non-current liabilities 234,305 232,571
Current financial liabilities 10.14 20,030 20,150
Current trade payables 10.16 21,700 25,990
Other current liabilities 10.17 63,969 78,023
Total current liabilities 105,699 124,163
Total equity and liabilities 406,178 422,619
4
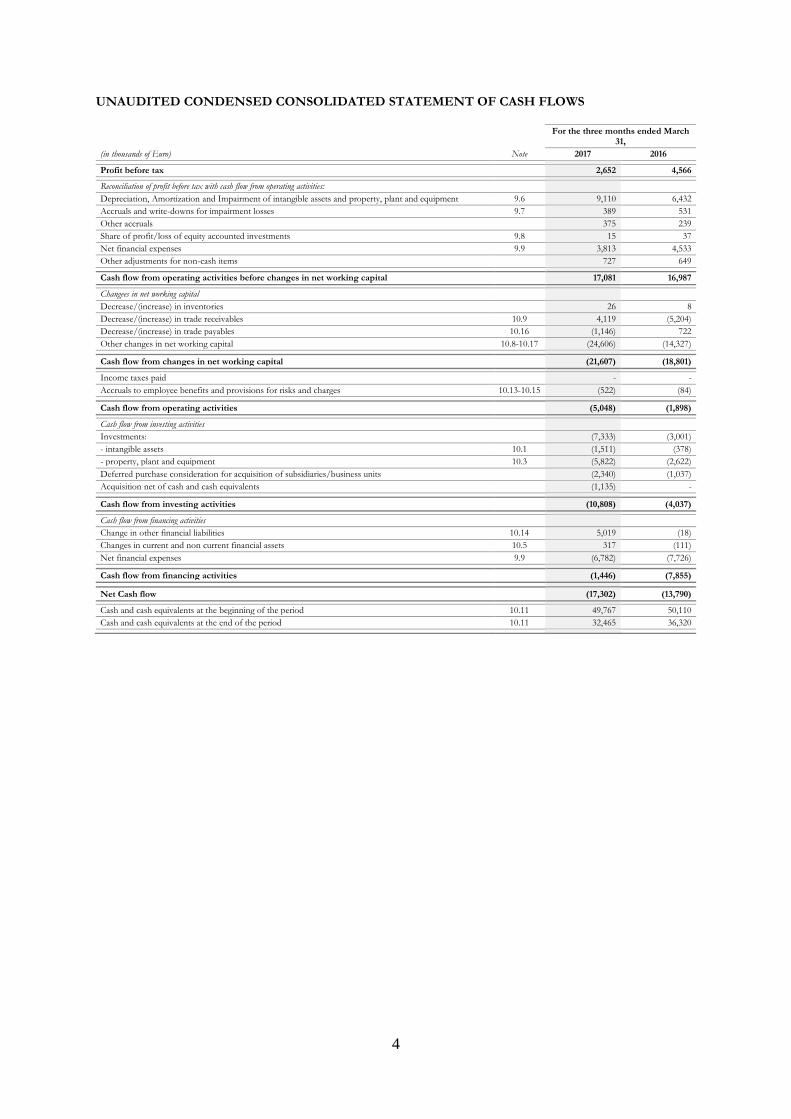
UNAUDITED CONDENSED CONSOLIDATED STATEMENT OF CASH FLOWS
For the three months ended March 31,
(in thousands of Euro) Note 2017 2016
Profit before tax 2,652 4,566
Reconciliation of profit before tax with cash flow from operating activities: Depreciation, Amortization and Impairment of intangible assets and property, plant and equipment 9.6 9,110 6,432
Accruals and write-downs for impairment losses 9.7 389 531
Other accruals 375 239
Share of profit/loss of equity accounted investments 9.8 15 37
Net financial expenses 9.9 3,813 4,533
Other adjustments for non-cash items 727 649
Cash flow from operating activities before changes in net working capital 17,081 16,987
Changees in net working capital Decrease/(increase) in inventories 26 8
Decrease/(increase) in trade receivables 10.9 4,119 (5,204)
Decrease/(increase) in trade payables 10.16 (1,146) 722
Other changes in net working capital 10.8-10.17 (24,606) (14,327)
Cash flow from changes in net working capital (21,607) (18,801)
Income taxes paid - -
Accruals to employee benefits and provisions for risks and charges 10.13-10.15 (522) (84)
Cash flow from operating activities (5,048) (1,898)
Cash flow from investing activities Investments: (7,333) (3,001)
- intangible assets 10.1 (1,511) (378)
- property, plant and equipment 10.3 (5,822) (2,622)
Deferred purchase consideration for acquisition of subsidiaries/business units (2,340) (1,037)
Acquisition net of cash and cash equivalents (1,135) -
Cash flow from investing activities (10,808) (4,037)
Cash flow from financing activities Change in other financial liabilities 10.14 5,019 (18)
Changes in current and non current financial assets 10.5 317 (111)
Net financial expenses 9.9 (6,782) (7,726)
Cash flow from financing activities (1,446) (7,855)
Net Cash flow (17,302) (13,790)
Cash and cash equivalents at the beginning of the period 10.11 49,767 50,110
Cash and cash equivalents at the end of the period 10.11 32,465 36,320
5
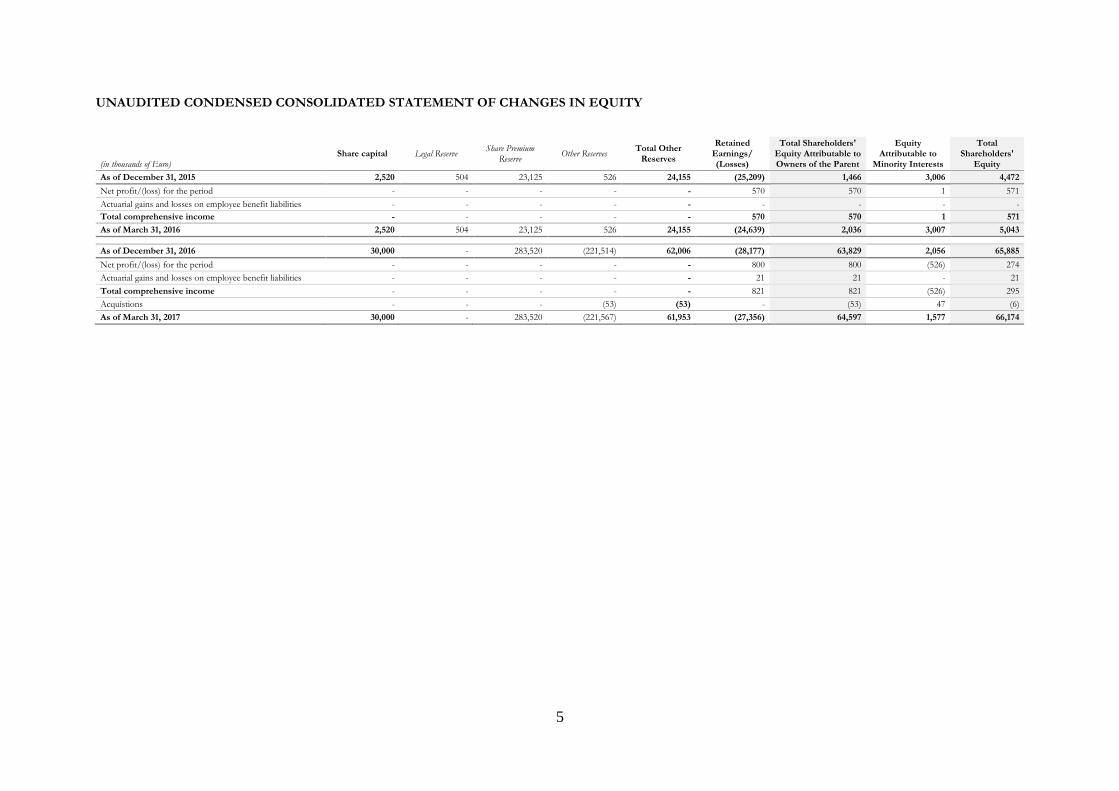
UNAUDITED CONDENSED CONSOLIDATED STATEMENT OF CHANGES IN EQUITY
(in thousands of Euro) Share capital Legal Reserve
Share Premium Reserve
Other Reserves Total Other
Reserves
Retained Earnings/ (Losses)
Total Shareholders' Equity Attributable to Owners of the Parent
Equity Attributable to
Minority Interests
Total Shareholders'
Equity
As of December 31, 2015 2,520 504 23,125 526 24,155 (25,209) 1,466 3,006 4,472
Net profit/(loss) for the period - - - - - 570 570 1 571
Actuarial gains and losses on employee benefit liabilities - - - - - - - - -
Total comprehensive income - - - - - 570 570 1 571
As of March 31, 2016 2,520 504 23,125 526 24,155 (24,639) 2,036 3,007 5,043
As of December 31, 2016 30,000 - 283,520 (221,514) 62,006 (28,177) 63,829 2,056 65,885
Net profit/(loss) for the period - - - - - 800 800 (526) 274
Actuarial gains and losses on employee benefit liabilities - - - - - 21 21 - 21
Total comprehensive income - - - - - 821 821 (526) 295
Acquistions - - - (53) (53) - (53) 47 (6)
As of March 31, 2017 30,000 - 283,520 (221,567) 61,953 (27,356) 64,597 1,577 66,174
6
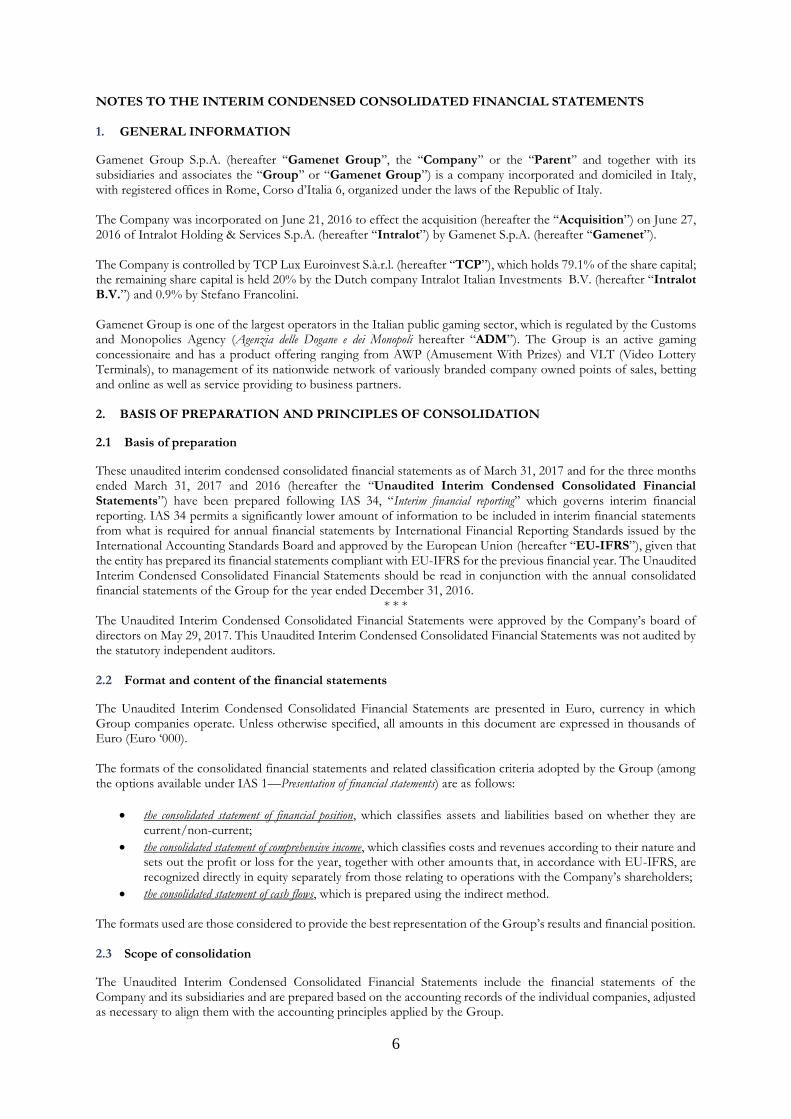
NOTES TO THE INTERIM CONDENSED CONSOLIDATED FINANCIAL STATEMENTS 1. GENERAL INFORMATION
Gamenet Group S.p.A. (hereafter ‘‘Gamenet Group’’, the ‘‘Company’’ or the ‘‘Parent’’ and together with its subsidiaries and associates the ‘‘Group’’ or “Gamenet Group”) is a company incorporated and domiciled in Italy, with registered offices in Rome, Corso d’Italia 6, organized under the laws of the Republic of Italy. The Company was incorporated on June 21, 2016 to effect the acquisition (hereafter the ‘‘Acquisition”) on June 27, 2016 of Intralot Holding & Services S.p.A. (hereafter ‘‘Intralot”) by Gamenet S.p.A. (hereafter ‘‘Gamenet”). The Company is controlled by TCP Lux Euroinvest S.à.r.l. (hereafter ‘‘TCP”), which holds 79.1% of the share capital; the remaining share capital is held 20% by the Dutch company Intralot Italian Investments B.V. (hereafter “Intralot B.V.”) and 0.9% by Stefano Francolini. Gamenet Group is one of the largest operators in the Italian public gaming sector, which is regulated by the Customs and Monopolies Agency (Agenzia delle Dogane e dei Monopoli hereafter “ADM”). The Group is an active gaming concessionaire and has a product offering ranging from AWP (Amusement With Prizes) and VLT (Video Lottery Terminals), to management of its nationwide network of variously branded company owned points of sales, betting and online as well as service providing to business partners. 2. BASIS OF PREPARATION AND PRINCIPLES OF CONSOLIDATION
2.1 Basis of preparation
These unaudited interim condensed consolidated financial statements as of March 31, 2017 and for the three months ended March 31, 2017 and 2016 (hereafter the “Unaudited Interim Condensed Consolidated Financial Statements”) have been prepared following IAS 34, “Interim financial reporting” which governs interim financial reporting. IAS 34 permits a significantly lower amount of information to be included in interim financial statements from what is required for annual financial statements by International Financial Reporting Standards issued by the International Accounting Standards Board and approved by the European Union (hereafter “EU-IFRS”), given that the entity has prepared its financial statements compliant with EU-IFRS for the previous financial year. The Unaudited Interim Condensed Consolidated Financial Statements should be read in conjunction with the annual consolidated financial statements of the Group for the year ended December 31, 2016.
* * * The Unaudited Interim Condensed Consolidated Financial Statements were approved by the Company’s board of directors on May 29, 2017. This Unaudited Interim Condensed Consolidated Financial Statements was not audited by the statutory independent auditors. 2.2 Format and content of the financial statements
The Unaudited Interim Condensed Consolidated Financial Statements are presented in Euro, currency in which Group companies operate. Unless otherwise specified, all amounts in this document are expressed in thousands of Euro (Euro ‘000). The formats of the consolidated financial statements and related classification criteria adopted by the Group (among the options available under IAS 1—Presentation of financial statements) are as follows:
• the consolidated statement of financial position, which classifies assets and liabilities based on whether they are current/non-current;
• the consolidated statement of comprehensive income, which classifies costs and revenues according to their nature and sets out the profit or loss for the year, together with other amounts that, in accordance with EU-IFRS, are recognized directly in equity separately from those relating to operations with the Company’s shareholders;
• the consolidated statement of cash flows, which is prepared using the indirect method. The formats used are those considered to provide the best representation of the Group’s results and financial position. 2.3 Scope of consolidation
The Unaudited Interim Condensed Consolidated Financial Statements include the financial statements of the Company and its subsidiaries and are prepared based on the accounting records of the individual companies, adjusted as necessary to align them with the accounting principles applied by the Group.
7
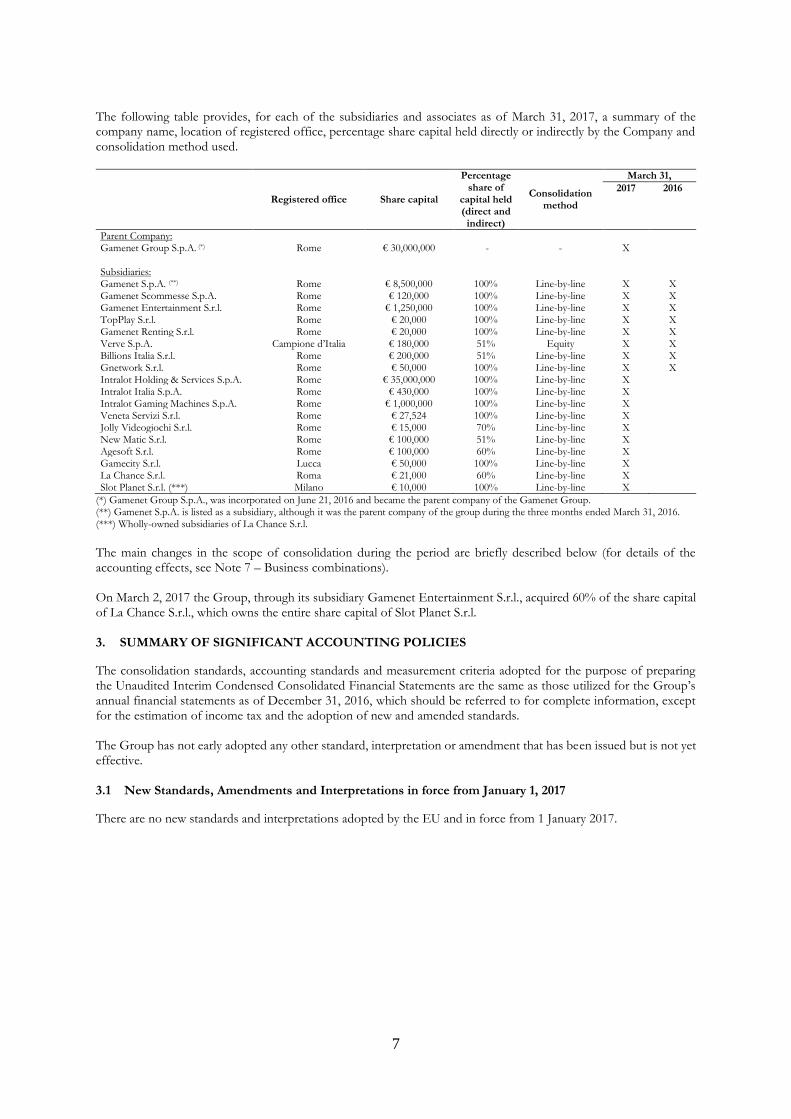
The following table provides, for each of the subsidiaries and associates as of March 31, 2017, a summary of the company name, location of registered office, percentage share capital held directly or indirectly by the Company and consolidation method used.
Registered office Share capital
Percentage share of
capital held (direct and indirect)
Consolidation method
March 31,
2017 2016
Parent Company: Gamenet Group S.p.A. (*) Rome € 30,000,000 - - X
Subsidiaries: Gamenet S.p.A. (**) Rome € 8,500,000 100% Line-by-line X X Gamenet Scommesse S.p.A. Rome € 120,000 100% Line-by-line X X Gamenet Entertainment S.r.l. Rome € 1,250,000 100% Line-by-line X X TopPlay S.r.l. Rome € 20,000 100% Line-by-line X X Gamenet Renting S.r.l. Rome € 20,000 100% Line-by-line X X Verve S.p.A. Campione d’Italia € 180,000 51% Equity X X Billions Italia S.r.l. Rome € 200,000 51% Line-by-line X X Gnetwork S.r.l. Rome € 50,000 100% Line-by-line X X Intralot Holding & Services S.p.A. Rome € 35,000,000 100% Line-by-line X Intralot Italia S.p.A. Rome € 430,000 100% Line-by-line X Intralot Gaming Machines S.p.A. Rome € 1,000,000 100% Line-by-line X Veneta Servizi S.r.l. Rome € 27,524 100% Line-by-line X Jolly Videogiochi S.r.l. Rome € 15,000 70% Line-by-line X New Matic S.r.l. Rome € 100,000 51% Line-by-line X Agesoft S.r.l. Rome € 100,000 60% Line-by-line X Gamecity S.r.l. Lucca € 50,000 100% Line-by-line X La Chance S.r.l. Roma € 21,000 60% Line-by-line X Slot Planet S.r.l. (***) Milano € 10,000 100% Line-by-line X
(*) Gamenet Group S.p.A., was incorporated on June 21, 2016 and became the parent company of the Gamenet Group. (**) Gamenet S.p.A. is listed as a subsidiary, although it was the parent company of the group during the three months ended March 31, 2016. (***) Wholly-owned subsidiaries of La Chance S.r.l.
The main changes in the scope of consolidation during the period are briefly described below (for details of the accounting effects, see Note 7 – Business combinations). On March 2, 2017 the Group, through its subsidiary Gamenet Entertainment S.r.l., acquired 60% of the share capital of La Chance S.r.l., which owns the entire share capital of Slot Planet S.r.l.
3. SUMMARY OF SIGNIFICANT ACCOUNTING POLICIES
The consolidation standards, accounting standards and measurement criteria adopted for the purpose of preparing the Unaudited Interim Condensed Consolidated Financial Statements are the same as those utilized for the Group’s annual financial statements as of December 31, 2016, which should be referred to for complete information, except for the estimation of income tax and the adoption of new and amended standards. The Group has not early adopted any other standard, interpretation or amendment that has been issued but is not yet effective. 3.1 New Standards, Amendments and Interpretations in force from January 1, 2017
There are no new standards and interpretations adopted by the EU and in force from 1 January 2017.
8
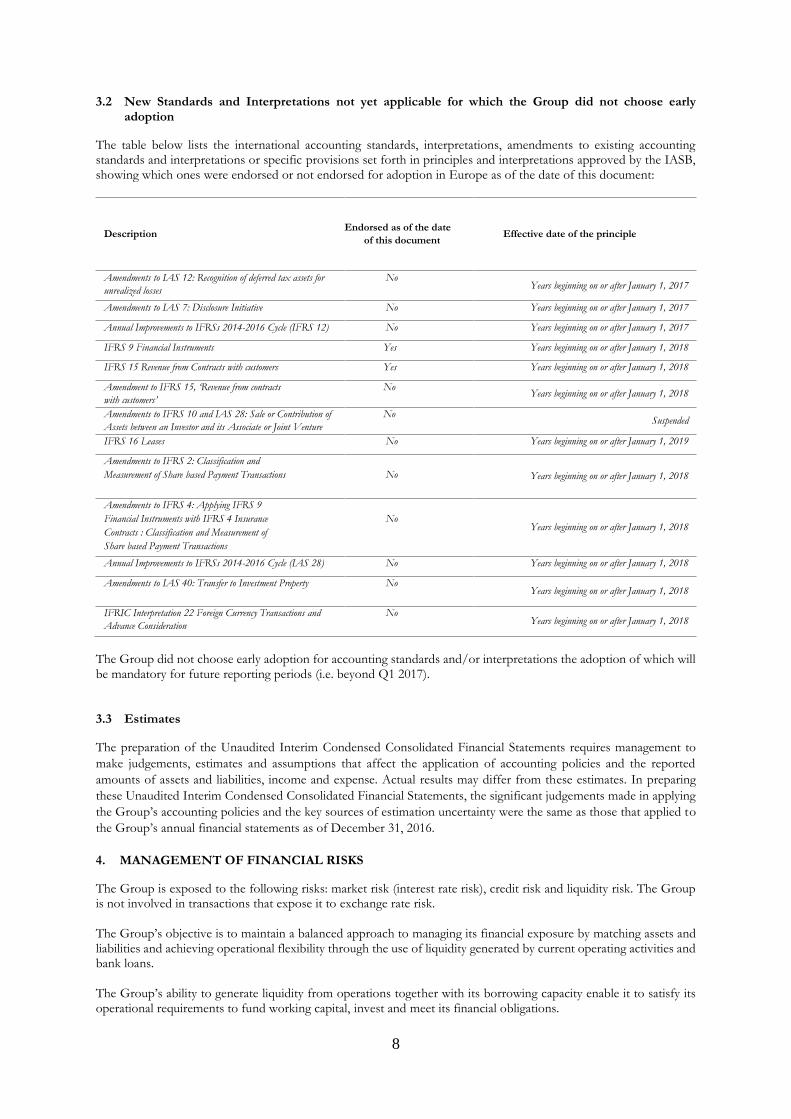
3.2 New Standards and Interpretations not yet applicable for which the Group did not choose early adoption
The table below lists the international accounting standards, interpretations, amendments to existing accounting standards and interpretations or specific provisions set forth in principles and interpretations approved by the IASB, showing which ones were endorsed or not endorsed for adoption in Europe as of the date of this document:
Description Endorsed as of the date
of this document Effective date of the principle
Amendments to IAS 12: Recognition of deferred tax assets for
unrealized losses
No Years beginning on or after January 1, 2017
Amendments to IAS 7: Disclosure Initiative No Years beginning on or after January 1, 2017
Annual Improvements to IFRSs 2014-2016 Cycle (IFRS 12) No Years beginning on or after January 1, 2017
IFRS 9 Financial Instruments Yes Years beginning on or after January 1, 2018
IFRS 15 Revenue from Contracts with customers Yes Years beginning on or after January 1, 2018
Amendment to IFRS 15, ‘Revenue from contracts
with customers’
No Years beginning on or after January 1, 2018
Amendments to IFRS 10 and IAS 28: Sale or Contribution of
Assets between an Investor and its Associate or Joint Venture
No Suspended
IFRS 16 Leases No Years beginning on or after January 1, 2019
Amendments to IFRS 2: Classification and
Measurement of Share based Payment Transactions
No Years beginning on or after January 1, 2018
Amendments to IFRS 4: Applying IFRS 9
Financial Instruments with IFRS 4 Insurance
Contracts : Classification and Measurement of
Share based Payment Transactions
No Years beginning on or after January 1, 2018
Annual Improvements to IFRSs 2014-2016 Cycle (IAS 28) No Years beginning on or after January 1, 2018
Amendments to IAS 40: Transfer to Investment Property No Years beginning on or after January 1, 2018
IFRIC Interpretation 22 Foreign Currency Transactions and
Advance Consideration
No Years beginning on or after January 1, 2018
The Group did not choose early adoption for accounting standards and/or interpretations the adoption of which will be mandatory for future reporting periods (i.e. beyond Q1 2017). 3.3 Estimates
The preparation of the Unaudited Interim Condensed Consolidated Financial Statements requires management to
make judgements, estimates and assumptions that affect the application of accounting policies and the reported
amounts of assets and liabilities, income and expense. Actual results may differ from these estimates. In preparing
these Unaudited Interim Condensed Consolidated Financial Statements, the significant judgements made in applying
the Group’s accounting policies and the key sources of estimation uncertainty were the same as those that applied to
the Group’s annual financial statements as of December 31, 2016.
4. MANAGEMENT OF FINANCIAL RISKS
The Group is exposed to the following risks: market risk (interest rate risk), credit risk and liquidity risk. The Group is not involved in transactions that expose it to exchange rate risk. The Group’s objective is to maintain a balanced approach to managing its financial exposure by matching assets and liabilities and achieving operational flexibility through the use of liquidity generated by current operating activities and bank loans. The Group’s ability to generate liquidity from operations together with its borrowing capacity enable it to satisfy its operational requirements to fund working capital, invest and meet its financial obligations.
9
Treasury and financial risk management are centralized within the Group. Specifically, the central finance function is responsible for evaluating and approving forecasted financial requirements, monitoring trends and taking corrective action as necessary. 4.1 Market risk
Interest rate risk While the effect of interest rate changes on the variable component of financial payables and liquidity may result in higher/lower finance income/charges, it is noted that the Group has limited exposure to interest rate risk as the main part of its financial debt, represented by the bond, is at fixed rate. 4.2 Credit risk
Credit risk represents the Group’s exposure to the risk of potential losses resulting from the non-fulfillment of obligations by counterparts. Collecting receivables deriving from betting and or AWP/VLT operations may generate credit risk for the Group, whose revenues are generated by the concessions granted by the Customs and Monopolies Agency (ADM), as the failure of, or losses incurred by, one or more members of the distribution network or the interruption of relations with any of them for whatever reason can have a negative impact on the Group’s results, business activities, financial conditions and future prospects. Trade receivables are recognized net of provisions, calculated on the basis of the risk of non-fulfillment of obligations by counterparts, in turn based on information available regarding the counterparty’s solvency and historical data. Provisions are made against individually significant receivables for which an objective risk of partial or total non-collection is identified.
4.3 Liquidity risk
Liquidity risk is the risk that, owing to an inability to access new funds or sell assets, the Group is unable to meet its payment obligations, leading to a negative impact on results if it is then obliged to incur additional costs to meet its obligations or deal with insolvency. The Group manages this risk by seeking to establish a financial structure that, consistent with its business objectives and defined limits, ensures sufficient liquidity, while minimizing the related opportunity cost, and maintains an appropriate balance in terms of duration and composition of debt. The Group’s exposure to liquidity risk relates mainly to obligations arising in relation to the refinancing operation undertaken in August 2016 through the issuance of a bond and use of a revolving loan facility. 4.4 Determination of fair value
Financial instruments carried at fair value are reported by valuation method. The different valuation levels are defined as follows:
- Quoted prices (unadjusted) in active markets for identical assets or liabilities (Level 1). - Inputs other than quoted prices included within level 1 that are observable for the asset or liability, either
directly (that is, as prices) or indirectly (that is, derived from prices) (Level 2). - Inputs for the asset or liability that are not based on observable market data (that is, unobservable inputs)
(Level 3). Both at March 31, 2017 and December 31 2016 the Group reported no outstanding assets and liabilities measured at fair value. 5. CAPITAL MANAGEMENT
The Group’s capital management is aimed at guaranteeing solid credit ratings and adequate capital indicators to support its investment plans, while meeting contractual obligations with lenders.
10
The Group ensures it has sufficient capital to finance its business development needs and meet operating requirements; to guarantee a balanced financial structure and minimize the total cost of capital, finances are sourced through a mix of risk capital and debt to the benefit of all stakeholders. Regarding certain financial liabilities, the Group is subject to certain restrictions (for further details see “Note 10.14 Current and non-current financial liabilities”). Returns on capital are monitored by reviewing market trends and business performance, net of other commitments, including borrowing costs. In order to ensure the Group’s going concern status, to develop the business and to provide an adequate return on capital, Management monitors the Group’s debt to equity ratio, on an ongoing basis, also in comparison with business trend and expected future cash flows in the medium/long term. 6. OPERATING SEGMENTS
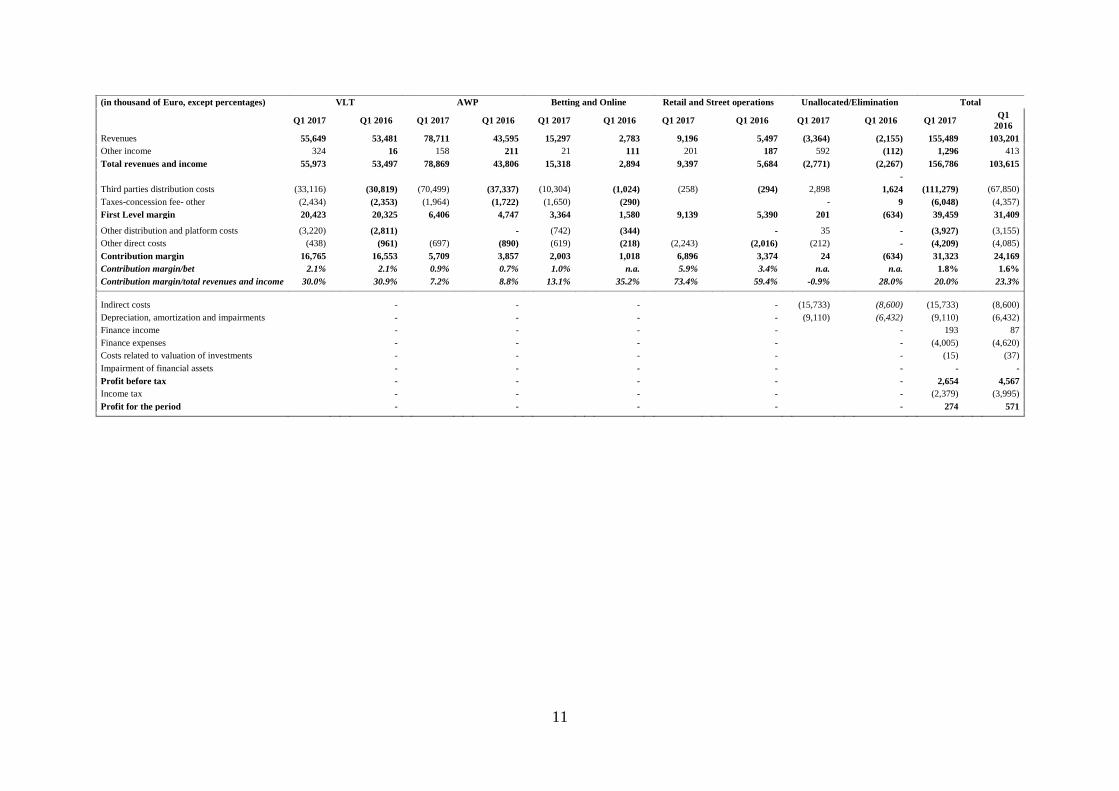
The following disclosure regarding operating segments is provided in accordance with IFRS 8 "Operating segments” (hereafter “IFRS 8”), which requires that such disclosure reflects the manner in which management manages the business and makes operational decisions. Accordingly, the operating segments and related disclosures are based on internal reporting used by management to make decisions about resources to be allocated to the various operating segments and assess performance. IFRS 8 defines an operating segment as a component of an entity that: i) engages in business activities from which it may earn revenues and incur expenses (including revenues and expenses relating to transactions with other components of the same entity); ii) whose operating results are regularly reviewed by the entity’s chief operating decision maker to make decisions about resources to be allocated to the segment and assess its performance; and iii) for which discrete financial information is available. The Group organizes and manages its business activities in terms of the following operating segments: (i) video lottery terminal (“VLT”); (ii) amusement with prize (“AWP”); (iii) “Betting and online”; and (iv) direct ownership of VLT gaming halls and direct AWP operations (Retail & Street Operations). Operating segments are monitored based on: i) revenues and other income; ii) first level margin; and iii) contribution margin. First level margin is defined as revenues and other income net of distribution and platform costs, concession fees and other costs. Contribution margin is defined as first level margin, net of other distribution and platform costs and other direct costs. Management believes that the aforementioned indicators provide a good indication of the performance of the four
operating segments.
The following table provides details of Group operating segments for the periods indicated:
11
(in thousand of Euro, except percentages) VLT AWP Betting and Online Retail and Street operations Unallocated/Elimination Total
Q1 2017
Q1 2016 Q1 2017
Q1 2016 Q1 2017
Q1 2016 Q1 2017
Q1 2016 Q1 2017
Q1 2016 Q1 2017
Q1
2016
Revenues 55,649 53,481 78,711 43,595 15,297 2,783 9,196 5,497 (3,364) (2,155) 155,489 103,201
Other income 324 16 158 211 21 111 201 187 592 (112) 1,296 413
Total revenues and income 55,973 53,497 78,869 43,806 15,318 2,894 9,397 5,684 (2,771) (2,267) 156,786 103,615
-
Third parties distribution costs (33,116) (30,819) (70,499) (37,337) (10,304) (1,024) (258) (294) 2,898 1,624 (111,279) (67,850)
Taxes-concession fee- other (2,434) (2,353) (1,964) (1,722) (1,650) (290) - 9 (6,048) (4,357)
First Level margin 20,423 20,325 6,406
4,747 3,364 1,580 9,139
5,390 201 (634) 39,459
31,409
Other distribution and platform costs (3,220) (2,811) - (742) (344) - 35 - (3,927) (3,155)
Other direct costs (438) (961) (697) (890) (619) (218) (2,243) (2,016) (212) - (4,209) (4,085)
Contribution margin 16,765 16,553 5,709
3,857 2,003 1,018 6,896
3,374 24 (634) 31,323
24,169
Contribution margin/bet 2.1% 2.1% 0.9% 0.7% 1.0% n.a. 5.9% 3.4% n.a. n.a. 1.8% 1.6%
Contribution margin/total revenues and income 30.0% 30.9% 7.2% 8.8% 13.1% 35.2% 73.4% 59.4% -0.9% 28.0% 20.0% 23.3%
Indirect costs - - - - (15,733) (8,600) (15,733) (8,600)
Depreciation, amortization and impairments - - - - (9,110) (6,432) (9,110) (6,432)
Finance income - - - - - 193 87
Finance expenses - - - - - (4,005) (4,620)
Costs related to valuation of investments - - - - - (15) (37)
Impairment of financial assets - - - - - - -
Profit before tax - - - - - 2,654 4,567
Income tax - - - - - (2,379) (3,995)
Profit for the period - - - - - 274 571
12
Given the range of services and products sold by the Group, there are no significant concentrations of revenues with individual customers. The Group currently operates solely in Italy. Finally, in terms of the balance sheet, management does not monitor assets by segment. 7. BUSINESS COMBINATIONS
The business combinations that took place during the three months ended March 31, 2017 had the effect of extending the scope of the Group consolidation. All of the acquisitions (described below) were made in the context of the Group’s vertical integration strategy. 7.1 Acquisition of La Chance S.r.l. and Slot Planet S.r.l.
On March 2, 2017, Gamenet Entertainment S.r.l. signed a framework agreement for the purchase of 60% of the share capital of La Chanche S.r.l., which is active in the public gaming sector both directly, through its management of a gaming hall (with 15 AWPs and 33 VLTs) , and indirectly through its ownership of the entire share capital of Slot Planet, which manages a gaming hall (with 34 AWPs and 22 VLTs) . Costs relating to the transaction were fully recognized in the income statement in the year to which they related. Cash flows relating to the consideration paid for the three months ended March 31, 2017 amounted to Euro 885 thousand. 7.2 Acquisition of businesses concerns
In the first quarter of 2017, Gamenet S.p.A. acquired an AWP related business concern. The fair values of assets acquired and liabilities assumed were determined in accordance with the provisions of IFRS 3 and the excess of the consideration paid with respect to the fair value of the net assets acquired, amounting to Euro 913 thousand, was recognized as goodwill. Costs relating to the transaction were fully recognized in the income statement in the year to which they related. Cash flows relating to the consideration paid for the three months ended March 31, 2017 amounted to Euro 250 thousand. Please note that the purchase agreement did not provide for an earn-out payment or other conditions or limitations which may have future adverse effects. 8. SEASONALITY
With respect to seasonality, the Group’s business is not subject to significant fluctuations, although it should be considered that the number of sports events, in particular football matches, for which bets are accepted, is higher in the first and fourth quarters than in other quarters of the year. As far as AWP / VLT bet is concerned, fourth quarter’s bet is higher than in any other quarters.
9. NOTES TO THE UNAUDITED INTERIM CONDENSED CONSOLIDATED STATEMENT OF
COMPREHENSIVE INCOME
9.1 Revenues
The following table provides a breakdown of “Revenues”:
For the three months ended March 31,
(in thousands of Euro) 2017 2016
VLT 55.649 53,481
AWP 78.711 43,595
Betting and Online 15.297 2,783
Retails and Street Operations 9.196 5,497
Not allocated/eliminations (3.364) (2,155)
Total 155,489 103,201
13
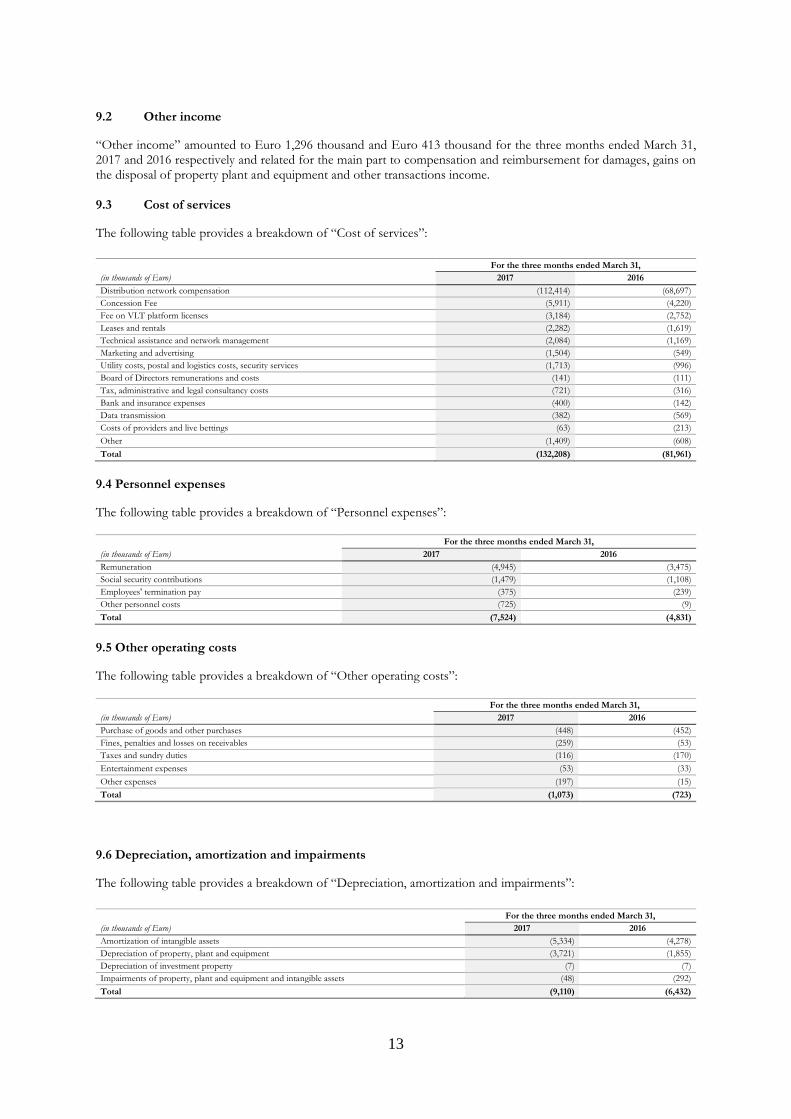
9.2 Other income
“Other income” amounted to Euro 1,296 thousand and Euro 413 thousand for the three months ended March 31, 2017 and 2016 respectively and related for the main part to compensation and reimbursement for damages, gains on the disposal of property plant and equipment and other transactions income. 9.3 Cost of services
The following table provides a breakdown of “Cost of services”:
For the three months ended March 31,
(in thousands of Euro) 2017 2016
Distribution network compensation (112,414) (68,697)
Concession Fee (5,911) (4,220)
Fee on VLT platform licenses (3,184) (2,752)
Leases and rentals (2,282) (1,619)
Technical assistance and network management (2,084) (1,169)
Marketing and advertising (1,504) (549)
Utility costs, postal and logistics costs, security services (1,713) (996)
Board of Directors remunerations and costs (141) (111)
Tax, administrative and legal consultancy costs (721) (316)
Bank and insurance expenses (400) (142)
Data transmission (382) (569)
Costs of providers and live bettings (63) (213)
Other (1,409) (608)
Total (132,208) (81,961)
9.4 Personnel expenses
The following table provides a breakdown of “Personnel expenses”:
For the three months ended March 31,
(in thousands of Euro) 2017 2016
Remuneration (4,945) (3,475)
Social security contributions (1,479) (1,108)
Employees' termination pay (375) (239)
Other personnel costs (725) (9)
Total (7,524) (4,831)
9.5 Other operating costs
The following table provides a breakdown of “Other operating costs”:
For the three months ended March 31,
(in thousands of Euro) 2017 2016
Purchase of goods and other purchases (448) (452)
Fines, penalties and losses on receivables (259) (53)
Taxes and sundry duties (116) (170)
Entertainment expenses (53) (33)
Other expenses (197) (15)
Total (1,073) (723)
9.6 Depreciation, amortization and impairments
The following table provides a breakdown of “Depreciation, amortization and impairments”:
For the three months ended March 31,
(in thousands of Euro) 2017 2016
Amortization of intangible assets (5,334) (4,278)
Depreciation of property, plant and equipment (3,721) (1,855)
Depreciation of investment property (7) (7)
Impairments of property, plant and equipment and intangible assets (48) (292)
Total (9,110) (6,432)
14
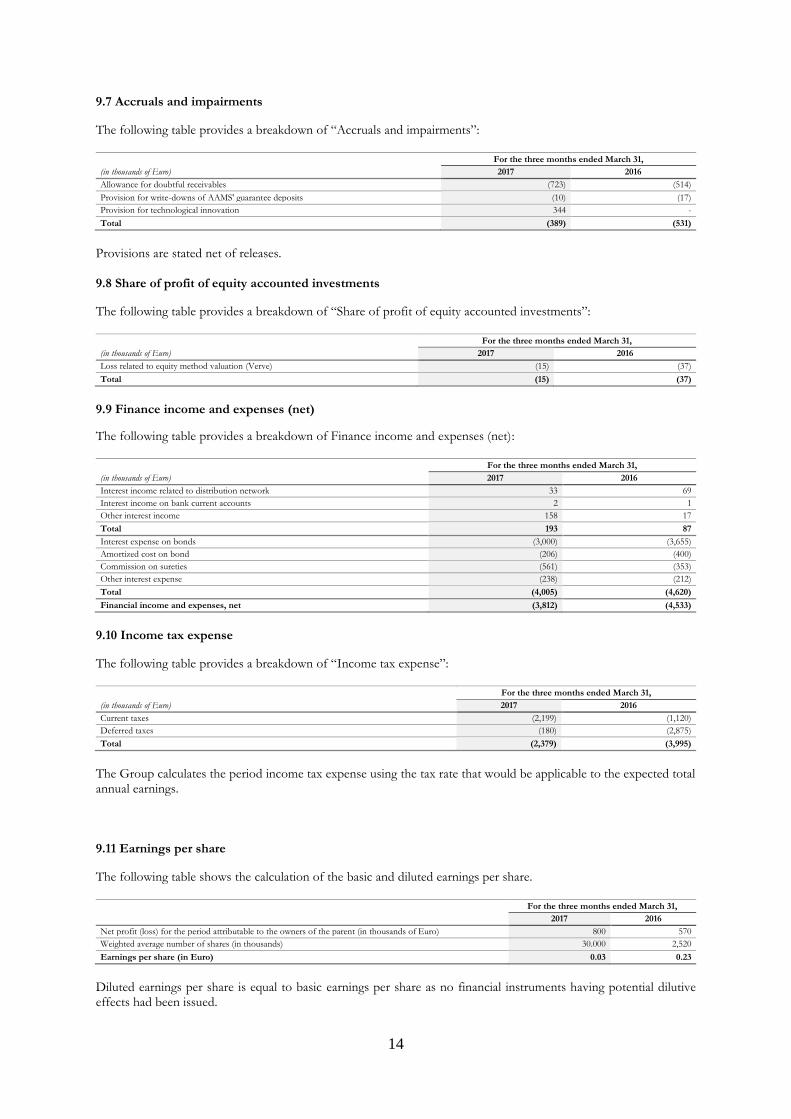
9.7 Accruals and impairments
The following table provides a breakdown of “Accruals and impairments”:
For the three months ended March 31,
(in thousands of Euro) 2017 2016
Allowance for doubtful receivables (723) (514)
Provision for write-downs of AAMS' guarantee deposits (10) (17)
Provision for technological innovation 344 -
Total (389) (531)
Provisions are stated net of releases. 9.8 Share of profit of equity accounted investments
The following table provides a breakdown of “Share of profit of equity accounted investments”:
For the three months ended March 31,
(in thousands of Euro) 2017 2016
Loss related to equity method valuation (Verve) (15) (37)
Total (15) (37)
9.9 Finance income and expenses (net)
The following table provides a breakdown of Finance income and expenses (net):
For the three months ended March 31,
(in thousands of Euro) 2017 2016
Interest income related to distribution network 33 69
Interest income on bank current accounts 2 1
Other interest income 158 17
Total 193 87
Interest expense on bonds (3,000) (3,655)
Amortized cost on bond (206) (400)
Commission on sureties (561) (353)
Other interest expense (238) (212)
Total (4,005) (4,620)
Financial income and expenses, net (3,812) (4,533)
9.10 Income tax expense
The following table provides a breakdown of “Income tax expense”:
For the three months ended March 31,
(in thousands of Euro) 2017 2016
Current taxes (2,199) (1,120)
Deferred taxes (180) (2,875)
Total (2,379) (3,995)
The Group calculates the period income tax expense using the tax rate that would be applicable to the expected total annual earnings. 9.11 Earnings per share
The following table shows the calculation of the basic and diluted earnings per share.
For the three months ended March 31,
2017 2016
Net profit (loss) for the period attributable to the owners of the parent (in thousands of Euro) 800 570
Weighted average number of shares (in thousands) 30.000 2,520
Earnings per share (in Euro) 0.03 0.23
Diluted earnings per share is equal to basic earnings per share as no financial instruments having potential dilutive effects had been issued.
15
10. NOTES TO THE UNAUDITED INTERIM CONDENSED CONSOLIDATED STATEMENT OF
FINANCIAL POSITION
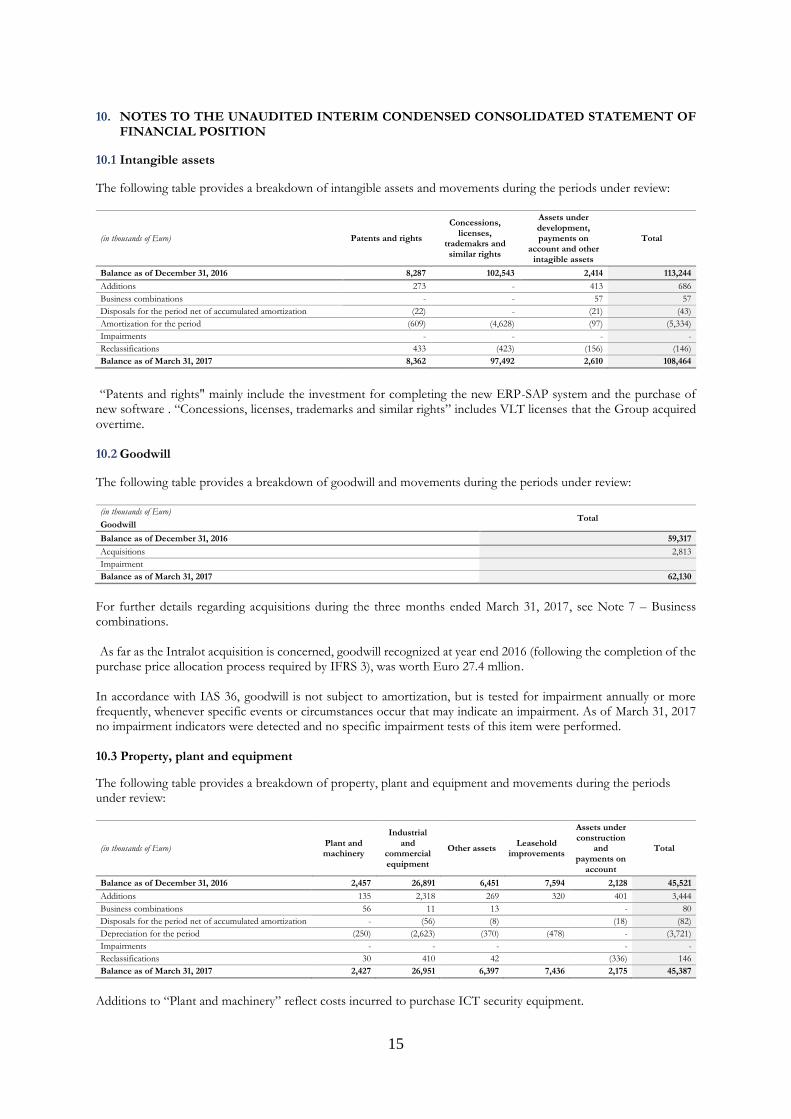
10.1 Intangible assets
The following table provides a breakdown of intangible assets and movements during the periods under review:
(in thousands of Euro) Patents and rights
Concessions, licenses,
trademakrs and similar rights
Assets under development, payments on
account and other intagible assets
Total
Balance as of December 31, 2016 8,287 102,543 2,414 113,244
Additions 273 - 413 686
Business combinations - - 57 57
Disposals for the period net of accumulated amortization (22) - (21) (43)
Amortization for the period (609) (4,628) (97) (5,334)
Impairments - - - -
Reclassifications 433 (423) (156) (146)
Balance as of March 31, 2017 8,362 97,492 2,610 108,464
“Patents and rights" mainly include the investment for completing the new ERP-SAP system and the purchase of new software . “Concessions, licenses, trademarks and similar rights” includes VLT licenses that the Group acquired overtime. 10.2 Goodwill
The following table provides a breakdown of goodwill and movements during the periods under review: (in thousands of Euro)
Total Goodwill
Balance as of December 31, 2016 59,317
Acquisitions 2,813
Impairment Balance as of March 31, 2017 62,130
For further details regarding acquisitions during the three months ended March 31, 2017, see Note 7 – Business combinations. As far as the Intralot acquisition is concerned, goodwill recognized at year end 2016 (following the completion of the purchase price allocation process required by IFRS 3), was worth Euro 27.4 mllion. In accordance with IAS 36, goodwill is not subject to amortization, but is tested for impairment annually or more frequently, whenever specific events or circumstances occur that may indicate an impairment. As of March 31, 2017 no impairment indicators were detected and no specific impairment tests of this item were performed. 10.3 Property, plant and equipment
The following table provides a breakdown of property, plant and equipment and movements during the periods under review:
(in thousands of Euro) Plant and machinery
Industrial and
commercial equipment
Other assets Leasehold
improvements
Assets under construction
and payments on
account
Total
Balance as of December 31, 2016 2,457 26,891 6,451 7,594 2,128 45,521
Additions 135 2,318 269 320 401 3,444
Business combinations 56 11 13 - 80
Disposals for the period net of accumulated amortization - (56) (8) (18) (82)
Depreciation for the period (250) (2,623) (370) (478) - (3,721)
Impairments - - - - -
Reclassifications 30 410 42 (336) 146
Balance as of March 31, 2017 2,427 26,951 6,397 7,436 2,175 45,387
Additions to “Plant and machinery” reflect costs incurred to purchase ICT security equipment.
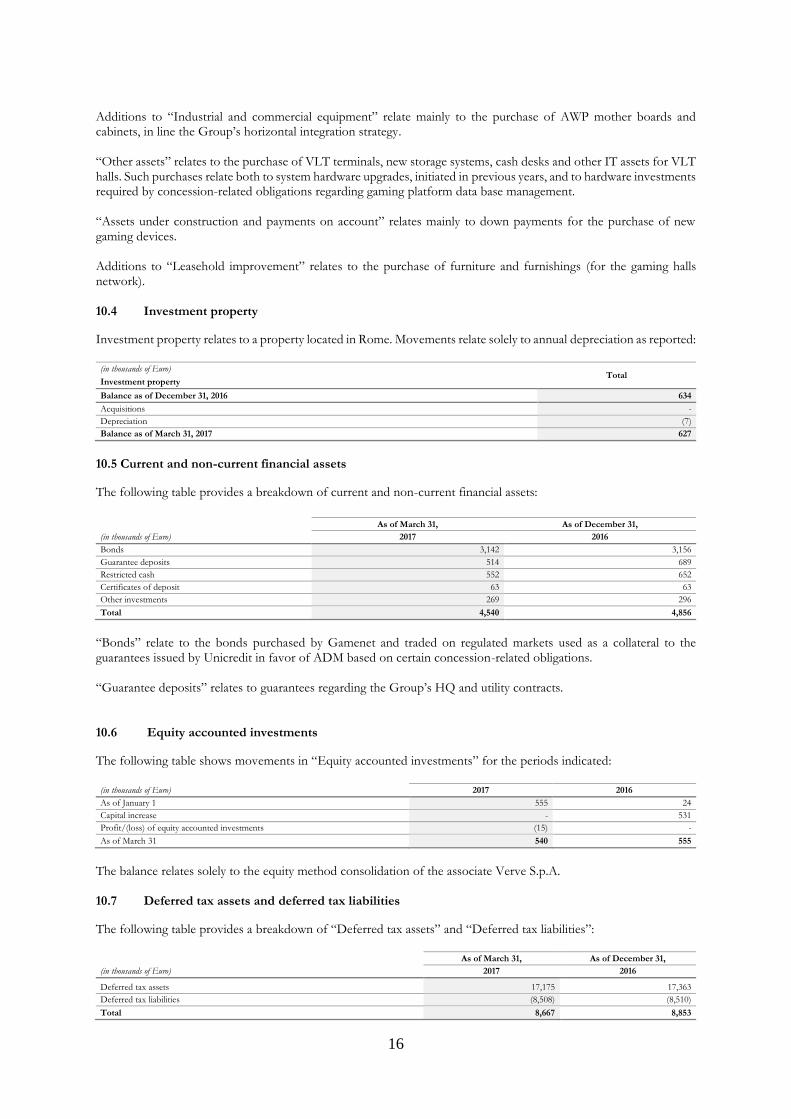
16
Additions to “Industrial and commercial equipment” relate mainly to the purchase of AWP mother boards and cabinets, in line the Group’s horizontal integration strategy. “Other assets” relates to the purchase of VLT terminals, new storage systems, cash desks and other IT assets for VLT halls. Such purchases relate both to system hardware upgrades, initiated in previous years, and to hardware investments required by concession-related obligations regarding gaming platform data base management. “Assets under construction and payments on account” relates mainly to down payments for the purchase of new gaming devices. Additions to “Leasehold improvement” relates to the purchase of furniture and furnishings (for the gaming halls network). 10.4 Investment property
Investment property relates to a property located in Rome. Movements relate solely to annual depreciation as reported: (in thousands of Euro)
Total Investment property
Balance as of December 31, 2016 634
Acquisitions -
Depreciation (7)
Balance as of March 31, 2017 627
10.5 Current and non-current financial assets
The following table provides a breakdown of current and non-current financial assets:
As of March 31, As of December 31,
(in thousands of Euro) 2017 2016
Bonds 3,142 3,156
Guarantee deposits 514 689
Restricted cash 552 652
Certificates of deposit 63 63
Other investments 269 296
Total 4,540 4,856
“Bonds” relate to the bonds purchased by Gamenet and traded on regulated markets used as a collateral to the guarantees issued by Unicredit in favor of ADM based on certain concession-related obligations. “Guarantee deposits” relates to guarantees regarding the Group’s HQ and utility contracts. 10.6 Equity accounted investments
The following table shows movements in “Equity accounted investments” for the periods indicated: (in thousands of Euro) 2017 2016
As of January 1 555 24
Capital increase - 531
Profit/(loss) of equity accounted investments (15) -
As of March 31 540 555
The balance relates solely to the equity method consolidation of the associate Verve S.p.A. 10.7 Deferred tax assets and deferred tax liabilities
The following table provides a breakdown of “Deferred tax assets” and “Deferred tax liabilities”:
As of March 31, As of December 31,
(in thousands of Euro) 2017 2016
Deferred tax assets 17,175 17,363
Deferred tax liabilities (8,508) (8,510)
Total 8,667 8,853
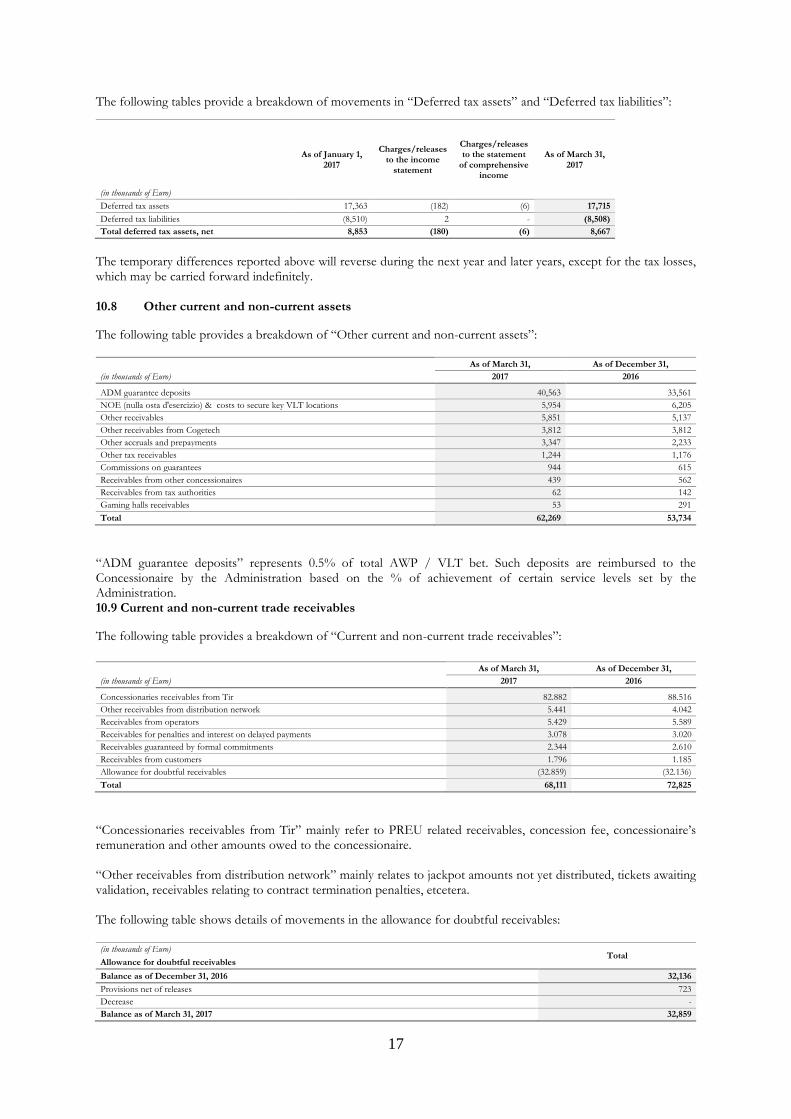
17
The following tables provide a breakdown of movements in “Deferred tax assets” and “Deferred tax liabilities”:
(in thousands of Euro)
As of January 1, 2017
Charges/releases to the income
statement
Charges/releases to the statement
of comprehensive income
As of March 31, 2017
Deferred tax assets 17,363 (182) (6) 17,715
Deferred tax liabilities (8,510) 2 - (8,508)
Total deferred tax assets, net 8,853 (180) (6) 8,667
The temporary differences reported above will reverse during the next year and later years, except for the tax losses, which may be carried forward indefinitely. 10.8 Other current and non-current assets
The following table provides a breakdown of “Other current and non-current assets”:
As of March 31, As of December 31,
(in thousands of Euro) 2017 2016
ADM guarantee deposits 40,563 33,561
NOE (nulla osta d'esercizio) & costs to secure key VLT locations 5,954 6,205
Other receivables 5,851 5,137
Other receivables from Cogetech 3,812 3,812
Other accruals and prepayments 3,347 2,233
Other tax receivables 1,244 1,176
Commissions on guarantees 944 615
Receivables from other concessionaires 439 562
Receivables from tax authorities 62 142
Gaming halls receivables 53 291
Total 62,269 53,734
“ADM guarantee deposits” represents 0.5% of total AWP / VLT bet. Such deposits are reimbursed to the Concessionaire by the Administration based on the % of achievement of certain service levels set by the Administration. 10.9 Current and non-current trade receivables
The following table provides a breakdown of “Current and non-current trade receivables”:
As of March 31, As of December 31,
(in thousands of Euro) 2017 2016
Concessionaries receivables from Tir 82.882 88.516
Other receivables from distribution network 5.441 4.042
Receivables from operators 5.429 5.589
Receivables for penalties and interest on delayed payments 3.078 3.020
Receivables guaranteed by formal commitments 2.344 2.610
Receivables from customers 1.796 1.185
Allowance for doubtful receivables (32.859) (32.136)
Total 68,111 72,825
“Concessionaries receivables from Tir” mainly refer to PREU related receivables, concession fee, concessionaire’s remuneration and other amounts owed to the concessionaire. “Other receivables from distribution network” mainly relates to jackpot amounts not yet distributed, tickets awaiting validation, receivables relating to contract termination penalties, etcetera. The following table shows details of movements in the allowance for doubtful receivables: (in thousands of Euro)
Total Allowance for doubtful receivables
Balance as of December 31, 2016 32,136
Provisions net of releases 723
Decrease -
Balance as of March 31, 2017 32,859
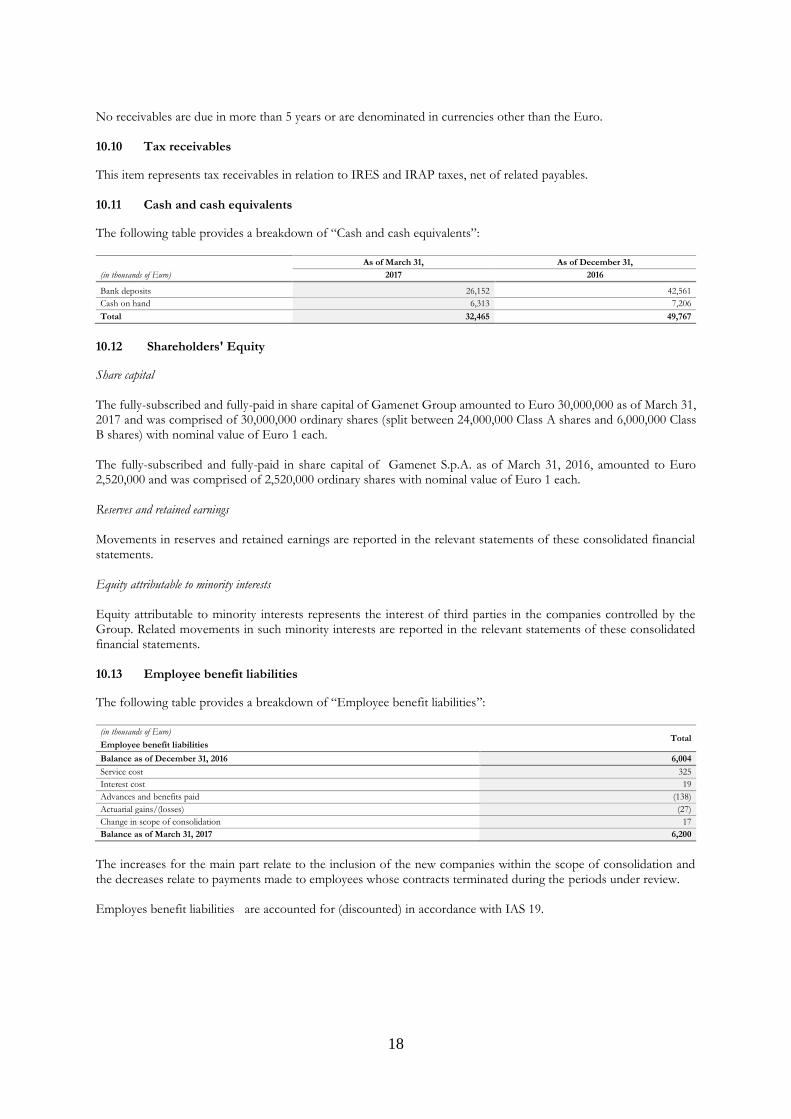
18
No receivables are due in more than 5 years or are denominated in currencies other than the Euro. 10.10 Tax receivables
This item represents tax receivables in relation to IRES and IRAP taxes, net of related payables. 10.11 Cash and cash equivalents
The following table provides a breakdown of “Cash and cash equivalents”:
As of March 31, As of December 31,
(in thousands of Euro) 2017 2016
Bank deposits 26,152 42,561
Cash on hand 6,313 7,206
Total 32,465 49,767
10.12 Shareholders' Equity
Share capital The fully-subscribed and fully-paid in share capital of Gamenet Group amounted to Euro 30,000,000 as of March 31, 2017 and was comprised of 30,000,000 ordinary shares (split between 24,000,000 Class A shares and 6,000,000 Class B shares) with nominal value of Euro 1 each. The fully-subscribed and fully-paid in share capital of Gamenet S.p.A. as of March 31, 2016, amounted to Euro 2,520,000 and was comprised of 2,520,000 ordinary shares with nominal value of Euro 1 each. Reserves and retained earnings Movements in reserves and retained earnings are reported in the relevant statements of these consolidated financial statements. Equity attributable to minority interests Equity attributable to minority interests represents the interest of third parties in the companies controlled by the Group. Related movements in such minority interests are reported in the relevant statements of these consolidated financial statements. 10.13 Employee benefit liabilities
The following table provides a breakdown of “Employee benefit liabilities”: (in thousands of Euro)
Total Employee benefit liabilities
Balance as of December 31, 2016 6,004
Service cost 325
Interest cost 19
Advances and benefits paid (138)
Actuarial gains/(losses) (27)
Change in scope of consolidation 17
Balance as of March 31, 2017 6,200
The increases for the main part relate to the inclusion of the new companies within the scope of consolidation and the decreases relate to payments made to employees whose contracts terminated during the periods under review. Employes benefit liabilities are accounted for (discounted) in accordance with IAS 19.
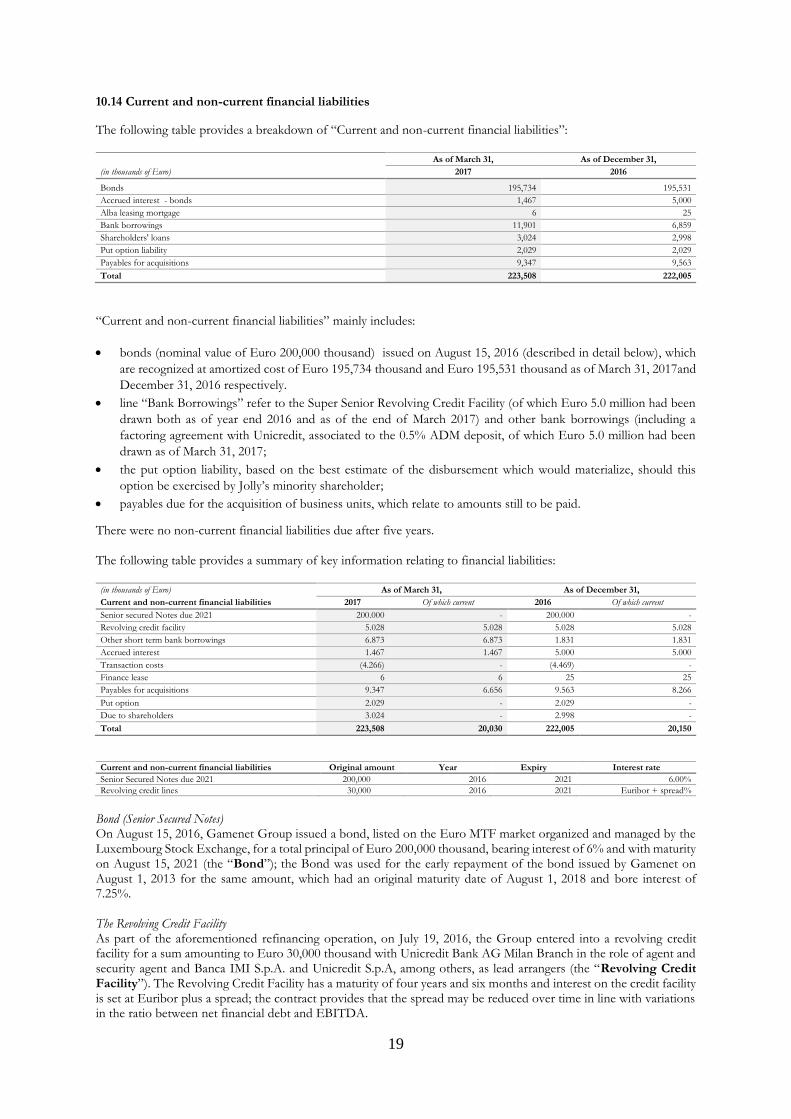
19
10.14 Current and non-current financial liabilities
The following table provides a breakdown of “Current and non-current financial liabilities”:
As of March 31, As of December 31,
(in thousands of Euro) 2017 2016
Bonds 195,734 195,531
Accrued interest - bonds 1,467 5,000
Alba leasing mortgage 6 25
Bank borrowings 11,901 6,859
Shareholders' loans 3,024 2,998
Put option liability 2,029 2,029
Payables for acquisitions 9,347 9,563
Total 223,508 222,005
“Current and non-current financial liabilities” mainly includes:
• bonds (nominal value of Euro 200,000 thousand) issued on August 15, 2016 (described in detail below), which
are recognized at amortized cost of Euro 195,734 thousand and Euro 195,531 thousand as of March 31, 2017and
December 31, 2016 respectively.
• line “Bank Borrowings” refer to the Super Senior Revolving Credit Facility (of which Euro 5.0 million had been
drawn both as of year end 2016 and as of the end of March 2017) and other bank borrowings (including a
factoring agreement with Unicredit, associated to the 0.5% ADM deposit, of which Euro 5.0 million had been
drawn as of March 31, 2017;
• the put option liability, based on the best estimate of the disbursement which would materialize, should this
option be exercised by Jolly’s minority shareholder;
• payables due for the acquisition of business units, which relate to amounts still to be paid.
There were no non-current financial liabilities due after five years. The following table provides a summary of key information relating to financial liabilities: (in thousands of Euro) As of March 31, As of December 31,
Current and non-current financial liabilities 2017 Of which current 2016 Of which current
Senior secured Notes due 2021 200.000 - 200.000 -
Revolving credit facility 5.028 5.028 5.028 5.028
Other short term bank borrowings 6.873 6.873 1.831 1.831
Accrued interest 1.467 1.467 5.000 5.000
Transaction costs (4.266) - (4.469) -
Finance lease 6 6 25 25
Payables for acquisitions 9.347 6.656 9.563 8.266
Put option 2.029 - 2.029 -
Due to shareholders 3.024 - 2.998 -
Total 223,508 20,030 222,005 20,150
Current and non-current financial liabilities Original amount Year Expiry Interest rate
Senior Secured Notes due 2021 200,000 2016 2021 6.00%
Revolving credit lines 30,000 2016 2021 Euribor + spread%
Bond (Senior Secured Notes) On August 15, 2016, Gamenet Group issued a bond, listed on the Euro MTF market organized and managed by the Luxembourg Stock Exchange, for a total principal of Euro 200,000 thousand, bearing interest of 6% and with maturity on August 15, 2021 (the “Bond”); the Bond was used for the early repayment of the bond issued by Gamenet on August 1, 2013 for the same amount, which had an original maturity date of August 1, 2018 and bore interest of 7.25%. The Revolving Credit Facility As part of the aforementioned refinancing operation, on July 19, 2016, the Group entered into a revolving credit facility for a sum amounting to Euro 30,000 thousand with Unicredit Bank AG Milan Branch in the role of agent and security agent and Banca IMI S.p.A. and Unicredit S.p.A, among others, as lead arrangers (the “Revolving Credit Facility”). The Revolving Credit Facility has a maturity of four years and six months and interest on the credit facility is set at Euribor plus a spread; the contract provides that the spread may be reduced over time in line with variations in the ratio between net financial debt and EBITDA.
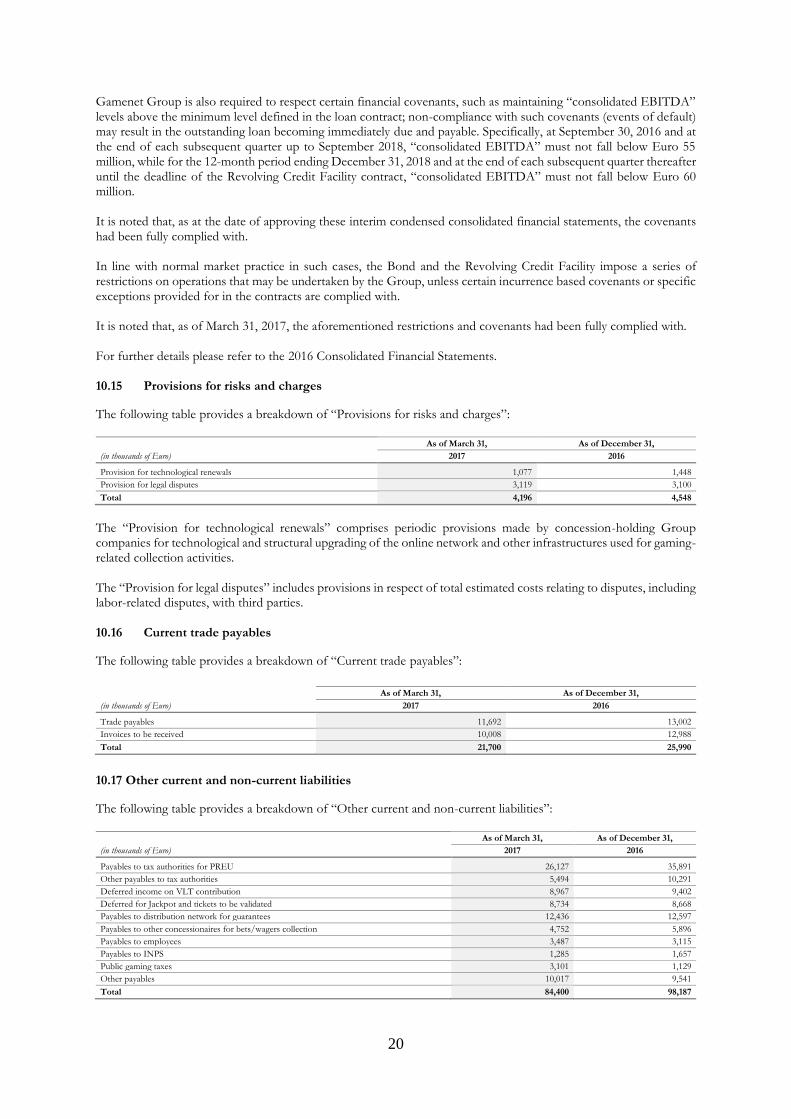
20
Gamenet Group is also required to respect certain financial covenants, such as maintaining “consolidated EBITDA” levels above the minimum level defined in the loan contract; non-compliance with such covenants (events of default) may result in the outstanding loan becoming immediately due and payable. Specifically, at September 30, 2016 and at the end of each subsequent quarter up to September 2018, “consolidated EBITDA” must not fall below Euro 55 million, while for the 12-month period ending December 31, 2018 and at the end of each subsequent quarter thereafter until the deadline of the Revolving Credit Facility contract, “consolidated EBITDA” must not fall below Euro 60 million. It is noted that, as at the date of approving these interim condensed consolidated financial statements, the covenants had been fully complied with. In line with normal market practice in such cases, the Bond and the Revolving Credit Facility impose a series of restrictions on operations that may be undertaken by the Group, unless certain incurrence based covenants or specific exceptions provided for in the contracts are complied with. It is noted that, as of March 31, 2017, the aforementioned restrictions and covenants had been fully complied with. For further details please refer to the 2016 Consolidated Financial Statements. 10.15 Provisions for risks and charges
The following table provides a breakdown of “Provisions for risks and charges”:
As of March 31, As of December 31,
(in thousands of Euro) 2017 2016
Provision for technological renewals 1,077 1,448
Provision for legal disputes 3,119 3,100
Total 4,196 4,548
The “Provision for technological renewals” comprises periodic provisions made by concession-holding Group companies for technological and structural upgrading of the online network and other infrastructures used for gaming-related collection activities. The “Provision for legal disputes” includes provisions in respect of total estimated costs relating to disputes, including labor-related disputes, with third parties. 10.16 Current trade payables
The following table provides a breakdown of “Current trade payables”:
As of March 31, As of December 31,
(in thousands of Euro) 2017 2016
Trade payables 11,692 13,002
Invoices to be received 10,008 12,988
Total 21,700 25,990
10.17 Other current and non-current liabilities
The following table provides a breakdown of “Other current and non-current liabilities”:
As of March 31, As of December 31,
(in thousands of Euro) 2017 2016
Payables to tax authorities for PREU 26,127 35,891
Other payables to tax authorities 5,494 10,291
Deferred income on VLT contribution 8,967 9,402
Deferred for Jackpot and tickets to be validated 8,734 8,668
Payables to distribution network for guarantees 12,436 12,597
Payables to other concessionaires for bets/wagers collection 4,752 5,896
Payables to employees 3,487 3,115
Payables to INPS 1,285 1,657
Public gaming taxes 3,101 1,129
Other payables 10,017 9,541
Total 84,400 98,187
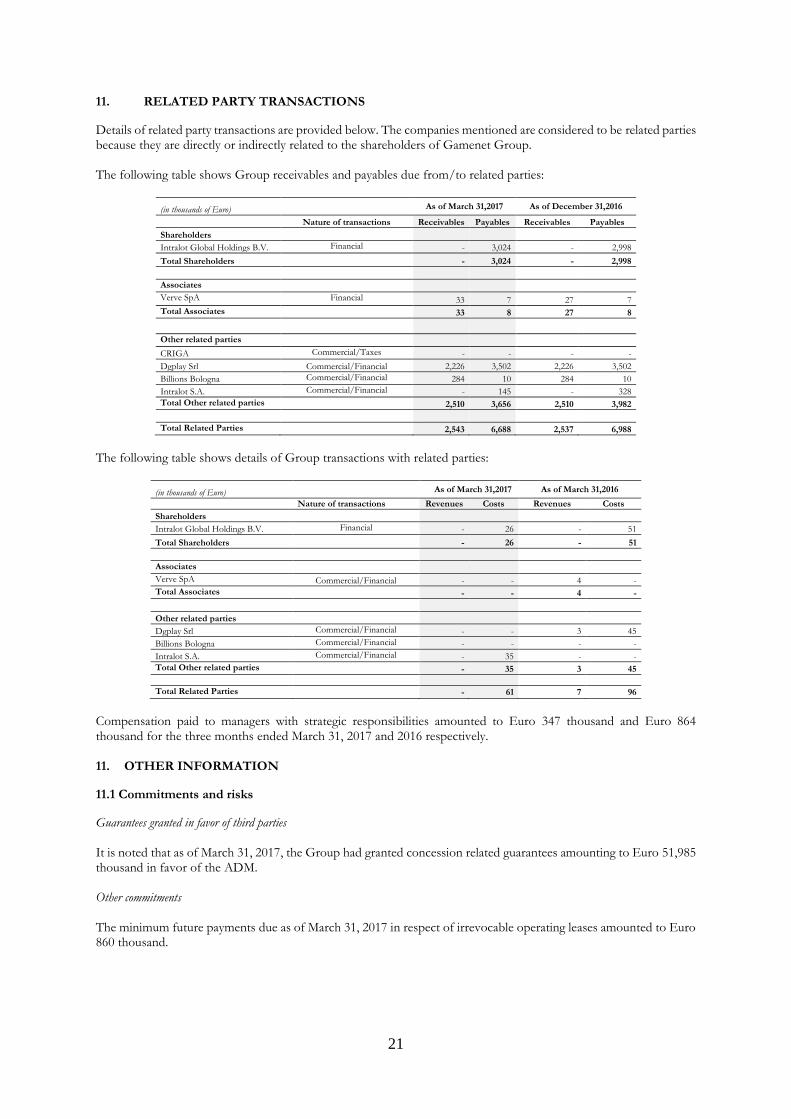
21
11. RELATED PARTY TRANSACTIONS
Details of related party transactions are provided below. The companies mentioned are considered to be related parties because they are directly or indirectly related to the shareholders of Gamenet Group. The following table shows Group receivables and payables due from/to related parties:
(in thousands of Euro) As of March 31,2017 As of December 31,2016
Nature of transactions Receivables Payables Receivables Payables
Shareholders
Intralot Global Holdings B.V. Financial - 3,024 - 2,998
Total Shareholders - 3,024 - 2,998
Associates
Verve SpA Financial 33 7 27 7
Total Associates 33 8 27 8
Other related parties
CRIGA Commercial/Taxes - - - -
Dgplay Srl Commercial/Financial 2,226 3,502 2,226 3,502
Billions Bologna Commercial/Financial 284 10 284 10
Intralot S.A. Commercial/Financial - 145 - 328
Total Other related parties 2,510 3,656 2,510 3,982
Total Related Parties 2,543 6,688 2,537 6,988
The following table shows details of Group transactions with related parties:
(in thousands of Euro) As of March 31,2017 As of March 31,2016
Nature of transactions Revenues Costs Revenues Costs
Shareholders
Intralot Global Holdings B.V. Financial - 26 - 51
Total Shareholders - 26 - 51
Associates
Verve SpA Commercial/Financial - - 4 -
Total Associates - - 4 -
Other related parties
Dgplay Srl Commercial/Financial - - 3 45
Billions Bologna Commercial/Financial - - - -
Intralot S.A. Commercial/Financial - 35 - -
Total Other related parties - 35 3 45
Total Related Parties
- 61 7 96
Compensation paid to managers with strategic responsibilities amounted to Euro 347 thousand and Euro 864 thousand for the three months ended March 31, 2017 and 2016 respectively. 11. OTHER INFORMATION
11.1 Commitments and risks
Guarantees granted in favor of third parties It is noted that as of March 31, 2017, the Group had granted concession related guarantees amounting to Euro 51,985 thousand in favor of the ADM. Other commitments The minimum future payments due as of March 31, 2017 in respect of irrevocable operating leases amounted to Euro 860 thousand.
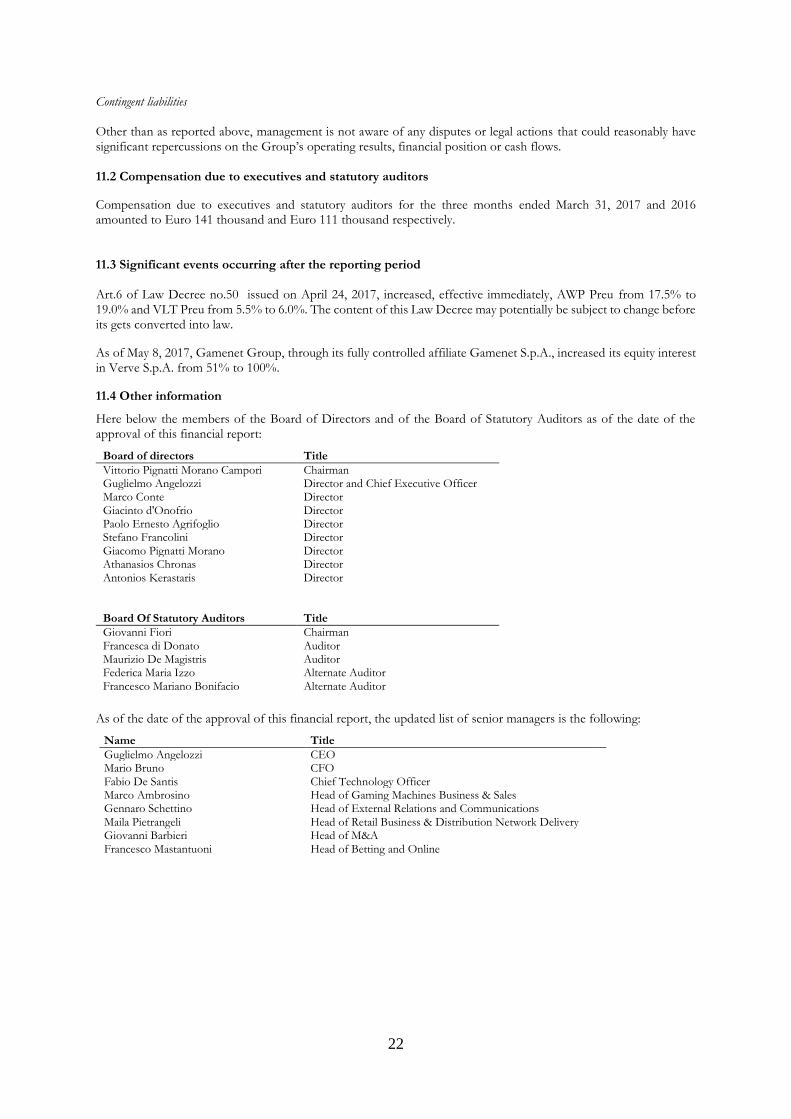
22
Contingent liabilities Other than as reported above, management is not aware of any disputes or legal actions that could reasonably have significant repercussions on the Group’s operating results, financial position or cash flows. 11.2 Compensation due to executives and statutory auditors
Compensation due to executives and statutory auditors for the three months ended March 31, 2017 and 2016 amounted to Euro 141 thousand and Euro 111 thousand respectively. 11.3 Significant events occurring after the reporting period Art.6 of Law Decree no.50 issued on April 24, 2017, increased, effective immediately, AWP Preu from 17.5% to 19.0% and VLT Preu from 5.5% to 6.0%. The content of this Law Decree may potentially be subject to change before its gets converted into law.
As of May 8, 2017, Gamenet Group, through its fully controlled affiliate Gamenet S.p.A., increased its equity interest in Verve S.p.A. from 51% to 100%.
11.4 Other information
Here below the members of the Board of Directors and of the Board of Statutory Auditors as of the date of the approval of this financial report:
Board of directors Title
Vittorio Pignatti Morano Campori Chairman Guglielmo Angelozzi Director and Chief Executive Officer Marco Conte Director Giacinto d'Onofrio Director Paolo Ernesto Agrifoglio Director Stefano Francolini Director Giacomo Pignatti Morano Director Athanasios Chronas Director Antonios Kerastaris Director Board Of Statutory Auditors Title
Giovanni Fiori Chairman Francesca di Donato Auditor Maurizio De Magistris Auditor Federica Maria Izzo Alternate Auditor Francesco Mariano Bonifacio Alternate Auditor
As of the date of the approval of this financial report, the updated list of senior managers is the following:
Name Title
Guglielmo Angelozzi CEO Mario Bruno CFO Fabio De Santis Chief Technology Officer Marco Ambrosino Head of Gaming Machines Business & Sales Gennaro Schettino Head of External Relations and Communications Maila Pietrangeli Head of Retail Business & Distribution Network Delivery Giovanni Barbieri Head of M&A Francesco Mastantuoni Head of Betting and Online
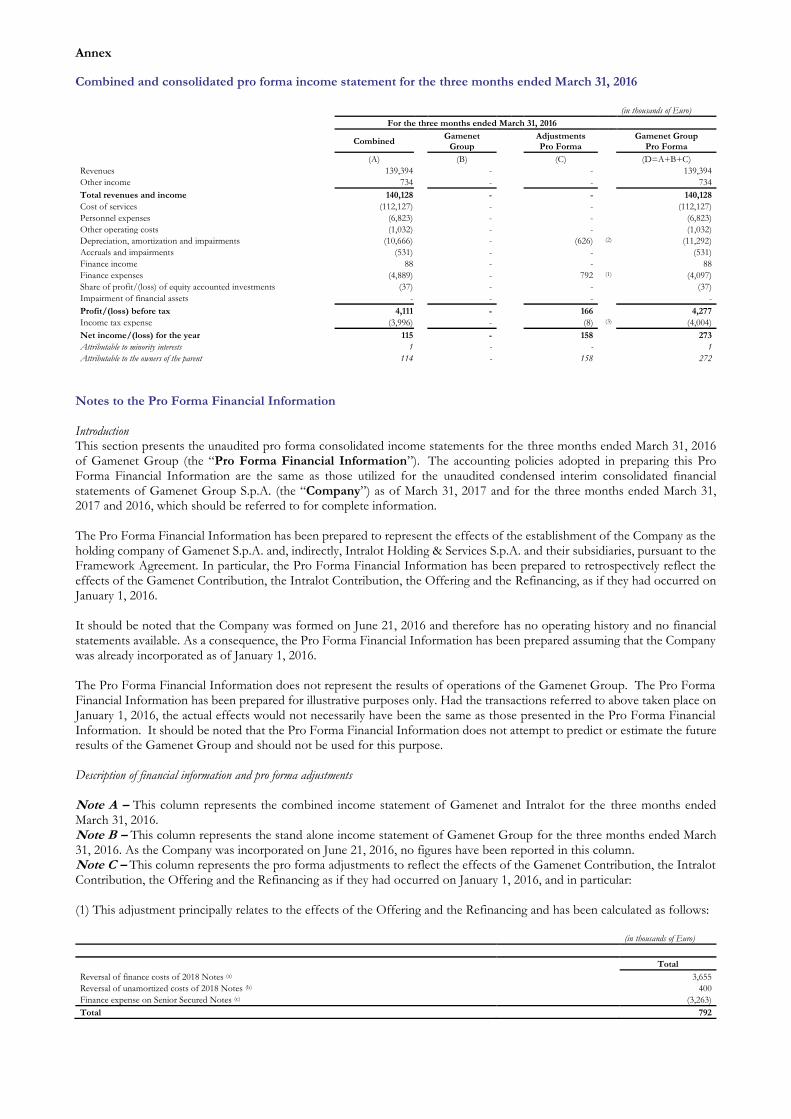
Annex
Combined and consolidated pro forma income statement for the three months ended March 31, 2016
(in thousands of Euro) For the three months ended March 31, 2016
Combined Gamenet Group
Adjustments Pro Forma
Gamenet Group Pro Forma
(A) (B) (C) (D=A+B+C)
Revenues 139,394 - - 139,394
Other income 734 - - 734
Total revenues and income 140,128 - - 140,128
Cost of services (112,127) - - (112,127)
Personnel expenses (6,823) - - (6,823)
Other operating costs (1,032) - - (1,032)
Depreciation, amortization and impairments (10,666) - (626) (2) (11,292)
Accruals and impairments (531) - - (531)
Finance income 88 - - 88
Finance expenses (4,889) - 792 (1) (4,097)
Share of profit/(loss) of equity accounted investments (37) - - (37)
Impairment of financial assets - - - -
Profit/(loss) before tax 4,111 - 166 4,277
Income tax expense (3,996) - (8) (3) (4,004)
Net income/(loss) for the year 115 - 158 273
Attributable to minority interests 1 - - 1
Attributable to the owners of the parent 114 - 158 272
Notes to the Pro Forma Financial Information Introduction This section presents the unaudited pro forma consolidated income statements for the three months ended March 31, 2016 of Gamenet Group (the “Pro Forma Financial Information”). The accounting policies adopted in preparing this Pro Forma Financial Information are the same as those utilized for the unaudited condensed interim consolidated financial statements of Gamenet Group S.p.A. (the “Company”) as of March 31, 2017 and for the three months ended March 31, 2017 and 2016, which should be referred to for complete information. The Pro Forma Financial Information has been prepared to represent the effects of the establishment of the Company as the holding company of Gamenet S.p.A. and, indirectly, Intralot Holding & Services S.p.A. and their subsidiaries, pursuant to the Framework Agreement. In particular, the Pro Forma Financial Information has been prepared to retrospectively reflect the effects of the Gamenet Contribution, the Intralot Contribution, the Offering and the Refinancing, as if they had occurred on January 1, 2016. It should be noted that the Company was formed on June 21, 2016 and therefore has no operating history and no financial statements available. As a consequence, the Pro Forma Financial Information has been prepared assuming that the Company was already incorporated as of January 1, 2016. The Pro Forma Financial Information does not represent the results of operations of the Gamenet Group. The Pro Forma Financial Information has been prepared for illustrative purposes only. Had the transactions referred to above taken place on January 1, 2016, the actual effects would not necessarily have been the same as those presented in the Pro Forma Financial Information. It should be noted that the Pro Forma Financial Information does not attempt to predict or estimate the future results of the Gamenet Group and should not be used for this purpose. Description of financial information and pro forma adjustments Note A – This column represents the combined income statement of Gamenet and Intralot for the three months ended March 31, 2016. Note B – This column represents the stand alone income statement of Gamenet Group for the three months ended March 31, 2016. As the Company was incorporated on June 21, 2016, no figures have been reported in this column. Note C – This column represents the pro forma adjustments to reflect the effects of the Gamenet Contribution, the Intralot Contribution, the Offering and the Refinancing as if they had occurred on January 1, 2016, and in particular: (1) This adjustment principally relates to the effects of the Offering and the Refinancing and has been calculated as follows:
(in thousands of Euro)
Total
Reversal of finance costs of 2018 Notes (a) 3,655
Reversal of unamortized costs of 2018 Notes (b) 400
Finance expense on Senior Secured Notes (c) (3,263)
Total 792

Annex (a) Relates to the elimination of the finance expenses recorded by Gamenet in the income statement for the three months ended March 31, 2016 on the 2018 Notes. (b) Relates to the unamortized cost recorded by Gamenet in the income statement for the three months ended March 31, 2016 on the 2018 Notes. (c) Relates to the finance costs related to the Senior Secured Notes for the three months ended March 31, 2016 assuming that the issuance had taken place on January 1, 2016.
(2) This adjustment includes the amortization of intangible assets arising from the Purchase Price Allocation process. (3) This adjustment reflects the related tax effect of the pro forma income statement adjustments.