ultrasound contrast imaging - aapm.org · pdf filecolor doppler w/o contrast pulse inversion...
TRANSCRIPT

1
Bruce, Averkiou—AAPM 2004 1
Ultrasound Contrast Imaging
Matthew BruceMike Averkiou
Tony Brock-FisherPatrick RafterJeff Powers
Philips Ultrasound, Bothell, WA, USA
Bruce, Averkiou—AAPM 2004 2
Outline
• History and background
• Basics of Ultrasound Contrast Imaging
• Application to liver lesion characterization
• Quantification
• Upcoming applications
Bruce, Averkiou—AAPM 2004 3
Ultrasound Contrast Agents
• Microbubbles– Heavy Gas/Air Mixture
• PFC, SF6
– Encapsulated• Shell ~ lipid, Albumin, polymer
– Diameters 2-10 µm
• Administered– Intravenous Injection
• Removed– Dissolve in circulation– Filtered by liver– Cleared ~ 15 minutes
Contrast and Red Blood Cells
Bruce, Averkiou—AAPM 2004 4
Blood Flow Imaging with Ultrasound
Color Dopplerw/o contrast
Pulse Inversion with contrast
HemangiomaSpleen
lesion
2
Bruce, Averkiou—AAPM 2004 5
History of Ultrasound Contrast Agents
• First of microbubbles - Agitated Saline
• Search for stabilization and passage through lungs led to:
– Shelled agents (galactose, albumin, lipid …)
– With Heavy gases (PFC ..)
Bruce, Averkiou—AAPM 2004 6
Clinical Applications of Ultrasound Contrast
• LVO – Left Ventricular Opacification
• Liver tumor detection and characterization
• Myocardial perfusion
• Kidney (transplants), breast, prostate, etc.
• Stroke
• Research for targeted/molecular imaging
– Combined with drug delivery
• Therapy guidance
– RFA
– Biopsy
• Mouse imaging
Bruce, Averkiou—AAPM 2004 7
Contrast Agent Status
YesYesYesYesNoLevovist*
NoNoLVO LVOLVOOptison †
NoNoNoNoPending for MCE
Point Bio
NoIn trialsYes+YesPendingDefinity +
In trialsYESYesPendingIn trialsSonoVue $
JapanChinaEuropeCanadaUSA
$ SonoVue approved for macro / micro flow in heart, liver, renal
* Levovist available in 69 countries, including Latin America and Asia
+ Limited to UK, pending other European countries (LVO and GI)
† Optison and Definity approved for Cardiology applications (LVO) in USA, Canada and Europe. Use in General Imaging requires “off-label” research agreement and IRB.
Bruce, Averkiou—AAPM 2004 8
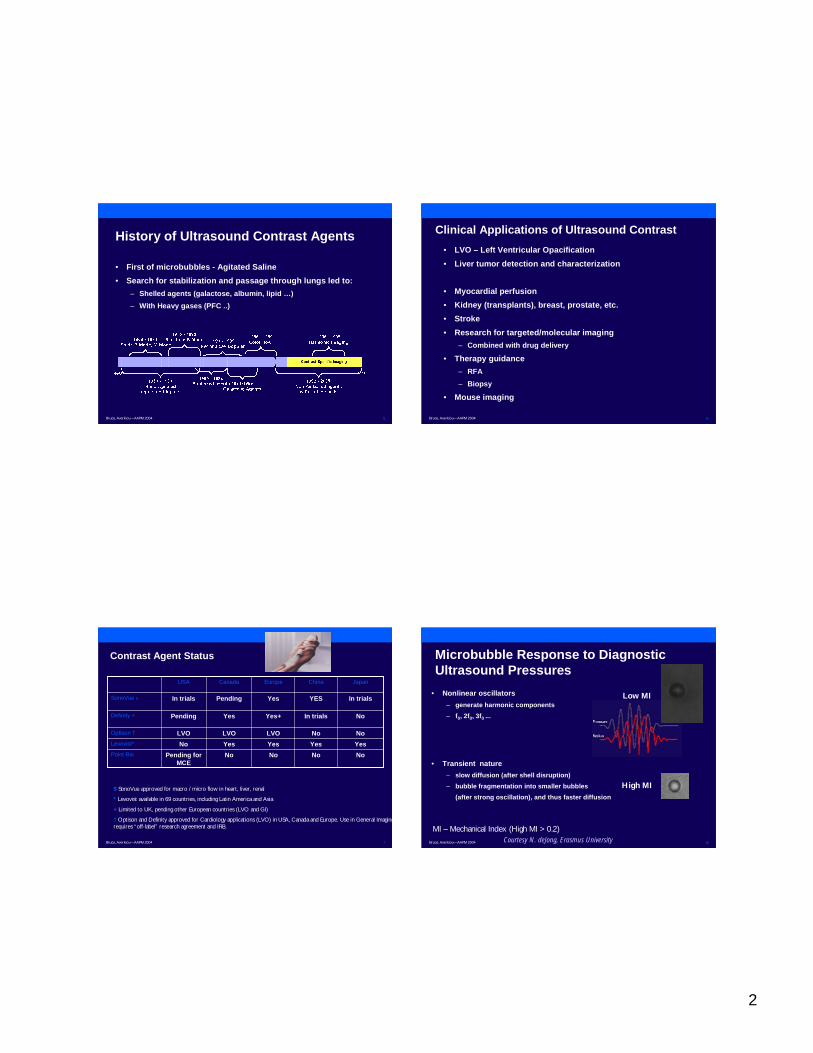
• Nonlinear oscillators
– generate harmonic components
– f0, 2f0, 3f0 ...
• Transient nature
– slow diffusion (after shell disruption)
– bubble fragmentation into smaller bubbles
(after strong oscillation), and thus faster diffusion
Microbubble Response to Diagnostic Ultrasound Pressures
High MI
Low MI
Courtesy N. deJong, Erasmus UniversityMI – Mechanical Index (High MI > 0.2)

3
Bruce, Averkiou—AAPM 2004 9
Contrast Imaging Techniques
Bruce, Averkiou—AAPM 2004 10
Harmonic Imaging
• Designed to extract nonlinear portion of returned signal
• Improved contrast to tissue ratio• Single pulse techniques filter out
fundamental on receive, but this limits the available bandwidth
• Triggered at High MI – Intermittent image acquisitions
• Led to Tissue Harmonic Imaging
Scanhead / beamformerfrequency response
Transmitfrequency Receive
frequency
ffo 2fo
Am
plit
ude
FundamentalImaging
1995 HarmonicImaging
Contrast in ventricle
Bruce, Averkiou—AAPM 2004 11
Harmonic Power Doppler
MI=1.1trig. 1:4
Optison TissueDopplerSignal
BubbleDopplerSignal
RFSpectrum
Higher MI More decorrelated Doppler signals
• Decorrelated Doppler signals – Due to microbubble disruption (pulse to pulse)
– High Frequency Doppler signals
• Triggered at High MI
– Intermittent image acquisitions
– End systole10 2 3 4 5 6
-40
-20
0 RF Spectrum (dB) vs F (MHz)
1 2 3 4 5 6 7 81000
2000
3000
Tissue Doppler Signal
1 2 3 4 5 6 7 8-8000
-4000
0
4000
8000Bubble Doppler Signal
Bruce, Averkiou—AAPM 2004 12
High MI Imaging
• Has highest SNRs
• Majority of microbubbles destroyed MI>0.4– At real time frame rates (>10 Hz)
• Limited visualization times– Destroy agent being imaged.
– CV – ECG triggered imaging while skipping heart cycles
– GI - Sweep through volume of interest or watch veil as agent is destroyed
4
Bruce, Averkiou—AAPM 2004 13
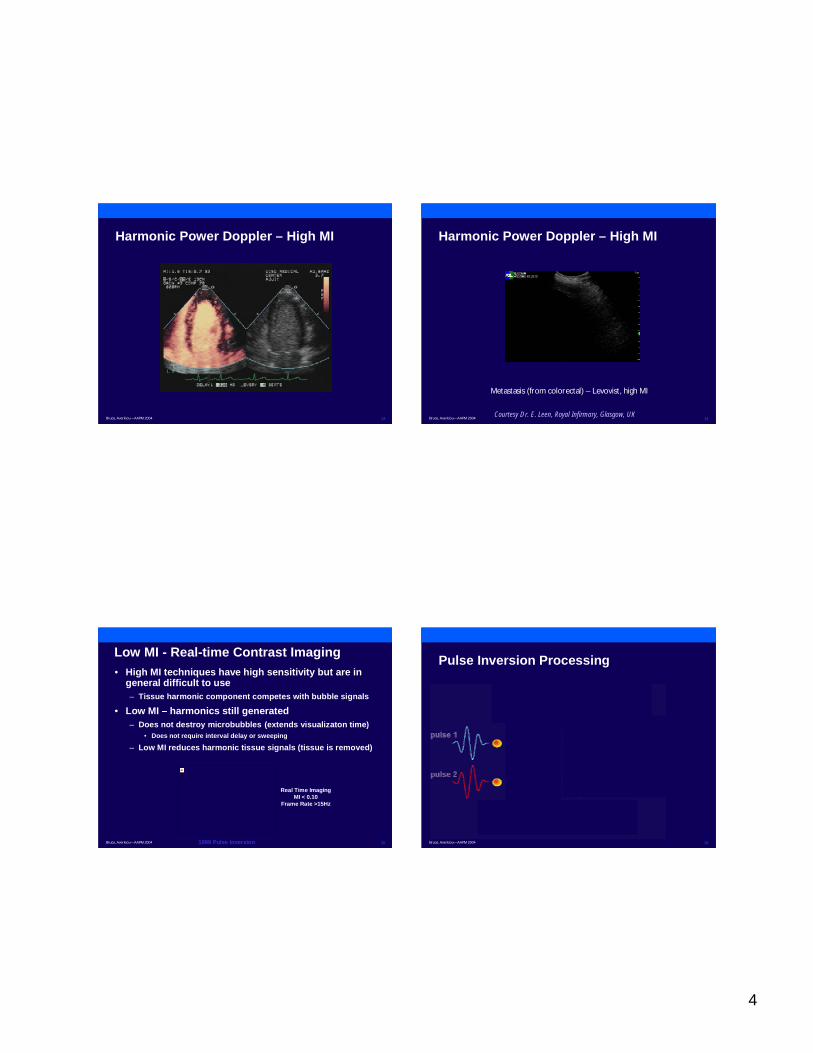
Harmonic Power Doppler – High MI
Bruce, Averkiou—AAPM 2004 14
Metastasis (from colorectal) – Levovist, high MI
Courtesy Dr. E. Leen, Royal Infirmary, Glasgow, UK
Harmonic Power Doppler – High MI
Bruce, Averkiou—AAPM 2004 15
Low MI - Real-time Contrast Imaging• High MI techniques have high sensitivity but are in
general difficult to use– Tissue harmonic component competes with bubble signals
• Low MI – harmonics still generated– Does not destroy microbubbles (extends visualizaton time)
• Does not require interval delay or sweeping
– Low MI reduces harmonic tissue signals (tissue is removed)
1999 Pulse Inversion
Real Time ImagingMI < 0.10
Frame Rate >15Hz
Bruce, Averkiou—AAPM 2004 16
Pulse Inversion Processing

5
Bruce, Averkiou—AAPM 2004 17
∑∞
=1
)(m
mm tpa
NonlinearSystemtj oe ω
)( 2T
o tje +ω
�++++++++++++ tjtjtj ooo eaeaea ωωωωωωωωωωωω 33
221
�+++ tjjtjjtjj ooo eeaeeaeea ωωωωππππωωωωππππωωωωππππ 333
2221
Even Harmonics
Pulse 1
Pulse 2
where To
ππππωωωω 2====
Input Output
Doppler Freq
-40
-20
0
π/2π/2π/2π/2 ππππ
Gai
n (d
B) a1
a3
a2
a4
Phase of the Harmonic Components of Pulse Inversion
�++++−−−−++++++++−−−− tjtjtj ooo eaeaea ωωωωωωωωωωωω 33
221 )1(1)1(
Bruce, Averkiou—AAPM 2004 18
xmit: (0.5, 1)rcv: (2, -1)
Power (Amplitude) Modulation
Bruce, Averkiou—AAPM 2004 19
Clinical Example – Low MICarotid
Bruce, Averkiou—AAPM 2004 20
Clinical Examples – Low MI FNH

6
Bruce, Averkiou—AAPM 2004 21
Clinical Examples Liver hemangioma
Bruce, Averkiou—AAPM 2004 22
Liver Lesion CharacterizationUltrasound Contrast Agents
Bruce, Averkiou—AAPM 2004 23
Contrast Quantification
• Contrast destruction provides method for perfusion quantification
• Destroy contrast with high MI frame
• Replenishment rate gives indication of microvascular flow rate
Bruce, Averkiou—AAPM 2004 24
Flash Contrast Imaging

7
Bruce, Averkiou—AAPM 2004 25
Parametric Example
Stenosis 1
Stenosis 2
Bruce, Averkiou—AAPM 2004 26
MicroVascular Imaging
• Some lesions have very low flow rates– bubbles can be seen in real-time, but not enough for good
vessel conspicuity
– Hold on to bubble signals as they traverse vasculature• Trace out resulting small-low velocity vessels
Bruce, Averkiou—AAPM 2004 27
MVI Rat Kidney
Bruce, Averkiou—AAPM 2004 28
Mouse Heart Imaging
8
Bruce, Averkiou—AAPM 2004 29
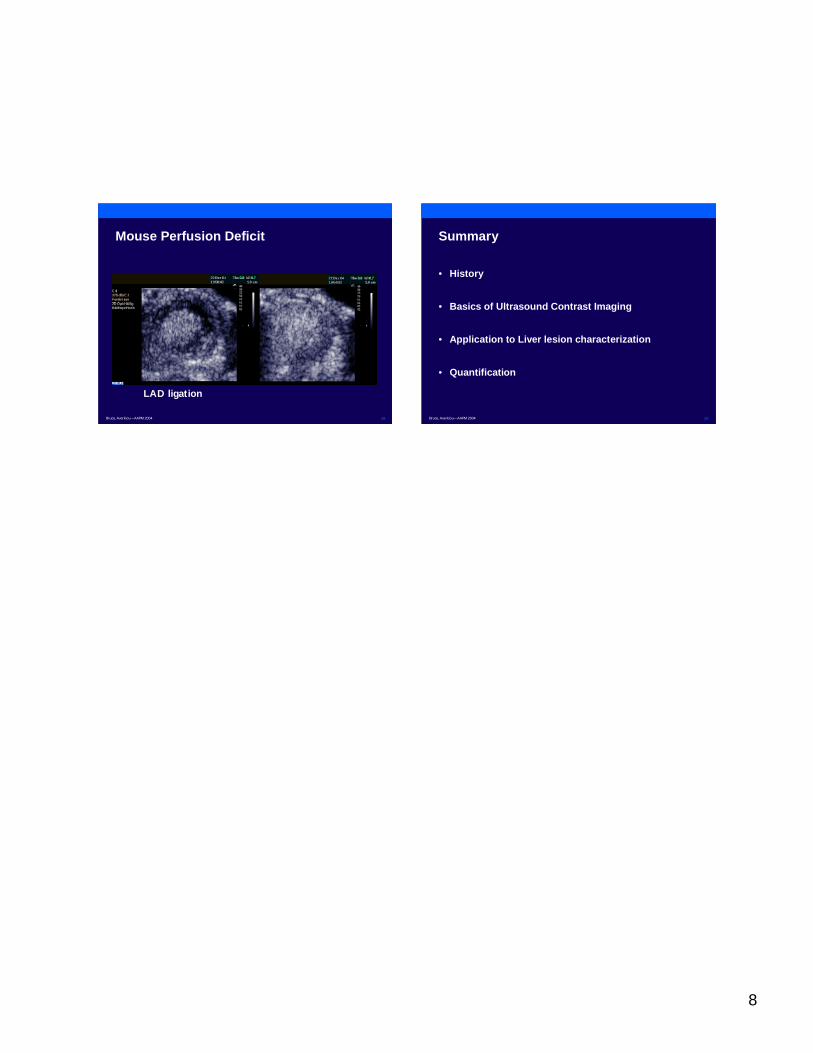
Mouse Perfusion Deficit
LAD ligation
Bruce, Averkiou—AAPM 2004 30
Summary
• History
• Basics of Ultrasound Contrast Imaging
• Application to Liver lesion characterization
• Quantification