ultrasound-based relative elastic modulus imaging for ... · ultrasound-based relative elastic...
TRANSCRIPT
Ultrasound-based relative elastic modulus imaging for visualizing thermal ablation zones in a
porcine model
This article has been downloaded from IOPscience. Please scroll down to see the full text article.
2010 Phys. Med. Biol. 55 2281
(http://iopscience.iop.org/0031-9155/55/8/011)
Download details:
IP Address: 128.104.2.244
The article was downloaded on 15/07/2010 at 21:04
Please note that terms and conditions apply.
View the table of contents for this issue, or go to the journal homepage for more
Home Search Collections Journals About Contact us My IOPscience
IOP PUBLISHING PHYSICS IN MEDICINE AND BIOLOGY
Phys. Med. Biol. 55 (2010) 2281–2306 doi:10.1088/0031-9155/55/8/011
Ultrasound-based relative elastic modulus imaging forvisualizing thermal ablation zones in a porcine model
Jingfeng Jiang1,6, Chris Brace1,2,3, Anita Andreano2,5,Ryan J DeWall1,3, Nick Rubert1, Ted G Fisher1, Tomy Varghese1,3,4,Fred Lee Jr2 and Timothy J Hall1
1 Department of Medical Physics, University of Wisconsin-Madison, WIMR-1005,1111 Highland Ave., Madison, WI 53705, USA2 Department of Radiology, University of Wisconsin-Madison, Madison, WI 53792, USA3 Department of Biomedical Engineering, University of Wisconsin-Madison, Madison,WI 53706, USA4 Department of Electrical and Computer Engineering, University of Wisconsin-Madison,Madison, WI 53706, USA5 Department of Radiology, University of Milan-Bicoca, Milan, Italy
E-mail: [email protected]
Received 9 October 2009, in final form 24 February 2010Published 30 March 2010Online at stacks.iop.org/PMB/55/2281
AbstractThe feasibility of using ultrasound-based elastic modulus imaging to visualizethermal ablation zones in an in vivo porcine model is reported. Elasticmodulus images of soft tissues are estimated as an inverse optimizationproblem. Ultrasonically measured displacement data are utilized as inputsto determine an elastic modulus distribution that provides the best match tothis displacement field. A total of 14 in vivo thermal ablation zones wereinvestigated in this study. To determine the accuracy of delineation of eachthermal ablation zone using elastic modulus imaging, the dimensions (lengthsof long and short axes) and the area of each thermal ablation zone obtained froman elastic modulus image were compared to the corresponding gross pathologyphotograph of the same ablation zone. Comparison of elastic modulus imagingmeasurements and gross pathology measurements showed high correlationwith respect to the area of thermal ablation zones (Pearson coefficient = 0.950and p < 0.0001). The radiological–pathological correlation was slightly lower(correlation = 0.853, p < 0.0001) for strain imaging among these 14 in vivoablation zones. We also found that, on average, elastic modulus imagingcan more accurately depict thermal ablation zones, when compared to strainimaging (14.7% versus 22.3% absolute percent error in area measurements,respectively). Furthermore, elastic modulus imaging also provides higher(more than a factor of 2) contrast-to-noise ratios for evaluating these thermalablation zones than those on corresponding strain images, thereby reducing
6 Author to whom any correspondence should be addressed.
0031-9155/10/082281+26$30.00 © 2010 Institute of Physics and Engineering in Medicine Printed in the UK 2281
2282 J Jiang et al
inter-observer variability. Our preliminary results suggest that elastic modulusimaging might potentially enhance the ability to visualize thermal ablationzones, thereby improving assessment of ablative therapies.
S Online supplementary data available from stacks.iop.org/PMB/55/2281/mmedia
(Some figures in this article are in colour only in the electronic version)
1. Introduction
Image-guided radiofrequency (RF) and microwave (MW) ablation are increasingly used totreat primary and some metastatic tumors in the liver (Sato et al 1996, Lencioni et al 2005, Luet al 2005, Liang et al 2005). In recent reports, excellent outcomes of treating renal tumorsusing RF and MW ablation techniques were also achieved by several groups (Gervais et al2000, 2005, Zagoria et al 2007, Laeseke et al 2007). The clinical potential of these techniquesfor treatment of neoplasms at other sites, including breast (Jeffrey et al 1999), bone (Rosenthalet al 1998, Callstrom et al 2006) and lung (Nguyen et al 2005, Wolf et al 2008, White andD’Amico 2008), has also been reported. While thermal ablation can be an effective cancertreatment tool, the lack of a reliable imaging modality to monitor progression of ablationtreatment is still a significant problem (Gazelle et al 2000, Solbiati et al 1997, Goldberg et al2000, Montgomery et al 2004). To eradicate the entire tumor mass, thermal ablation mustensure delivery of a lethal thermal dose to the whole tumor and an ablative margin, whileminimizing heat damage to vulnerable areas (e.g. bowel, stomach, gall bladder, bile ductsand the renal cortex). Unfortunately, because of a lack of adequate imaging-based treatmentmonitoring options, undertreated portions of the tumor often go undetected until follow-up.Accordingly, a rapid feedback imaging technique would be useful for the real-time or nearreal-time evaluation of the ablation zone to help reduce the number of local recurrences andsubsequent re-treatment sessions after thermal tumor ablation.
In many centers, the insertion of the RF/MW applicator is usually done under ultrasoundguidance since it offers a fast and effective real-time method of guidance. Unfortunately,attempts to monitor ablation with conventional B-mode ultrasound have been largelyunsuccessful. Hyperechoic areas caused by micro-bubbles and gas formed during tissueheating have been used as a surrogate for the ablation zone but do not correlate well withthe actual ablation zone (Bush et al 1993). In addition, these hyperechoic areas graduallydisappear within 30 min after ablation, making post-treatment evaluation difficult. Contrast-enhanced ultrasound (CEUS) has been shown to be of benefit (Solbiati et al 2004) but is notapproved for use in all countries. CEUS is also plagued by a relatively short cycle time inthe livers and kidneys. In addition, to monitor an ablation procedure, micro-bubble contrastagents must thereafter be continuously injected throughout the treatment.
X-ray computed tomography (CT) can predict the coagulation zone with a precision of2–3 mm (Goldberg et al 2000). However, the use of CT or contrast-enhanced CT (Dupuy andGoldberg 2001) is limited by the amount of contrast agent that can be injected (due to possiblerenal failure) and concerns regarding the radiation dose to both the patient and the physician.Magnetic resonance imaging (MRI) can be utilized for imaging the ablation zone in severalways (Goldberg et al 1998, Weidensteiner et al 2003, Stern et al 2008, Pilatou et al 2009,Hyodoh et al 1998). However, there is limited availability of FDA-approved MRI-compatibleapplicators and a shortage of interventional MRI scanners (Carter et al 1998, Wacker et al2004).
Ultrasound-based relative elastic modulus imaging for evaluating ablation therapy 2283
During RF ablation, protein denaturation during heating results in an increase in theelastic modulus of tissue (Kiss et al 2004). Therefore, thermal ablation zones appear to bestiffer than surrounding untreated tissue and may be differentiated by new elasticity imagingmethods that directly estimate mechanical properties of soft tissue (Gao et al 1996, Greenleafet al 2003, Ophir et al 1999, Hall 2003). Several methods, including strain imaging (Vargheseet al 2002, Kallel et al 1999), sonoelastography (Zhang et al 2008) and acoustic radiationforce imaging (Fahey et al 2006), have demonstrated good correspondence between elasticityimaging findings and gross pathology features.
Our group, among others, has been developing quasi-static elasticity imaging methodsthat employ unmodified clinical equipment and examination techniques similar to standardclinical ultrasound examinations. With these methods, an ultrasound transducer is usedto acquire phase-sensitive ultrasound echo data (either radiofrequency (RF) or quadraturedata). Ultrasound echo signals are tracked as the anatomy is deformed to obtain local tissuedisplacement information. The displacement field is then used to calculate the component ofstrain along the direction of the acoustic beam (hereafter referred as to strain) to form a 2D/3Dstrain image. This strain image is interpreted as an image of the reciprocal of the shear orYoung’s modulus for the tissue (Ophir et al 1991). Unlike strain, Young’s or shear modulusis an intrinsic material property of the tissue being studied, thereby providing unambiguousinformation regarding tissue elasticity (Barbone and Bamber 2002). Considerable researchefforts have been directed to use the same displacement field to solve an inverse elasticityproblem to explicitly determine the spatial distribution of the elastic modulus of interest.While a few techniques (Kallel and Bertrand 1996, Zhu et al 2003, Doyley et al 2000,Oberai et al 2004) have been proposed, only few applications to date (Oberai et al 2009)have been applied to in vivo soft tissue. In this study, we will apply our relative elasticmodulus imaging (EMI) technique specifically designed for using ablation applicator-induceddeformation (Jiang et al 2009) in an in vivo porcine liver model.
Our objective is to evaluate the radiological–pathological correlation and accuracy of thistechnique in pre-clinical animal studies. In this paper, we compare the dimension and areameasurements of in vivo thermal ablation zones obtained using strain imaging and relativeEMI against the dimension and area measurements using corresponding gross-pathologyphotographs of the same thermal ablation zones. Furthermore, both a contrast-noise ratiometric (Song et al 2004) and inter-observer variability among three human observers of elasticmodulus and strain images are assessed to demonstrate that the EMI could become a potentiallyenhanced modality for visualizing thermal ablation zones.
2. Materials and methods
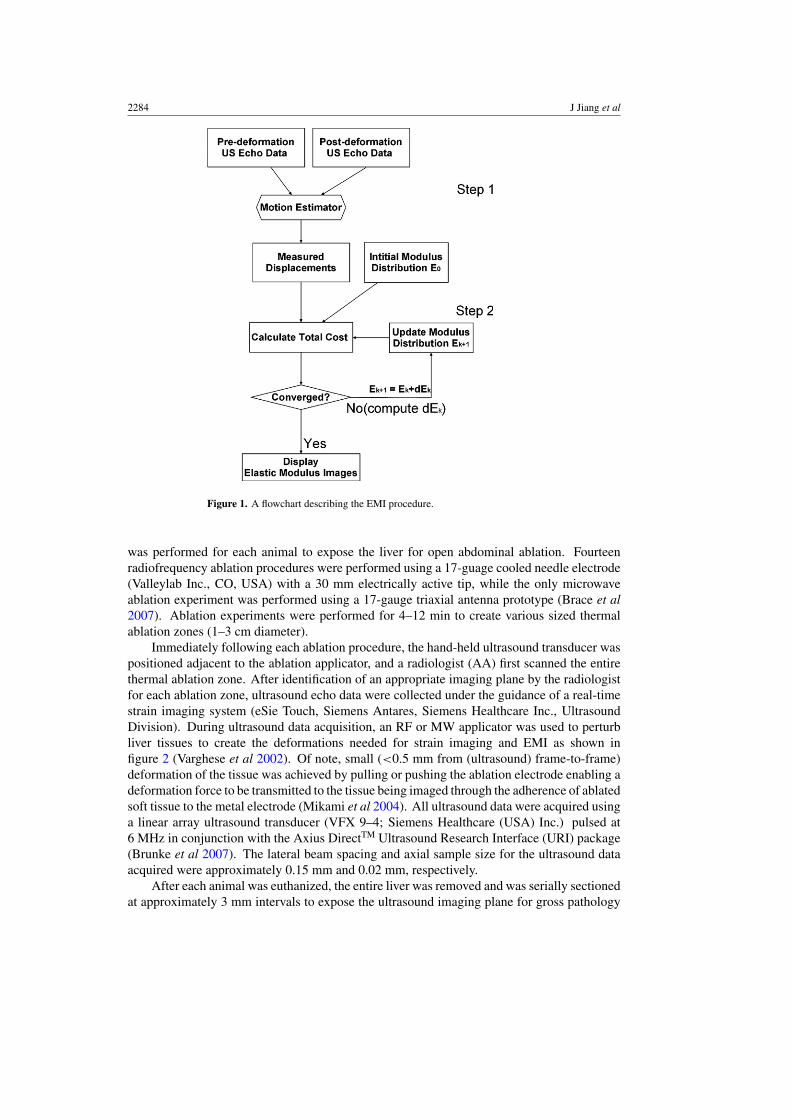
A brief description of the proposed EMI method including data acquisition and analysis isgiven in this section. Figure 1 shows a flowchart describing, in general, the proposed EMImethod used for data acquisition and processing.
2.1. Animal preparation and experiments
Following an institutionally approved animal protocol, a total of 15 ablation zoneswere created in vivo in five porcine animals with normal liver (radiofrequencyn = 14 and microwave n = 1). During open-abdomen ablation experiments, general anesthesiawas first induced with an intramuscular injection of teletamine and zolazepam (Telazol; FortDodge Laboratories, Fort Dodge, IA) and xylazine (Rompun; Bayer Corporation, ShawneeMission, KS) and was maintained with inhaled isoflurane 1–3%. Subsequently, laparotomy
2284 J Jiang et al
Figure 1. A flowchart describing the EMI procedure.
was performed for each animal to expose the liver for open abdominal ablation. Fourteenradiofrequency ablation procedures were performed using a 17-guage cooled needle electrode(Valleylab Inc., CO, USA) with a 30 mm electrically active tip, while the only microwaveablation experiment was performed using a 17-gauge triaxial antenna prototype (Brace et al2007). Ablation experiments were performed for 4–12 min to create various sized thermalablation zones (1–3 cm diameter).
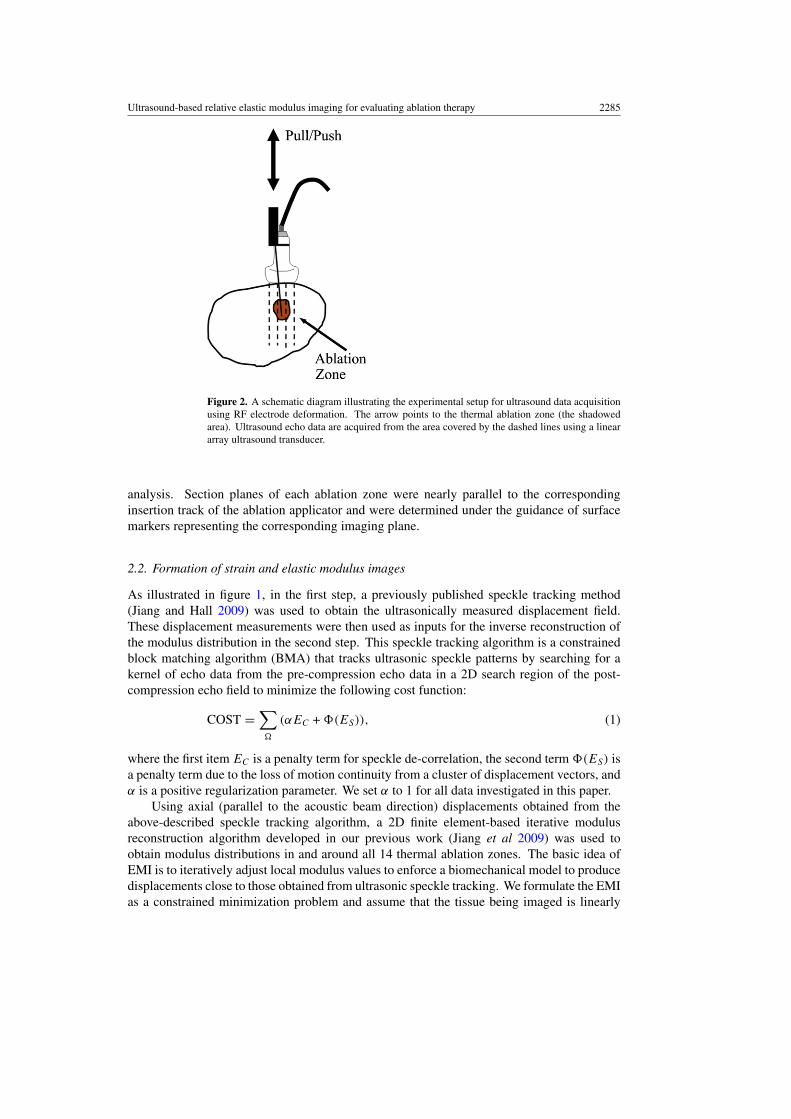
Immediately following each ablation procedure, the hand-held ultrasound transducer waspositioned adjacent to the ablation applicator, and a radiologist (AA) first scanned the entirethermal ablation zone. After identification of an appropriate imaging plane by the radiologistfor each ablation zone, ultrasound echo data were collected under the guidance of a real-timestrain imaging system (eSie Touch, Siemens Antares, Siemens Healthcare Inc., UltrasoundDivision). During ultrasound data acquisition, an RF or MW applicator was used to perturbliver tissues to create the deformations needed for strain imaging and EMI as shown infigure 2 (Varghese et al 2002). Of note, small (<0.5 mm from (ultrasound) frame-to-frame)deformation of the tissue was achieved by pulling or pushing the ablation electrode enabling adeformation force to be transmitted to the tissue being imaged through the adherence of ablatedsoft tissue to the metal electrode (Mikami et al 2004). All ultrasound data were acquired usinga linear array ultrasound transducer (VFX 9–4; Siemens Healthcare (USA) Inc.) pulsed at6 MHz in conjunction with the Axius DirectTM Ultrasound Research Interface (URI) package(Brunke et al 2007). The lateral beam spacing and axial sample size for the ultrasound dataacquired were approximately 0.15 mm and 0.02 mm, respectively.
After each animal was euthanized, the entire liver was removed and was serially sectionedat approximately 3 mm intervals to expose the ultrasound imaging plane for gross pathology
Ultrasound-based relative elastic modulus imaging for evaluating ablation therapy 2285
Figure 2. A schematic diagram illustrating the experimental setup for ultrasound data acquisitionusing RF electrode deformation. The arrow points to the thermal ablation zone (the shadowedarea). Ultrasound echo data are acquired from the area covered by the dashed lines using a lineararray ultrasound transducer.
analysis. Section planes of each ablation zone were nearly parallel to the correspondinginsertion track of the ablation applicator and were determined under the guidance of surfacemarkers representing the corresponding imaging plane.
2.2. Formation of strain and elastic modulus images
As illustrated in figure 1, in the first step, a previously published speckle tracking method(Jiang and Hall 2009) was used to obtain the ultrasonically measured displacement field.These displacement measurements were then used as inputs for the inverse reconstruction ofthe modulus distribution in the second step. This speckle tracking algorithm is a constrainedblock matching algorithm (BMA) that tracks ultrasonic speckle patterns by searching for akernel of echo data from the pre-compression echo data in a 2D search region of the post-compression echo field to minimize the following cost function:
COST =∑�
(αEC + �(ES)), (1)
where the first item EC is a penalty term for speckle de-correlation, the second term �(ES) isa penalty term due to the loss of motion continuity from a cluster of displacement vectors, andα is a positive regularization parameter. We set α to 1 for all data investigated in this paper.
Using axial (parallel to the acoustic beam direction) displacements obtained from theabove-described speckle tracking algorithm, a 2D finite element-based iterative modulusreconstruction algorithm developed in our previous work (Jiang et al 2009) was used toobtain modulus distributions in and around all 14 thermal ablation zones. The basic idea ofEMI is to iteratively adjust local modulus values to enforce a biomechanical model to producedisplacements close to those obtained from ultrasonic speckle tracking. We formulate the EMIas a constrained minimization problem and assume that the tissue being imaged is linearly
2286 J Jiang et al
elastic as a first approximation for small deformations (approximately 1.0% frame-to-frameaverage strain),
J (E) = arg min
{1
2‖T (E) − U‖2 + βV (E)
}, (2)
V (E) =∫
�
(√|∇E|2 + γ 2)
d�, (3)
subject to
Emin � E � Emax, (4)
where T (E) is the predicted axial displacement by a forward finite element simulation basedon the current estimated modulus distribution E and U is the estimated axial displacementusing the ultrasound-based speckle tracking algorithm described above. In equation (3), ∇is a gradient operator, |(x, y)| =
√x2 + y2 is the Euclidean norm and γ is a small positive
constant.To stabilize the solution of equation (2), regularization (Vogel 2002) is often used, and the
resulting solution is a tradeoff between fidelity to the measured displacement data (the first itemon the right-hand side of equation (2)) and bias due to the regularity of the solution constrainedthrough the regularization function (the second item on the right-hand side of equation (2)).In other words, regularization injects a priori knowledge to balance this tradeoff for a givensituation. In this sense, β is a positive parameter controlling the tradeoff between the fidelityand variability in E. In our experience, ablated tissues typically have a sharp transitionin tissue stiffness between the normal and the ablated regions, whereas the tissue stiffnesswithin both the normal and ablated regions gradually varies. Therefore, an edge-preservingregularization function V (E) is selected to enforce such a priori knowledge in the hope ofaccurately capturing boundaries of a thermal zone in the reconstructed modulus map. In thisstudy, β (equation (2)) and γ (equation (3)) were set to 5 × 10⁻⁷ and 0.1, respectively, forall data investigated. Detailed formulations to solve equations (2)–(4) can be found in ourprevious work (Jiang et al 2009).
2.3. Implementation of the EMI algorithm
To obtain a relative elastic modulus image, the basic procedures involved are summarized asfollows.
(1) Estimate displacement U from a region of interest (ROI; see the white box in figure 3(a))defined by a user.
(2) Identify the location of the ablation electrode in both axial displacement and B-modeimages. In the axial displacement image, pulling/pushing of the ablation electroderesults in a rigid-body motion, that is, relatively constant displacements within a smallregion (see the arrow in figure 3(c)). In the B-mode image, a metal electrode typicallyresults in reflection (see the arrow in figure 3(a)) shadowing below it. The locations of theablation electrode on displacement and B-mode images should be spatially consistent.
(3) Assume an initial uniform Young’s modulus distribution E. The displacements within theidentified electrode region and the displacements at the edges of the ROI will be enforcedas boundary conditions to solve the 2D FEA forward solution (i.e. T (E) in equation (2)).
(4) Compare these predicted displacements T (E) with the ultrasonically measureddisplacements U . Simultaneously, the assumed modulus distribution E is updated.Iterations between (3) and (4) continue until one criterion or all convergence criteria are
Ultrasound-based relative elastic modulus imaging for evaluating ablation therapy 2287
(a) (b)
(c) (d)
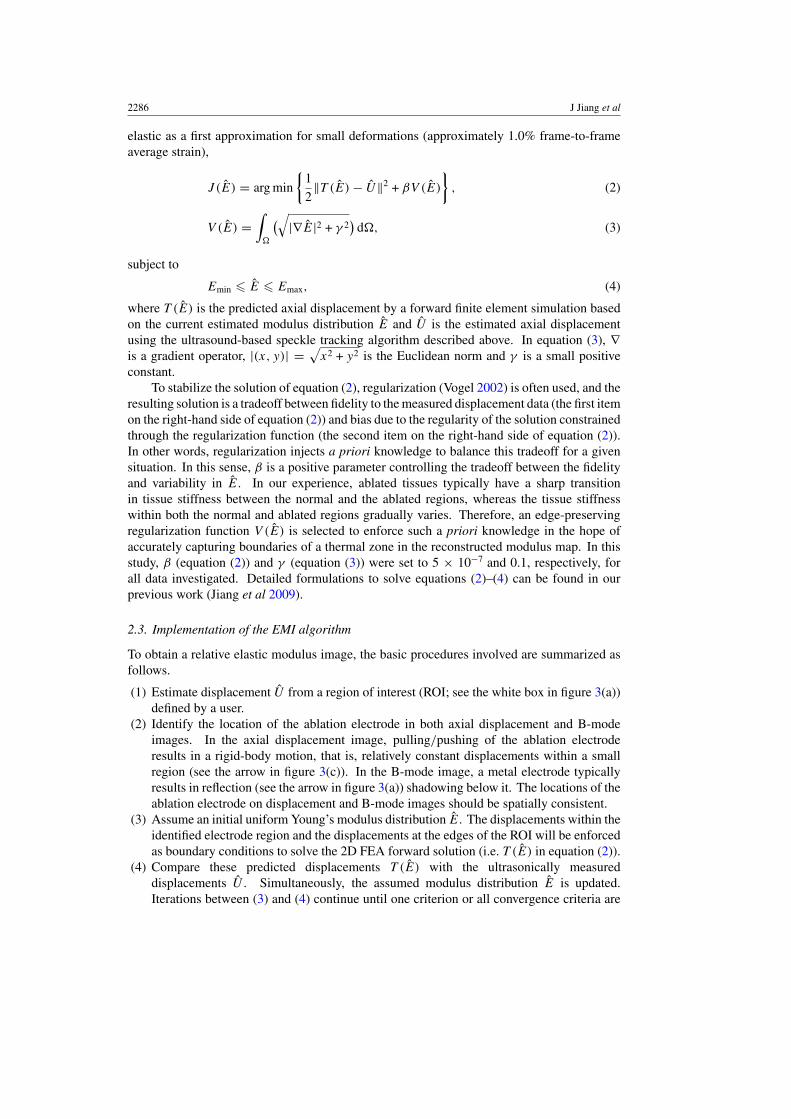
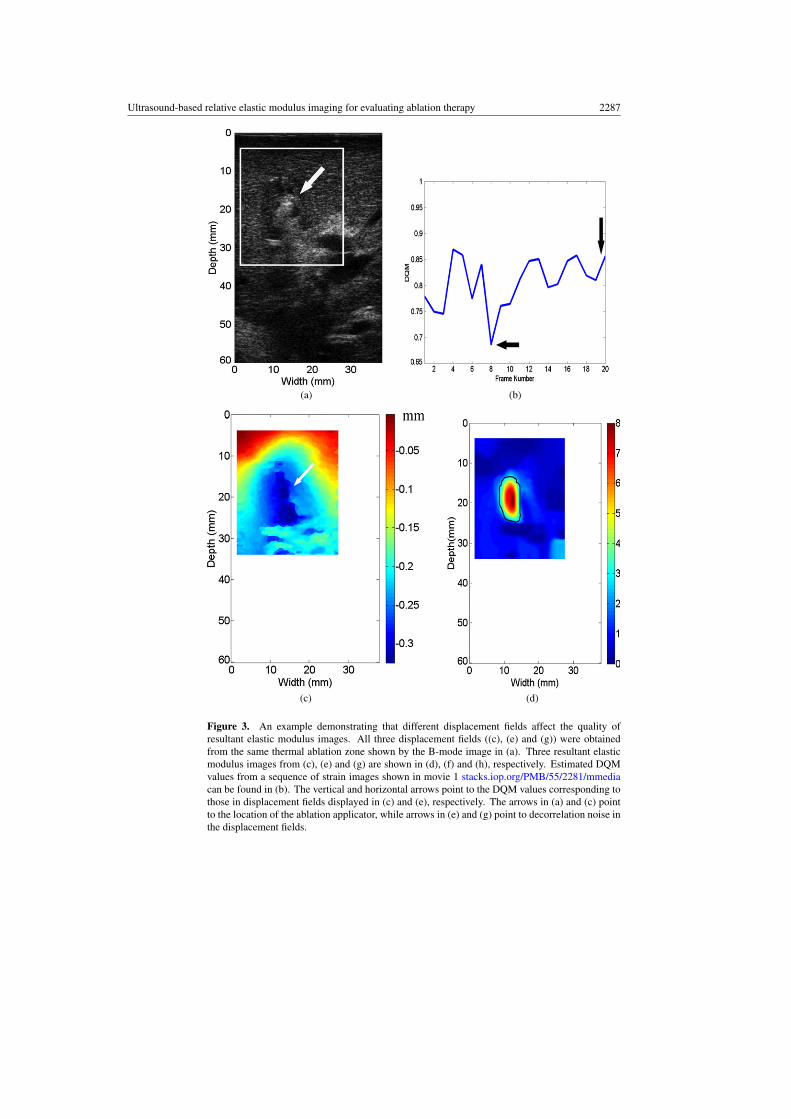
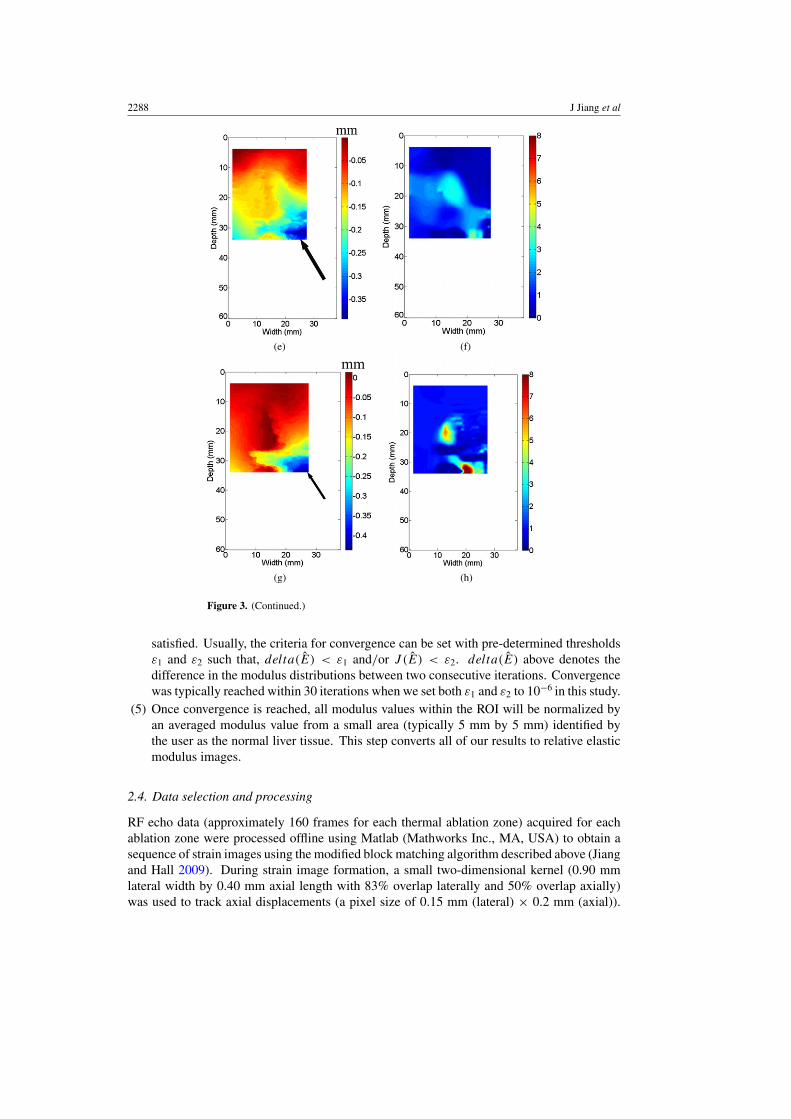
Figure 3. An example demonstrating that different displacement fields affect the quality ofresultant elastic modulus images. All three displacement fields ((c), (e) and (g)) were obtainedfrom the same thermal ablation zone shown by the B-mode image in (a). Three resultant elasticmodulus images from (c), (e) and (g) are shown in (d), (f) and (h), respectively. Estimated DQMvalues from a sequence of strain images shown in movie 1 stacks.iop.org/PMB/55/2281/mmediacan be found in (b). The vertical and horizontal arrows point to the DQM values corresponding tothose in displacement fields displayed in (c) and (e), respectively. The arrows in (a) and (c) pointto the location of the ablation applicator, while arrows in (e) and (g) point to decorrelation noise inthe displacement fields.
2288 J Jiang et al
(e) (f)
(g) (h)
Figure 3. (Continued.)
satisfied. Usually, the criteria for convergence can be set with pre-determined thresholdsε1 and ε2 such that, delta(E) < ε1 and/or J (E) < ε2. delta(E) above denotes thedifference in the modulus distributions between two consecutive iterations. Convergencewas typically reached within 30 iterations when we set both ε1 and ε2 to 10−6 in this study.
(5) Once convergence is reached, all modulus values within the ROI will be normalized byan averaged modulus value from a small area (typically 5 mm by 5 mm) identified bythe user as the normal liver tissue. This step converts all of our results to relative elasticmodulus images.
2.4. Data selection and processing
RF echo data (approximately 160 frames for each thermal ablation zone) acquired for eachablation zone were processed offline using Matlab (Mathworks Inc., MA, USA) to obtain asequence of strain images using the modified block matching algorithm described above (Jiangand Hall 2009). During strain image formation, a small two-dimensional kernel (0.90 mmlateral width by 0.40 mm axial length with 83% overlap laterally and 50% overlap axially)was used to track axial displacements (a pixel size of 0.15 mm (lateral) × 0.2 mm (axial)).
Ultrasound-based relative elastic modulus imaging for evaluating ablation therapy 2289
Then, axial strain images were obtained by fitting the local estimated axial displacement datato a line (i.e. linear regression) whose slope provides local strain at the center of this small(1.8 mm) segment of axial displacement estimates (Kallel and Ophir 1997).
A displacement quality metric (DQM; (Jiang et al 2006)) was calculated for eachdisplacement and strain image. The DQM is the product of the normalized cross-correlationcoefficient among the pre-deformation and motion-compensated post-deformation RF echofields (a measure of motion tracking accuracy applied to the entire region of interest) andthe normalized cross-correlation coefficient between two consecutive motion-compensatedstrain images (a measure of strain image consistency) (Jiang et al 2006). The DQM values liebetween 0 and 1, with 1 providing the best result. The DQM method is used for semi-automateddata selection as described below. Strain images are marked as ‘high’ quality only if at leastthree consecutive strain images possess DQM values greater than 0.75. One example of DQMestimates for 20 consecutive strain images estimated from a thermal ablation zone (see figure3(a)) is shown in figure 3(b). The corresponding 20 frames of strain images displayed sideby side with B-mode images can be found in movie 1 stacks.iop.org/PMB/55/2281/mmedia.If more than one ‘high’ quality strain image for a given thermal ablation zone exist, onedisplacement field (typically the displacement field whose corresponding strain image hadthe highest DQM value and least decorrelation noise as demonstrated in figure 3(c) below) isselected to reconstruct the corresponding elastic modulus image as described in sections 2.2and 2.3.
Due to computational limitations, the displacement fields selected for the modulusreconstruction (see the ROIs in figures 3(a) and (c)) were spatially decimated to accommodatea smaller finite element mesh (41 × 41). For all cases, the size of finite elements (witha modulus constant within a finite element) used for EMI was variable but approximately0.75 mm × 0.75 mm.
Three displacement images shown in figures 3(c), (e) and (g) all correspond to the samethermal ablation zone displayed in figure 3(a). Their DQM values are 0.85 (the 20th framein figure 3(b) and movie 1), 0.68 (the eighth frame in figure 3(b) and movie 1) and 0.42 (notin movie 1), stacks.iop.org/PMB/55/2281/mmedia, respectively. In two displacement images(figures 3(e) and (g)) with relatively low DQM values, relatively high noise can be observedas indicated by arrows at the lower right corner. Consequently, when we reconstructedelastic modulus images using these three displacement fields, the quality of elastic modulusimages was variable. In the case of the high quality displacement image (i.e. figure 3(c)), asingle coherent region where relative modulus values were elevated can be clearly seen fromfigure 3(d). However, the resultant elastic modulus images from two relatively low qualitydisplacement images could either contain considerable noise (figure 3(f)) or deviate from theexpected shape of the thermal ablation zone (figure 3(h)).
The image quality of the resultant strain and elastic modulus images was assessed by theweighted contrast-to-noise ratio (CNR) defined below (Song et al 2004):
CNR = |St − Sb|(wtσ
2t + wbσ
2b
)1/2 , (5)
where S and σ 2 denote means and variances of signals, and the subscripts b and t representthe background and target, respectively. w is a weighting of the area of the target and thebackground to the total area given by wx = areax/areatotal. The inclusion of the weighted areais necessary because the target and the background contribute in different amounts to the noiseestimates (Song et al 2004). It is worth noting that we converted all strain and elastic modulusimages to the same resolution (a pixel size of 0.2 mm by 0.2 mm) prior to the estimation ofCNR values and human segmentation of the ablation zones described below in section 2.5. To
2290 J Jiang et al
calculate the CNR using equation (5) for each elasticity (strain and modulus) image, we usedthe manually segmented thermal ablation zone (see an example given by figure 3(d)) and therest of the image as the target and the background, respectively.
2.5. Measurement of thermal ablation zones
Data from one RF ablation zone were excluded because the thermal ablation zone could notbe seen using any modalities including B-mode, strain imaging and EMI. Only data obtainedfrom the remaining 14 thermal ablation zones were processed and analyzed in this study.These 14 thermal ablation zones were manually delineated by three independent observerson strain and elastic modulus images, and corresponding pathology photographs usingImageJ (http://rsbweb.nih.gov/ij/). All three observers are ultrasound physicists/engineerswho actively perform research related to ultrasound-based elasticity imaging. To understandthe influence of color maps, both color and grayscale strain and elastic modulus images werepresented to human readers.
In the first step, all observers were given grayscale strain and elastic modulus images,together with the co-registered B-mode ultrasound images, in a random order and were askedto delineate the thermal lesion boundaries in B-mode, strain and elastic modulus images.All observers had knowledge of the approximate position of each thermal ablation zone bysimultaneously viewing the corresponding B-mode image. To look for sites of ablation zonesin ultrasound B-mode images, observers were instructed to examine echogenicity changes.Observers were also instructed to look for a smooth contour representing a sharp transition(i.e. a large gradient in image contrast) between the normal liver tissue and the ablated tissueon the strain and elastic modulus image. When boundaries of a thermal ablation zone werenot clearly defined on corresponding ultrasound B-mode, strain and elastic modulus images,observers were asked to complete their task by conservatively outlining a smooth contouraround the position of the ablation applicator (known from the corresponding B-mode image).
In the second step, all observers were given a set of color (color map ‘jet’ in MATLAB)strain and elastic modulus images, together with the co-registered B-mode ultrasound imagesin a different random order. These color strain and elastic modulus images were exactly thesame set of strain and elastic modulus images except the color map. Following the sameguidelines mentioned above, observers were asked to delineate the thermal lesion boundariesin those color strain and elastic modulus images. A dynamic range for all strain images was setfrom either 0 to 2% or four times of the frame-average strain, whichever was less. Similarly,we also limited the dynamic range for all elastic modulus images either by using a relativescale ranging from 1 to 8 or four times of the frame-average relative modulus value, whicheverwas less.
In the third step, only 14 gross pathology images were given to these three observers,in a random order. Most in vivo thermal ablation zones contain a central white/gray zonerepresenting coagulation necrosis and a surrounding red ring of about 1–3 mm thickness,representing hemorrhagic and inflammatory reactions (Goldberg et al 2003, Cha et al 2000).Because the outer red rim of the thermal ablation zone contains no viable cells (Goldberget al 2003, Cha et al 2000), observers were instructed to include this thin layer from theirsegmented thermal ablation zones. In all three steps, after the thermal ablation zones weredepicted, dimensions and areas of the thermal ablation zones were measured using the ImageJsoftware. Contouring with ImageJ described above was performed on the same monitor(MultiSync LCD 1860NX, NEC, Japan) with the same default monitor setting.
In the fourth step, we calculated the extent of overlap of areas of thermal ablation zonessegmented manually by three observers in gross pathology, elastic modulus and strain images.
Ultrasound-based relative elastic modulus imaging for evaluating ablation therapy 2291
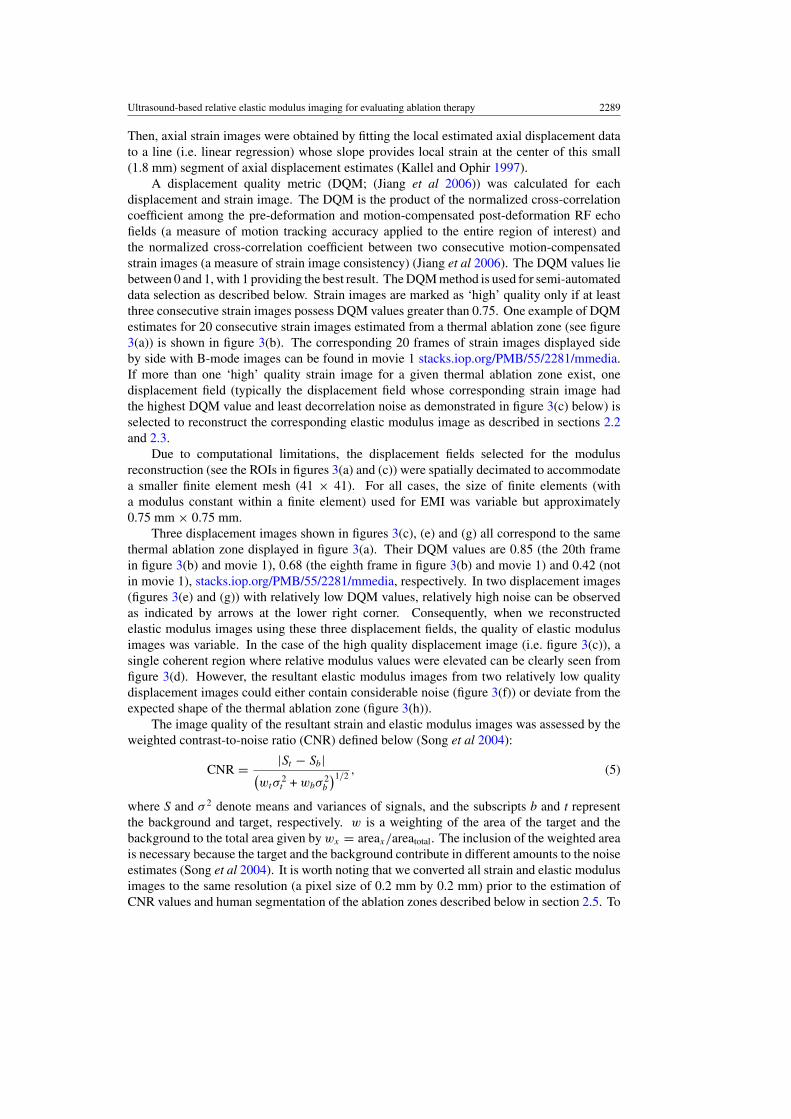
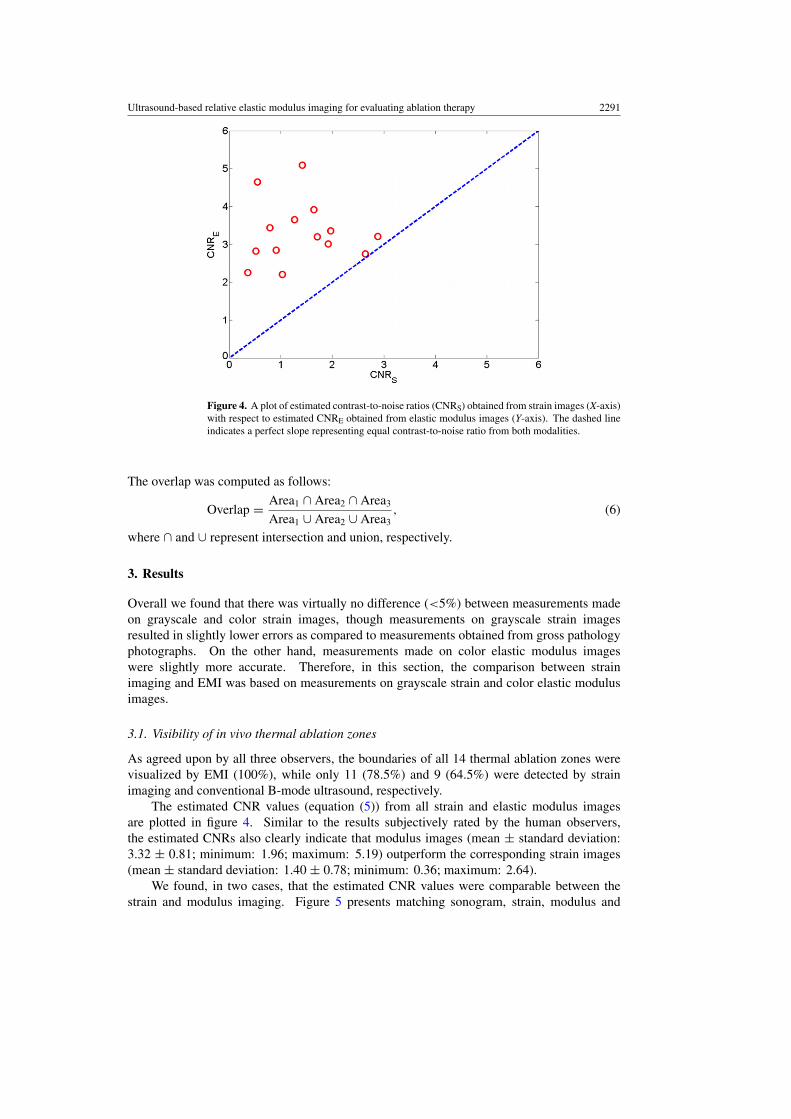
Figure 4. A plot of estimated contrast-to-noise ratios (CNRS) obtained from strain images (X-axis)with respect to estimated CNRE obtained from elastic modulus images (Y-axis). The dashed lineindicates a perfect slope representing equal contrast-to-noise ratio from both modalities.
The overlap was computed as follows:
Overlap = Area1 ∩ Area2 ∩ Area3
Area1 ∪ Area2 ∪ Area3, (6)
where ∩ and ∪ represent intersection and union, respectively.
3. Results
Overall we found that there was virtually no difference (<5%) between measurements madeon grayscale and color strain images, though measurements on grayscale strain imagesresulted in slightly lower errors as compared to measurements obtained from gross pathologyphotographs. On the other hand, measurements made on color elastic modulus imageswere slightly more accurate. Therefore, in this section, the comparison between strainimaging and EMI was based on measurements on grayscale strain and color elastic modulusimages.
3.1. Visibility of in vivo thermal ablation zones
As agreed upon by all three observers, the boundaries of all 14 thermal ablation zones werevisualized by EMI (100%), while only 11 (78.5%) and 9 (64.5%) were detected by strainimaging and conventional B-mode ultrasound, respectively.
The estimated CNR values (equation (5)) from all strain and elastic modulus imagesare plotted in figure 4. Similar to the results subjectively rated by the human observers,the estimated CNRs also clearly indicate that modulus images (mean ± standard deviation:3.32 ± 0.81; minimum: 1.96; maximum: 5.19) outperform the corresponding strain images(mean ± standard deviation: 1.40 ± 0.78; minimum: 0.36; maximum: 2.64).
We found, in two cases, that the estimated CNR values were comparable between thestrain and modulus imaging. Figure 5 presents matching sonogram, strain, modulus and
2292 J Jiang et al
(a) (b)
(c) (d)
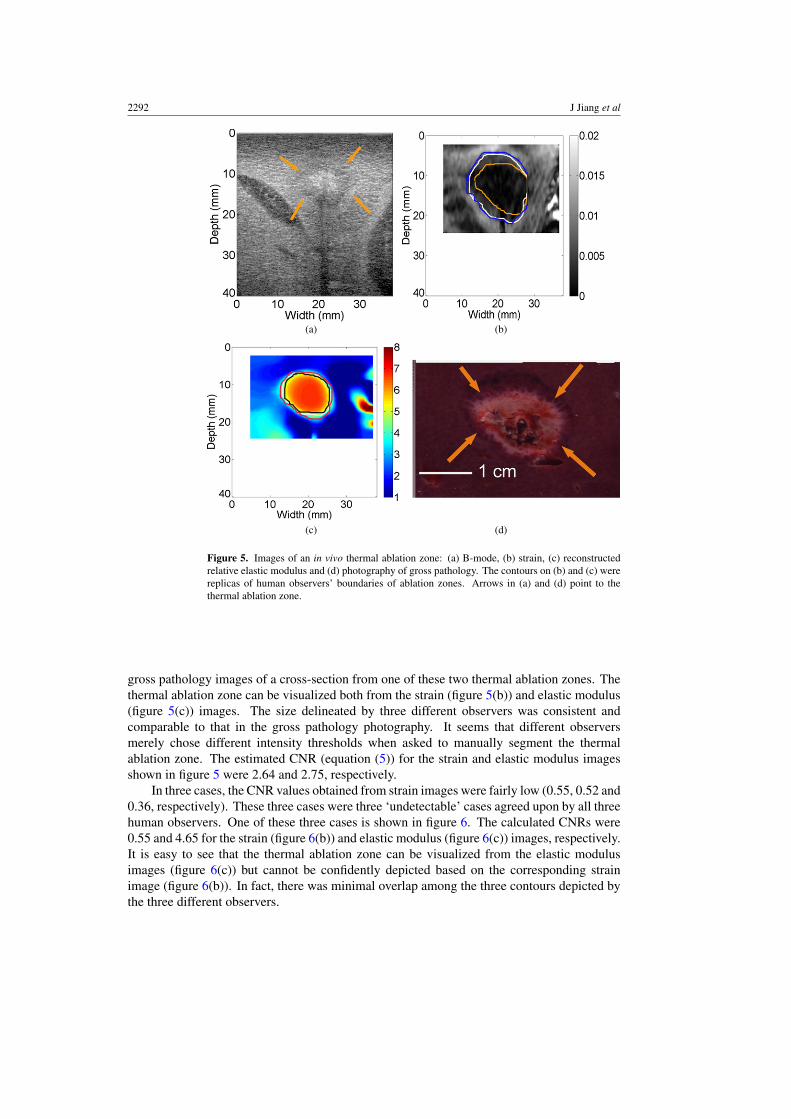
Figure 5. Images of an in vivo thermal ablation zone: (a) B-mode, (b) strain, (c) reconstructedrelative elastic modulus and (d) photography of gross pathology. The contours on (b) and (c) werereplicas of human observers’ boundaries of ablation zones. Arrows in (a) and (d) point to thethermal ablation zone.
gross pathology images of a cross-section from one of these two thermal ablation zones. Thethermal ablation zone can be visualized both from the strain (figure 5(b)) and elastic modulus(figure 5(c)) images. The size delineated by three different observers was consistent andcomparable to that in the gross pathology photography. It seems that different observersmerely chose different intensity thresholds when asked to manually segment the thermalablation zone. The estimated CNR (equation (5)) for the strain and elastic modulus imagesshown in figure 5 were 2.64 and 2.75, respectively.
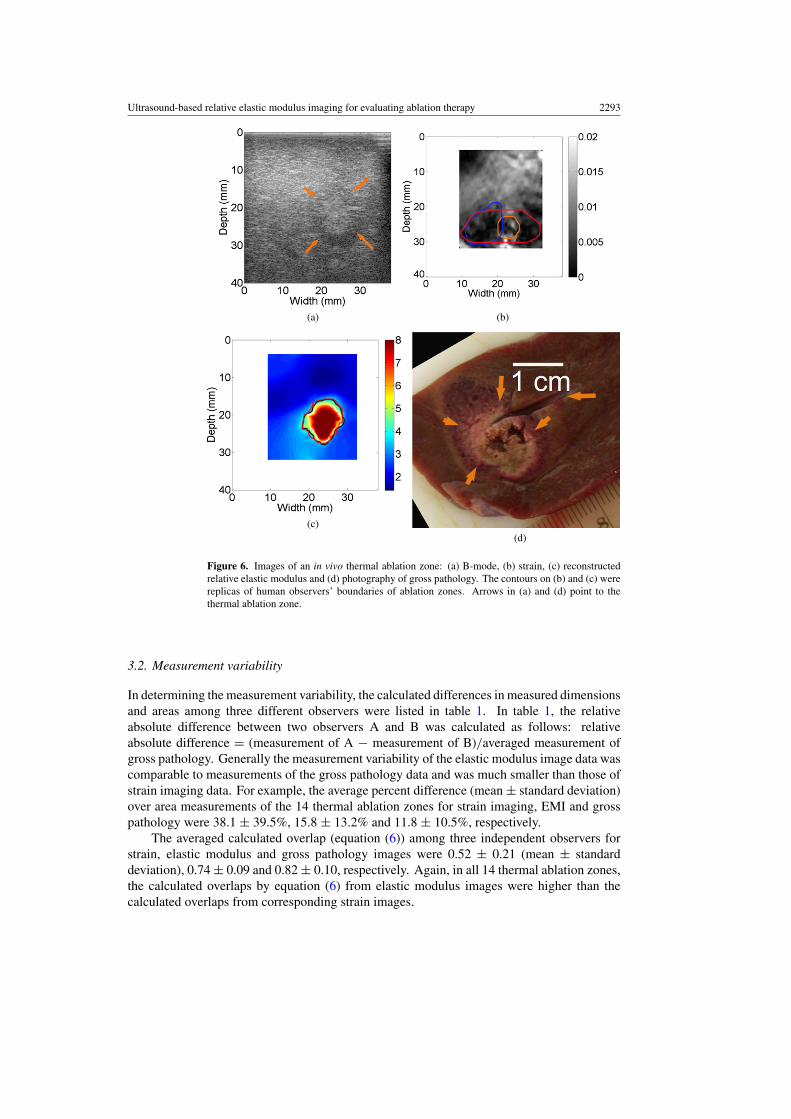
In three cases, the CNR values obtained from strain images were fairly low (0.55, 0.52 and0.36, respectively). These three cases were three ‘undetectable’ cases agreed upon by all threehuman observers. One of these three cases is shown in figure 6. The calculated CNRs were0.55 and 4.65 for the strain (figure 6(b)) and elastic modulus (figure 6(c)) images, respectively.It is easy to see that the thermal ablation zone can be visualized from the elastic modulusimages (figure 6(c)) but cannot be confidently depicted based on the corresponding strainimage (figure 6(b)). In fact, there was minimal overlap among the three contours depicted bythe three different observers.
Ultrasound-based relative elastic modulus imaging for evaluating ablation therapy 2293
(a) (b)
(c)(d)
Figure 6. Images of an in vivo thermal ablation zone: (a) B-mode, (b) strain, (c) reconstructedrelative elastic modulus and (d) photography of gross pathology. The contours on (b) and (c) werereplicas of human observers’ boundaries of ablation zones. Arrows in (a) and (d) point to thethermal ablation zone.
3.2. Measurement variability
In determining the measurement variability, the calculated differences in measured dimensionsand areas among three different observers were listed in table 1. In table 1, the relativeabsolute difference between two observers A and B was calculated as follows: relativeabsolute difference = (measurement of A − measurement of B)/averaged measurement ofgross pathology. Generally the measurement variability of the elastic modulus image data wascomparable to measurements of the gross pathology data and was much smaller than those ofstrain imaging data. For example, the average percent difference (mean ± standard deviation)over area measurements of the 14 thermal ablation zones for strain imaging, EMI and grosspathology were 38.1 ± 39.5%, 15.8 ± 13.2% and 11.8 ± 10.5%, respectively.
The averaged calculated overlap (equation (6)) among three independent observers forstrain, elastic modulus and gross pathology images were 0.52 ± 0.21 (mean ± standarddeviation), 0.74 ± 0.09 and 0.82 ± 0.10, respectively. Again, in all 14 thermal ablation zones,the calculated overlaps by equation (6) from elastic modulus images were higher than thecalculated overlaps from corresponding strain images.
2294 J Jiang et al
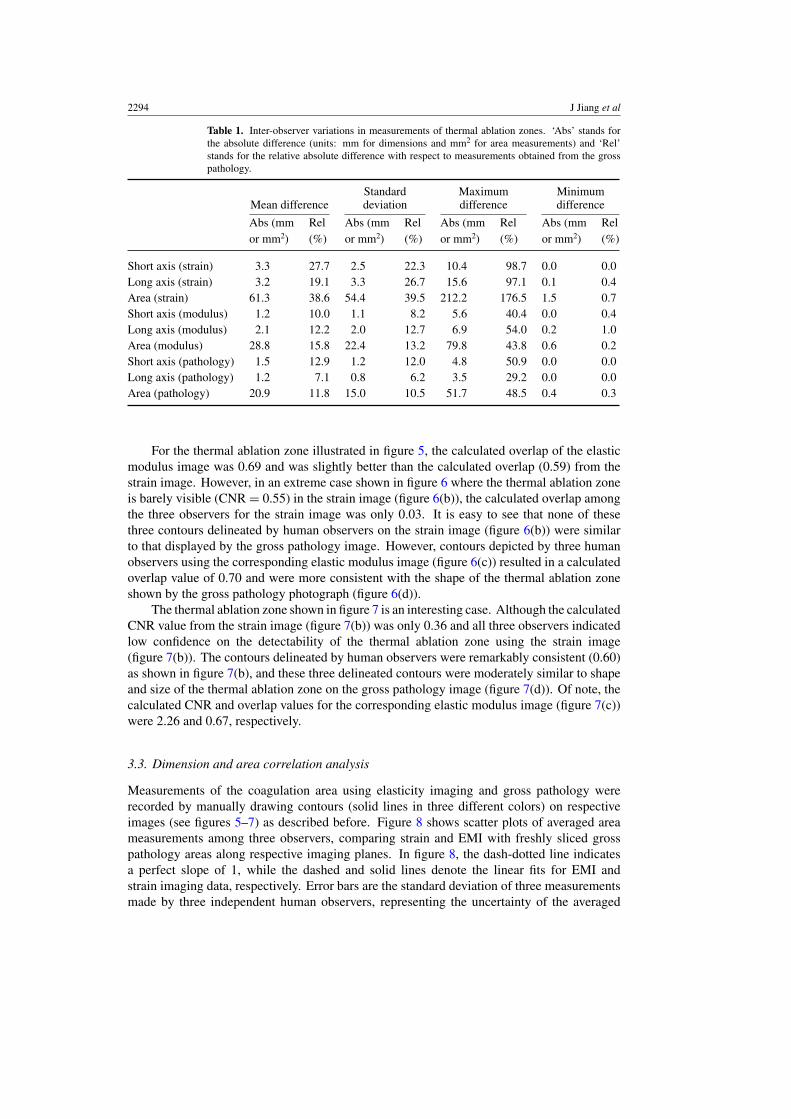
Table 1. Inter-observer variations in measurements of thermal ablation zones. ‘Abs’ stands forthe absolute difference (units: mm for dimensions and mm2 for area measurements) and ‘Rel’stands for the relative absolute difference with respect to measurements obtained from the grosspathology.
Mean differenceStandarddeviation
Maximumdifference
Minimumdifference
Abs (mm Rel Abs (mm Rel Abs (mm Rel Abs (mm Relor mm2) (%) or mm2) (%) or mm2) (%) or mm2) (%)
Short axis (strain) 3.3 27.7 2.5 22.3 10.4 98.7 0.0 0.0Long axis (strain) 3.2 19.1 3.3 26.7 15.6 97.1 0.1 0.4Area (strain) 61.3 38.6 54.4 39.5 212.2 176.5 1.5 0.7Short axis (modulus) 1.2 10.0 1.1 8.2 5.6 40.4 0.0 0.4Long axis (modulus) 2.1 12.2 2.0 12.7 6.9 54.0 0.2 1.0Area (modulus) 28.8 15.8 22.4 13.2 79.8 43.8 0.6 0.2Short axis (pathology) 1.5 12.9 1.2 12.0 4.8 50.9 0.0 0.0Long axis (pathology) 1.2 7.1 0.8 6.2 3.5 29.2 0.0 0.0Area (pathology) 20.9 11.8 15.0 10.5 51.7 48.5 0.4 0.3
For the thermal ablation zone illustrated in figure 5, the calculated overlap of the elasticmodulus image was 0.69 and was slightly better than the calculated overlap (0.59) from thestrain image. However, in an extreme case shown in figure 6 where the thermal ablation zoneis barely visible (CNR = 0.55) in the strain image (figure 6(b)), the calculated overlap amongthe three observers for the strain image was only 0.03. It is easy to see that none of thesethree contours delineated by human observers on the strain image (figure 6(b)) were similarto that displayed by the gross pathology image. However, contours depicted by three humanobservers using the corresponding elastic modulus image (figure 6(c)) resulted in a calculatedoverlap value of 0.70 and were more consistent with the shape of the thermal ablation zoneshown by the gross pathology photograph (figure 6(d)).
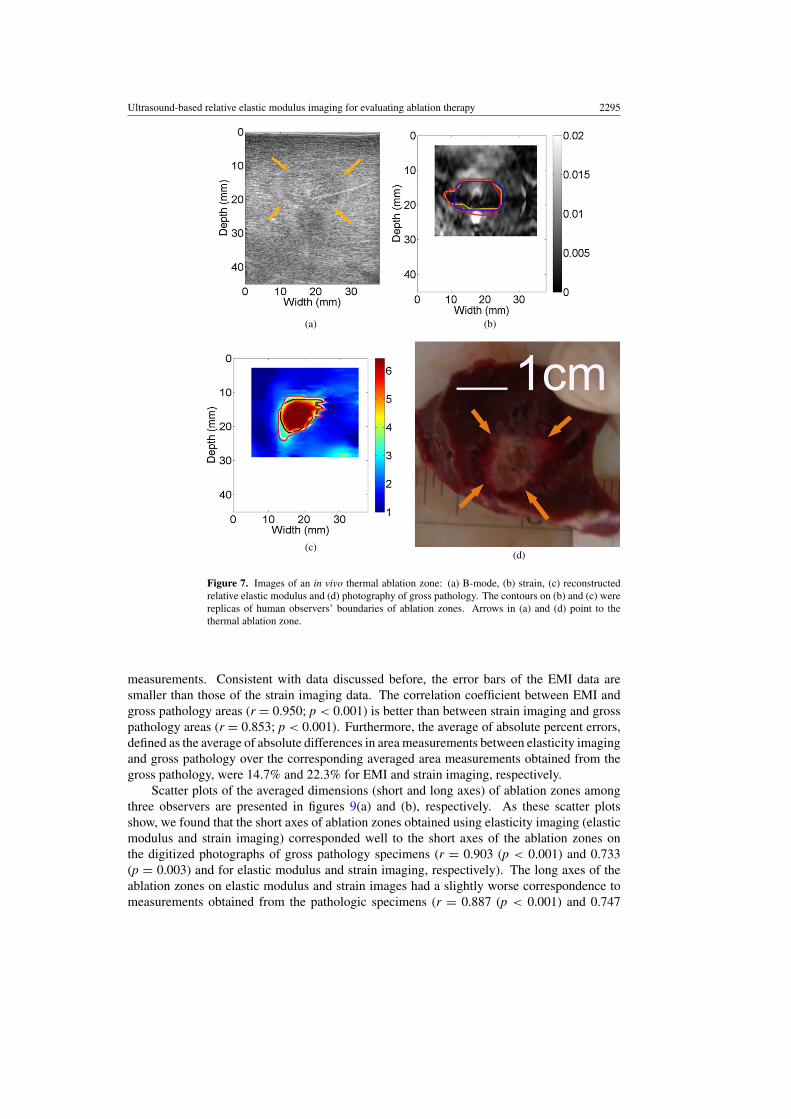
The thermal ablation zone shown in figure 7 is an interesting case. Although the calculatedCNR value from the strain image (figure 7(b)) was only 0.36 and all three observers indicatedlow confidence on the detectability of the thermal ablation zone using the strain image(figure 7(b)). The contours delineated by human observers were remarkably consistent (0.60)as shown in figure 7(b), and these three delineated contours were moderately similar to shapeand size of the thermal ablation zone on the gross pathology image (figure 7(d)). Of note, thecalculated CNR and overlap values for the corresponding elastic modulus image (figure 7(c))were 2.26 and 0.67, respectively.
3.3. Dimension and area correlation analysis
Measurements of the coagulation area using elasticity imaging and gross pathology wererecorded by manually drawing contours (solid lines in three different colors) on respectiveimages (see figures 5–7) as described before. Figure 8 shows scatter plots of averaged areameasurements among three observers, comparing strain and EMI with freshly sliced grosspathology areas along respective imaging planes. In figure 8, the dash-dotted line indicatesa perfect slope of 1, while the dashed and solid lines denote the linear fits for EMI andstrain imaging data, respectively. Error bars are the standard deviation of three measurementsmade by three independent human observers, representing the uncertainty of the averaged
Ultrasound-based relative elastic modulus imaging for evaluating ablation therapy 2295
(a)
(c)(d)
(b)
Figure 7. Images of an in vivo thermal ablation zone: (a) B-mode, (b) strain, (c) reconstructedrelative elastic modulus and (d) photography of gross pathology. The contours on (b) and (c) werereplicas of human observers’ boundaries of ablation zones. Arrows in (a) and (d) point to thethermal ablation zone.
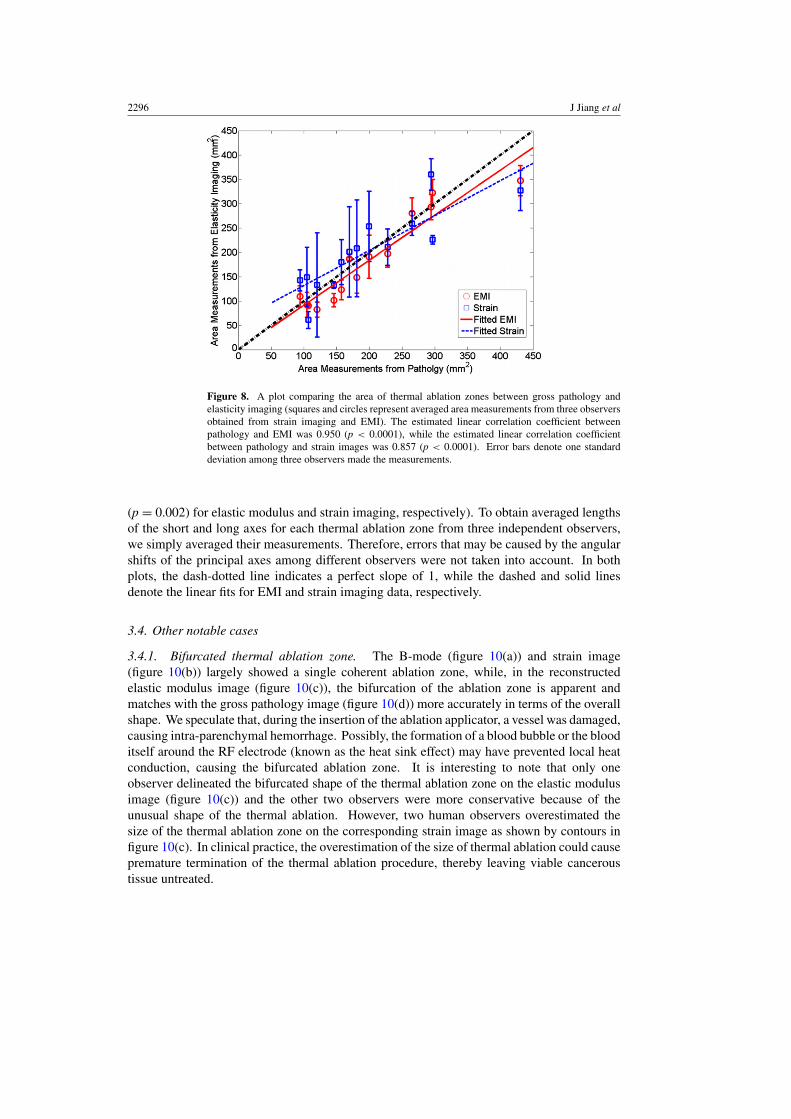
measurements. Consistent with data discussed before, the error bars of the EMI data aresmaller than those of the strain imaging data. The correlation coefficient between EMI andgross pathology areas (r = 0.950; p < 0.001) is better than between strain imaging and grosspathology areas (r = 0.853; p < 0.001). Furthermore, the average of absolute percent errors,defined as the average of absolute differences in area measurements between elasticity imagingand gross pathology over the corresponding averaged area measurements obtained from thegross pathology, were 14.7% and 22.3% for EMI and strain imaging, respectively.
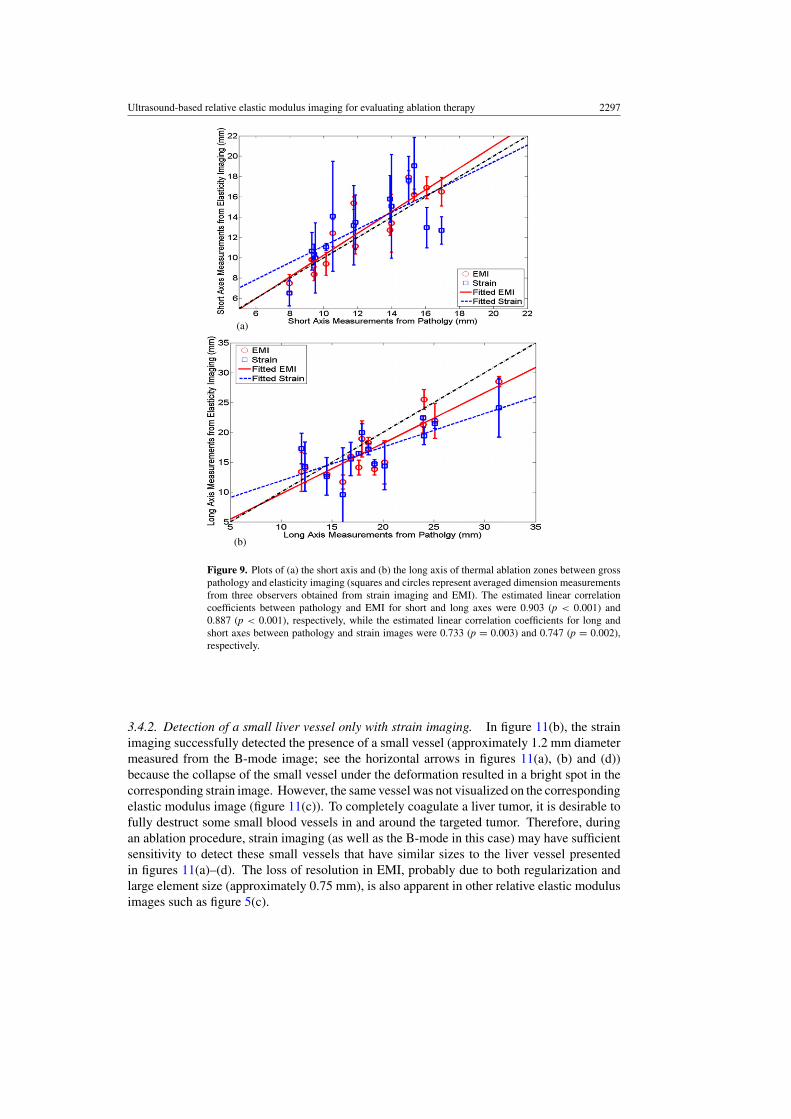
Scatter plots of the averaged dimensions (short and long axes) of ablation zones amongthree observers are presented in figures 9(a) and (b), respectively. As these scatter plotsshow, we found that the short axes of ablation zones obtained using elasticity imaging (elasticmodulus and strain imaging) corresponded well to the short axes of the ablation zones onthe digitized photographs of gross pathology specimens (r = 0.903 (p < 0.001) and 0.733(p = 0.003) and for elastic modulus and strain imaging, respectively). The long axes of theablation zones on elastic modulus and strain images had a slightly worse correspondence tomeasurements obtained from the pathologic specimens (r = 0.887 (p < 0.001) and 0.747
2296 J Jiang et al
Figure 8. A plot comparing the area of thermal ablation zones between gross pathology andelasticity imaging (squares and circles represent averaged area measurements from three observersobtained from strain imaging and EMI). The estimated linear correlation coefficient betweenpathology and EMI was 0.950 (p < 0.0001), while the estimated linear correlation coefficientbetween pathology and strain images was 0.857 (p < 0.0001). Error bars denote one standarddeviation among three observers made the measurements.
(p = 0.002) for elastic modulus and strain imaging, respectively). To obtain averaged lengthsof the short and long axes for each thermal ablation zone from three independent observers,we simply averaged their measurements. Therefore, errors that may be caused by the angularshifts of the principal axes among different observers were not taken into account. In bothplots, the dash-dotted line indicates a perfect slope of 1, while the dashed and solid linesdenote the linear fits for EMI and strain imaging data, respectively.
3.4. Other notable cases
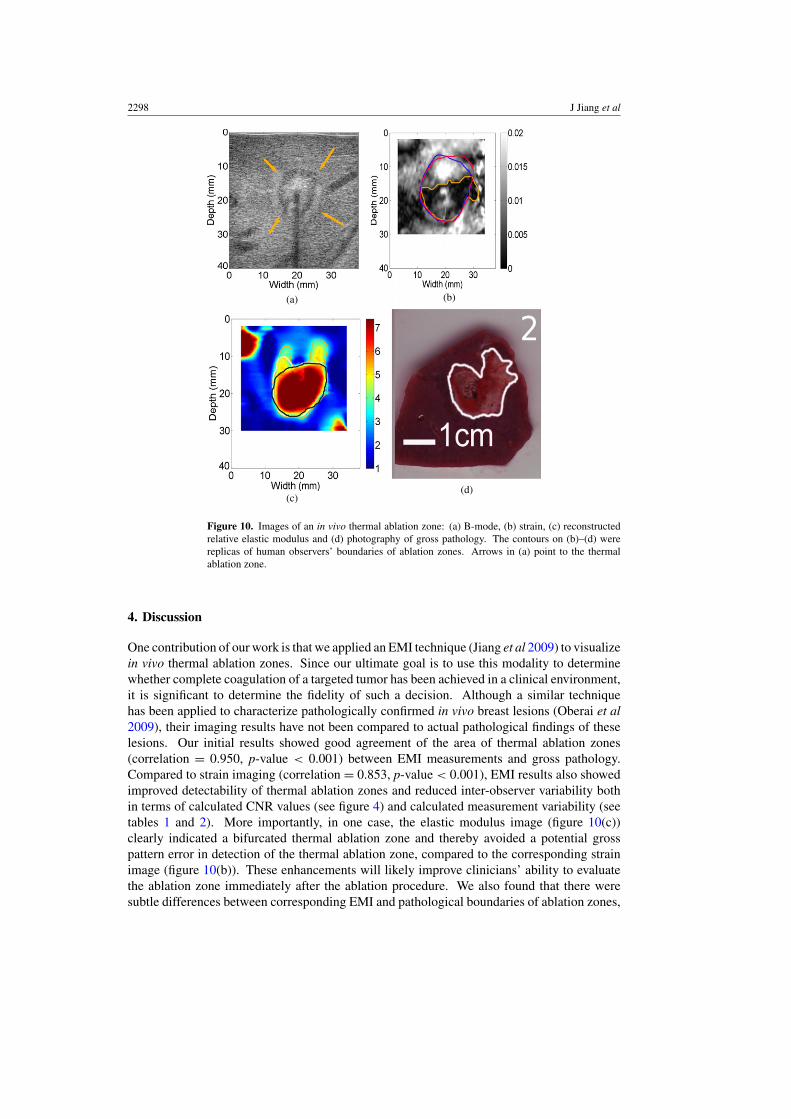
3.4.1. Bifurcated thermal ablation zone. The B-mode (figure 10(a)) and strain image(figure 10(b)) largely showed a single coherent ablation zone, while, in the reconstructedelastic modulus image (figure 10(c)), the bifurcation of the ablation zone is apparent andmatches with the gross pathology image (figure 10(d)) more accurately in terms of the overallshape. We speculate that, during the insertion of the ablation applicator, a vessel was damaged,causing intra-parenchymal hemorrhage. Possibly, the formation of a blood bubble or the blooditself around the RF electrode (known as the heat sink effect) may have prevented local heatconduction, causing the bifurcated ablation zone. It is interesting to note that only oneobserver delineated the bifurcated shape of the thermal ablation zone on the elastic modulusimage (figure 10(c)) and the other two observers were more conservative because of theunusual shape of the thermal ablation. However, two human observers overestimated thesize of the thermal ablation zone on the corresponding strain image as shown by contours infigure 10(c). In clinical practice, the overestimation of the size of thermal ablation could causepremature termination of the thermal ablation procedure, thereby leaving viable canceroustissue untreated.
Ultrasound-based relative elastic modulus imaging for evaluating ablation therapy 2297
(a)
(b)
Figure 9. Plots of (a) the short axis and (b) the long axis of thermal ablation zones between grosspathology and elasticity imaging (squares and circles represent averaged dimension measurementsfrom three observers obtained from strain imaging and EMI). The estimated linear correlationcoefficients between pathology and EMI for short and long axes were 0.903 (p < 0.001) and0.887 (p < 0.001), respectively, while the estimated linear correlation coefficients for long andshort axes between pathology and strain images were 0.733 (p = 0.003) and 0.747 (p = 0.002),respectively.
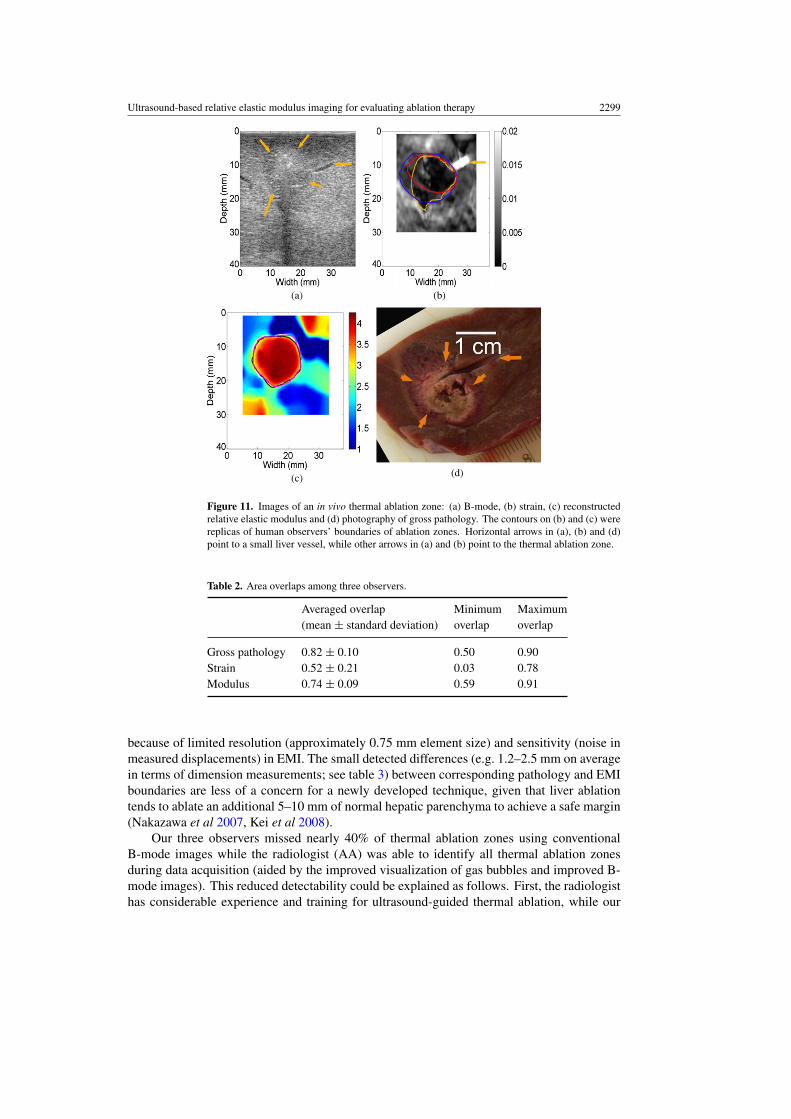
3.4.2. Detection of a small liver vessel only with strain imaging. In figure 11(b), the strainimaging successfully detected the presence of a small vessel (approximately 1.2 mm diametermeasured from the B-mode image; see the horizontal arrows in figures 11(a), (b) and (d))because the collapse of the small vessel under the deformation resulted in a bright spot in thecorresponding strain image. However, the same vessel was not visualized on the correspondingelastic modulus image (figure 11(c)). To completely coagulate a liver tumor, it is desirable tofully destruct some small blood vessels in and around the targeted tumor. Therefore, duringan ablation procedure, strain imaging (as well as the B-mode in this case) may have sufficientsensitivity to detect these small vessels that have similar sizes to the liver vessel presentedin figures 11(a)–(d). The loss of resolution in EMI, probably due to both regularization andlarge element size (approximately 0.75 mm), is also apparent in other relative elastic modulusimages such as figure 5(c).
2298 J Jiang et al
(a)
(c)(d)
(b)
Figure 10. Images of an in vivo thermal ablation zone: (a) B-mode, (b) strain, (c) reconstructedrelative elastic modulus and (d) photography of gross pathology. The contours on (b)–(d) werereplicas of human observers’ boundaries of ablation zones. Arrows in (a) point to the thermalablation zone.
4. Discussion
One contribution of our work is that we applied an EMI technique (Jiang et al 2009) to visualizein vivo thermal ablation zones. Since our ultimate goal is to use this modality to determinewhether complete coagulation of a targeted tumor has been achieved in a clinical environment,it is significant to determine the fidelity of such a decision. Although a similar techniquehas been applied to characterize pathologically confirmed in vivo breast lesions (Oberai et al2009), their imaging results have not been compared to actual pathological findings of theselesions. Our initial results showed good agreement of the area of thermal ablation zones(correlation = 0.950, p-value < 0.001) between EMI measurements and gross pathology.Compared to strain imaging (correlation = 0.853, p-value < 0.001), EMI results also showedimproved detectability of thermal ablation zones and reduced inter-observer variability bothin terms of calculated CNR values (see figure 4) and calculated measurement variability (seetables 1 and 2). More importantly, in one case, the elastic modulus image (figure 10(c))clearly indicated a bifurcated thermal ablation zone and thereby avoided a potential grosspattern error in detection of the thermal ablation zone, compared to the corresponding strainimage (figure 10(b)). These enhancements will likely improve clinicians’ ability to evaluatethe ablation zone immediately after the ablation procedure. We also found that there weresubtle differences between corresponding EMI and pathological boundaries of ablation zones,
Ultrasound-based relative elastic modulus imaging for evaluating ablation therapy 2299
(a) (b)
(c) (d)
Figure 11. Images of an in vivo thermal ablation zone: (a) B-mode, (b) strain, (c) reconstructedrelative elastic modulus and (d) photography of gross pathology. The contours on (b) and (c) werereplicas of human observers’ boundaries of ablation zones. Horizontal arrows in (a), (b) and (d)point to a small liver vessel, while other arrows in (a) and (b) point to the thermal ablation zone.
Table 2. Area overlaps among three observers.
Averaged overlap Minimum Maximum(mean ± standard deviation) overlap overlap
Gross pathology 0.82 ± 0.10 0.50 0.90Strain 0.52 ± 0.21 0.03 0.78Modulus 0.74 ± 0.09 0.59 0.91
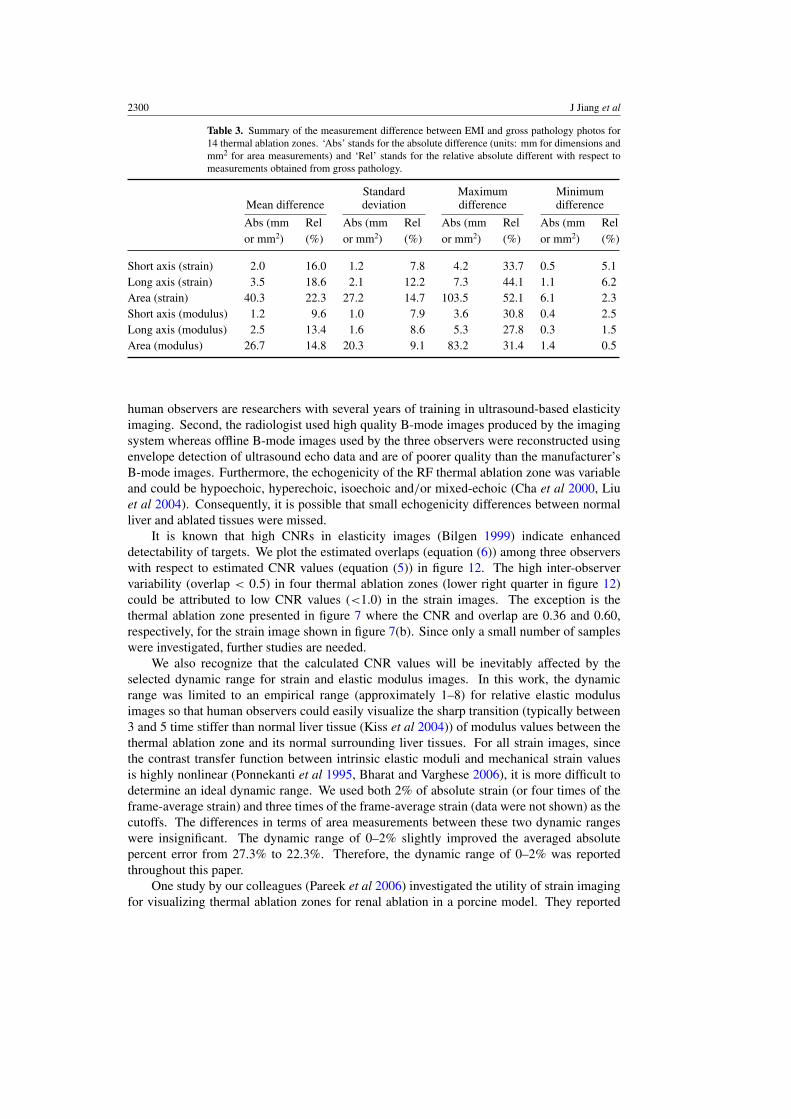
because of limited resolution (approximately 0.75 mm element size) and sensitivity (noise inmeasured displacements) in EMI. The small detected differences (e.g. 1.2–2.5 mm on averagein terms of dimension measurements; see table 3) between corresponding pathology and EMIboundaries are less of a concern for a newly developed technique, given that liver ablationtends to ablate an additional 5–10 mm of normal hepatic parenchyma to achieve a safe margin(Nakazawa et al 2007, Kei et al 2008).
Our three observers missed nearly 40% of thermal ablation zones using conventionalB-mode images while the radiologist (AA) was able to identify all thermal ablation zonesduring data acquisition (aided by the improved visualization of gas bubbles and improved B-mode images). This reduced detectability could be explained as follows. First, the radiologisthas considerable experience and training for ultrasound-guided thermal ablation, while our
2300 J Jiang et al
Table 3. Summary of the measurement difference between EMI and gross pathology photos for14 thermal ablation zones. ‘Abs’ stands for the absolute difference (units: mm for dimensions andmm2 for area measurements) and ‘Rel’ stands for the relative absolute different with respect tomeasurements obtained from gross pathology.
Mean differenceStandarddeviation
Maximumdifference
Minimumdifference
Abs (mm Rel Abs (mm Rel Abs (mm Rel Abs (mm Relor mm2) (%) or mm2) (%) or mm2) (%) or mm2) (%)
Short axis (strain) 2.0 16.0 1.2 7.8 4.2 33.7 0.5 5.1Long axis (strain) 3.5 18.6 2.1 12.2 7.3 44.1 1.1 6.2Area (strain) 40.3 22.3 27.2 14.7 103.5 52.1 6.1 2.3Short axis (modulus) 1.2 9.6 1.0 7.9 3.6 30.8 0.4 2.5Long axis (modulus) 2.5 13.4 1.6 8.6 5.3 27.8 0.3 1.5Area (modulus) 26.7 14.8 20.3 9.1 83.2 31.4 1.4 0.5
human observers are researchers with several years of training in ultrasound-based elasticityimaging. Second, the radiologist used high quality B-mode images produced by the imagingsystem whereas offline B-mode images used by the three observers were reconstructed usingenvelope detection of ultrasound echo data and are of poorer quality than the manufacturer’sB-mode images. Furthermore, the echogenicity of the RF thermal ablation zone was variableand could be hypoechoic, hyperechoic, isoechoic and/or mixed-echoic (Cha et al 2000, Liuet al 2004). Consequently, it is possible that small echogenicity differences between normalliver and ablated tissues were missed.
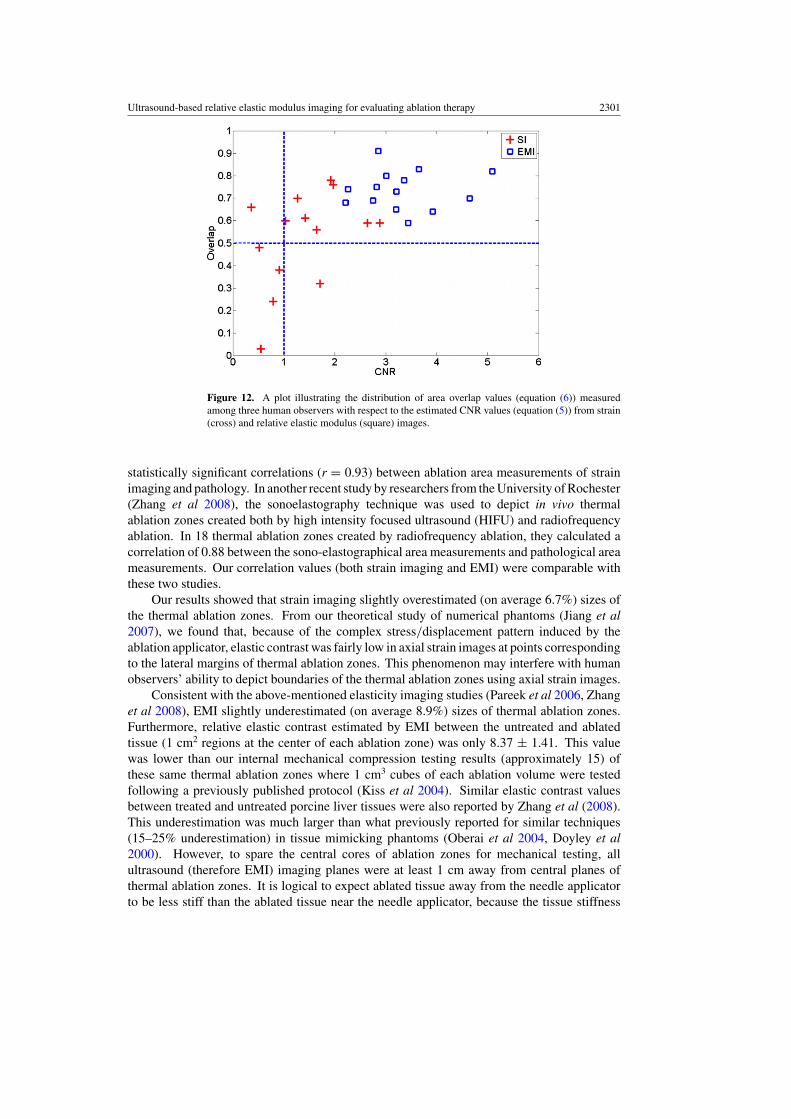
It is known that high CNRs in elasticity images (Bilgen 1999) indicate enhanceddetectability of targets. We plot the estimated overlaps (equation (6)) among three observerswith respect to estimated CNR values (equation (5)) in figure 12. The high inter-observervariability (overlap < 0.5) in four thermal ablation zones (lower right quarter in figure 12)could be attributed to low CNR values (<1.0) in the strain images. The exception is thethermal ablation zone presented in figure 7 where the CNR and overlap are 0.36 and 0.60,respectively, for the strain image shown in figure 7(b). Since only a small number of sampleswere investigated, further studies are needed.
We also recognize that the calculated CNR values will be inevitably affected by theselected dynamic range for strain and elastic modulus images. In this work, the dynamicrange was limited to an empirical range (approximately 1–8) for relative elastic modulusimages so that human observers could easily visualize the sharp transition (typically between3 and 5 time stiffer than normal liver tissue (Kiss et al 2004)) of modulus values between thethermal ablation zone and its normal surrounding liver tissues. For all strain images, sincethe contrast transfer function between intrinsic elastic moduli and mechanical strain valuesis highly nonlinear (Ponnekanti et al 1995, Bharat and Varghese 2006), it is more difficult todetermine an ideal dynamic range. We used both 2% of absolute strain (or four times of theframe-average strain) and three times of the frame-average strain (data were not shown) as thecutoffs. The differences in terms of area measurements between these two dynamic rangeswere insignificant. The dynamic range of 0–2% slightly improved the averaged absolutepercent error from 27.3% to 22.3%. Therefore, the dynamic range of 0–2% was reportedthroughout this paper.
One study by our colleagues (Pareek et al 2006) investigated the utility of strain imagingfor visualizing thermal ablation zones for renal ablation in a porcine model. They reported
Ultrasound-based relative elastic modulus imaging for evaluating ablation therapy 2301
Figure 12. A plot illustrating the distribution of area overlap values (equation (6)) measuredamong three human observers with respect to the estimated CNR values (equation (5)) from strain(cross) and relative elastic modulus (square) images.
statistically significant correlations (r = 0.93) between ablation area measurements of strainimaging and pathology. In another recent study by researchers from the University of Rochester(Zhang et al 2008), the sonoelastography technique was used to depict in vivo thermalablation zones created both by high intensity focused ultrasound (HIFU) and radiofrequencyablation. In 18 thermal ablation zones created by radiofrequency ablation, they calculated acorrelation of 0.88 between the sono-elastographical area measurements and pathological areameasurements. Our correlation values (both strain imaging and EMI) were comparable withthese two studies.
Our results showed that strain imaging slightly overestimated (on average 6.7%) sizes ofthe thermal ablation zones. From our theoretical study of numerical phantoms (Jiang et al2007), we found that, because of the complex stress/displacement pattern induced by theablation applicator, elastic contrast was fairly low in axial strain images at points correspondingto the lateral margins of thermal ablation zones. This phenomenon may interfere with humanobservers’ ability to depict boundaries of the thermal ablation zones using axial strain images.
Consistent with the above-mentioned elasticity imaging studies (Pareek et al 2006, Zhanget al 2008), EMI slightly underestimated (on average 8.9%) sizes of thermal ablation zones.Furthermore, relative elastic contrast estimated by EMI between the untreated and ablatedtissue (1 cm2 regions at the center of each ablation zone) was only 8.37 ± 1.41. This valuewas lower than our internal mechanical compression testing results (approximately 15) ofthese same thermal ablation zones where 1 cm3 cubes of each ablation volume were testedfollowing a previously published protocol (Kiss et al 2004). Similar elastic contrast valuesbetween treated and untreated porcine liver tissues were also reported by Zhang et al (2008).This underestimation was much larger than what previously reported for similar techniques(15–25% underestimation) in tissue mimicking phantoms (Oberai et al 2004, Doyley et al2000). However, to spare the central cores of ablation zones for mechanical testing, allultrasound (therefore EMI) imaging planes were at least 1 cm away from central planes ofthermal ablation zones. It is logical to expect ablated tissue away from the needle applicatorto be less stiff than the ablated tissue near the needle applicator, because the tissue stiffness
2302 J Jiang et al
change is largely temperature dependent (Bharat et al 2005). Our ongoing research is toaddress both underestimations (i.e. size and elastic contrast) by using a more intelligentregularization method during inverse modulus reconstruction and improving the accuracy ofspeckle tracking.
We used a DQM metric (Jiang et al 2006) as the basis to pre-select displacementimages. First, as demonstrated in figures 3(a)–(h), the quality of displacements affected theoutcomes of EMI because the displacement estimates provide fundamental information formodulus reconstruction. Although good regularization methods (Doyley et al 2006) make thereconstruction process more robust, good quality displacement measurements should enableus to reduce the dependence on regularization. Second, we generally obtain a sequence ofdisplacement fields for EMI in a clinical setting. The use of DQM could be a method forautomated displacement data selection, thereby potentially eliminating user dependence.
We also found that, when grayscale elastic modulus images were used, human observerstended to further underestimate sizes of thermal ablation zones. The underestimation increasedto 12.0% (up from 8.9% as described above). Compared to measurements made from colorelastic modulus images using the same dynamic range described in section 2.5, the correlationof area measurements between grayscale elastic modulus images and gross pathology reducedto 0.90 (down from 0.95 as described above). Further studies of this topic may help usunderstand how to use appropriate color maps to improve the visualization of thermal ablationzones (Rogowitz and Treinish 2005).
One limitation of our study is that ultrasound images were not automatically registeredwith photographs of gross pathology. Since markers corresponding to respective imagingplanes were created on the surfaces of liver lobes during data acquisition, we are reasonablyconfident that imaging planes of gross pathology should be in the vicinity of elasticity imagingplanes. However, during post-processing of gross pathology and ultrasound-related imagingresults, we were not able to find enough landmarks to estimate the errors of such manualalignments. This limitation could be resolved in our future studies. In the literature, multiplefiducial needles were used to register 3D images in and near ablation zones with sufficientaccuracy (approximately 1 mm error) (Lazebnik et al 2003). Another limitation with theporcine model is that all thermal ablation zones were created in healthy parenchyma. Thebasic assumption of using EMI to differentiate ablation zones is that protein denaturation dueto heating causes an increase of stiffness in ablated tissue (Kiss et al 2004). Because of this,the presence of certain liver masses which may also be harder (e.g. cholangiocarcinomas (Yehet al 2002)) or softer (e.g. HCCs (Yeh et al 2002)) than normal liver tissue will likely makethis differentiation more difficult.
The modulus reconstruction method (equations (2)–(4)) described in this paper assumesthat both normal and ablated liver tissues are linearly elastic. Since nearly all soft tissue arenonlinear (Fung 1993), using a hyper-elastic material model similar to the model used byOberai et al (2009) may improve our results at the expense of larger computational demands.However, inverse reconstruction of nonlinear material properties as in their work (Oberaiet al 2009) might not be feasible because the large accumulative deformation (e.g. 15–20% ofcompression) required would be difficult to achieve in the liver with electrode displacementelastography.
Another limitation of our method is that we require a user to identify the location ofthe ablation applicator so that the deformation induced by the applicator (i.e. the source ofmechanical stimulus) is a part of the boundary conditions.
In this study, open abdominal ablation procedures were performed. Clinically, approachesfor hepatic ablation include both percutaneous and surgical ablation (laparoscopy and open)techniques. Although the percutaneous approach is preferred by many institutions because
Ultrasound-based relative elastic modulus imaging for evaluating ablation therapy 2303
of its minimally invasive nature (e.g. less morbidity, complications and associated healthcarecosts), thermal ablation using surgical procedures including open-abdominal approach alsoprovides distinct advantages (Siperstein et al 1997, Burdio et al 2008). In a large numberof cases, hepatic ablation is still performed as open-abdominal procedures. With surgicalablation techniques, the entire liver can be imaged with a high-frequency intra-operativeultrasound transducer placed directly on the surface of the liver, resulting in better placementfor ablation applicators and subsequent lower recurrence rates (Burdio et al 2008). Althoughwe do not make any assumptions about the liver geometry, we use all displacement estimatesalong edges of a user-defined ROI (see figure 3(a)) as a part of the boundary conditions. Ifour method would be applied to percutaneous ablation, the presence of the body wall mayinduce phase aberration, signal loss and distortion in ultrasound data, thereby resulting inless accurate displacement estimation under certain conditions (Varghese et al 2001). Ifthese inaccurate displacements happen to be around the edge of the ROI, they would likelydegrade our ability to visualize the thermal ablation zone as the examples demonstrated infigures 3(f) and (g). This use of EMI during open abdominal ablation, a less complicatedimaging condition, is a necessary first step to test its clinical utility. Our ongoing research isto test the above-mentioned EMI method in the presence of a tumor background and usingpercutaneous ablation.
Currently, the elastic modulus reconstruction algorithm is implemented using MATLAB(Mathworks Inc., MA, USA) and provides an elastic modulus image in 15–20 min. However,achieving a reasonably fast frame rate (20 s/frame) for EMI is indeed possible. The formationof a 2D elastic modulus image in 30 s using advanced programming language C in conjunctionwith a much less advanced personal computer (Pentium 1-GHz) was reported in by Oberaiet al (2004).
5. Conclusions
The use of our EMI method to visualize in vivo thermal ablation zones was presented. In all14 cases, when compared to strain imaging, the elastic modulus images show equal or betterdetectability in terms of visualization of the in vivo thermal ablation zones. Our results alsodemonstrate that the proposed EMI method has the potential to accurately (correlation = 0.950and mean error = 8.9%) depict boundaries of complex thermal ablation zones. This initialresult is encouraging and warrants further carefully planned studies involving a reasonablylarge number of pre-clinical animal experiments, in particular, using tumor-bearing animalmodels. If successful, the ultrasound-based EMI method can be a useful means for monitoringand evaluating thermal ablation procedures involving human patients.
Acknowledgments
We gratefully acknowledge the support by NIH grants R01CA100373, R01CA112192 andR01CA112192-03S1. Ted Fisher and Ryan DeWall are supported, in part, by an NIH traininggrant T32CA09206. We are also grateful to colleagues at the University of Wisconsin(especially Drs Mark Kliewer and Shyam Bharat and Ms Lisa Sampson) for their assistancein equipment access and data acquisition during ablation experiments.
References
Barbone P E and Bamber J C 2002 Quantitative elasticity imaging: what can and cannot be inferred from strainimages Phys. Med. Biol. 47 2147–64
2304 J Jiang et al
Bharat S, Techavipoo U, Kiss M Z, Liu W and Varghese T 2005 Monitoring stiffness changes in lesions afterradiofrequency ablation at different temperatures and durations of ablation Ultrasound Med. Biol. 31 415–22
Bharat S and Varghese T 2006 Contrast-transfer improvement for electrode displacement elastography Phys. Med.Biol. 51 6403–18
Bilgen M 1999 Target detectability in acoustic elastography IEEE Trans. Ultrason. Ferroelectr. Freq. Control46 1128–33
Brace C L, Laeseke P F, Sampson L A, Frey T M, van der Weide D W and Lee F T Jr 2007 Microwave ablation witha single small-gauge triaxial antenna: in vivo porcine liver model Radiology 242 435–40
Brunke S S, Insana M F, Dahl J J, Hansen C, Ashfaq M and Ermert H 2007 An ultrasound research interface for aclinical system IEEE Trans. Ultrason. Ferroelectr. Freq. Control 54 198–210
Burdio F, Mulier S, Navarro A, Figueras J, Berjano E, Poves I and Grande L 2008 Influence of approach on outcomein radiofrequency ablation of liver tumors Surg. Oncol. 17 295–9
Bush N L, Rivens I, ter Haar G R and Bamber J C 1993 Acoustic properties of lesions generated with an ultrasoundtherapy system Ultrasound Med. Biol. 19 789–801
Callstrom M R et al 2006 Painful metastases involving bone: percutaneous image-guided cryoablation—prospectivetrial interim analysis Radiology 241 572–80
Carter D L, MacFall J R, Clegg S T, Wan X, Prescott D M, Charles H C and Samulski T V 1998 Magnetic resonancethermometry during hyperthermia for human high-grade sarcoma Int. J. Radiat. Oncol. Biol. Phys. 40 815–22
Cha C H, Lee F T Jr, Gurney J M, Markhardt B K, Warner T F, Kelcz F and Mahvi D M 2000 CT versus sonographyfor monitoring radiofrequency ablation in a porcine liver AJR Am. J. Roentgenol 175 705–11
Doyley M M, Meaney P M and Bamber J C 2000 Evaluation of an iterative reconstruction method for quantitativeelastography Phys. Med. Biol. 45 1521–40
Doyley M M, Srinivasan S, Dimidenko E, Soni N and Ophir J 2006 Enhancing the performance of model-basedelastography by incorporating additional a priori information in the modulus image reconstruction processPhys. Med. Biol. 51 95–112
Dupuy D E and Goldberg S N 2001 Image-guided radiofrequency tumor ablation: challenges and opportunities—part II J. Vasc. Interv. Radiol. 12 1135–48
Fahey B J, Hsu S J, Wolf P D, Nelson R C and Trahey G E 2006 Liver ablation guidance with acoustic radiation forceimpulse imaging: challenges and opportunities Phys. Med. Biol. 51 3785–808
Fung Y C 1993 Biomechanics: Mechanical Properties of Living Tissues (New York: Springer)Gao L, Parker K J, Lerner R M and Levinson S F 1996 Imaging of the elastic properties of tissue—a review Ultrasound
Med. Biol. 22 959–77Gazelle G S, Goldberg S N, Solbiati L and Livraghi T 2000 Tumor ablation with radio-frequency energy Radiology
217 633–46Gervais D A, McGovern F J, Arellano R S, McDougal W S and Mueller P R 2005 Radiofrequency ablation of renal
cell carcinoma: part 1. Indications, results, and role in patient management over a 6-year period and ablation of100 tumors AJR Am. J. Roentgenol. 185 64–71
Gervais D A, McGovern F J, Wood B J, Goldberg S N, McDougal W S and Mueller P R 2000 Radio-frequencyablation of renal cell carcinoma: early clinical experience Radiology 217 665–72
Goldberg S N et al 2003 Image-guided tumor ablation: proposal for standardization of terms and reporting criteriaRadiology 228 335–45
Goldberg S N, Gazelle G S and Mueller P R 2000 Thermal ablation therapy for focal malignancy: a unified approachto underlying principles, techniques, and diagnostic imaging guidance AJR Am. J. Roentgenol. 174 323–31
Goldberg S N, Gazelle G S, Solbiati L, Livraghi T, Tanabe K K, Hahn P F and Mueller P R 1998 Ablation of livertumors using percutaneous RF therapy AJR Am. J. Roentgenol. 170 1023–8
Greenleaf J F, Fatemi M and Insana M 2003 Selected methods for imaging elastic properties of biological tissuesAnnu. Rev. Biomed. Eng. 5 57–78
Hall T J 2003 AAPM/RSNA physics tutorial for residents: topics in US: beyond the basics: elasticity imaging withUS Radiographics 23 1657–71
Hyodoh H, Hyodoh K, Takahashi K, Furuse M, Kawamoto C, Isoda N, Hozumi M, Ido K and Hirota N 1998 Microwavecoagulation therapy on hepatomas: CT and MR appearance after therapy J. Magn. Reson. Imaging 8 451–8
Jeffrey S S, Birdwell R L, Ikeda D M, Daniel B L, Nowels K W, Dirbas F M and Griffey S M 1999 Radiofrequencyablation of breast cancer: first report of an emerging technology Arch. Surg. 134 1064–8
Jiang J and Hall T 2009 A generalized speckle tracking algorithm for ultrasonic strain imaging using dynamicprogramming Ultrasound Med. Biol. 35 1863–79
Jiang J, Hall T J and Sommer A M 2006 A novel performance descriptor for ultrasonic strain imaging: a preliminarystudy IEEE Trans. Ultrason. Ferroelectr. Freq. Control 53 1088–102
Ultrasound-based relative elastic modulus imaging for evaluating ablation therapy 2305
Jiang J, Varghese T, Brace C, Madsen E, Hall T, Bharat S, Hobson M, Zagzebski J and Lee F Jr 2009 Young’smodulus reconstruction for radio-frequency ablation electrode-induced displacement fields: a feasibility studyIEEE Trans. Med. Imaging 28 1325–34
Jiang J, Varghese T, Chen Q, Hall T J and Zagzebski J A 2007 Finite element analysis of tissue deformation with aradiofrequency ablation electrode for strain imaging IEEE Trans. Ultrason. Ferroelectr. Freq. Control 54 281–9
Kallel F and Bertrand M 1996 Tissue elasticity reconstruction using linear perturbation method IEEE Trans. Med.Imaging 15 299–313
Kallel F and Ophir J 1997 A least-squares strain estimator for elastography Ultrason. Imaging 19 195–208Kallel F, Stafford R J, Price R E, Righetti R, Ophir J and Hazle J D 1999 The feasibility of elastographic visualization
of HIFU-induced thermal lesions in soft tissues. Image-guided high-intensity focused ultrasound UltrasoundMed. Biol. 25 641–7
Kei S K, Rhim H, Choi D, Lee W J, Lim H K and Kim Y S 2008 Local tumor progression after radiofrequency ablationof liver tumors: analysis of morphologic pattern and site of recurrence AJR Am. J. Roentgenol. 190 1544–51
Kiss M Z, Varghese T and Hall T J 2004 Viscoelastic characterization of in vitro canine tissue Phys. Med.Biol. 49 4207–18
Laeseke P F, Sampson L A, Frey T M, Mukherjee R, Winter T C III, Lee F T Jr and Brace C L 2007 Multiple-electroderadiofrequency ablation: comparison with a conventional cluster electrode in an in vivo porcine kidney modelJ. Vasc. Interv. Radiol. 18 1005–10
Lazebnik R S, Lancaster T L, Breen M S, Lewin J S and Wilson D L 2003 Volume registration using needle pathsand point landmarks for evaluation of interventional MRI treatments IEEE Trans. Med. Imaging 22 653–60
Lencioni R, Cioni D, Crocetti L, Franchini C, Pina C D, Lera J and Bartolozzi C 2005 Early-stage hepatocellularcarcinoma in patients with cirrhosis: long-term results of percutaneous image-guided radiofrequency ablationRadiology 234 961–7
Liang P, Dong B, Yu X, Yu D, Wang Y, Feng L and Xiao Q 2005 Prognostic factors for survival in patients withhepatocellular carcinoma after percutaneous microwave ablation Radiology 235 299–307
Liu W, Techavipoo U, Varghese T, Zagzebski J A, Chen Q and Lee F T Jr 2004 Elastographic versus x-ray CTimaging of radio frequency ablation coagulations: an in vitro study Med. Phys. 31 1322–32
Lu M D, Xu H X, Xie X Y, Yin X Y, Chen J W, Kuang M, Xu Z F, Liu G J and Zheng Y L 2005 Percutaneousmicrowave and radiofrequency ablation for hepatocellular carcinoma: a retrospective comparative studyJ. Gastroenterol. 40 1054–60
Mikami T, Takahashi A, Hashi K, Gasa S and Houkin K 2004 Performance of bipolar forceps during coagulation andits dependence on the tip material: a quantitative experimental assay. Technical note J. Neurosurg. 100 133–8
Montgomery R S, Rahal A, Dodd G D III, Leyendecker J R and Hubbard L G 2004 Radiofrequency ablation ofhepatic tumors: variability of lesion size using a single ablation device AJR Am. J. Roentgenol. 182 657–61
Nakazawa T, Kokubu S, Shibuya A, Ono K, Watanabe M, Hidaka H, Tsuchihashi T and Saigenji K 2007Radiofrequency ablation of hepatocellular carcinoma: correlation between local tumor progression after ablationand ablative margin Am. J. Roentgenol. 188 480–8
Nguyen C L, Scott W J, Young N A, Rader T, Giles L R and Goldberg M 2005 Radiofrequency ablation of primarylung cancer: results from an ablate and resect pilot study Chest 128 3507–11
Oberai A A, Gokhale N H, Doyley M M and Bamber J C 2004 Evaluation of the adjoint equation based algorithmfor elasticity imaging Phys. Med. Biol. 49 2955–74
Oberai A A, Gokhale N H, Goenezen S, Barbone P E, Hall T J, Sommer A M and Jiang J 2009 Linear and nonlinearelasticity imaging of soft tissue in vivo: demonstration of feasibility Phys. Med. Biol. 54 1191–207
Ophir J, Alam S K, Garra B, Kallel F, Konofagou E, Krouskop T and Varghese T 1999 Elastography: ultrasonicestimation and imaging of the elastic properties of tissues Proc. Inst. Mech. Eng. H 213 203–33
Ophir J, Cespedes I, Ponnekanti H, Yazdi Y and Li X 1991 Elastography: a quantitative method for imaging theelasticity of biological tissues Ultrason. Imaging 13 111–34
Pareek G, Wilkinson E R, Bharat S, Varghese T, Laeseke P F, Lee F T Jr, Warner T F, Zagzebski J Aand Nakada S Y 2006 Elastographic measurements of in-vivo radiofrequency ablation lesions of the kidneyJ. Endourol. 20 959–64
Pilatou M C, Stewart E A, Maier S E, Fennessy F M, Hynynen K, Tempany C M and McDannold N 2009 MRI-based thermal dosimetry and diffusion-weighted imaging of MRI-guided focused ultrasound thermal ablationof uterine fibroids J. Magn. Reson. Imaging 29 404–11
Ponnekanti H, Ophir J, Huang Y and Cespedes I 1995 Fundamental mechanical limitations on the visualization ofelasticity contrast in elastography Ultrasound Med. Biol. 21 533–43
Rogowitz B E and Treinish L A 2005 Why should engineers and scientists be worried about color? Technical Report(New York: IBM Thomas J Watson Research Center)
2306 J Jiang et al
Rosenthal D I, Hornicek F J, Wolfe M W, Jennings L C, Gebhardt M C and Mankin H J 1998 Percutaneousradiofrequency coagulation of osteoid osteoma compared with operative treatment J. Bone Joint Surg. Am.80 815–21
Sato M, Watanabe Y, Ueda S, Iseki S, Abe Y, Sato N, Kimura S, Okubo K and Onji M 1996 Microwave coagulationtherapy for hepatocellular carcinoma Gastroenterology 110 1507–14
Siperstein A E, Rogers S J, Hansen P D and Gitomirsky A 1997 Laparoscopic thermal ablation of hepaticneuroendocrine tumor metastases Surgery 122 1147–54 discussion 54–5
Solbiati L et al 1997 Percutaneous US-guided radio-frequency tissue ablation of liver metastases: treatment andfollow-up in 16 patients Radiology 202 195–203
Solbiati L, Ierace T, Tonolini M and Cova L 2004 Guidance and monitoring of radiofrequency liver tumor ablationwith contrast-enhanced ultrasound Eur. J. Radiol. 51 S19–23
Song X, Pogue B W, Jiang S, Doyley M M, Dehghani H, Tosteson T D and Paulsen K D 2004 Automated regiondetection based on the contrast-to-noise ratio in near-infrared tomography Appl. Opt. 43 1053–62
Stern J M, Merritt M E, Zeltser I, Raman J D and Cadeddu J A 2008 Phase one pilot study using magnetic resonancespectroscopy to predict the histology of radiofrequency-ablated renal tissue Eur. Urol. 55 433–40
Varghese T, Bilgen M and Ophir J 2001 Phase aberration effects in elastography Ultrasound Med. Biol. 27 819–27Varghese T, Zagzebski J A and Lee F T Jr 2002 Elastographic imaging of thermal lesions in the liver in vivo following
radiofrequency ablation: preliminary results Ultrasound Med. Biol. 28 1467–73Vogel C R 2002 Computational Methods for Inverse Problems (Philadelphia, PA: SIAM)Wacker F K, Nour S G, Eisenberg R, Duerk J L and Lewin J S 2004 MRI-guided radiofrequency thermal ablation of
normal lung tissue: in vivo study in a rabbit model AJR Am. J. Roentgenol. 183 599–603Weidensteiner C, Quesson B, Caire-Gana B, Kerioui N, Rullier A, Trillaud H and Moonen C T 2003 Real-time MR
temperature mapping of rabbit liver in vivo during thermal ablation Magn. Reson. Med. 50 322–30White D C and D’Amico T A 2008 Radiofrequency ablation for primary lung cancer and pulmonary metastases Clin.
Lung Cancer 9 16–23Wolf F J, Grand D J, Machan J T, Dipetrillo T A, Mayo-Smith W W and Dupuy D E 2008 Microwave ablation of
lung malignancies: effectiveness, CT findings, and safety in 50 patients Radiology 247 871–9Yeh W C, Li P C, Jeng Y M, Hsu H C, Kuo P L, Li M L, Yang P M and Lee P H 2002 Elastic modulus measurements
of human liver and correlation with pathology Ultrasound Med. Biol. 28 467–74Zagoria R J, Traver M A, Werle D M, Perini M, Hayasaka S and Clark P E 2007 Oncologic efficacy of CT-guided
percutaneous radiofrequency ablation of renal cell carcinomas AJR Am. J. Roentgenol. 189 429–36Zhang M, Castaneda B, Christensen J, Saad W, Bylund B, Hoyt K, Strang J G, Rubens D J and Parker K J 2008
Real-time sonoelastography of hepatic thermal lesions in a swine model Med. Phys. 35 4132Zhu Y, Hall T J and Jiang J 2003 A finite-element approach for Young’s modulus reconstruction IEEE Trans. Med.
Imaging 22 890–901