ultra-supercritical pressure cfb boiler conceptual design study
TRANSCRIPT
ULTRA-SUPERCRITICAL PRESSURE CFB BOILER
CONCEPTUAL DESIGN STUDY
FINAL REPORT
Prepared by:
Zhen Fan Steve Goidich
Archie Robertson Song Wu
Issued September 2006
Work Performed Under U.S. Department of Energy
Cooperative Agreement No. DE-FC26-03NT41737
Foster Wheeler North America Corp. 12 Peach Tree Hill Road
Livingston, NJ 07039
ii
Disclaimer
"This report was prepared as an account of work sponsored by an agency of the United States Government. Neither the United States Government nor any agency thereof, nor any of their employees, makes any warranty, express or implied, or assumes any legal liability or responsibility for the accuracy, completeness, or usefulness of any information, apparatus, product, or process disclosed, or represents that its use would not infringe upon privately owned rights. Reference herein to any specific commercial product, process, or service by trade name, trademark, manufacturer, or otherwise does not necessarily constitute or imply its endorsement by the United States Government or any agency thereof. The views and opinions of authors expressed herein do not necessarily state or reflect those of the United States Government or any agency thereof."
Neither the author, nor any affiliate, nor any of their employees, makes any warranty, express or implied, or assumes any legal liability or responsibility including, but not limited to, in regard to the accuracy, completeness, or usefulness of any information, apparatus, product, or process disclosed, or represents that its use would not infringe upon privately owned rights whether such liability or responsibility is of a direct, indirect, special, punitive, incidental, consequential, or other nature and whether arising in contract, warranty, tort including negligence, strict liability, or other legal theory. Utilization of this information is with the above understanding.
iii
Abstract Electric utility interest in supercritical pressure steam cycles has revived in the United States after waning in the 1980s. Since supercritical cycles yield higher plant efficiencies than subcritical plants along with a proportional reduction in traditional stack gas pollutants and CO2 release rates, the interest is to pursue even more advanced steam conditions. The advantages of supercritical (SC) and ultra supercritical (USC) pressure steam conditions have been demonstrated in the high gas temperature, high heat flux environment of large pulverized coal-fired (PC) boilers. Interest in circulating fluidized bed (CFB) combustion, as an alternative to PC combustion, has been steadily increasing. Although CFB boilers as large as 300 MWe are now in operation, they are drum type, subcritical pressure units. With their sizes being much smaller than and their combustion temperatures much lower than those of PC boilers (~300 MWe versus 1,000 MWe and ~1600ºF versus 3500ºF), a conceptual design study was conducted herein to investigate the technical feasibility and economics of USC CFB boilers. The conceptual study was conducted at 400 MWe and 800 MWe nominal plant sizes with high sulfur Illinois No. 6 coal used as the fuel. The USC CFB plants had higher heating value efficiencies of 40.6 and 41.3 percent respectively and their CFB boilers, which reflect conventional design practices, can be built without the need for an R&D effort. Assuming construction at a generic Ohio River Valley site with union labor, total plant costs in January 2006 dollars were estimated to be $1,551/kW and $1,244/kW with costs of electricity of $52.21/MWhr and $44.08/MWhr, respectively. Based on the above, this study has shown that large USC CFB boilers are feasible and that they can operate with performance and costs that are competitive with comparable USC PC boilers.
iv
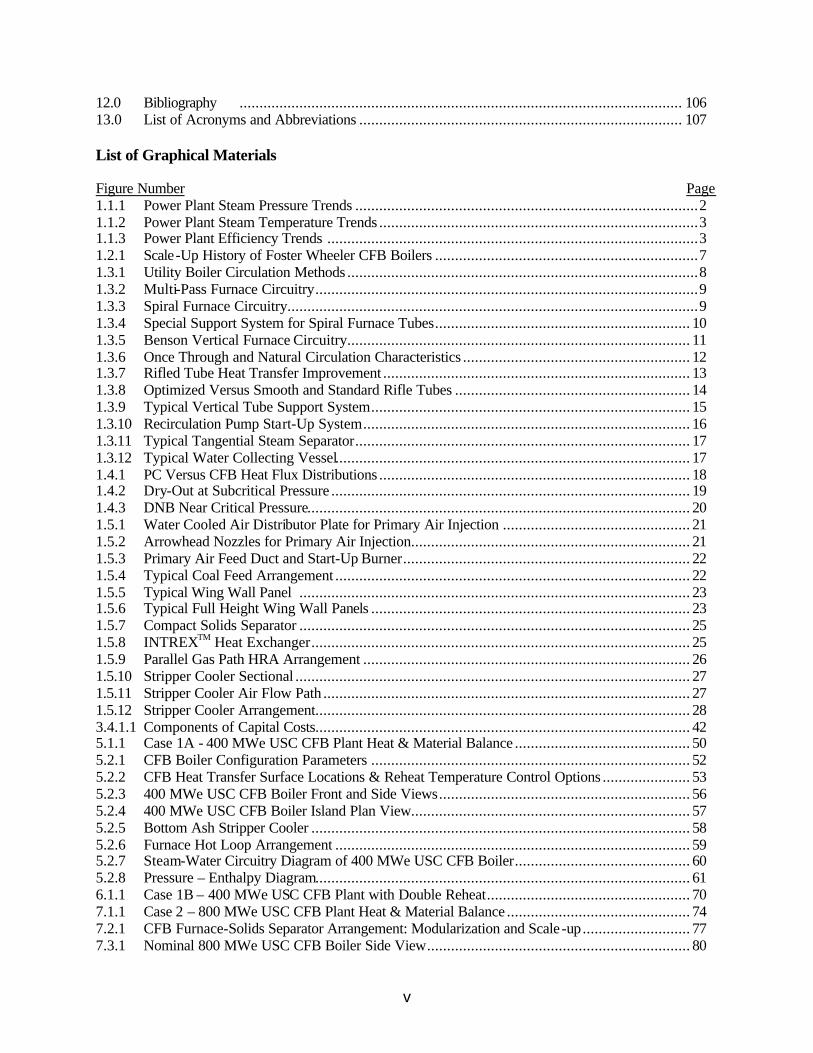
Table of Contents Section Page 1.0 Introduction ...................................................................................................................1 1.1 Supercritical Pressure Pulverized Coal-Fired Boiler Technology.................................1 1.2 Circulating Fluidized Bed Boiler Technology Overview.............................................5 1.3 Once-Through Boiler Technology.............................................................................8 1.4 Benson Optimized Rifling Not Required by CFB Boile rs ......................................... 17 1.5 Typical CFB Boiler Design Features....................................................................... 20 2.0 Executive Summary........................................................................................................... 30 3.0 Proposed Program / Economic and Costing Methodology .................................................... 33
3.1 General Approach.................................................................................................. 33 3.2 Economic Factors.................................................................................................. 37 3.3 Cost Estimate Basis and Assumptions ..................................................................... 37 3.4 Cost Elements ....................................................................................................... 40
3.4.1 Capital Costs ............................................................................................. 40 3.4.2 Bare Erected Cost...................................................................................... 40 3.4.3 Total Plant Cost......................................................................................... 40 3.4.4 Total Plant Investment ............................................................................... 40 3.4.5 Total Capital Requirement.......................................................................... 41 3.4.6 Capital Cost Estimate Exclusions ................................................................ 42 3.4.7 Operating and Maintenance Costs............................................................... 43 3.4.8 Consumable Costs ..................................................................................... 43 3.4.9 Fuel Cost .................................................................................................. 44 3.4.10 Total Production Cost ................................................................................ 44 3.4.11 Carrying Charge ........................................................................................ 44 3.4.12 Cost of Electricity...................................................................................... 45
4.0 Experimental / General Basis for USC CFB Design Study.................................................... 45 4.1 Plant Site Conditions ............................................................................................. 45 4.2 Coal and Limestone ............................................................................................... 46 4.3 Nominal Plant Sizes and Steam Cycle Conditions .................................................... 47 5.0 400 MWe USC CFB Boiler with Single Reheat (Case 1A)................................................... 48 5.1 Plant Performance and Emissions ........................................................................... 48 5.2 CFB Boiler Conceptual Design............................................................................... 52 5.3 Balance of Plant Systems ....................................................................................... 62 5.4 Plant Cost and Economics ...................................................................................... 66 6.0 400 MWe USC CFB Boiler with Double Reheat (Case 1B).................................................. 69 6.1 Plant Performance ................................................................................................. 69 7.0 800 MWe USC CFB Boiler (Case 2)................................................................................... 72 7.1 Plant Performance and Emissions .......................................................................... 72 7.2 Scale-Up Considerations ........................................................................................ 76 7.3 CFB Boiler Conceptual Design............................................................................... 78 7.4 Balance of Plant Systems ....................................................................................... 88 7.5 Plant Cost and Economics ...................................................................................... 88 8.0 800 MWe Advanced USC CFB Boiler (Case 3)................................................................... 92
8.1 CFB Steam Temperatures for the Future ................................................................. 92 8.2 Plant Performance and Emissions ........................................................................... 92 8.3 CFB Boiler Conceptual Design............................................................................... 96
9.0 Results and Discussion..................................................................................................... 101 10.0 Conclusions ............................................................................................................... 105 11.0 References ............................................................................................................... 106
v
12.0 Bibliography ............................................................................................................... 106 13.0 List of Acronyms and Abbreviations ................................................................................. 107 List of Graphical Materials Figure Number Page 1.1.1 Power Plant Steam Pressure Trends ......................................................................................2 1.1.2 Power Plant Steam Temperature Trends ................................................................................3 1.1.3 Power Plant Efficiency Trends .............................................................................................3 1.2.1 Scale-Up History of Foster Wheeler CFB Boilers ..................................................................7 1.3.1 Utility Boiler Circulation Methods ........................................................................................8 1.3.2 Multi-Pass Furnace Circuitry................................................................................................9 1.3.3 Spiral Furnace Circuitry.......................................................................................................9 1.3.4 Special Support System for Spiral Furnace Tubes................................................................ 10 1.3.5 Benson Vertical Furnace Circuitry...................................................................................... 11 1.3.6 Once Through and Natural Circulation Characteristics ......................................................... 12 1.3.7 Rifled Tube Heat Transfer Improvement ............................................................................. 13 1.3.8 Optimized Versus Smooth and Standard Rifle Tubes ........................................................... 14 1.3.9 Typical Vertical Tube Support System................................................................................ 15 1.3.10 Recirculation Pump Start-Up System.................................................................................. 16 1.3.11 Typical Tangential Steam Separator.................................................................................... 17 1.3.12 Typical Water Collecting Vessel......................................................................................... 17 1.4.1 PC Versus CFB Heat Flux Distributions .............................................................................. 18 1.4.2 Dry-Out at Subcritical Pressure .......................................................................................... 19 1.4.3 DNB Near Critical Pressure................................................................................................ 20 1.5.1 Water Cooled Air Distributor Plate for Primary Air Injection ............................................... 21 1.5.2 Arrowhead Nozzles for Primary Air Injection...................................................................... 21 1.5.3 Primary Air Feed Duct and Start-Up Burner........................................................................ 22 1.5.4 Typical Coal Feed Arrangement ......................................................................................... 22 1.5.5 Typical Wing Wall Panel .................................................................................................. 23 1.5.6 Typical Full Height Wing Wall Panels ................................................................................ 23 1.5.7 Compact Solids Separator .................................................................................................. 25 1.5.8 INTREXTM Heat Exchanger............................................................................................... 25 1.5.9 Parallel Gas Path HRA Arrangement .................................................................................. 26 1.5.10 Stripper Cooler Sectional ................................................................................................... 27 1.5.11 Stripper Cooler Air Flow Path ............................................................................................ 27 1.5.12 Stripper Cooler Arrangement.............................................................................................. 28 3.4.1.1 Components of Capital Costs.............................................................................................. 42 5.1.1 Case 1A - 400 MWe USC CFB Plant Heat & Material Balance ............................................ 50 5.2.1 CFB Boiler Configuration Parameters ................................................................................ 52 5.2.2 CFB Heat Transfer Surface Locations & Reheat Temperature Control Options ...................... 53 5.2.3 400 MWe USC CFB Boiler Front and Side Views............................................................... 56 5.2.4 400 MWe USC CFB Boiler Island Plan View...................................................................... 57 5.2.5 Bottom Ash Stripper Cooler ............................................................................................... 58 5.2.6 Furnace Hot Loop Arrangement ......................................................................................... 59 5.2.7 Steam-Water Circuitry Diagram of 400 MWe USC CFB Boiler............................................ 60 5.2.8 Pressure – Enthalpy Diagram.............................................................................................. 61 6.1.1 Case 1B – 400 MWe USC CFB Plant with Double Reheat................................................... 70 7.1.1 Case 2 – 800 MWe USC CFB Plant Heat & Material Balance .............................................. 74 7.2.1 CFB Furnace-Solids Separator Arrangement: Modularization and Scale -up........................... 77 7.3.1 Nominal 800 MWe USC CFB Boiler Side View.................................................................. 80
vi
7.3.2 Nominal 800 MWe USC CFB Boiler Front View ................................................................ 81 7.3.3 Nominal 800 MWe USC CFB Boiler Plan View.................................................................. 82 7.3.4 Furnace Wall Heat Flux Profile .......................................................................................... 83 7.3.5 Furnace Centerline Oxygen Profile ..................................................................................... 83 7.3.6 Cascading INTREXTM Arrangement ................................................................................... 85 7.3.7 Furnace Wall Openings for INTREXTM............................................................................... 85 7.3.8 Furnace Temperature Profile .............................................................................................. 85 7.3.9 INTREXTM Duty Change with Internal Solids Circulation ................................................... 86 7.3.10 Steam-Water Circuitry of 800 MWe USC CFB Boiler ......................................................... 86 8.1.1 Comparison of PC and CFB Furnace Exit Gas Temperatures................................................ 92 8.2.1 Case 3 – 800 MWe Advanced USC CFB Plant Heat & Material Balance .............................. 94 8.3.1 PC Finishing SH Location .................................................................................................. 96 8.3.2 CFB Convection SH Location ............................................................................................ 96 8.3.3 Front View of 800 MWe Advanced USC CFB Boiler .......................................................... 98 8.3.4 Side View of 800 MWe Advanced USC CFB Boiler............................................................ 99 8.3.5 Case 2 to 3 Duty Distribution Shift ................................................................................... 100 8.3.6 40 Percent Load Duty Comparison ................................................................................... 100 Table Number Page 1.1.1 Recent Supercritical Pressure PC Boilers...............................................................................5 2.1 USC CFB Boiler Plant Performance and Economics ............................................................ 31 3.2.1 Unit Costs and Escalation................................................................................................... 38 3.2.2 Financial Assumptions ....................................................................................................... 39 3.4.8.1 Consumable Unit Costs...................................................................................................... 44 4.1.1 Site Characteristics ............................................................................................................ 46 4.2.1 Illinois No 6 Coal Analysis ................................................................................................ 47 4.2.2 Limestone Analysis ........................................................................................................... 47 4.3.1 Study Steam Cycle Conditions ........................................................................................... 48 5.1.1 400 MWe Plant Performance and Auxiliary Power Consumption.......................................... 51 5.1.2 Emissions of 400 MWe Single Reheat USC CFB Plant ........................................................ 52 5.2.1 400 MWe USC CFB Boiler Operating Conditions ............................................................... 54 5.2.2 Comparison of CFB Furnace Dimensions ............................................................................ 55 5.2.3 Comparison of CFB INTREXTM Heat Exchangers............................................................... 55 5.2.4 Pressure Part Materials for 400 MWe USC CFB Boiler........................................................ 62 5.4.1 Total Plant Cost Summary – Nominal 400 MWe USC CFB Boiler Plant ............................... 67 5.4.2 Capital Investment & Revenue Requirement Summary – Nominal 400 MWe USC CFB Boiler Plant .....68 6.1.1 Double Reheat 400 MWe Plant Performance ...................................................................... 71 6.1.2 Double Reheat 400 MWe USC CFB Plant Emissions ........................................................... 72 7.1.1 Nominal 800 MWe USC CFB Plant Performance ................................................................ 75 7.1.2 Nominal 800 MWe USC CFB Plant Emissions .................................................................... 76 7.3.1 Nominal 800 MWe CFB Boiler Operating Conditions.......................................................... 79 7.3.2 CFB Furnace Dimension Comparison ................................................................................. 79 7.3.3 CFB INTREXTM Heat Exchanger Comparison..................................................................... 84 7.3.4 Pressure Part Materials for 800 MWe USC CFB Boiler........................................................ 87 7.5.1 Total Plant Cost Summary – Nominal 800 MWe USC CFB Boiler ...................................... 90 7.5.2 Capital Investment & Revenue Requirement Summary – Nominal 800 MWe USC CFB Boiler Plant ... 91 8.2.1 Advanced USC 800 MWe CFB Plant Performance .............................................................. 95 8.2.2 Advanced USC 800 MWe CFB Plant Emissions .................................................................. 96 8.3.1 Advanced USC 800 MWe CFB Boiler Operating Conditions ............................................... 97 9.1 Supercritical CFB Boiler Plant Performance and Economics .............................................. 104
1
1.0 Introduction Coal is the largest source of fuel for electric power generation and it provides approximately 38 percent of the energy consumed in power plants worldwide. With the largest share of the world’s recoverable coal reserves, the United States (US) generates over half of its electricity from coal. Coal is expected to remain the dominant fuel for power generation in the US for decades to come, not only because of its low and stable price, but also because energy diversity is a crucial and fundamental national security need. Today’s coal based power generation technologies, however, must prove their market competitiveness and gain public acceptance in a changing environment that entails:
• Deregulation and privatization that are transforming the electrical utilities from a regulated industry to a “bottom line” business keenly focused on costs and risks;
• Steady growth in electricity demand; • Volatility in natural gas price; • Concerns of ozone, particulate matter and trace metal pollution have led to drastically
tightened NOx and SO2 emission limits and utility mercury emission regulation; • Current and anticipated requirements for reductions in CO2 emissions or CO2 intensity.
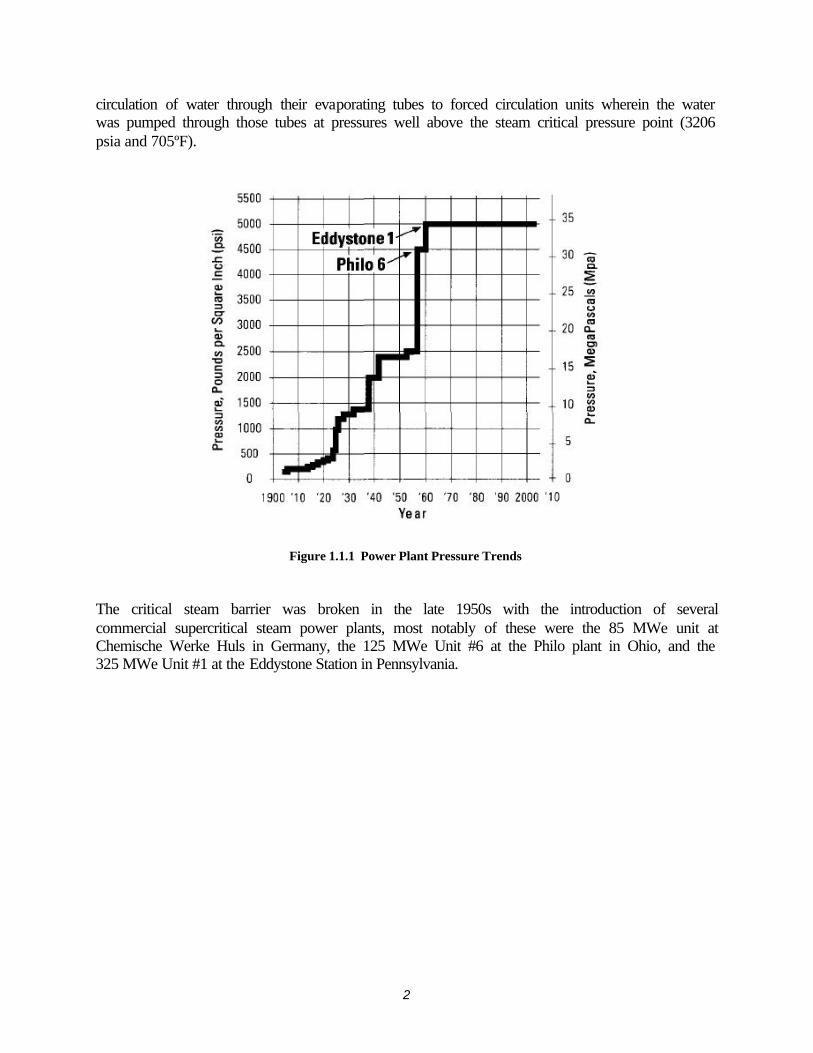
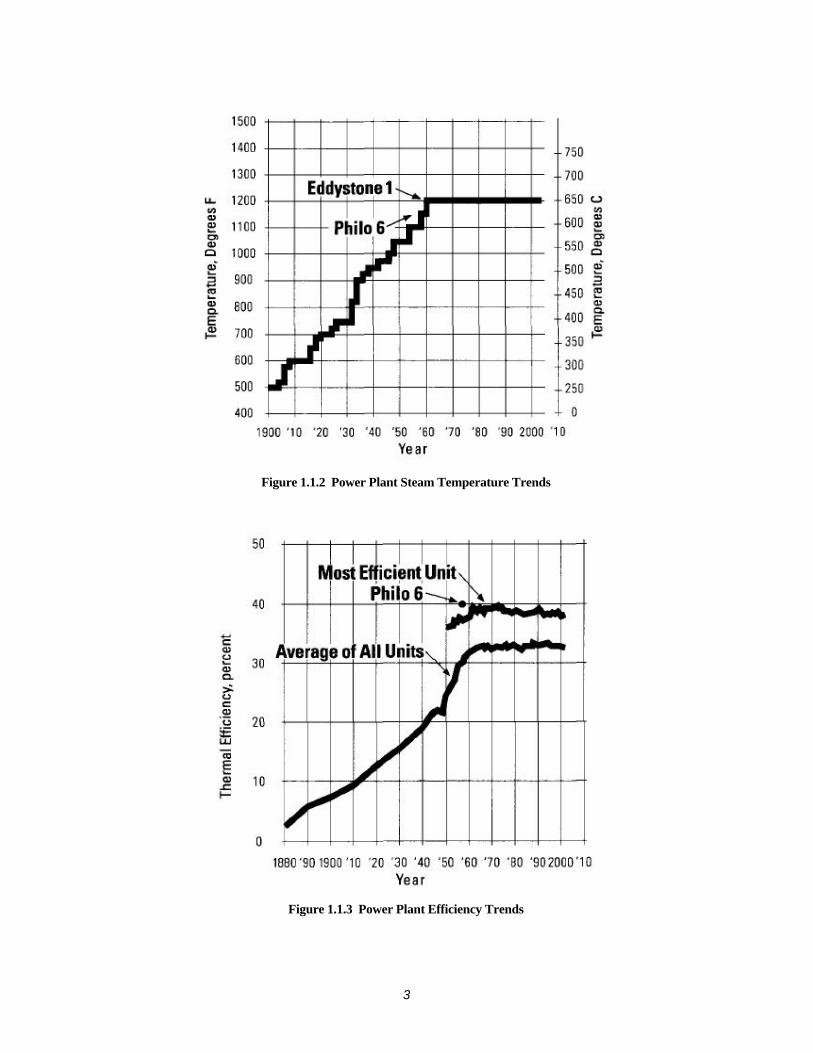
SO2 and NOx emission credits are tradable commodities in the US. The mercury rule issued by the US Environmental Protection Agency, and the likely future CO2 regulations, will be of the cap and trade type. In addition, the new emission limits also tend to be based on electric output rather than heat input. Because of the new regulatory trends, emission performance is now directly linked to plant efficiency and generation cost. Today’s utility industry is expecting new generation technologies to have low cost, high efficiency, high reliability, and good fuel flexibility while complying with future environmental regulations, including mercury and CO2. Circulating fluidized bed (CFB) boilers with ultra-supercritical (USC) steam conditions have the potential to meet the above requirements and to become a preferred coal-based power generation technology. The objective of this conceptual design study is to evaluate the feasibility of USC CFB boilers for large-scale power generation and identify any technical obstacles impeding their deployment. 1.1 Supercritical Pressure Pulverized Coal-Fired Boiler Technology The Rankine cycle used by pulverized coal-fired (PC) power plants has been the dominant method for electricity generation through the last century. As steam cycle/boiler outlet conditions have steadily advanced to higher pressures and temperatures, plant efficiencies and economics have likewise improved. As shown in Figures 1.1.1 through 1.1.3 extracted from [1-1], by 1950 Rankine cycle based steam power plants had reached steam conditions comparable to that of today’s typical, sub-critical pressure power plants (2400 psig and 1000ºF). These plants had net efficiencies in the low 30s and further gains were achieved by moving from sub-critical to supercritical pressure steam conditions. As a result, boilers changed from drum type units that relied on the natural
2
circulation of water through their evaporating tubes to forced circulation units wherein the water was pumped through those tubes at pressures well above the steam critical pressure point (3206 psia and 705ºF).
Figure 1.1.1 Power Plant Pressure Trends
The critical steam barrier was broken in the late 1950s with the introduction of several commercial supercritical steam power plants, most notably of these were the 85 MWe unit at Chemische Werke Huls in Germany, the 125 MWe Unit #6 at the Philo plant in Ohio, and the 325 MWe Unit #1 at the Eddystone Station in Pennsylvania.
3
Figure 1.1.2 Power Plant Steam Temperature Trends
Figure 1.1.3 Power Plant Efficiency Trends
4
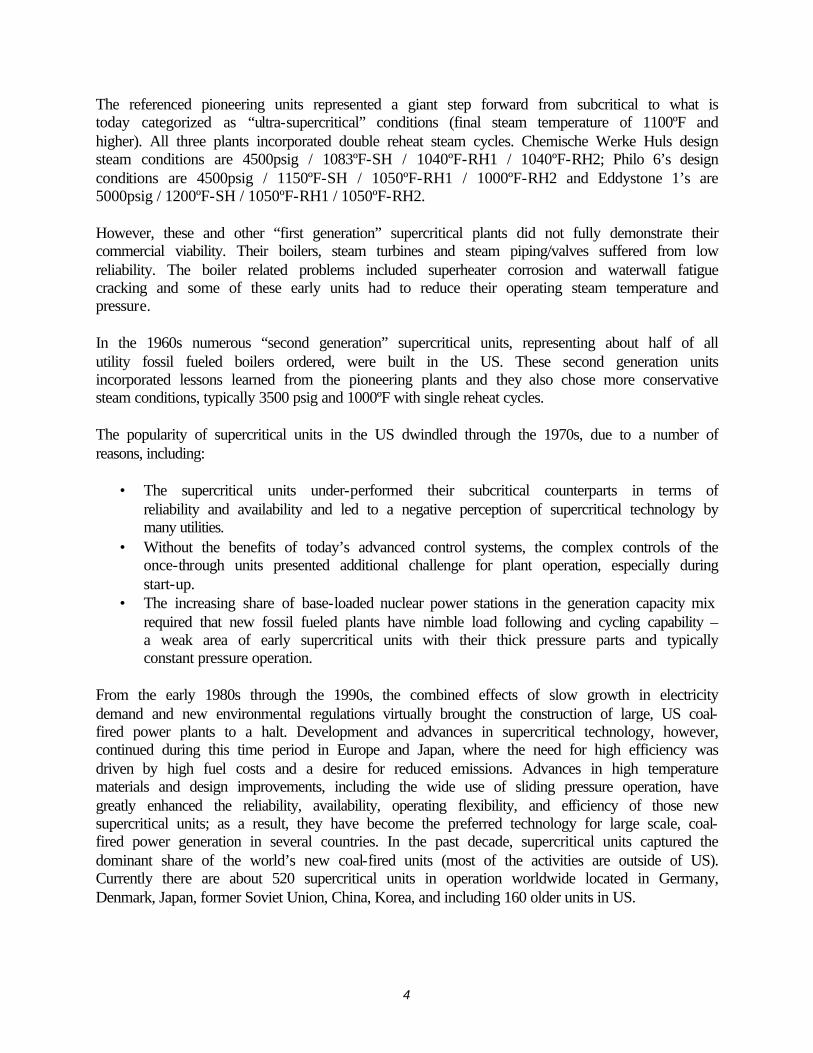
The referenced pioneering units represented a giant step forward from subcritical to what is today categorized as “ultra-supercritical” conditions (final steam temperature of 1100ºF and higher). All three plants incorporated double reheat steam cycles. Chemische Werke Huls design steam conditions are 4500psig / 1083ºF-SH / 1040ºF-RH1 / 1040ºF-RH2; Philo 6’s design conditions are 4500psig / 1150ºF-SH / 1050ºF-RH1 / 1000ºF-RH2 and Eddystone 1’s are 5000psig / 1200ºF-SH / 1050ºF-RH1 / 1050ºF-RH2. However, these and other “first generation” supercritical plants did not fully demonstrate their commercial viability. Their boilers, steam turbines and steam piping/valves suffered from low reliability. The boiler related problems included superheater corrosion and waterwall fatigue cracking and some of these early units had to reduce their operating steam temperature and pressure. In the 1960s numerous “second generation” supercritical units, representing about half of all utility fossil fueled boilers ordered, were built in the US. These second generation units incorporated lessons learned from the pioneering plants and they also chose more conservative steam conditions, typically 3500 psig and 1000ºF with single reheat cycles. The popularity of supercritical units in the US dwindled through the 1970s, due to a number of reasons, including:
• The supercritical units under-performed their subcritical counterparts in terms of reliability and availability and led to a negative perception of supercritical technology by many utilities.
• Without the benefits of today’s advanced control systems, the complex controls of the once-through units presented additional challenge for plant operation, especially during start-up.
• The increasing share of base-loaded nuclear power stations in the generation capacity mix required that new fossil fueled plants have nimble load following and cycling capability – a weak area of early supercritical units with their thick pressure parts and typically constant pressure operation.
From the early 1980s through the 1990s, the combined effects of slow growth in electricity demand and new environmental regulations virtually brought the construction of large, US coal-fired power plants to a halt. Development and advances in supercritical technology, however, continued during this time period in Europe and Japan, where the need for high efficiency was driven by high fuel costs and a desire for reduced emissions. Advances in high temperature materials and design improvements, including the wide use of sliding pressure operation, have greatly enhanced the reliability, availability, operating flexibility, and efficiency of those new supercritical units; as a result, they have become the preferred technology for large scale, coal-fired power generation in several countries. In the past decade, supercritical units captured the dominant share of the world’s new coal-fired units (most of the activities are outside of US). Currently there are about 520 supercritical units in operation worldwide located in Germany, Denmark, Japan, former Soviet Union, China, Korea, and including 160 older units in US.
5
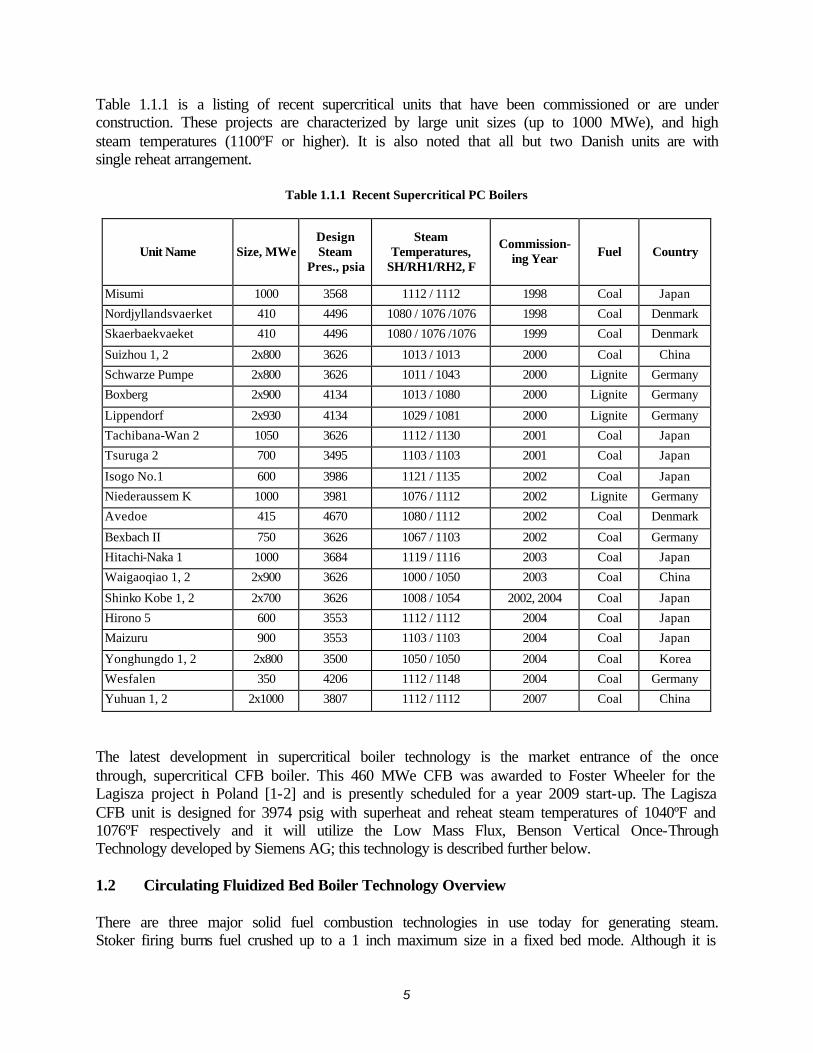
Table 1.1.1 is a listing of recent supercritical units that have been commissioned or are under construction. These projects are characterized by large unit sizes (up to 1000 MWe), and high steam temperatures (1100ºF or higher). It is also noted that all but two Danish units are with single reheat arrangement.
Table 1.1.1 Recent Supercritical PC Boilers
Unit Name Size, MWe Design Steam
Pres., psia
Steam Temperatures,
SH/RH1/RH2, F
Commission-ing Year Fuel Country
Misumi 1000 3568 1112 / 1112 1998 Coal Japan
Nordjyllandsvaerket 410 4496 1080 / 1076 /1076 1998 Coal Denmark
Skaerbaekvaeket 410 4496 1080 / 1076 /1076 1999 Coal Denmark
Suizhou 1, 2 2x800 3626 1013 / 1013 2000 Coal China
Schwarze Pumpe 2x800 3626 1011 / 1043 2000 Lignite Germany
Boxberg 2x900 4134 1013 / 1080 2000 Lignite Germany
Lippendorf 2x930 4134 1029 / 1081 2000 Lignite Germany
Tachibana-Wan 2 1050 3626 1112 / 1130 2001 Coal Japan
Tsuruga 2 700 3495 1103 / 1103 2001 Coal Japan
Isogo No.1 600 3986 1121 / 1135 2002 Coal Japan
Niederaussem K 1000 3981 1076 / 1112 2002 Lignite Germany
Avedoe 415 4670 1080 / 1112 2002 Coal Denmark
Bexbach II 750 3626 1067 / 1103 2002 Coal Germany
Hitachi-Naka 1 1000 3684 1119 / 1116 2003 Coal Japan
Waigaoqiao 1, 2 2x900 3626 1000 / 1050 2003 Coal China
Shinko Kobe 1, 2 2x700 3626 1008 / 1054 2002, 2004 Coal Japan
Hirono 5 600 3553 1112 / 1112 2004 Coal Japan
Maizuru 900 3553 1103 / 1103 2004 Coal Japan
Yonghungdo 1, 2 2x800 3500 1050 / 1050 2004 Coal Korea
Wesfalen 350 4206 1112 / 1148 2004 Coal Germany
Yuhuan 1, 2 2x1000 3807 1112 / 1112 2007 Coal China
The latest development in supercritical boiler technology is the market entrance of the once through, supercritical CFB boiler. This 460 MWe CFB was awarded to Foster Wheeler for the Lagisza project in Poland [1-2] and is presently scheduled for a year 2009 start-up. The Lagisza CFB unit is designed for 3974 psig with superheat and reheat steam temperatures of 1040ºF and 1076ºF respectively and it will utilize the Low Mass Flux, Benson Vertical Once-Through Technology developed by Siemens AG; this technology is described further below. 1.2 Circulating Fluidized Bed Boiler Technology Overview There are three major solid fuel combustion technologies in use today for generating steam. Stoker firing burns fuel crushed up to a 1 inch maximum size in a fixed bed mode. Although it is
6
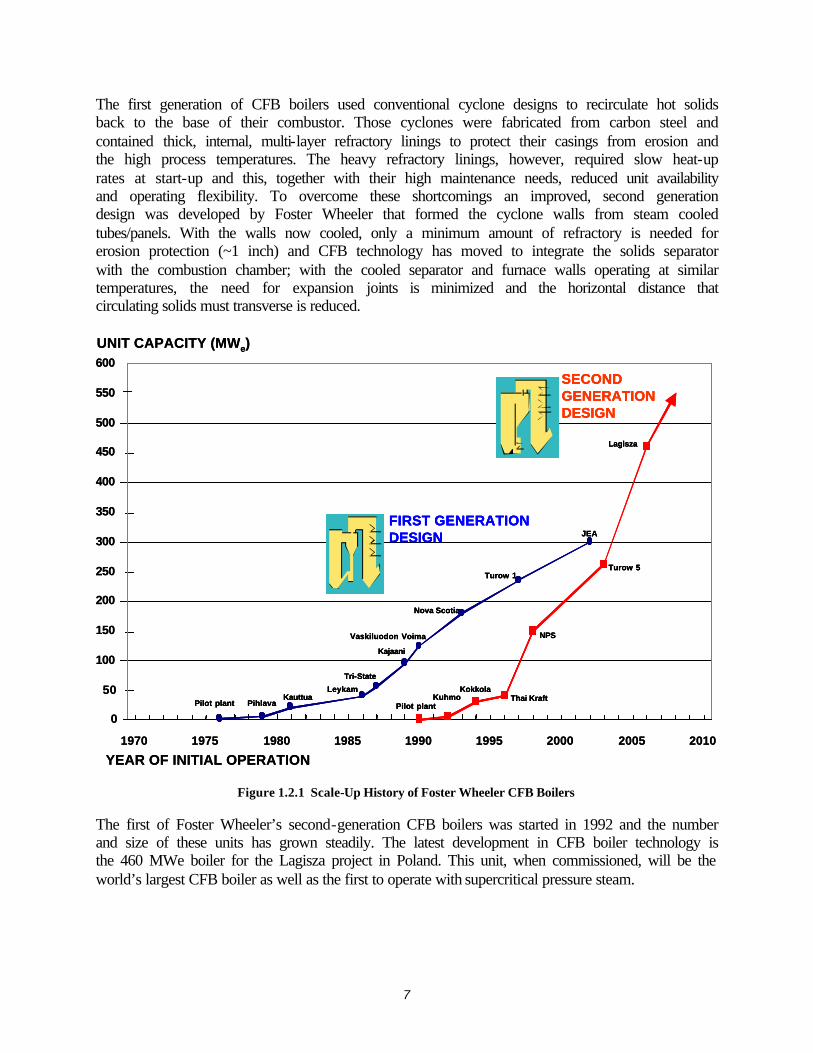
a traditional technology, it is no longer used for large power station boilers because of its low combustion efficiency. PC furnaces combust coal, crushed to a fine powder (typically 75 percent passing through a 200 mesh screen), as an air entrained mixture. PC combustion was first introduced in the 1800s, and in the 1920 to 1970 time period it gained and has maintained the dominant position for solids fuel power generation in the 100 MWe to 1300 MWe size range. CFB combustion technology has developed rapidly in the past three decades and is becoming an important technology for large-scale power generation. There are three important modes of fluidized bed operation, the bubbling fluidized bed (BFB), the CFB, and the fast fluidized bed. The bubbling bed operates at lower gas velocities, typically up to 6 feet per second, with the solids particles suspended by the drag of the up-flowing gas. This gas-solids suspension or “emulsion” forms the continuous phase known as the “bed” at the bottom of the reactor and any excess gas passes through the bed in the form of discrete, rising bubbles. In the fast bed mode, gas velocities are much higher, typically above 40 feet per second, and the reactor is filled with an entrained flow of solids and gas. A CFB boiler operates at a lower velocity, typically about 20 feet per second, and the lower velocity yields heavy solids back mixing (refluxing) in the form of clusters / strands of particles that constantly change shape. Although a CFB boiler employs the fast bed principle in the combustor, it also uses the bubbling bed mode for solids return, fluidized bed heat exchangers, and ash coolers. The bubbling bed was first used for coal combustion and steam generation. Development began during the 1960s in China, the United Kingdom, and US and, since then, hundreds of small BFB boilers have been built worldwide with capacities up to 180 MWe. As a power generation option, however, the BFB has been eclipsed by the CFB boiler as the latter offers superior combustion and emission performance, a more compact combustor size, and avoids the use of erosion-prone in-bed tubes. Today BFB boilers remain a niche product for relatively small size units burning biomass and other waste fuels with low heating value, low sulfur content, and high moisture content. Interest in CFB combustion started in the 1970s with development work being carried out by several different groups. A pilot plant was constructed at Foster Wheeler’s Karhula Research and Development Center in Finland (formerly Hans Ahlstrom Laboratory) in 1976 to develop CFB combustion technology and this effort led to the start-up of Foster Wheeler’s first commercial unit, rated at 15 MWt in 1979 at Pihlava Finland. Because of the CFB’s multi-fuel capability, low emissions, operating flexibility, and high reliability, there has been a steady progression to larger unit sizes. Figure 1.2.1 shows the scale-up history of Foster Wheeler’s CFB boilers and it is noted that over about a 30 year period there has been 60 fold increase in size e.g. from 5 MWe to 300 MWe. Excluding China (because of a lack of data) there are currently over 450 CFB boilers in operation worldwide. Foster Wheeler has supplied over 200 of these CFB units. Other major vendors include Alstom, Kvaerner, Lurgi, Babcock & Wilcox, and several domestic boiler companies in China. Today the largest CFB boilers in operation are the two 300 MWe boilers Foster Wheeler supplied to the Jacksonville Electric Authority (JEA) in Florida [1-3]. The rapid scale-up of CFB technology received important assistance from the US Government through a number of US DOE Clean Coal Demonstration Projects, including such milestones as the first 100 MWe class unit at Tri-State, and the first 300 MWe class units at Jacksonville.
7
The first generation of CFB boilers used conventional cyclone designs to recirculate hot solids back to the base of their combustor. Those cyclones were fabricated from carbon steel and contained thick, internal, multi-layer refractory linings to protect their casings from erosion and the high process temperatures. The heavy refractory linings, however, required slow heat-up rates at start-up and this, together with their high maintenance needs, reduced unit availability and operating flexibility. To overcome these shortcomings an improved, second generation design was developed by Foster Wheeler that formed the cyclone walls from steam cooled tubes/panels. With the walls now cooled, only a minimum amount of refractory is needed for erosion protection (~1 inch) and CFB technology has moved to integrate the solids separator with the combustion chamber; with the cooled separator and furnace walls operating at similar temperatures, the need for expansion joints is minimized and the horizontal distance that circulating solids must transverse is reduced.
YEAR OF INITIAL OPERATION
UNIT CAPACITY (MWe)
0
50
100
150
200
250
300
350
400
450
500
550
600
1970 1975 1980 1985 1990 1995 2000 2005 2010
Pilot plant Pihlava
Leykam
Tri-State
Kajaani
Kauttua
Vaskiluodon Voima
Nova Scotia
Pilot plantKuhmo
KokkolaThai Kraft
NPS
Turow 5
FIRST GENERATIONDESIGN
Turow 1
JEA
SECOND GENERATIONDESIGN
Lagisza
YEAR OF INITIAL OPERATION
UNIT CAPACITY (MWe)
0
50
100
150
200
250
300
350
400
450
500
550
600
1970 1975 1980 1985 1990 1995 2000 2005 2010
Pilot plant Pihlava
Leykam
Tri-State
Kajaani
KauttuaPilot plant Pihlava
Leykam
Tri-State
Kajaani
Kauttua
Vaskiluodon Voima
Nova Scotia
Vaskiluodon Voima
Nova Scotia
Pilot plantKuhmo
KokkolaThai Kraft
NPS
Pilot plantKuhmo
KokkolaThai Kraft
NPS
Turow 5Turow 5
FIRST GENERATIONDESIGN
Turow 1
JEAFIRST GENERATIONDESIGN
Turow 1
JEA
SECOND GENERATIONDESIGN
Lagisza
SECOND GENERATIONDESIGN
Lagisza
Figure 1.2.1 Scale-Up History of Foster Wheeler CFB Boilers
The first of Foster Wheeler’s second-generation CFB boilers was started in 1992 and the number and size of these units has grown steadily. The latest development in CFB boiler technology is the 460 MWe boiler for the Lagisza project in Poland. This unit, when commissioned, will be the world’s largest CFB boiler as well as the first to operate with supercritical pressure steam.
8
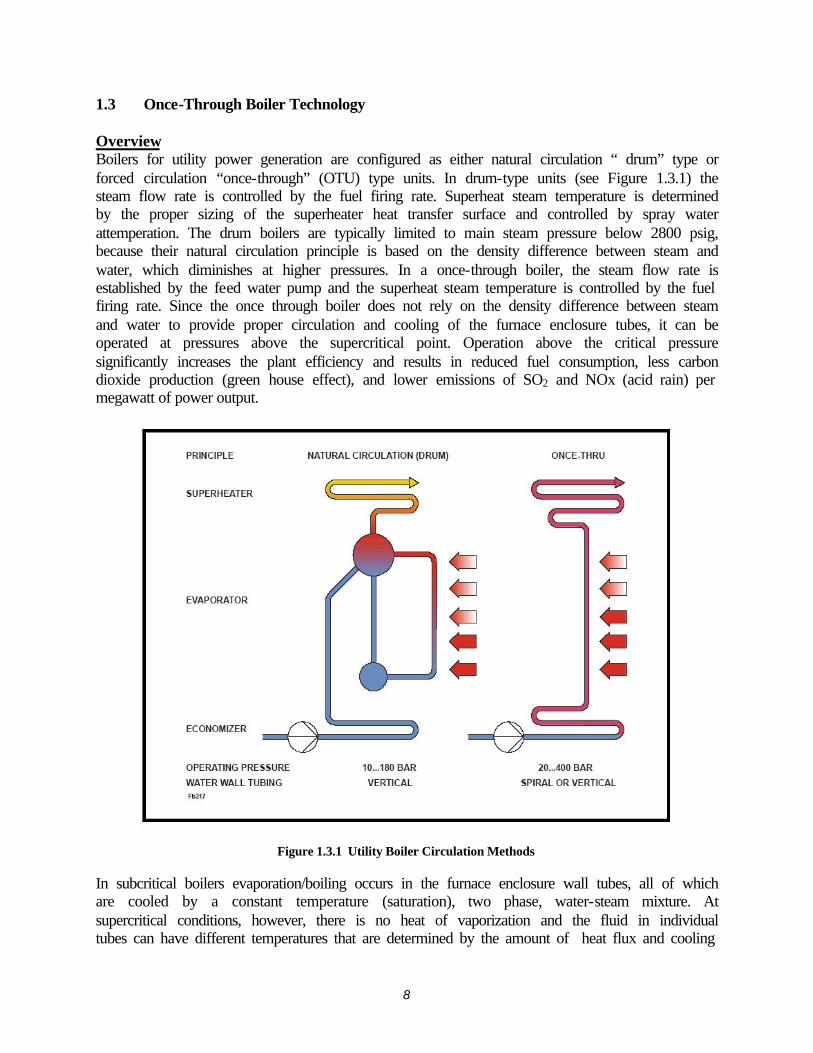
1.3 Once-Through Boiler Technology Overview Boilers for utility power generation are configured as either natural circulation “ drum” type or forced circulation “once-through” (OTU) type units. In drum-type units (see Figure 1.3.1) the steam flow rate is controlled by the fuel firing rate. Superheat steam temperature is determined by the proper sizing of the superheater heat transfer surface and controlled by spray water attemperation. The drum boilers are typically limited to main steam pressure below 2800 psig, because their natural circulation principle is based on the density difference between steam and water, which diminishes at higher pressures. In a once-through boiler, the steam flow rate is established by the feed water pump and the superheat steam temperature is controlled by the fuel firing rate. Since the once through boiler does not rely on the density difference between steam and water to provide proper circulation and cooling of the furnace enclosure tubes, it can be operated at pressures above the supercritical point. Operation above the critical pressure significantly increases the plant efficiency and results in reduced fuel consumption, less carbon dioxide production (green house effect), and lower emissions of SO2 and NOx (acid rain) per megawatt of power output.
Figure 1.3.1 Utility Boiler Circulation Methods
In subcritical boilers evaporation/boiling occurs in the furnace enclosure wall tubes, all of which are cooled by a constant temperature (saturation), two phase, water-steam mixture. At supercritical conditions, however, there is no heat of vaporization and the fluid in individual tubes can have different temperatures that are determined by the amount of heat flux and cooling
9
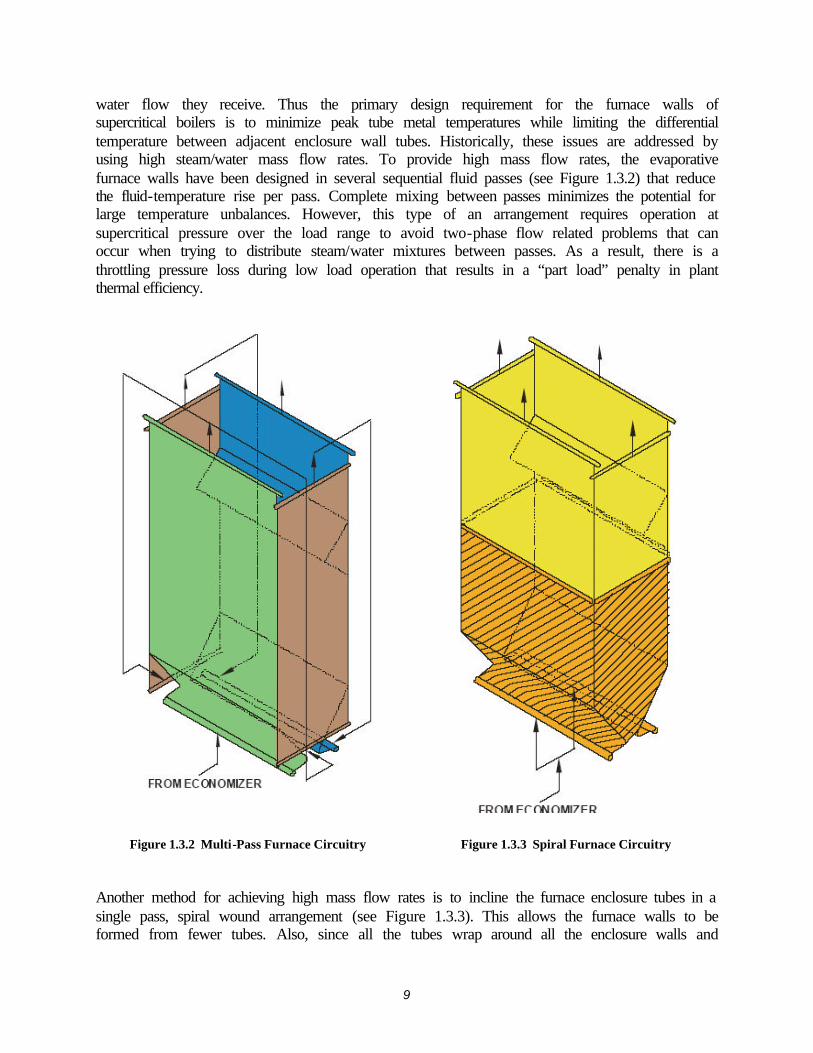
water flow they receive. Thus the primary design requirement for the furnace walls of supercritical boilers is to minimize peak tube metal temperatures while limiting the differential temperature between adjacent enclosure wall tubes. Historically, these issues are addressed by using high steam/water mass flow rates. To provide high mass flow rates, the evaporative furnace walls have been designed in several sequential fluid passes (see Figure 1.3.2) that reduce the fluid-temperature rise per pass. Complete mixing between passes minimizes the potential for large temperature unbalances. However, this type of an arrangement requires operation at supercritical pressure over the load range to avoid two-phase flow related problems that can occur when trying to distribute steam/water mixtures between passes. As a result, there is a throttling pressure loss during low load operation that results in a “part load” penalty in plant thermal efficiency.
Figure 1.3.2 Multi-Pass Furnace Circuitry Figure 1.3.3 Spiral Furnace Circuitry Another method for achieving high mass flow rates is to incline the furnace enclosure tubes in a single pass, spiral wound arrangement (see Figure 1.3.3). This allows the furnace walls to be formed from fewer tubes. Also, since all the tubes wrap around all the enclosure walls and
10
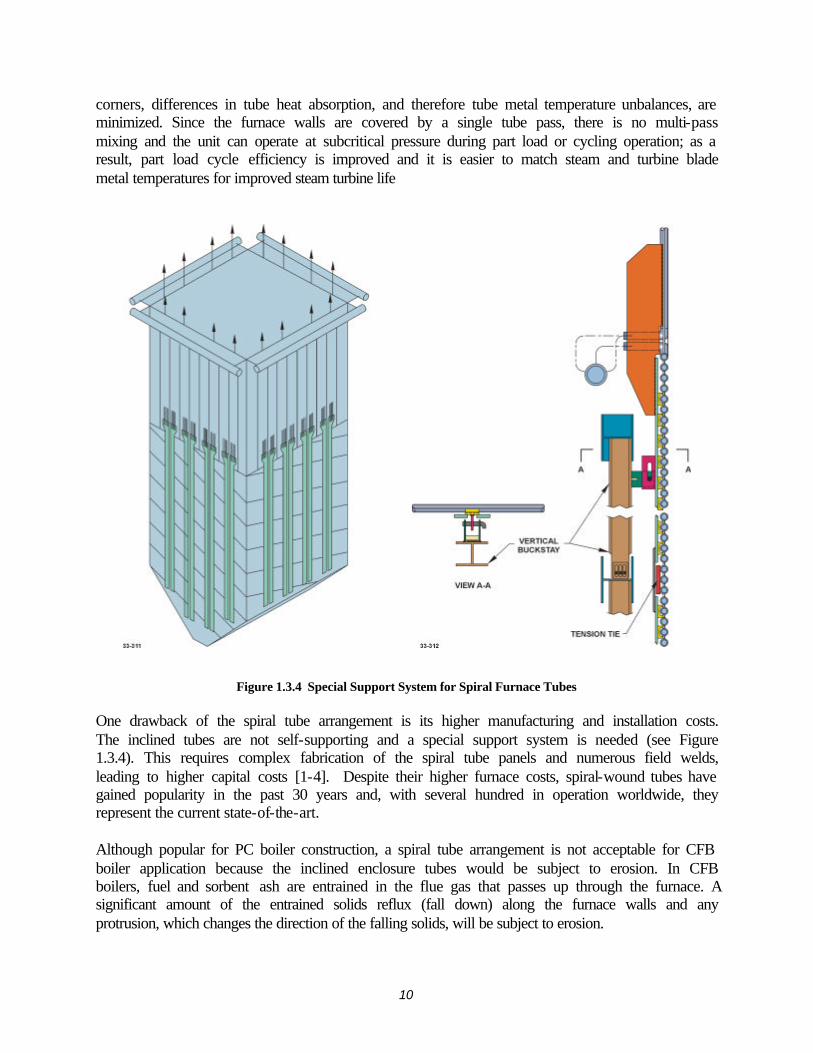
corners, differences in tube heat absorption, and therefore tube metal temperature unbalances, are minimized. Since the furnace walls are covered by a single tube pass, there is no multi-pass mixing and the unit can operate at subcritical pressure during part load or cycling operation; as a result, part load cycle efficiency is improved and it is easier to match steam and turbine blade metal temperatures for improved steam turbine life
Figure 1.3.4 Special Support System for Spiral Furnace Tubes
One drawback of the spiral tube arrangement is its higher manufacturing and installation costs. The inclined tubes are not self-supporting and a special support system is needed (see Figure 1.3.4). This requires complex fabrication of the spiral tube panels and numerous field welds, leading to higher capital costs [1-4]. Despite their higher furnace costs, spiral-wound tubes have gained popularity in the past 30 years and, with several hundred in operation worldwide, they represent the current state-of-the-art. Although popular for PC boiler construction, a spiral tube arrangement is not acceptable for CFB boiler application because the inclined enclosure tubes would be subject to erosion. In CFB boilers, fuel and sorbent ash are entrained in the flue gas that passes up through the furnace. A significant amount of the entrained solids reflux (fall down) along the furnace walls and any protrusion, which changes the direction of the falling solids, will be subject to erosion.
11
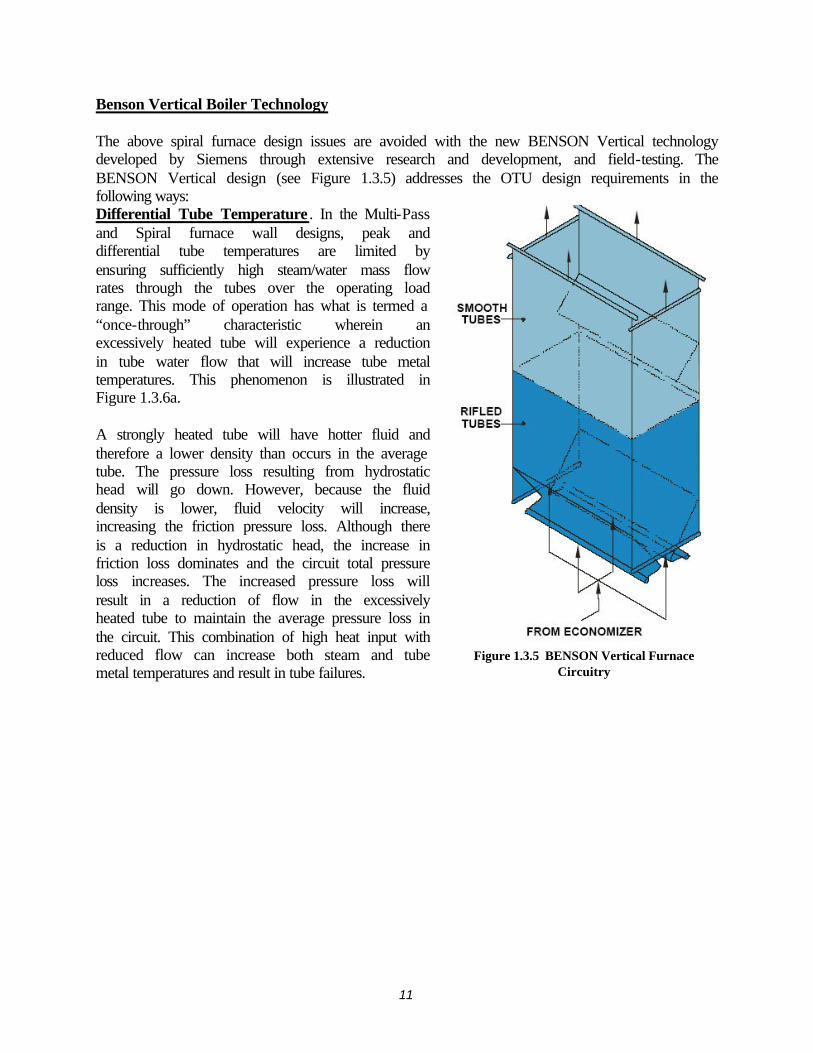
Benson Vertical Boiler Technology The above spiral furnace design issues are avoided with the new BENSON Vertical technology developed by Siemens through extensive research and development, and field-testing. The BENSON Vertical design (see Figure 1.3.5) addresses the OTU design requirements in the following ways: Differential Tube Temperature . In the Multi-Pass and Spiral furnace wall designs, peak and differential tube temperatures are limited by ensuring sufficiently high steam/water mass flow rates through the tubes over the operating load range. This mode of operation has what is termed a “once-through” characteristic wherein an excessively heated tube will experience a reduction in tube water flow that will increase tube metal temperatures. This phenomenon is illustrated in Figure 1.3.6a. A strongly heated tube will have hotter fluid and therefore a lower density than occurs in the average tube. The pressure loss resulting from hydrostatic head will go down. However, because the fluid density is lower, fluid velocity will increase, increasing the friction pressure loss. Although there is a reduction in hydrostatic head, the increase in friction loss dominates and the circuit total pressure loss increases. The increased pressure loss will result in a reduction of flow in the excessively heated tube to maintain the average pressure loss in the circuit. This combination of high heat input with reduced flow can increase both steam and tube metal temperatures and result in tube failures.
Figure 1.3.5 BENSON Vertical Furnace
Circuitry
12
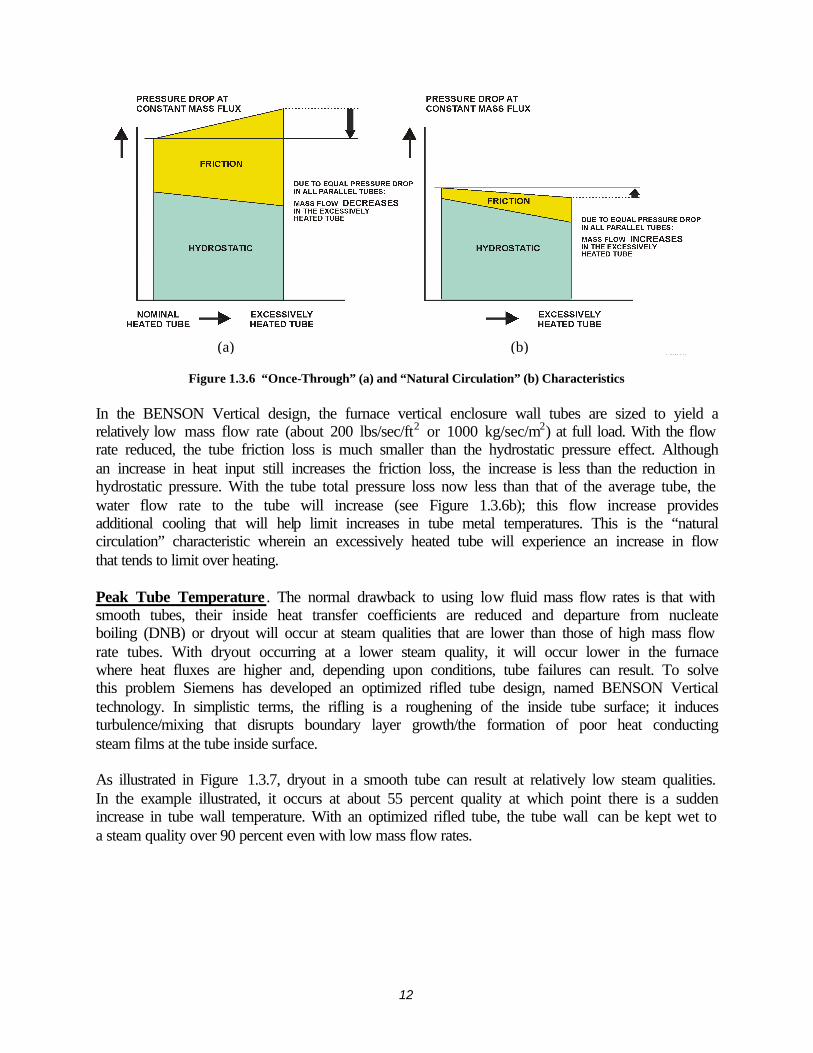
(a) (b)
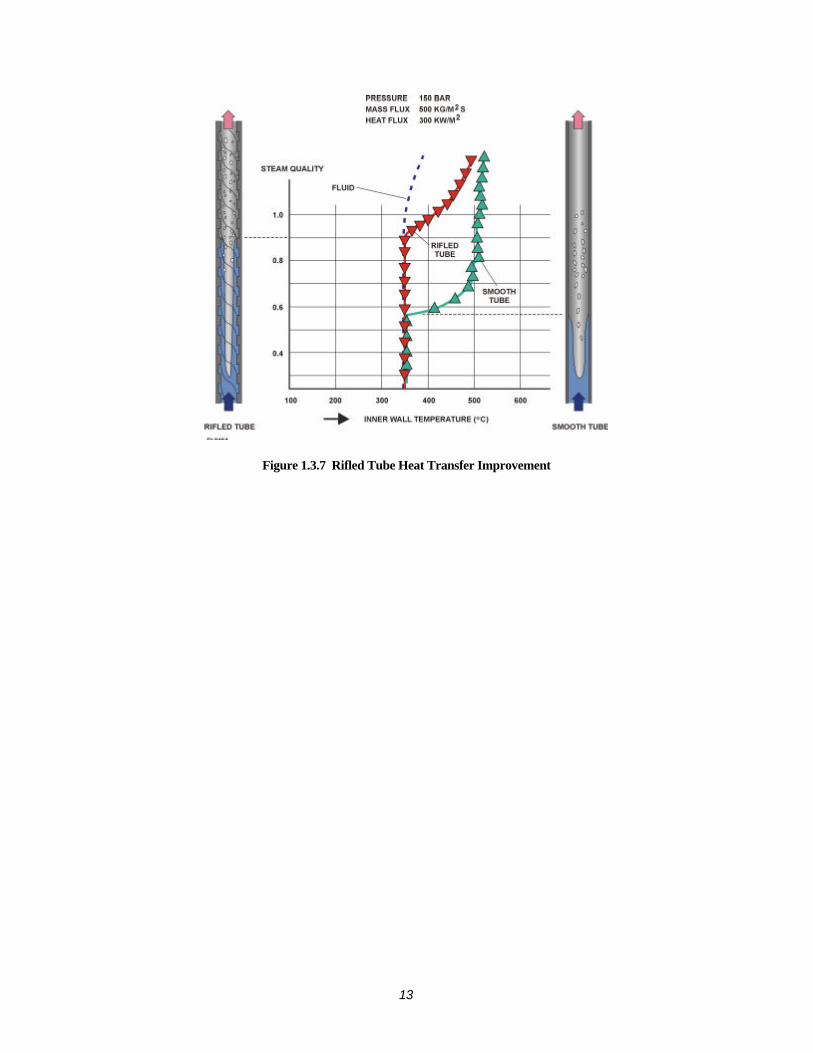
Figure 1.3.6 “Once-Through” (a) and “Natural Circulation” (b) Characteristics In the BENSON Vertical design, the furnace vertical enclosure wall tubes are sized to yield a relatively low mass flow rate (about 200 lbs/sec/ft2 or 1000 kg/sec/m2) at full load. With the flow rate reduced, the tube friction loss is much smaller than the hydrostatic pressure effect. Although an increase in heat input still increases the friction loss, the increase is less than the reduction in hydrostatic pressure. With the tube total pressure loss now less than that of the average tube, the water flow rate to the tube will increase (see Figure 1.3.6b); this flow increase provides additional cooling that will help limit increases in tube metal temperatures. This is the “natural circulation” characteristic wherein an excessively heated tube will experience an increase in flow that tends to limit over heating. Peak Tube Temperature . The normal drawback to using low fluid mass flow rates is that with smooth tubes, their inside heat transfer coefficients are reduced and departure from nucleate boiling (DNB) or dryout will occur at steam qualities that are lower than those of high mass flow rate tubes. With dryout occurring at a lower steam quality, it will occur lower in the furnace where heat fluxes are higher and, depending upon conditions, tube failures can result. To solve this problem Siemens has developed an optimized rifled tube design, named BENSON Vertical technology. In simplistic terms, the rifling is a roughening of the inside tube surface; it induces turbulence/mixing that disrupts boundary layer growth/the formation of poor heat conducting steam films at the tube inside surface. As illustrated in Figure 1.3.7, dryout in a smooth tube can result at relatively low steam qualities. In the example illustrated, it occurs at about 55 percent quality at which point there is a sudden increase in tube wall temperature. With an optimized rifled tube, the tube wall can be kept wet to a steam quality over 90 percent even with low mass flow rates.
13
Figure 1.3.7 Rifled Tube Heat Transfer Improvement
14
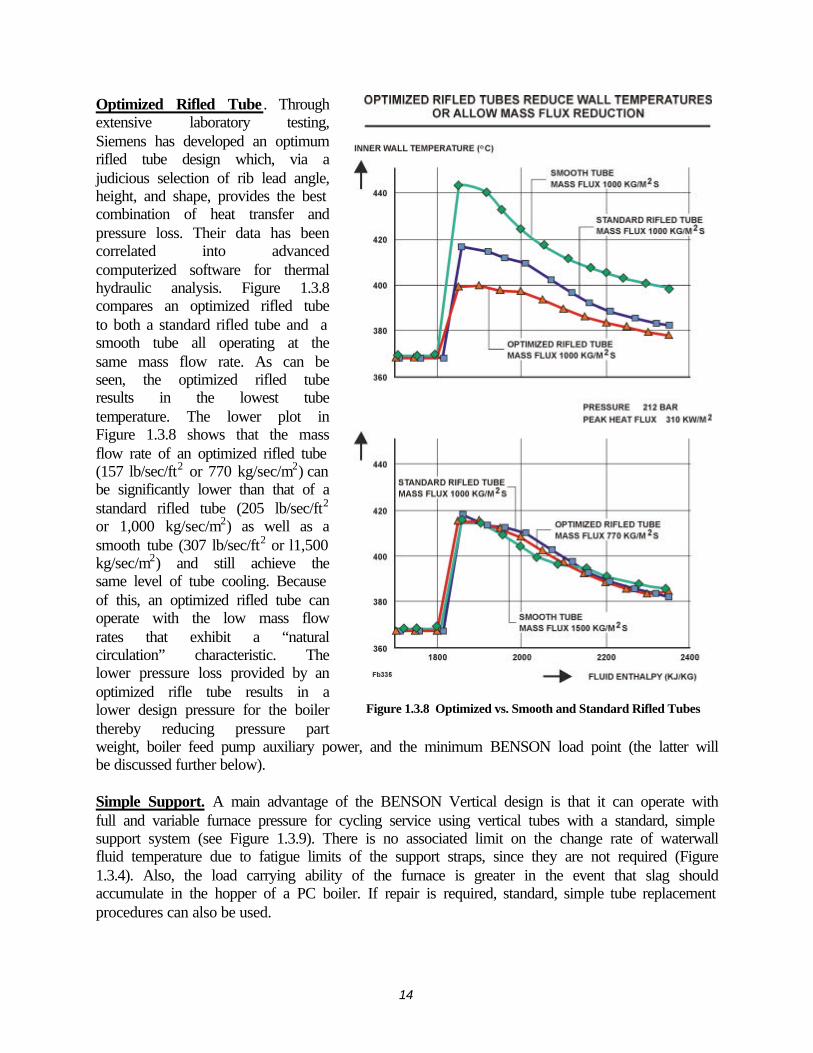
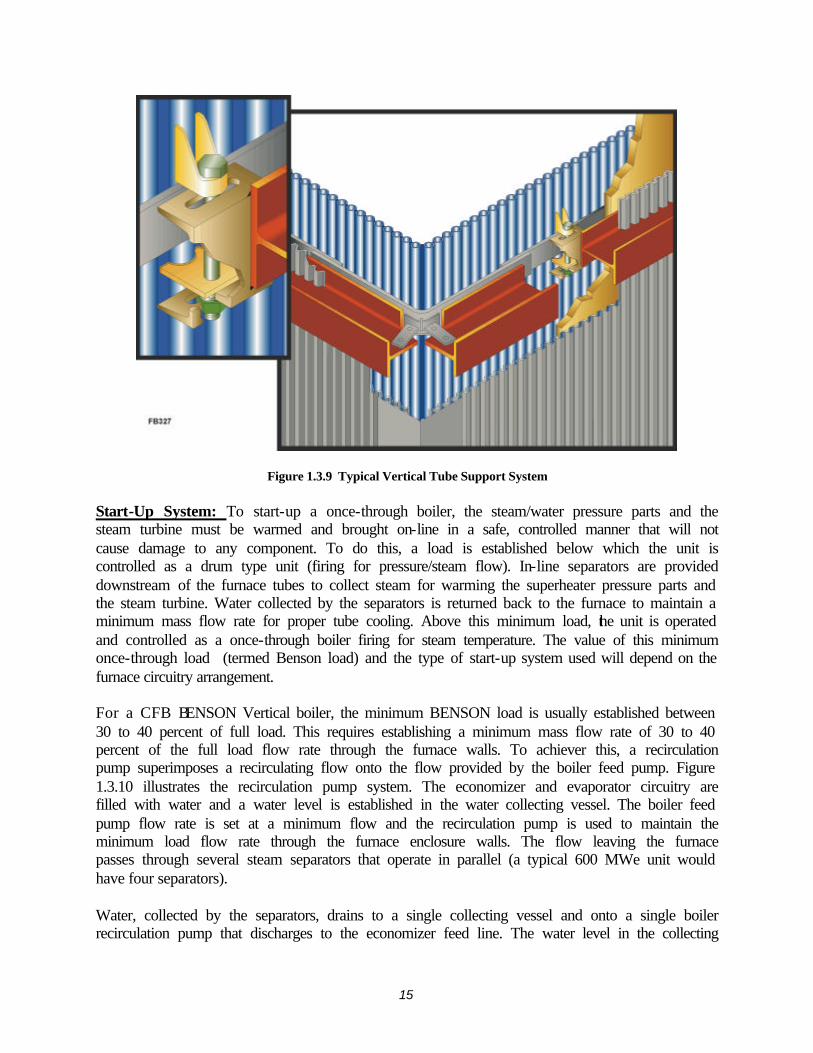
Optimized Rifled Tube . Through extensive laboratory testing, Siemens has developed an optimum rifled tube design which, via a judicious selection of rib lead angle, height, and shape, provides the best combination of heat transfer and pressure loss. Their data has been correlated into advanced computerized software for thermal hydraulic analysis. Figure 1.3.8 compares an optimized rifled tube to both a standard rifled tube and a smooth tube all operating at the same mass flow rate. As can be seen, the optimized rifled tube results in the lowest tube temperature. The lower plot in Figure 1.3.8 shows that the mass flow rate of an optimized rifled tube (157 lb/sec/ft2 or 770 kg/sec/m2) can be significantly lower than that of a standard rifled tube (205 lb/sec/ft2 or 1,000 kg/sec/m2) as well as a smooth tube (307 lb/sec/ft2 or l1,500 kg/sec/m2) and still achieve the same level of tube cooling. Because of this, an optimized rifled tube can operate with the low mass flow rates that exhibit a “natural circulation” characteristic. The lower pressure loss provided by an optimized rifle tube results in a lower design pressure for the boiler thereby reducing pressure part weight, boiler feed pump auxiliary power, and the minimum BENSON load point (the latter will be discussed further below). Simple Support. A main advantage of the BENSON Vertical design is that it can operate with full and variable furnace pressure for cycling service using vertical tubes with a standard, simple support system (see Figure 1.3.9). There is no associated limit on the change rate of waterwall fluid temperature due to fatigue limits of the support straps, since they are not required (Figure 1.3.4). Also, the load carrying ability of the furnace is greater in the event that slag should accumulate in the hopper of a PC boiler. If repair is required, standard, simple tube replacement procedures can also be used.
Figure 1.3.8 Optimized vs. Smooth and Standard Rifled Tubes
15
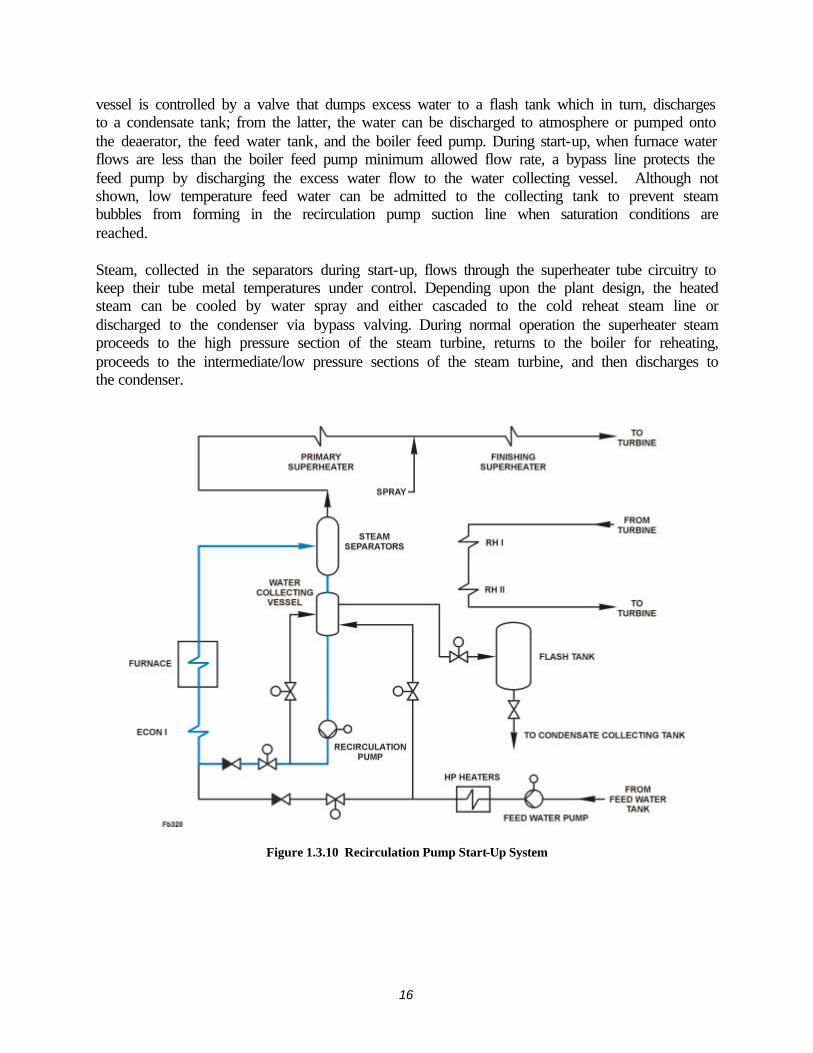
Figure 1.3.9 Typical Vertical Tube Support System Start-Up System: To start-up a once-through boiler, the steam/water pressure parts and the steam turbine must be warmed and brought on-line in a safe, controlled manner that will not cause damage to any component. To do this, a load is established below which the unit is controlled as a drum type unit (firing for pressure/steam flow). In-line separators are provided downstream of the furnace tubes to collect steam for warming the superheater pressure parts and the steam turbine. Water collected by the separators is returned back to the furnace to maintain a minimum mass flow rate for proper tube cooling. Above this minimum load, the unit is operated and controlled as a once-through boiler firing for steam temperature. The value of this minimum once-through load (termed Benson load) and the type of start-up system used will depend on the furnace circuitry arrangement. For a CFB BENSON Vertical boiler, the minimum BENSON load is usually established between 30 to 40 percent of full load. This requires establishing a minimum mass flow rate of 30 to 40 percent of the full load flow rate through the furnace walls. To achiever this, a recirculation pump superimposes a recirculating flow onto the flow provided by the boiler feed pump. Figure 1.3.10 illustrates the recirculation pump system. The economizer and evaporator circuitry are filled with water and a water level is established in the water collecting vessel. The boiler feed pump flow rate is set at a minimum flow and the recirculation pump is used to maintain the minimum load flow rate through the furnace enclosure walls. The flow leaving the furnace passes through several steam separators that operate in parallel (a typical 600 MWe unit would have four separators). Water, collected by the separators, drains to a single collecting vessel and onto a single boiler recirculation pump that discharges to the economizer feed line. The water level in the collecting
16
vessel is controlled by a valve that dumps excess water to a flash tank which in turn, discharges to a condensate tank; from the latter, the water can be discharged to atmosphere or pumped onto the deaerator, the feed water tank, and the boiler feed pump. During start-up, when furnace water flows are less than the boiler feed pump minimum allowed flow rate, a bypass line protects the feed pump by discharging the excess water flow to the water collecting vessel. Although not shown, low temperature feed water can be admitted to the collecting tank to prevent steam bubbles from forming in the recirculation pump suction line when saturation conditions are reached. Steam, collected in the separators during start-up, flows through the superheater tube circuitry to keep their tube metal temperatures under control. Depending upon the plant design, the heated steam can be cooled by water spray and either cascaded to the cold reheat steam line or discharged to the condenser via bypass valving. During normal operation the superheater steam proceeds to the high pressure section of the steam turbine, returns to the boiler for reheating, proceeds to the intermediate/low pressure sections of the steam turbine, and then discharges to the condenser.
Figure 1.3.10 Recirculation Pump Start-Up System
17
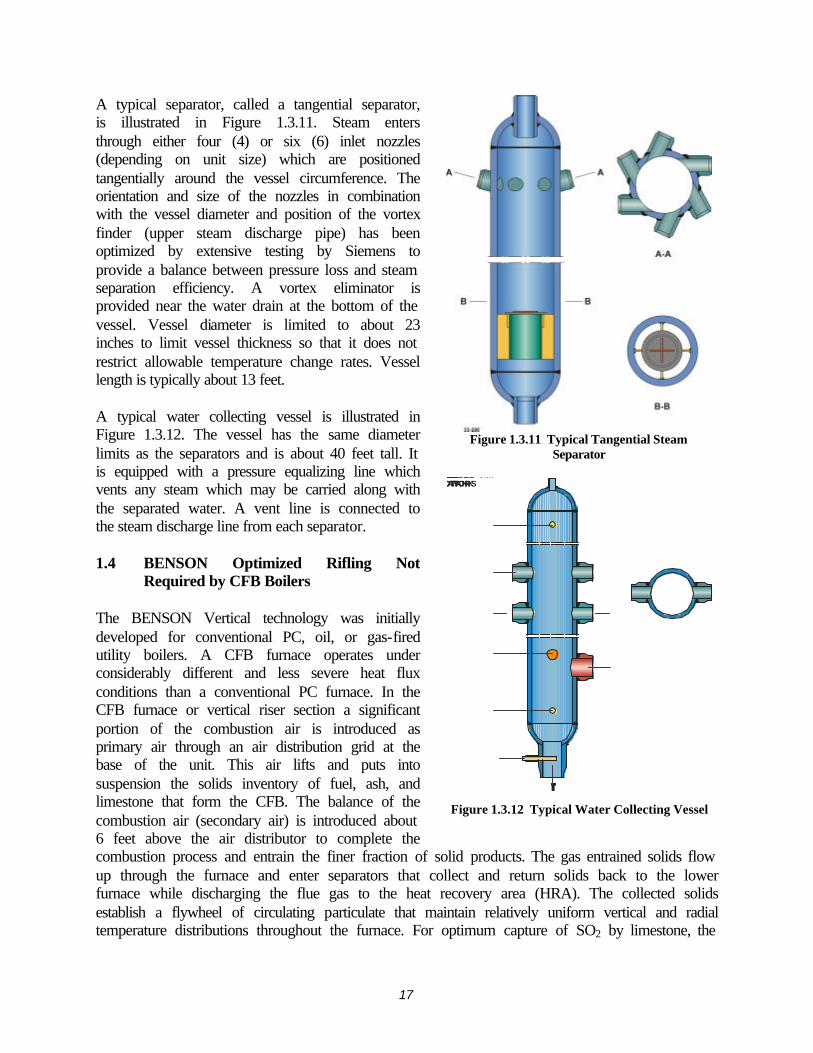
A typical separator, called a tangential separator, is illustrated in Figure 1.3.11. Steam enters through either four (4) or six (6) inlet nozzles (depending on unit size) which are positioned tangentially around the vessel circumference. The orientation and size of the nozzles in combination with the vessel diameter and position of the vortex finder (upper steam discharge pipe) has been optimized by extensive testing by Siemens to provide a balance between pressure loss and steam separation efficiency. A vortex eliminator is provided near the water drain at the bottom of the vessel. Vessel diameter is limited to about 23 inches to limit vessel thickness so that it does not restrict allowable temperature change rates. Vessel length is typically about 13 feet. A typical water collecting vessel is illustrated in Figure 1.3.12. The vessel has the same diameter limits as the separators and is about 40 feet tall. It is equipped with a pressure equalizing line which vents any steam which may be carried along with the separated water. A vent line is connected to the steam discharge line from each separator. 1.4 BENSON Optimized Rifling Not
Required by CFB Boilers The BENSON Vertical technology was initially developed for conventional PC, oil, or gas-fired utility boilers. A CFB furnace operates under considerably different and less severe heat flux conditions than a conventional PC furnace. In the CFB furnace or vertical riser section a significant portion of the combustion air is introduced as primary air through an air distribution grid at the base of the unit. This air lifts and puts into suspension the solids inventory of fuel, ash, and limestone that form the CFB. The balance of the combustion air (secondary air) is introduced about 6 feet above the air distributor to complete the combustion process and entrain the finer fraction of solid products. The gas entrained solids flow up through the furnace and enter separators that collect and return solids back to the lower furnace while discharging the flue gas to the heat recovery area (HRA). The collected solids establish a flywheel of circulating particulate that maintain relatively uniform vertical and radial temperature distributions throughout the furnace. For optimum capture of SO2 by limestone, the
Figure 1.3.11 Typical Tangential Steam
Separator
FB322WATERINJECTION
LEVELLEVELMIN.FLOWFROM
SEPARATORSTO
FLASH TANKAAA-ATO CIRCULATING PUMP
Figure 1.3.12 Typical Water Collecting Vessel
18
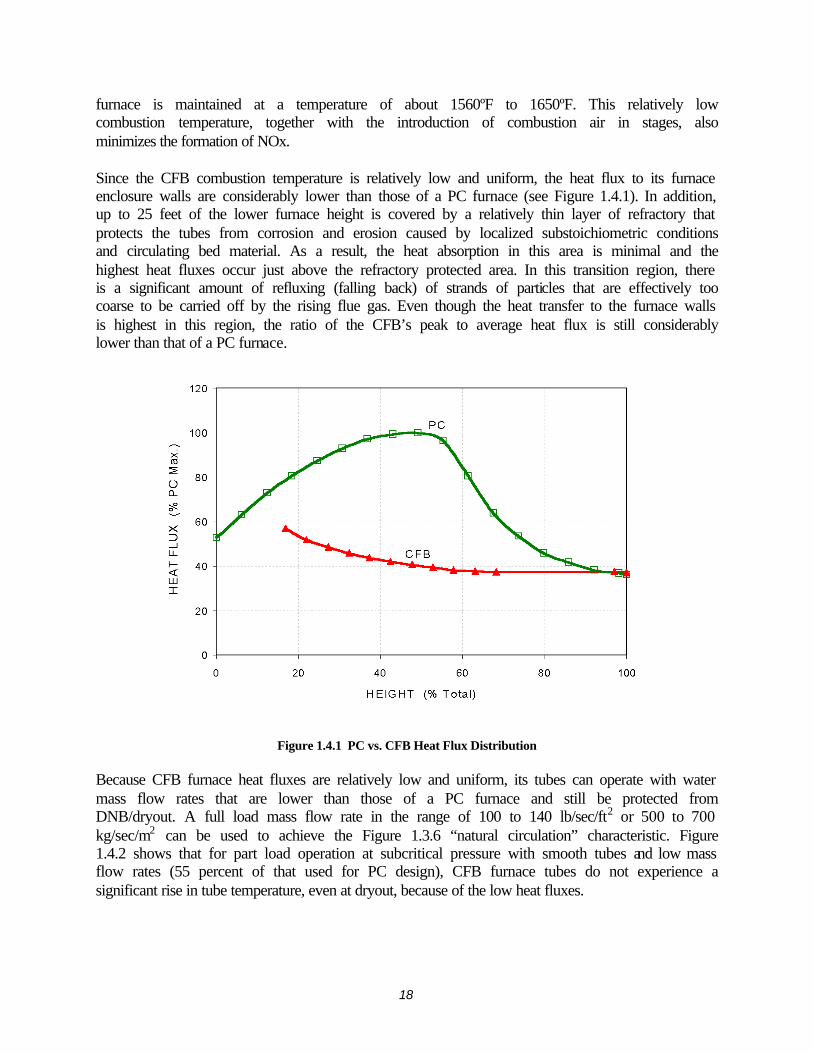
furnace is maintained at a temperature of about 1560ºF to 1650ºF. This relatively low combustion temperature, together with the introduction of combustion air in stages, also minimizes the formation of NOx. Since the CFB combustion temperature is relatively low and uniform, the heat flux to its furnace enclosure walls are considerably lower than those of a PC furnace (see Figure 1.4.1). In addition, up to 25 feet of the lower furnace height is covered by a relatively thin layer of refractory that protects the tubes from corrosion and erosion caused by localized substoichiometric conditions and circulating bed material. As a result, the heat absorption in this area is minimal and the highest heat fluxes occur just above the refractory protected area. In this transition region, there is a significant amount of refluxing (falling back) of strands of particles that are effectively too coarse to be carried off by the rising flue gas. Even though the heat transfer to the furnace walls is highest in this region, the ratio of the CFB’s peak to average heat flux is still considerably lower than that of a PC furnace.
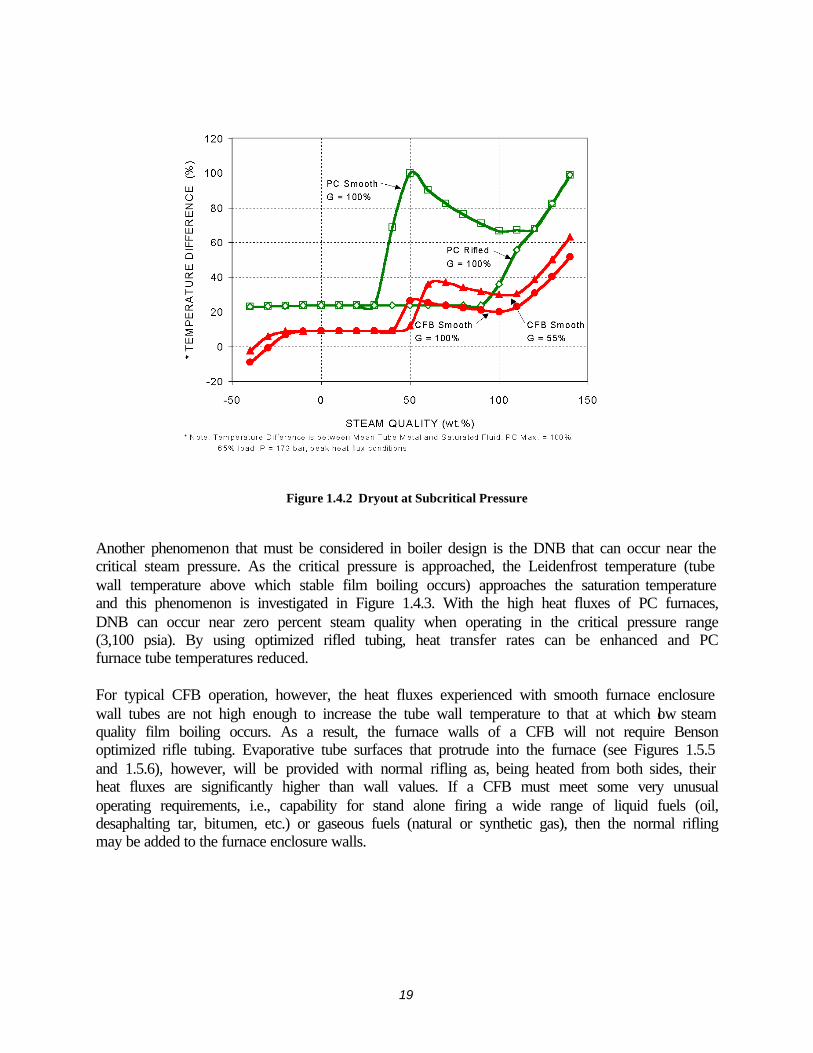
Figure 1.4.1 PC vs. CFB Heat Flux Distribution Because CFB furnace heat fluxes are relatively low and uniform, its tubes can operate with water mass flow rates that are lower than those of a PC furnace and still be protected from DNB/dryout. A full load mass flow rate in the range of 100 to 140 lb/sec/ft2 or 500 to 700 kg/sec/m2 can be used to achieve the Figure 1.3.6 “natural circulation” characteristic. Figure 1.4.2 shows that for part load operation at subcritical pressure with smooth tubes and low mass flow rates (55 percent of that used for PC design), CFB furnace tubes do not experience a significant rise in tube temperature, even at dryout, because of the low heat fluxes.
19
Figure 1.4.2 Dryout at Subcritical Pressure
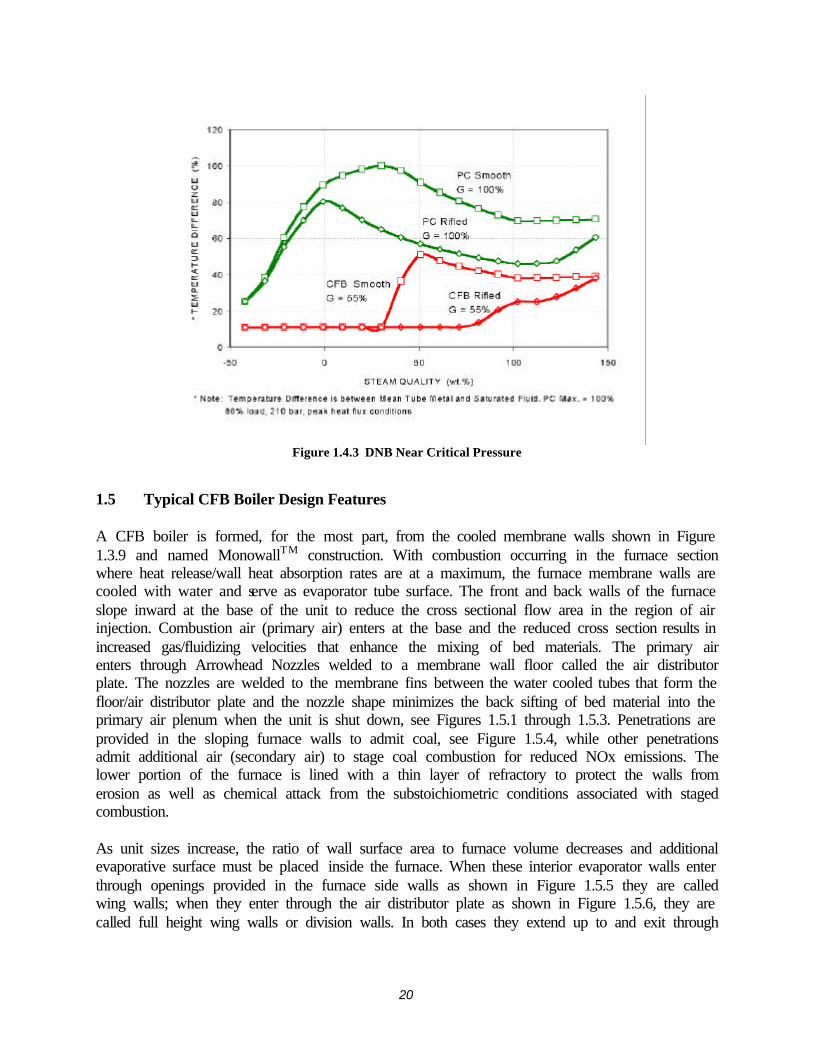
Another phenomenon that must be considered in boiler design is the DNB that can occur near the critical steam pressure. As the critical pressure is approached, the Leidenfrost temperature (tube wall temperature above which stable film boiling occurs) approaches the saturation temperature and this phenomenon is investigated in Figure 1.4.3. With the high heat fluxes of PC furnaces, DNB can occur near zero percent steam quality when operating in the critical pressure range (3,100 psia). By using optimized rifled tubing, heat transfer rates can be enhanced and PC furnace tube temperatures reduced. For typical CFB operation, however, the heat fluxes experienced with smooth furnace enclosure wall tubes are not high enough to increase the tube wall temperature to that at which low steam quality film boiling occurs. As a result, the furnace walls of a CFB will not require Benson optimized rifle tubing. Evaporative tube surfaces that protrude into the furnace (see Figures 1.5.5 and 1.5.6), however, will be provided with normal rifling as, being heated from both sides, their heat fluxes are significantly higher than wall values. If a CFB must meet some very unusual operating requirements, i.e., capability for stand alone firing a wide range of liquid fuels (oil, desaphalting tar, bitumen, etc.) or gaseous fuels (natural or synthetic gas), then the normal rifling may be added to the furnace enclosure walls.
20
Figure 1.4.3 DNB Near Critical Pressure
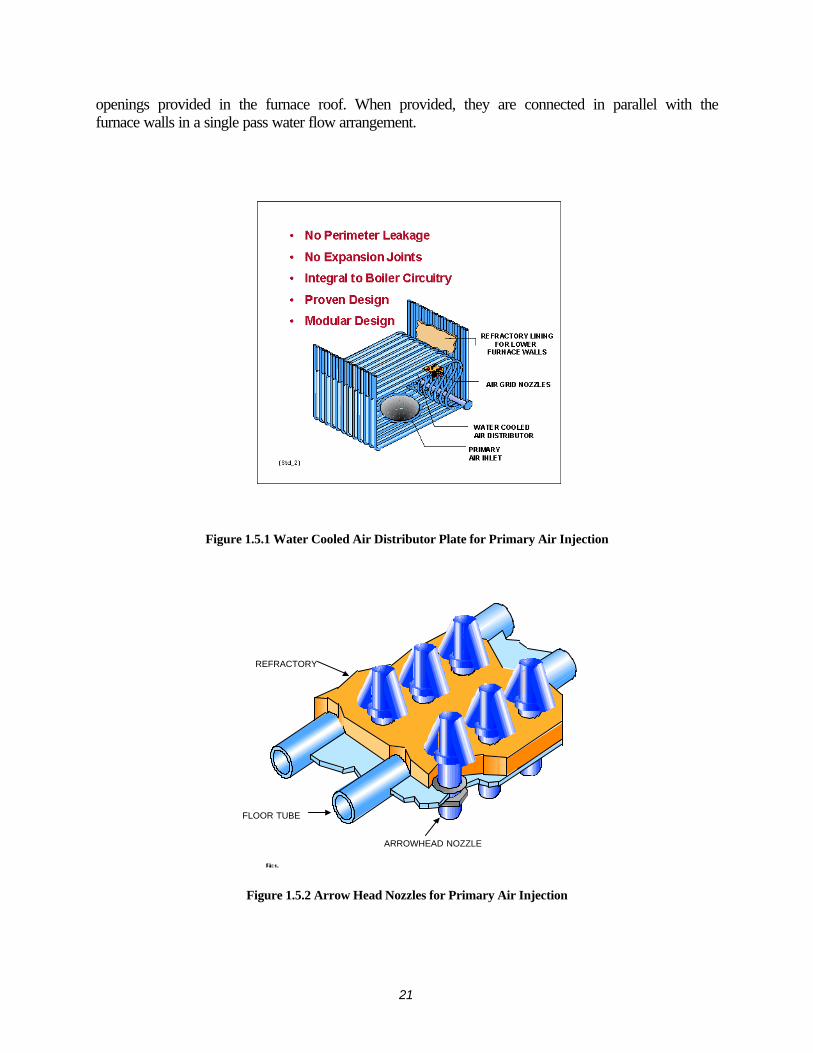
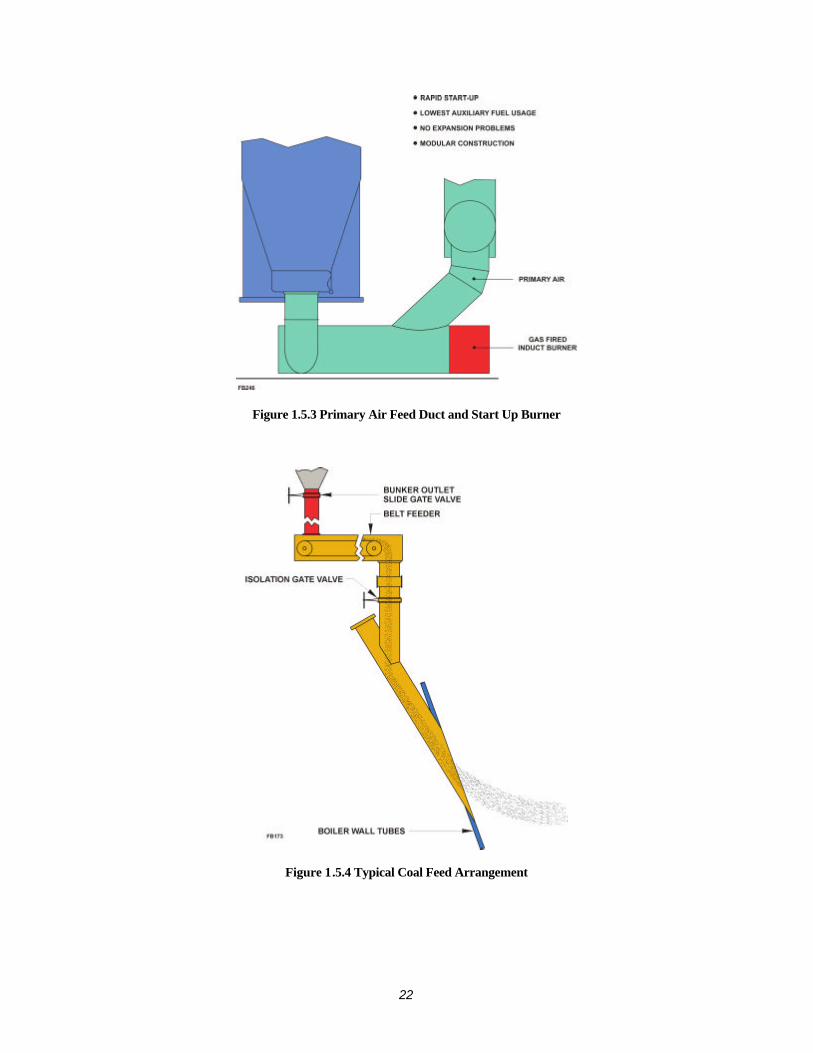
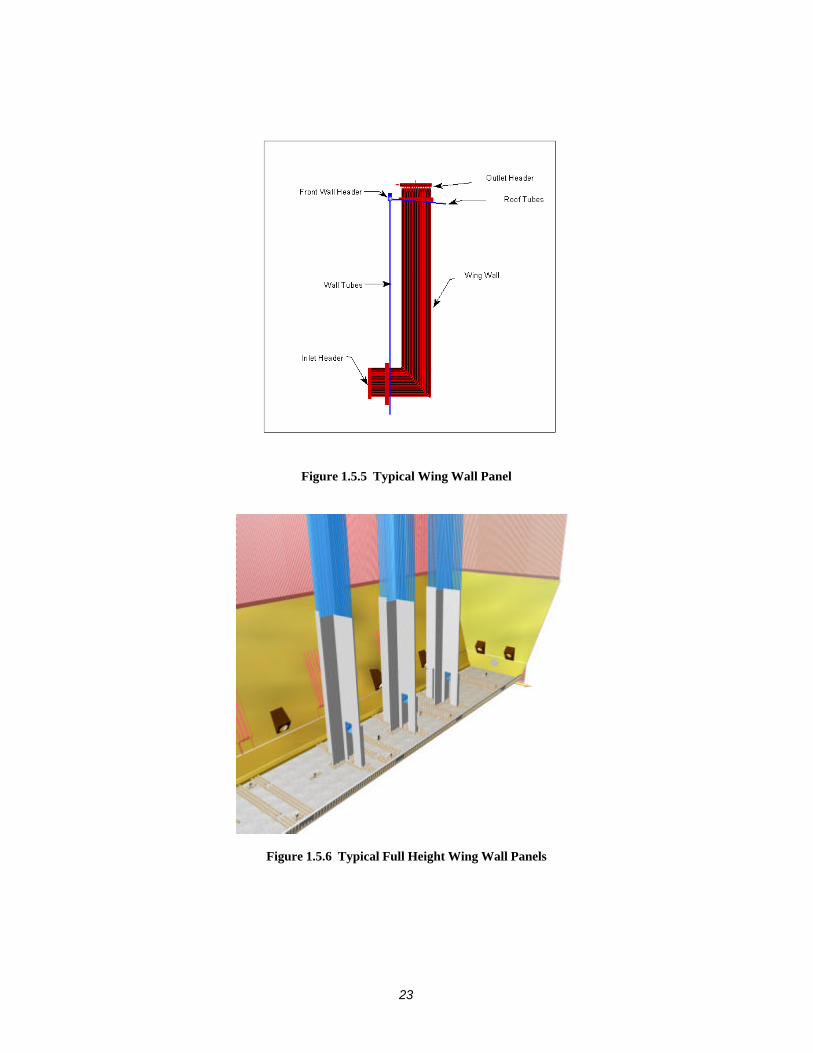
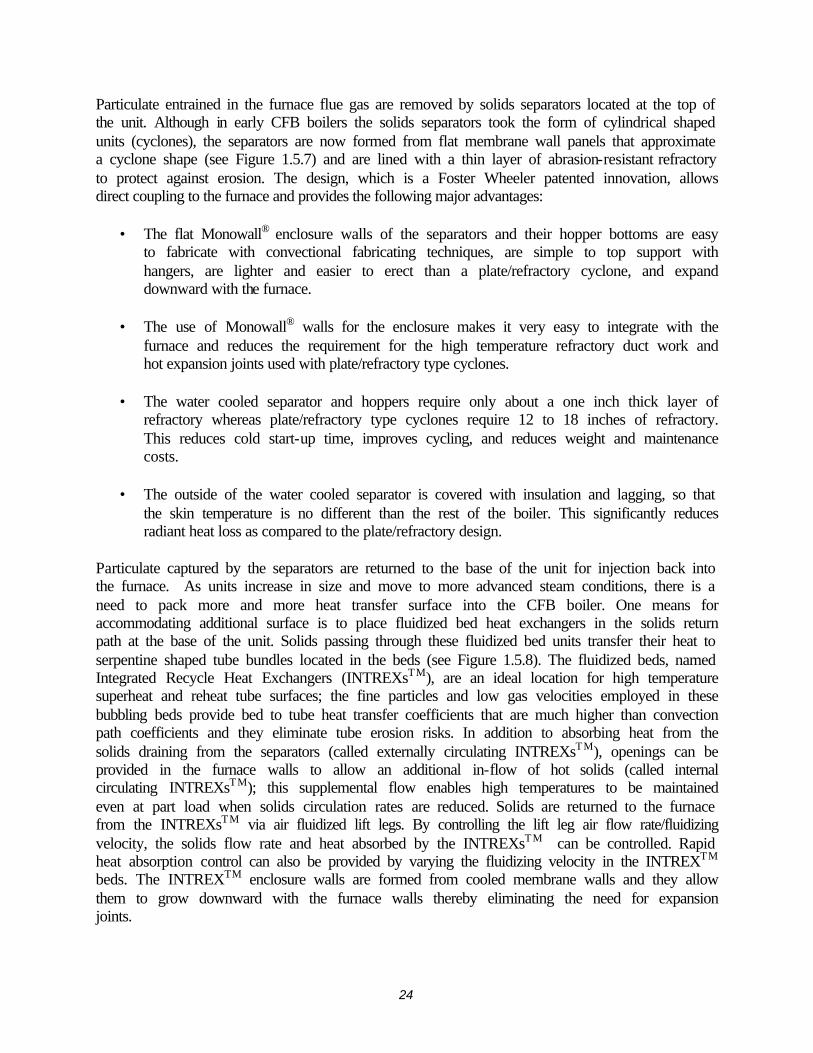
1.5 Typical CFB Boiler Design Features A CFB boiler is formed, for the most part, from the cooled membrane walls shown in Figure 1.3.9 and named MonowallTM construction. With combustion occurring in the furnace section where heat release/wall heat absorption rates are at a maximum, the furnace membrane walls are cooled with water and serve as evaporator tube surface. The front and back walls of the furnace slope inward at the base of the unit to reduce the cross sectional flow area in the region of air injection. Combustion air (primary air) enters at the base and the reduced cross section results in increased gas/fluidizing velocities that enhance the mixing of bed materials. The primary air enters through Arrowhead Nozzles welded to a membrane wall floor called the air distributor plate. The nozzles are welded to the membrane fins between the water cooled tubes that form the floor/air distributor plate and the nozzle shape minimizes the back sifting of bed material into the primary air plenum when the unit is shut down, see Figures 1.5.1 through 1.5.3. Penetrations are provided in the sloping furnace walls to admit coal, see Figure 1.5.4, while other penetrations admit additional air (secondary air) to stage coal combustion for reduced NOx emissions. The lower portion of the furnace is lined with a thin layer of refractory to protect the walls from erosion as well as chemical attack from the substoichiometric conditions associated with staged combustion. As unit sizes increase, the ratio of wall surface area to furnace volume decreases and additional evaporative surface must be placed inside the furnace. When these interior evaporator walls enter through openings provided in the furnace side walls as shown in Figure 1.5.5 they are called wing walls; when they enter through the air distributor plate as shown in Figure 1.5.6, they are called full height wing walls or division walls. In both cases they extend up to and exit through
21
openings provided in the furnace roof. When provided, they are connected in parallel with the furnace walls in a single pass water flow arrangement.
Figure 1.5.1 Water Cooled Air Distributor Plate for Primary Air Injection
REFRACTORY
FLOOR TUBE
ARROWHEAD NOZZLE
Figure 1.5.2 Arrow Head Nozzles for Primary Air Injection
22
Figure 1.5.3 Primary Air Feed Duct and Start Up Burner
Figure 1.5.4 Typical Coal Feed Arrangement
23
Figure 1.5.5 Typical Wing Wall Panel
Figure 1.5.6 Typical Full Height Wing Wall Panels
24
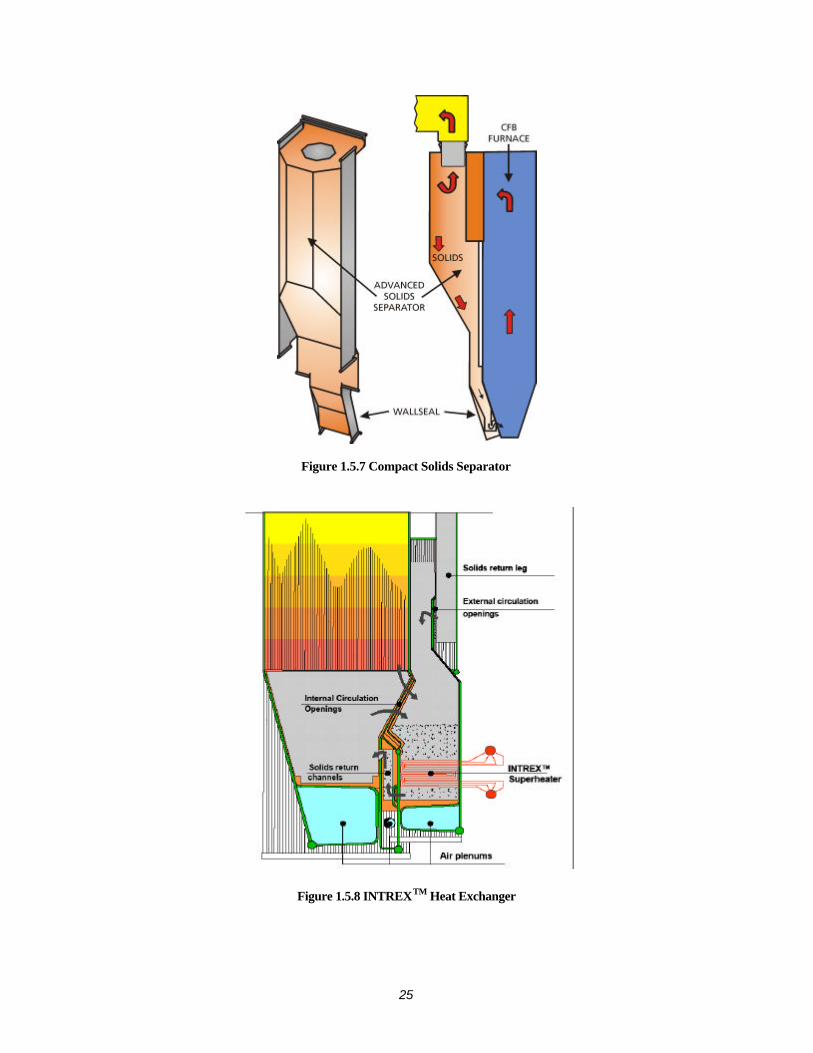
Particulate entrained in the furnace flue gas are removed by solids separators located at the top of the unit. Although in early CFB boilers the solids separators took the form of cylindrical shaped units (cyclones), the separators are now formed from flat membrane wall panels that approximate a cyclone shape (see Figure 1.5.7) and are lined with a thin layer of abrasion-resistant refractory to protect against erosion. The design, which is a Foster Wheeler patented innovation, allows direct coupling to the furnace and provides the following major advantages:
• The flat Monowall® enclosure walls of the separators and their hopper bottoms are easy to fabricate with convectional fabricating techniques, are simple to top support with hangers, are lighter and easier to erect than a plate/refractory cyclone, and expand downward with the furnace.
• The use of Monowall® walls for the enclosure makes it very easy to integrate with the
furnace and reduces the requirement for the high temperature refractory duct work and hot expansion joints used with plate/refractory type cyclones.
• The water cooled separator and hoppers require only about a one inch thick layer of
refractory whereas plate/refractory type cyclones require 12 to 18 inches of refractory. This reduces cold start-up time, improves cycling, and reduces weight and maintenance costs.
• The outside of the water cooled separator is covered with insulation and lagging, so that
the skin temperature is no different than the rest of the boiler. This significantly reduces radiant heat loss as compared to the plate/refractory design.
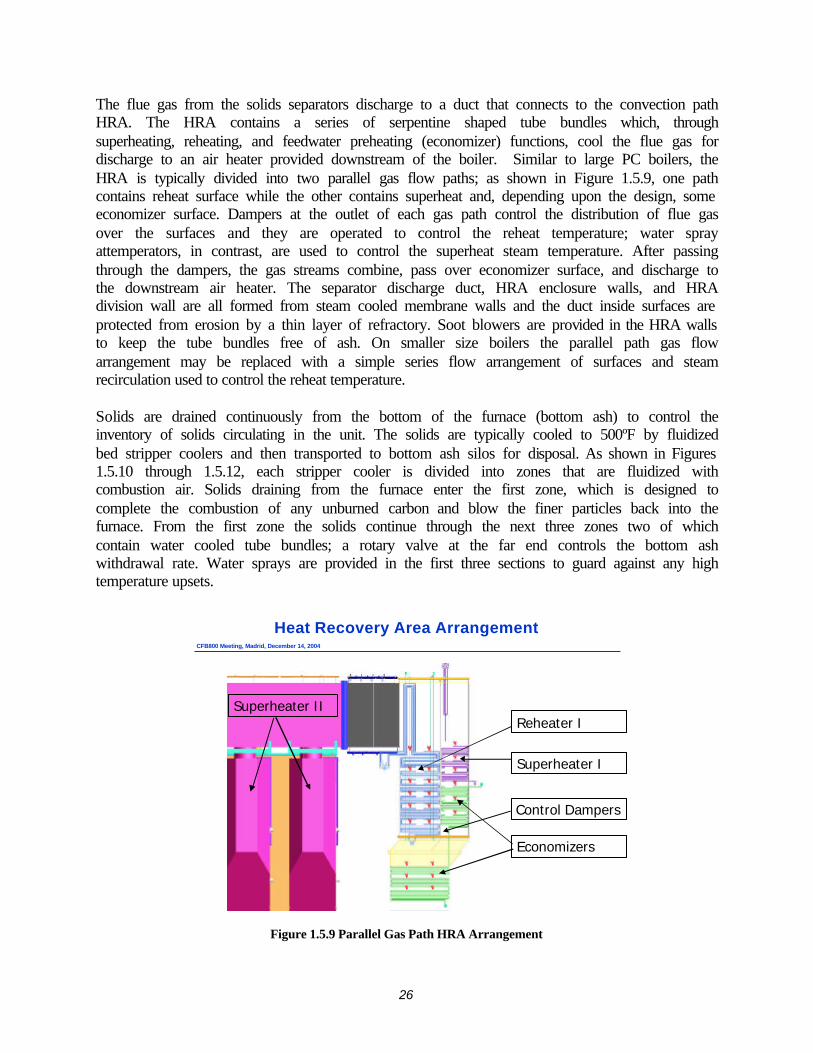
Particulate captured by the separators are returned to the base of the unit for injection back into the furnace. As units increase in size and move to more advanced steam conditions, there is a need to pack more and more heat transfer surface into the CFB boiler. One means for accommodating additional surface is to place fluidized bed heat exchangers in the solids return path at the base of the unit. Solids passing through these fluidized bed units transfer their heat to serpentine shaped tube bundles located in the beds (see Figure 1.5.8). The fluidized beds, named Integrated Recycle Heat Exchangers (INTREXsTM), are an ideal location for high temperature superheat and reheat tube surfaces; the fine particles and low gas velocities employed in these bubbling beds provide bed to tube heat transfer coefficients that are much higher than convection path coefficients and they eliminate tube erosion risks. In addition to absorbing heat from the solids draining from the separators (called externally circulating INTREXsTM), openings can be provided in the furnace walls to allow an additional in-flow of hot solids (called internal circulating INTREXsTM); this supplemental flow enables high temperatures to be maintained even at part load when solids circulation rates are reduced. Solids are returned to the furnace from the INTREXsTM via air fluidized lift legs. By controlling the lift leg air flow rate/fluidizing velocity, the solids flow rate and heat absorbed by the INTREXsTM can be controlled. Rapid heat absorption control can also be provided by varying the fluidizing velocity in the INTREXTM beds. The INTREXTM enclosure walls are formed from cooled membrane walls and they allow them to grow downward with the furnace walls thereby eliminating the need for expansion joints.
25
Figure 1.5.7 Compact Solids Separator
Figure 1.5.8 INTREXTM Heat Exchanger
26
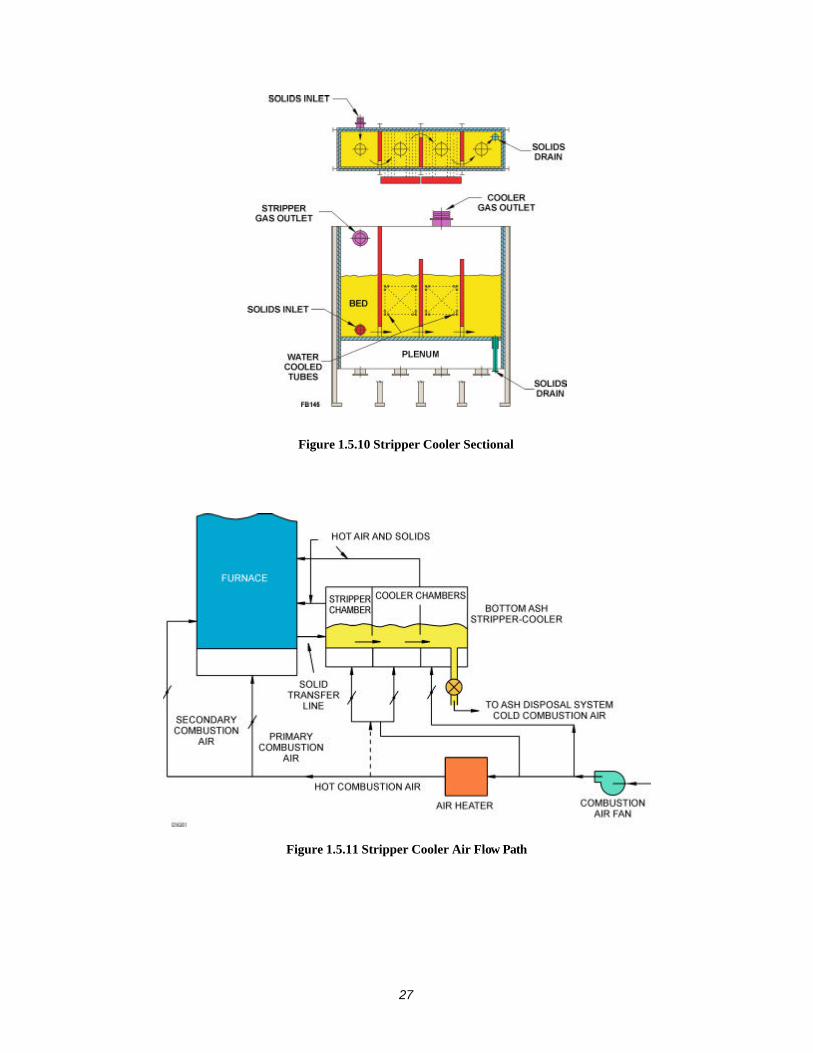
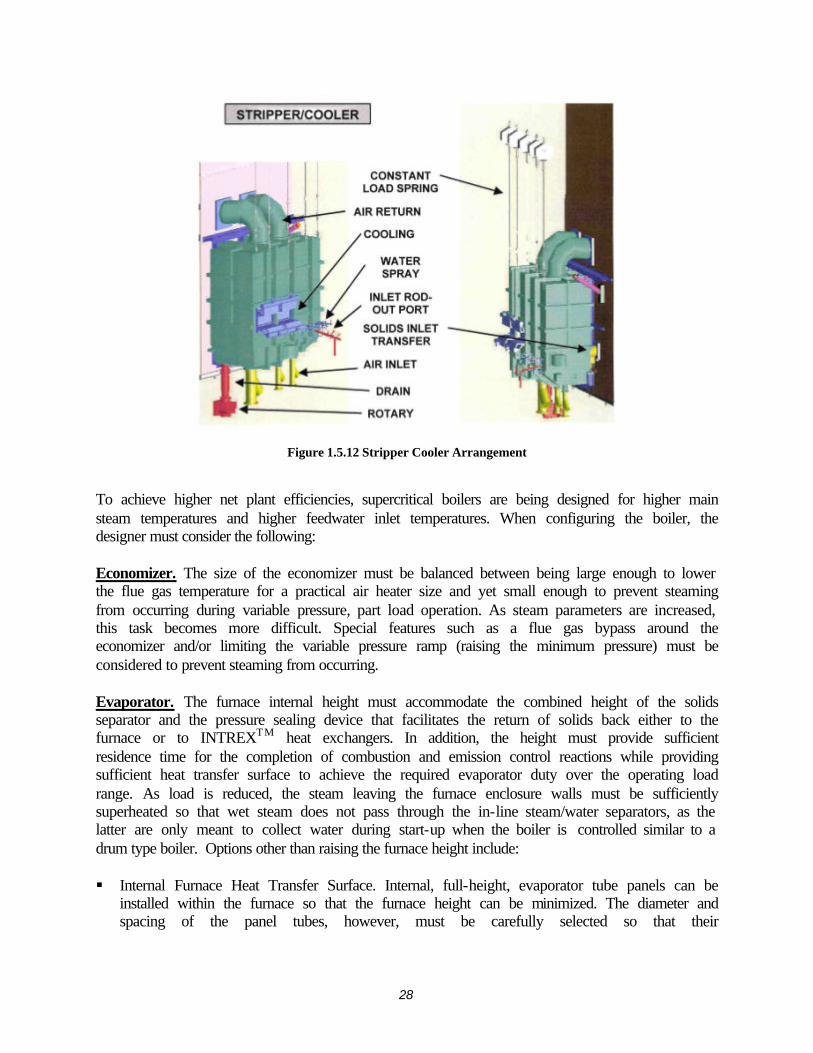
The flue gas from the solids separators discharge to a duct that connects to the convection path HRA. The HRA contains a series of serpentine shaped tube bundles which, through superheating, reheating, and feedwater preheating (economizer) functions, cool the flue gas for discharge to an air heater provided downstream of the boiler. Similar to large PC boilers, the HRA is typically divided into two parallel gas flow paths; as shown in Figure 1.5.9, one path contains reheat surface while the other contains superheat and, depending upon the design, some economizer surface. Dampers at the outlet of each gas path control the distribution of flue gas over the surfaces and they are operated to control the reheat temperature; water spray attemperators, in contrast, are used to control the superheat steam temperature. After passing through the dampers, the gas streams combine, pass over economizer surface, and discharge to the downstream air heater. The separator discharge duct, HRA enclosure walls, and HRA division wall are all formed from steam cooled membrane walls and the duct inside surfaces are protected from erosion by a thin layer of refractory. Soot blowers are provided in the HRA walls to keep the tube bundles free of ash. On smaller size boilers the parallel path gas flow arrangement may be replaced with a simple series flow arrangement of surfaces and steam recirculation used to control the reheat temperature. Solids are drained continuously from the bottom of the furnace (bottom ash) to control the inventory of solids circulating in the unit. The solids are typically cooled to 500ºF by fluidized bed stripper coolers and then transported to bottom ash silos for disposal. As shown in Figures 1.5.10 through 1.5.12, each stripper cooler is divided into zones that are fluidized with combustion air. Solids draining from the furnace enter the first zone, which is designed to complete the combustion of any unburned carbon and blow the finer particles back into the furnace. From the first zone the solids continue through the next three zones two of which contain water cooled tube bundles; a rotary valve at the far end controls the bottom ash withdrawal rate. Water sprays are provided in the first three sections to guard against any high temperature upsets.
CFB800 Meeting, Madrid, December 14, 2004
Heat Recovery Area Arrangement
Reheater I
Superheater I
Economizers
Superheater II
Control Dampers
Figure 1.5.9 Parallel Gas Path HRA Arrangement
27
Figure 1.5.10 Stripper Cooler Sectional
Figure 1.5.11 Stripper Cooler Air Flow Path
28
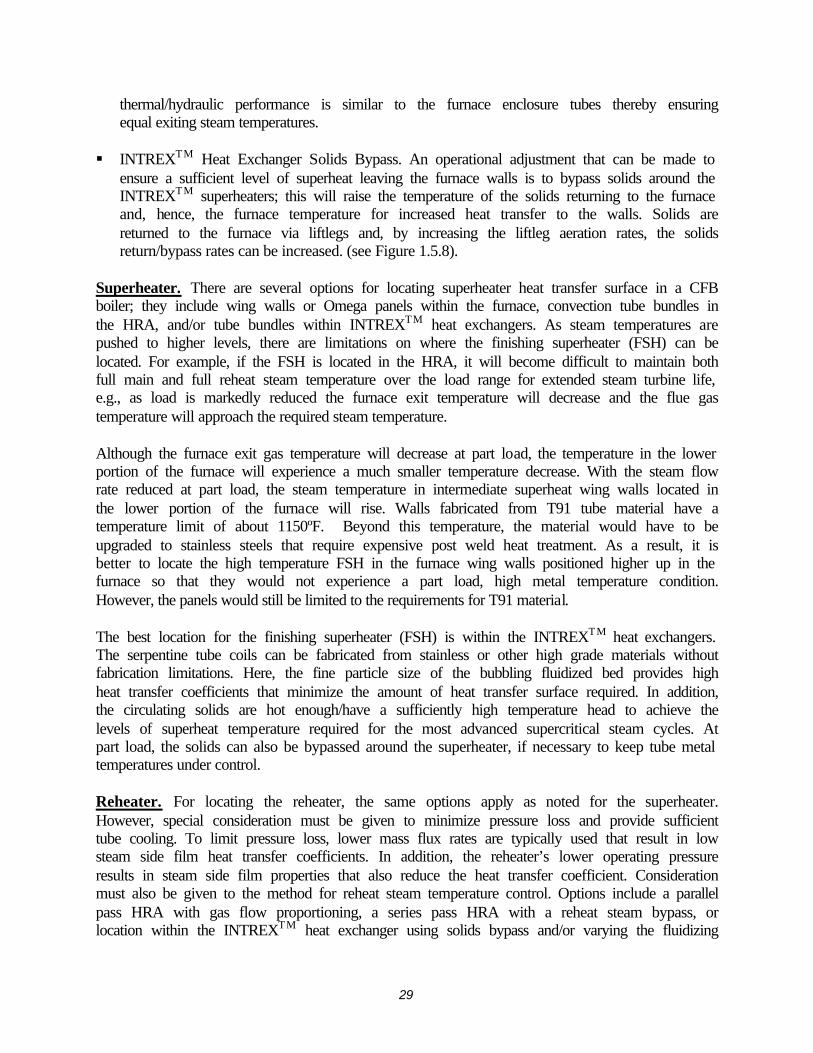
Figure 1.5.12 Stripper Cooler Arrangement To achieve higher net plant efficiencies, supercritical boilers are being designed for higher main steam temperatures and higher feedwater inlet temperatures. When configuring the boiler, the designer must consider the following: Economizer. The size of the economizer must be balanced between being large enough to lower the flue gas temperature for a practical air heater size and yet small enough to prevent steaming from occurring during variable pressure, part load operation. As steam parameters are increased, this task becomes more difficult. Special features such as a flue gas bypass around the economizer and/or limiting the variable pressure ramp (raising the minimum pressure) must be considered to prevent steaming from occurring. Evaporator. The furnace internal height must accommodate the combined height of the solids separator and the pressure sealing device that facilitates the return of solids back either to the furnace or to INTREXTM heat exchangers. In addition, the height must provide sufficient residence time for the completion of combustion and emission control reactions while providing sufficient heat transfer surface to achieve the required evaporator duty over the operating load range. As load is reduced, the steam leaving the furnace enclosure walls must be sufficiently superheated so that wet steam does not pass through the in-line steam/water separators, as the latter are only meant to collect water during start-up when the boiler is controlled similar to a drum type boiler. Options other than raising the furnace height include: § Internal Furnace Heat Transfer Surface. Internal, full-height, evaporator tube panels can be
installed within the furnace so that the furnace height can be minimized. The diameter and spacing of the panel tubes, however, must be carefully selected so that their
29
thermal/hydraulic performance is similar to the furnace enclosure tubes thereby ensuring equal exiting steam temperatures.
§ INTREXTM Heat Exchanger Solids Bypass. An operational adjustment that can be made to
ensure a sufficient level of superheat leaving the furnace walls is to bypass solids around the INTREXTM superheaters; this will raise the temperature of the solids returning to the furnace and, hence, the furnace temperature for increased heat transfer to the walls. Solids are returned to the furnace via liftlegs and, by increasing the liftleg aeration rates, the solids return/bypass rates can be increased. (see Figure 1.5.8).
Superheater. There are several options for locating superheater heat transfer surface in a CFB boiler; they include wing walls or Omega panels within the furnace, convection tube bundles in the HRA, and/or tube bundles within INTREXTM heat exchangers. As steam temperatures are pushed to higher levels, there are limitations on where the finishing superheater (FSH) can be located. For example, if the FSH is located in the HRA, it will become difficult to maintain both full main and full reheat steam temperature over the load range for extended steam turbine life, e.g., as load is markedly reduced the furnace exit temperature will decrease and the flue gas temperature will approach the required steam temperature. Although the furnace exit gas temperature will decrease at part load, the temperature in the lower portion of the furnace will experience a much smaller temperature decrease. With the steam flow rate reduced at part load, the steam temperature in intermediate superheat wing walls located in the lower portion of the furnace will rise. Walls fabricated from T91 tube material have a temperature limit of about 1150ºF. Beyond this temperature, the material would have to be upgraded to stainless steels that require expensive post weld heat treatment. As a result, it is better to locate the high temperature FSH in the furnace wing walls positioned higher up in the furnace so that they would not experience a part load, high metal temperature condition. However, the panels would still be limited to the requirements for T91 material. The best location for the finishing superheater (FSH) is within the INTREXTM heat exchangers. The serpentine tube coils can be fabricated from stainless or other high grade materials without fabrication limitations. Here, the fine particle size of the bubbling fluidized bed provides high heat transfer coefficients that minimize the amount of heat transfer surface required. In addition, the circulating solids are hot enough/have a sufficiently high temperature head to achieve the levels of superheat temperature required for the most advanced supercritical steam cycles. At part load, the solids can also be bypassed around the superheater, if necessary to keep tube metal temperatures under control. Reheater. For locating the reheater, the same options apply as noted for the superheater. However, special consideration must be given to minimize pressure loss and provide sufficient tube cooling. To limit pressure loss, lower mass flux rates are typically used that result in low steam side film heat transfer coefficients. In addition, the reheater’s lower operating pressure results in steam side film properties that also reduce the heat transfer coefficient. Consideration must also be given to the method for reheat steam temperature control. Options include a parallel pass HRA with gas flow proportioning, a series pass HRA with a reheat steam bypass, or location within the INTREXTM heat exchanger using solids bypass and/or varying the fluidizing
30
velocity. Project specific requirements will dictate where best to locate the reheater and the most responsive method for temperature control. 2.0 Executive Summary Electric utility interest in supercritical pressure steam cycles is returning in the US after waning in the 1980s. With typical steam turbine throttle condition of ~3500 psig and 1000ºF, these cycles offer higher plant efficiencies than subcritical pressure plants, along with a proportional reduction in both traditional stack gas pollutants and CO2 release rates. In addition, the desire for even higher efficiencies has sparked interest in ultra supercritical (steam temperatures typically 1100ºF and higher) and advanced ultra supercritical (steam conditions approaching 5000 psig and 1300ºF) steam cycles. The advantages of supercritical (SC) and ultra supercritical (USC) pressure steam conditions have been demonstrated in the high gas temperature, high heat flux environment of pulverized coal-fired boilers. For economies of scale these units are large in size and are frequently in the 800 to 1000 MWe range. Circulating fluidized bed (CFB) boilers were first introduced in the 1970s and are an alternative to pulverized coal-fired (PC) boilers. Exhibiting multi-fuel and low grade fuel capabilities, low emissions, operating flexibility, and high reliability, they have steadily increased in size and, as of the writing of this report, the largest units in operation are the two 300 MWe, natural circulation, CFB boilers supplied by Foster Wheeler to the Jacksonville Electric Authority. Since CFB boilers operate with combustion temperatures and in sizes that are much lower/smaller than those of PC boilers (~1600ºF versus 3500ºF and ~300 MWe versus 1000 MWe), the ability of CFB boilers to accommodate SC, USC, and advanced USC has been questioned. To address this, a study was conducted to develop conceptual designs and cost estimates of USC CFB boilers. Reference [4-1] presented a conceptual design and determined the economics of a USC PC plant operating with 4500psig/1100ºF/1100ºF/1100ºF (double reheat) steam turbine conditions; the plant had a net power output of 399.7 MWe and a higher heating value (HHV) efficiency of 41.4 percent. To permit a consistent comparison of technologies, the USC CFB study was conducted for the same site conditions, the same SO2 and NOx lb/MMBtu emission rates, and included a study case with the same steam conditions and output. In addition to that 400 MWe double reheat case, the CFB study also studied single reheat in nominal 400 MWe and 800 MWe plant sizes. Assuming tubing and piping materials could be developed that would result in component thicknesses that would be similar to those of USC boilers, a nominal 800 MWe CFB design was developed for advanced USC steam conditions. The move to 400 and 800 MWe supercritical CFB boilers represents a significant design change and scale-up. Items to be considered in such a scale-up are the design of:
1.) the furnace/riser where combustion occurs 2.) the solids separators that remove entrained particulate from the combustion exhaust 3.) the gas heat recovery area (HRA) that cools the combustion gas exiting the separators 4.) the fluidized bed heat exchangers that cool the particulate collected by the separators for
return to the base of the furnace
31
5.) the overall integration of the CFB boiler steam-water circuitry with the HRA and furnace hot circulating loop of solids.
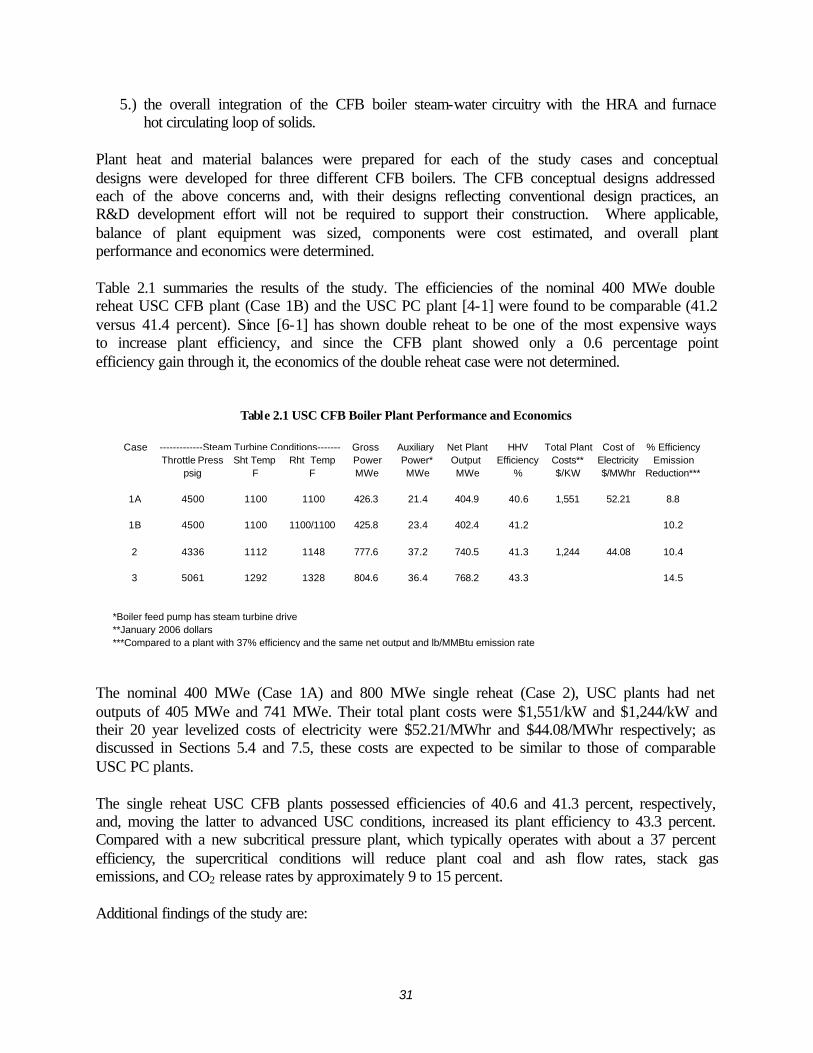
Plant heat and material balances were prepared for each of the study cases and conceptual designs were developed for three different CFB boilers. The CFB conceptual designs addressed each of the above concerns and, with their designs reflecting conventional design practices, an R&D development effort will not be required to support their construction. Where applicable, balance of plant equipment was sized, components were cost estimated, and overall plant performance and economics were determined. Table 2.1 summaries the results of the study. The efficiencies of the nominal 400 MWe double reheat USC CFB plant (Case 1B) and the USC PC plant [4-1] were found to be comparable (41.2 versus 41.4 percent). Since [6-1] has shown double reheat to be one of the most expensive ways to increase plant efficiency, and since the CFB plant showed only a 0.6 percentage point efficiency gain through it, the economics of the double reheat case were not determined.
Table 2.1 USC CFB Boiler Plant Performance and Economics
Case -------------Steam Turbine Conditions------------Gross Auxiliary Net Plant HHV Total Plant Cost of % EfficiencyThrottle Press Sht Temp Rht Temp Power Power* Output Efficiency Costs** Electricity Emission
psig F F MWe MWe MWe % $/KW $/MWhr Reduction***
1A 4500 1100 1100 426.3 21.4 404.9 40.6 1,551 52.21 8.8
1B 4500 1100 1100/1100 425.8 23.4 402.4 41.2 10.2
2 4336 1112 1148 777.6 37.2 740.5 41.3 1,244 44.08 10.4
3 5061 1292 1328 804.6 36.4 768.2 43.3 14.5
*Boiler feed pump has steam turbine drive**January 2006 dollars***Compared to a plant with 37% efficiency and the same net output and lb/MMBtu emission rate
The nominal 400 MWe (Case 1A) and 800 MWe single reheat (Case 2), USC plants had net outputs of 405 MWe and 741 MWe. Their total plant costs were $1,551/kW and $1,244/kW and their 20 year levelized costs of electricity were $52.21/MWhr and $44.08/MWhr respectively; as discussed in Sections 5.4 and 7.5, these costs are expected to be similar to those of comparable USC PC plants. The single reheat USC CFB plants possessed efficiencies of 40.6 and 41.3 percent, respectively, and, moving the latter to advanced USC conditions, increased its plant efficiency to 43.3 percent. Compared with a new subcritical pressure plant, which typically operates with about a 37 percent efficiency, the supercritical conditions will reduce plant coal and ash flow rates, stack gas emissions, and CO2 release rates by approximately 9 to 15 percent. Additional findings of the study are:
32
1.) Since CFB furnace heat fluxes are lower and more uniform than PC boilers:
a. CFB furnace enclosure walls can be constructed from straight, self supporting, vertical tubes rather than the complex spiral wound tube designs of PC boilers that require a special support system.
b. CFB furnace walls can operate at water mass flow rates much lower than a PC boiler without the need for internal rifling and still be protected from DNB.
c. With smooth tubes and lower water mass flow rates being used, CFB furnace wall frictional pressure losses are lower than hydrostatic pressure losses and unlike USC PC boilers:
i. USC CFB boilers will require less boiler feed pump power. ii. CFB furnace walls will operate with a self compensating, natural
circulation characteristic wherein an excessively heated tube will experience an increase in water flow that will minimize the tube-to-tube temperature differences that could lead to tube failures.
2.) With CFB furnace heights and depths limited to approximately 165 and 40 feet from the
standpoint of heat transfer effectiveness and the ability to distribute fuel and secondary air across the furnace cross section, the move to larger capacities will be essentially achieved by modular type width increases:
a. Large CFB boilers will be constructed from nominal 100 MWe type building
block modules, each consisting of a section of furnace section linked to two solids separators placed side by side and then opposite each other to reach 400 and 800 MWe sizes.
3.) Including coal and limestone feed silos, air fans, and air heater, a 400 MWe USC CFB
boiler will occupy a foot print approximately 180 feet by 275 feet and be supported by structural steel approximately 225 feet above grade. The comparable dimensions of the nominal 800 MWe units are 200 by 300 by 250 feet.
4.) Computer model simulations of the 400 MWe and 800 MWe units have predicted furnace
heat release patterns, heat flux profiles, pressure profiles, oxygen profiles, and maximum tube wall temperatures that are consistent with Foster Wheeler CFB boiler design standards.
6.) Part load analyses have shown that superheat and reheat steam temperatures can be
maintained at full load values over the 40 to 100 percent load range, whereas, 50 to 100 percent is typical of PC boilers.
7.) Despite the CFB’s relatively low ~1600ºF combustion temperature, the 1300ºF steam
temperature of advanced USC cycles can be accommodated by operating Foster Wheeler’s INTREX fluidized bed heat exchangers with patented internal solids circulation.
33
8.) The physical arrangements of the 400 MWe and 800 MWe USC units reflect conventional Foster Wheeler CFB boiler configurations and can be deployed without the need for R&D development work.
9.) The physical arrangement of the 800 MWe CFB boiler operating with advanced USC
steam conditions also reflects conventional Foster Wheeler CFB design practices but will require the development of new tube/pipe materials.
10.) The efficiencies and economics of 400 MWe and 800 MWe USC CFB and PC boiler
plants are expected to be comparable.
11.) Use of advanced USC conditions (nominally 5061psig/1300ºF/1300ºF) will increase the efficiency of the 800 MWe CFB plant to 43.3 percent
In summary, this study has shown that the move to 400 MWe and 800 MWe size USC CFB boilers is technically feasible, economically viable, and will involve minimal scale-up risk. In addition, the higher plant efficiencies that supercritical conditions provide will enable the plant to operate with less fuel consumption and a proportional reduction in waste ash flow rates, traditional stack gas pollutants, and CO2 release rates; depending upon the supercritical conditions selected, the fuel and emission rates will be approximately 9 to 15 percent lower than a new, subcritical pressure plant operating with 37 percent efficiency. Hence, supercritical CFB boilers will be a viable means for meeting the present and future economic and environmental needs of the US electric utility industry. 3.0 Proposed Program / Economic and Costing Methodology 3.1 General Approach The cost and economics of the USC CFB plants presented in later sections were determined by Foster Wheeler’s CFB State of the Art Power Plant (SOAPP) Program. The CFB SOAPP Plant Evaluation Program is a software product that was developed by Foster Wheeler and the Electric Power Research Institute (EPRI). Foster Wheeler Power Group developed the boiler programming and provided tailored collaboration funding and technical support for development of the balance of the plant. At present, the working spreadsheet version is available only to Foster Wheeler and EPRI. Foster Wheeler has customized this version for its own use, incorporating many of its design standards and revising the program output for presentation to prospective customers. The CFB SOAPP Plant Evaluation Program is a software tool used to evaluate both circulating fluidized bed boiler and balance of plant design alternatives as well as assess their impact on overall plant performance and economics. Although the program has the ability to calculate for specific project site conditions CFB plant performance (including boiler efficiency, turbine heat rate, fuel and sorbent consumption, water consumption, and emissions), its standard design algorithms can be bypassed to allow more advanced/customized designs to be utilized. With the USC operating conditions of this study being non standard, the SOAPP customized design options were utilized e.g. ASPEN simulations were generated to establish operating conditions
34
for each advanced plant configuration and a CFB boiler design complete with auxiliaries was developed and cost estimated for each case. With that specialized data input, the program was used to complete the sizing and cost estimating of balance of plant equipment including: Fuel Preparation and Handling Systems Mills/crushers Fuel storage and handling Conveying Sorbent Preparation and Handling Systems Mills/crushers Storage and handling Conveying Drying Inert Systems Storage and handling Ash Handling Ash conveying from boiler (bottom ash) Ash conveying from boiler (economizer/air heater ash) Ash conveying from ESP/baghouse Ash conditioning Ash storage Water Treatment Cycle chemistry Makeup demineralizer Demineralized and raw water tanks Waste water treatment Stack Stack sizing and number of flues Stack materials Turbine Cycle Steam turbine-generator Condensate pump Feedwater heaters Boiler feed pump Heat Rejection Systems Condenser Once-through systems Mechanical draft cooling towers Circulating water pumps
35
Service water pumps Closed cooling water system SCR (when applicable) Anhydrous ammonia Aqueous ammonia Electrical Systems Transformer/bus ducts Switchgear Switchyard Cables/wiring Civil / Structural Overall plant dimensions and arrangement Boiler building structure Turbine building structure Miscellaneous structures Foundations Wind load adjustment factors Seismic zone adjustment factors Plant Control Systems Distributed control system Local control systems Ancillary Systems Continuous Emission Monitoring (CEM) Instrumentation Plant and instrument air systems Installation costs for the above were also calculated by the program using labor conditions specified for the study site. Economic Analysis The preceding calculated design and performance values provide relationships for calculating capital, operating and maintenance (O&M), financial, and other economic parameters. The financial feature of the program was used to determine overall plant costs and economics and yield a levelized cost of electricity (COE). The program calculated the following costs in order to construct the pro forma: Total Capital Requirements Equipment Bulk materials and labor
36
Engineering and home office labor Contingency Start-up Working capital Land Interest during construction Other financing costs Debt service reserve O&M and Production Costs Fixed O&M Plant Staff Normal Maintenance Replacement reserve Insurance Miscellaneous Variable O&M Limestone Ash Water & treatment Ammonia Fuel cost Financial Pro-Forma A Financial pro-forma can be generated by the program for both Independent Power Producer and Investor Owned Utility (IOU) calculations based on the above cost and technical data, as well as user input economic parameters; IOU calculations were the basis for this study. The following cost elements are included in the program’s financial output based on an IOU financing approach:
• Book depreciation • Deferred income tax • Normalization of investment tax credit • Interest expense • State and Federal income taxes • Recovery of preferred stock, including AFUDC • Recovery of common equity, including AFUDC • Total capital recovery • Return on equity
The program uses the following in determining project rates of return (IRR) and debt coverage ratios for IOU projects
• Tax depreciation (MACRS), depends on fuel type
37
• Interest expense, up to 3 loans • Principal payment • State and Federal income taxes • Interest during construction • Commitment fees • Debt service reserve • Closing costs • Carry forward tax losses (optional)
3.2 Economic Factors The cost and economic assumptions used in this study are given in Tables 3.2.1 and 3.2.2. 3.3 Cost Estimate Basis and Assumptions The general estimate basis and assumptions are identified below:
• Total plant costs are expressed in January 2006 dollars.
• The estimate represents a mature technology plant, or "nth plant" (i.e., it does not include costs associated with a first-of-a-kind plant).
• The estimate represents a complete plant facility.
• The estimate boundary limit is defined as the total plant facility within the "fence line"; it
begins at the rail road tracks entering the plant and terminates at the high side of the main power transformers. River water is assumed to be available for cooling tower and demineralizer make up and is reasonably proximate to the site.
• Site location is within the Ohio River Valley, southwestern Pennsylvania/eastern Ohio,
but not specifically sited within the region.
• Terms used in connection with the estimate are consistent with the EPRI Technical Assessment Guidelines (TAG) [3-1].
• Costs are grouped for the most part according to a process/system-oriented code of
accounts; all reasonably allocable components of a system or process are included in the specific system account in contrast to a facility, area, or commodity account structure.
• Design engineering services, including construction management and contingencies are
expressed as a percentage of equipment costs delivered and erected at the job site.
• The fuel cost was developed on the basis of a straightforward calculation involving the plant size, plant heat rate, coal higher heating value, coal unit cost, plant annual operating hours, and a levelizing factor.
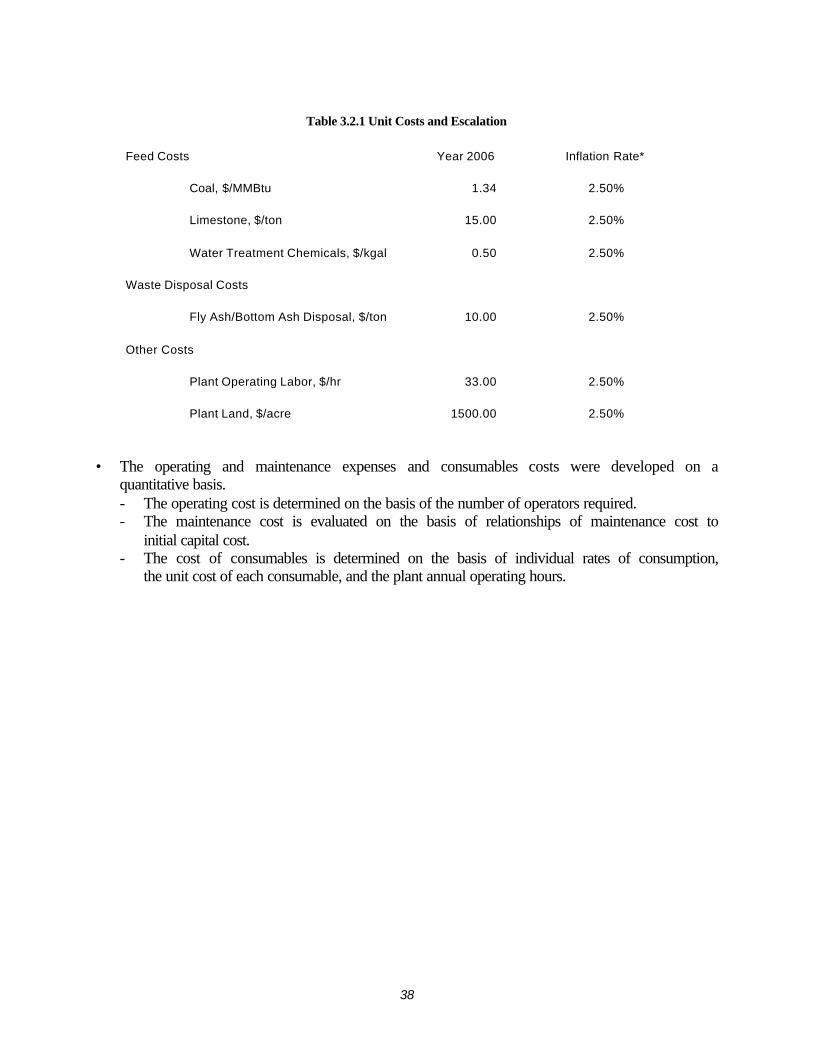
38
Table 3.2.1 Unit Costs and Escalation
Feed Costs Year 2006 Inflation Rate*
Coal, $/MMBtu 1.34 2.50%
Limestone, $/ton 15.00 2.50%
Water Treatment Chemicals, $/kgal 0.50 2.50%
Waste Disposal Costs
Fly Ash/Bottom Ash Disposal, $/ton 10.00 2.50%
Other Costs
Plant Operating Labor, $/hr 33.00 2.50%
Plant Land, $/acre 1500.00 2.50%
• The operating and maintenance expenses and consumables costs were developed on a
quantitative basis. - The operating cost is determined on the basis of the number of operators required. - The maintenance cost is evaluated on the basis of relationships of maintenance cost to
initial capital cost. - The cost of consumables is determined on the basis of individual rates of consumption,
the unit cost of each consumable, and the plant annual operating hours.
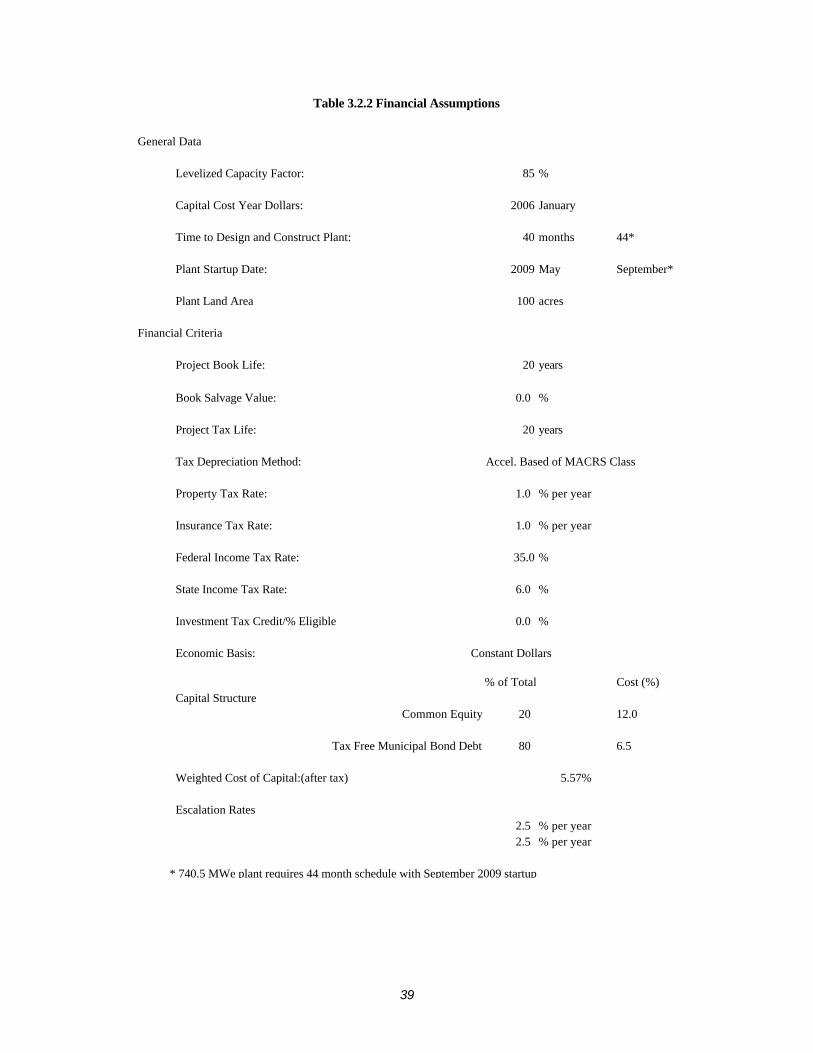
39
Table 3.2.2 Financial Assumptions
General Data
Levelized Capacity Factor: 85 %
Capital Cost Year Dollars: 2006 January
Time to Design and Construct Plant: 40 months 44*
Plant Startup Date: 2009 May September*
Plant Land Area 100 acres
Financial Criteria
Project Book Life: 20 years
Book Salvage Value: 0.0 %
Project Tax Life: 20 years
Tax Depreciation Method: Accel. Based of MACRS Class
Property Tax Rate: 1.0 % per year
Insurance Tax Rate: 1.0 % per year
Federal Income Tax Rate: 35.0 %
State Income Tax Rate: 6.0 %
Investment Tax Credit/% Eligible 0.0 %
Economic Basis: Constant Dollars
% of Total Cost (%) Capital Structure
Common Equity 20 12.0
Tax Free Municipal Bond Debt 80 6.5
Weighted Cost of Capital:(after tax) 5.57%
Escalation Rates2.5 % per year2.5 % per year
* 740.5 MWe plant requires 44 month schedule with September 2009 startup
40
Each of these expenses and costs is determined on a first-year basis and levelized at the 20-year life of the plant through application of a levelizing factor to determine the electricity production cost. 3.4 Cost Elements 3.4.1 Capital Costs The capital cost, specifically referred to as total capital requirement (TCR) for the mature USC power plant, was estimated using the EPRI methodology identified in Figure 3.4.1.1. The major components of TCR consist of bare erected cost, total plant cost (TPC), total plant investment (TPI), and owner's costs. The capital cost was determined through the process of estimating the cost of major equipment items, components, and bulk quantities identified. A Code of Accounts was developed to provide the required structure for the estimate. The Code facilitates the consistent allocation of individual costs and provides recognition of battery limits and the scope included in each account. 3.4.2 Bare Erected Cost The bare erected cost level of the estimate, also referred to as the sum of process capital and general facilities capital, consists of the cost of factory equipment, field materials and supplies, direct labor, indirect field labor, and indirect construction costs. 3.4.3 Total Plant Cost (TPC) The TPC level of the estimate consists of the bare erected cost plus engineering and contingencies. Engineering costs represent the cost of architect/engineer services for design/drafting, project construction management services, and fee and were set at 10 percent of the bare erected cost. The cost for engineering services provided by the equipment manufacturers and vendors is included directly in the equipment costs. Allowances for process and project contingencies are also part of the TPC. Since the plant cost estimate assumes a mature technology, the process contingency was zero but a project contingency equal to 10 percent of the sum of bare erected and engineering costs was included. 3.4.4 Total Plant Investment (TPI) The TPI at date of start-up includes escalation of construction costs and allowance for funds used during construction (AFUDC). AFUDC includes interest during construction as well as a similar concept for timing of equity funds over the construction period. TPI is computed from the TPC based on a linear drawdown schedule and the compounded interest (or implied equity rate) in the percentages of debt and equity. Drawdown was over the assumed 40 month construction schedule for the 405 MW plant, and 44 months for the 740 MW plant. As the analysis is done in
41
constant 2006 dollars, no escalation was applied. The full AFUDC is used in calculating returns on debt and equity, but only the interest during construction is included in the depreciation base. 3.4.5 Total Capital Requirement (TCR) The TCR includes all capital necessary to complete the entire project. TCR consists of TPI, prepaid royalties, pre-production (or start-up) costs, inventory capital, initial chemical and catalyst charge, and land cost: • Royalty Costs have been assumed to be zero, as none apply. • Start-Up/Pre-Production Costs are intended to cover operator training, equipment checkout,
extra maintenance, and use of fuel and other materials during plant start-up. They are estimated as follows: - hiring and phasing-in prior to and during start up of operating and maintenance labor,
administrative and support labor, variable operating costs ramped up to full capacity (including fuel, chemicals, water, and other consumables and waste disposal charges. These variable costs are assumed to be compensated by electric energy payments during the start up period.
- costs of spare parts usage, and expected changes and modifications to equipment that may be needed to bring the plant up to full capacity.
• Inventory capital is the value of inventories of fuel, other consumables, and by-products, which are capitalized and included in the inventory capital account. The inventory capital is estimated as follows: - Fuel inventory is based on full-capacity operation for 30 days. - Inventory of other consumables (excluding water) is normally based on full-capacity
operation for the same number of days as specified for the fuel. - ½ percent of the TPC equipment cost is included for spare parts.
• Initial catalyst and chemical charge covers the initial cost of any catalyst or chemicals that are contained in the process equipment (but not in storage, which is covered in inventory capital). No value is shown because costs are assumed to have been included in the component equipment capital cost.
• Land cost is based on 100 acres of land at $1,500 per acre.
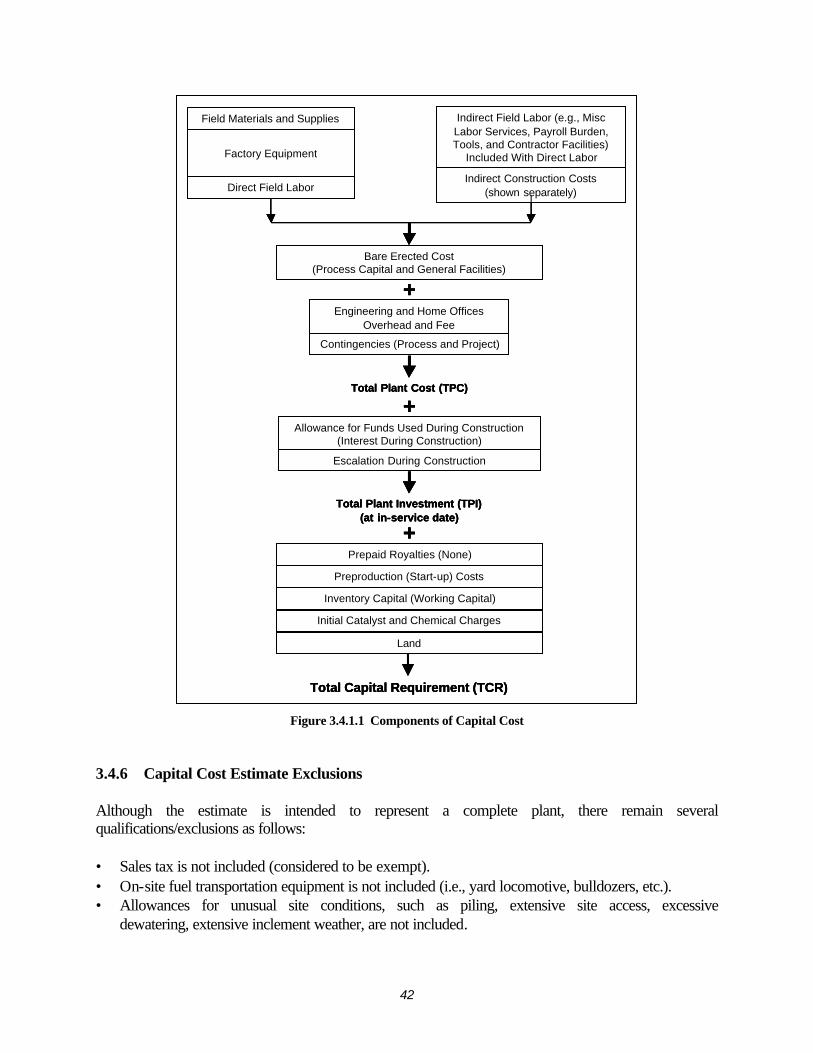
42
Field Materials and Supplies
Factory Equipment
Direct Field Labor
Indirect Field Labor (e.g., Misc Labor Services, Payroll Burden, Tools, and Contractor Facilities)
Included With Direct Labor
Indirect Construction Costs(shown separately)
Engineering and Home OfficesOverhead and Fee
Contingencies (Process and Project)
Total Plant Cost (TPC)
Allowance for Funds Used During Construction(Interest During Construction)
Escalation During Construction
Total Plant Investment (TPI)(at in-service date)
Prepaid Royalties (None)
Preproduction (Start-up) Costs
Inventory Capital (Working Capital)
Initial Catalyst and Chemical Charges
Land
Total Capital Requirement (TCR)
+
+
+
Bare Erected Cost (Process Capital and General Facilities)
Figure 3.4.1.1 Components of Capital Cost 3.4.6 Capital Cost Estimate Exclusions Although the estimate is intended to represent a complete plant, there remain several qualifications/exclusions as follows: • Sales tax is not included (considered to be exempt). • On-site fuel transportation equipment is not included (i.e., yard locomotive, bulldozers, etc.). • Allowances for unusual site conditions, such as piling, extensive site access, excessive
dewatering, extensive inclement weather, are not included.
43
• Switchyard (transmission plant) is not included. The cost scope terminates at the high side of the main power transformer.
• Ash disposal facility is excluded; only 3-day ash/slag storage silos have been provided (the ash disposal cost is accounted for in the ash disposal charge as part of consumables costs).
• Royalties. 3.4.7 Operating and Maintenance (O&M) Costs The costs and expenses associated with operating and maintaining the plant include: • Operating labor • Maintenance
- Material - Labor
• Administrative and support labor The cost of operating labor was based on an estimate of the staffing needed to operate the plant whereas the annual maintenance costs were taken as a percentage of TPC. The operating labor, maintenance material and labor, and other labor-related costs are combined to give a total operating and maintenance cost which is then divided into two components: 90 percent for fixed O&M, which is independent of operation, and 10 percent for variable O&M, which is proportional to operation. The first-year costs are in January 2006 dollars with an 85 percent capacity factor and assume normal operation. These O&M costs do not include the initial start-up costs, which are computed separately. A 20-year levelizing factor is applied to the first-year costs and expenses to arrive at appropriate values that contribute to the cost of electricity. The other operating costs, consumables and fuel, are determined on a daily 100 percent operating capacity basis and adjusted to an annual plant operation basis, equivalent to operating at 100 percent load for 85 percent of the year (plant capacity factor). The development of the actual values was consistent with TAG. 3.4.8 Consumable Costs Costs included in this category are listed in Table 3.4.8.1 and include: • Consumables • By-product credit (if applicable) • Auxiliary fuel cost (start-up fuel) Feedstock and disposal costs are those consumable expenses associated with normal plant operation. Consumable operating costs are developed on a first-year basis and subsequently levelized over a 20-year period. The consumables category consists of water, chemicals, other consumables, and waste disposal.
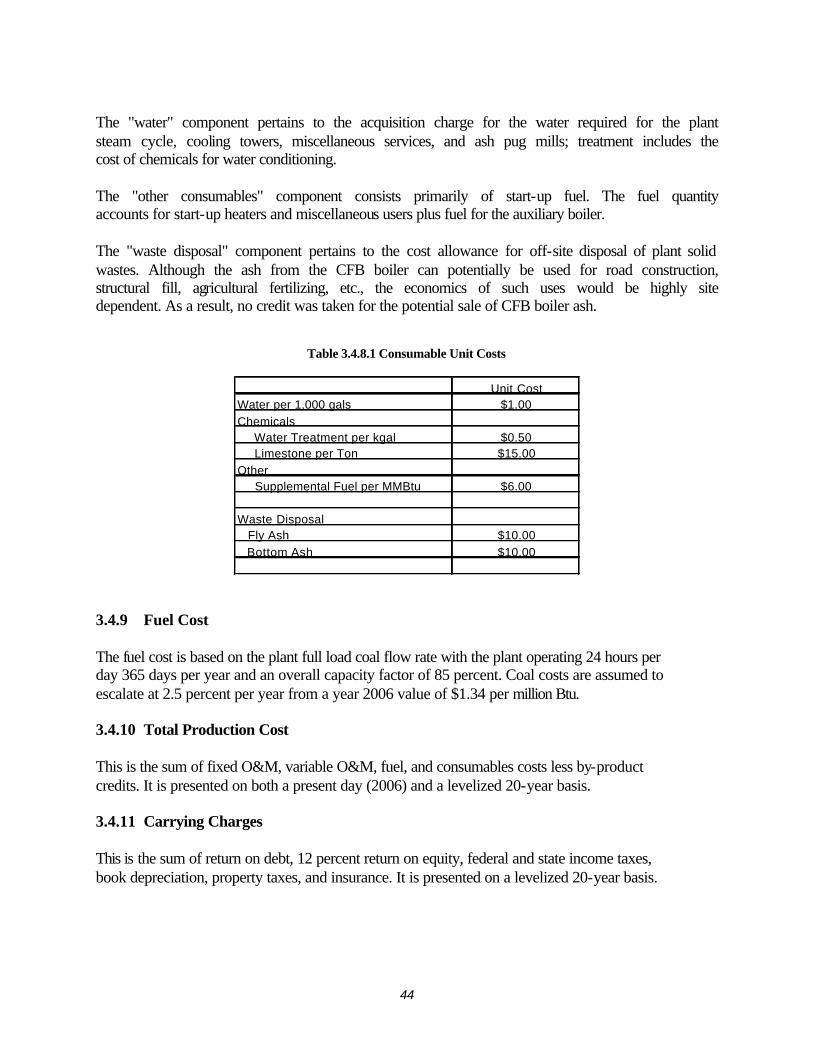
44
The "water" component pertains to the acquisition charge for the water required for the plant steam cycle, cooling towers, miscellaneous services, and ash pug mills; treatment includes the cost of chemicals for water conditioning. The "other consumables" component consists primarily of start-up fuel. The fuel quantity accounts for start-up heaters and miscellaneous users plus fuel for the auxiliary boiler. The "waste disposal" component pertains to the cost allowance for off-site disposal of plant solid wastes. Although the ash from the CFB boiler can potentially be used for road construction, structural fill, agricultural fertilizing, etc., the economics of such uses would be highly site dependent. As a result, no credit was taken for the potential sale of CFB boiler ash.
Table 3.4.8.1 Consumable Unit Costs
Water per 1,000 gals
Chemicals Water Treatment per kgal Limestone per Ton
Other Supplemental Fuel per MMBtu
Waste Disposal Fly Ash
Bottom Ash
$1.00Unit Cost
$10.00
$10.00
$6.00
$0.50$15.00
3.4.9 Fuel Cost The fuel cost is based on the plant full load coal flow rate with the plant operating 24 hours per day 365 days per year and an overall capacity factor of 85 percent. Coal costs are assumed to escalate at 2.5 percent per year from a year 2006 value of $1.34 per million Btu. 3.4.10 Total Production Cost This is the sum of fixed O&M, variable O&M, fuel, and consumables costs less by-product credits. It is presented on both a present day (2006) and a levelized 20-year basis. 3.4.11 Carrying Charges This is the sum of return on debt, 12 percent return on equity, federal and state income taxes, book depreciation, property taxes, and insurance. It is presented on a levelized 20-year basis.
45
3.4.12 Cost of Electricity (COE) The revenue requirement method is widely used in the electric utility industry to perform an economic analysis of a prospective new power plant. This method permits the various dissimilar components of a new plant to be incorporated into a value that can be compared with various alternatives. From a cost of electricity standpoint the revenue requirement figure-of-merit is the levelized (over plant life) coal pile-to-buss bar cost of electricity expressed in $/MWhr. The value, based on EPRI definitions and methodology, includes the TCR, which is represented in the levelized carrying charge (sometimes referred to as the fixed charges), 20-year levelized fixed and variable operating and maintenance costs, 20-year levelized consumables operating costs, and 20 year levelized fuel cost. The levelized carrying charge, applied to TCR, establishes the required revenues to cover return on equity, interest on debt, depreciation, income tax, property tax, and insurance. Levelizing factors are applied to the first-year fuel, O&M, and consumables costs to yield 20-year levelized costs. A long-term inflation rate of 2.5 percent per year was assumed in estimating the cost of capital and in estimating the life-cycle revenue requirements for other expenses (includes coal escalated at 2.5 percent per year). To represent these varying revenue requirements for fixed and variable costs, a "levelized" value was computed using the "present worth" concept of money based on the assumptions shown in Table 3.2.1 and 3.2.2. By combining costs and carrying charges, a levelized 20 year cost of producing electricity was calculated by the following: Levelized COE* = (LCC+LFOM+LVOM+LCM–LLB+LFC) / MWhr of Electricity per Year LCC = Levelized Carrying charge, $/yr LFOM = Levelized Fixed O&M, $/yr LVOM = Levelized Variable O&M, $/yr LCM = Levelized Consumables*, $/yr LBPC = Levelized By-product credit* (if any), $/yr LFC = Levelized Fuel costs*, $/yr * all for an 85 percent plant capacity factor 4.0 Experimental / General Basis for USC CFB Design Study To allow a consistent comparison of technologies the site conditions used for the USC CFB based plants were the same as those used in [4-1]. 4.1 Plant Site Conditions The CFB plants assume a common generic site with conditions representing a typical Ohio River Valley site. Table 4.1.1 lists the characteristics of this site.
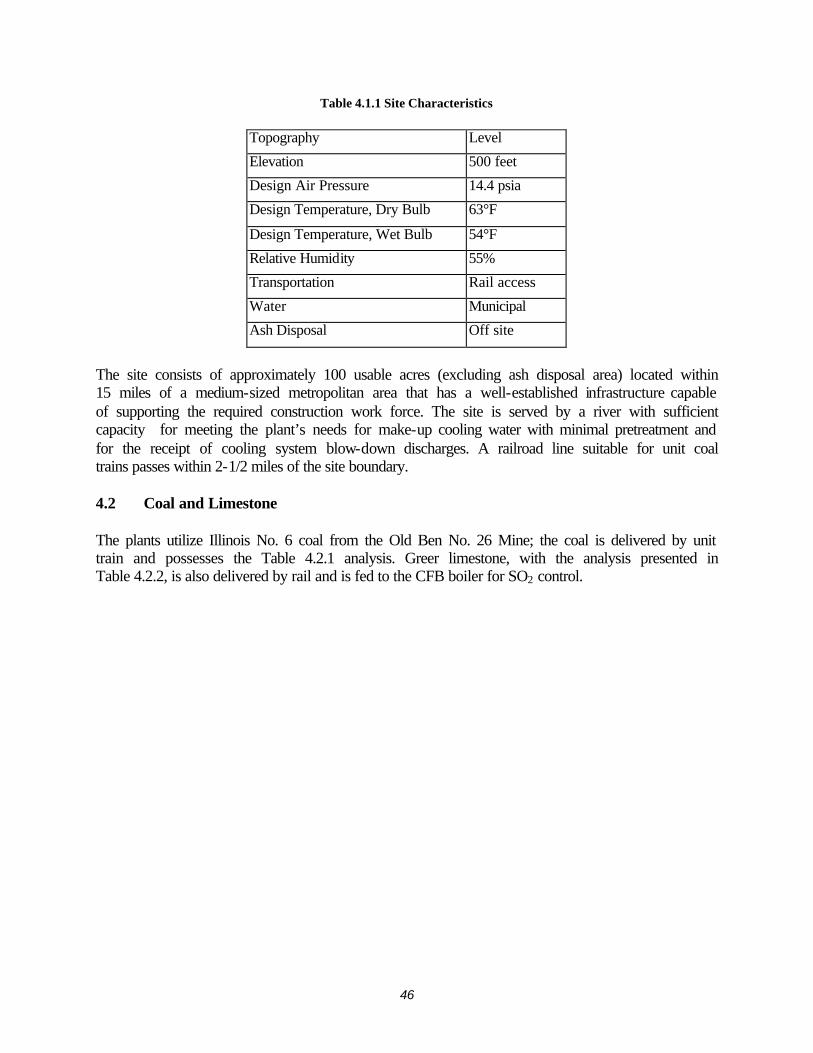
46
Table 4.1.1 Site Characteristics
Topography Level
Elevation 500 feet
Design Air Pressure 14.4 psia
Design Temperature, Dry Bulb 63°F
Design Temperature, Wet Bulb 54°F
Relative Humidity 55%
Transportation Rail access
Water Municipal
Ash Disposal Off site
The site consists of approximately 100 usable acres (excluding ash disposal area) located within 15 miles of a medium-sized metropolitan area that has a well-established infrastructure capable of supporting the required construction work force. The site is served by a river with sufficient capacity for meeting the plant’s needs for make-up cooling water with minimal pretreatment and for the receipt of cooling system blow-down discharges. A railroad line suitable for unit coal trains passes within 2-1/2 miles of the site boundary. 4.2 Coal and Limestone The plants utilize Illinois No. 6 coal from the Old Ben No. 26 Mine; the coal is delivered by unit train and possesses the Table 4.2.1 analysis. Greer limestone, with the analysis presented in Table 4.2.2, is also delivered by rail and is fed to the CFB boiler for SO2 control.
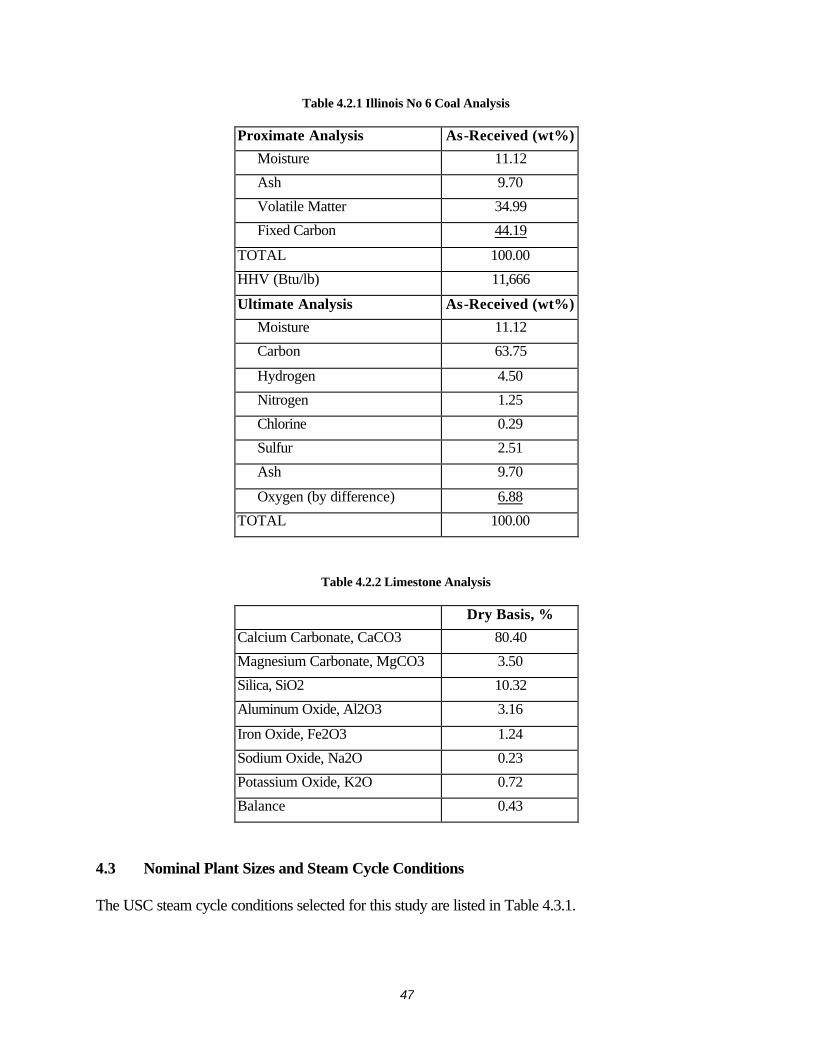
47
Table 4.2.1 Illinois No 6 Coal Analysis
Proximate Analysis As-Received (wt%)
Moisture 11.12
Ash 9.70
Volatile Matter 34.99
Fixed Carbon 44.19
TOTAL 100.00
HHV (Btu/lb) 11,666
Ultimate Analysis As-Received (wt%)
Moisture 11.12
Carbon 63.75
Hydrogen 4.50
Nitrogen 1.25
Chlorine 0.29
Sulfur 2.51
Ash 9.70
Oxygen (by difference) 6.88
TOTAL 100.00
Table 4.2.2 Limestone Analysis
Dry Basis, %
Calcium Carbonate, CaCO3 80.40
Magnesium Carbonate, MgCO3 3.50
Silica, SiO2 10.32
Aluminum Oxide, Al2O3 3.16
Iron Oxide, Fe2O3 1.24
Sodium Oxide, Na2O 0.23
Potassium Oxide, K2O 0.72
Balance 0.43
4.3 Nominal Plant Sizes and Steam Cycle Conditions The USC steam cycle conditions selected for this study are listed in Table 4.3.1.
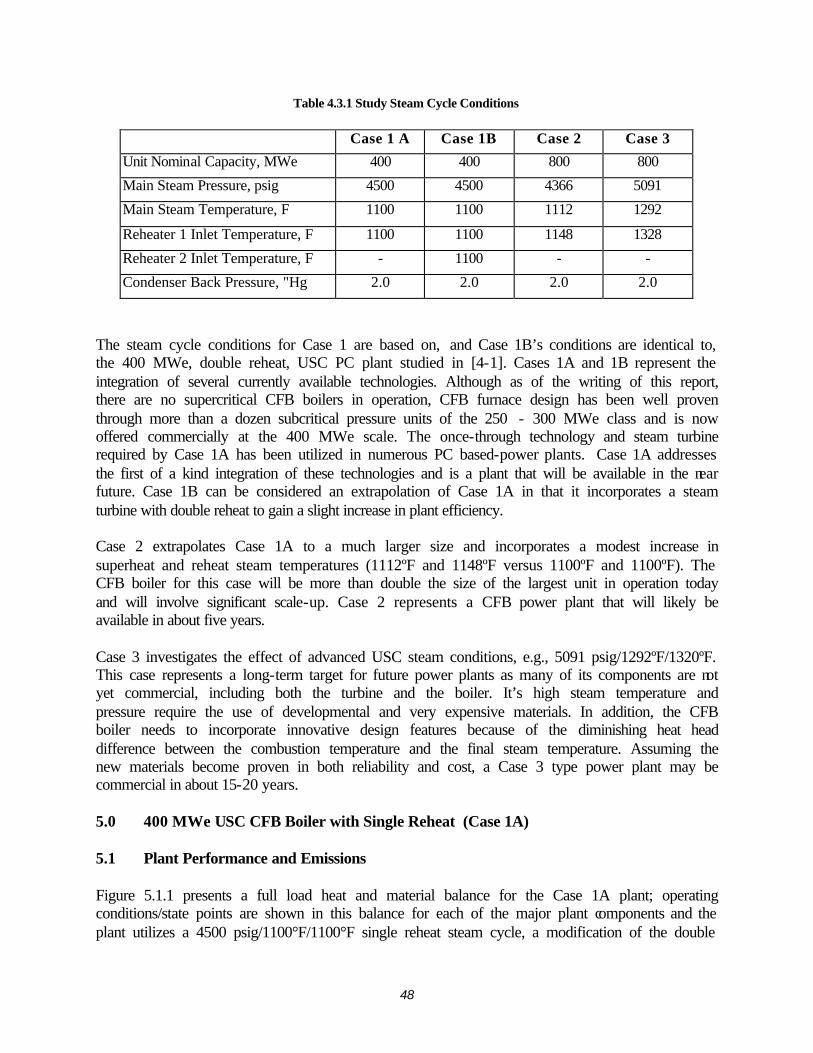
48
Table 4.3.1 Study Steam Cycle Conditions
Case 1 A Case 1B Case 2 Case 3
Unit Nominal Capacity, MWe 400 400 800 800
Main Steam Pressure, psig 4500 4500 4366 5091
Main Steam Temperature, F 1100 1100 1112 1292
Reheater 1 Inlet Temperature, F 1100 1100 1148 1328
Reheater 2 Inlet Temperature, F - 1100 - -
Condenser Back Pressure, "Hg 2.0 2.0 2.0 2.0
The steam cycle conditions for Case 1 are based on, and Case 1B’s conditions are identical to, the 400 MWe, double reheat, USC PC plant studied in [4-1]. Cases 1A and 1B represent the integration of several currently available technologies. Although as of the writing of this report, there are no supercritical CFB boilers in operation, CFB furnace design has been well proven through more than a dozen subcritical pressure units of the 250 - 300 MWe class and is now offered commercially at the 400 MWe scale. The once-through technology and steam turbine required by Case 1A has been utilized in numerous PC based-power plants. Case 1A addresses the first of a kind integration of these technologies and is a plant that will be available in the near future. Case 1B can be considered an extrapolation of Case 1A in that it incorporates a steam turbine with double reheat to gain a slight increase in plant efficiency. Case 2 extrapolates Case 1A to a much larger size and incorporates a modest increase in superheat and reheat steam temperatures (1112ºF and 1148ºF versus 1100ºF and 1100ºF). The CFB boiler for this case will be more than double the size of the largest unit in operation today and will involve significant scale-up. Case 2 represents a CFB power plant that will likely be available in about five years. Case 3 investigates the effect of advanced USC steam conditions, e.g., 5091 psig/1292ºF/1320ºF. This case represents a long-term target for future power plants as many of its components are not yet commercial, including both the turbine and the boiler. It’s high steam temperature and pressure require the use of developmental and very expensive materials. In addition, the CFB boiler needs to incorporate innovative design features because of the diminishing heat head difference between the combustion temperature and the final steam temperature. Assuming the new materials become proven in both reliability and cost, a Case 3 type power plant may be commercial in about 15-20 years. 5.0 400 MWe USC CFB Boiler with Single Reheat (Case 1A) 5.1 Plant Performance and Emissions Figure 5.1.1 presents a full load heat and material balance for the Case 1A plant; operating conditions/state points are shown in this balance for each of the major plant components and the plant utilizes a 4500 psig/1100°F/1100°F single reheat steam cycle, a modification of the double
49
reheat steam cycle shown in [4-1] for a 400 MWe USC PC plant. The CFB plant turbine generator is a single machine comprised of tandem HP, IP, and LP sections that drive a 3600 RPM hydrogen-cooled generator. Steam enters the high-pressure turbine at a rate of 2,710,000 lb/h at 4515 psia and 1100°F and the 2,198,000 lb/h, 854 psia, 640°F cold reheat steam flow is reheated to 1100°F and 789 psia before entering the IP turbine. The turbine exhausts to a single-pressure condenser operating at 2.0 inches of mercury absolute (Hga) backpressure at full load. The feedwater train consists of seven closed feedwater heaters (four low-pressure and three high pressure), and one open feedwater heater (deaerator). Extractions for feedwater heating, deaerating, and the boiler feed pump are taken from the HP, IP, and LP turbine cylinders, and from the cold reheat piping. The [4-1] PC plant operates with a 96 percent sulfur capture efficiency and a NOx release rate of 0.16 lb/MMBtu, values that are achieved through the use of wet flue gas desulfurization, low NOx burners, and the selective catalytic reduction (SCR) of nitrogen. The CFB plant has been designed to match those same emission rates but it uses limestone feed to the CFB boiler for in situ sulfur capture and the CFB’s relatively low furnace temperature, coupled with the staged injection of combustion air, eliminates the need for “back end” flue gas clean up of these contaminants. For particulate control the CFB plant utilizes a pulse jet, fabric filter to remove over 99.9% of the dust in the flue gas. Table 5.1.1 summarizes the performance and auxiliary power consumption of the plant at full load and Table 5.1.2 presents its emissions. The plant net power output is 404.9 MWe and it operates with a higher heating value (HHV) efficiency of 40.6 percent or a heat rate of 8,405 Btu/kWh. The ultra supercritical pressure steam cycle results in a plant efficiency that is approximately 13 percent higher (40.6 versus ~36.0 percent) than that of a comparable subcritical pressure CFB plant. As a result, the ultra supercritical plant operates with approximately 11 percent less coal flow and its Table 5.1.2 emissions are approximately 11 percent less than those of a typical subcritical pressure CFB plant.
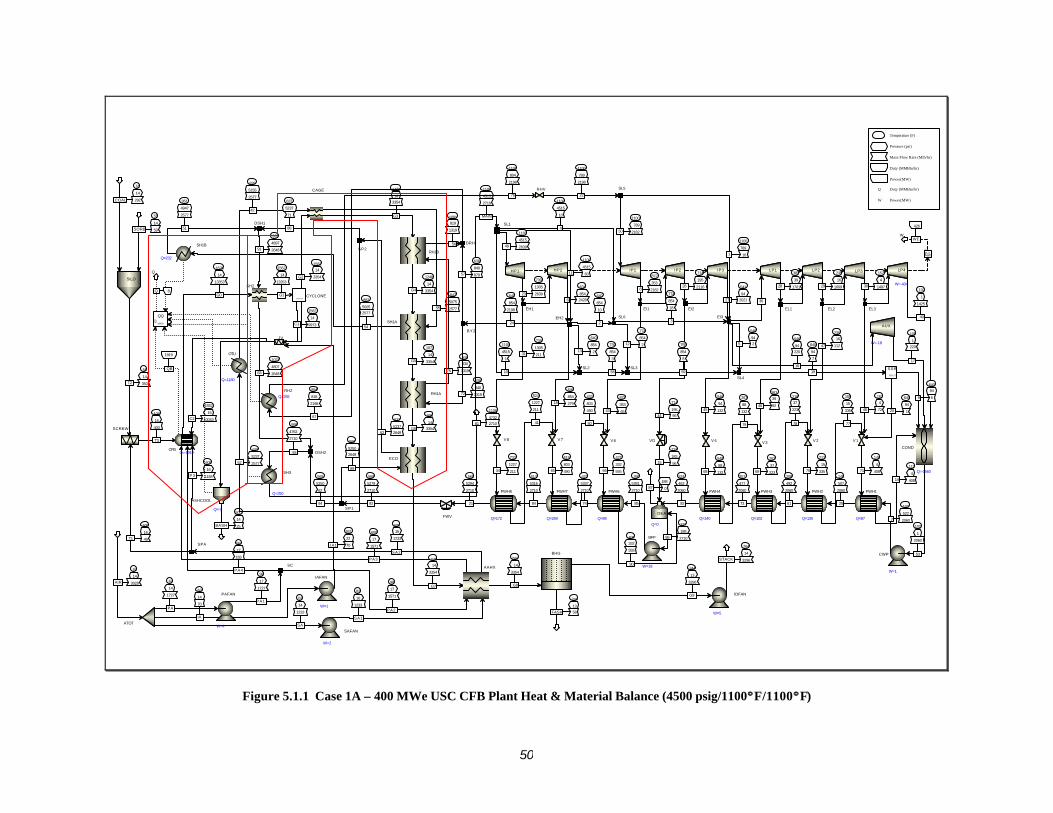
50
106
16
400
T3
1552
15
10043C2
600
16
1184P3
98
17
155
PA4
600
17
1571
PA3
1625
14
13353
G0
1919
QB
55
14
292COAL
55
14
59SORB
56
14
350T2
600
16
49T1
1562
14
13353
G1
1562
14
9973C1
1562
14
3354G2
63
14
70
IA
162
22
70IA1
63
14
3029AIR
63
14
1233
SA
63
14
1727
PA
649
14
3354
G782
16
1233
SA1
98
17
1571
PA2
244
14
3354
G8
600
16
1233
SA2
98
17
1727
PA1
569
5250
2648
89
895
14
3354G6
637
5237
264862
847
5075
257755
1248
14
3354G4
1071
14
3354G5
882
5005
2577
54
828
5155
2577
42
1430
14
3354
G3
839
830
131975
1081
819
1319
56
638
840
131972
244
13
3296
G9244
13
58FASH
264
14
3296STACK
933
4897
264891
1021
4807
264883
500
14
25BASH
634
854
24286
1100
789
218250
872
353
21828
714
195
211626 541
94
202127 36
383
39
170128
235
16
160929
152
4
149730102
1
1425
40
426
WEW
1100
4515
6011
640
854
213
640
854
27918
640
854
2198
24
640
854
10
2
872
353
6543
714
195
9644
1100
789
161
774
854
18
3
546
94
13245
546
94
220
16
546
94
25
383
39
9246
235
16
11247
152
4
7248
1100
4515
2710
MAIN
1100
4515
263949
1100
4515
10
4
1100
4515
1
10
640
94
69
108
1
220
17
112
4
40814
102
1
2060
53
640
94
7
19
640
94
120
713
183
9615
739
854
3
58
774
854
212 755
854
5
59
524
1227
211
41
519
803
49065
432
803
490
80
427
332
55566
545
88
13268
267
88
132
79
262
37
22369
218
37
223
78
213
15
33570
155
15
335
77
149
4
40871
102
522
20607
324
462
2060
82
400
332
555
90
377
188
271086
188
087
390
5381
2710
85
145
507
2060
25
208
492
2060
61
257
477
2060
73
422
5337
2710
74
514
5316
2710
84
1100
789
2198
22
732
1227
21134
569
5294
2710
21
739
1305
263923
739
1305
21131
951
4947
2577
51
637
5237
71
88
637
5237
257752
569
5279
2710
92
569
5250
62
94
998
4762
2710
93
1106
4732
271081
638
840
87957
894
818
2198
67
1101
804
2198
76
8Q
Q
CFBQ=-1919
SILO
SCREW
SSPLITCYCLONE
IAFAN
W=1
ATOT
AAHX
PAFAN
W=4SAFAN
W=2
ECO
SH1A
CAGE
RH1B
RH1A
JV
BHG
IDFAN
W=5
SH2
ASHCOOL
Q=-7
SPA
SC
HP2 IP1 IP2 IP3 LP1 LP2 LP3 LP4
W=-434
W
MULTEG
EH2
EI1 EI2
EI3
EL1 EL2 EL3
SL1
COND
Q=-1560
FSPLIT
SSR
VD
AUX
W=-18
SL2 SL3
V7 V6 V4 V3 V2 V1
CWP
W=1
DEA
Q=0
BFP
W=18
FWH1
Q=87
FWH2
Q=130
FWH3
Q=102
FWH4
Q=140
FWH6
Q=88
FWH7
Q=269
SL5
SL6
SL4
FWH8
Q=172
HP1
EH1
V8
DSH1
SH1B
Q=232
OTU
Q=1180
FWV
SP1
DSH2
SH3
Q=250
BY2
DRH
RH2
Q=255
QMIXER
RHV
SP2
Temperature (F)
Pressure (psi)
Mass Flow Rate (Mlb/hr)
Duty (MMBtu/hr)
Power(MW)
Q Duty (MMBtu/hr)
W Power(MW)
CASE-1As, ST=4500/1100/1100/2.0"Hg, Gross Power=444 MWe, AuxPower=38MW, NetPower=406MWe, Neteff=40.66%, 08/29/05
Figure 5.1.1 Case 1A – 400 MWe USC CFB Plant Heat & Material Balance (4500 psig/1100°° F/1100°° F)
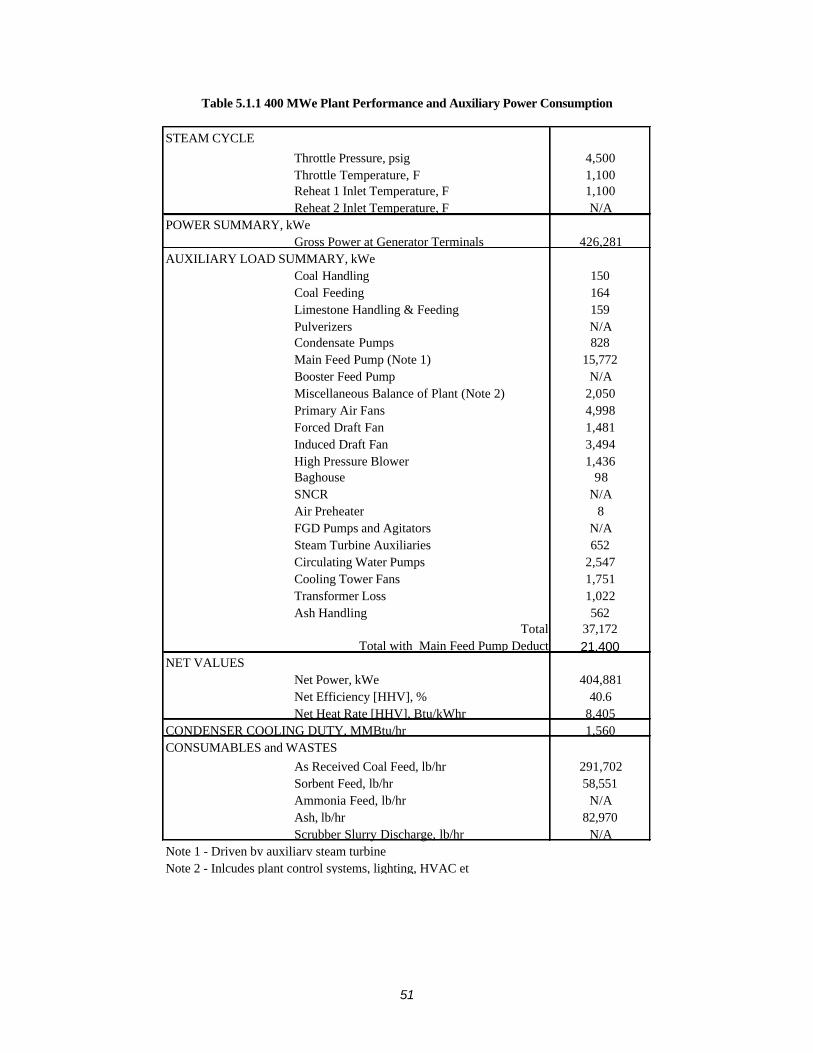
51
Table 5.1.1 400 MWe Plant Performance and Auxiliary Power Consumption
Throttle Pressure, psig 4,500Throttle Temperature, F 1,100Reheat 1 Inlet Temperature, F 1,100Reheat 2 Inlet Temperature, F N/A
POWER SUMMARY, kWeGross Power at Generator Terminals 426,281
Coal Handling 150Coal Feeding 164Limestone Handling & Feeding 159Pulverizers N/ACondensate Pumps 828Main Feed Pump (Note 1) 15,772Booster Feed Pump N/AMiscellaneous Balance of Plant (Note 2) 2,050Primary Air Fans 4,998Forced Draft Fan 1,481Induced Draft Fan 3,494High Pressure Blower 1,436Baghouse 98SNCR N/AAir Preheater 8FGD Pumps and Agitators N/ASteam Turbine Auxiliaries 652Circulating Water Pumps 2,547Cooling Tower Fans 1,751Transformer Loss 1,022Ash Handling 562
37,172Total with Main Feed Pump Deduct 21,400
NET VALUESNet Power, kWe 404,881Net Efficiency [HHV], % 40.6Net Heat Rate [HHV], Btu/kWhr 8,405
1,560
As Received Coal Feed, lb/hr 291,702Sorbent Feed, lb/hr 58,551Ammonia Feed, lb/hr N/AAsh, lb/hr 82,970Scrubber Slurry Discharge, lb/hr N/A
Note 2 - Inlcudes plant control systems, lighting, HVAC et
STEAM CYCLE
CONDENSER COOLING DUTY, MMBtu/hrCONSUMABLES and WASTES
Note 1 - Driven by auxiliary steam turbine
Total
AUXILIARY LOAD SUMMARY, kWe
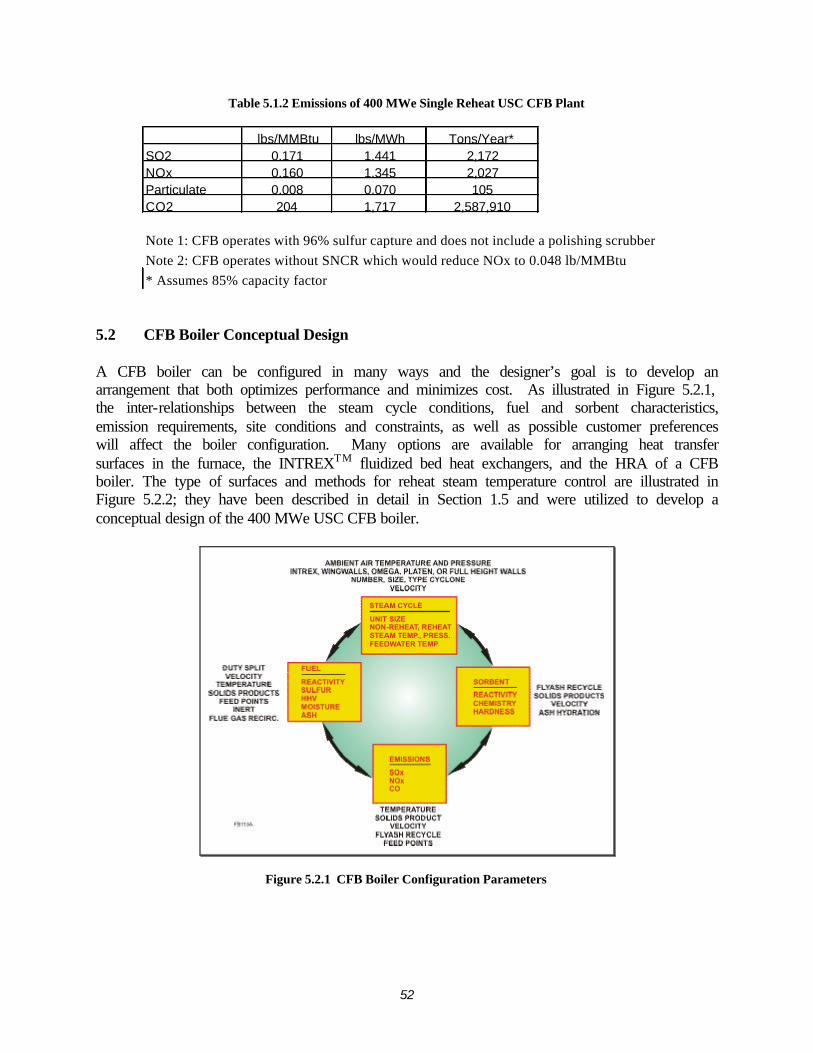
52
Table 5.1.2 Emissions of 400 MWe Single Reheat USC CFB Plant
lbs/MMBtu lbs/MWh Tons/Year* SO2 0.171 1.441 2,172NOx 0.160 1.345 2,027Particulate 0.008 0.070 105CO2 204 1,717 2,587,910
Note 1: CFB operates with 96% sulfur capture and does not include a polishing scrubber
Note 2: CFB operates without SNCR which would reduce NOx to 0.048 lb/MMBtu
* Assumes 85% capacity factor 5.2 CFB Boiler Conceptual Design A CFB boiler can be configured in many ways and the designer’s goal is to develop an arrangement that both optimizes performance and minimizes cost. As illustrated in Figure 5.2.1, the inter-relationships between the steam cycle conditions, fuel and sorbent characteristics, emission requirements, site conditions and constraints, as well as possible customer preferences will affect the boiler configuration. Many options are available for arranging heat transfer surfaces in the furnace, the INTREXTM fluidized bed heat exchangers, and the HRA of a CFB boiler. The type of surfaces and methods for reheat steam temperature control are illustrated in Figure 5.2.2; they have been described in detail in Section 1.5 and were utilized to develop a conceptual design of the 400 MWe USC CFB boiler.
Figure 5.2.1 CFB Boiler Configuration Parameters
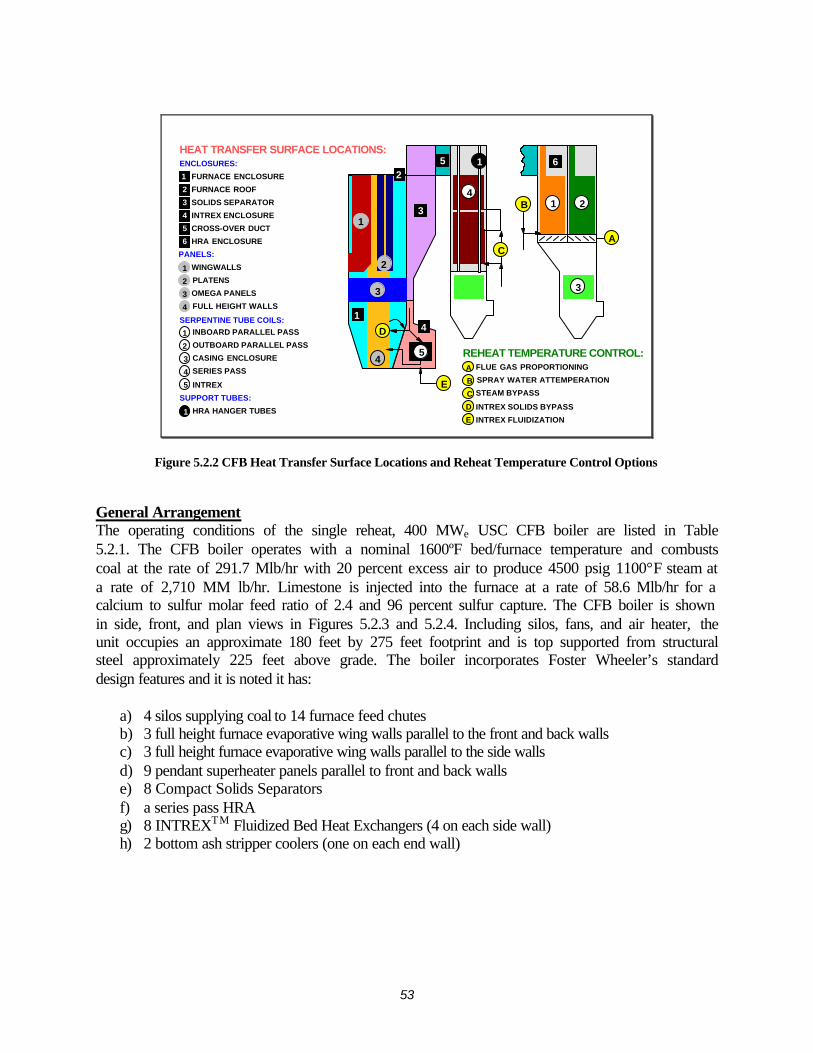
53
HEAT TRANSFER SURFACE LOCATIONS:
1
2
3
4
5
6
1
FURNACE ENCLOSURE
FURNACE ROOF
SOLIDS SEPARATOR
INTREX ENCLOSURE
CROSS-OVER DUCT
HRA ENCLOSURE
2
3
4
WINGWALLS
PLATENS
OMEGA PANELS
FULL HEIGHT WALLS
1
2
3
4
INBOARD PARALLEL PASS
OUTBOARD PARALLEL PASS
CASING ENCLOSURE
SERIES PASS
5 INTREX
1 HRA HANGER TUBES
ENCLOSURES:
PANELS:
SERPENTINE TUBE COILS:
SUPPORT TUBES:
4
5
1
3
C
1 2
A
B
D
E
2
4
3
1
14
3
5 62
REHEAT TEMPERATURE CONTROL:A
B
C
D
FLUE GAS PROPORTIONING
SPRAY WATER ATTEMPERATION
STEAM BYPASS
INTREX FLUIDIZATIONE
INTREX SOLIDS BYPASS
Figure 5.2.2 CFB Heat Transfer Surface Locations and Reheat Temperature Control Options General Arrangement The operating conditions of the single reheat, 400 MWe USC CFB boiler are listed in Table 5.2.1. The CFB boiler operates with a nominal 1600ºF bed/furnace temperature and combusts coal at the rate of 291.7 Mlb/hr with 20 percent excess air to produce 4500 psig 1100°F steam at a rate of 2,710 MM lb/hr. Limestone is injected into the furnace at a rate of 58.6 Mlb/hr for a calcium to sulfur molar feed ratio of 2.4 and 96 percent sulfur capture. The CFB boiler is shown in side, front, and plan views in Figures 5.2.3 and 5.2.4. Including silos, fans, and air heater, the unit occupies an approximate 180 feet by 275 feet footprint and is top supported from structural steel approximately 225 feet above grade. The boiler incorporates Foster Wheeler’s standard design features and it is noted it has:
a) 4 silos supplying coal to 14 furnace feed chutes b) 3 full height furnace evaporative wing walls parallel to the front and back walls c) 3 full height furnace evaporative wing walls parallel to the side walls d) 9 pendant superheater panels parallel to front and back walls e) 8 Compact Solids Separators f) a series pass HRA g) 8 INTREXTM Fluidized Bed Heat Exchangers (4 on each side wall) h) 2 bottom ash stripper coolers (one on each end wall)
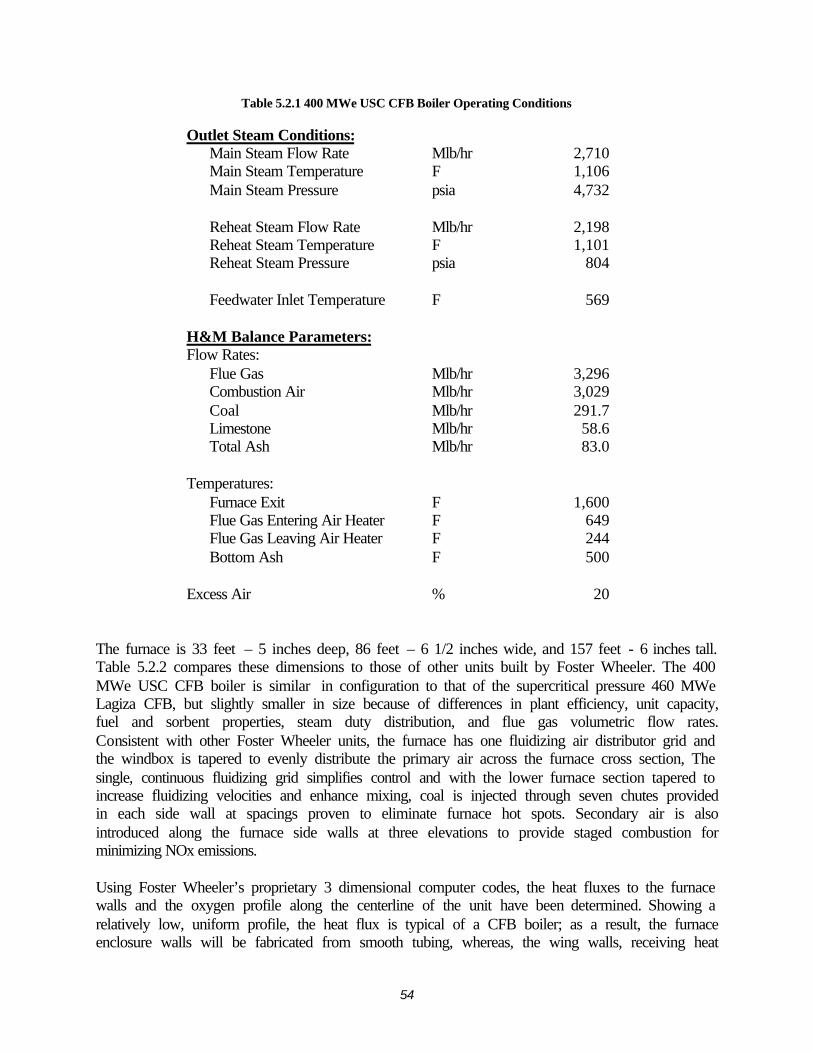
54
Table 5.2.1 400 MWe USC CFB Boiler Operating Conditions
Outlet Steam Conditions: Main Steam Flow Rate Mlb/hr 2,710 Main Steam Temperature F 1,106 Main Steam Pressure psia 4,732 Reheat Steam Flow Rate Mlb/hr 2,198 Reheat Steam Temperature F 1,101 Reheat Steam Pressure psia 804 Feedwater Inlet Temperature F 569
H&M Balance Parameters: Flow Rates:
Flue Gas Mlb/hr 3,296 Combustion Air Mlb/hr 3,029 Coal Mlb/hr 291.7 Limestone Mlb/hr 58.6 Total Ash Mlb/hr 83.0
Temperatures:
Furnace Exit F 1,600 Flue Gas Entering Air Heater F 649 Flue Gas Leaving Air Heater F 244 Bottom Ash F 500
Excess Air % 20
The furnace is 33 feet – 5 inches deep, 86 feet – 6 1/2 inches wide, and 157 feet - 6 inches tall. Table 5.2.2 compares these dimensions to those of other units built by Foster Wheeler. The 400 MWe USC CFB boiler is similar in configuration to that of the supercritical pressure 460 MWe Lagiza CFB, but slightly smaller in size because of differences in plant efficiency, unit capacity, fuel and sorbent properties, steam duty distribution, and flue gas volumetric flow rates. Consistent with other Foster Wheeler units, the furnace has one fluidizing air distributor grid and the windbox is tapered to evenly distribute the primary air across the furnace cross section, The single, continuous fluidizing grid simplifies control and with the lower furnace section tapered to increase fluidizing velocities and enhance mixing, coal is injected through seven chutes provided in each side wall at spacings proven to eliminate furnace hot spots. Secondary air is also introduced along the furnace side walls at three elevations to provide staged combustion for minimizing NOx emissions. Using Foster Wheeler’s proprietary 3 dimensional computer codes, the heat fluxes to the furnace walls and the oxygen profile along the centerline of the unit have been determined. Showing a relatively low, uniform profile, the heat flux is typical of a CFB boiler; as a result, the furnace enclosure walls will be fabricated from smooth tubing, whereas, the wing walls, receiving heat
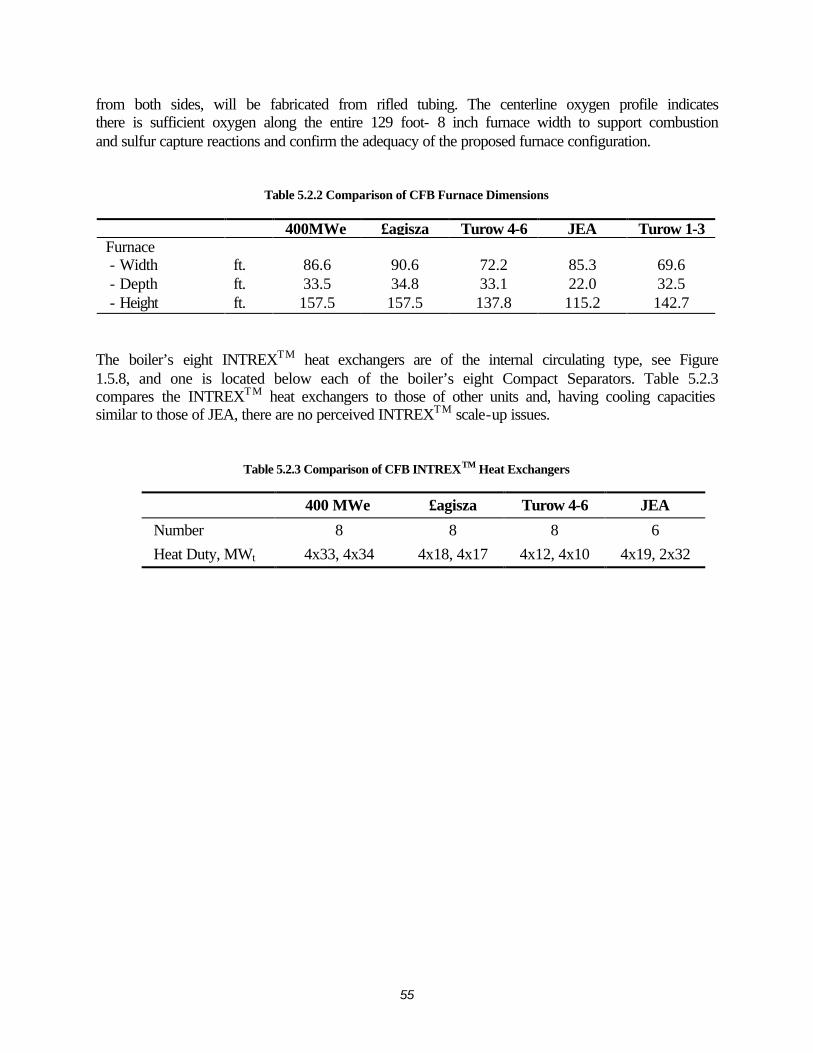
55
from both sides, will be fabricated from rifled tubing. The centerline oxygen profile indicates there is sufficient oxygen along the entire 129 foot- 8 inch furnace width to support combustion and sulfur capture reactions and confirm the adequacy of the proposed furnace configuration.
Table 5.2.2 Comparison of CFB Furnace Dimensions
400MWe £agisza Turow 4-6 JEA Turow 1-3 Furnace - Width ft. 86.6 90.6 72.2 85.3 69.6 - Depth ft. 33.5 34.8 33.1 22.0 32.5 - Height ft. 157.5 157.5 137.8 115.2 142.7
The boiler’s eight INTREXTM heat exchangers are of the internal circulating type, see Figure 1.5.8, and one is located below each of the boiler’s eight Compact Separators. Table 5.2.3 compares the INTREXTM heat exchangers to those of other units and, having cooling capacities similar to those of JEA, there are no perceived INTREXTM scale-up issues.
Table 5.2.3 Comparison of CFB INTREXTM Heat Exchangers
400 MWe £agisza Turow 4-6 JEA
Number 8 8 8 6
Heat Duty, MWt 4x33, 4x34 4x18, 4x17 4x12, 4x10 4x19, 2x32
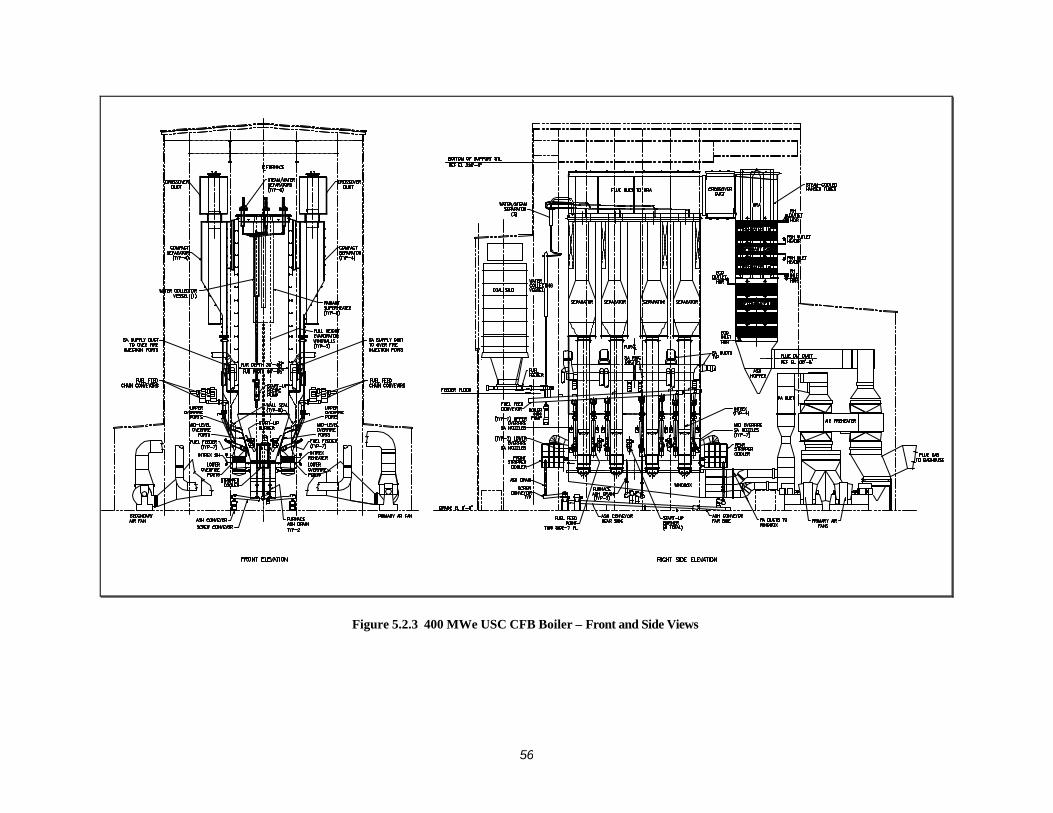
56
Figure 5.2.3 400 MWe USC CFB Boiler – Front and Side Views
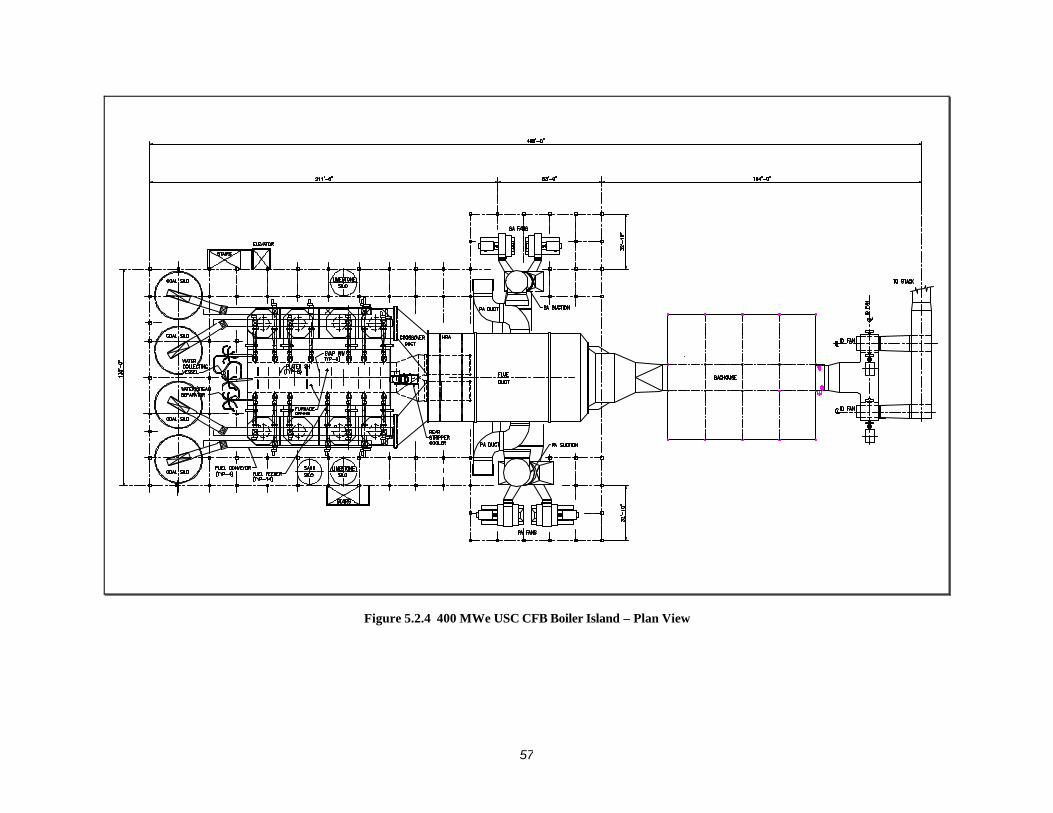
57
Figure 5.2.4 400 MWe USC CFB Boiler Island – Plan View
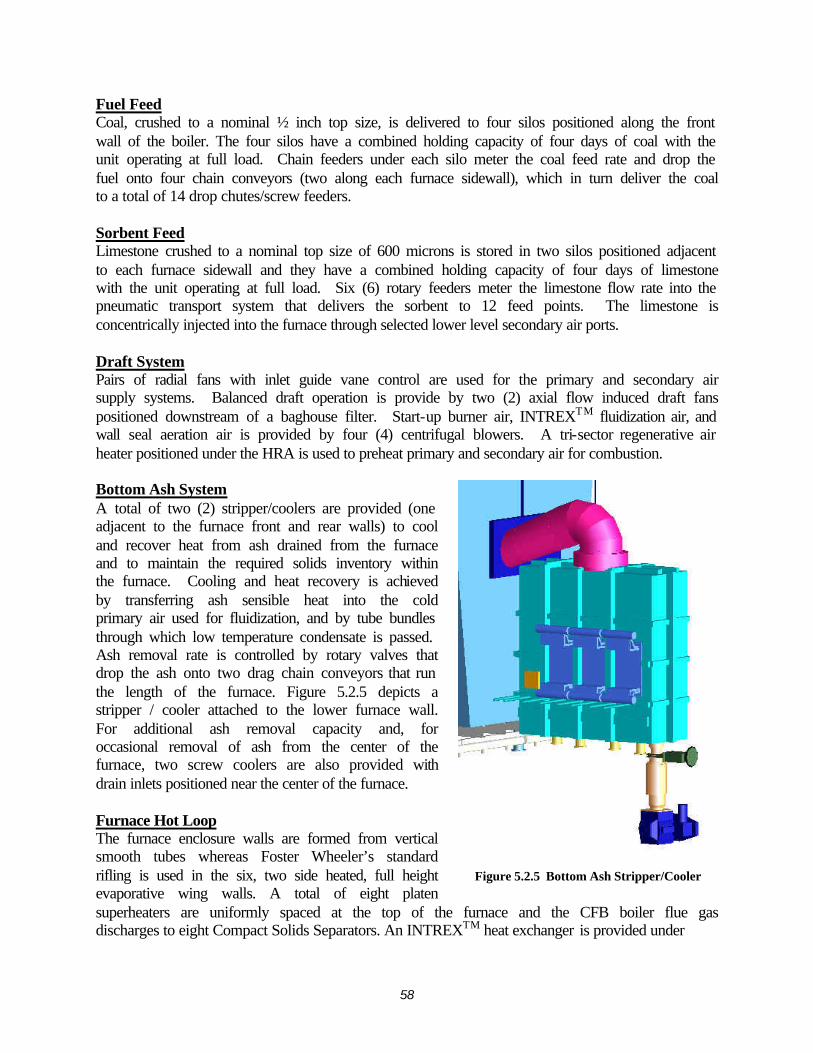
58
Fuel Feed Coal, crushed to a nominal ½ inch top size, is delivered to four silos positioned along the front wall of the boiler. The four silos have a combined holding capacity of four days of coal with the unit operating at full load. Chain feeders under each silo meter the coal feed rate and drop the fuel onto four chain conveyors (two along each furnace sidewall), which in turn deliver the coal to a total of 14 drop chutes/screw feeders. Sorbent Feed Limestone crushed to a nominal top size of 600 microns is stored in two silos positioned adjacent to each furnace sidewall and they have a combined holding capacity of four days of limestone with the unit operating at full load. Six (6) rotary feeders meter the limestone flow rate into the pneumatic transport system that delivers the sorbent to 12 feed points. The limestone is concentrically injected into the furnace through selected lower level secondary air ports. Draft System Pairs of radial fans with inlet guide vane control are used for the primary and secondary air supply systems. Balanced draft operation is provide by two (2) axial flow induced draft fans positioned downstream of a baghouse filter. Start-up burner air, INTREXTM fluidization air, and wall seal aeration air is provided by four (4) centrifugal blowers. A tri-sector regenerative air heater positioned under the HRA is used to preheat primary and secondary air for combustion. Bottom Ash System A total of two (2) stripper/coolers are provided (one adjacent to the furnace front and rear walls) to cool and recover heat from ash drained from the furnace and to maintain the required solids inventory within the furnace. Cooling and heat recovery is achieved by transferring ash sensible heat into the cold primary air used for fluidization, and by tube bundles through which low temperature condensate is passed. Ash removal rate is controlled by rotary valves that drop the ash onto two drag chain conveyors that run the length of the furnace. Figure 5.2.5 depicts a stripper / cooler attached to the lower furnace wall. For additional ash removal capacity and, for occasional removal of ash from the center of the furnace, two screw coolers are also provided with drain inlets positioned near the center of the furnace. Furnace Hot Loop The furnace enclosure walls are formed from vertical smooth tubes whereas Foster Wheeler’s standard rifling is used in the six, two side heated, full height evaporative wing walls. A total of eight platen superheaters are uniformly spaced at the top of the furnace and the CFB boiler flue gas discharges to eight Compact Solids Separators. An INTREXTM heat exchanger is provided under
Figure 5.2.5 Bottom Ash Stripper/Cooler
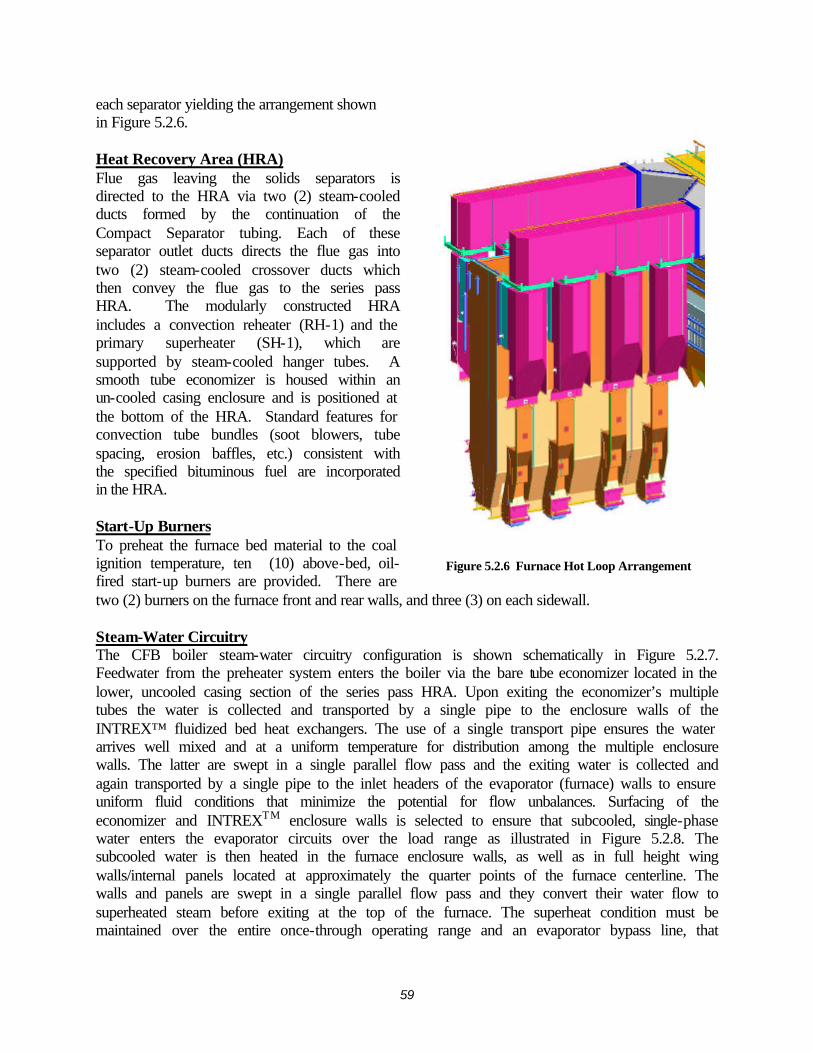
59
each separator yielding the arrangement shown in Figure 5.2.6. Heat Recovery Area (HRA) Flue gas leaving the solids separators is directed to the HRA via two (2) steam-cooled ducts formed by the continuation of the Compact Separator tubing. Each of these separator outlet ducts directs the flue gas into two (2) steam-cooled crossover ducts which then convey the flue gas to the series pass HRA. The modularly constructed HRA includes a convection reheater (RH-1) and the primary superheater (SH-1), which are supported by steam-cooled hanger tubes. A smooth tube economizer is housed within an un-cooled casing enclosure and is positioned at the bottom of the HRA. Standard features for convection tube bundles (soot blowers, tube spacing, erosion baffles, etc.) consistent with the specified bituminous fuel are incorporated in the HRA. Start-Up Burners To preheat the furnace bed material to the coal ignition temperature, ten (10) above-bed, oil-fired start-up burners are provided. There are two (2) burners on the furnace front and rear walls, and three (3) on each sidewall. Steam-Water Circuitry The CFB boiler steam-water circuitry configuration is shown schematically in Figure 5.2.7. Feedwater from the preheater system enters the boiler via the bare tube economizer located in the lower, uncooled casing section of the series pass HRA. Upon exiting the economizer’s multiple tubes the water is collected and transported by a single pipe to the enclosure walls of the INTREX™ fluidized bed heat exchangers. The use of a single transport pipe ensures the water arrives well mixed and at a uniform temperature for distribution among the multiple enclosure walls. The latter are swept in a single parallel flow pass and the exiting water is collected and again transported by a single pipe to the inlet headers of the evaporator (furnace) walls to ensure uniform fluid conditions that minimize the potential for flow unbalances. Surfacing of the economizer and INTREXTM enclosure walls is selected to ensure that subcooled, single-phase water enters the evaporator circuits over the load range as illustrated in Figure 5.2.8. The subcooled water is then heated in the furnace enclosure walls, as well as in full height wing walls/internal panels located at approximately the quarter points of the furnace centerline. The walls and panels are swept in a single parallel flow pass and they convert their water flow to superheated steam before exiting at the top of the furnace. The superheat condition must be maintained over the entire once-through operating range and an evaporator bypass line, that
Figure 5.2.6 Furnace Hot Loop Arrangement
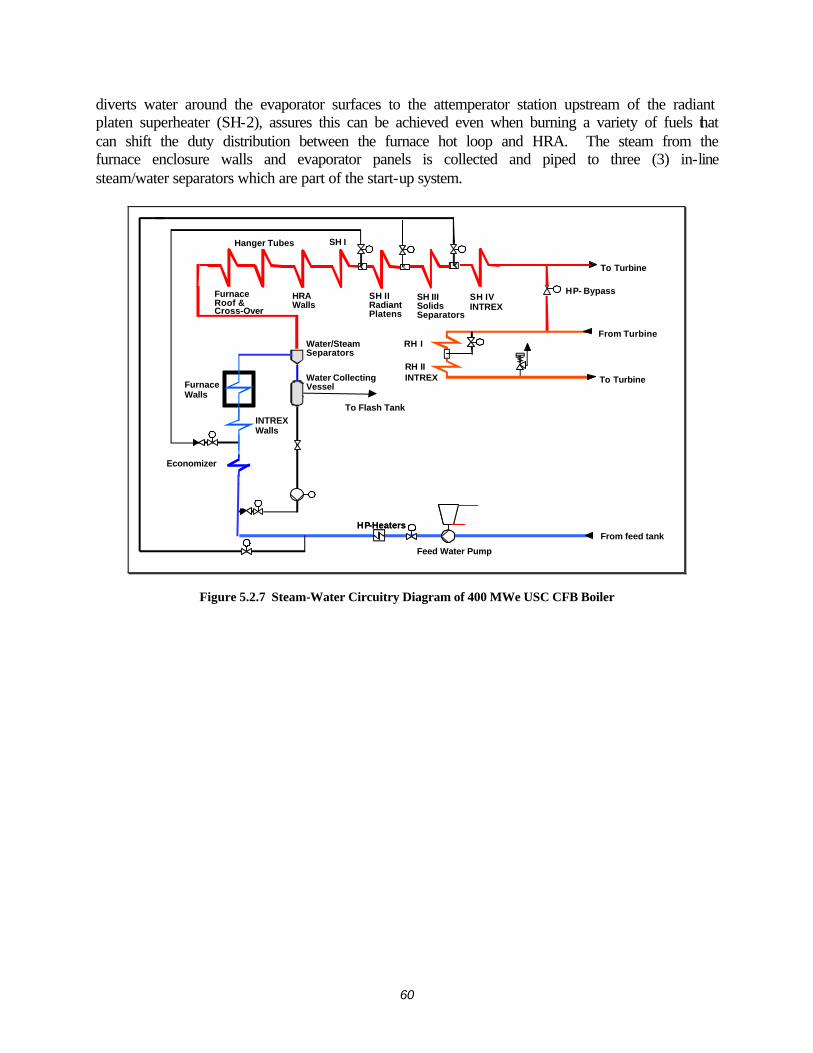
60
diverts water around the evaporator surfaces to the attemperator station upstream of the radiant platen superheater (SH-2), assures this can be achieved even when burning a variety of fuels that can shift the duty distribution between the furnace hot loop and HRA. The steam from the furnace enclosure walls and evaporator panels is collected and piped to three (3) in-line steam/water separators which are part of the start-up system.
INTREXWalls
FurnaceWalls
Economizer
HRAWalls
Hanger Tubes
SH IIRadiantPlatens
SH IVINTREX
HP- Bypass
To Turbine
Feed Water Pump
FurnaceRoof & Cross-Over
To Flash Tank
Water/Steam Separators
SH I
HP-HeatersHP-HeatersFrom feed tank
From TurbineRH I
RH IIINTREX To Turbine
SH IIISolids Separators
Water CollectingVessel
Figure 5.2.7 Steam-Water Circuitry Diagram of 400 MWe USC CFB Boiler
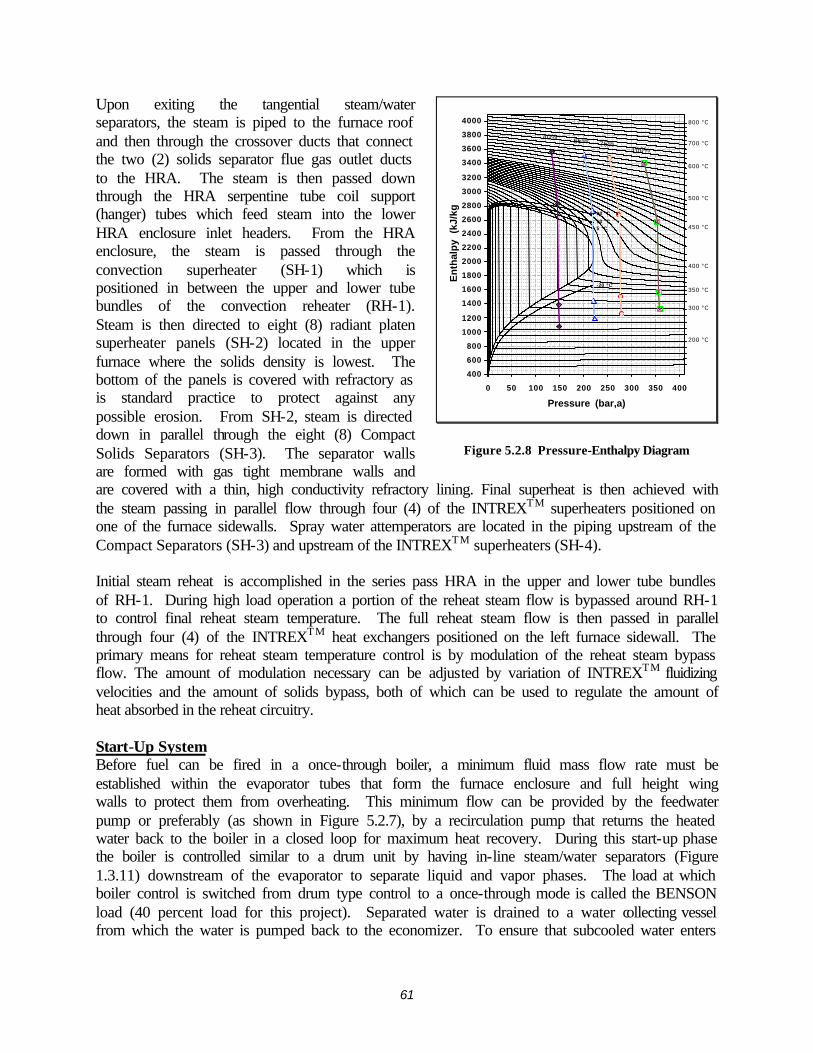
61
Upon exiting the tangential steam/water separators, the steam is piped to the furnace roof and then through the crossover ducts that connect the two (2) solids separator flue gas outlet ducts to the HRA. The steam is then passed down through the HRA serpentine tube coil support (hanger) tubes which feed steam into the lower HRA enclosure inlet headers. From the HRA enclosure, the steam is passed through the convection superheater (SH-1) which is positioned in between the upper and lower tube bundles of the convection reheater (RH-1). Steam is then directed to eight (8) radiant platen superheater panels (SH-2) located in the upper furnace where the solids density is lowest. The bottom of the panels is covered with refractory as is standard practice to protect against any possible erosion. From SH-2, steam is directed down in parallel through the eight (8) Compact Solids Separators (SH-3). The separator walls are formed with gas tight membrane walls and are covered with a thin, high conductivity refractory lining. Final superheat is then achieved with the steam passing in parallel flow through four (4) of the INTREXTM superheaters positioned on one of the furnace sidewalls. Spray water attemperators are located in the piping upstream of the Compact Separators (SH-3) and upstream of the INTREXTM superheaters (SH-4). Initial steam reheat is accomplished in the series pass HRA in the upper and lower tube bundles of RH-1. During high load operation a portion of the reheat steam flow is bypassed around RH-1 to control final reheat steam temperature. The full reheat steam flow is then passed in parallel through four (4) of the INTREXTM heat exchangers positioned on the left furnace sidewall. The primary means for reheat steam temperature control is by modulation of the reheat steam bypass flow. The amount of modulation necessary can be adjusted by variation of INTREXTM fluidizing velocities and the amount of solids bypass, both of which can be used to regulate the amount of heat absorbed in the reheat circuitry. Start-Up System Before fuel can be fired in a once-through boiler, a minimum fluid mass flow rate must be established within the evaporator tubes that form the furnace enclosure and full height wing walls to protect them from overheating. This minimum flow can be provided by the feedwater pump or preferably (as shown in Figure 5.2.7), by a recirculation pump that returns the heated water back to the boiler in a closed loop for maximum heat recovery. During this start-up phase the boiler is controlled similar to a drum unit by having in-line steam/water separators (Figure 1.3.11) downstream of the evaporator to separate liquid and vapor phases. The load at which boiler control is switched from drum type control to a once-through mode is called the BENSON load (40 percent load for this project). Separated water is drained to a water collecting vessel from which the water is pumped back to the economizer. To ensure that subcooled water enters
-20 °C
5 °C10 °C
20 °C
200 °C
300 °C
350 °C
400 °C
450 °C
500 °C
600 °C
700 °C
800 °C
400
600
800
1000
1200
1400
1600
1800
2000
2200
2400
2600
2800
3000
3200
3400
3600
3800
4000
0 50 100 150 200 250 300 350 400
Pressure (bar,a)
En
thal
py
(kJ
/kg
)
40%75%
100%65%
Figure 5.2.8 Pressure-Enthalpy Diagram
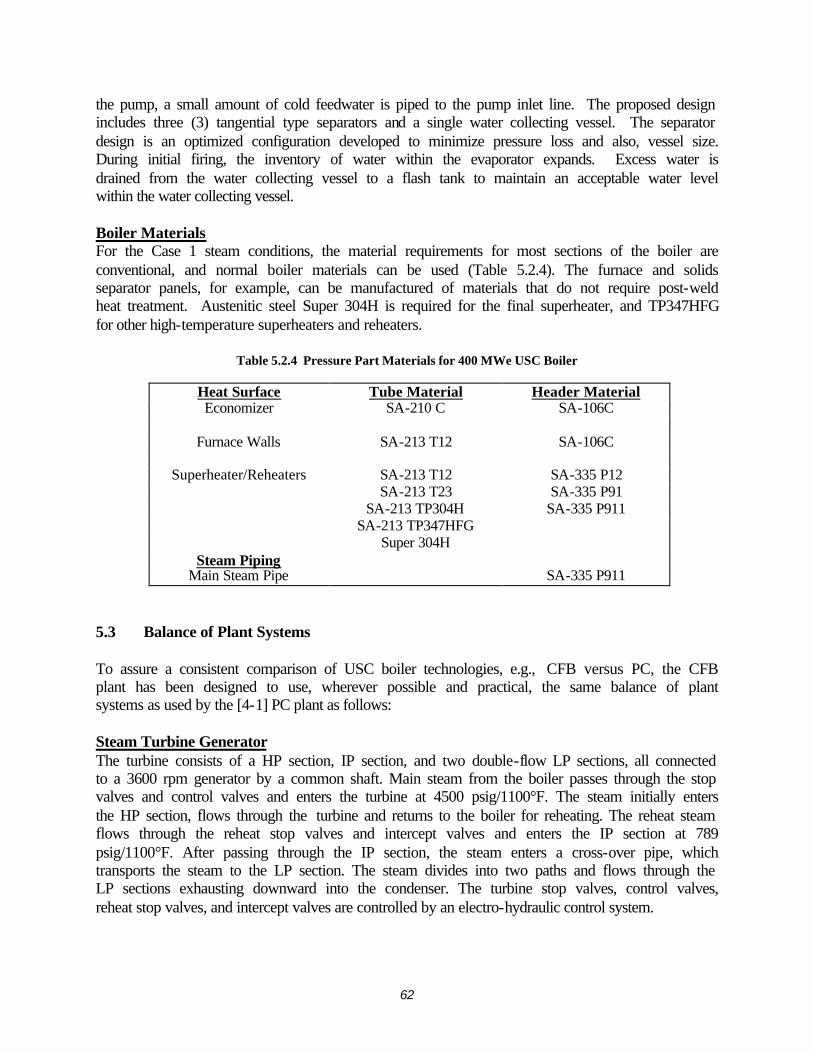
62
the pump, a small amount of cold feedwater is piped to the pump inlet line. The proposed design includes three (3) tangential type separators and a single water collecting vessel. The separator design is an optimized configuration developed to minimize pressure loss and also, vessel size. During initial firing, the inventory of water within the evaporator expands. Excess water is drained from the water collecting vessel to a flash tank to maintain an acceptable water level within the water collecting vessel. Boiler Materials For the Case 1 steam conditions, the material requirements for most sections of the boiler are conventional, and normal boiler materials can be used (Table 5.2.4). The furnace and solids separator panels, for example, can be manufactured of materials that do not require post-weld heat treatment. Austenitic steel Super 304H is required for the final superheater, and TP347HFG for other high-temperature superheaters and reheaters.
Table 5.2.4 Pressure Part Materials for 400 MWe USC Boiler
Heat Surface Tube Material Header Material Economizer SA-210 C SA-106C
Furnace Walls SA-213 T12 SA-106C
Superheater/Reheaters SA-213 T12 SA-335 P12
SA-213 T23 SA-335 P91 SA-213 TP304H SA-335 P911 SA-213 TP347HFG Super 304H
Steam Piping Main Steam Pipe SA-335 P911
5.3 Balance of Plant Systems To assure a consistent comparison of USC boiler technologies, e.g., CFB versus PC, the CFB plant has been designed to use, wherever possible and practical, the same balance of plant systems as used by the [4-1] PC plant as follows: Steam Turbine Generator The turbine consists of a HP section, IP section, and two double-flow LP sections, all connected to a 3600 rpm generator by a common shaft. Main steam from the boiler passes through the stop valves and control valves and enters the turbine at 4500 psig/1100°F. The steam initially enters the HP section, flows through the turbine and returns to the boiler for reheating. The reheat steam flows through the reheat stop valves and intercept valves and enters the IP section at 789 psig/1100°F. After passing through the IP section, the steam enters a cross-over pipe, which transports the steam to the LP section. The steam divides into two paths and flows through the LP sections exhausting downward into the condenser. The turbine stop valves, control valves, reheat stop valves, and intercept valves are controlled by an electro-hydraulic control system.
63
The turbine is designed to operate at constant inlet steam pressure over the entire load range and is capable of being converted in the future to sliding pressure operation for economic unit cycling. Condensate and Feedwater Systems This system delivers the condensate from the condenser hot well to the deaerator, through the gland steam condenser and the LP feedwater heaters. The system includes one main condenser, two 50 percent capacity motor-driven vertical condensate pumps, one gland steam condenser, four LP heaters, and one deaerator with storage tank. Condensate is delivered to a common discharge header through two separate pump discharge lines, each with a check valve and a gate valve. A common minimum flow recirculation line discharging to the condenser is provided to maintain minimum flow requirements for the gland steam condenser and the condensate pumps. The feedwater system delivers the feedwater from the deaerator storage tank to the boiler economizer. One turbine-driven boiler feed pump sized at 100 percent capacity is provided to pump feedwater through the three HP feedwater heaters. The pump is provided with inlet and outlet isolation valves, outlet check valves and individual minimum flow recirculation lines discharging back to the deaerator storage tank. The recirculation flow is controlled by pneumatic flow control valves. In addition, the suctions of the pumps are equipped with startup strainers, which are utilized during initial startup and following major outages or system maintenance. Each feedwater heater is provided with inlet/outlet isolation valves and a full capacity bypass. Feedwater heater drains cascade down to the next highest extraction pressure heater and finally discharge into the deaerator for HP heaters, or the condenser for the LP heaters . Normal drain level in the heaters is controlled by pneumatic level control valves. High water level dump lines discharging to the condenser are provided for each heater for turbine water induction protection. Dump line flow is controlled by pneumatic level control valves. Circulating Water System The circulating water system supplies cooling water to condense the main turbine exhaust steam. The system includes two 50 percent capacity vertical circulating water pumps, a multi-cell mechanical draft evaporative cooling tower, and interconnecting piping. The condenser is a single-pass, horizontal type with divided water boxes. There are two separate circulating water circuits in each box and the condenser cooling duty is 1560 MMBtu/hr. Coal, Limestone, and Sand Receiving and Handling The coal handling system covers the equipment required for unloading, conveying, preparing, and storing the coal delivered to the plant. The scope of the system is from the trestle bottom dumper and coal receiving hoppers up to the inlet of the prepared fuel silos. The bituminous coal is delivered to the site by unit trains of 100-ton rail cars. Each unit train consists of 100 rail cars that are unloaded by a trestle bottom dumper to two receiving hoppers.
64
Coal from each hopper is fed directly into a vibratory feeder. The 6" x 0 coal from the feeder is discharged onto belt conveyors that transfer the coal to the reclaim area. The conveyor passes under a magnetic plate separator to remove tramp iron, and then to the reclaim pile. Coal from the reclaim pile is fed by two vibratory feeders, located under the pile, onto a belt conveyor that transfers the coal to the coal surge bin located in the crusher tower. The coal is reduced in size to 3" x 0 in the first of two crushers. The coal then enters the second crusher that reduces the coal size to 1/2 " x 0. The coal is then transferred by conveyor to a transfer tower and onto the boiler area where a tripper loads the prepared coal into one of the four silos along the boiler front wall. The coal silos together with their feeding systems are part of/included in the CFB boiler cost account. Limestone in a 2 inch by zero size is also delivered to the site by train, unloaded by the above equipment, transferred to a separate pile, reclaimed and transported by conveyors to the two limestone silos located at the CFB boiler. The limestone silos together with their milling and feeding systems are part of/included in the CFB boiler cost account. The CFB boiler is started with a bed of sand. The sand is delivered to the site by a pneumatic transport truck that blows the sand into a silo located adjacent to the CFB boiler. The sand silo and its feeding system are part of/included in the CFB boiler cost account. Ash Handling System The ash handling system includes the equipment required for conveying, preparing, storing, and disposing the fly ash and bottom ash produced on a daily basis by the boiler. The scope of the system is from the baghouse hoppers, air heater hopper collectors, and bottom ash coolers to the truck filling stations. The fly ash collected in the fabric filter and air heater is conveyed to the fly ash storage silo by a pneumatic transport system using low-pressure air from a blower. The fly ash is discharged through a wet unloader that conditions the fly ash and conveys it through a telescopic unloading chute into a truck for disposal. The bottom ash from the bed ash coolers is discharged to a drag chain type conveyor for transport to the bottom ash silo. The silos are sized for a nominal holdup capacity of 36 hours of full-load operation. At periodic intervals, a convoy of ash hauling trucks will transit the unloading station underneath the silos and remove a quantity of ash for disposal. Particulate Removal A pulse jet type fabric filter is used to remove particulate from the flue gas cleaning it to a release rate of 0.01 lb/MMBtu. The boiler exhaust gas enters the inlet plenum of the fabric filter and is distributed among its multiple modules. Gas enters each module through a vaned inlet near the bottom of the module above the ash hopper. The gas then turns upward and is uniformly distributed through the modules, depositing the fly ash on the exterior surface of the bags. Clean gas passes through the fabric and into the outlet duct through poppet dampers. From the outlet dampers the gas proceeds to two downstream induced draft fans.
65
Periodically each module is isolated from the gas flow, and the fabric is cleaned by a pulse of compressed air injected into each filter bag through a venturi nozzle. This cleaning dislodges the dust cake collected on the filter bag exterior. The dust falls into the ash hopper and is removed through the ash handling system. Ducting and Stack The stack is constructed of reinforced concrete with a liner. The stack is sized for adequate dispersion of criteria pollutants, to assure that ground level concentrations are within regulatory limits. Waste Treatment System An onsite water treatment facility treats all runoff, cleaning wastes, blowdown, and backwash to within U.S. Environmental Protection Agency (EPA) standards for suspended solids, oil and grease, pH, and miscellaneous metals. All waste treatment equipment is housed in a separate building. The waste treatment system consists of a water collection basin, three raw waste pumps, an acid neutralization system, an oxidation system, flocculation, clarification/thickening, and sludge de-watering. The water collection basin is a synthetic-membrane-lined earthen basin, which collects rainfall run-off, maintenance cleaning wastes, and backwash flows. The raw waste is pumped to the treatment system at a controlled rate by the raw waste pumps. The neutralization system neutralizes the acidic wastewater with hydrated lime in a two-stage system, consisting of a lime storage silo/lime slurry makeup system with 50-ton lime silo, a 0 -1,000 lb/hour dry lime feeder, a 5,000-gallon lime slurry tank, slurry tank mixer, and 25 gpm lime slurry feed pumps. The oxidation system consists of a 50 scfm air compressor, which injects air through a sparger pipe into the second-stage neutralization tank. The flocculation tank is fiberglass with a variable speed agitator. A polymer dilution and feed system is also provided for flocculation. The clarifier is a plate-type, with the sludge pumped to the dewatering system. The sludge is dewatered in filter presses and disposed off-site. The filtrate from the sludge dewatering is returned to the raw waste sump. Miscellaneous Systems Miscellaneous systems include fuel oil, service air, instrument air, and service water systems. A 200,000-gallon storage tank provides a supply of No. 2 fuel oil used for startup and for a small auxiliary boiler. Fuel oil is delivered by truck. All truck roadways and unloading stations inside the fence area are provided. Accessory Electric Plant The accessory electric plant includes all switchgear and control equipment, generator equipment, station service equipment, conduit and cable trays, all wire and cable. It also includes the main power transformer, all required foundations, and standby equipment. Instrumentation and Control An integrated plant-wide distributed control and monitoring system (DCS) is provided. The DCS is a redundant microprocessor-based, functionally distributed system. The control room houses
66
an array of multiple video monitor (CRT) and keyboard units. The CRT/keyboard units are the primary interface between the generating process and operations personnel. The DCS incorporates plant monitoring and control functions for all the major plant equipment. The DCS is designed to provide 99.5 percent availability. The plant equipment and the DCS are designed for automatic response to load changes from minimum load to 100 percent. Startup and shutdown routines are implemented in a supervised manual mode but with the capability for operator selection of modular automation routines available. Buildings and Structures A soil-bearing load of 5,000 lb/ft2 is used for foundation design. Foundations are provided for the support structures, pumps, tanks, and other plant components. The following buildings are included in the design basis:
• Steam turbine building • Boiler building • Administration and service building • Makeup water and pretreatment building • Pump house and electrical equipment building • Fuel oil pump house • Continuous emissions monitoring building • River water intake structure • Guard house • Runoff water pump house • Industrial waste treatment building
5.4 Plant Costs and Economics The 404.9 MWe USC CFB boiler system shown in Figure 5.2.3, complete with silos, limestone milling, coal and limestone feeding, CFB boiler, air heater, fans, flues, ducts, ash coolers, ash conveyors, and structural steel, is estimated to cost, delivered to the site and erected with union labor, $248.3 million in January 2006 dollars. In Table 5.4.1 the CFB system costs are shown along with the balance of plant cost elements and the plant has a bare erected cost (equipment plus field labor and materials) of $518.8 million. Adding 10 percent for architect/plant engineering, construction management, home office costs, and fee plus 10 percent for project contingency yields a total plant cost of $627.8 million or $1,551/kW. As discussed in Section 3, the TPC assumes over night construction and Table 5.4.2 adds $85.9 million for interest during construction to obtain a TPI of $713.7 million. The addition of start up costs, inventory capital, land, etc. yields a TCR of $734.8 million. O&M costs, operating costs, and fuel costs are also shown and together with a levelized carrying charge lead to a 20 year levelized cost of electricity of $52.21/MWhr.
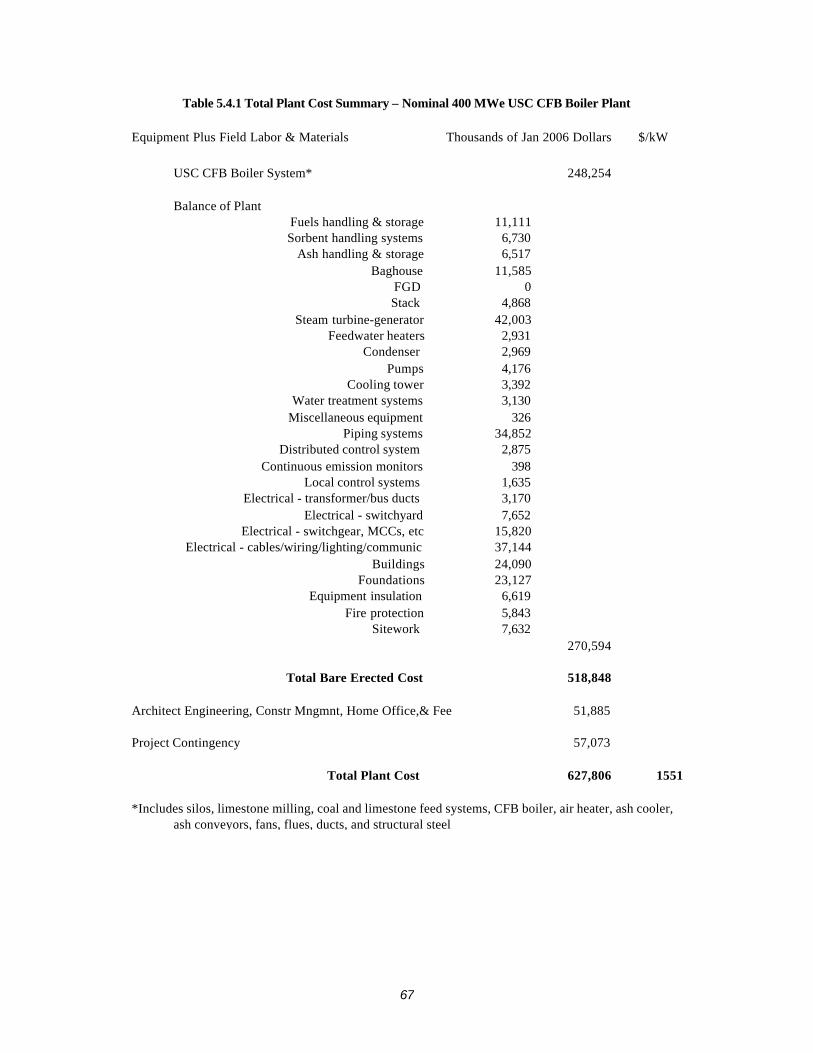
67
Table 5.4.1 Total Plant Cost Summary – Nominal 400 MWe USC CFB Boiler Plant
Equipment Plus Field Labor & Materials Thousands of Jan 2006 Dollars $/kW
USC CFB Boiler System* 248,254
Balance of PlantFuels handling & storage 11,111Sorbent handling systems 6,730
Ash handling & storage 6,517Baghouse 11,585
FGD 0Stack 4,868
Steam turbine-generator 42,003Feedwater heaters 2,931
Condenser 2,969Pumps 4,176
Cooling tower 3,392Water treatment systems 3,130
Miscellaneous equipment 326Piping systems 34,852
Distributed control system 2,875Continuous emission monitors 398
Local control systems 1,635Electrical - transformer/bus ducts 3,170
Electrical - switchyard 7,652Electrical - switchgear, MCCs, etc 15,820
Electrical - cables/wiring/lighting/communic 37,144Buildings 24,090
Foundations 23,127Equipment insulation 6,619
Fire protection 5,843Sitework 7,632
270,594
Total Bare Erected Cost 518,848
Architect Engineering, Constr Mngmnt, Home Office,& Fee 51,885
Project Contingency 57,073
Total Plant Cost 627,806 1551
*Includes silos, limestone milling, coal and limestone feed systems, CFB boiler, air heater, ash cooler, ash conveyors, fans, flues, ducts, and structural steel
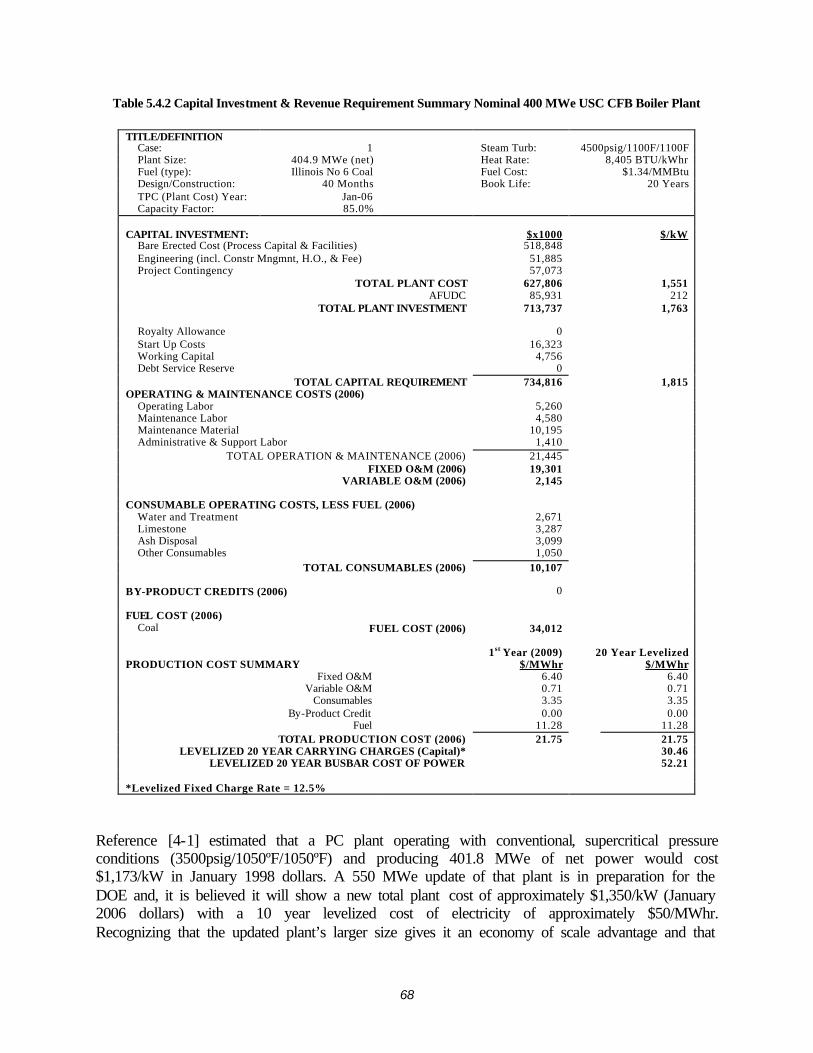
68
Table 5.4.2 Capital Investment & Revenue Requirement Summary Nominal 400 MWe USC CFB Boiler Plant
TITLE/DEFINITION Case: 1 Steam Turb: 4500psig/1100F/1100F Plant Size: 404.9 MWe (net) Heat Rate: 8,405 BTU/kWhr Fuel (type): Illinois No 6 Coal Fuel Cost: $1.34/MMBtu Design/Construction: 40 Months Book Life: 20 Years TPC (Plant Cost) Year: Jan-06 Capacity Factor: 85.0%
CAPITAL INVESTMENT: $x1000 $/kW
Bare Erected Cost (Process Capital & Facilities) 518,848 Engineering (incl. Constr Mngmnt, H.O., & Fee) 51,885 Project Contingency 57,073
TOTAL PLANT COST 627,806 1,551 AFUDC 85,931 212
TOTAL PLANT INVESTMENT 713,737 1,763
Royalty Allowance 0 Start Up Costs 16,323 Working Capital 4,756 Debt Service Reserve 0
TOTAL CAPITAL REQUIREMENT 734,816 1,815 OPERATING & MAINTENANCE COSTS (2006)
Operating Labor 5,260 Maintenance Labor 4,580 Maintenance Material 10,195 Administrative & Support Labor 1,410
TOTAL OPERATION & MAINTENANCE (2006) 21,445 FIXED O&M (2006) 19,301
VARIABLE O&M (2006) 2,145 CONSUMABLE OPERATING COSTS, LESS FUEL (2006)
Water and Treatment 2,671 Limestone 3,287 Ash Disposal 3,099 Other Consumables 1,050
TOTAL CONSUMABLES (2006) 10,107 BY-PRODUCT CREDITS (2006) 0 FUEL COST (2006)
Coal FUEL COST (2006) 34,012 1st Year (2009) 20 Year Levelized PRODUCTION COST SUMMARY $/MWhr $/MWhr
Fixed O&M 6.40 6.40 Variable O&M 0.71 0.71
Consumables 3.35 3.35 By-Product Credit 0.00 0.00
Fuel 11.28 11.28 TOTAL PRODUCTION COST (2006) 21.75 21.75
LEVELIZED 20 YEAR CARRYING CHARGES (Capital)* 30.46 LEVELIZED 20 YEAR BUSBAR COST OF POWER 52.21
*Levelized Fixed Charge Rate = 12.5%
Reference [4-1] estimated that a PC plant operating with conventional, supercritical pressure conditions (3500psig/1050ºF/1050ºF) and producing 401.8 MWe of net power would cost $1,173/kW in January 1998 dollars. A 550 MWe update of that plant is in preparation for the DOE and, it is believed it will show a new total plant cost of approximately $1,350/kW (January 2006 dollars) with a 10 year levelized cost of electricity of approximately $50/MWhr. Recognizing that the updated plant’s larger size gives it an economy of scale advantage and that
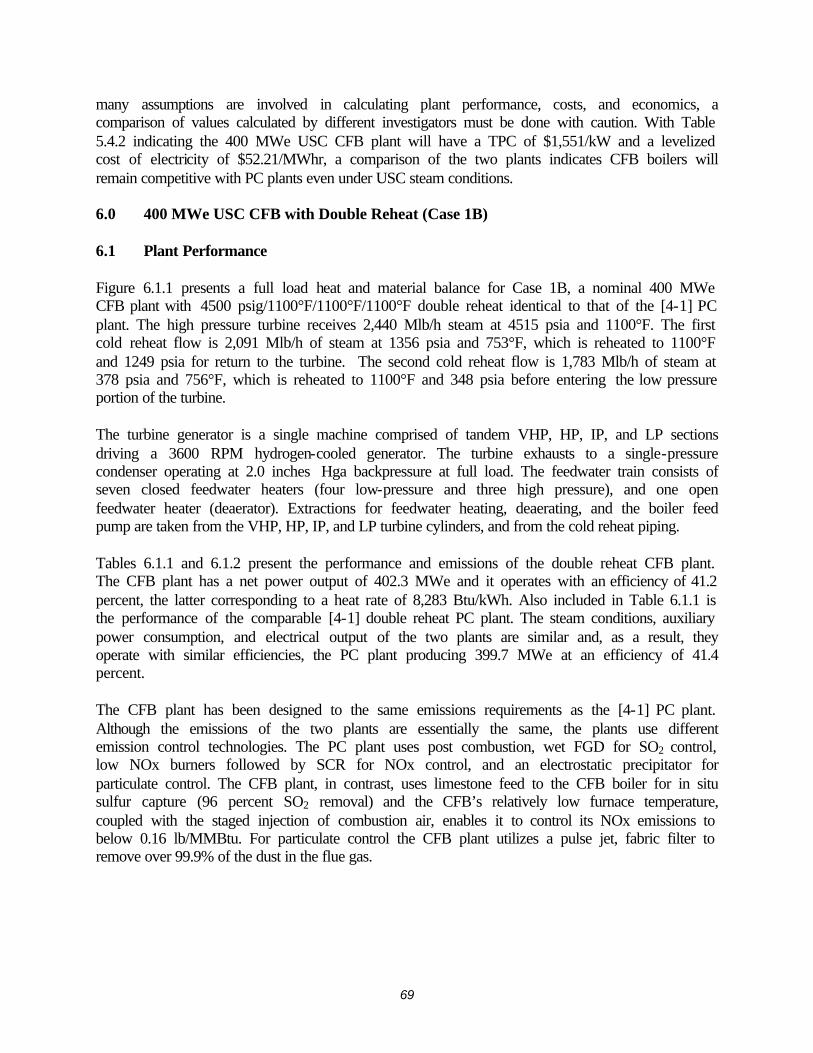
69
many assumptions are involved in calculating plant performance, costs, and economics, a comparison of values calculated by different investigators must be done with caution. With Table 5.4.2 indicating the 400 MWe USC CFB plant will have a TPC of $1,551/kW and a levelized cost of electricity of $52.21/MWhr, a comparison of the two plants indicates CFB boilers will remain competitive with PC plants even under USC steam conditions. 6.0 400 MWe USC CFB with Double Reheat (Case 1B) 6.1 Plant Performance Figure 6.1.1 presents a full load heat and material balance for Case 1B, a nominal 400 MWe CFB plant with 4500 psig/1100°F/1100°F/1100°F double reheat identical to that of the [4-1] PC plant. The high pressure turbine receives 2,440 Mlb/h steam at 4515 psia and 1100°F. The first cold reheat flow is 2,091 Mlb/h of steam at 1356 psia and 753°F, which is reheated to 1100°F and 1249 psia for return to the turbine. The second cold reheat flow is 1,783 Mlb/h of steam at 378 psia and 756°F, which is reheated to 1100°F and 348 psia before entering the low pressure portion of the turbine. The turbine generator is a single machine comprised of tandem VHP, HP, IP, and LP sections driving a 3600 RPM hydrogen-cooled generator. The turbine exhausts to a single-pressure condenser operating at 2.0 inches Hga backpressure at full load. The feedwater train consists of seven closed feedwater heaters (four low-pressure and three high pressure), and one open feedwater heater (deaerator). Extractions for feedwater heating, deaerating, and the boiler feed pump are taken from the VHP, HP, IP, and LP turbine cylinders, and from the cold reheat piping. Tables 6.1.1 and 6.1.2 present the performance and emissions of the double reheat CFB plant. The CFB plant has a net power output of 402.3 MWe and it operates with an efficiency of 41.2 percent, the latter corresponding to a heat rate of 8,283 Btu/kWh. Also included in Table 6.1.1 is the performance of the comparable [4-1] double reheat PC plant. The steam conditions, auxiliary power consumption, and electrical output of the two plants are similar and, as a result, they operate with similar efficiencies, the PC plant producing 399.7 MWe at an efficiency of 41.4 percent. The CFB plant has been designed to the same emissions requirements as the [4-1] PC plant. Although the emissions of the two plants are essentially the same, the plants use different emission control technologies. The PC plant uses post combustion, wet FGD for SO2 control, low NOx burners followed by SCR for NOx control, and an electrostatic precipitator for particulate control. The CFB plant, in contrast, uses limestone feed to the CFB boiler for in situ sulfur capture (96 percent SO2 removal) and the CFB’s relatively low furnace temperature, coupled with the staged injection of combustion air, enables it to control its NOx emissions to below 0.16 lb/MMBtu. For particulate control the CFB plant utilizes a pulse jet, fabric filter to remove over 99.9% of the dust in the flue gas.
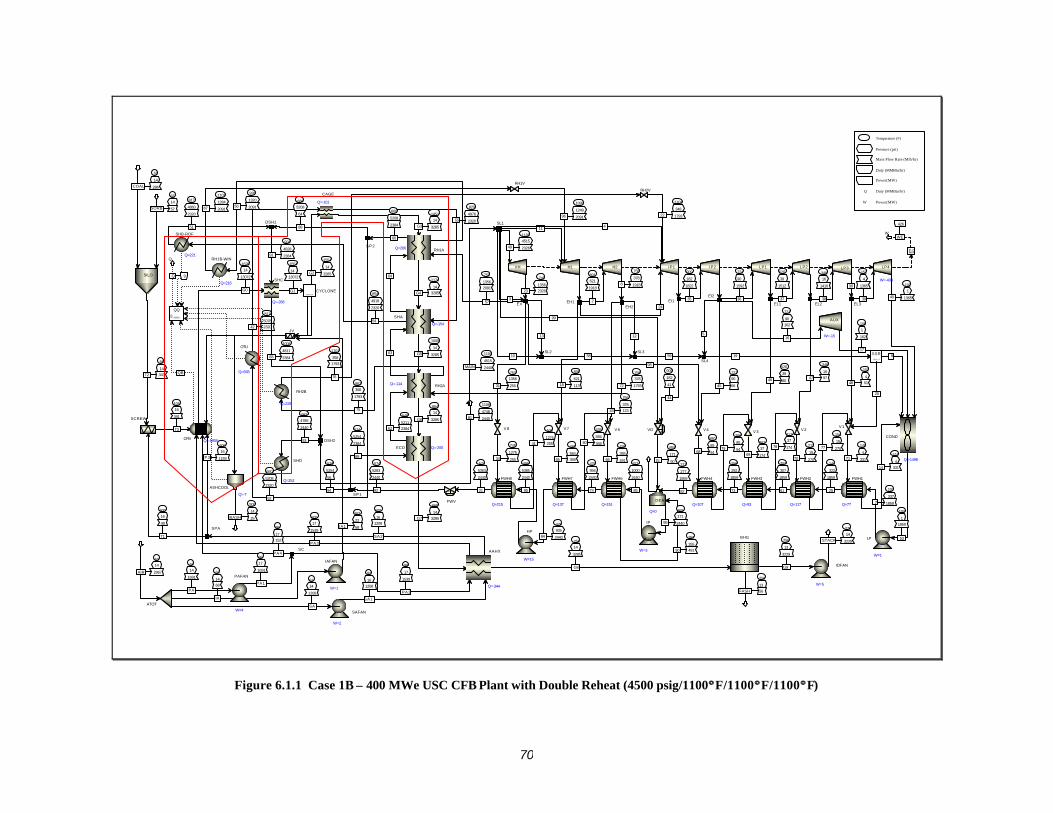
70
106
16
391
T3
600
16
1159P3
98
17
152
PA4
600
17
1539
PA3
1625
14
13072
G0
QB
55
14
286COAL
55
14
57SORB
56
14
343T2
600
16
48
T1
1554
14
13072
G1
1554
14
3285G2
63
14
68
IA
162
22
68IA1
63
14
2967AIR
63
14
1208
SA
63
14
1691
PA
660
14
3285G7
82
16
1208
SA1
98
17
1539
PA2
256
14
3285
G8
600
16
1208
SA2
98
17
1691
PA1
574
5254
2384
89
884
14
3285G6640
5211
238462
829
4976
232055
1174
14
3285G4
63
1009
14
3285G5
64
854
4918
2320
54
817
5078
232042
1451
14
3285G3
753
1356
2091
57
660
5208
2384
60
926
1320
209156
756
378
179372862
368
1793
75
256
13
3229
G9
256
13
56FASH
276
14
3229STACK
903
4828
238491
1008
4811
238483
500
14
25BASH
1099
1249
209196
11
891
621
1918
2
756
378
19188
1101
348
179322
4
24
909
182
1822
35
721
90
1592
36
526
39
1512
37
348
16
1416
38
30
152
4
1365
39
102
1
136540
426
WEW
891
621
11318
756
378
12343
12
909
182
41
44
721
90
6645
721
90
162
165
526
39
8046
348
16
9747
152
4
5148
1100
4515
2440MAIN
1100
4515
232649
10
99
3
9
108
1
162
17
112
4
33114
102
1
1859
53
19
20
892
171
9015
13
58 59
506
1275
25541483
584
36865
439
584
36880433
355
49166
98
690
85
9468
266
85
9479
262
37
17469
217
37
17478 213
15
27070
154
15
27077 149
4
33171
102
337
18597
313
277
1859
82
381
355
49190
369
171
244086
371
1000
2440
85
144
322
1859
25
207
307
1859
61
256
292
1859
73
429
956
2440
74
479
935
244084
745
1275
25534496
5385
2440
95
574
5363
2440
21
749
1356
232623
753
1356
25531
917
4860
2320
51
660
5208
64
88
660
5208
2320
52
574
5283
2440
92
574
5254
56
94
987
4785
2440
93
1106
4748
244081
1101
358
1793
76
9Q
Q
1101
1284
209167
CFB Q=-1858
SILO
SCREW
SSPLIT
CYCLONE
IAFAN
W=1
ATOT
AAHX
Q=-344
PAFAN
W=4 SAFAN
W=2
ECO Q=-200
SHA
Q=-154
CAGE
Q=-101
RH1AQ=266
RH2AQ=-114
JV
BHG
IDFAN
W=5
SHC
Q=-268
ASHCOOL
Q=-7
SPA
SC
H1 H2 IP1 IP2 LP1 LP2 LP3 LP4
W=-433
W
MULTEG
EH1EH2
EI1EI2
EL1 EL2 EL3
SL1
COND
Q=-1498
FSPLIT
SSR
VD
AUX
W=-15
SL2 SL3
V7 V6 V4 V3 V2V1
LP
W=1
DEA
Q=0
IP
W=3
FWH1
Q=77
FWH2
Q=117
FWH3
Q=93
FWH4
Q=107
FWH6
Q=151
FWH7
Q=137
SL4
FWH8
Q=215
VH
EV
V8
DSH1
SHB-ROF
Q=221
OTU
Q=938
FWV
SP1
DSH2
SHD
Q=252
RH2B
Q=228
Q MIXER
RH2V
SP2
HP
W=15
RH1B-WIN
Q=216
RH1V
Temperature (F)
Pressure (psi)
Mass Flow Rate (Mlb/hr)
Duty (MMBtu/hr)
Power(MW)
Q Duty (MMBtu/hr)
W Power(MW)
CASE-1Bs, ST=4500/1100/1100/1100/2.0"Hg, Gross Power=440MW, AuxPower=37.1MW, NetPower=403.3MWe, Neteff=41.28%, 08/29/05
Figure 6.1.1 Case 1B – 400 MWe USC CFB Plant with Double Reheat (4500 psig/1100°° F/1100°° F/1100°° F)
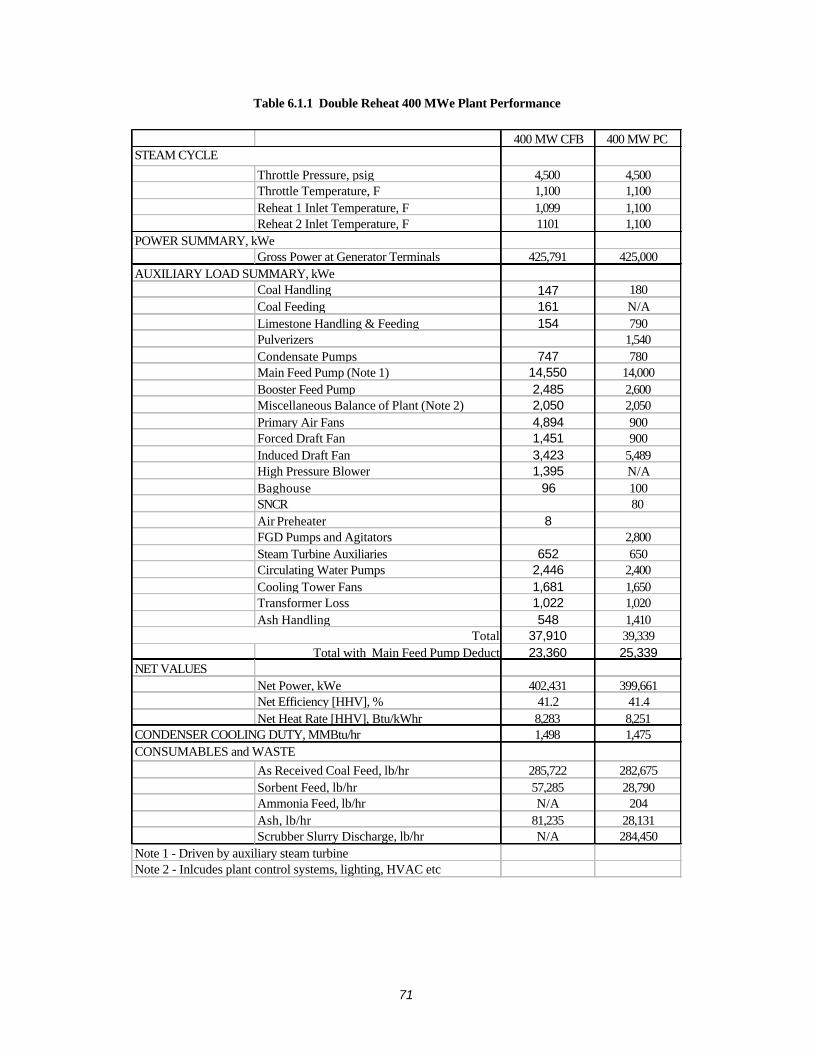
71
Table 6.1.1 Double Reheat 400 MWe Plant Performance
400 MW CFB 400 MW PC
Throttle Pressure, psig 4,500 4,500Throttle Temperature, F 1,100 1,100Reheat 1 Inlet Temperature, F 1,099 1,100Reheat 2 Inlet Temperature, F 1101 1,100
POWER SUMMARY, kWeGross Power at Generator Terminals 425,791 425,000
Coal Handling 147 180Coal Feeding 161 N/ALimestone Handling & Feeding 154 790Pulverizers 1,540Condensate Pumps 747 780Main Feed Pump (Note 1) 14,550 14,000Booster Feed Pump 2,485 2,600Miscellaneous Balance of Plant (Note 2) 2,050 2,050Primary Air Fans 4,894 900Forced Draft Fan 1,451 900Induced Draft Fan 3,423 5,489High Pressure Blower 1,395 N/ABaghouse 96 100SNCR 80Air Preheater 8FGD Pumps and Agitators 2,800Steam Turbine Auxiliaries 652 650Circulating Water Pumps 2,446 2,400Cooling Tower Fans 1,681 1,650Transformer Loss 1,022 1,020Ash Handling 548 1,410
37,910 39,339Total with Main Feed Pump Deduct 23,360 25,339
NET VALUESNet Power, kWe 402,431 399,661Net Efficiency [HHV], % 41.2 41.4Net Heat Rate [HHV], Btu/kWhr 8,283 8,251
1,498 1,475
As Received Coal Feed, lb/hr 285,722 282,675Sorbent Feed, lb/hr 57,285 28,790Ammonia Feed, lb/hr N/A 204Ash, lb/hr 81,235 28,131Scrubber Slurry Discharge, lb/hr N/A 284,450
Note 2 - Inlcudes plant control systems, lighting, HVAC etcNote 1 - Driven by auxiliary steam turbine
Total
AUXILIARY LOAD SUMMARY, kWe
STEAM CYCLE
CONDENSER COOLING DUTY, MMBtu/hrCONSUMABLES and WASTE
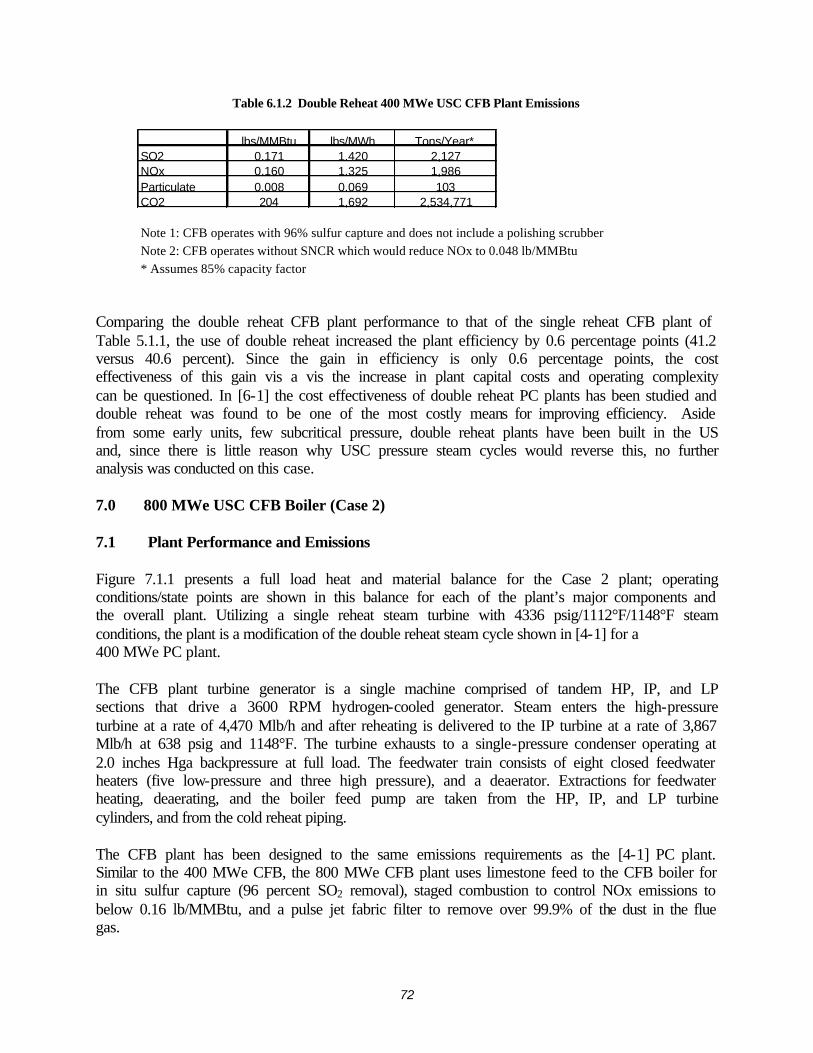
72
Table 6.1.2 Double Reheat 400 MWe USC CFB Plant Emissions
lbs/MMBtu lbs/MWh Tons/Year* SO2 0.171 1.420 2,127NOx 0.160 1.325 1,986Particulate 0.008 0.069 103CO2 204 1,692 2,534,771
Note 1: CFB operates with 96% sulfur capture and does not include a polishing scrubber
Note 2: CFB operates without SNCR which would reduce NOx to 0.048 lb/MMBtu
* Assumes 85% capacity factor
Comparing the double reheat CFB plant performance to that of the single reheat CFB plant of Table 5.1.1, the use of double reheat increased the plant efficiency by 0.6 percentage points (41.2 versus 40.6 percent). Since the gain in efficiency is only 0.6 percentage points, the cost effectiveness of this gain vis a vis the increase in plant capital costs and operating complexity can be questioned. In [6-1] the cost effectiveness of double reheat PC plants has been studied and double reheat was found to be one of the most costly means for improving efficiency. Aside from some early units, few subcritical pressure, double reheat plants have been built in the US and, since there is little reason why USC pressure steam cycles would reverse this, no further analysis was conducted on this case. 7.0 800 MWe USC CFB Boiler (Case 2) 7.1 Plant Performance and Emissions Figure 7.1.1 presents a full load heat and material balance for the Case 2 plant; operating conditions/state points are shown in this balance for each of the plant’s major components and the overall plant. Utilizing a single reheat steam turbine with 4336 psig/1112°F/1148°F steam conditions, the plant is a modification of the double reheat steam cycle shown in [4-1] for a 400 MWe PC plant. The CFB plant turbine generator is a single machine comprised of tandem HP, IP, and LP sections that drive a 3600 RPM hydrogen-cooled generator. Steam enters the high-pressure turbine at a rate of 4,470 Mlb/h and after reheating is delivered to the IP turbine at a rate of 3,867 Mlb/h at 638 psig and 1148°F. The turbine exhausts to a single-pressure condenser operating at 2.0 inches Hga backpressure at full load. The feedwater train consists of eight closed feedwater heaters (five low-pressure and three high pressure), and a deaerator. Extractions for feedwater heating, deaerating, and the boiler feed pump are taken from the HP, IP, and LP turbine cylinders, and from the cold reheat piping. The CFB plant has been designed to the same emissions requirements as the [4-1] PC plant. Similar to the 400 MWe CFB, the 800 MWe CFB plant uses limestone feed to the CFB boiler for in situ sulfur capture (96 percent SO2 removal), staged combustion to control NOx emissions to below 0.16 lb/MMBtu, and a pulse jet fabric filter to remove over 99.9% of the dust in the flue gas.
73
Tables 7.1.1 and 7.1.2 summarize the performance and emissions of the plant at full load. The plant net power output is 740.5 MWe and it operates with an efficiency of 41.3 percent (HHV), which is a heat rate of 8,263 Btu/kWh. Compared with the 400 MWe CFB plant, the 800 MWe plant efficiency is about 2 percent higher (41.3 versus 40.6). This slight improvement in efficiency, which is attributed to an increase in steam reheat temperature (1148 versus 1100ºF) and equipment “economies of scale”, results in about a 2 percent reduction in emissions.
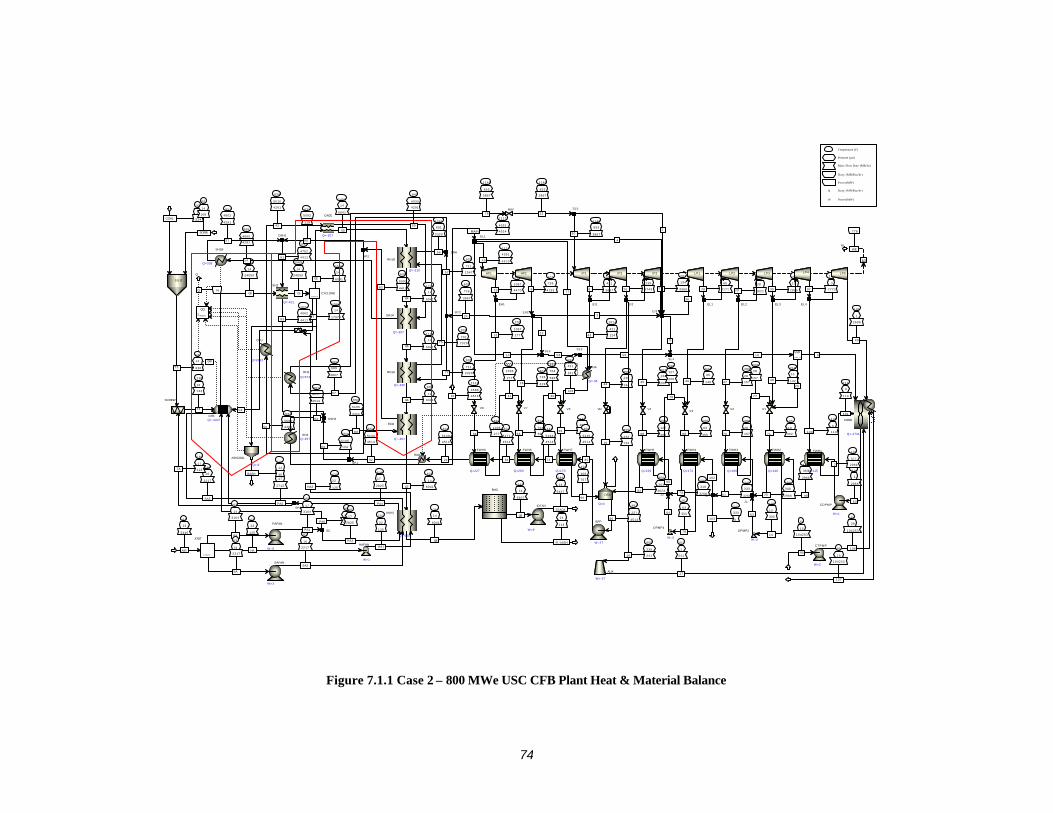
74
110
16
743
T3 C2
535
17
2712
PA5
98
17
279PA6
535
16
2217
SA3
1625
14
24050
G0
QB
55
14
524COAL
55
14
106
SORB
56
14
630T2
535
17
113TA
1568
14
24050
G1
1568
14
17974C1
1568
14
6041G2
63
14
125
HA
162
22
125
HA1
63
14
5446
AIR
63
14
3104
PA
63
14
2217
SA
625
14
6041G7
82
16
2217
SA2
98
17
2825
PA3
267
14
6041
G8
535
17
2825
PA4
535
22
125HA3
98
17
3104
PA1
553
5105
4411
89
907
14
6041G6
637
5092
441162
847
4930
4291
55
1278
14
6041G4
1102
14
6041G5
888
4860
4291
54
828
5010
4291
42
1453
14
6041
G3
839
701
232075
1081
691
2320
56
605
711
232072
267
14
5927
G9267
14
114
FLYASH
286
14
5927
STACK
932
4752
441191
1021
4662
441183
500
14
35BASH
607
726
41936
1148
653
386750
1014
421
38678
855
239
374326
707
134
336927
36
544
65
317128
380
28
302229
219
11
286530
101
1
2609
40
778
WEW
13
607
726
31918
607
726
3867
24 2
1014
421
12443
855
239
13444
855
239
24116
1
4
707
134
20645
5
544
65
14946
380
28
15747
219
11
14248
1112
4351
4514MAIN
1112
4351
447049
11
10 9
101
1
241
17
111
3
114
101
101
1
2966
53
19
20
855
232
13415
58 59
511
1035
277
41
504
704
59665
452
704
596
80
592
421
161
105
447
408
75766
706
127
20668
298
127
206
79
296
63
35569
380
28
15770
200
28
157
77
195
10
30271
101
377
29667
350
303
362482
416
408
757
90
393
227
451486
406
5236
4514
85
140
363
2966
99
189
348
296625
195
10
302
14
241
333
326861
102
251
63
355
78
292
318
326873
95
442
5192
4514
74
501
5171
4514
84
1148
653
3867
22
697
1035
27734
546
5149
4514
21
700
1067
447023
700
1067
27731
951
4802
4291
51
637
5092
119
88
637
5092
429152553
5134
4514
92
553
5105
10494
997
4617
4514
93
1119
4588
451481
605
711
154757
880
689
3867
67
1149
663
3867
76
16Q
Q
6364
145
3
272397
145
3
114100
241
333
0103
64
15
104253
96
64
29
104253
10691
15
104253
107
CFBQ=-3407
SILO
SCREW
SSPLIT
CYCLONE
HAFAN
W=1
FSPLIT
ATOT
AAHX
Q=-560
PAFAN
W=8
ECO
Q=-461
SH1A
Q=-307
CAGE
Q=-207
RH1B
Q=-310
RH1A
Q=-330
J V
BHG
IDFAN
W=9
SH2
Q=-401
ASHCOOL
Q=-9
SPA
SC
SAFAN
W=3
HP2 IP1 IP2 IP3 LP1 LP2 LP3 LP5
W
MULTEG
EH2
EI1 EI2
EI3
EL1 EL2 EL3
SL1
COND
Q=-2731
FSPLIT
SSR
VD
AUX
W=-27
SL2SL3
V7 V6 V4V3
V2 V1
CDPMP
W=1
DEA
Q=0
BFP
W=27
FWH2
Q=146
FWH3
Q=166
FWH4
Q=172
FWH5
Q=229
FWH7
Q=170
FWH8
Q=290
SL5
SL4
FWH9
Q=227
HP1
EH1
V8
DSH1
SH1B
Q=338
OTU
Q=2032
RUB
SP1
DSH2
SH3Q=457
BY2
DRH
RH2
Q=574
Q MIXER
RHV
SP2
J1
DPMP2
W=0
DPMP4
W=0
J2
LP4
EL4
FWH1
Q=115
SP
RUA
Q=-35
CTPMP
W=2
Temperature (F)
Pressure (psi)
Mass Flow Rate (Mlb/hr)
Duty (MMBtu/hr)
Power(MW)
Q Duty (MMBtu/hr)
W Power(MW)
CASE-2r, ST=4351/1112/1148/2"Hg, AuxPower=65MW, Gross Power=805MWe, NetPower=740MWe, Neteff=41.25%, 05/09/06
Figure 7.1.1 Case 2 – 800 MWe USC CFB Plant Heat & Material Balance
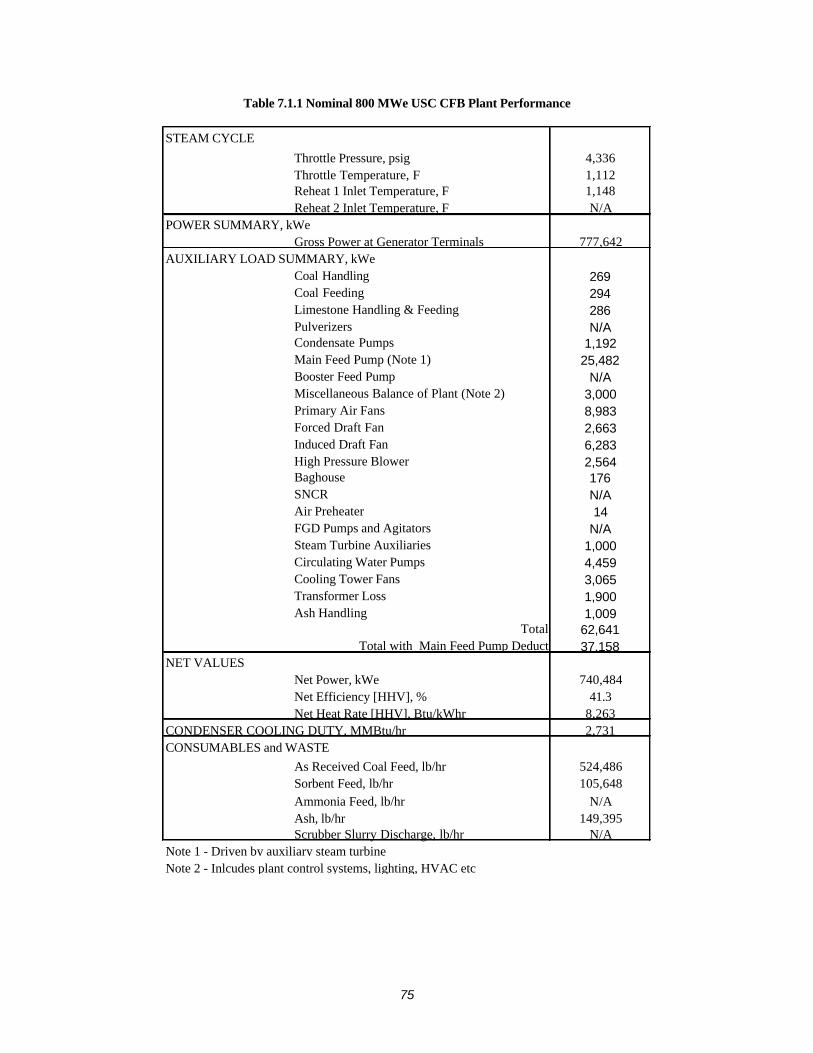
75
Table 7.1.1 Nominal 800 MWe USC CFB Plant Performance
Throttle Pressure, psig 4,336Throttle Temperature, F 1,112Reheat 1 Inlet Temperature, F 1,148Reheat 2 Inlet Temperature, F N/A
POWER SUMMARY, kWeGross Power at Generator Terminals 777,642
Coal Handling 269Coal Feeding 294Limestone Handling & Feeding 286Pulverizers N/ACondensate Pumps 1,192Main Feed Pump (Note 1) 25,482Booster Feed Pump N/AMiscellaneous Balance of Plant (Note 2) 3,000Primary Air Fans 8,983Forced Draft Fan 2,663Induced Draft Fan 6,283High Pressure Blower 2,564Baghouse 176SNCR N/AAir Preheater 14FGD Pumps and Agitators N/ASteam Turbine Auxiliaries 1,000Circulating Water Pumps 4,459Cooling Tower Fans 3,065Transformer Loss 1,900Ash Handling 1,009
62,641Total with Main Feed Pump Deduct 37,158
NET VALUESNet Power, kWe 740,484Net Efficiency [HHV], % 41.3Net Heat Rate [HHV], Btu/kWhr 8,263
2,731
As Received Coal Feed, lb/hr 524,486Sorbent Feed, lb/hr 105,648
Ammonia Feed, lb/hr N/AAsh, lb/hr 149,395Scrubber Slurry Discharge, lb/hr N/A
Note 2 - Inlcudes plant control systems, lighting, HVAC etcNote 1 - Driven by auxiliary steam turbine
Total
AUXILIARY LOAD SUMMARY, kWe
STEAM CYCLE
CONDENSER COOLING DUTY, MMBtu/hrCONSUMABLES and WASTE
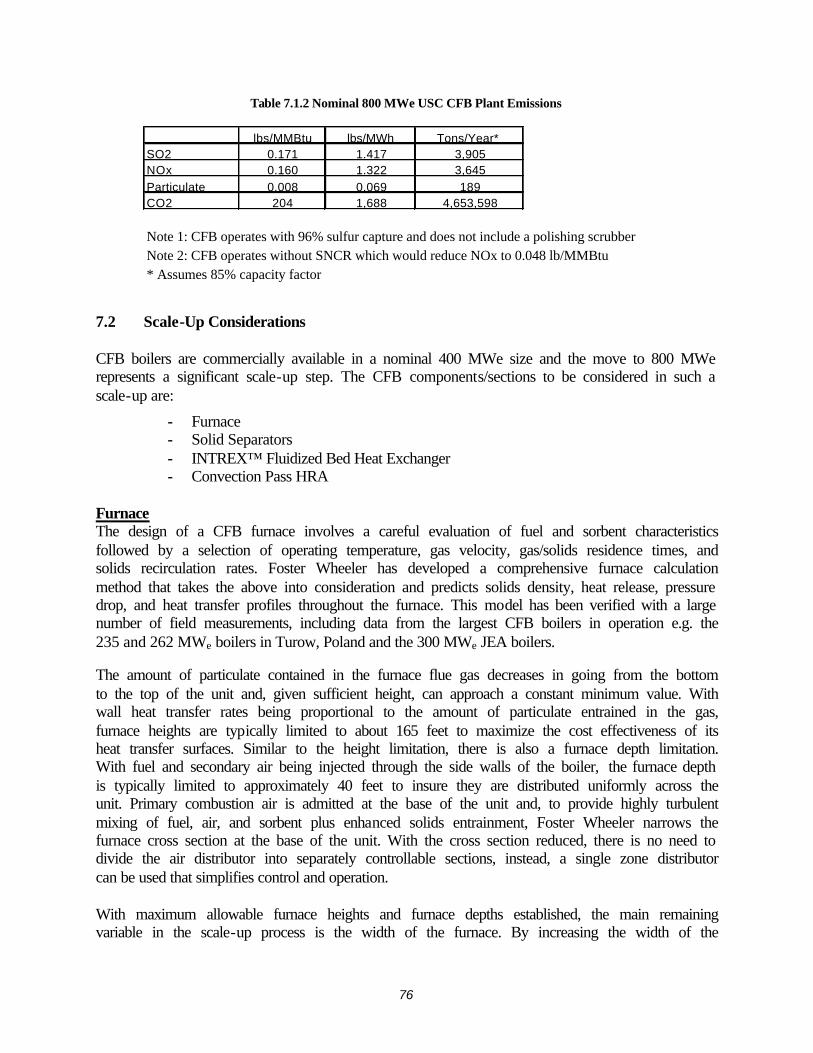
76
Table 7.1.2 Nominal 800 MWe USC CFB Plant Emissions
lbs/MMBtu lbs/MWh Tons/Year* SO2 0.171 1.417 3,905NOx 0.160 1.322 3,645
Particulate 0.008 0.069 189CO2 204 1,688 4,653,598
Note 1: CFB operates with 96% sulfur capture and does not include a polishing scrubberNote 2: CFB operates without SNCR which would reduce NOx to 0.048 lb/MMBtu* Assumes 85% capacity factor
7.2 Scale-Up Considerations CFB boilers are commercially available in a nominal 400 MWe size and the move to 800 MWe represents a significant scale-up step. The CFB components/sections to be considered in such a scale-up are:
- Furnace - Solid Separators - INTREX™ Fluidized Bed Heat Exchanger - Convection Pass HRA
Furnace The design of a CFB furnace involves a careful evaluation of fuel and sorbent characteristics followed by a selection of operating temperature, gas velocity, gas/solids residence times, and solids recirculation rates. Foster Wheeler has developed a comprehensive furnace calculation method that takes the above into consideration and predicts solids density, heat release, pressure drop, and heat transfer profiles throughout the furnace. This model has been verified with a large number of field measurements, including data from the largest CFB boilers in operation e.g. the 235 and 262 MWe boilers in Turow, Poland and the 300 MWe JEA boilers.
The amount of particulate contained in the furnace flue gas decreases in going from the bottom to the top of the unit and, given sufficient height, can approach a constant minimum value. With wall heat transfer rates being proportional to the amount of particulate entrained in the gas, furnace heights are typically limited to about 165 feet to maximize the cost effectiveness of its heat transfer surfaces. Similar to the height limitation, there is also a furnace depth limitation. With fuel and secondary air being injected through the side walls of the boiler, the furnace depth is typically limited to approximately 40 feet to insure they are distributed uniformly across the unit. Primary combustion air is admitted at the base of the unit and, to provide highly turbulent mixing of fuel, air, and sorbent plus enhanced solids entrainment, Foster Wheeler narrows the furnace cross section at the base of the unit. With the cross section reduced, there is no need to divide the air distributor into separately controllable sections, instead, a single zone distributor can be used that simplifies control and operation. With maximum allowable furnace heights and furnace depths established, the main remaining variable in the scale-up process is the width of the furnace. By increasing the width of the
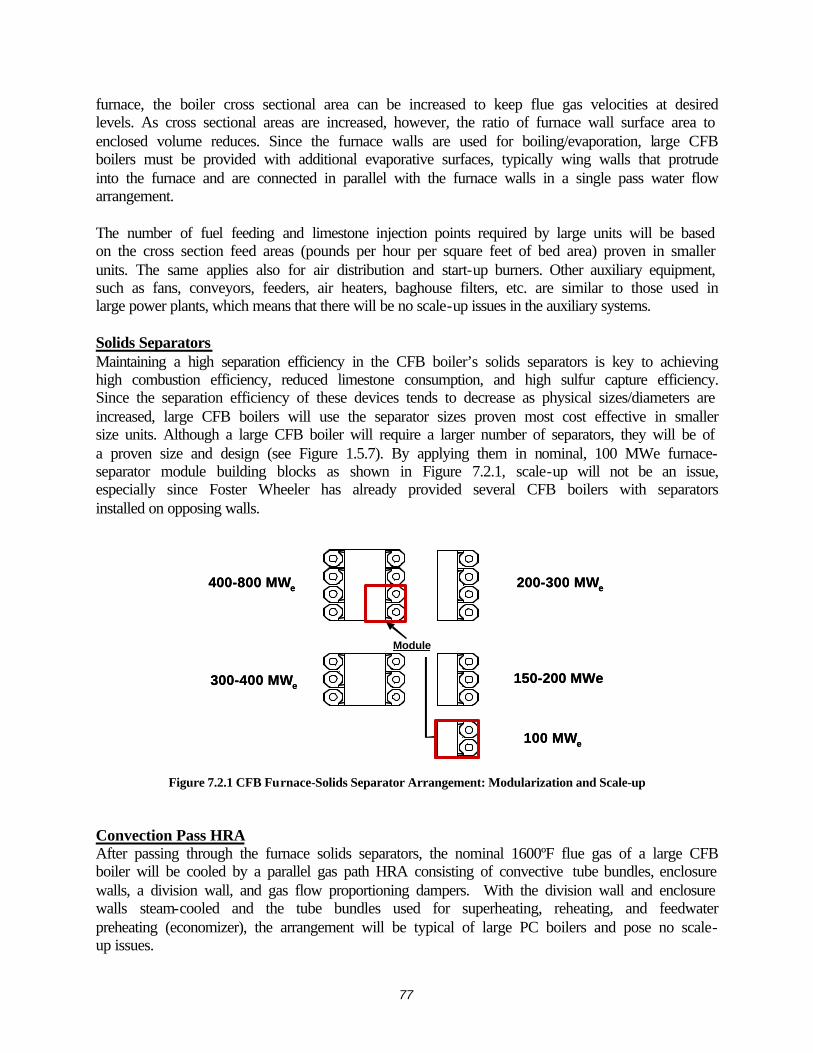
77
furnace, the boiler cross sectional area can be increased to keep flue gas velocities at desired levels. As cross sectional areas are increased, however, the ratio of furnace wall surface area to enclosed volume reduces. Since the furnace walls are used for boiling/evaporation, large CFB boilers must be provided with additional evaporative surfaces, typically wing walls that protrude into the furnace and are connected in parallel with the furnace walls in a single pass water flow arrangement. The number of fuel feeding and limestone injection points required by large units will be based on the cross section feed areas (pounds per hour per square feet of bed area) proven in smaller units. The same applies also for air distribution and start-up burners. Other auxiliary equipment, such as fans, conveyors, feeders, air heaters, baghouse filters, etc. are similar to those used in large power plants, which means that there will be no scale-up issues in the auxiliary systems. Solids Separators Maintaining a high separation efficiency in the CFB boiler’s solids separators is key to achieving high combustion efficiency, reduced limestone consumption, and high sulfur capture efficiency. Since the separation efficiency of these devices tends to decrease as physical sizes/diameters are increased, large CFB boilers will use the separator sizes proven most cost effective in smaller size units. Although a large CFB boiler will require a larger number of separators, they will be of a proven size and design (see Figure 1.5.7). By applying them in nominal, 100 MWe furnace-separator module building blocks as shown in Figure 7.2.1, scale-up will not be an issue, especially since Foster Wheeler has already provided several CFB boilers with separators installed on opposing walls.
100 MWe
200-300 MWe
150-200 MWe
400-800 MWe
300-400 MWe
Module
100 MWe
200-300 MWe
150-200 MWe
400-800 MWe
300-400 MWe
Module
Figure 7.2.1 CFB Furnace-Solids Separator Arrangement: Modularization and Scale-up Convection Pass HRA After passing through the furnace solids separators, the nominal 1600ºF flue gas of a large CFB boiler will be cooled by a parallel gas path HRA consisting of convective tube bundles, enclosure walls, a division wall, and gas flow proportioning dampers. With the division wall and enclosure walls steam-cooled and the tube bundles used for superheating, reheating, and feedwater preheating (economizer), the arrangement will be typical of large PC boilers and pose no scale-up issues.
78
INTREX™ Fluidized Bed Heat Exchanger If the heat content of the CFB flue gas can not satisfy the plant’s superheat and reheat needs, superheat wing walls will be added to the furnace. With evaporative surfaces already added to the furnace, the space for this additional surface may be limited. If this situation develops, then superheat and reheat tube surfaces will be placed in INTREXTM heat exchangers. Since these exchangers provide a dense “package” of highly efficient heat transfer surfaces and have been utilized on several Foster Wheeler CFB boilers, they should not pose a scale-up issue. 7.3 CFB Boiler Conceptual Design General Arrangement The operating conditions of the nominal 800 MWe USC CFB boiler are listed in Table 7.3.1. The CFB boiler operates with a nominal 1600ºF bed/furnace temperature and combusts coal at the rate of 519 Mlb/hr with 20 percent excess air to produce 4573 psig 1119F steam at a rate of 4,514 M lb/hr. Limestone is injected into the furnace at a rate of 106 Mlb/hr for a calcium to sulfur molar feed ratio of 2.4 and 96 percent sulfur capture. The CFB boiler is shown in side, front, and plan views in Figures 7.3.1 through 7.3.3. Including silos, fans, and air heater, the unit occupies an approximate 200 feet by 330 feet foot print and is top supported from structural steel approximately 250 feet above grade. The boiler incorporates Foster Wheeler’s standard design features and it is noted it has:
a) 4 coal silos supplying coal to 16 furnace feed chutes b) 3 full height furnace evaporative wing walls parallel to front and back walls c) 3 full height furnace evaporative wing walls parallel to the side walls d) 8 Compact Solids Separators e) a parallel pass HRA f) 2 elevations of 8 INTREXTM Fluidized Bed Heat Exchangers g) 2 bottom ash stripper coolers (one on each end wall)
The furnace is 38 feet deep, 129 feet - 8 inches wide, and 165 feet tall and its dimensions are compared in Table 7.3.2 to those of other units built by Foster Wheeler; this comparison reveals that the move to 800 MWe has been primarily achieved by an increase in furnace width. Although the increase is significant, approximately 50 percent larger than the largest unit built to date, it reflects the addition of furnace-separator modules per the Figure 7.2.1 methodology and, hence, has low risk. Consistent with previous units, the furnace has one fluidizing air distributor plate and, to ensure a uniform distribution of primary air across the enlarged furnace cross section, the primary air plenum is subdivided into four separate compartments each with its own air and control. Coal is injected through eight chutes provided in each side wall at spacings proven to eliminate furnace hot spots. Secondary air is also introduced along the furnace side walls at three elevations to provide staged combustion for minimizing NOx emissions. Using Foster Wheeler’s proprietary 3 dimensional computer codes, the heat fluxes to the furnace walls and the oxygen profile along the centerline of the unit have been determined and are shown in Figures 7.3.4 and 7.3.5, respectively. Showing a relatively low, uniform profile, the heat flux is typical of a CFB boiler; as a result, the furnace enclosure walls will be fabricated from smooth tubing, whereas, the wing walls, receiving heat from both sides, will be fabricated from rifled
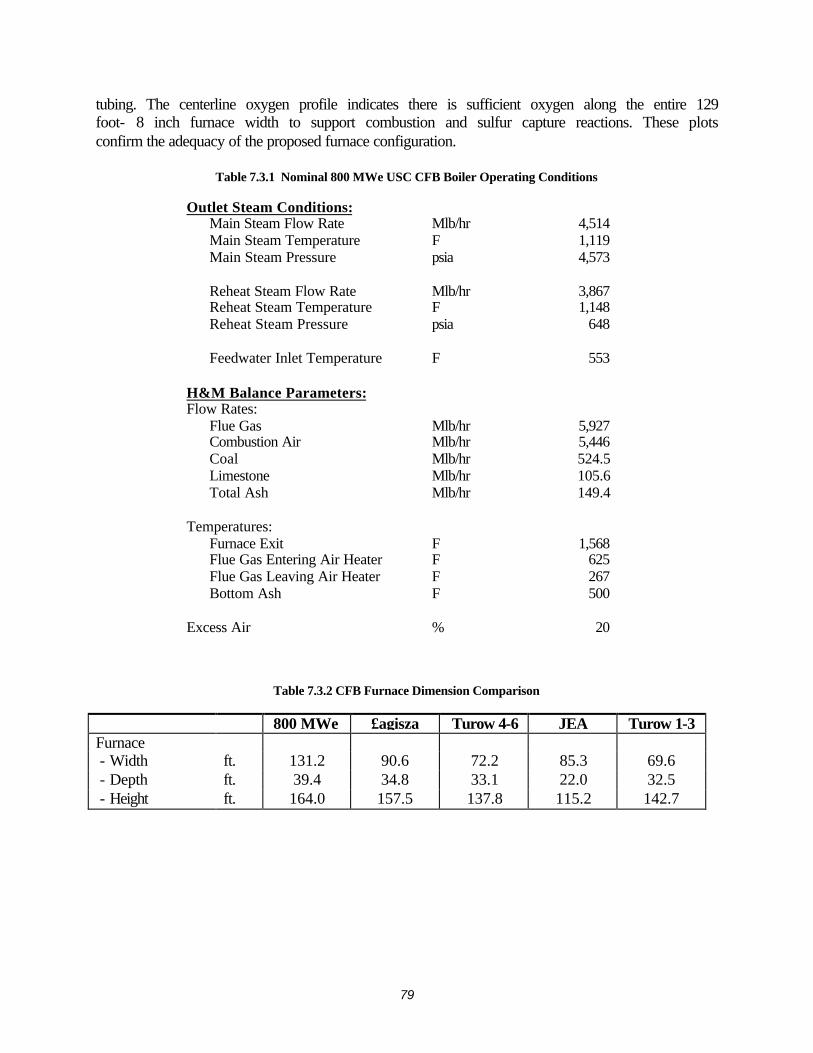
79
tubing. The centerline oxygen profile indicates there is sufficient oxygen along the entire 129 foot- 8 inch furnace width to support combustion and sulfur capture reactions. These plots confirm the adequacy of the proposed furnace configuration.
Table 7.3.1 Nominal 800 MWe USC CFB Boiler Operating Conditions
Outlet Steam Conditions: Main Steam Flow Rate Mlb/hr 4,514 Main Steam Temperature F 1,119 Main Steam Pressure psia 4,573 Reheat Steam Flow Rate Mlb/hr 3,867 Reheat Steam Temperature F 1,148 Reheat Steam Pressure psia 648 Feedwater Inlet Temperature F 553
H&M Balance Parameters: Flow Rates:
Flue Gas Mlb/hr 5,927 Combustion Air Mlb/hr 5,446 Coal Mlb/hr 524.5 Limestone Mlb/hr 105.6 Total Ash Mlb/hr 149.4
Temperatures:
Furnace Exit F 1,568 Flue Gas Entering Air Heater F 625 Flue Gas Leaving Air Heater F 267 Bottom Ash F 500
Excess Air % 20
Table 7.3.2 CFB Furnace Dimension Comparison
800 MWe £agisza Turow 4-6 JEA Turow 1-3 Furnace - Width ft. 131.2 90.6 72.2 85.3 69.6 - Depth ft. 39.4 34.8 33.1 22.0 32.5 - Height ft. 164.0 157.5 137.8 115.2 142.7
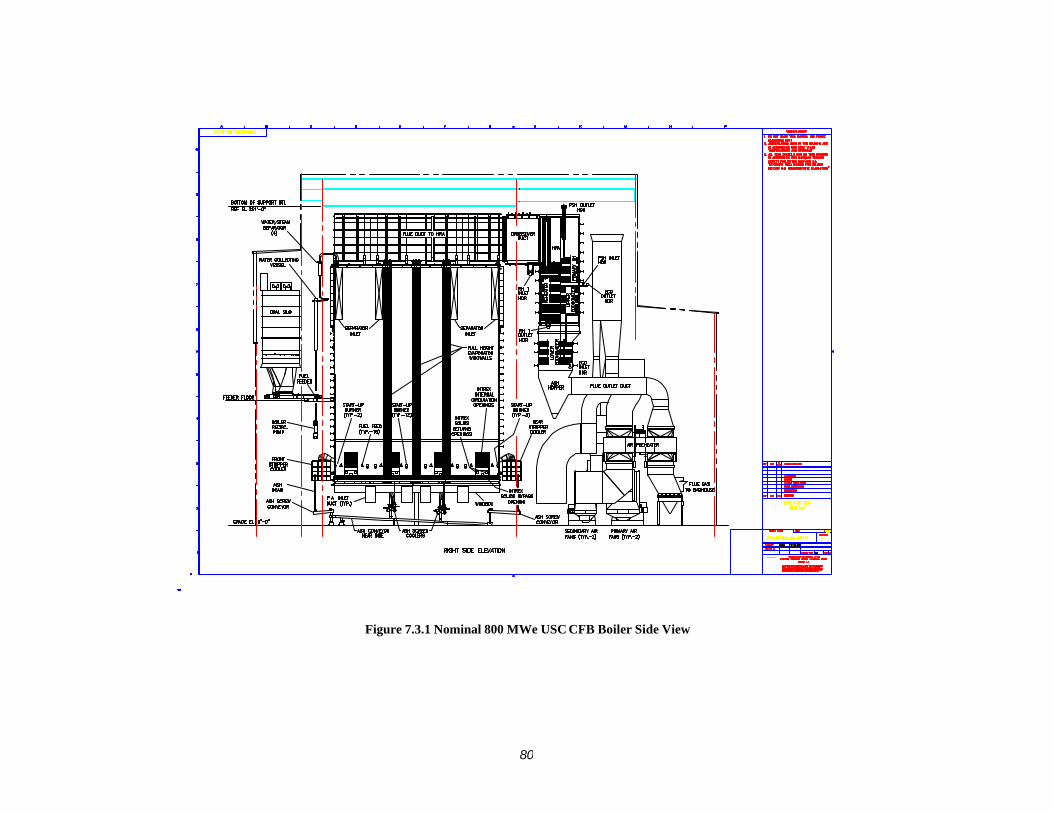
80
Figure 7.3.1 Nominal 800 MWe USC CFB Boiler Side View
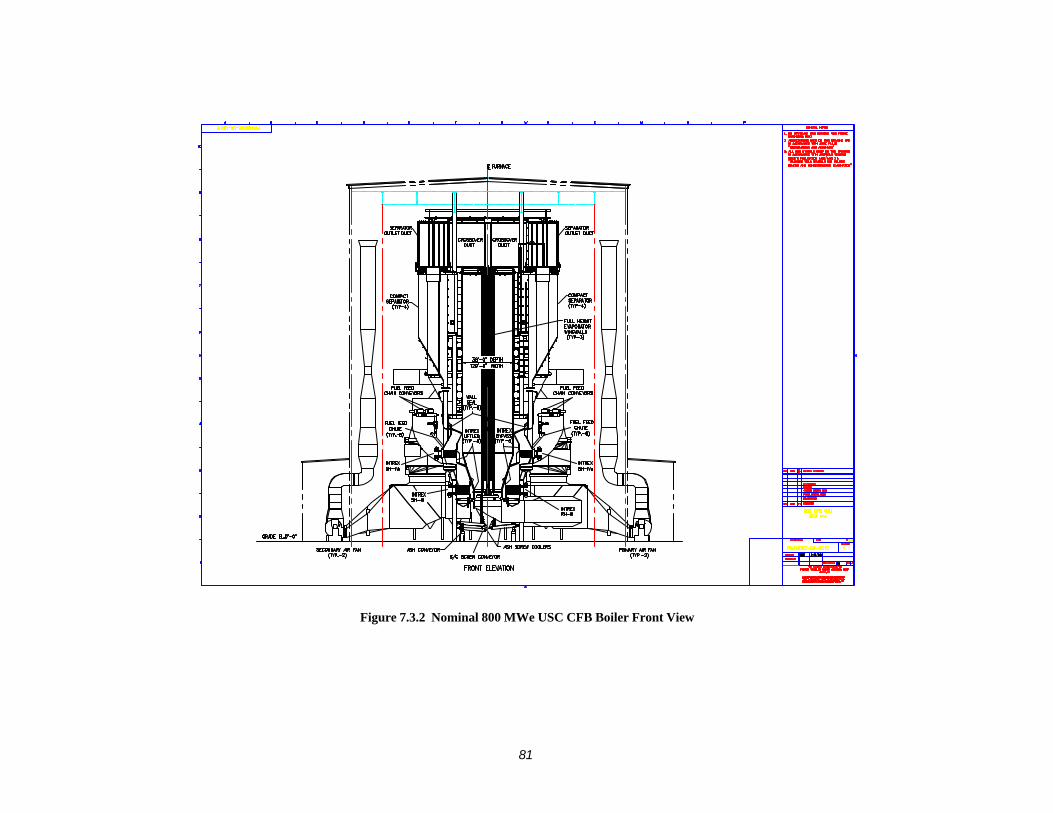
81
Figure 7.3.2 Nominal 800 MWe USC CFB Boiler Front View
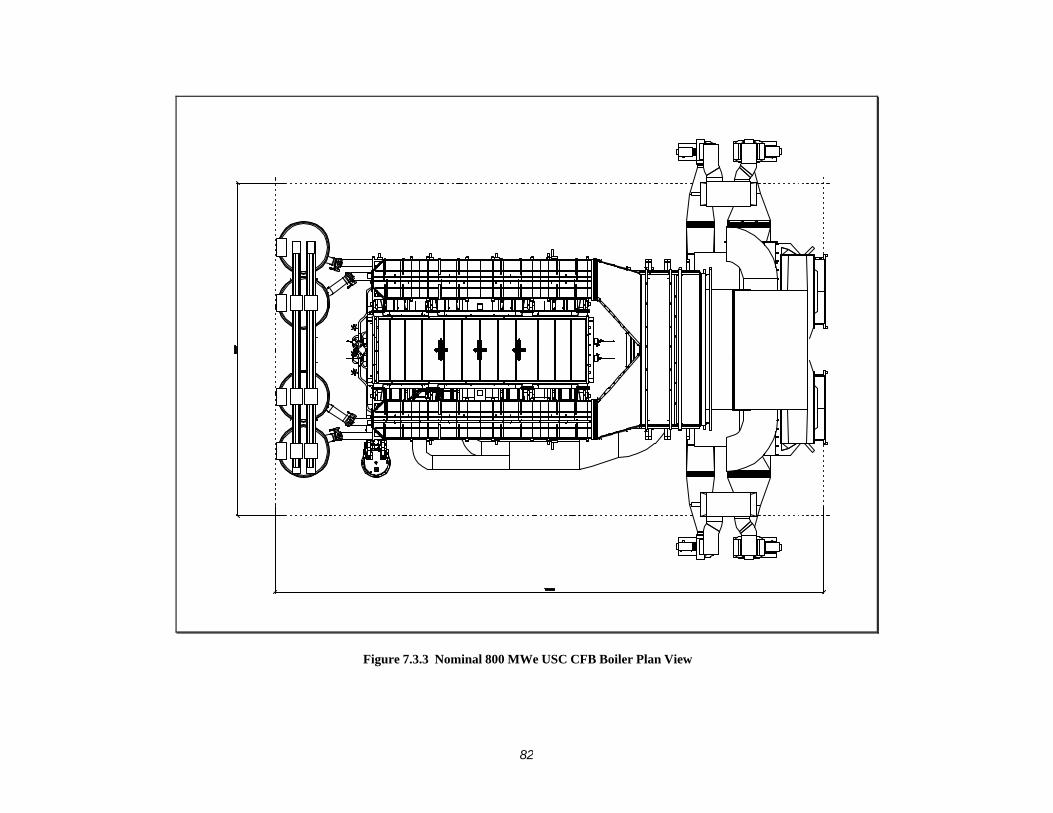
82
Figure 7.3.3 Nominal 800 MWe USC CFB Boiler Plan View
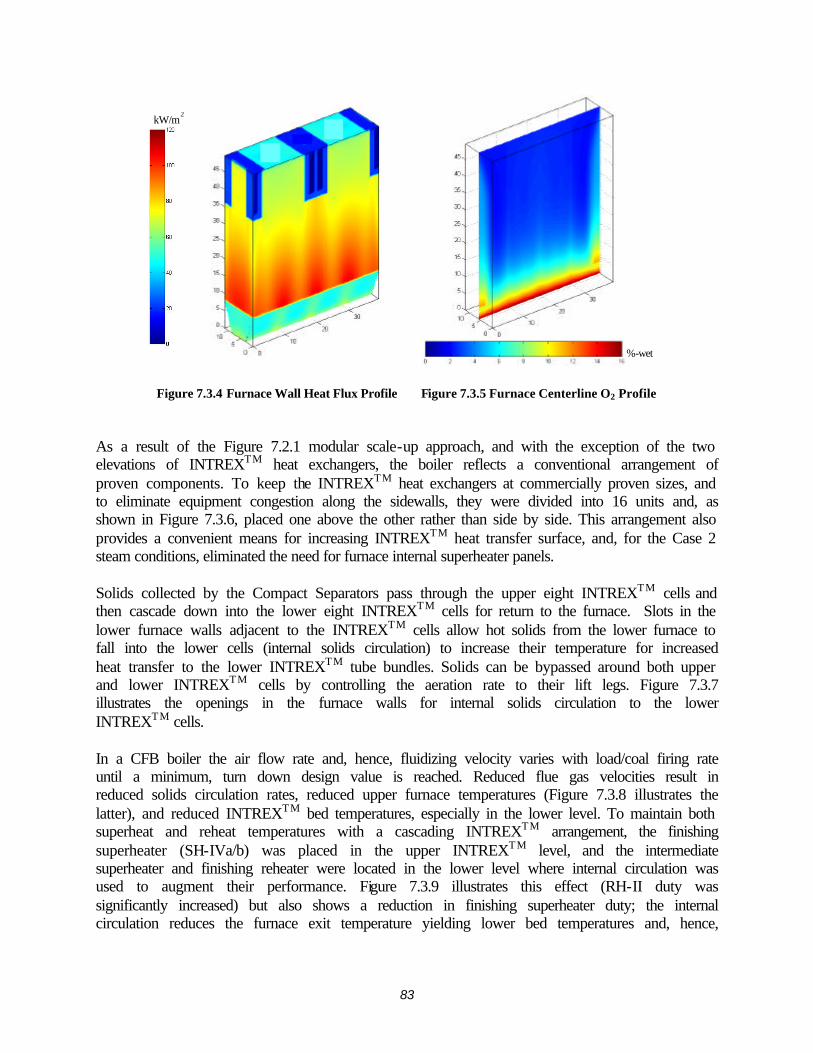
83
%-wet
kW/m2
Figure 7.3.4 Furnace Wall Heat Flux Profile Figure 7.3.5 Furnace Centerline O2 Profile As a result of the Figure 7.2.1 modular scale-up approach, and with the exception of the two elevations of INTREXTM heat exchangers, the boiler reflects a conventional arrangement of proven components. To keep the INTREXTM heat exchangers at commercially proven sizes, and to eliminate equipment congestion along the sidewalls, they were divided into 16 units and, as shown in Figure 7.3.6, placed one above the other rather than side by side. This arrangement also provides a convenient means for increasing INTREXTM heat transfer surface, and, for the Case 2 steam conditions, eliminated the need for furnace internal superheater panels. Solids collected by the Compact Separators pass through the upper eight INTREXTM cells and then cascade down into the lower eight INTREXTM cells for return to the furnace. Slots in the lower furnace walls adjacent to the INTREXTM cells allow hot solids from the lower furnace to fall into the lower cells (internal solids circulation) to increase their temperature for increased heat transfer to the lower INTREXTM tube bundles. Solids can be bypassed around both upper and lower INTREXTM cells by controlling the aeration rate to their lift legs. Figure 7.3.7 illustrates the openings in the furnace walls for internal solids circulation to the lower INTREXTM cells. In a CFB boiler the air flow rate and, hence, fluidizing velocity varies with load/coal firing rate until a minimum, turn down design value is reached. Reduced flue gas velocities result in reduced solids circulation rates, reduced upper furnace temperatures (Figure 7.3.8 illustrates the latter), and reduced INTREXTM bed temperatures, especially in the lower level. To maintain both superheat and reheat temperatures with a cascading INTREXTM arrangement, the finishing superheater (SH-IVa/b) was placed in the upper INTREXTM level, and the intermediate superheater and finishing reheater were located in the lower level where internal circulation was used to augment their performance. Figure 7.3.9 illustrates this effect (RH-II duty was significantly increased) but also shows a reduction in finishing superheater duty; the internal circulation reduces the furnace exit temperature yielding lower bed temperatures and, hence,
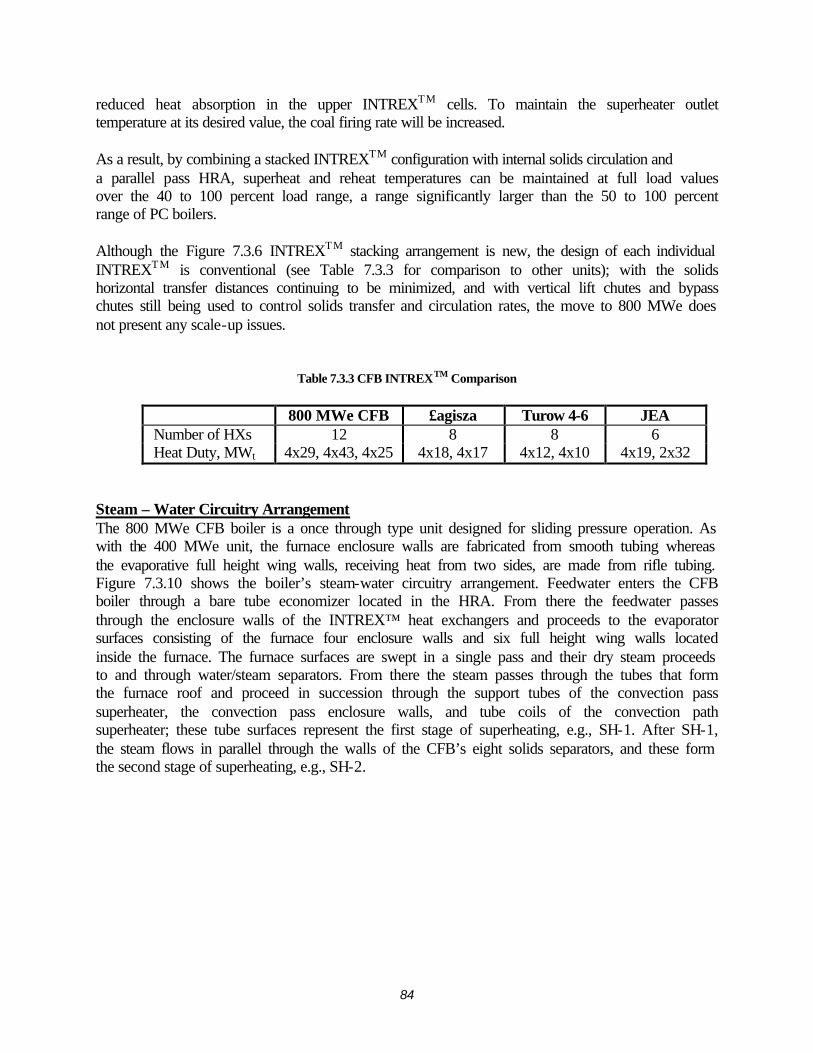
84
reduced heat absorption in the upper INTREXTM cells. To maintain the superheater outlet temperature at its desired value, the coal firing rate will be increased. As a result, by combining a stacked INTREXTM configuration with internal solids circulation and a parallel pass HRA, superheat and reheat temperatures can be maintained at full load values over the 40 to 100 percent load range, a range significantly larger than the 50 to 100 percent range of PC boilers. Although the Figure 7.3.6 INTREXTM stacking arrangement is new, the design of each individual INTREXTM is conventional (see Table 7.3.3 for comparison to other units); with the solids horizontal transfer distances continuing to be minimized, and with vertical lift chutes and bypass chutes still being used to control solids transfer and circulation rates, the move to 800 MWe does not present any scale-up issues.
Table 7.3.3 CFB INTREXTM Comparison
800 MWe CFB £agisza Turow 4-6 JEA Number of HXs 12 8 8 6 Heat Duty, MWt 4x29, 4x43, 4x25 4x18, 4x17 4x12, 4x10 4x19, 2x32
Steam – Water Circuitry Arrangement The 800 MWe CFB boiler is a once through type unit designed for sliding pressure operation. As with the 400 MWe unit, the furnace enclosure walls are fabricated from smooth tubing whereas the evaporative full height wing walls, receiving heat from two sides, are made from rifle tubing. Figure 7.3.10 shows the boiler’s steam-water circuitry arrangement. Feedwater enters the CFB boiler through a bare tube economizer located in the HRA. From there the feedwater passes through the enclosure walls of the INTREX™ heat exchangers and proceeds to the evaporator surfaces consisting of the furnace four enclosure walls and six full height wing walls located inside the furnace. The furnace surfaces are swept in a single pass and their dry steam proceeds to and through water/steam separators. From there the steam passes through the tubes that form the furnace roof and proceed in succession through the support tubes of the convection pass superheater, the convection pass enclosure walls, and tube coils of the convection path superheater; these tube surfaces represent the first stage of superheating, e.g., SH-1. After SH-1, the steam flows in parallel through the walls of the CFB’s eight solids separators, and these form the second stage of superheating, e.g., SH-2.
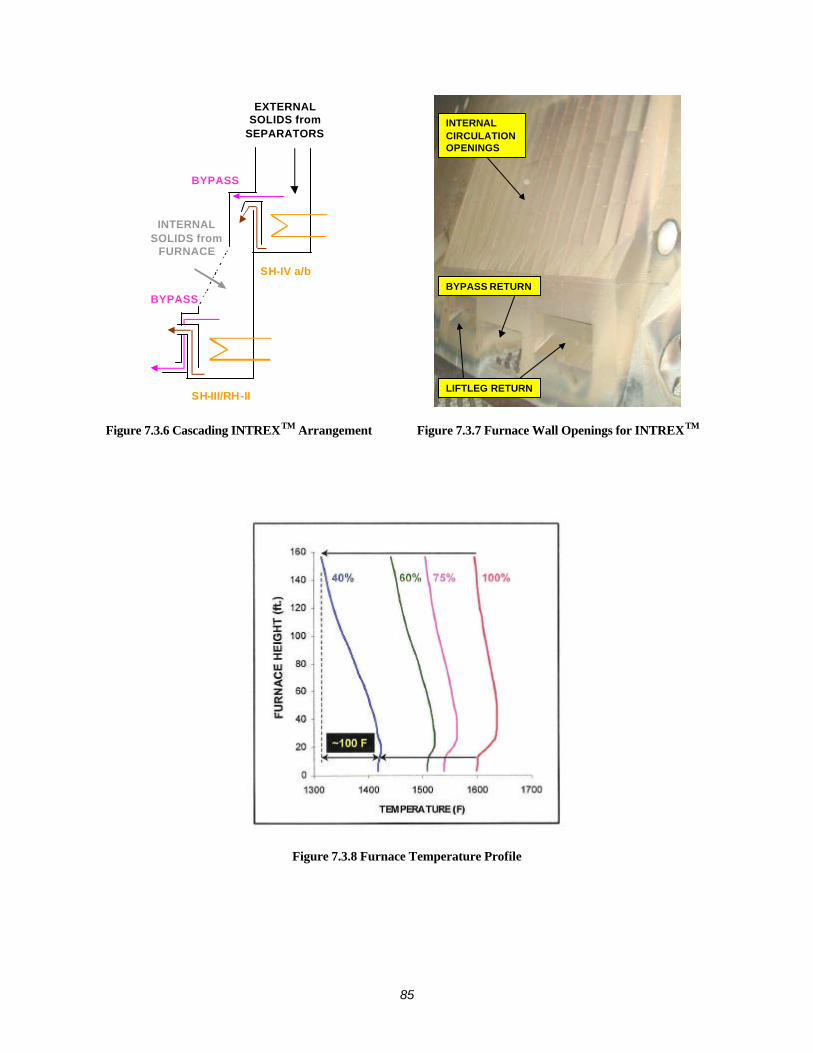
85
eEXTERNAL
SOLIDS from SEPARATORS
INTERNAL SOLIDS from
FURNACE
BYPASS
BYPASS
SH-IV a/b
SH-III/RH-II LIFTLEG RETURN
BYPASS RETURN
INTERNAL CIRCULATION OPENINGS
Figure 7.3.6 Cascading INTREXTM Arrangement
Figure 7.3.7 Furnace Wall Openings for INTREXTM
Figure 7.3.8 Furnace Temperature Profile
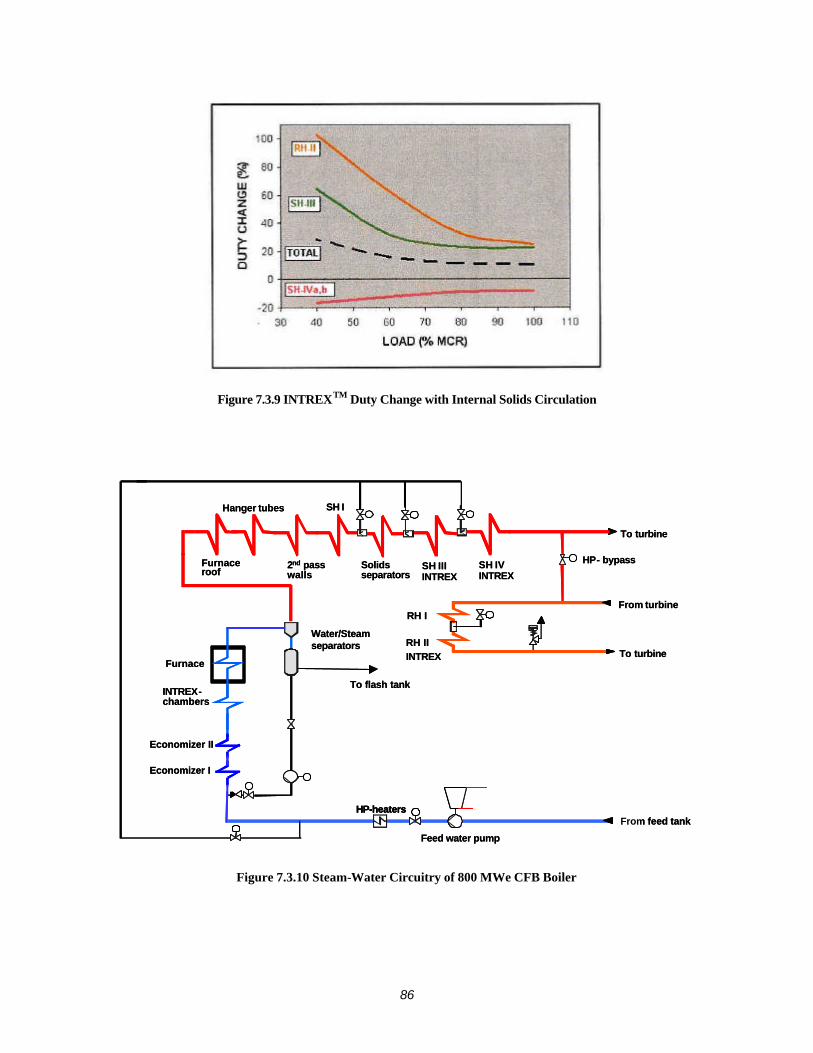
86
Figure 7.3.9 INTREXTM Duty Change with Internal Solids Circulation
INTREX-chambers
Furnace
Economizer II
2nd passwalls
Hanger tubes
Solids separators
SH IVINTREX
HP- bypass
To turbine
Feed water pump
Furnaceroof
To flash tank
Water/Steam separators
SH I
HP-heatersFrom feed tank
From turbineRH I
RH IIINTREX To turbine
SH IIIINTREX
Economizer I
INTREX-chambers
Furnace
Economizer II
2nd passwalls
Hanger tubes
Solids separators
SH IVINTREX
HP- bypass
To turbine
Feed water pump
Furnaceroof
To flash tank
Water/Steam separators
SH I
HP-heatersHP-heatersFrom feed tank
From turbineRH I
RH IIINTREX To turbine
SH IIIINTREX
Economizer I
Figure 7.3.10 Steam-Water Circuitry of 800 MWe CFB Boiler
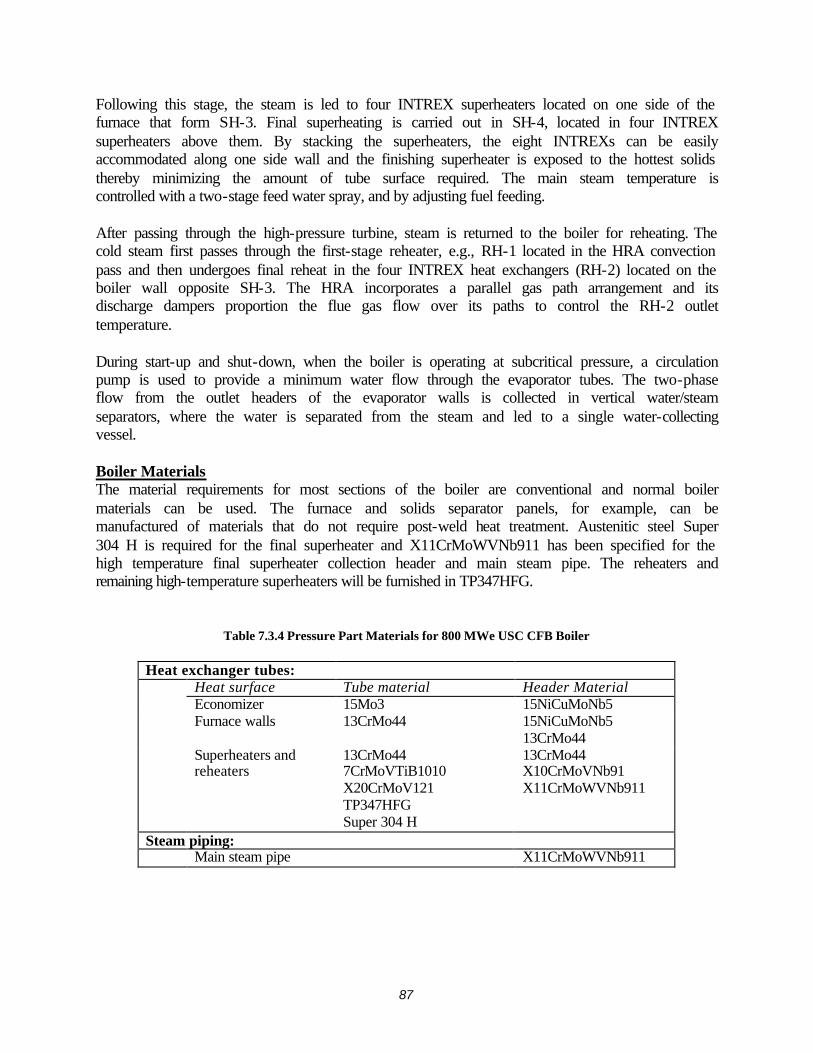
87
Following this stage, the steam is led to four INTREX superheaters located on one side of the furnace that form SH-3. Final superheating is carried out in SH-4, located in four INTREX superheaters above them. By stacking the superheaters, the eight INTREXs can be easily accommodated along one side wall and the finishing superheater is exposed to the hottest solids thereby minimizing the amount of tube surface required. The main steam temperature is controlled with a two-stage feed water spray, and by adjusting fuel feeding. After passing through the high-pressure turbine, steam is returned to the boiler for reheating. The cold steam first passes through the first-stage reheater, e.g., RH-1 located in the HRA convection pass and then undergoes final reheat in the four INTREX heat exchangers (RH-2) located on the boiler wall opposite SH-3. The HRA incorporates a parallel gas path arrangement and its discharge dampers proportion the flue gas flow over its paths to control the RH-2 outlet temperature. During start-up and shut-down, when the boiler is operating at subcritical pressure, a circulation pump is used to provide a minimum water flow through the evaporator tubes. The two-phase flow from the outlet headers of the evaporator walls is collected in vertical water/steam separators, where the water is separated from the steam and led to a single water-collecting vessel. Boiler Materials The material requirements for most sections of the boiler are conventional and normal boiler materials can be used. The furnace and solids separator panels, for example, can be manufactured of materials that do not require post-weld heat treatment. Austenitic steel Super 304 H is required for the final superheater and X11CrMoWVNb911 has been specified for the high temperature final superheater collection header and main steam pipe. The reheaters and remaining high-temperature superheaters will be furnished in TP347HFG.
Table 7.3.4 Pressure Part Materials for 800 MWe USC CFB Boiler
Heat exchanger tubes: Heat surface Tube material Header Material Economizer 15Mo3 15NiCuMoNb5 Furnace walls 13CrMo44 15NiCuMoNb5
13CrMo44 Superheaters and
reheaters 13CrMo44 7CrMoVTiB1010 X20CrMoV121 TP347HFG Super 304 H
13CrMo44 X10CrMoVNb91 X11CrMoWVNb911
Steam piping: Main steam pipe X11CrMoWVNb911
88
Coal Feed Coal, crushed to a nominal top size of 1/2 inch, is stored in four four-day silos positioned along the front wall of the boiler. Chain feeders under each silo meter the coal feed rate and drop the fuel onto four chain conveyors (two along each furnace sidewall) which, in turn, deliver the coal to a total of 16 drop chutes/screw feeders. Sorbent Feed Limestone with a 2-inch top size is stored in two silos positioned adjacent to each furnace side wall; the silos have a combined holding capacity of four days of limestone with the unit operating at full load. Limestone is withdrawn from the silos, milled to nominal top size of 600 microns, and rotary feeders meter the limestone flow into pneumatic transport systems that deliver the sorbent to 16 feed points. The limestone is concentrically injected into the furnace through selected lower level secondary air ports. Draft System Pairs of radial fans with inlet guide vane control are used for primary and secondary systems. Balanced draft operation is provided by two (2) axial flow, induced draft fans positioned downstream of a baghouse filter. Start-up burner air, INTREXTM fluidization air, and wall seal aeration air is provided by four (4) centrifugal blowers. The flue gas exiting from the boiler is cooled in two parallel rotary/regenerative air heaters. The air heaters incorporate a tri-sector design, are approximately 55 feet in diameter, and cool the flue gases to 267ºF for discharge to a baghouse filter. Bottom Ash System A total of two stripper/coolers are provided (one adjacent to furnace front and rear walls) to cool and recover heat from the ash that drained from the furnace to maintain its inventory of circulating solids. Cooling and heat recovery is achieved by transferring ash sensible heat into the cold primary air used for fluidization, and by tube bundles through which low temperature condensate is passed. Ash removal rates are controlled by rotary valves that drop the 500ºF ash onto two drag chain conveyors that run the length of the furnace. For additional ash removal capacity and for occasional removal of ash from the center of the furnace, two screw coolers are also provided with drain inlets positioned near the center of the furnace. 7.4 Balance of Plant Systems The balance of plant systems of the nominal 800 MWe CFB boiler are, with the exception of higher capacities/flow rates, essentially identical to those of the 400 MWe CFB boiler. For a description of the systems the reader is referred to Section 5.3. 7.5 Plant Cost and Economics The 740.5 MWe USC CFB boiler system shown in Figure 7.3.1, complete with silos, limestone milling, coal and limestone feeding, CFB boiler, air heater, fans, flues, ducts, ash coolers, ash conveyors, and structural steel, is estimated to cost, delivered to the site and erected with union labor, $367.1 million in January 2006 dollars. In Table 7.5.1 the CFB system costs are shown along with the balance of plant cost elements and the plant has a bare erected cost (equipment
89
plus field labor and materials) of $761.3 million. Adding 10 percent for architect/plant engineering, construction management, home office costs, and fee, plus 10 percent for project contingency, yields a total plant cost of $921.1 million or $1,244/kW. As discussed in Section 3, the TPC assumes over night construction and Table 7.5.2 adds $144.3 million for interest during construction to obtain a TPI of $1,065.4 million. The addition of start up costs, inventory capital, land, etc. yields a TCR of $1,097.3 million. O&M costs, operating costs, and fuel costs are also shown and together with the levelized fixed carrying charge yield a 20 year levelized cost of electricity of $44.08/MWhr. Reference [4-1] estimated that a PC plant operating with conventional, supercritical pressure conditions (3500psig/1050ºF/1050ºF) and producing 401.8 MWe of net power would cost $1,173/kW in January 1998 dollars. A 550 MWe update of that plant is in preparation for the DOE and, it is believed it will show a new total plant cost of approximately $1,350/kW in January 2006 dollars with a 10 year levelized cost of electricity of approximately $50/MWhr. Recognizing that the USC CFB plant is larger in size, which gives the CFB plant an economy of scale advantage, and that many assumptions are involved in calculating plant performance, costs, and economics, a comparison of values calculated by different investigators must be done with caution. With the nominal 800 MWe USC CFB plant coming in with a TPC of $1,244/kW and a levelized cost of electricity of $44.08/MWhr, a comparison of the two plants indicates CFB boilers will remain competitive with PC plants in both large sizes as well as under USC steam conditions.
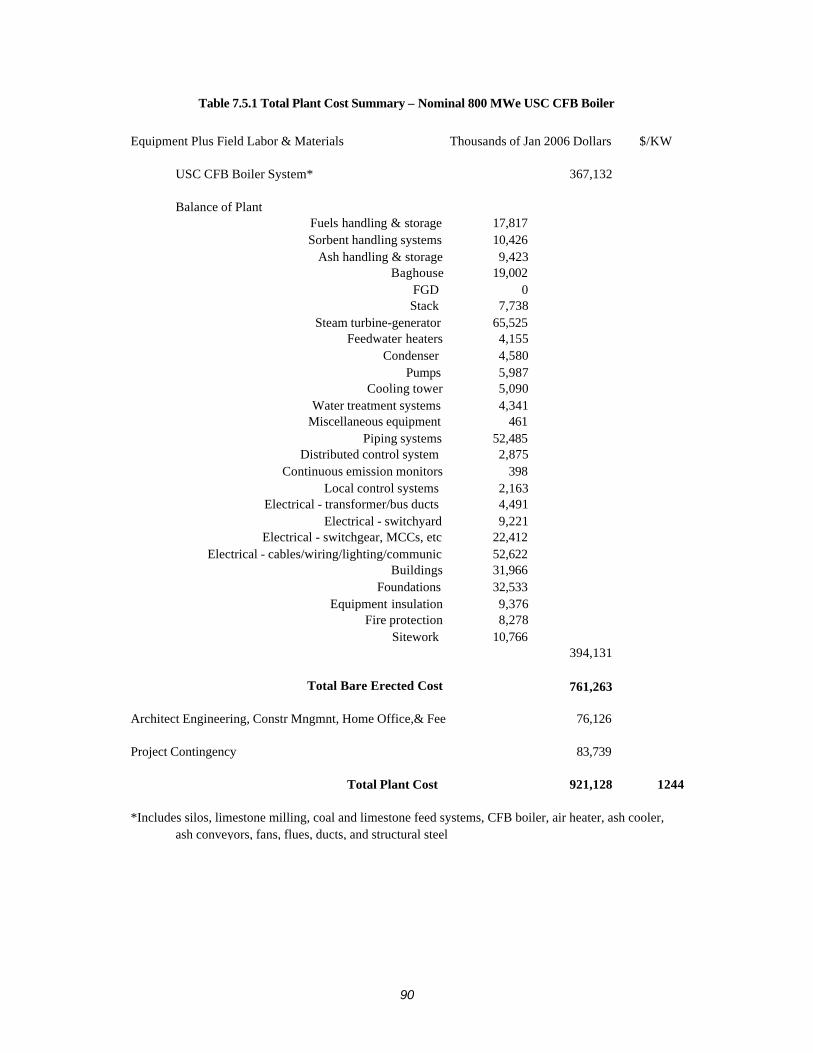
90
Table 7.5.1 Total Plant Cost Summary – Nominal 800 MWe USC CFB Boiler
Equipment Plus Field Labor & Materials Thousands of Jan 2006 Dollars $/KW
USC CFB Boiler System* 367,132
Balance of PlantFuels handling & storage 17,817Sorbent handling systems 10,426
Ash handling & storage 9,423Baghouse 19,002
FGD 0Stack 7,738
Steam turbine-generator 65,525Feedwater heaters 4,155
Condenser 4,580Pumps 5,987
Cooling tower 5,090Water treatment systems 4,341
Miscellaneous equipment 461Piping systems 52,485
Distributed control system 2,875Continuous emission monitors 398
Local control systems 2,163Electrical - transformer/bus ducts 4,491
Electrical - switchyard 9,221Electrical - switchgear, MCCs, etc 22,412
Electrical - cables/wiring/lighting/communic 52,622Buildings 31,966
Foundations 32,533Equipment insulation 9,376
Fire protection 8,278Sitework 10,766
394,131
Total Bare Erected Cost 761,263
Architect Engineering, Constr Mngmnt, Home Office,& Fee 76,126
Project Contingency 83,739
Total Plant Cost 921,128 1244
*Includes silos, limestone milling, coal and limestone feed systems, CFB boiler, air heater, ash cooler, ash conveyors, fans, flues, ducts, and structural steel
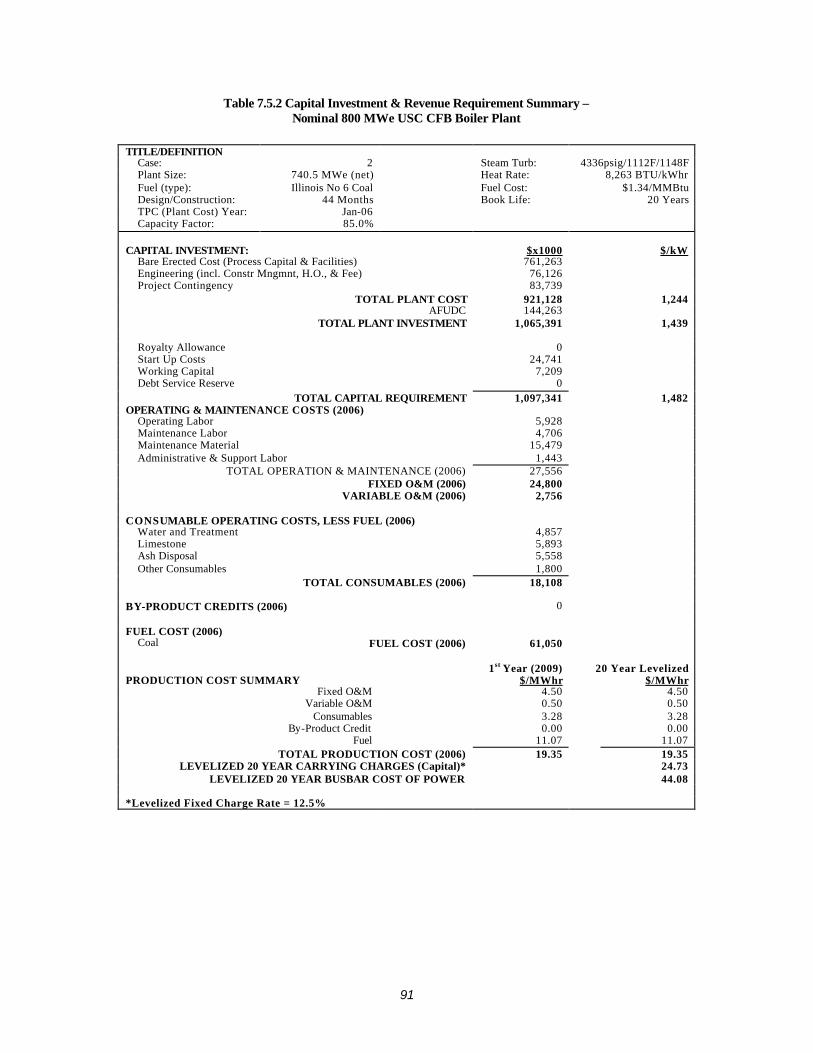
91
Table 7.5.2 Capital Investment & Revenue Requirement Summary – Nominal 800 MWe USC CFB Boiler Plant
TITLE/DEFINITION
Case: 2 Steam Turb: 4336psig/1112F/1148F Plant Size: 740.5 MWe (net) Heat Rate: 8,263 BTU/kWhr Fuel (type): Illinois No 6 Coal Fuel Cost: $1.34/MMBtu Design/Construction: 44 Months Book Life: 20 Years TPC (Plant Cost) Year: Jan-06 Capacity Factor: 85.0%
CAPITAL INVESTMENT: $x1000 $/kW
Bare Erected Cost (Process Capital & Facilities) 761,263 Engineering (incl. Constr Mngmnt, H.O., & Fee) 76,126 Project Contingency 83,739
TOTAL PLANT COST 921,128 1,244 AFUDC 144,263
TOTAL PLANT INVESTMENT 1,065,391 1,439
Royalty Allowance 0 Start Up Costs 24,741 Working Capital 7,209 Debt Service Reserve 0
TOTAL CAPITAL REQUIREMENT 1,097,341 1,482 OPERATING & MAINTENANCE COSTS (2006)
Operating Labor 5,928 Maintenance Labor 4,706 Maintenance Material 15,479 Administrative & Support Labor 1,443
TOTAL OPERATION & MAINTENANCE (2006) 27,556 FIXED O&M (2006) 24,800
VARIABLE O&M (2006) 2,756 CONSUMABLE OPERATING COSTS, LESS FUEL (2006)
Water and Treatment 4,857 Limestone 5,893 Ash Disposal 5,558 Other Consumables 1,800
TOTAL CONSUMABLES (2006) 18,108 BY-PRODUCT CREDITS (2006) 0 FUEL COST (2006)
Coal FUEL COST (2006) 61,050 1st Year (2009) 20 Year Levelized PRODUCTION COST SUMMARY $/MWhr $/MWhr
Fixed O&M 4.50 4.50 Variable O&M 0.50 0.50
Consumables 3.28 3.28 By-Product Credit 0.00 0.00
Fuel 11.07 11.07 TOTAL PRODUCTION COST (2006) 19.35 19.35
LEVELIZED 20 YEAR CARRYING CHARGES (Capital)* 24.73 LEVELIZED 20 YEAR BUSBAR COST OF POWER 44.08
*Levelized Fixed Charge Rate = 12.5%
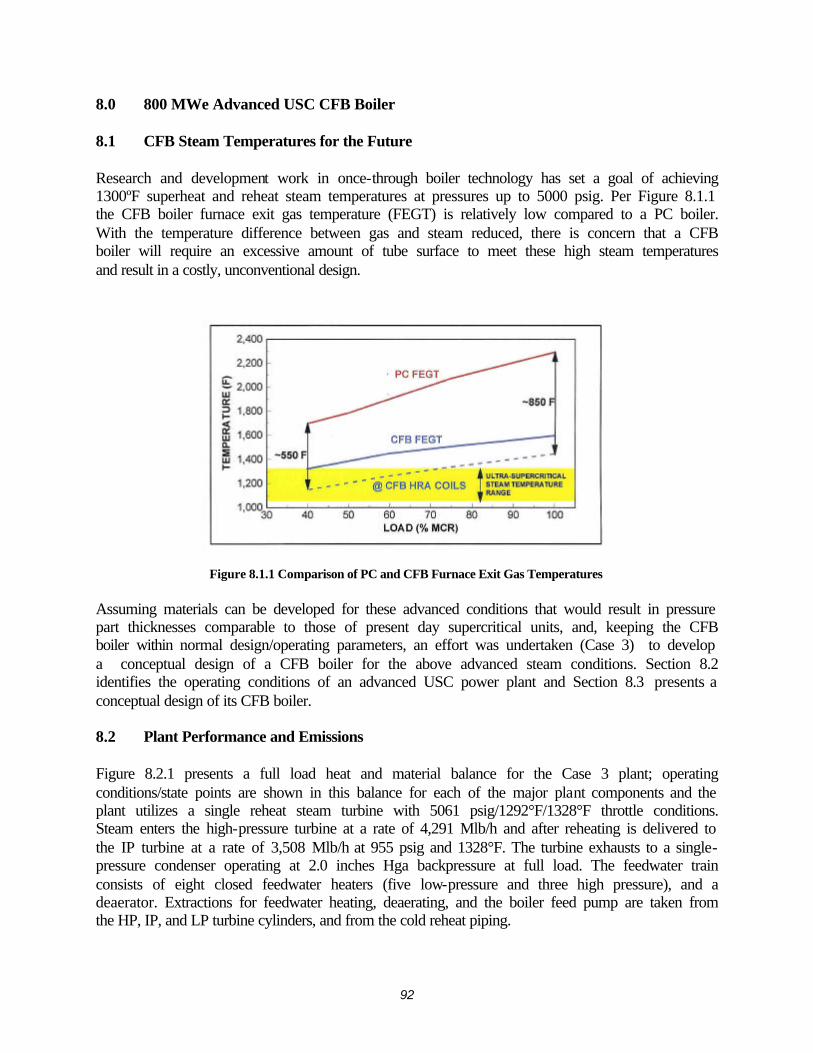
92
8.0 800 MWe Advanced USC CFB Boiler 8.1 CFB Steam Temperatures for the Future Research and development work in once-through boiler technology has set a goal of achieving 1300ºF superheat and reheat steam temperatures at pressures up to 5000 psig. Per Figure 8.1.1 the CFB boiler furnace exit gas temperature (FEGT) is relatively low compared to a PC boiler. With the temperature difference between gas and steam reduced, there is concern that a CFB boiler will require an excessive amount of tube surface to meet these high steam temperatures and result in a costly, unconventional design.
Figure 8.1.1 Comparison of PC and CFB Furnace Exit Gas Temperatures
Assuming materials can be developed for these advanced conditions that would result in pressure part thicknesses comparable to those of present day supercritical units, and, keeping the CFB boiler within normal design/operating parameters, an effort was undertaken (Case 3) to develop a conceptual design of a CFB boiler for the above advanced steam conditions. Section 8.2 identifies the operating conditions of an advanced USC power plant and Section 8.3 presents a conceptual design of its CFB boiler. 8.2 Plant Performance and Emissions Figure 8.2.1 presents a full load heat and material balance for the Case 3 plant; operating conditions/state points are shown in this balance for each of the major plant components and the plant utilizes a single reheat steam turbine with 5061 psig/1292°F/1328°F throttle conditions. Steam enters the high-pressure turbine at a rate of 4,291 Mlb/h and after reheating is delivered to the IP turbine at a rate of 3,508 Mlb/h at 955 psig and 1328°F. The turbine exhausts to a single-pressure condenser operating at 2.0 inches Hga backpressure at full load. The feedwater train consists of eight closed feedwater heaters (five low-pressure and three high pressure), and a deaerator. Extractions for feedwater heating, deaerating, and the boiler feed pump are taken from the HP, IP, and LP turbine cylinders, and from the cold reheat piping.
93
The plant has been designed to the same emissions requirements as the other CFB plants and, as such, it uses limestone feed to the CFB boiler for in situ sulfur capture (96 percent SO2 removal), staged combustion to control NOx emissions to below 0.16 lb/MMBtu, and a pulse jet baghouse filter to remove over 99.9% of the dust in the flue gas. Tables 8.2.1 and 8.2.2 summarizes the performance and emissions of the plant at full load. The plant net power output is 768.2 MWe and it operates with an efficiency of 43.3 percent (HHV), which is a heat rate of 7,878 Btu/kWh. The move to advanced USC, e.g., higher pressure and higher superheat and reheat temperatures increases the plant efficiency by approximately 5 percent (43.3 versus 41.3) over that of the Case 2 plant. As a result, the plant emissions are similarly reduced by about 5 percent.
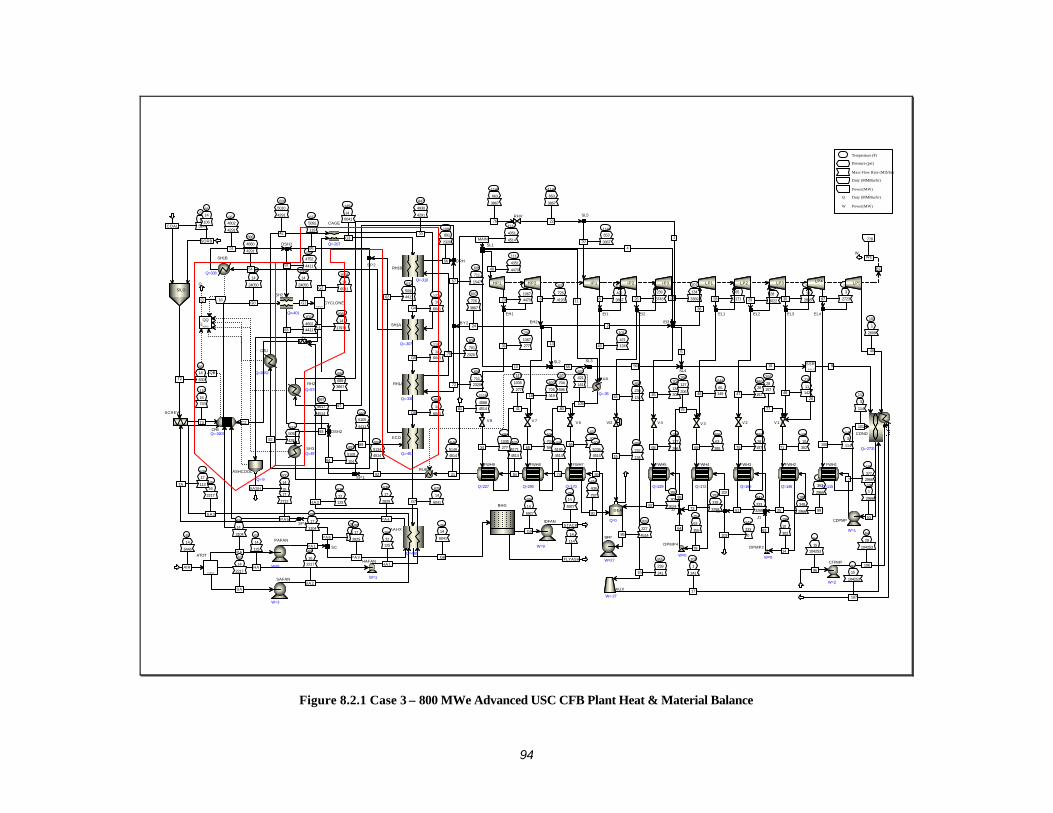
94
110
16
743
T3 C2
535
17
2712
PA598
17
279PA6
535
16
2217
SA3
1625
14
24050
G0
QB
55
14
524COAL
55
14
106
SORB
56
14
630T2
535
17
113TA
1568
14
24050
G1
1568
14
17974C1
1568
14
6041G2
63
14
125
HA
162
22
125
HA1
63
14
5446
AIR
63
14
3104
PA63
14
2217
SA
625
14
6041G7
82
16
2217
SA2
98
17
2825
PA3
267
14
6041
G8
535
17
2825
PA4
535
22
125HA3
98
17
3104
PA1
553
5105
4411
89
907
14
6041G6
637
5092
441162
847
4930
4291
55
1278
14
6041G4
1102
14
6041G5
888
4860
4291
54
828
5010
4291
42
1453
14
6041
G3
839
701
232075
1081
691
2320
56
605
711
232072
267
14
5927
G9267
14
114
FLYASH
286
14
5927
STACK
932
4752
441191
1021
4662
441183
500
14
35BASH
607
726
41936
1148
653
386750
1014
421
38678
855
239
374326
707
134
336927
36
544
65
317128
380
28
302229
219
11
286530
101
1
2609
40
778
WEW
13
607
726
31918
607
726
3867
24 2
1014
421
12443
855
239
13444
855
239
24116
1
4
707
134
20645
5
544
65
14946
380
28
15747
219
11
14248
1112
4351
4514MAIN
1112
4351
447049
11
10 9
101
1
241
17
111
3
114
101
101
1
2966
53
19
20
855
232
13415
58 59
511
1035
277
41
504
704
59665
452
704
596
80
592
421
161
105
447
408
75766
706
127
20668
298
127
206
79
296
63
35569
380
28
15770
200
28
157
77
195
10
30271
101
377
29667
350
303
362482
416
408
757
90
393
227
451486
406
5236
4514
85140
363
2966
99
189
348
296625
195
10
302
14
241
333
326861
102
251
63
355
78
292
318
326873
95
442
5192
4514
74
501
5171
4514
84
1148
653
3867
22
697
1035
27734546
5149
4514
21
700
1067
447023
700
1067
27731
951
4802
4291
51
637
5092
119
88
637
5092
429152553
5134
4514
92
553
5105
10494
997
4617
4514
93
1119
4588
451481
605
711
154757
880
689
3867
67
1149
663
3867
76
16Q
Q
6364
145
3
272397
145
3
114100
241
333
0103
64
15
104253
96
64
29
104253
10691
15
104253
107
CFBQ=-3407
SILO
SCREW
SSPLIT
CYCLONE
HAFAN
W=1FSPLIT
ATOT
AAHX
Q=-560
PAFAN
W=8
ECO
Q=-461
SH1A
Q=-307
CAGE
Q=-207
RH1B
Q=-310
RH1A
Q=-330
JV
BHG
IDFAN
W=9
SH2
Q=-401
ASHCOOL
Q=-9
SPA
SC
SAFAN
W=3
HP2 IP1 IP2 IP3 LP1 LP2 LP3 LP5
W
MULTEG
EH2
EI1 EI2
EI3
EL1 EL2 EL3
SL1
COND
Q=-2731
FSPLIT
SSR
VD
AUX
W=-27
SL2 SL3
V7 V6 V4 V3 V2 V1
CDPMP
W=1
DEA
Q=0
BFP
W=27
FWH2
Q=146
FWH3
Q=166
FWH4
Q=172
FWH5
Q=229
FWH7
Q=170
FWH8
Q=290
SL5
SL4
FWH9
Q=227
HP1
EH1
V8
DSH1
SH1B
Q=338
OTU
Q=2032
RUB
SP1
DSH2
SH3Q=457
BY2
DRH
RH2
Q=574
QMIXER
RHV
SP2
J1
DPMP2
W=0
DPMP4
W=0
J2
LP4
EL4
FWH1
Q=115
SP
RUA
Q=-35
CTPMP
W=2
Temperature (F)
Pressure (psi)
Mass Flow Rate (Mlb/hr)
Duty (MMBtu/hr)
Power(MW)
Q Duty (MMBtu/hr)
W Power(MW)
CASE-2r, ST=4351/1112/1148/2"Hg, AuxPower=65MW, Gross Power=805MWe, NetPower=740MWe, Neteff=41.25%, 05/09/06
Figure 8.2.1 Case 3 – 800 MWe Advanced USC CFB Plant Heat & Material Balance
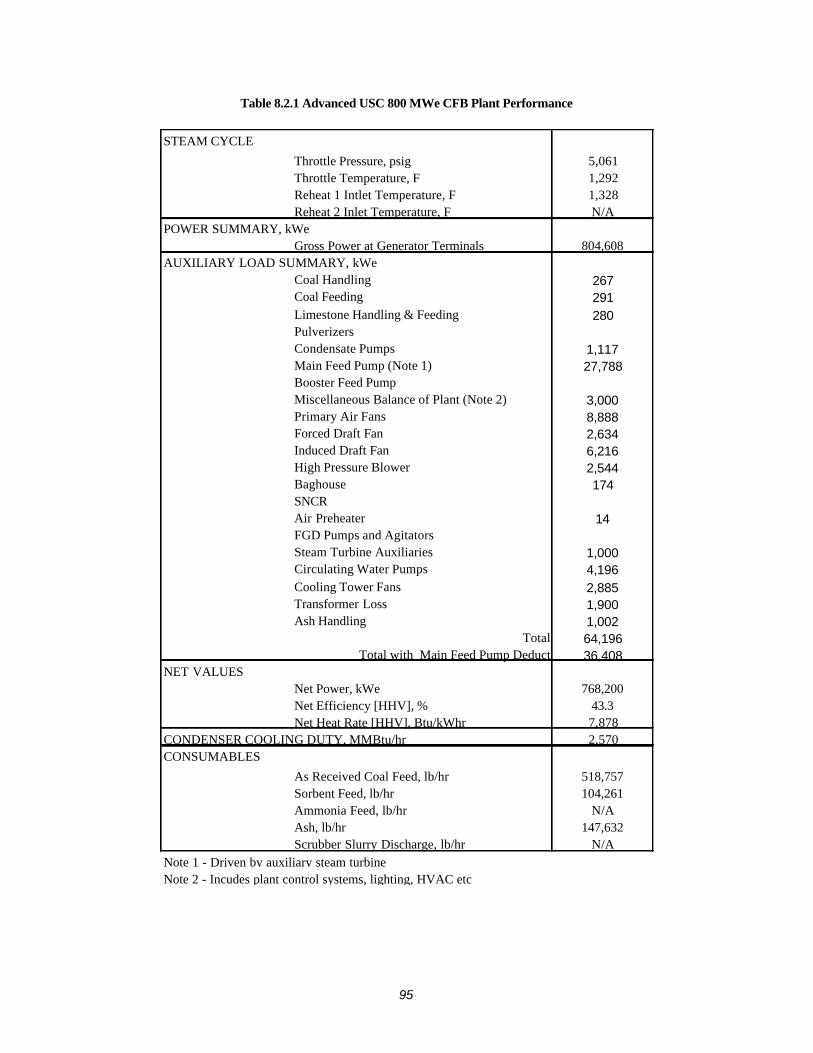
95
Table 8.2.1 Advanced USC 800 MWe CFB Plant Performance
Throttle Pressure, psig 5,061Throttle Temperature, F 1,292Reheat 1 Intlet Temperature, F 1,328Reheat 2 Inlet Temperature, F N/A
POWER SUMMARY, kWeGross Power at Generator Terminals 804,608
Coal Handling 267Coal Feeding 291Limestone Handling & Feeding 280PulverizersCondensate Pumps 1,117Main Feed Pump (Note 1) 27,788Booster Feed PumpMiscellaneous Balance of Plant (Note 2) 3,000Primary Air Fans 8,888Forced Draft Fan 2,634Induced Draft Fan 6,216High Pressure Blower 2,544Baghouse 174SNCRAir Preheater 14FGD Pumps and AgitatorsSteam Turbine Auxiliaries 1,000Circulating Water Pumps 4,196Cooling Tower Fans 2,885Transformer Loss 1,900Ash Handling 1,002
64,196Total with Main Feed Pump Deduct 36,408
NET VALUESNet Power, kWe 768,200Net Efficiency [HHV], % 43.3Net Heat Rate [HHV], Btu/kWhr 7,878
2,570
As Received Coal Feed, lb/hr 518,757Sorbent Feed, lb/hr 104,261Ammonia Feed, lb/hr N/AAsh, lb/hr 147,632Scrubber Slurry Discharge, lb/hr N/A
Note 2 - Incudes plant control systems, lighting, HVAC etc
STEAM CYCLE
CONDENSER COOLING DUTY, MMBtu/hrCONSUMABLES
Note 1 - Driven by auxiliary steam turbine
Total
AUXILIARY LOAD SUMMARY, kWe
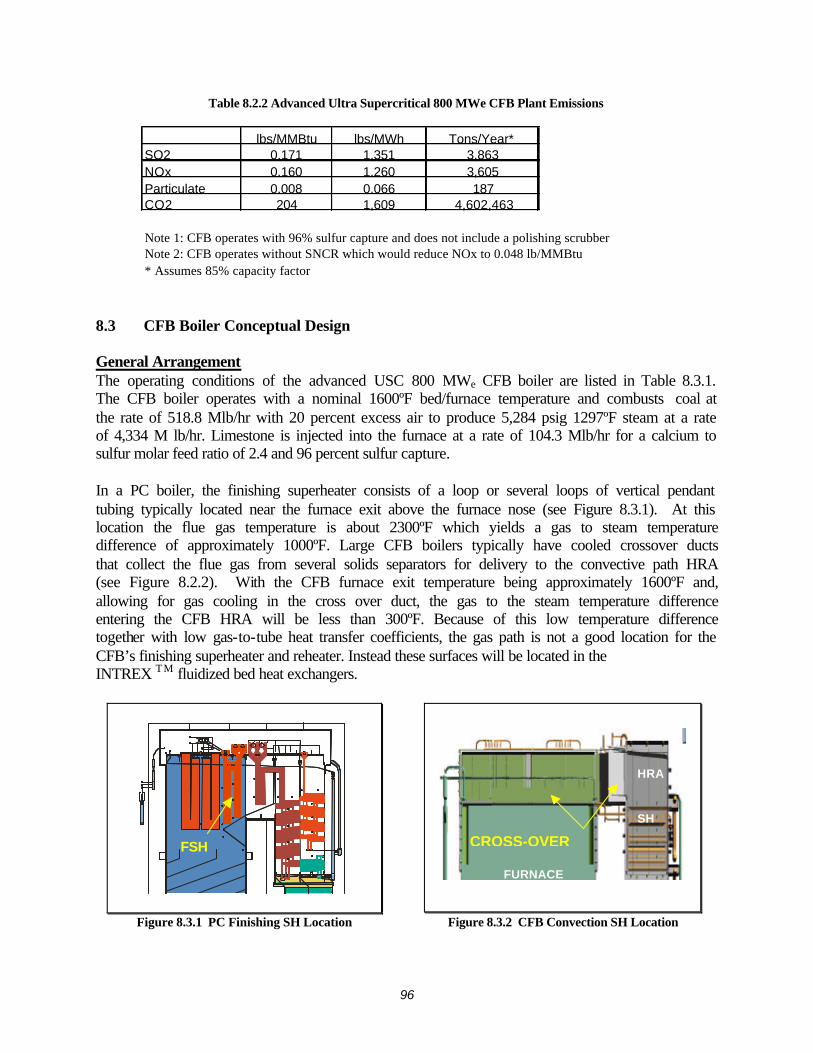
96
Table 8.2.2 Advanced Ultra Supercritical 800 MWe CFB Plant Emissions
lbs/MMBtu lbs/MWh Tons/Year* SO2 0.171 1.351 3,863NOx 0.160 1.260 3,605Particulate 0.008 0.066 187CO2 204 1,609 4,602,463
Note 1: CFB operates with 96% sulfur capture and does not include a polishing scrubberNote 2: CFB operates without SNCR which would reduce NOx to 0.048 lb/MMBtu* Assumes 85% capacity factor
8.3 CFB Boiler Conceptual Design General Arrangement The operating conditions of the advanced USC 800 MWe CFB boiler are listed in Table 8.3.1. The CFB boiler operates with a nominal 1600ºF bed/furnace temperature and combusts coal at the rate of 518.8 Mlb/hr with 20 percent excess air to produce 5,284 psig 1297ºF steam at a rate of 4,334 M lb/hr. Limestone is injected into the furnace at a rate of 104.3 Mlb/hr for a calcium to sulfur molar feed ratio of 2.4 and 96 percent sulfur capture. In a PC boiler, the finishing superheater consists of a loop or several loops of vertical pendant tubing typically located near the furnace exit above the furnace nose (see Figure 8.3.1). At this location the flue gas temperature is about 2300ºF which yields a gas to steam temperature difference of approximately 1000ºF. Large CFB boilers typically have cooled crossover ducts that collect the flue gas from several solids separators for delivery to the convective path HRA (see Figure 8.2.2). With the CFB furnace exit temperature being approximately 1600ºF and, allowing for gas cooling in the cross over duct, the gas to the steam temperature difference entering the CFB HRA will be less than 300ºF. Because of this low temperature difference together with low gas-to-tube heat transfer coefficients, the gas path is not a good location for the CFB’s finishing superheater and reheater. Instead these surfaces will be located in the INTREX TM fluidized bed heat exchangers.
FSH
CROSS-OVER
FURNACE
HRA
SH
Figure 8.3.1 PC Finishing SH Location Figure 8.3.2 CFB Convection SH Location
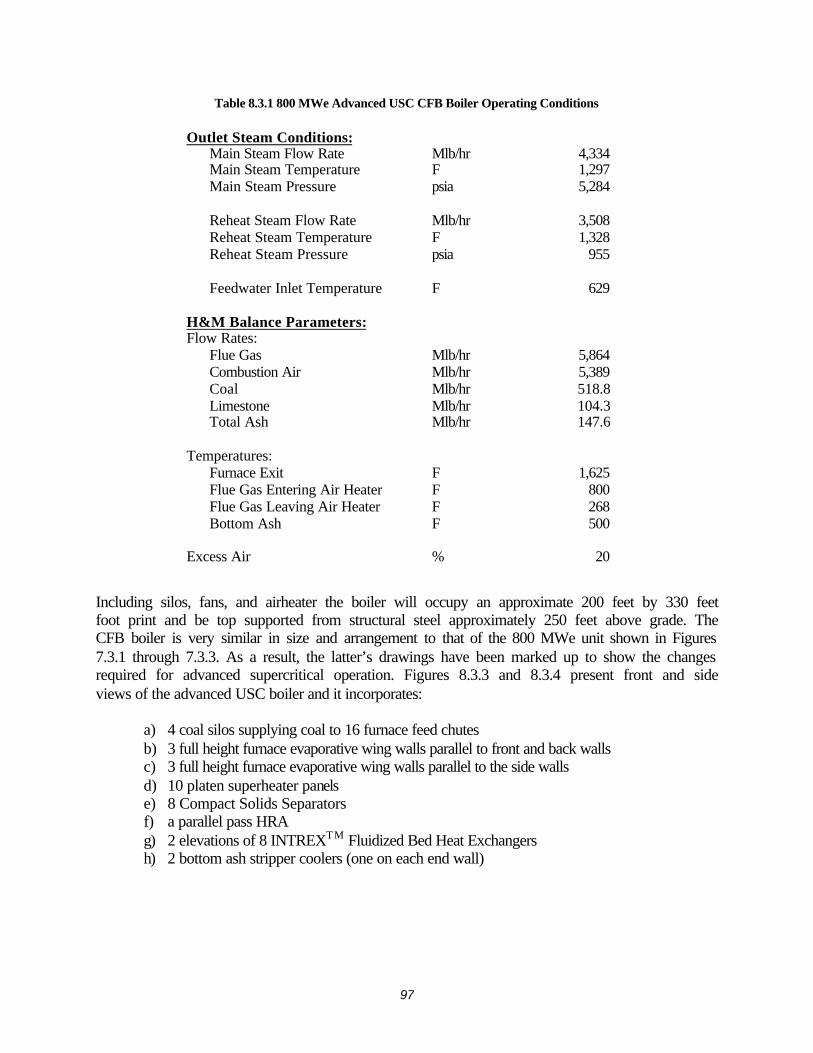
97
Table 8.3.1 800 MWe Advanced USC CFB Boiler Operating Conditions
Outlet Steam Conditions: Main Steam Flow Rate Mlb/hr 4,334 Main Steam Temperature F 1,297 Main Steam Pressure psia 5,284 Reheat Steam Flow Rate Mlb/hr 3,508 Reheat Steam Temperature F 1,328 Reheat Steam Pressure psia 955 Feedwater Inlet Temperature F 629
H&M Balance Parameters: Flow Rates:
Flue Gas Mlb/hr 5,864 Combustion Air Mlb/hr 5,389 Coal Mlb/hr 518.8 Limestone Mlb/hr 104.3 Total Ash Mlb/hr 147.6
Temperatures:
Furnace Exit F 1,625 Flue Gas Entering Air Heater F 800 Flue Gas Leaving Air Heater F 268 Bottom Ash F 500
Excess Air % 20
Including silos, fans, and airheater the boiler will occupy an approximate 200 feet by 330 feet foot print and be top supported from structural steel approximately 250 feet above grade. The CFB boiler is very similar in size and arrangement to that of the 800 MWe unit shown in Figures 7.3.1 through 7.3.3. As a result, the latter’s drawings have been marked up to show the changes required for advanced supercritical operation. Figures 8.3.3 and 8.3.4 present front and side views of the advanced USC boiler and it incorporates:
a) 4 coal silos supplying coal to 16 furnace feed chutes b) 3 full height furnace evaporative wing walls parallel to front and back walls c) 3 full height furnace evaporative wing walls parallel to the side walls d) 10 platen superheater panels e) 8 Compact Solids Separators f) a parallel pass HRA g) 2 elevations of 8 INTREXTM Fluidized Bed Heat Exchangers h) 2 bottom ash stripper coolers (one on each end wall)
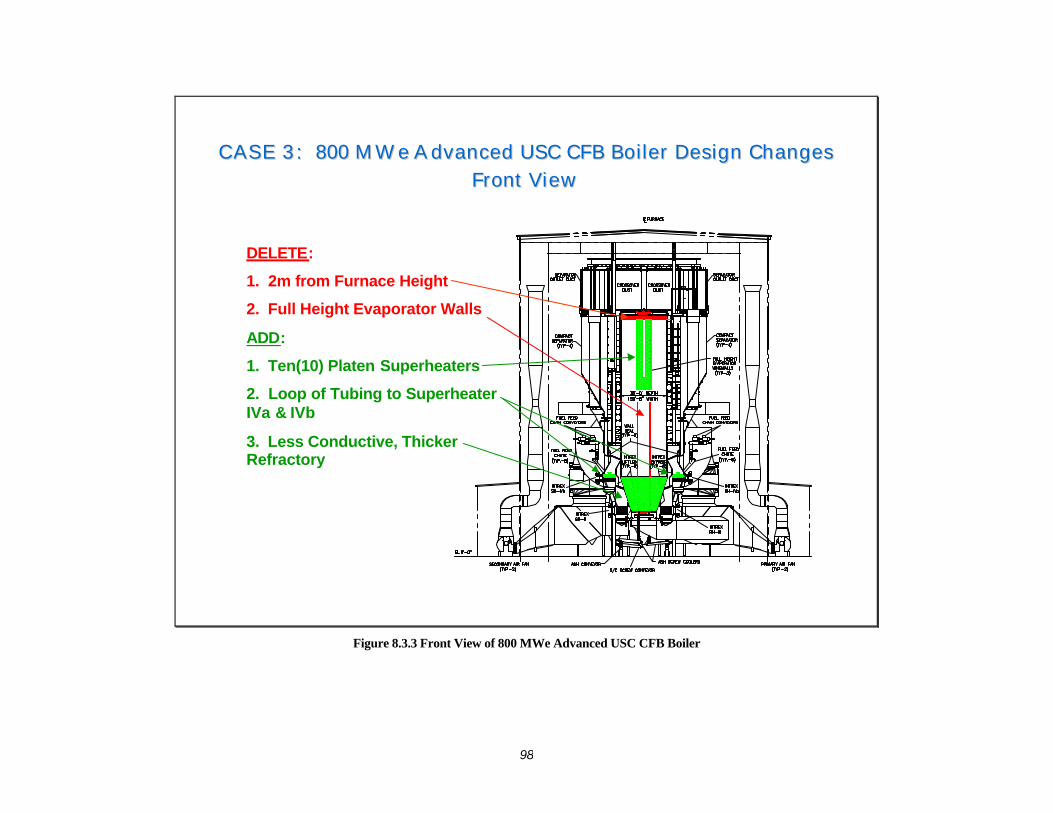
98
CASE 3 : 800 M W e A dvanced USC CFB Boiler Design Changes CASE 3 : 800 M W e A dvanced USC CFB Boiler Design Changes Front ViewFront View
DELETE:
1. 2m from Furnace Height
2. Full Height Evaporator Walls
ADD:
1. Ten(10) Platen Superheaters
2. Loop of Tubing to SuperheaterIVa & IVb
3. Less Conductive, Thicker Refractory
Figure 8.3.3 Front View of 800 MWe Advanced USC CFB Boiler
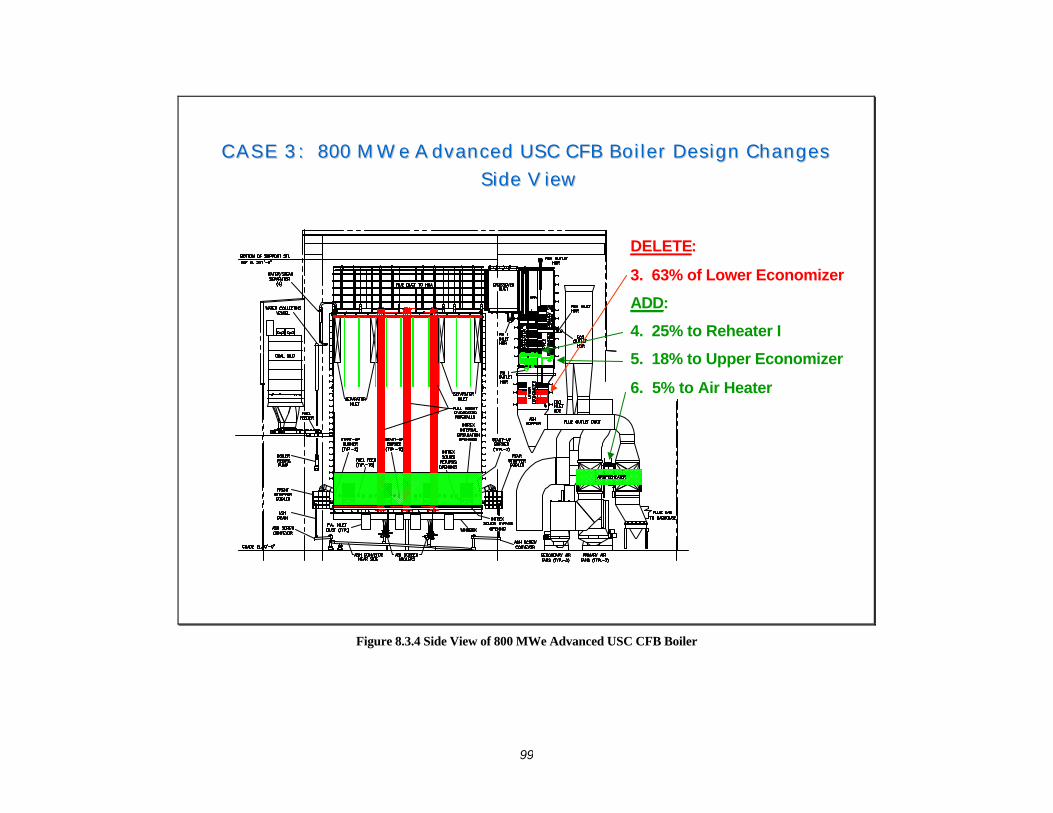
99
C A S E 3 : 800 M W e A dvanced USC CFB Boi ler Design Changes C A S E 3 : 800 M W e A dvanced USC CFB Boi ler Design Changes
Side V iewSide V iew
DELETE:
3. 63% of Lower Economizer
ADD:
4. 25% to Reheater I
5. 18% to Upper Economizer
6. 5% to Air Heater
Figure 8.3.4 Side View of 800 MWe Advanced USC CFB Boiler
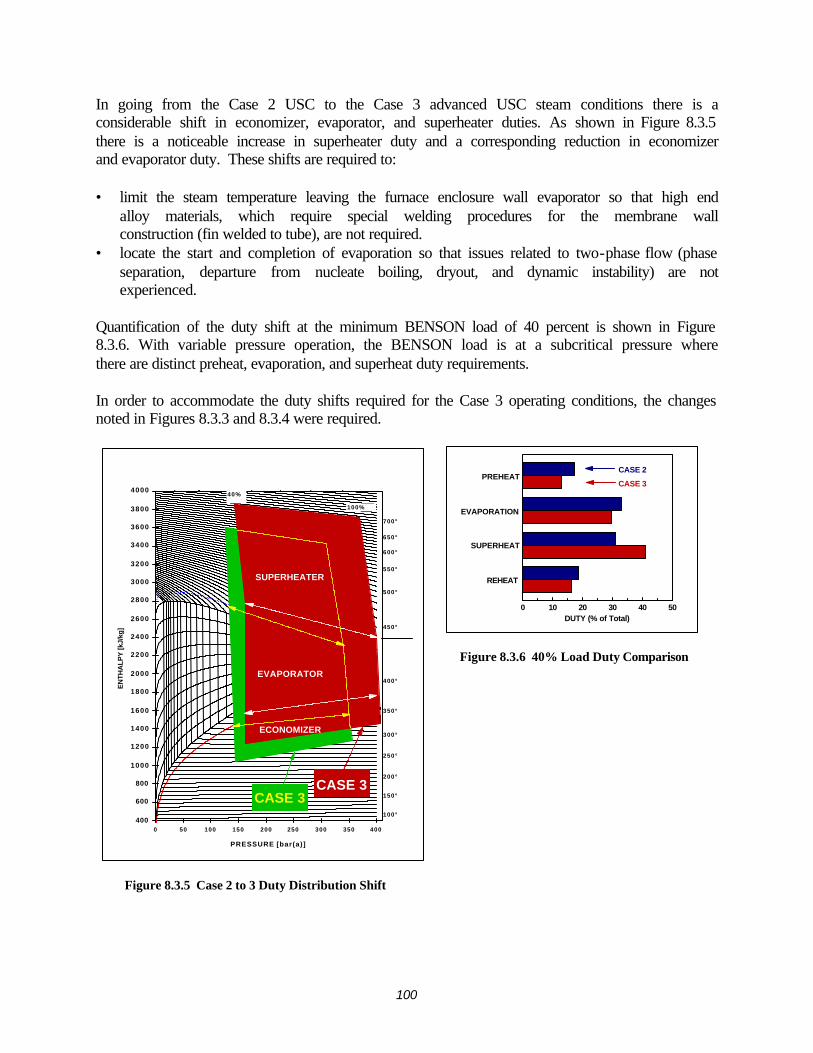
100
In going from the Case 2 USC to the Case 3 advanced USC steam conditions there is a considerable shift in economizer, evaporator, and superheater duties. As shown in Figure 8.3.5 there is a noticeable increase in superheater duty and a corresponding reduction in economizer and evaporator duty. These shifts are required to: • limit the steam temperature leaving the furnace enclosure wall evaporator so that high end
alloy materials, which require special welding procedures for the membrane wall construction (fin welded to tube), are not required.
• locate the start and completion of evaporation so that issues related to two-phase flow (phase separation, departure from nucleate boiling, dryout, and dynamic instability) are not experienced.
Quantification of the duty shift at the minimum BENSON load of 40 percent is shown in Figure 8.3.6. With variable pressure operation, the BENSON load is at a subcritical pressure where there are distinct preheat, evaporation, and superheat duty requirements. In order to accommodate the duty shifts required for the Case 3 operating conditions, the changes noted in Figures 8.3.3 and 8.3.4 were required.
Figure 8.3.6 40% Load Duty Comparison
Figure 8.3.5 Case 2 to 3 Duty Distribution Shift
400
600
800
1000
1200
1400
1600
1800
2000
2200
2400
2600
2800
3000
3200
3400
3600
3800
4000
0 50 100 150 200 250 300 350 400
PRESSURE [bar(a)]
EN
TH
AL
PY
[kJ
/kg
]
700°
300°
350°
400°
450°
500°
550°
600°
650°
250°
200°
150°
100°
40%
100%
SUPERHEATER
EVAPORATOR
ECONOMIZER
CASE 3CASE 3
PREHEAT
EVAPORATION
SUPERHEAT
REHEAT
0 10 20 30 40 50DUTY (% of Total)
CASE 2
CASE 3
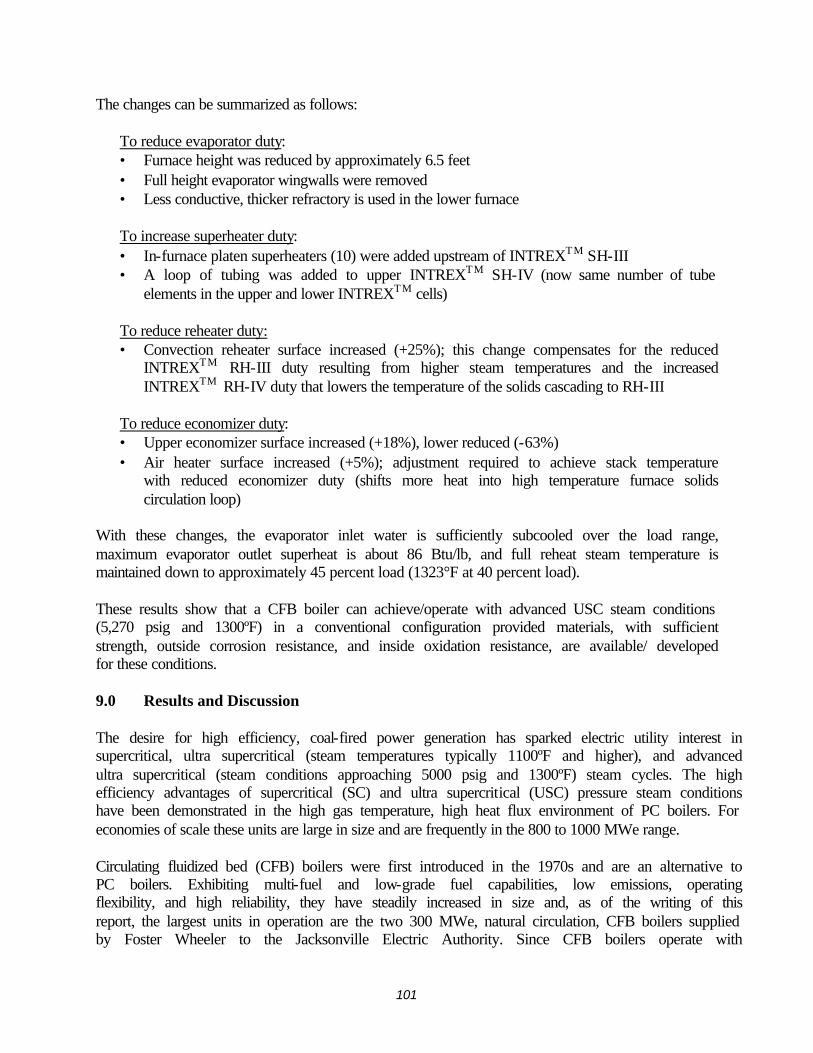
101
The changes can be summarized as follows:
To reduce evaporator duty: • Furnace height was reduced by approximately 6.5 feet • Full height evaporator wingwalls were removed • Less conductive, thicker refractory is used in the lower furnace To increase superheater duty: • In-furnace platen superheaters (10) were added upstream of INTREXTM SH-III • A loop of tubing was added to upper INTREXTM SH-IV (now same number of tube
elements in the upper and lower INTREXTM cells) To reduce reheater duty: • Convection reheater surface increased (+25%); this change compensates for the reduced
INTREXTM RH-III duty resulting from higher steam temperatures and the increased INTREXTM RH-IV duty that lowers the temperature of the solids cascading to RH-III
To reduce economizer duty: • Upper economizer surface increased (+18%), lower reduced (-63%) • Air heater surface increased (+5%); adjustment required to achieve stack temperature
with reduced economizer duty (shifts more heat into high temperature furnace solids circulation loop)
With these changes, the evaporator inlet water is sufficiently subcooled over the load range, maximum evaporator outlet superheat is about 86 Btu/lb, and full reheat steam temperature is maintained down to approximately 45 percent load (1323°F at 40 percent load). These results show that a CFB boiler can achieve/operate with advanced USC steam conditions (5,270 psig and 1300ºF) in a conventional configuration provided materials, with sufficient strength, outside corrosion resistance, and inside oxidation resistance, are available/ developed for these conditions. 9.0 Results and Discussion The desire for high efficiency, coal-fired power generation has sparked electric utility interest in supercritical, ultra supercritical (steam temperatures typically 1100ºF and higher), and advanced ultra supercritical (steam conditions approaching 5000 psig and 1300ºF) steam cycles. The high efficiency advantages of supercritical (SC) and ultra supercritical (USC) pressure steam conditions have been demonstrated in the high gas temperature, high heat flux environment of PC boilers. For economies of scale these units are large in size and are frequently in the 800 to 1000 MWe range. Circulating fluidized bed (CFB) boilers were first introduced in the 1970s and are an alternative to PC boilers. Exhibiting multi-fuel and low-grade fuel capabilities, low emissions, operating flexibility, and high reliability, they have steadily increased in size and, as of the writing of this report, the largest units in operation are the two 300 MWe, natural circulation, CFB boilers supplied by Foster Wheeler to the Jacksonville Electric Authority. Since CFB boilers operate with
102
combustion temperatures and in sizes that are much lower/smaller than those of PC boilers (~1600ºF versus 3500ºF and 300 MWe versus 1000 MWe), the ability of CFB boilers to accommodate SC, USC, and advanced USC has been questioned. To address this, a study was conducted to develop and assess conceptual designs of supercritical CFB boilers and to estimate their plant performance and economics. Reference [4-1] presented a conceptual design and determined the economics of a USC PC plant operating with 4500psig/1100ºF/1100ºF/1100ºF USC steam conditions that produced 399.7 MWe (net) with an efficiency of 41.4 percent. To permit a consistent comparison of technologies, the CFB study was conducted for the same site conditions i.e. Illinois No. 6 coal, Ohio River Valley, etc. and for the same SO2 and NOx lb/MMBtu emission rates. In addition to the [4-1] 400 MWe double reheat case, the CFB study included single reheat in nominal 400 MWe and 800 MWe sizes. Assuming tubing and piping materials could be developed that would result in component thicknesses that would be similar to those of USC boilers, a nominal 800 MWe CFB design was developed for advanced USC steam conditions. The move to 400 and 800 MWe supercritical CFB boilers represents a significant design change and scale-up. Items to be considered in such a scale-up are the design of:
1.) furnace/riser where combustion occurs 2.) the solids separators that remove entrained particulate from the combustion exhaust 3.) the HRA that cools the combustion exhaust gas exiting the separators for delivery to an
air heater 4.) the fluidized bed heat exchangers that cool the particulate collected by the separators
before their return to the base of the furnace 5.) the overall integration of the CFB boiler steam-water circuitry with the HRA and the
furnace hot, circulating solids loop
The amount of particulate contained in the furnace flue gas decreases in going from the bottom to the top of the unit and, given sufficient height, can approach a constant minimum value. With wall heat transfer rates being proportional to the amount of particulate entrained in the gas, furnace heights are typically limited to about 165 feet to maximize the cost effectiveness of its heat transfer surfaces. Similar to the height limitation, there is also a furnace depth limitation. With primary combustion air admitted at the base of the furnace, and fuel and secondary air injected through the side walls of the boiler, the furnace depth is typically limited to approximately 40 feet to insure the side injections are distributed uniformly across the unit. With maximum allowable furnace heights and furnace depths established, the main remaining variable in the scale-up process is the width. By increasing the width of the furnace, the boiler cross sectional areas were increased to keep flue gas velocities at desired levels. As the cross sectional areas were increased, however, the ratio of furnace wall surface area to enclosed volume reduced. Since the furnace walls are used for boiling/evaporation, additional evaporative surfaces, e.g. wing walls that protrude into the furnace and are connected in parallel with the furnace walls in a single pass water flow arrangement, were added to the furnaces. Maintaining a high separation efficiency in the CFB boiler’s solids separators is key to achieving high combustion efficiency, reduced limestone consumption, and high sulfur capture efficiency.
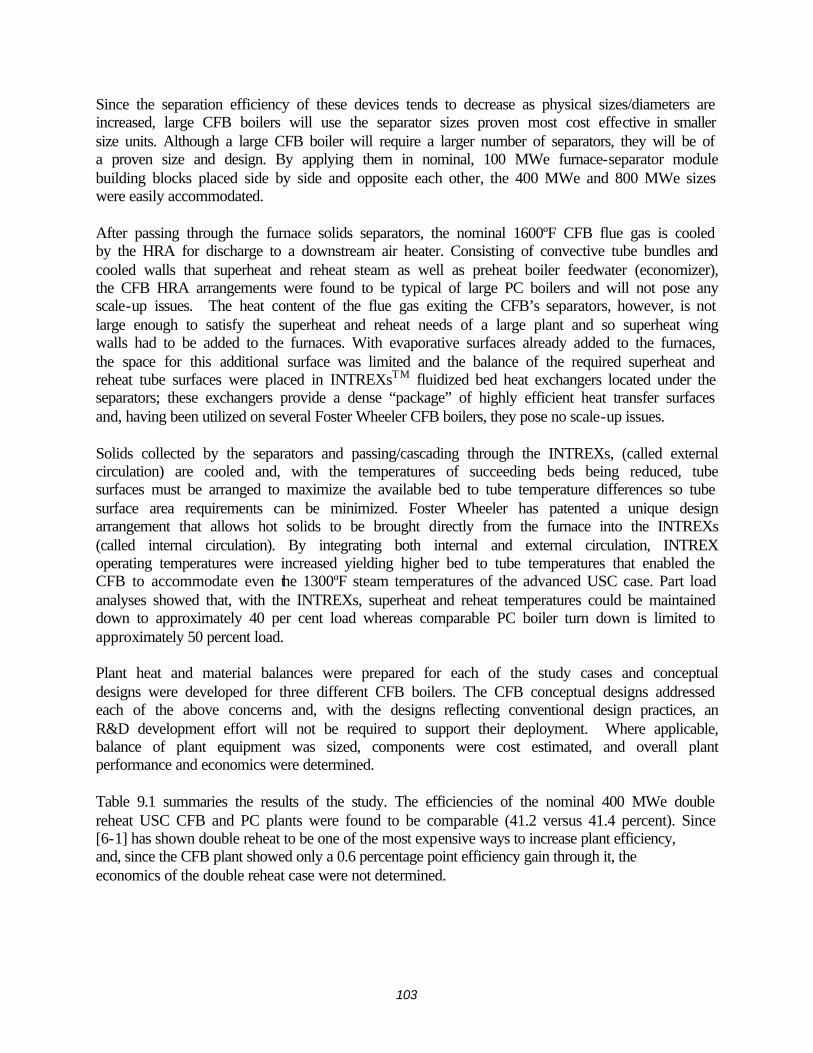
103
Since the separation efficiency of these devices tends to decrease as physical sizes/diameters are increased, large CFB boilers will use the separator sizes proven most cost effective in smaller size units. Although a large CFB boiler will require a larger number of separators, they will be of a proven size and design. By applying them in nominal, 100 MWe furnace-separator module building blocks placed side by side and opposite each other, the 400 MWe and 800 MWe sizes were easily accommodated. After passing through the furnace solids separators, the nominal 1600ºF CFB flue gas is cooled by the HRA for discharge to a downstream air heater. Consisting of convective tube bundles and cooled walls that superheat and reheat steam as well as preheat boiler feedwater (economizer), the CFB HRA arrangements were found to be typical of large PC boilers and will not pose any scale-up issues. The heat content of the flue gas exiting the CFB’s separators, however, is not large enough to satisfy the superheat and reheat needs of a large plant and so superheat wing walls had to be added to the furnaces. With evaporative surfaces already added to the furnaces, the space for this additional surface was limited and the balance of the required superheat and reheat tube surfaces were placed in INTREXsTM fluidized bed heat exchangers located under the separators; these exchangers provide a dense “package” of highly efficient heat transfer surfaces and, having been utilized on several Foster Wheeler CFB boilers, they pose no scale-up issues. Solids collected by the separators and passing/cascading through the INTREXs, (called external circulation) are cooled and, with the temperatures of succeeding beds being reduced, tube surfaces must be arranged to maximize the available bed to tube temperature differences so tube surface area requirements can be minimized. Foster Wheeler has patented a unique design arrangement that allows hot solids to be brought directly from the furnace into the INTREXs (called internal circulation). By integrating both internal and external circulation, INTREX operating temperatures were increased yielding higher bed to tube temperatures that enabled the CFB to accommodate even the 1300ºF steam temperatures of the advanced USC case. Part load analyses showed that, with the INTREXs, superheat and reheat temperatures could be maintained down to approximately 40 per cent load whereas comparable PC boiler turn down is limited to approximately 50 percent load. Plant heat and material balances were prepared for each of the study cases and conceptual designs were developed for three different CFB boilers. The CFB conceptual designs addressed each of the above concerns and, with the designs reflecting conventional design practices, an R&D development effort will not be required to support their deployment. Where applicable, balance of plant equipment was sized, components were cost estimated, and overall plant performance and economics were determined. Table 9.1 summaries the results of the study. The efficiencies of the nominal 400 MWe double reheat USC CFB and PC plants were found to be comparable (41.2 versus 41.4 percent). Since [6-1] has shown double reheat to be one of the most expensive ways to increase plant efficiency, and, since the CFB plant showed only a 0.6 percentage point efficiency gain through it, the economics of the double reheat case were not determined.
104
Table 9.1 USC CFB Boiler Plant Performance and Economics
Case -------------Steam Turbine Conditions------------Gross Auxiliary Net Plant HHV Total Plant Cost of % EfficiencyThrottle Press Sht Temp Rht Temp Power Power* Output Efficiency Costs** Electricity Emission
psig F F MWe MWe MWe % $/KW $/MWhr Reduction***
1A 4500 1100 1100 426.3 21.4 404.9 40.6 1,551 52.21 8.8
1B 4500 1100 1100/1100 425.8 23.4 402.4 41.2 10.2
2 4336 1112 1148 777.6 37.2 740.5 41.3 1,244 44.08 10.4
3 5061 1292 1328 804.6 36.4 768.2 43.3 14.5
*Boiler feed pump has steam turbine drive**January 2006 dollars***Compared to a plant with 37% efficiency and the same net output and lb/MMBtu emission rate The nominal 400 MWe (Case 1A) and 800 MWe (Case 2) single reheat USC CFB plants were single boiler-steam turbine plants with net outputs of 405 and 740 MWe; their total plant costs, which were calculated to be $1,551/kW and $1,244/kW respectively, exhibit a significant economy of scale. Reference [9-1] indicates that the costs of single unit plants typically scale on their capacity raised to the 0.6 to 0.7 power; based on gross electrical output, an exponent of 0.64 is observed to fit the CFB plant costs. This economy of scale also extends into the cost of electricity calculation yielding levelized values of $52.21/MWhr and $44.08/MWhr respectively. As discussed in Sections 5.4 and 7.5, the USC CFB plant costs are expected to be similar to those of comparable USC PC plants. The single reheat 405 and 740 MWe USC CFB plants exhibit efficiencies of 40.6 and 41.3 percent, respectively, and, moving the latter to advanced USC conditions, increased its plant efficiency to 43.3 percent. Compared with a new subcritical pressure plant, which typically operates with about a 37 percent efficiency, the supercritical conditions studied will reduce power plant coal and ash flow rates, stack gas emissions, and CO2 release rates by approximately 9 to 15 percent. Key findings of the study are:
1.) Since CFB furnace heat fluxes are lower and more uniform than PC boilers:
a. CFB furnace enclosure walls can be constructed from straight, self supporting, vertical tubes rather than the complex spiral wound tube designs of PC boilers that require a special support system and which would experience erosion in a CFB furnace
b. CFB furnace walls can operate without internal rifling at water mass flow rates much lower than a PC boiler and still be protected from departure from DNB.
c. With smooth tubes and lower water mass flow rates being used, CFB furnace wall frictional pressure losses are lower than hydrostatic pressure losses and: i. USC CFB boilers will require less boiler feed pump power than PC units
105
ii. CFB furnace walls will operate with a self compensating, natural circulation characteristic, wherein, an excessively heated tube will experience an increase in water flow that will minimize the tube-to-tube temperature differences that can lead to tube failures
2.) Large CFB boilers will be constructed from nominal 100 MWe type building block
modules, each consisting of a section of furnace section linked to two solids separators placed side by side and then opposite each other to reach 400 and 800 MWe sizes.
3.) Including coal and limestone feed silos, air fans, and air heater, a 400 MWe USC CFB
boiler will occupy a foot print approximately 180 feet by 275 feet and be supported by structural steel approximately 225 feet above grade.
4.) Including coal and limestone feed silos, air fans, and air heater, a nominal 800 MWe USC
CFB boiler will occupy a foot print, approximately 200 feet by 300 feet and be supported by structural steel approximately 250 feet above grade.
5.) Computer model simulations of the 400 MWe and 800 MWe units have predicted furnace
heat release patterns, heat flux profiles, pressure profiles, oxygen profiles, and maximum tube wall temperatures that are consistent with Foster Wheeler CFB boiler design standards.
6.) Part load analyses have shown that superheat and reheat steam temperatures can be
maintained at full load values over the 40 to 100 percent load range, whereas, 50 to 100 percent is typical of PC boilers.
7.) Despite the CFB’s relatively low ~1600ºF combustion temperature, the 1300ºF steam
temperature of advanced USC cycles can be accommodated by operating Foster Wheeler’s INTREXTM fluidized bed heat exchangers with patented internal solids circulation.
8.) The physical arrangements of the 400 MWe and 800 MWe USC units reflect
conventional Foster Wheeler CFB boiler configurations and can be deployed without the need for R&D development work.
9.) The physical arrangement of the 800 MWe CFB boiler operating with advanced USC
steam conditions also reflects conventional Foster Wheeler CFB design practices but will require the development of new tube/pipe materials.
10.) Use of advanced USC conditions (nominally 5061psig/1300ºF/1300ºF) will increase the
efficiency of the 800 MWe CFB plant to 43.3 percent. 10.0 Conclusions This study has shown that the move to 400 MWe and 800 MWe size USC CFB boilers is technically feasible, economically viable, and will involve minimal scale-up risk. Such large
106
CFB boilers will be constructed from nominal, 100 MWe type building block modules, each consisting of a furnace section linked to two solids separators placed side by side and then opposite each other to reach 400 and 800 MWe sizes. The performance and economics USC CFB boiler plants will be similar to that of USC PC plants. The higher plant efficiencies that supercritical conditions provide will enable these plants to operate with less fuel consumption and a proportional reduction in waste ash flow rates, traditional stack gas pollutants, and CO2 release rates; depending upon the supercritical conditions selected, the fuel and emission rates will be approximately 9 to 15 percent lower than a new, subcritical pressure plant operating with 37 percent efficiency. Hence, supercritical CFB boilers will be a viable means for meeting the economic and environmental needs of the US electric utility industry for both the present and the future. 11.0 References 1-1 Viswananthan R., et al, “ A Critical Look at Supercritical Power Plants” Power, Vol.148,
No. 3, 42-49. April 2004. 1-2 Lundqvist, R., et. al., R. “The Advantages of a Supercritical Circulating Fluidized Bed
Boiler”, Presented at PowerGen Europe 2003, Dusseldorf, Germany. 1-3 “The JEA Large-Scale CFB Combustion Demonstration Project”, US DOE Clean Coal
Technology Topical Report No. 22, March 2003. 1-4 Goidich. S., “Steady Progress in Supercritical Once-Through Technology”, Coal Gen
2001 Proceedings, July 25-27, 2001, Chicago, Illinois. 1-5 Goidich, S., and Lundqvist, R., “The Utility CFB Boiler - Present Status, Short and Long
Term Future With Supercritical and Ultra-Supercritical Steam Parameters”, PowerGen Europe 2002, Milan, July 11-13, 2002).
3-1 Electric Power Research Institute, “TAG-Technical Assessment Guide”, Vol 1, EPRI TR- 102276-V1R7, Palo Alto, CA, Rev 7 June 1993.
4-1 “Market-Based Advanced Coal Power Systems”, Report No DOE/FE-0400, US Department of Energy, Final Report, May 1999.
6-1 Kotschenreuther, H., “Future High Efficiency Cycles”, Materials for Advanced Power Engineering, Part 1, pages 31-46.
9-1 “Gasification Plant Cost and Performance Optimization”, Task 1 Topical Report, DOE Contract N. DE-AC26-99FT40342, May 2002
12.0 Bibliography N/A
107
13.0 Acronyms and Abbreviations AFUDC Allowance for Funds Used During Construction BFB Bubbling Fluidized Bed CFB Circulating Fluidized Bed COE Cost of Electricity CO2 Carbon Dioxide DCS Distributed Control System DNB Departure From Nucleate Boiling FGD Flue Gas Desulfurization FEGT Furnace Exit Gas Temperature FSH Finishing Superheater Hg Mercury HHV Higher Heating Value HP High Pressure HRA Heat Recovery Area INTREXTM Integrated Recirculating Heat Exchanger IOU Investor Owned Utility IP Intermediate Pressure IRR Internal Rate of Return JEA Jacksonville Electric Authority, Jacksonville Florida LP Low Pressure NOx Oxides of Nitrogen OTU Once Through Unit O&M Operating and Maintenance PC Pulverized Coal RH Reheater RPM Revolutions per Minute SC Supercritical SCR Selective Catalytic Reduction SH Superheater SO2 Sulfur Dioxide TAG Technical Assessment Guideline TPC Total Plant Cost TPI Total Plant Investment TCR Total Capital Requirement US United States USC Ultra Supercritical VHP Very High Pressure