ujjain district, madhya pradeshcgwb.gov.in/aqm/naquim_report/mp/ujjain.pdfaquifer mapping &...
TRANSCRIPT

क� द्र�य भू�म जल बोडर्
जल संसाधन, नद� �वकास और गंगा संर�ण मंत्रालय
भारत सरकार Central Ground Water Board
Ministry of Water Resources, River Development and Ganga Rejuvenation
Government of India
AQUIFER MAPPING REPORT
Ujjain District, Madhya Pradesh
उ�र� मध्य �ेत्र, भोपाल North Central Region, Bhopal
Government of India Central Ground Water Board
Ministry of Water Resources, River Development & Ganga Rejuvenation
AQUIFER MAPPING & MANAGEMENT PLAN FOR UJJAIN BLOCKS UJJAIN DISTRICT, MADHYA
PRADESH (2015-2016)
By Devendra Joshi Scientist “D”
National Aquifer Mapping Programme Management Plan of Dewas District,Madhya Pradesh
North Central Region December, 2016

Aquifer mapping & Management plan of Ujjain blocks, Ujjain District, Madhya Pradesh
CONTENT
1.0 Introduction 1.0 Objectives, Scope of the Study, Approach and Methodology,
Area Details, 1.1 Data availability, Data adequacy and data gap analysis and
Data generation, 1.3 Rainfall-spatial, temporal and secular distribution, 1.4 Physiographic setup, Physiography/DEM, 1.5 Geomorphology, 1.6 Land use, 1.7 Soil, 1.8 Hydrology and Drainage, 1.9 Agriculture, irrigation, cropping patterns, 1.10 prevailing water conservation/recharge practices and any other relevant Information
2.0 Data Collection and Generation 2.1. Geology
2.2 Hydro geomorphology 2.3 Hydrogeological data 2.4 Hydrochemical (water quality) 2.5 Geophysical (Location, number, analytical techniques etc.), 2.6 Exploratory drilling-State, CGWB and private wells 3.0 Data Interpretation, Integration and Aquifer Mapping 3.1 Results and interpretation of all studies and preparation of aquifer maps- 2 D and
3D diagrams.
4.0 Ground Water Resources 4.1 Recharge, Draft and Stage of groundwater development of replenishable resource. 4.2 Static resource and extraction from unconfined aquifer as well as in/from deeper
aquifers, if any. 5.0 Ground Water Related Issues 5.1 Identification of issues, 5.2 Geographical distribution and quantification with respect to ground water
Resources 5.3 Ground water quality/contamination; 5.4 Future demand (for 2025 and 2030) scenario and stress aspects of the aquifer. 5.5 Participatory ground water management issues.

6.0 Management Strategies
6.1 Plan for sustainable management of the resource- aquifer wise including modeling
outputs. 6.2 Aquifer wise availability of unsaturated zone. 6.3 Augmentation plan of the resource through artificial recharge and water
conservation. 6.4 Demand side management, through irrigation efficiency, ground water use
efficiency etc. 6.5 Stress aspect against future demand (2025,2030) and strategies for addressing
those. 7.0 Rejuvenation of Kshipra river- Suggested Interventions
8.0 Work Done by CGWB in Kshipra basin
Part II: Block wise Aquifer Maps and Management plans (≈ 10 pages).
1. Salient Information Name of the Block and Area (in Km2) District/ State Population Rainfall Agriculture and Irrigation Ground water resource availability and extraction Existing and future water demands Water level behavior
2. Aquifer Disposition
Number of aquifers 3-D aquifer disposition and basic characteristics of each aquifer
3. Ground water resource, extraction, contamination and other issues
Aquifer wise resource availability and extraction Chemical quality of ground water and contamination Other issues Sustainability, vulnerability or other issues, if any.
4. Ground water resource enhancement
Aquifer wise space available for recharge and proposed interventions Other interventions proposed, if any
5. Demand side interventions
Advanced Irrigation Practices Change in cropping pattern
Change in cropping pattern Regulation and Control Other interventions proposed, if any

Aquifer mapping & Management plan of Ujjain blocks,
Ujjain District, Madhya Pradesh
1. Introduction
1.1 Objectives, Scope of the Study, Approach and Methodology, Area Details,
1.1.1 Objectives • Define aquifer geometry at 1: 50,000 scale, type of aquifers, ground water regime
behavior, hydraulic characteristics, and geochemistry of aquifer systems. • Develop a dynamic system for sustainable management of ground water resources for an
aquifer as a unit.
1.1.2 Scope of the Study Under NAQUIM, Ujjain block have been studied during the AAP2016-2017 and utilized
existing data of exploration, water level and water quality of NHS wells
Data collection, compilation, bringing entire data to GIS platform, data gap analysis and data creation
To establish the aquifer geometry & characteristics Aquifer Management Plan.
1.1.3 Approach and Methodology
• Entire blocks of Ujjain district has been covered under Basaltic lava flows areas with isolated pockets of alluvium formation.
• Area divided grid wise and aquifer wise basic requirement for establishing aquifer geometry and characteristics upto 200 m where data generation is required, quality parameters specific to the area
• Preparation of Base Map A physical map on A2 size, Geology and Geomorphology
• Compilation of existing data for mapping : Exploratory Data Availability, Geophysical Information
• Pre processing of data Exploratory Data , Ground Water Level, Ground Water Quality
METHODOLOGY FOR ARRIVING AT DATA GAP
Exploratory Data : (Desirable spatial scale – in 5’ x 5’ grids)
Exploratory well of 200 m depth, 5- EW’s and 5- OW’s should be constructed at suitable locations, preferably one in central quadrant and one each in the four corner quadrants for establishing aquifer geometry and determining aquifer parameters.
Aquifer performance test shall be conducted at all the five EW’s tapping the fracture aquifer to estimate the aquifer hydraulic parameters and water quality .
Existing exploratory Data and Data gap analysis

Geophysical Data : 2 or 3 Profiling/VES/TEM having 200 meter interpretation depth
should be carried out in each of the nine quadrants of the toposheet totaling 18 to 27 nos.
in each sheet to decipher aquifer geometry) .Existing Geophysical Data and Data gap
analysis
Ground Water Monitoring Data : Data Required : 5’ x 5’ grids.
i. For 1st aquifer (un-confined/Phreatic) two open/dug wells are recommended for each quadrant of a toposheet.
ii. For 2nd and 3rd aquifer the well-constructed in the Well field and Special Purpose wells may be used as piezometers for GW monitoring.Minimum four times monitoring annually
Ground Water Quality Data : Data Required 5’ x 5’ grids.
i. For 1st aquifer (un-confined/Phreatic) one sample from open/dug wells are recommended for each quadrant of a toposheet
ii. For 2nd aquifer the sample is to be collected from well-constructed in the Well field explained above and Special Purpose wells for GW Quality monitoring .Minimum two times monitoring initially is recommended.
Data Generation:
Value addition of Geological map. Preparation of subsurface geology of the area ,
Value addition of Geomorphological map ,
Analysis of Land use pattern,
Conduct additional required VES/TEM ,
Analysis of Water bodies of the area ,Impact of Water bodies on surrounding Ground
Water Regime, Surface water –Groundwater interaction studies,
Water level monitoring of key wells - 4 Times in a year for 3 Consecutive year ,
Exploratory drilling –Construction of EW, OW,PZ,SH. ,Pump test of EW for
Determination of Aquifer Parameters, Peizometer construction for AWLR
Groundwater quality Data Generation : Collection of required water samples and analysis for GROUND WATER QUALITY ASSESSMENT

Aquifer Wise Management Plan Aquifer wise ground water management through integration of various data / information in the form of thematic layers
Feasible areas for ground water development along with yield potential / Depth of
drilling / safe yields etc.
Feasible areas for rainwater harvesting and ground water recharge vis a vis aquifer storage available for recharge and surplus non committed surface water available for recharge.
Aquifer wise vulnerability map in terms of ground water availability (potential areas / ground water stress areas), water logged areas and quality problem areas.
Demarcation of Ground Water Regulatory Zones (GRZ).
Demarcation of Ground Water Sanctuaries to be reserved for drought proofing.
Ultimate goal is to construct a ground water flow simulation models at appropriate scale to arrive at technically and economically feasible aquifer management options.
1.1.4 Area Details:.
Ujjain is a district in the Madhya Pradesh State of India. Total area of Ujjain is 6130,23 km² including
5,896.79 km² rural area and 194.21 km² urban area. The hilly & forest area in it is about 190.90 km. The
mappable area or recharge worthy area is 5939.33 sq km (95%).Ujjain has a population of 19,86,864
peoples and There are 1095 villages and 3,91,438 houses in the district..
Table 1.1.41 : Area of Ujjain
Total Geographical Area 6130.23 sq. km
Mappable area 5939.33 Sq Km 96.88 %
Hilly/Forest 190.90 Sq Km 3.11 % Ujjain has a population of 19,86,864 peoples.(2011).(table1.1.4),Population density in sq km (2011) is
326. There is marked increase in the population density per sq km in last two decade is from 227
(1991) to 326 (2011). In the last ten year (2001 to 2011) the percentage increase in population is
16.12%.
Table 1.1.42 Population of Ujjain (2011 Census)
Population Type Male Population Female Population Total Population
Rural 6,16,353 5,91,298 12,07,651 Urban 3,99,939 3,79,277 7,79,213 Total 10,16,289 9,70,575 19,86,864

The district area extends between the parallels of latitude 220 50' and 230 46' North and between the meridians of longitude 750 08' and 760 16' East, and is falling in the Survey of India Topo Sheet No. 46M(parts of 46M/3,7.8.10.11.12.14,15,16) 46N(parts of 46N/5) and 55 A(parts of 55A/2,3,4). Ujjain district is mainly agriculture-based district and its cropping pattern is diversified.
. Fig:1 Location of Ujjain district
Block Mappable Area Category Stage of GW Development
(sq km) %
Badnagar 1235.95 Over-exploited 116.90 Ghatia 641.63 Over-exploited 100.49 Khachrod 1101.78 Semi-critical 73.81 Mahidpur 1134.53 Semi-critical 76.15 Tarana 1065.8 Safe 73.16 Ujjain 759.64 Over-exploited 123.56 5939.33

1.2 Data availability, Data adequacy and Data gap analysis and Data generation,
1.2.1 Data availability There are 26 exploratory wells have been constructed in the area of mapping ,out of which 11 exploratory wells are in the urban area & 16 exploratory wells are in the blocks of Ujjain.There are three blocks- Khachord,Mahidpur and Tarana in which each of them having one exploratory wells constructd. (Table1.2.1)
Table1.2.1. :Wells constructed by CGWB in Ujjain
Fig 1.2 : Data Gap analysis with Exploratory wells location in the Ujjain
Block Total wells
EW OW DW Piezomter Data Gap CGW SGD
Badnagar 15 05 - - 05 05 09
Ghatia 06 02 - - 01 03 07
Khachrod 06 01 - - 02 03 16
Mahidpur 07 01 - - 03 03 15
Tarana 08 01 - - 03 04 12
Ujjain Urban Ujjain
24 21
05 11
14 - 07
03 03
02
07
Total 87 26 14 07 20 20 66

1.2.2 Data adequacy and Data gap analysis
Data gap analysis & status as on 1st April 2012 based on EFC Norms Targets as per EFC norms and actual achievements are given below:
Block Ujjain As per EFC
norms Actual
achievements Area in sq.km 6130.23
sq. km
Preparation of Sub-surface Geology (area in sq.km)
6130.23 sq. km
Existing data inadequate Geo-morphological analysis (area in
sq.km) 6130.23 sq. km
GSI layer completed Land use pattern (area in sq.km) 6130.23
sq. km Layer
prepared Vertical electrical Sounding (VES) (Nos) 41 25 41 Bore Hole Logging (Nos) 5
Need based
Need based
2-D Imaging (Line Km) Ground TEM (Nos) Heliborne TEM & Gravity (Line km)
Preparation of Drainage Map (area in Sq.km)
6130.23 completed Demarcation of water bodies (area in sq.km)
6130.23 completed Soil infiltration studies (Nos.) 42 33 0 Rainfall data analysis for estimation of recharge to ground water (area in sq.km)
6130.23 Monthly data yet to receive
Canal flow, impact of recharge structures analysis, surface water-ground water
6130.23 Existing data inadequate Water level monitoring (No of stations*
frequency) (No of monitoring stations) *4*3 456
Exploratory Wells 10 10 Observation Wells 08 2 Slug test (Nos) 0 0 0 Specific Yield test (Nos) 0 0 0 Micro-level hydro-geological data Acquisition including Quality Monitoring
102 37
Water Quality (sampling and Analysis) for Basic Constituent, Heavy Metals etc Analysis of Ground water for Pesticides, Bacteriological contamination in Ground
0 0 0
Carbon dating (Nos) 0 0 0 Isotopic studies (Nos) 0 0 0 Core drilling (Nos) 0 Need based

1.2.3 Data generation
66 exploratory wells in the mapping area are to constructed in the depth range of 200m or above. There are 92 quardent in the of Ujjain district area,out of which 66 doesn’t have any exploration wells.The blockwise proposed data generation are given in tabe
1.3 Rainfall-spatial, temporal and secular distribution Climate & Rainfall Ujjain has a humid subtropical climate, with mild, dry winters, a hot summer and a humid monsoon season. Summers start in late April and go on till mid-June, the average temperature being around 30 °C (86 °F), with the peak of summer in May, when the highs regularly exceed 40 °C (104 °F). The monsoon starts in late June and ends in late September. These months see about 40 inches (1020 mm) of precipitation, frequent thunderstorms and flooding. IMD normal annual rainfall of Ujjain city is 715 mm. The normal annual rainfall of Ujjain district is 914.5 mm. Ujjain district receive maximum rainfall during southwest monsoon period i.e. June to November. About 92.1% of annual rainfall is received during monsoon season. The surplus water for groundwater recharge is available only during the southwest monsoon period
. The average temperature is around 25 °C (77 °F) and the humidity is quite high. Temperatures rise again up to late October when winter starts, which lasts up to early March. Winters in Bhopal are mild, sunny and dry, with average temperatures around 18 °C (64 °F) and little or no rain. The winter peaks in January when temperatures may drop close to freezing on some nights. Daily mean normal temperature of Ujjain in May - 40.70 C and minimum - 26.40 C.
The Annual Normal Rainfall in the area is 914.5 mm /yr
Block Data Gap Badnagar 09 Ghatia 07
Khachrod 16
Mahidpur 15 Tarana 12 Ujjain 07
Total 66
Year January February March April May June July August September October November December Annual Total
2004 28.2 0 0 2.2 6.2 72.5 199.6 524 20.6 45.5 0 0 898.8
2005 0 0 6 12.5 0 54.9 279.3 188 128.7 0 0 0 669.4
2006 0 0 19.9 0 27.2 151.6 245 883.9 432.5 7 1.3 0 1768.4 2007 0 3.4 0 2.2 22.5 119.7 426.1 382.9 168.4 0 0 0 1125.2 2008 0 0 0 13.5 0.3 109.7 218.1 129.6 125.4 41.5 1.5 0 639.6
2009 1.2 0 0 0.2 19.6 69.8 313.6 146.1 101.8 85.1 56 24.5 817.9 2010 0.6 8.8 0 0 0.7 11.9 217.9 328.2 80.7 16.7 45.8 2.2 713.5
2011 00 00 5.0 0.0 0.0 174.4 452.5 458.9 147.0 0.0 0.0 0.0 1237.8 2012 00 0 0.0 0.0 3.0 12.0 455.0 214.0 0.0 0.0 0.0 0.0 684.0
2013 00 4.0 33.0 7.0 0.0 271.0 456.0 352.0 90.0 25.0 0.0 0.0 1238..0 2014 17.0 43 4.0 0.0 17 36 264.0 165.0 55.0 6.0 0.0 33.0 640.0

AVERAGE MONTHLY PRECIPITATION OVER THE YEAR
1.4 Physiographic setup, Physiography / DEM,
Topography of the Ujjain district is highly rugged and undulating comprising hills, dissected plateau, valley and flats. The maximum elevation of about 555.2m amsl is observed in the area Bardnager block and lowest elevation is <380m asl in the Khachord & Mahindpur block area in the North of Ujjain district
Block Elevation m amsl Max Min Diff
Badnagar 555.2 471.5 83.5 Ghatia 528.5 465.5 63.5 Khachrod 530.1 441.4 88.6 Mahidpur 518.7 436.1 82.9 Tarana 521.5 420.0 102 Ujjain 537.7 462.7 75.3

1.5 Geomorphology
The geomorphic surface in the area are such that the area becomes steep to moderately slopping to nearly flat in the middle reaches of the river. The distribution and structure of valleys landforms reflect the geomorphic processes that created them. Landform, any conspicuous topographic feature - mountains (including volcanic cones), plateaus,
The Chamala Khipra /Gambhir and chhotikalisndh river sub basin in Ujjain area are consist of flood deposit along the river banks and denudation hill, highly dissected Plateau. Pediment, vally fill and pedplain (Fig 1.5)
Fig 1.5 : Geomorphology of Ujjain
1.6 Land use
Cultivated area is about km2 498757 which is 90.68 % of total area. The forest area is of 3149 ha which falls in parts of only three block area of-Tarana,Ujjain and Ghatia.

Table 1.6.1 Land use pattern (Ha) 2013
Block Geographical area
Forest area
Land available for non-agriculture use
other non-agriculture
land
Agriculture land
Fallow land
Net sown area
Doubled crop
Badnagar 63719 0 11535 3903 254 474 107350 98275
Ghatia 63946 217 6580 2974 456 224 53470 52949
Khachrod 63719 0 6613 3106 1594 312 51807 43796
Mahidpur 113453 0 11838 7005 197 346 94000 71655
Nagada 65549 0 7641 4488 1411 185 51780 43824 Tarana 104275 2305 9746 8283 969 502 82325 70294 Ujjain 75337 627 10712 3904 1107 534 58055 52949
District 549998 3149 64665 33663 5988 2577 498787 433742
%age 0.57%
1.08% 0.46% 90.68%
Change in Land use pattern : Net sown area have been increased to 13919 ha and double crop area become threefold increase in last 12 year i.e from 108309 to 318072 ha
Table 1.6.2: Change in Land use pattern (Ha) in 12 year from 2002-2013
Year Agriculture land Fallow land Net sown area Doubled crop
2002-03 10950 3849 484868 108309 2003-04 10656 3239 488272 274209 2004-05 10426 3326 490025 287544 2005-06 9973 4960 483975 185083 2006-07 9148 2860 491503 328177 2007-08 2008-09 11789 2707 489147 289147 2009-10 7992 2580 496071 377199 2010-11 6689 3173 496528 377521 2011-12 8114 3335 497163 389406 2012-13 5988 2577 498787 426381
Change in Ha in last 10 year
- 4962 - 1272 +13919 +318072

1.7.1 Soil : Black cotton soils with heavy to light texture are found in the whole area. Light textured silty ‘Kankar’ and admixtures of clay in the form of alluvium occur along the bank of major streams. The district faces considerable problem of soil erosion, which is aided and abetted by faulty forming practices and also by natural agents like wind and water
1.8 Drainage Drainage: : The area forms part of Chambal sub basin of Yamuna river sub-basin(Ganga basin) The main river of the district is Chambal River whose tributaries are the Kshipra, Chhoti Kalisindh, Gambhir and Chamla River. The main river Chambal originates from a place known as Janapaspur at an elevation of 854 m above mean sea level in the Indore district. The left bank tributaries of Chambal River are Bageri join the Chambal River Nagda and Kurel River near Uri. The Chamla River originating from Dhar district join Chambal River near Piploda Sagoti Mata in Khachrod tehsil. Kshipra River originates from Kokri Bardi hill, which about 11 km southeast of Indore. Khan River joins Kshipra River near Ujjain and Gambhir River near Mahidpur. The major Streams are flowing in south western and central direction The major and minor streams shows dendritic and sub parallel drainage pattern. In the valley fill area the branching of the stream is not visible. The Stream gradient is steep to moderate in the source region and it is moderate to gentle in the middle & lower reaches

1.9 Agriculture & cropping patterns
Ujjain district is mainly agriculture-based district and its cropping pattern is diversified. The total crop area is 4987.87Sq km while double crop area is 4284.92sq km.The main crops in kharif season are Soybean, Maize. Jawar & Bajara Groundnut while in the Rabi crops are Wheat, Gram etc
Area of Kharif crop : 4966.76 Sq km Area of Rabi : 4284.92 Sqkm
Table 1.9.1 Kharif & Rabi crop area (Ha)-2013
Block Kharif crop Rabi crop
Food Nonfood Total Food Nonfood Total Badnagar 1822 105005 106827 98083 715 98798 Ghatia 1088 51681 52769 46027 262 46289 Khachrod 1730 49650 51380 43211 1012 44223 Mahidpur 1952 91792 93744 70881 1030 71911 Nagada 1554 50186 51740 43219 645 43864 Tarana 2826 79499 82325 69919 375 70294 Ujjain 1052 56839 57891 52686 427 53113 District 12024 484652 496676 424026 4466 428492
Cropping pattern Table 1.9.2 Area of Main Kharif Crop 2013 (Ha)
Block Jawar Maize Bajara Tuar Mug moth
Urd Soya
bean
Ground nut
Til Total
Badnagar 0 1292 3 142 391 130 10410 17 0 12385 Ghatia 9 617 4 182 97 146 50079 6 6 51146 Khachrod 6 795 5 117 156 650 47350 32 2 49113 Mahidpur 87 1109 4 321 190 330 85962 50 10 88063 Nagada 43 1070 5 108 179 268 48328 24 2 50027 Tarana 424 1474 0 471 188 340 70698 55 0 73650 Ujjain 14 339 6 180 170 237 54995 8 5 55954 District 583 6696 27 1521 1371 2101 367822 192 25 380339

Table 1.9.2: Area of Main Rabi Crop 2013(Ha)
1.10 Irrigation
Ground water irrigation in the area is about 96.18% (302338 ha) of total irrigation area of various sources i.e. 314327Ha.(table 10.1) Table 1.10 : Total Irrigation areas from various sources
1.10.1 Groundwater Irrigated areas & structures
Groundwater irrigation is about 302338 Ha from dug wells and tube wells. The total groundwater structures is 93359
Fig 1.10.1: Block wise Groundwater structures & Irrigated area
Block Wheat Gram Mustered Alsi Other oil seed
Sugar cane
Total
Badnagar 35551 53702 106 0 1 2 89362 Ghatia 27309 15436 50 0 0 3 42798 Khachrod 20513 16737 607 16 7 1 37881 Mahidpur 36268 28639 495 6 9 7 65424 Nagada 22021 17616 371 0 27 1 40036 Tarana 29273 36616 33 13 0 10 65945 Ujjain 33905 14589 30 15 0 6 48545 District 204840 183335 1692 50 44 30 389991
Irrigated area
(Ha)
Source Structures Area(ha) Total %
Surface water Canal 5402 11989 3.82 % Ponds 6587
Groundwater
Tube wells 220024 302338 96.18 % Dug wells 82314
Total 314327 100 %

Table 1.10.1 Block wise Groundwater structures & Irrigated area Block
Dug well Tube well Total
Number Irrigated area(ha)
Number Irrigated Area (ha)
Number Irrigated area(ha)
Badnagar 1030 1431 17925 67418 18955 68849
Ghatia 5252 10164 5032 23211 10284 33375
Khachrod 3343 7346 4915 16408 8258 23754 Mahidpur 10590 11810 4579 45850 15169 57660
Nagada 4639 19546 3981 10167 8620 29713 Tarana 9387 24953 6183 21407 15570 46360 Ujjain 3338 7064 13165 35563 16503 42627 District 37579 82314 55780 220024 93359 302338 Table1.10.1: Surface water structures & Irrigated area
Block
Cannal Talv Total
Number Irrigated area(ha)
Number Irrigated area(ha)
Number Irrigated area(ha)
Badnagar 2 0 4 175 6 175 Ghatia 6 138 6 138 Khachrod 3 3866 3 1236 6 5102 Mahidpur 5 420 7 225 12 645 Nagada 5 111 7 436 12 547 Tarana 6 0 26 1009 32 1009 Ujjain 7 867 9 3506 16 4373 District 34 5402 56 6587 90 11989 1.10.2 Medium & Minor irrigation project
There are 07medium & 50 minor irrigation structures in the Ujjain area and their storage capacity is about 49.97 mcm and 57.17 mcm respectively.
Tabel 1.10.2: Medium & Minor irrigation project Irrigation Project
Block
Dam
Watershed area
storage capacity
75% dependence storage
Hight of Talav Range
(Sq.Km) mcm mcm (m)
Medium
Kharchod 3 13.02 2.89 2.68 6.1-6.4 Ghatiya 2 13.02 2.89 2.68 17.44-18.9 Mahindpur 2 227.96 44.19 45.15 18.9-22.6 Total 7 254 49.97 50.51

1.11 Prevailing water conservation/recharge practices and any other relevant Information
There are 700 percolation tanks ,1020 Check dam and 49 ponds have been constructed in Ujjain area and these structures create total recharge in the area is about 2055.99 mcm. Table 1.11 : Water Conservation/Recharge Structures and their Recharge Volume
Irrigation Project
Block
Dam Watershed area
storage capacity
75% dependence
storage
Hight of Talav range
Water Spread area
No. Sq.Km mcm mcm m Sq km Minor
Bardnager 5 4192.13 2.046 1.22 1.8-7.62 0.594453 Ghatia 7 5542.28 3.064 2.55 1.8-11.8 0.80894 Khachroad 5 530.34 13.36 16.8 1.8-11.8 1.670228 Mahidpur 13 14341.726 6.84 14.279 1.8-14.09 2.103807 Tarna 13 3238.88 11.57 17.85 1.5-17.98 1.287362 ujjain 7 505.41 20.247 47.057 3.156-
9.71 2.556904
Total 50 28350.766 57.127 99.756 9.0217
Block
Percolation Tank
check dam
Total Recharge
from PT&CD
Tank /pond
Total Recharge
from Tank/pond
Total Recharge from pond
Number ha m Number ham ha m Bardnager 45 90 33.75 4 37.75 71.5 Ghatia 360 550 231.75 6 237.75 469.5 Khachrod 75 85 41.63 6 47.63 89.26 Mahidpur 65 130 48.75 17 1193.72 1242.47 Tarana 105 125 59.63 7 66.63 126.26 Ujjain 50 40 24 9 33 57 Total 700 1020 439.51 49 1616.48 2055.99

2.1 Data collection and generation
2.1 Data collection
2.1.1 Geology Geological succession in the area of Ujjain area is given in the table-2.1
Table 2.1.1: Geological succession
Succession Formation Age
Alluvium/ Laterite
Clay with kanker, sand and river alluvium Recent to Pleistocene
Deccan trap Basaltic lava flows with redbole and interappean beds
Upper cretaceous to Eocene
----------------------------------------------Unconformity------------------------------
Upper Vindhyan Bhander Group
Sandstone and Shale sequence with conglomerate
Upper pre Cambrian to Lower protoeozoic
Fig 2.1 Geology of Ujjain

2.1.2 Geological survey of India (GSI):
GSI mapped the Ujjain area and established Deccan trap basalt flows, lava flows occupy vast area in the north, central and western parts of Ujjain block. They have been classified into two formations viz: Kankariya and Indore based on diagnostic characters and marker horizons or inter-treappen beds are established.
Lithostratigraphy Sequenc The area forms the part of the Great Malwa Plateau exhibiting terraced steep like structures with occasional isolated hills varying altitude. The average height from 440m to 520m above M.S.L. Lava flows of the Deccan trap Suite covers an extensive area consists of a sequence of 29 basaltic lava flows with cumulative thickness of 442m The low-lying plains are restricted to the major river valleys in the northern parts. Table 2.1.2-The Litho stratigraphy Sequence is tabulated in table 4.1 and depicted in fig 4.1 & 4.2 Table 2.1.2: Litho stratigraphy of Deccan trap of Ujjain Urban
Age Formation Lithostratigraphy
Quaternary Alluvium Very Coarse to fine sand, silt and clay with pebbles in the basal bed
Upper Cretaceous to lower Eocene
Deccan Trap Malwa group of basaltic flows
No of flows
Elevation . m.a.ms.l
Thickness m
Character
Bargonda
11
610-762
152
Fine grained flow of aphyric to sparsely porphyritic, 'Aa' type, occurs as small hills in Malwa plateau.
Indore
6
520-610
90
Major part of Kshipra watershed, moderately porphyritic forms thickness of 14-15m; Lateral variation in flow characteristics from Pahoehoe to 'Aa' type.
Kankariya perukheri
8
440-520
80
Occurs in low lying area of Kshipra catchment, highly weathered vesicular in the lower part of flow .
Alluvium formation occupy in the parts of south eastern area and as valley fill along river Kshipra,Gambhir and chotikalisindh in the central part of area.
Laterite occurs as isolated capping over the Deccan trap in the extreme north western part of area. The general level of occurrence of the laterite capping is 500m amsl. It is reddish brown in color and limonite soft rock in character.

2.1.3 Basaltic flow unit; Each individual lava flow can be sub divided into 3 distinct units- (i) Red bole (impersistent horizon)/clay., (ii) Vesicular/Amygdular basalt
(iii) Massive and compact basalt
Red bole clay : The top of the individual flows is occasional marked by reddish brown clay material, termed as “Red bole” which at places is represented by grayish clay .The thickness of red bole varies from few centimeter to few meters. The red bole in its genetic relationship is an insitu product of backing and weathering of basalts representing a time gap between the two Successive flows. They indicate the local topographic highs during the time gap of successive flows
Vesicular/ Amygdulear basalt: The vesicular unit of each flows forms the upper horizon and ranges in thickness from 1.5 meters to as much as 06 m forming 25 to 30% of the total thickness of flows. It is medium to coarse grained, softer than massive basalt and vesicles are commonly filled with secondary mineral like calcite, Zeolites and quartz.
Massive Basalt: It is fine to medium grained compact, dark greenish to grey colour and form 60 to 70% of the flow unit. It weathers along joints and spheroidal weathering is commonly seen. Columnar jointing is quite common
2.1.4 Joints in Deccan trap Joints in Deccan trap : Basaltic lava flows do not show any effect of tectonic disturbance and are sub-horizontal in disposition as revealed by subsurface correlation. The major joints as deciphered by GSI are shown below-
(i) NE – SW (N 400 -600E,- S 400 – 600 W)
(ii) NW – SE (N 300 -500E,- S 300 – 500 E)
2.1.5 Sub surface geology and correlation of Basaltic Lava flows:
In order to study the subsurface geology and to correlate the basaltic lava flows a number of cross have been prepared using the drilling data of exploration data of exploratory bore holes
In order to define the individual lava flows the geophysical logs viz. resistivity and natural gamma logs provided a rapid means of flow demarcation and correlation. The resistivity logs helped in differentiating the individual lava flows, whereas the natural gamma logs recording a distinct change in gamma logs repose in certain flows served as tool in correlation of lava flows. The signatures recorded on gamma logs against different flows taking into account the change in borehole diameter, casing details etc., have been grouped into two distinct categories:
(i) Flows with low gamma repose and (ii) Flows with high gamma repose
In the area, a total of 14 flows have been delineated between the elevation ranges of 555.20 and 420 m amsl. The thickness of lava flows ranges from 6.0 to 38.0 m and the average thickness is about 18.0-20.m.Exceptional thickness of flows ranging from 27 to 381m have been met with in the Ujjain. The flows have a gentle slop from south west to north east. The lateral and vertical variations in flows characteristic are quite common in the area.
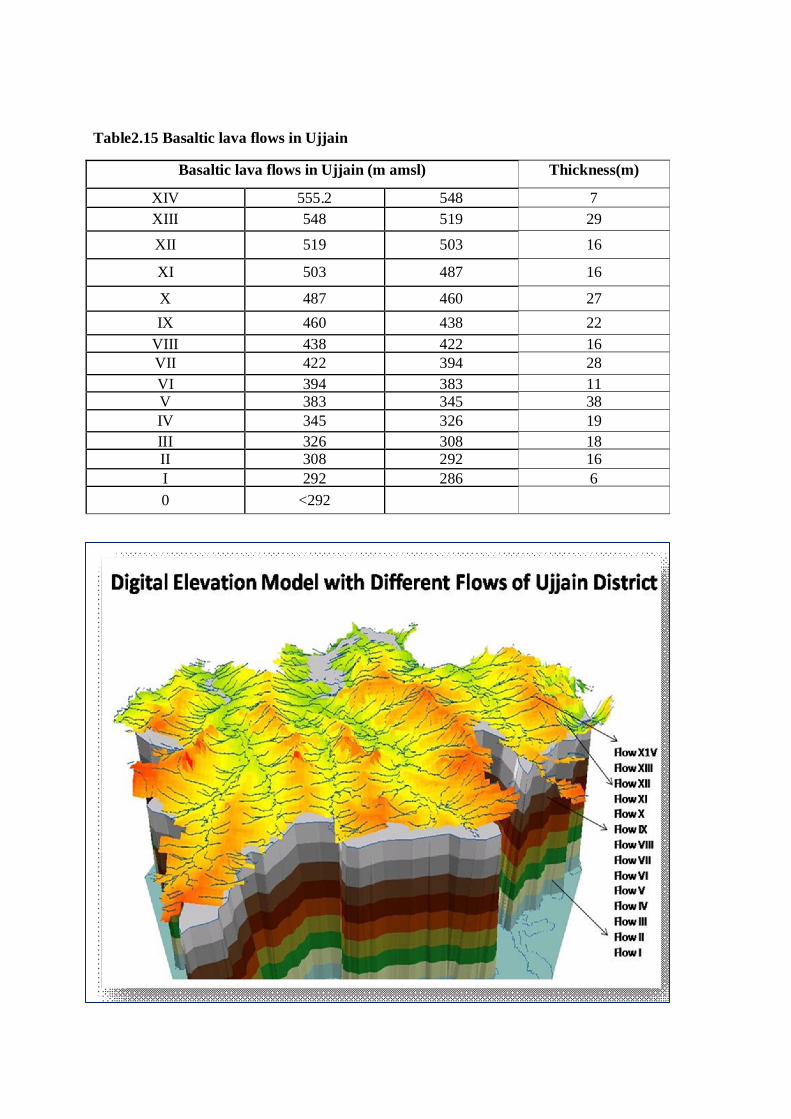
Table2.15 Basaltic lava flows in Ujjain
Basaltic lava flows in Ujjain (m amsl) Thickness(m)
XIV 555.2 548 7 XIII 548 519 29
XII 519 503 16
XI 503 487 16
X 487 460 27 IX 460 438 22
VIII 438 422 16 VII 422 394 28 VI 394 383 11 V 383 345 38 IV 345 326 19 III 326 308 18 II 308 292 16 I 292 286 6 0 <292

2.2 Hydro geomorphology Hydrogeomorphological mapping (fig2.2_) is one of the best-suited approaches to explore the possibility of groundwater resources especially in those areas where availability of surface water in insufficient . The study of Landsat imagery interpretation revealed that the Deccan basalt formation have developed distinct land form which helped in identifying the hydro geomorphological features of the potential prospects areas for groundwater availability in Ujjain area The major landforms in the area are classified into 5 units:
Table 2.2: Classification of Hydro geomorphic landform of Ujjain
Fig 2.2 : Hydro geomorphology map of Ujjain
Geomorphic landform Area covered(sq.km) / % Dissected 00.5261 0.0088 Moderately dissected 1487.97 25.05 Un dissected 3848.15 64.79 Residual hil 35.514 0.59 Valley fill 562.61 9.47 Water body 04.559 0.076
Total 5939.33 100.00

Table2.2.2 Relationship of Geomorphic surface with Ground water potential
2.1.7 Lineaments
The lineaments gives linear expression on the Landsat imagery as well as on aerial photograph as
I. Linear topographic features , trenches or ridges, river alignments etc II. Linear vegetation and soil/land use pattern
These are linear to curvilinear features on the surface of earth, of tectonic significance -mainly fractures and /or faults and sometimes master joints.
The major Lineament within the area of Ujjain is discussed below:
There are 663 lineaments in the study area. NW and NE are predominant direction of lineaments Studies revealed a close relationship between lineaments and groundwater flow and yield. Generally lineaments are underlain by zones of localized weathering and increased permeability and porosity
The major3- lineaments in the Ujjain area :
(i) South east of Khachord,North of Nagda and north east of Mahidpur that cut across Chambal,Khipra and chotikalisindr
(ii) South west of Ujjain town that cut across river Khipra and Gambhir, South east of Ujjain
Origin Geomorphic Unit Description Groundwater potential
Structural
Highly dissected plateaus
Moderate to steeply sloping basaltic plateau margin with high drainage density negligible soil cover
Poor
Structural
Highly dissected plateaus
Moderate sloping basaltic plateau margin with high drainage density and weathered moderately soil cover
Poor
Structural
Plateaus top
Isolate3d basaltic plateaus with steep side slop with moderate soil cover
Poor
Structural
Moderately dissected plateaus
Basaltic plateaus moderately dissected with high drainage density with soil cover
Poor
Structural
Moderately dissected plateaus
Basaltic plateaus moderately dissected with high drainage density with thick soil cover
moderate

Fig 2.1.7: lineaments in the Ujjain
2.3 Data generation 2.3.1 Hydrogeological data 2.3.1.1 Ground water level,
There are 78 Groundwater structures have been monitored (table 2.2.1) in the period 2015-16.Based on the water level data the pre and post moon water with water level fluctuation map have been prepared and given below- Table2.2.1 : Numbers of Groundwater monitoring structures area Block NHS(Dug wells) Piezomter
Number Number
Badnagar 07 09 Ghatia 04 04 Khachrod 02 05 Mahidpur 08 06 Tarana 07 07 Ujjain 13 8 District 41 37


2.3.1.2 Dugwell ; Water level trend _Pre moonsoon 2006-2015
Sl No. Block Location Data Points
Rise (m/year)
Fall (m/year) Intercept
1 Badnager Kharotia 13 8.8909 0.0898
2 Ghatia Bachhukhera 20 0.1172 9.5270
3 Khachord Khachrod1 10 0.2371 9.7738
4 Khachord Unhel 8 0.1188 12.5930
5 Mahindpur Baijnath 10 0.5199 14.2068
6 Mahindpur Delchi buzurg 9 0.5816 18.2082
7 Mahindpur Khera khajuria 10 0.0249 7.7414
8 Raghvi Raghvi 8 7.5898 0.2478
9 Tarana Dablahardu 16 0.2373 12.0487
10 Tarana Makdon 10 10.0636 0.3684
11 Tarana Rupakhedi 8 0.0898 11.7382
12 Tarana Tarana 20 10.5489 0.1998
13 Ujjain *Chandukhedi 6 11.4579 0.2859
14 Ujjain *Mohanpura 8 0.2662 12.0876
15 Ujjain Hasampura 10 0.5386 17.0727
16 Ujjain Palkhanda 28 0.1213 9.2114
17 Ujjain Patpala 10 7.6661 0.4008

2.3.1.3 Shallow PZ Trend of Water level – PreMonsoon 2006-2015
Block Location PZ'S Data Points
Rise (m/year)
Fall (m/year) Intercept
Badnager *Bhatpachlana S 5
0.0000
Badnager Runija S 10
0.0726 14.9914
Mahindpur Mahidpurroad S 10
0.2833 8.9151
Ujjain Ujjain S 10
0.1515 6.8175
2.3.1.4 Deep Pizomter Trend of Water Level – PreMonsoon : year 2006 2015
Sl No. Block Location Pz Data Points
Rise (m/year)
Fall (m/year)
Intercept
1 Badnager Runija D 9
0.3623 27.0224
2 Khachord Khachrod1 D 10
0.2371 9.7738
3 Khachord Unhel D 8
0.1188 12.5930
4 Mahindpur Mahidpur town D 8
4.1131 0.0680
5 Mahindpur Mahidpurtown D 10
0.3819 14.3180
6 Raghvi Raghvi D 9
0.2946 8.6598
7 Tarana Tarana D 8
0.4377 51.1378
8 Ujjain Narwar(deep) D 7
24.3117 1.1674
9 Ujjain Panth piplai D 6
0.5248 19.1503
10 Ujjain Ujjain D 8
0.3257 8.5581

2.3.1.5 Exploratory drilling-State, CGWB and private wells : Ground water Exploration : Central Groundwater Board
Block No. of EW Depth rages EW Elevation ranges
mbgl m amsl Bandager 05 148.5-203.65 485-520 Ghatia 02 203.25-216.4 478-496 Khachord 01 191.25 490 Mahidpur 01 203.10 495 Tarana 01 203.10 499 Ujjain 06 143.30-203.35 495-518 Urban Ujjain 10 140.20-203.0 473.60-498.6
Total 26 140.20-216.4 473.60-520 2.3.1.6 Block wise exploration wells
S.no Blcok Exploration Elevation TotalDepth Long Lat m amsl mbgl
1
Badnagar
Badnagar EW 485 191.25 23.08 75.39 2 Amla EW 513 203.45 23.01 75.33 3 Kharsaud Khurd EW 499 202.1 23.12 75.46 4 Lohana EW 515 203.65 22.92 75.37 5 Runija EW 520 148.5 23.16 75.26 1 Ghatia
Goyala Buzurg EW 478 203.25 23.28 75.71 2 Jaithal EW 496 216.4 23.28 75.82 1 Khachrod Unhel EW 490 191.25 23.34 75.44
1 Mahidpur Kheda Khajuriya EW 495 203.1 23.46 75.79 1 Tarana Sumarkhera EW 499 166.2 23.26 76.07 1
Ujjain
Kakaria chirakhan EW 515 143.3 23.03 75.72 2 Kithoda rao EW 495 202 23.08 75.84 3 Nalwa EW 499 203.2 23.12 75.46 4 Palkhanda EW 518 202.1 23.04 75.95 5 Pingleshwar EW 507 203.55 23.23 75.85 6 Tajpur EW 515 203 23.23 75.91

2.4 Hydrochemical (Ground water quality) of Ujjain District (Water quality sampling, number of samples and analysis mechanism etc.)
The water samples were collected from National Hydrograph Stations in clean double stopped poly ethylene bottles from 24 different locations of Ujjain district during May 2014.
The pH of ground water of Ujjain district ranged in between 7.26 to 8.65. As per BIS recommendation, all water samples recorded within the permissible limit of 6.5 to 8.5. In the Ujjain district, pH has been observed more than 8.5 in the dug well of Kaiytha (8.52), Khera Khajuria (8.55), Mahidpur road (8.65), Makdon (8.59) and Vijayganj Mandi (8.54). The ground water of the study area can be assessed as slightly neutral to alkaline in nature.
The electrical conductivity of ground water in Ujjain district ranged between 595 to 4085 µS/cm at 25°C. The EC values more than the 3000 µS/cm 25°C were recorded only at Kaiytha i.e. 4085 µS/cm at 25°C. The electrical conductivity shows that the ground water in Ujjain district is good to slightly saline in nature.
The fluoride concentration in Ujjain district ranged in between 0.09 to 1.57 mg/l. The BIS has set the maximum concentration of fluoride in drinking water is 1.5 mg/l as permissible limit. The maximum concentration of fluoride has been recorded in Nazarpur village i.e. 1.57 mg/l.
In the district, nitrate concentration in ground water ranged in between 5 to 225 mg/l. The
29 % ground water samples recorded nitrate concentration within the acceptable limit and 71% water samples recorded more than 45 mg/l as BIS recommendation. The highest concentration of nitrate has been detected in ground water of Ujjain Nagar Palika (225 mg/l). High nitrate in ground water appears may be due to anthropogenic activities or excessive use of fertilizers etc.
Total hardness of ground water in the study area ranged in between 150 to 1580 mg/l. The maximum concentration of was observed in the dug well of Dablahardu (605 mg/l), Ujjain Nagar Palika (810 mg/l) and Kaiythya (1580 mg/l).
In the district water is mixed type, saline in nature, temporary and permanent hardness type of water. The US Salinity Diagram of Ujjain district shows the ground water is low to high salinity classes i.e. C2S1, C3S1, C3S2 and C4S1 classes. C3 and C4 classes of water should not be used for irrigation purpose unless proper soil management.


2.5 Geophysical Investigations 2.5.1 Location, number, analytical techniques of Surface Resistivity Investigation:
Forty one Vertical electrical sounding (VES) have been conducted in and around Ujjain city covering an area of about 300 km2 in Kishpra basin. In present investigation, Schlumberger configuration was adopted for conducting VES because of its sensitivity towards local inhomogeneity. The location map of observed VES is shown in figure-2.5.1.
The resistivity sounding curves obtained in the area are multi-layered in nature and represent H, AK, HA, HKH, AHKH etc type curves. Some of representative VES have been shown in figure-25.2. The interpreted geoelectrical layer parameters of each VES have been presented in table-2.5. Figure-2.5: Location of VES observed in Khipra basin, Ujjain district.
Figure-2.5.2: Representative VES obtained from Khipra basin, Ujjain district.

Table 2.5: Interpreted Results of VES observed in Kshipra basin, around Ujjain City, Ujjain district, MP.
VES No.
Location Layer Resitivities (ohm.m) Layer thickness (m) Total Thickness
(m)
H1 h2 h3 h4 h5/ h6
1 Kithora 34 17 119 28 540 - 0.8 8.0 10.8 52 - 71.6 2 Khajuria 17 3.4 43 - - - 1.0 13.0 - - - 14 3 Juna Ninora 20 8 56 - - - 1.2 19.2 - - - 20.4 4 Karohan 12 7.2 53.2 - - - 0.8 26.4 - - - 27.2 5 Malanwasha 3.5 7 55 25.6 - - 0.7 1.9 14.6 - - 15.2 6 Chandeshri 8.6 6.7 23.8 75 - - 1.0 10.0 19.8 - - 30.8 7 Datana 73 7.1 59.5 - - - 1.7 8.9 - - - 10.6 8 Lalpur 6 4.5 36.4 - - - 1.1 0.8 - - - 1.9 9 Bhairopur 14 5.6 164 - - - 0.8 12 - - - 12.8 10 17 km stone 11 17 Km stone 47 19 200 - - - 0.7 42.3 - - - 43.0 12 Ramwasha 13 Sahibakheri 13 7.8 28.7 100 28.8 - 0.8 14.4 45 21 - 81.2 14 Ahukhana 14 47 266 19 72 10/
300 0.6 3.7 5 14 36.3
/56 115.6
15 Sandipni Asram 17 6.8 49 10.8 - - 1.9 13.7 16 - - 31.6 16 Surasa 30 9 62.3 - - - 0.8 28 - - - 28.9 17 Makodia am 11 5.5 15 38.5 380 - 1 4.5 13.8 22 - 41.3 18 Pawansha 33 13 560 210 60.8 602 0.7 3.5 14.4 80 88 186.6 19 Undasha 15 6 21 300 27 640 0.8 4.8 15.7 4.8 15.2 41.3 20 Kanipura 11 6.6 53.2 210 30 - 0.9 2.1 3.8 15 - 21.8 21
Dhabla 13 5.2 220 - - - 1.0 9.0 - - - 10.0
22 Jaithal 27 16 210 51 805 - 1.1 1.3 74.4 24.6 - 101.4 23 Yantra Mahal 40 12 195 8 140 - 1.0 7.0 2.0 17.3 - 27.3 24 Mahananda Ngr 43 8.6 77 13.6 - - 0.6 1.8 32.4 - - 34.8 25 Dashara Maidan 18 5.4 62 4.5 130 - 0.8 4.3 8 6 - 19.1 26 Dewas Gate 14 5.6 56 - - - 1.4 11.2 - - - 12.6 27 Mohanpura 66 4 44 480 - - 1.2 20.4 33 - - 54.6 28 Hanuman Garhi 130 9.1 384 54.4 - - 2 18 24.4 - - 44.4 29 Chinta Haran
Ganesh 18 9 50 9.6 440 - 0.9 2.7 10.4 18 - 32
30 Jawasia 18 5.4 81 - - - 0.7 11.9 - - - 12.6 31 Palkheri 14 4.2 176 - - - 0.9 8.1 - - - 9.0 32 Gangeli 8 4 18 - - - 0.9 16.2 - - - 17.1 33 Sikandri 9.8 4.6 5.4 50 - - 0.8 1.3 22.8 - - 24.9 34 Dawat Kheri 15 7.5 49 260 - - 0.7 21 8 - - 29.7 35 Jeewan Kheri 8 2.4 9.5 70 16.8 - 0.8 3.2 16.7 19.6 - 40.3 36 Kalidah Mahal 6 12 55 - - - 6 27.6 - - - 33.6 37 Barkheri 7 8.8 37 - - - 1.9 10.3 - - - 12.4 38 Nand Kheri 8 4.5 100 - - - 0.9 5.1 - - - 6.0 39 Bhadarkha 25 32 60 - - - 2.1 2.1 48 - - 52.2 40 Padmakheri 8.6 5.2 12 65 - - 1.1 4.4 9.9 - - 15.4 41 Utesra 12 3.3 176 - - - 0.8 5.1 - - - 5.9

The VES results have indicated the presence of 3 to 7 geoelectrical layer sequence in the interpreted depths range of about 120 m bgl. The measured as well as interpreted resistivity values have indicated the wide range of resistivity variations. The measured apparent resistivity varies from the order of 3 ohm-m to the order of 100 ohm-m while the interpreted true resistivity value varies from the order of 4 ohm-m to 800 ohm-m. The interpreted results indicate The presence of 10 to 30 m thick weathered hard rock layer which can also be
characterized as alluvium thickness. This layer is forming good shallow aquifer in the study area..
At places VESs, the presence of weathered/fractured/vesicular basalt which may be forming deeper aquifer in the depth range of 70 to 80 m.
Correlation of interpreted layer parameter with local subsurface lithological details indicate that there is an overlap in resistivity values of different geological layer.
The lower range of resistivity value corresponds to weathered rock with more clay content and the high resistivity value represents hard rock formation.
The intermediate resistivity of the order of 10 – 50 ohm-m may corresponds to weathered / fractured formations whic h m ay be fo rm in g aquifer system whereas the resistivity of the order of more than 100 ohm-m may corresponds to hard basalt formation.
On the basis of geoelctrical parameter the depth to hard rock (over burden thickness) map has been prepared and shown in figure-2.5.3 Figure-2.5.3: Depth to hard rock (over burden thickness) map around Ujjain City, Khipra basin, Ujjain district.

2.5.2 Geophysical Logging: Five exploratory and two observation boreholes namely Jaithal, Kanasiya, Sumarakhera, Mandon and Thukral have been geophysically logged in Ujjain district. Composite geophysical logs (resistivity, natural gamma, SP, caliper, temperature and conductivity) obtained from exploratory borehole drilled in basaltic rock formation of Ujjain district, MP is shown in figure 2.5.2.1. The resistivity log recorded the wide range (15-500 ohm-m) of resistivity values while the
natural gamma counts vary between 10 and 47 cps. The combination of resistivity and natural gamma log clearly distinguish between
compact basalt and intertrapean formation. The comparative `low’ resistivity zone in `high’ resistivity background corresponds to high gamma counts (30-47 cps) represents the intertrapean formation where as the `low’ gamma counts of the order of 8-15 cps corresponds to high resistivity massive basalt.
The geophysical log parameters clearly distinguish between different lithological formations which are finally useful for designing well assembly. The composite logs indicated the need for recording more than one geophysical parameter for getting desired hydrogeological inferences. Figure- 2.5.2.1: Composite geophysical log (SP, Resistivity, Caliper,Natural Gamma, Temperature and Conductivity) of Thukral exploratory borehole Ujjain district.
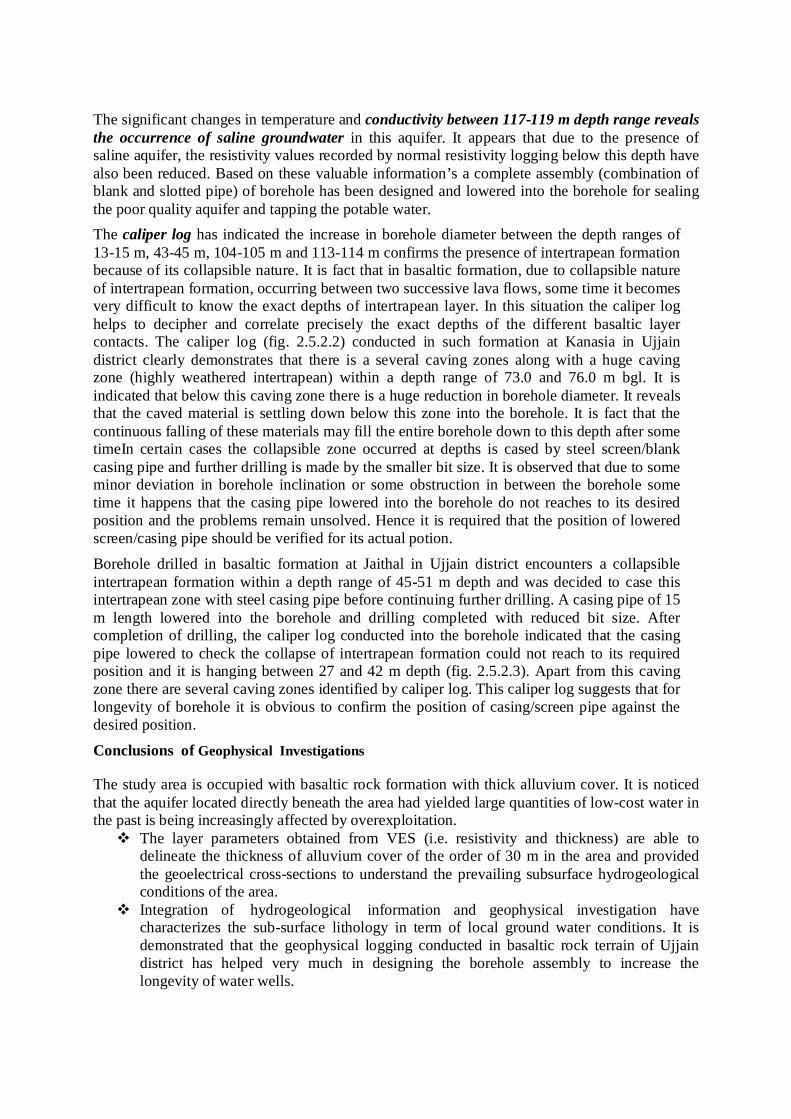
The significant changes in temperature and conductivity between 117-119 m depth range reveals the occurrence of saline groundwater in this aquifer. It appears that due to the presence of saline aquifer, the resistivity values recorded by normal resistivity logging below this depth have also been reduced. Based on these valuable information’s a complete assembly (combination of blank and slotted pipe) of borehole has been designed and lowered into the borehole for sealing the poor quality aquifer and tapping the potable water. The caliper log has indicated the increase in borehole diameter between the depth ranges of 13-15 m, 43-45 m, 104-105 m and 113-114 m confirms the presence of intertrapean formation because of its collapsible nature. It is fact that in basaltic formation, due to collapsible nature of intertrapean formation, occurring between two successive lava flows, some time it becomes very difficult to know the exact depths of intertrapean layer. In this situation the caliper log helps to decipher and correlate precisely the exact depths of the different basaltic layer contacts. The caliper log (fig. 2.5.2.2) conducted in such formation at Kanasia in Ujjain district clearly demonstrates that there is a several caving zones along with a huge caving zone (highly weathered intertrapean) within a depth range of 73.0 and 76.0 m bgl. It is indicated that below this caving zone there is a huge reduction in borehole diameter. It reveals that the caved material is settling down below this zone into the borehole. It is fact that the continuous falling of these materials may fill the entire borehole down to this depth after some timeIn certain cases the collapsible zone occurred at depths is cased by steel screen/blank casing pipe and further drilling is made by the smaller bit size. It is observed that due to some minor deviation in borehole inclination or some obstruction in between the borehole some time it happens that the casing pipe lowered into the borehole do not reaches to its desired position and the problems remain unsolved. Hence it is required that the position of lowered screen/casing pipe should be verified for its actual potion.
Borehole drilled in basaltic formation at Jaithal in Ujjain district encounters a collapsible intertrapean formation within a depth range of 45-51 m depth and was decided to case this intertrapean zone with steel casing pipe before continuing further drilling. A casing pipe of 15 m length lowered into the borehole and drilling completed with reduced bit size. After completion of drilling, the caliper log conducted into the borehole indicated that the casing pipe lowered to check the collapse of intertrapean formation could not reach to its required position and it is hanging between 27 and 42 m depth (fig. 2.5.2.3). Apart from this caving zone there are several caving zones identified by caliper log. This caliper log suggests that for longevity of borehole it is obvious to confirm the position of casing/screen pipe against the desired position.
Conclusions of Geophysical Investigations The study area is occupied with basaltic rock formation with thick alluvium cover. It is noticed that the aquifer located directly beneath the area had yielded large quantities of low-cost water in the past is being increasingly affected by overexploitation. The layer parameters obtained from VES (i.e. resistivity and thickness) are able to
delineate the thickness of alluvium cover of the order of 30 m in the area and provided the geoelectrical cross-sections to understand the prevailing subsurface hydrogeological conditions of the area.
Integration of hydrogeological information and geophysical investigation have characterizes the sub-surface lithology in term of local ground water conditions. It is demonstrated that the geophysical logging conducted in basaltic rock terrain of Ujjain district has helped very much in designing the borehole assembly to increase the longevity of water wells.

The application of geophysical logs have shown its capability in delineating aquifer’s geometry, identifying different lava flows in basaltic rock formation and evaluation/verification of well conditions prior to sealing and abandonment of borehole
.
Figure-2.5.2.2: Caliper log of Kanasiya exploratory boreholes Ujjain district.
Figure-2.5.2.3: Natural Gamma and Caliper log og Jaithal exploratory boreholes Ujjain district.

3.0 Data Interpretation, Integration and Aquifer Mapping
Results and interpretation of all studies helps in preparation of aquifer maps- 2 D and 3D diagrams.
3.1 Hydro geomorphology analysis : The major area in Ujjain covered 64.80 % (38488.15sq km) by undissected plateau with 25.05% (1487.9 sq km) covered by moderately dissected plateau.The valley fill area as alluvium formation along the banks of river Kshipra & Chambal is about9..47% (562.61)
Table3.1: Ground water propect along various geomorphic features
S. No.
Geomorphological Unit
Spectral Signature prospect for ground water
1. Plateau Highly Dissected
Medium to dark brownish tone, medium texture, dendritic drainage pattern and moderate drainage density, Very gentle to gentle slope, extensively cultivated
Good prospect for ground water recharge
2. Plateau Moderately Dissected
Medium to light bluish reddish tone, coarse texture, medium drainage density, Gentle to moderate slope, extensively cultivated
Better prospect along fracture zone
3. Plateau Slightly Dissected
Light Bluish green tone, coarse to fine texture, dendritic drainage pattern and high drainage density, Moderately to slightly undulating, under rainfed cultivation
High priority for recharge structure
4. Alluvial Plain Light to medium grey tone, mottled texture, Very gentle to gentle slope, cultivated.
Good recharge from surrounding areas
5. Valley Fills Reddish tone, smooth texture, sparse vegetation, confined along stream course.
High priority for recharge structure
6. Denudational Hills Brownish tone, fine texture, High dissected with high relief, vegetation present.
Runoff zone, Not suitable for recharge
7. Waterbody Bluish tone ----
Plateaus Un dissected : Large areas within the Ujjain district area covered by Un dissected surfaces (64.80%). These are highly fractured and weathered surface and covers an area of 3848.15sq km The land of these unit is severely dissected the stream of Khipr and Chambal with chotkalisindh t river giving rise to a stream consist of flat topped ridges & steep scrap. In general Ground water yield of the geomorphic surface is poor to moderate in dissected plateau from 36 to 288 lpm, The yield of bore wells in range of 140 to 288 lpm are located at lineaments
A pediment is a gently sloping erosion surface or plain of low relief formed by running water in semiarid region at the base of a receding mountain front. A pediment is underlain by bedrock that is typically covered by a thin, discontinuous veneer of soil and alluvium derived from upland areas. Much of this alluvial material is in transit across the surface, moving during episodic storm events or blown by wind
Plateaus moderately dissected (PLM-2,PLM-622) : It covers an area of 1487.97sq km (13.28%) These are highly weathered surface & fractured and occurring in North east of area of Halai, , Ghorapachar river. There are 27 lineaments in the area of Plateaus moderately dissected. The yields of wells are in the 36 to 60 lpm
Peneplain, gently undulating, broad, relatively flat rock face, an extensive area of low relief formed by the joining of several pediments almost featureless plain that it may be final stage of geomorphic cycle of landform evolution., dominated by convex-up (‘bulging’) hill slopes mantled by a continuous regolith, and by wide, shallow river valleys.
Valley fill (VFS) : Valley fill deposit is about 562.61sq km and found in the northern and northeastern part of the area along Kshipra & Chambal river has good potential of agriculture. They ranges in elevation from to in a amsl . The morph metric attributer of the valley fill are such that the gradient in mordantly steep (50 to 80), valley fill deposit consist mainly of weathered product of surrounding basaltic books, mostly comprising moderately thick gravel Pebbles, sand & silt The Ground water potential ranges from moderate to good. The water level fluctuation are raging from 4.10 to 6.02 m. They yield ranges from 308 to 363 lpm. They valley are developed along the fractured and such place can be exploited for groundwater through deep bore wells
3.2 Lineament Analysis
The lineaments present in the study area are both geomorphic as well as controlled lineament The mapped structural lineaments were analyzed using the lineament density (LD) and lineament frequency (LF) parameters. The results of the analysis are presented as lineament density map and rose diagram (figures 6, 7& 8) respectively. . The frequency of total number of 118 lineaments has been plotted in 100azimuth class interval. The rose diagram shows bimodal distribution with dominant trends
The rose diagram (Figure) shows the directional frequency of the mapped lineaments over the area of study. It was interpreted as a statistical means of representing the anisotropy of the fractured environment, as well as the fissure development tendency on a regional. The rose diagram of the detected lineaments show two prominent trends in the direction of N S and N-W axis which is also the principal direction of the regional structures directions. A comparison of Lineament density variation map shows that the two prominent lineament trends (NW SE and N-S) are correlated with high density variation zones of the study area. This can be an indication of the direction of groundwater movement in the studied area.

3.3 Hydro geological flow: Aquifer disposition in the 10 basaltic have been demarcated, based on it the Shallow aquifers occurs in 5-Basaltic lava flows between elevation 530-421m amsl Both Shallow & deep aquifer occurs in 3 flows from 503 – 440 m amsl Deep aquifers occurs in basaltic flows from 503- 276 m asml
Basaltic lava flows wise Aquifer disposition: Aquifers encountered at various depth of exploration have been evaluated in basaltic lava flow and it has given in table .The deeper aquifer disposition in depth range of 101-194.0m have been found in the flows from VII to II between elevation 422-292 m amsl. Table: 2.3.1: Flowise aquifer disposition
Basaltic Lava flows EW Depth of Aquifer Elevation_ AQ AQ_elevation ranges
No No mbgl m amsl m amsl
X 5
30.00 32.00 483.00
483-463.55 35.45 42.50 463.55 17.45 23.55 472.55
(487 -460 m amsl) 47.50 58.50 467.50 16.9 21.1 478.10
IX
5
29.65 35.75 455.35
455.35-446.50 23.55 29.65 454.45
(460 -438 m amsl) 48.5 50.2 446.50 39.00 41.50 460.00 64.70 85.00 453.30
VIII 4
60.15 87.55 429.85
438-428.70 70.3 75.0 428.70
(438 -422m amsl) 69.25 75.35 437.75 77.00 81.00 438.00
VII
7
90.05 116.60 408.95
420.95-390.55
124.45 136.55 390.55 115.40 118.40 404.60
(422 -394 m amsl)
57.05 69.25 420.95 84.0 90.0 412.00 93.65 108.95 396.35 101.00 109.20 414.00
VI 3
129.50 143.30 385.50 399.50-385 99.5 111.7 399.50
(394 -383m amsl) 118.05 124.15 388.95 V
4
130.25 136.35 347.75
347.75 & 371.95 125.0 131.0 371.00 (383 -345m amsl) 118.05 136.35 371.95
148.0 151.3 347.00 IV 2 184.5 194.5 330.55 330.55-328.0
(345 -326m amsl) 168.0 186.0 328.00 III(326-308 m amsl 1 186.0 192.0 310.00 310 II(308--292 m amsl) 1 185.15 189.00 299.85 299.85
I 1 185.15 191.25 292.85
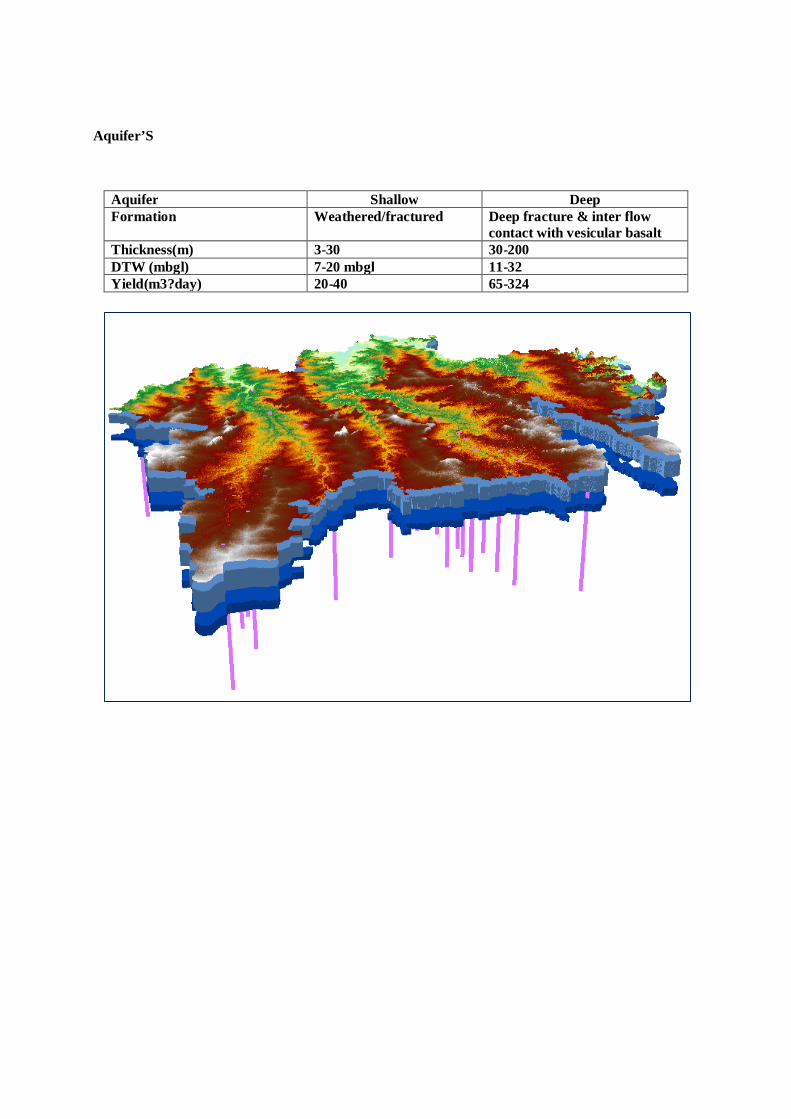
Aquifer’S
Aquifer Shallow Deep Formation Weathered/fractured Deep fracture & inter flow
contact with vesicular basalt Thickness(m) 3-30 30-200 DTW (mbgl) 7-20 mbgl 11-32 Yield(m3?day) 20-40 65-324

Deposition of shallow Aquifer
Koyal
Kanwas
Disposition of Shallow Aquifer
A
A’
B
B’
400-420420-440440-460460-480480-500500-520520-540
428.409729 - 438.2329826
438.2329827 - 448.0562363
448.0562364 - 457.8794899
457.87949 - 467.7027435
467.7027436 - 477.5259972
477.5259973 - 487.3492508
487.3492509 - 497.1725044
497.1725045 - 506.9957581
Index Elevation m.amsl
(Depth Profile A-A’ & B-B’)
Makdone pz
Kanwas
Lohana EW
Koyal
0.70.60.50.40.30.20.10
500
490480470
460450
440
A 1 2 3 4 5 6 7 8
A’
Elev
atio
n in
m. a
msl
Distance in Km
10.80.60.40.20
490
480
470
460
450
440B B’1 2 3 4 5 6
Elev
atio
n in
m. a
msl
Distance in Km
Depth Profile A-A’ & B-B’- Disposition of Shallow Aquifer
Shallow AquiferBasalt flow No.
wellsDepth range
(mbgl) formation
XII(519-503)
3 29.65 35.75 Fractured basalt
28.92 32.00 Vesicular basalt26.70 32.50 Fractured
basalt
XI(503-487) 2
29.00 30.00 Fractured basalt
28.00 30.00 Fractured basalt
X(487-460)
25 27 30.00 Vesicular basalt26.0 30.00 Fractured
basalt
20 23 V .Weathered basalt
IX(460-438) 3
29.65 33.0 Fractured basalt
28.92 32.00 Vesicular basalt
VIII(438-422)
2 18.28 21.94 Vesicular basalt12.02 14.10 Fractured
basalt

Deposition of Deeper Aquifer
Pat (PZ)
Raghvi (D)Raghvi (D)
Lohana(EW)
Disposition of Deeper Aquifer
A
A’
B
B’
420-440440-460460-480480-500500-520520-540540-560
Index Elevation m.amsl
Gogapur Pz Pat Pz
Sumarkhera EW
Runija EW
B (Depth Profile A-A’ & B-B’)
Depth Profile A-A’ & B-B’- Disposition of Deeper Aquifer
480460440420400380360340
Elev
atio
n in
m. a
msl
Distance in Km1 2 3 4 5 6 7 8 9 10
A A’
450440430420410400390380B B’
Ele
vatio
n in
m. a
msl
Distance in Km1 2 3 4 5 6 7 8 9
Aq_flow Elevation of Flow No.of wellDepth range
(mbgll)X 487-460 10 33 45
48 6098 99
129 145185 191
IX 460-438 16 32 4669 7091 97
165 170VIII 438-422 11 37 45
52 6575 81
117 124170 185
VII 422-394 18 18 3037 4765 6885 93
100 105186 192
VI 394-383 6 32 4284 93
V 383-345 9 38 4257 6984 99
148 151168 186
IV 345-326 2 184 194124 136
III 326-308 5 161 164127 12969 7536 41
II 308-292 3 185 200I 292-386 I 185.15 191.25

Block wise disposition of aquifer in basaltic lava flows Aquifers are weathered basalt,basalt fractured &jointed and vesicular basalt with discharge
Table: 2.3.1: Flowise aquifer disposition
Blcok No.of flows
Aquifer Flows RL_Aq Zonned tapped
mbgl
Badnagar 6
Shallow XII 507.00 8.00 20.65 IX 455.35 29.65 35.75 X 483.00 30.00 32.00
Deep
X 463.55 35.45 42.50 VII 408.95 90.05 116.60 VII 390.55 124.45 136.55 VII 404.60 115.40 118.40 IV 330.55 184.5 194.5 II 299.85 185.15 189.00
Ghatia 6
Shallow IX 454.45 23.55 29.65
Deep
VII 420.95 57.05 69.25 VII 412.00 84.0 90.0 V 347.75 130.25 136.35 V 371.00 125.0 131.0 IV 328.00 168.0 186.0 III 310.00 186.0 192.0 I 292.85 185.15 191.25
Khachrod 4
Shallow X 472.55 17.45 23.55
Deep VIII 429.85 60.15 87.55 VII 396.35 93.65 108.95 V 371.95 118.05 136.35
Mahidpur 1 Deep IX 446.50 48.5 50.2 Tarana
2 Deep IX 460.00 39.00 41.50 Tarana VIII 428.70 70.3 75.0
Ujjain 7
Shallow XII 495.85 22.15 30.00 X 478.10 16.9 21.1
Deep
X 467.50 47.50 58.50 IX 453.30 64.70 85.00 IX 440.00 75.00 81.00
VIII 437.75 69.25 75.35 VII 414.00 101.00 109.20 VI 399.50 99.5 111.7 VI 388.95 118.05 124.15 VI 385.50 129.50 143.30 V 347.00 148.0 151.3

Groundwater Potential Model (GPM) Groundwater Favorable Zone
A groundwater favorable zonation of the study area has been analyzed by the using of with the lithological structural, lineament density, drainage density, land use, hydro-geomorphological elements, and the background of the survey of India topographical maps on 1:50,000 scale. On the basis of integration of these maps groundwater favorable zones of the study area were identified.
On the above considerations, the various hydro-geomorphic units have then been classified into five categories of groundwater potentiality namely, very good, good, moderate, poor and very poor.
The hydro-geomorphological units such as Alluvial Plain, Valley Fills, Deccan Plateau,
Buried Pediment (sand stone) are most favorable zones for groundwater exploration & development in the study. Hence, these areas are marked as good to very good favourable zones. These zones are distributed mostly in the north, and middle of the study area and only some few in the southern portion of the area. A glance. -reveals that the northern part and some of the southern part of the study area have excellent groundwater potential as compared to the upper middle basin and east-south-eastern part of the basin. These are also verified from field check. This information is very useful for the further groundwater development in the study area.
Very High High Moderate Low Groundwater Potential Class
4.26 29.29 45.79 20.64 Area %

4.1 Ground Water Resources
4.1 Recharge, Draft and Stage of groundwater development of replenishable resource.
4.1.1 Recharge
Data Variables used in Dynamic Ground water Resources
Annual Rainfall (mm) 713.5 Average Pre-monsoon Water level (mbgl) 14.13 Average Post-monsoon Water Level (mbgl) 6.84 Average Fluctuation (m) 7.29 Number for Irrigation structure
DW with electric /diesel pump 37579
Bore well 55780
Parameters Used in the Assessment of Dynamic Ground water Resources Rainfall Infiltration Factor (in fraction) 0.13/.06 Specific Yield (in fraction) 0.02/.015
Recharge From Rain Fall During Monsoon Season mcm 782.0
Recharge From Other Sources During Monsoon Season mcm 47.185
Recharge From Rain Fall During Non Monsoon Season mcm 184.10
Recharge From Other Sources During Non Monsoon Season mcm 1013.33
Total Annual Recharge mcm 1013.33
Natural Discharge During Non Monsoon Period mcm 520.66
Net Ground Water Availability mcm 962.66
Total Geographical Area Ha 6130.23
Hilly Area Ha 190.90 (3.11%)
Ground Water Recharge Worthy Area Ha 5939.33 (96.11%)
Non-command area Ha 5939.33

4.1.2 Draft
Parameters Used in the Assessment of Dynamic Ground water Resources
Season-wise Unit draft Irrigation(ha m)
DW with electric /diesel pump
Monsoon
Non-Monsoon 36756 Bore well
Monsoon
Non-Monsoon 50589
Ground Water Draft
Existing Gross Ground Water Draft for Irrigation Ham 902.43 Existing Gross Ground Water Draft for Domestic & Industrial Water Supply Ham
Net Ground Water Availability for Future Irrigation Development Ham 52.66
4.1.3 Stage of groundwater development of replenish able resource Stage of Ground Water Development 93.74%
4.2 Static resource and extraction from unconfined aquifer as well as in/from deeper aquifers, if any.
District Shallow aquifer
Deep aquifer Shallow & deep aquifer
Dynamic Static total Static Static
Ujjain 962.66 MCM
259.917 MCM
1222.559 MCM
497.251 MCM
757.168 MCM
Block
Number Unit Draft(ham) Draft (ham) Total
DW BW DW BW DW BW
Badnagar 1030 17925 0.81 1.3 834.3 23302.5 24136.8
Ghatia 5482 5232 0.81 1.3 4440.42 6801.6 11242.02
Khachrod 9992 5000 0.76 1.21 7593.92 6050 13643.92
Mahidpur 10590 4579 0.61 1.21 6459.9 5540.59 12000.49
Tarana 6387 5183 0.61 1.21 3896.07 6271.43 10167.5
Ujjain 3275 12670 0.95 1.03 3111.25 13050.1 16161.35

4.2 Ground Water Related Issues 4.2.1 Identification of issues,
Limited Yield Potential: During Rabi period yield of Groundwater abstraction structure reduces & do not meet
crop water requirement. Bore wells yield reduces in peak Rabi season (From 324-65m3/day during start of Rabi to 162-22 m3/day during Peak Rabi Season).
Aquifers –Shallow: Low to medium potential in Basalt aquifers. Aquifers-deep : Limited vesicles/fracture thickness resulting into low yield of bore wells.
Declining Water levels :Water level 4.35-8.40m (Premoonsoon 2005) to 7.70-18.34m Premoonsoon 2015)
Dependency of Irrigation on Ground Water : 57.14% of irrigation requirement from Ground Water
Surface water irrigation 226730ha (42.85%
Groundwater irrigation 302338ha(57.14%) 4.3 Geographical distribution and quantification with respect to ground water resources
Block
Shallow Aquifer Deep AQ SAQ+DAQ Dynamic Static total Static Static
MCM Badnager 210.494 7.33 217.824 102.559 109.889 Ghatia 114.77 10.137 124.907 46.967 57.104 Khachrod 191.84 83.514 275.354 79.768 163.282 Mahidpur 163.88 73.744 237.624 93.485 167.229 Tarana 145.628 52.224 197.852 98.053 150.277 Ujjain 136.03 32.968 168.998 76.419 109.387
Ujjain district 962.66 259.917 1222.559 497.251 757.168

Dynamic ground Water Resources (2015)
4.4 Future demand (for 2025 and 2030) scenario and stress aspects of the aquifer.
Groundwater Demand of projected population @ increase of growth of 16.21%/year .The demand of water in 2025 will be 436974 cum
Present Population 2011)
Projected population [email protected]%/year
Water requirement
@ liter
Water demand (Cum)
Rural 1207651 2725427 70 190780
Urban 779213 1758528 140 246194
Total 1986864 4483955 436974
Block
Net Ground Water
Availability in mcm
Existing Gross
Ground Water
Draft for Irrigation
in mcm
Existing Gross
Ground Water
Draft for Domestic & Industrial
Water Supply in
mcm
Existing Gross
Ground Water
Draft for All Uses in mcm (3+4)
Allocation For
Domestic &
Industrial
Water Supply
in mcm
Net Ground Water
Availability for
Future Irrigation Developm
ent in mcm
(2-3-6)
Stage of Ground Water
Development in
% {(5/2)*10
0}
1 2 3 4 5 6 7 16
Badnagar 210.49 240.65 5.41 246.06 5.41 35.56 116.90
Ghatia 114.77 112.21 3.12 115.33 3.12 .5661 100.49
Kachrod 191.84 136.01 5.58 141.60 8.59 47.23 73.81
Mahidpur 163.88 119.43 5.36 124.80 7.53 36.91 76.15
Tarana 145.62 101.32 5.21 106.53 7.60 36.70 73.16
Ujjain 136.03 162.31 5.78 168.09 5.78 32.05 123.56
District 962.66 871.95 30.48 902.43 38.05 52.66 93.74
6.0 Management Strategies
6.1 Aquifer wise Plan for sustainable management of the resource
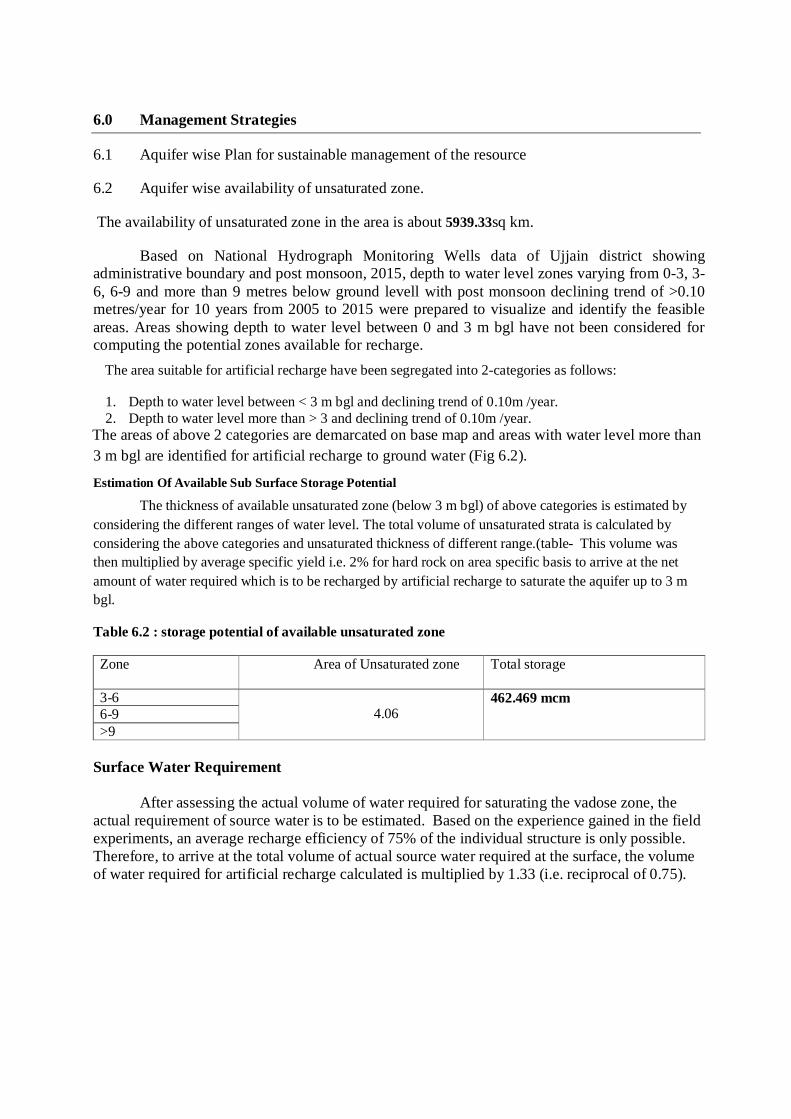
6.2 Aquifer wise availability of unsaturated zone.
The availability of unsaturated zone in the area is about 5939.33sq km.
Based on National Hydrograph Monitoring Wells data of Ujjain district showing administrative boundary and post monsoon, 2015, depth to water level zones varying from 0-3, 3-6, 6-9 and more than 9 metres below ground levell with post monsoon declining trend of >0.10 metres/year for 10 years from 2005 to 2015 were prepared to visualize and identify the feasible areas. Areas showing depth to water level between 0 and 3 m bgl have not been considered for computing the potential zones available for recharge.
The area suitable for artificial recharge have been segregated into 2-categories as follows:
1. Depth to water level between < 3 m bgl and declining trend of 0.10m /year. 2. Depth to water level more than > 3 and declining trend of 0.10m /year.
The areas of above 2 categories are demarcated on base map and areas with water level more than 3 m bgl are identified for artificial recharge to ground water (Fig 6.2).
Estimation Of Available Sub Surface Storage Potential
The thickness of available unsaturated zone (below 3 m bgl) of above categories is estimated by considering the different ranges of water level. The total volume of unsaturated strata is calculated by considering the above categories and unsaturated thickness of different range.(table- This volume was then multiplied by average specific yield i.e. 2% for hard rock on area specific basis to arrive at the net amount of water required which is to be recharged by artificial recharge to saturate the aquifer up to 3 m bgl.
Table 6.2 : storage potential of available unsaturated zone
Zone Area of Unsaturated zone Total storage
3-6 4.06
462.469 mcm 6-9 >9
Surface Water Requirement
After assessing the actual volume of water required for saturating the vadose zone, the actual requirement of source water is to be estimated. Based on the experience gained in the field experiments, an average recharge efficiency of 75% of the individual structure is only possible. Therefore, to arrive at the total volume of actual source water required at the surface, the volume of water required for artificial recharge calculated is multiplied by 1.33 (i.e. reciprocal of 0.75).

6.3 Augmentation plan of the resource through artificial recharge and water conservation. Area suitable for recharge (sq km) : 5939.33
Average pos-monsoon water level (m) : 7.07 Average SP Yield (%) : 0.02 Source Water for Artificial Recharge
Sub-surface storage (mcm)
Surface water required (mcm)
Surface water (Run-off) available (mcm)
Non-committed Run-off (mcm)
462.469 615.08 1271.31 422.99 Number of Recharge Structure
Structure Proposed Already Constructed Balance Percolation tank 383 33 350 Recharge shaft/ Tube well 846 - NB/ CD/ CP Proposed 2688 82 2606 Financial Outlay of the Plan
Structure Unit Cost (Rs in Crores)
Number Cost (Rs in Crores)
Percolation Tanks 0.2 383 76.6 NB/ CD/ CP 0.1 2688 268.8 Recharge shaft/ Tube well 0.01 846 8.46 Renovation of Village Ponds 0.01
1101 22.02
Total Cost (RS in Crores) 405.87
6.4 Demand side management, through change in Crop Pattern
Crop area(Ha)
Wheat 199308 50% of Wheat crop 99654 Gram 109060 Proposed increase in Gram area
208714
Water requirement for Wheat crop mcm
Present Wheat 797.232 Proposed change Wheat 398.616
Water requirement for Gram crop mcm
Present Gram 218.12 Proposed change Gram 471.428
Total requirement wheat+Gram mcm
Present Wheat 1015.35 Proposed change Gram 816.044
Saving of Groundwater in mcm Proposed Change in crop pattern 199.308

6.5 Demand side management, through change irrigation practices
6.6 Projected status of Ground water Resources & Utilization
After Interventation DYNAMIC GROUND WATER RESOURCES
Total Annual Recharge (mcm) 1013.33 Net Ground Water Availability (mcm) 962.66 Existing Gross Ground Water Draft for All Uses (mcm) 902.43 Net Ground Water Availability for Future Irrigation Development (mcm) 52.66
Saving GW In sprinkler irrigation 135.44mcm)+change in crop area from wheat to Gram(199.308mcm) 334.74
Stage of Ground Water Development in % 37.69 %
Change in Ground Water Development in % 93.74 % To 37.69%
9.0 Rejuvenation of Kshipra river- Suggested Interventions 7.1 Introduction
The Kshipra is a river of Central India, also called Kshipra or Avanti nadi. The Kshiprariver originates in the Vindhya Range and flows in a northerly direction across the Malwa plateau to join the Chambal River. Upstream of its confluence with the Chambal, the Kshipra has a catchment area of 5600 km2. Its nominal source is on the KokriBardi hill, 20km south-east of Indore near the small village of Ujeni (22° 31' N. and 76°00’ E.). It is considered as sacred as the Ganga river by the Hindus. The holy city of Ujjain is located on the right bank of the Kshiprariver.
The river flows in a general north-westerly direction and has a very sinuous course. The total course of about 195 km flows through Indore, Dewas,Ujjain, Dhar and Ratlam districts of the state; it finally joins the Chambal near Kalu-Kher village (23°53' N. and 75°31'). The main tributaries of Kshipra include the Khan river near Ujjain and the Ghambir river near Mahidpur. The main course of the Kshipra lies over the grassy plains of Malwa between low banks and from Mahidpur and it is characterised by high rocky banks. The water of the Kshipra is used for drinking, industrial and lift irrigation purposes. The main land use along the river is agriculture. The basin location and key topographic and drainage details are shown in Figure 1.
Ground water irrigated area 338612 Ha
50 % of Ground water irrigated area proposed through Sprinkler 169306 Ha
No. of sprinklers proposed 6772
20% Groundwater saving by Sprinkler 135.4448 mcm

Kshipra sub basin forms a part of Malwa Plateau which experiences semi-arid climate. The average annual rainfall of Kshipra Watershed is 916.5mm. The rainfall in general has been normal except for 1992, 2000, 2005 & 2008, which is less than the normal rainfall. The Kshipra river originates from KokriBardi hills (747m a.m.s.l) in Indore district and flows towards north to join the Chambal river near village Kalakhedi (421m a.m.s.l) in Ratlam district (Fig- ). Total length of Kshipra River is about 195 Km, its total Water shed area is about 5385 Sq.km.
Kshipra sub basin is underlain by hard rock formation consisting mainly of basalt and it shows high relief (Fig-3). The southern part shows higher elevation of more than 575 mamsl (metres above mean sea level) and it decreases to less than 450 mamsl in the northern most part of the sub basin near confluence of Kshipra with Chambalriver. Sub basin is broadly divided into three water sheds of Kshipra (2876 sq km),Gambhir (1606 sq km) and Khan (903 sq km) rivers. Average slope in the area is 1.15 m/km.
Earlier surface water supply of Indore city was fromBilawai&YashwantSagar tanks with surface water supply 1.98 & 8.37 MGD respectively. The need has grown up with increasing population necessiting the need for inter basin transfer of water of 39.6 MGDfrom the Narmada river.Dewas city has started getting water of Narmada river directly by private sector water supply.
7.2 Kshipra river - Status
Kshiprariver had been a perennial river from the beginning, however, to augment the flows in the river a barrage with collapsible gates was constructed prior to 1912 by the King of Gwalior and thereafter four more barrages were constructed along Kshipra River in and around Ujjain city.

Water supply of Ujjain city started as early as in year 1912 by lifting water from the river Kshipra from Infiltration gallery by using steam engine pump and 1 MGD raw water was supplied to town. Simultaneously, till 1952, six barrages were constructed along the Kshipra River with storage capacities from 0.15 to 1.5 MCM for a water supply of approximately 5 MGD. During the drought year 1965 Undasaa reservoir was constructed to augment water demand and additional water demand was met from Sahebkhedi irrigation tank located on tributary of Shipra during 1986-87. Later a dam was constructed on Gambhir River in 1992 to have additional 12 MGD of water.
As reported in “Hydrogeology in Upper catchment of Kshipra river in parts of Indore, Dewas and Ujjain”,Kshipra river used to be perennial till 1996 and thereafter, the river flow reportedly reduced progressively. At present, the river remains dry in stretches for a period of 6 to 7 monthsi.e from November onwards.
Initially drinking water supply requirements were reportedly met from the ground water resources withdrawn from dug wells and ever first Infiltration Gallery to tap the ground water, which was constructed in Kshipra riverbed at Gaughat having discharge of 1 MGD. With declining of water table, first borehole was drilled in year 1965 to further augment the water supply. Municipal Corporation constructed 200 boreholes and 78 hand pumps for water supply to Ujjain city. In addition, the individuals, to fulfill day-to-day water requirements have constructed more than 1500 bore wells. Out of total water supply to the city 3.20, 0.01 and 1.27 MGD is being supplied through tube wells, hand pumps and dug wells respectively.
In the Kshipra sub basin area, especially central parts around Ujjain, ground water has been important source for irrigation as well as domestic purpose since historical past. During 1950-51 the area irrigated by ground water was 9600 ha, which increased to 21000 ha in year 1990-91 and further it reached a figure of 1,39,168 ha by 2006-07.
Table : District & Block wise area covered in Kshipra Sub basin
District/ Total area
Area Km2
Block Area Km2
Indore
3898 Km2
2373
(60.95%)
1. Mhow 195 2. Indore 881 3. Depalpur 547 4. Sanwer 750
Dhar 8153Km2
16 1. Nalchha 16
Dewas 7920 Km2
484 1. Dewas 484
Ujjain
6091Km2
1982
(32.53%)
1. Bar Nagar 125 2. Ujjain 760 3. Ghatiya 58 4. Khachrod 276 5. Mahidpur 763
Ratlam 4861 Km2
530 1. Alot 530
Total 5385 Km2

7.3 Kshipra river- Present scenario Flow in Kshiprariver is still being regulated through five barrages upto Ram ghat, Ujjain.
These barrages, since it’s commissioning, are used for maintaining desired level in the river at various ghats.
During summer (April-May), river channel is transformed into a series of disconnected turbid ponds or pools of water and absence of any hydraulic connection between them renders them stagnant and polluted. After onset of monsoon that is usually month of June, these ponds are again hydraulically connected. During rainy season the low lying areas along the bank of Kshiprariver, including Ramghat, Indore gate, Railway colony, Kartikchowk, Harsidhi areas of Ujjain etc. are frequently flooded and heavily inundated.
Since 2014, 5 cumecsof Onkareshwar canal is being transferred through a pipeline upto the village Ujjaini (i.e at the origin of Kshiprariver) as and when required.
About 55 % of entire sub basin falls under net sown area. Crops are generally ground water fed, dependency being about 96%. In Ujjain, during 2012-13, land area of about
302338 ha was being irrigated through 55780 borewells and 37579 dugwells.
As per the dynamic ground water resource estimation for the year 2011, out of 12 blocks constituting the Kshipra sub basin 9 blocks have been categorized as “Over-Exploited” and remaining three fall in Semi critical category (Fig- ). Over all stage of ground water extraction is 115%.
Depth to water level map of Kshipra sub basin for the premonsoon period of 1996, 2006 and 2016 (Fig- ). Maps clearly indicate adverse changes in ground water level scenario since 1996. During the year 1996 ground water levels were mostly within 10 metres below ground level (mbgl). However, during subsequent years of 2006 and 2016 the area showing 0 to 5 mbgl water levels reduced drastically. During 2016 considerable area shows water levels varying from 10 to 20 mbgl or more than 20 mbgl.

Thus over exploitation of ground water has resulted in drastic depletion in ground water resources. This has in turn has adversely affected the natural base flows in the Kshipra sub basin.
Surface water contributes only about 4% for irrigation, which is mostly through 47 stop dams, five barrages and several unauthorized lift irrigation by farmers, along Kshipra and Gambhir rivers. It is also one of the major causes for drying up of rivers in the area.
The lower stretches of the river from north of Ujjain up to the confluence with Chambal river generally remains dry for the major part of the year due to the large number of storage structures upstream and extraction of water through Lift Irrigation as mentioned above.
Discharge of urban and Industrial effluents is often visible in the river channel up to the confluence with Chambal throughout the year.
7.4 Hydrogeological set up of Kshipra sub basin
The area forms the South western part of the Malwa Plateau, locally called “MalkiDesh" and consists of east-west trending hill ranges. The plateau in the north and northwest of Ujjain and eastern part of the area is highly broken and rugged with thin soil cover but in general whole area of watershed is almost flat plain, which is sloping towards north. The maximum relief difference in the area is about 20m and the general elevation is about 450m.
Kshipra River along with its tributaries has a number of micro watershed ranging in area from less than a sq km to more than 10 sq km. Number of micro watershed in various tributaries of Kshipra river upto the confluence of Ghambir River are tabulated below: Water bearing formation:
Hydrogeologically the area can be dived into two formations- Alluvium and Basaltic lava flows with intratrappen weathered zones/clay (red boles) occurring at various depth. Alluvium is confined to the localized area along river/streams (Kshipra and Gambhir). Weathered basalt in low topographic areas forms groundwater potential area.
Deccan Trap basalts occupy almost entire Kshipra watershed area, except narrow strip along Kshipra and Khan rivers.

Depth to Pre-Monsoon Water Level of The year 1996, 2006 & 2016
7.5 Hydrology of Kshipra Basin
Kshipra River Flow Analysis: As per report “Support to the National Water Mission NAPCC, Kshiprasubasin” stream flow analysis has been done using the month wise observed data for the period 1976-2004. For this purpose data from 2 stream flow monitoring stations at Ujjain and Mahidpur (Figure __) were available. Table-__ indicates that:
flow in Kshipra stream at Ujjain is highest during August (83.01 cumecs) which dwindles to 12.83 cumecs during October and remains almost dry November onwards.
Similarly for stream flow as observed at Mahidpur DG site highest flow is observed during August which is 160.63 cumecs. This reduces to 5.80 cumecs during November and further December onwards the discharge is negligible upto May. Since Mahidpur DG site is situated downstream of confluence of Kshipra and Gambhir rivers the stream flow showscumulative effect.

Ponds/Talabs
There are about 182 ponds in Kshipra watershed area in Indore, Ujjain&Dewas districts existing along various minor streams or in low topographic areas. Water stored in these ponds/ talabs during monsoon period is used for irrigating 429 ha area in the sub basin.
Stop dams 47 Stop dams along the Kshipra and Gambhirriver courses
have been constructed and these are generally 1 to 2 meters in height invariably with sluice gates. Water stored in these stop dams is either pumped or diverted through diversion channels for irrigation purposes. Figure - shows locations of these stop dams.
Barrages inKshipra Sub Basin
The storage capacity of various water bodies in Kshipra watershed is given in table-2.5
Table: Barrages of Kshipra Sub Basin
S.No. Name of Water Body River/streams Storage capacity (MCM) 1. Billoda Barrage Kshipra 1.021 2. Chimli Barrage Kshipra 0.169 3. Kithoda Barrage Kshipra 1.434 4. Treveni Barrage Kshipra 1-530 5. Gaughat Barrage Kshipra 1.135 6. Sahibkhedi Tank Kshipra 9-60 7. Undasa Tank Kshipra 5.28 8. Bilawali Khan 9.05 Total 29.22
7.4 Narmada KshipraSimhastha Link Project (NWDA)
Narmada KshipraSimhastha Link Project has been completed in the year 2014 to have the perennial water availability for the villages situated along the banks of Kshipra River and for maintaining required water level at ghats for holy bath of the devotees. The project costing Rs. 396.385 crores was commissioned to meet the requriements during Simhastha mela-2016. The water is lifted from Onkareshwar canal and stored at Sisliya tank and then transferred to Ujjaini through a pipeline covering a distance of about 45.5 Km. Water is transferred by four stages of pumping at a rate of 5 cumecs
Table- Annual Rainfall and storage in Kshipra river
Year Annual Rainfall (mm)
Total Storage
upto Ujjain (MCM)
1991 909.8 869.429 1992 701 61.729 1993 1258 479.229 1994 1174.7 1147.389 1995 1118 685.79 1996 1261.4 924.769 1997 1049 518.649 1998 1020.3 481.909 1999 958.8 371.069 2000 516.5 86.929 2001 585.5 175.159 2002 903.3 241.889 2003 999.4 430.979

7.5 Groundwater Problems and issues The sub basin has several issues related to groundwater such as: Since 96 % of the water requirement for irrigation is met by ground water, there is severe
stress on ground water resources. Out of 12 blocks constituting the Kshipra sub basin 9 blocks have been categorized as “Over-
Exploited” and remaining three fall in Semi critical category. Over all stage of ground water extraction is 115%. The temporal analysis of depth to water levels from 1996 to 2016 also indicates major changes in ground water regime. Earlier water levels were between 2 and 10 mbgl which has gone down beyond10 mbgl in some parts of the area in last 20 years. Overall depletion of ground water resources is evident from the ground water level data as well as stage of ground water extraction. This has resulted in reduction of base flows. Since base flow was the main source of water in rivers during lean season, the rivers normally dry up during lean period or carry minimal flow.
Erratic rainfall pattern and reduced storage capacity of water bodies due to siltation has resulted in diminishing surface water resources.
Polluted stream water with untreated urban and industrial wastewater. Inadequate interaction among supply and demand side initiatives and lack of decision making
at basin level. inadequate knowledge-base and awareness at grass root level.
7.6 Inventions suggested to enhance base flows in Kshipra sub basin
1 Rejuvenation of the dry stretches of the river will require Enhancement of water-storage in the watershed. Enhance the base-flow into the river through suitable artificial recharge and water
conservation structures in the watershed. Regulation of direct pumping from the river during Rabi season.
2 Management interventions may be required to achieve the objectives . Notification of the river stretch between Dewas and Ujjain for regulation of direct pumping
from the river Kshipra for irrigation. Restoration and rejuvenation of the large number of defunct water bodies existing in the
watershed. Construction of suitable water conservation/ artificial recharge structures in the watershed to
replenish the ground water resources and to reduce soil erosion and enhance the base flow in the river.
Planting trees to increase vegetation cover; this is a sustainable solution for restoring the eco-system of the basin area.
Community /People participation is required for protecting the river and motivate them towards participating in protection and conservation of this Holy River .


7.7 Proposed Recharge Plan
District Area Suitable for AR
Volume of Surface Water available for AR
Volume of Water required for recharge
Proportionate Surface water for planning AR
Percolation Tanks
Recharge trench
NB/ CD/ CP Recharge shaft/ Tube
well
Step recharge trench
subsurface dyke
Renovation of Village
Ponds
Total Cost of RS in crores
Sq km mcm mcm
structure cost
structure cost
structure cost
structure cost
structure cost
structure cost
structure cost
Nos (crores) Nos
(crores) Nos
(crores) Nos
(crores) Nos
(crores) Nos
(crores) Nos
(crores)
Mhow 188 43.24 4.25068 12.972 6 1.2 3 0.018 39 3.9 26 1.3 24 0.144 5 0.07 14 0.28 6.912
Indore 881 202.6
3 86.7080
2 60.789 26 5.2 15 0.09 182 18.2 122 6.1 104 0.624 8 0.112 69 1.38 31.706
Depalpur 537 123.5
1 11.5702 37.053 16 3.2 9 0.054 111 11.1 74 3.7 64 0.384 9 0.126 53 1.06 19.624 Sanwer 750 172.5 87.381 51.75 22 4.4 13 0.078 155 15.5 175 8.75 88 0.528 6 0.084 79 1.58 30.92
Nalcha 16 3.68 1.69388
8 1.104 0 0 0 0 3 0.3 2 0.1 0 0 0 0 4 0.08 0.48
Dewas 484 111.3
2 43.6442
2 33.396 14 2.8 8 0.048 100 10 67 3.35 56 0.336 8 0.112 106 2.12 18.766
Barnager 125 28.75 23.3082
5 8.625 4 0.8 2 0.012 26 2.6 17 0.85 16 0.096 7 0.098 29 0.58 5.036 Ujjain 760 174.8 81.8748 52.44 22 4.4 13 0.078 157 15.7 105 5.25 88 0.528 14 0.196 131 2.62 28.772
Ghatiya 58 13.34 6.80374
8 4.002 2 0.4 1 0.006 12 1.2 8 0.4 8 0.048 3 0.042 12 0.24 2.336
Khachord 276 63.48 13.5819
6 19.044 8 1.6 5 0.03 57 5.7 38 1.9 32 0.192 3 0.042 47 0.94 10.404
Mahidpur 763 175.4
9 69.4116
4 52.647 23 4.6 13 0.078 158 15.8 105 5.25 92 0.552 10 0.14 513 10.26 36.68 A lot 530 121.9 88.1125 36.57 16 3.2 9 0.054 110 11 73 3.65 64 0.384 6 0.084 61 1.22 19.592
TOTAL 5368 656.8
8 235.248 197.06
4 84 31.8 91 0.546 590 111 741 40.6 636 3.816 79 1.106 1118 22.36 211.22
8


8. Work Done by CGWB in Kshipra basin a) Recharge shaft construction for groundwater recharge to deep aquifers has been
carried out in the Kshipra watershed in district Ujjain. The depth of bore wells drilled in the area range between 142 mbgl (Gaughat) to
203.35 mbgl (Kendriya Colony). Discharge ranges from 2.69 lps (Indira Nagar) to 8.0 lps (Budhwaria&mahashaktinager) with
specific capacity ranging from 2.02 to 154.18 lpm/ m drawdown.
b) Artificial Recharge & Water conservation of Narwar Micro watershed,Block Ujjain, Ujjain district The area of Ujjain block (895 Km2) lies in the catchment of Kshipra River Watershed in Malwa
Plateau is an Overexploited block with stage of Groundwater development -139.81% Average annual rainfall of Ujjain is 934.10mm in 42 rainy days. The irrigation and domestic water supply in the watershed are dependent on groundwater only. The ground water development is not uniform throughout the watershed.
Groundwater recharging measures- There is an alarming need of Groundwater recharging measures for sustainability of ground water regime and maintain some minimum flow in the stream course. A combination of supply and demand measures have been planned in Narwar micro watershed recharge scheme based Hydro geologically sound approach and Engineering aspects.
Planning: 37- Recharge and water conservation structures are proposed to construct in the area of 90.95 Km² of Narwar watersheds covering 15 villages. The proposed recharge scheme for implementation comprises structure of: Percolation tank (PT-1), Recharge trench (RT-1) stop dam (SD-03), Recharge shaft (RS-19),Gabion (GB-06),Subsurface dyke (SSD-4). Step recharge trench ( SRT-02).
Estimated cost of Artificial & water conservation-Estimated cost of recharge scheme of Narwar watershed for implementation and impact assessment is Rs 167.38 lakhs as per M.P.WRD,PWD & PHED USOR year 2009.
Estimated impact: Storage capacity of structures of recharge scheme which are proposed to construct, varies from 7500 m3/year to 9900 m3/year. The total estimated quantum of recharge volume is about 503469 m3/year.
