ugo leonardi f.a.o. land cover/remote sensing specialist [email protected]
TRANSCRIPT


On November 2008, in the GLCN office at the Istituto Agronomico per l’Oltremare
(Florence, Italy), the Senegal Accuracy Assessment was carried out under the
supervision of the F.A.O. Senior Mapping Expert, Mr. Antonio Di Gregorio. For this task
the GeoMAP (Mapping Accuracy Programme, http://www.geovis.net/) software was
used. It is a dedicated software specifically created to perform the accuracy
assessment of a LCCS database.
The software extracts randomly the polygons (single units, NOT mixed units) to be
checked. They are extracted according to a given area, the frequency of the classes
present in the original shapefile and the minimum amount of classes for each stratum
(class of group of classes) needed.
In the example given in the next slides, to evaluate the land cover mapping accuracy,
the high resolution imagery available with Google Earth freeware were used as base
images.
Senegal Accuracy Assessment & Statistical Report

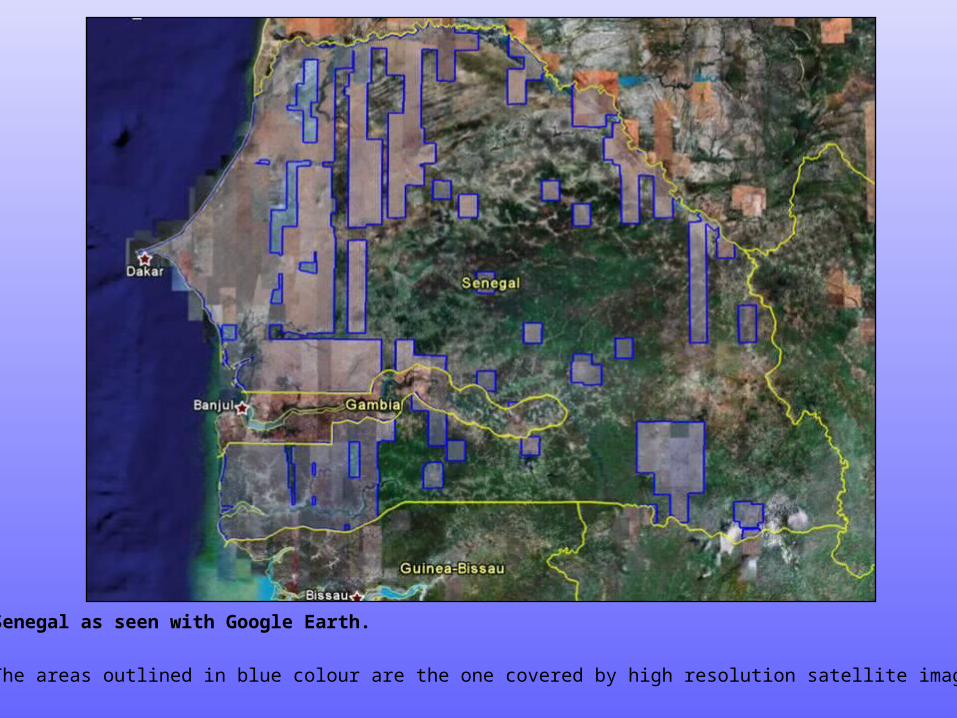
Senegal as seen with Google Earth.
The areas outlined in blue colour are the one covered by high resolution satellite images.

In blue are shown the polygons extracted for the accuracy assessment. They fall inside area covered by high resolution images.

Example of correct photo-interpretation.
On the Left figure the polygon is checked and evaluated with the GeoMAP software; in this case the code (1H-p+A = Small Rainfed Herbaceous crops with a layer of Sparse Trees) is correct as can be seen on the right figure, where the polygon to be checked is visualized on a Google Earth high resolution image. So clicking on the “Correct” key of the GeoMAP window, the assessment of the polygon is finalized.

Example of partially correct photo-interpretation.
On the left figure, the polygon is checked and evaluated with the GeoMAP software. A portion of the polygon is not correct, as it is shown on the right figure, where the polygon to be checked is visualized on a Google Earth high resolution image.
Clicking on the “Split” key of the GeoMAP window one new window pops up; on this latter window (the one with the red polygon in the left figure) is possible to cut the polygon with the “Split polygon” tool, separating the correct portion from the wrong one. The correct portion keeps the original code while to the wrong portion is given the code of the corresponding class.

Example of wrong photo-interpretation.
On the Left figure, the polygon is checked and evaluated with the GeoMAP software. In this example the original polygon’s code (2arTOE = Very Open Shrubs with emergent Trees) is wrong, as can be seen on the right figure, where the same polygon is visualized on a Google Earth high resolution image.
Clicking on the “Wrong” key of the GeoMAP window a bar with all the classes of the legend pops up. From the bar is selected the correct class which is given to the polygon checked.

The GeoMAP software stores all the data coming from the accuracy assessment work, in order to
calculate statistics for each polygon checked. The results are summarized according to two
different approaches: a Map approach and a Surface approach.
In the Map approach the polygon is the accuracy’s unit of measurement, while in the Surface
approach the area checked is the accuracy’s unit of measurement, i.e. in the Map approach a
polygon with a bad delineation is considered wrong, even if only a portion of it is wrong; on the
reverse, the Surface approach takes into account also the right portion of polygon with a not
precise delineation.
Red (surface accuracy based on ratio between correct and total surface checked) =
percentage of correct area against the total area checked; in this case the total amount
of correct surface is taken into consideration, also the portion of correct area of
polygons with a not precise delineation.
The average value for the classes checked is 92,9%
The below percentages have the following meaning:
Blue (map accuracy based on number of fully correct polygons) = percentage of
correct polygons against the total amount of polygons checked.
The average value for the classes checked is 82,3%
Green (map accuracy based on number of fully correct polygons) = percentage of
polygons’ correct area against the total polygon’s area checked; in this case, even
if a portion of the polygon has a correct interpretation, the area of the whole
polygon is considered wrong.
The average value for the classes checked is 88,3%

MAP softaware also generate a confusion matrix reporting information about Omission/Commission errors, allowing to understand in which direction errors stremed in.

For this reason a further revision of the land cover interpretation was carried
out in November 2008. Particular attention was given to all the classes
showing low accuracy, and a specific check was done for classes N.18 and
N.28. At the end of the final revision, an additional accuracy assessment was
performed specifically for the two classes quoted above, with the following
result:
The classes N.18 (Herbaceous Closed to Open Vegetation ) and N.28
(Closed to Open Medium Tall Herbaceous Vegetation On Temporarily
Flooded Land ) show a low general accuracy.