ugc minor research project - hncc...
TRANSCRIPT
UGC MINOR RESEARCH PROJECT
File No.23-1374/09 (WRO)
24th February 2010
A Study of Socio Economic Conditions among Bidi
Workers in Solapur
Asso.Professor: Dr.Pankaj V. Dolas Hirachand Nemchand College of
Commerce Solapur.
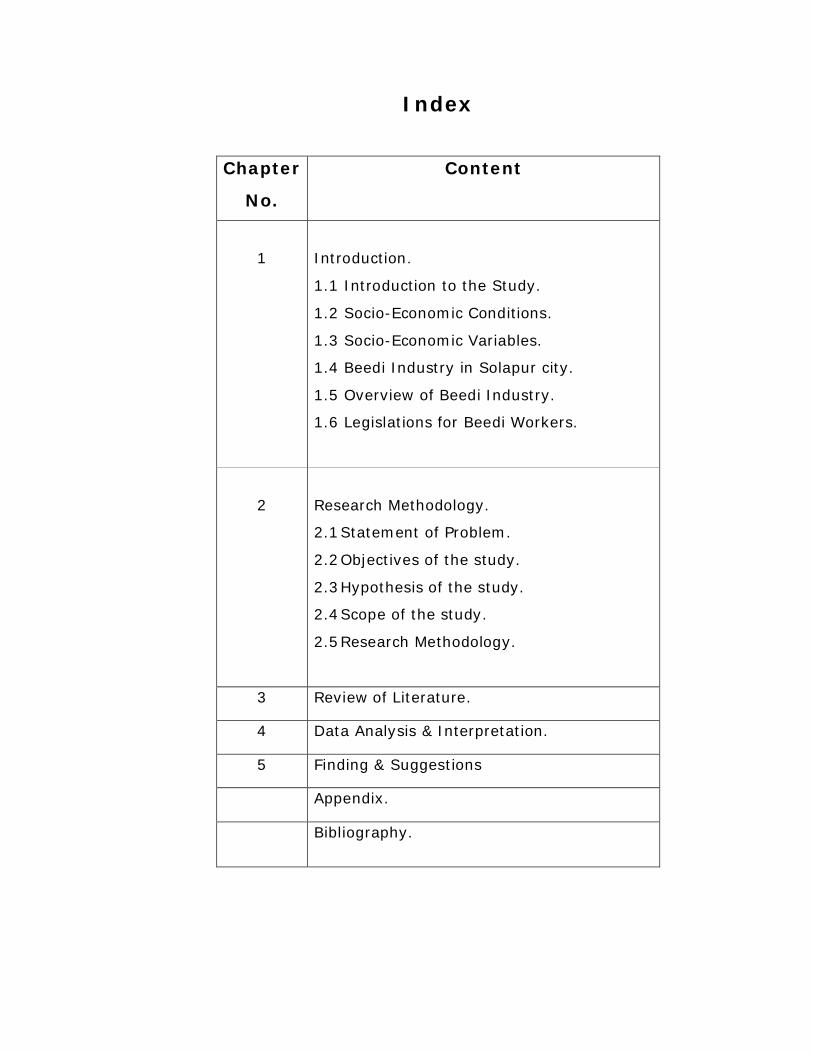
Index
Chapter
No.
Content
1
Introduction.
1.1 Introduction to the Study.
1.2 Socio-Economic Conditions.
1.3 Socio-Economic Variables.
1.4 Beedi Industry in Solapur city.
1.5 Overview of Beedi Industry.
1.6 Legislations for Beedi Workers.
2
Research Methodology.
2.1 Statement of Problem.
2.2 Objectives of the study.
2.3 Hypothesis of the study.
2.4 Scope of the study.
2.5 Research Methodology.
3 Review of Literature.
4 Data Analysis & Interpretation.
5 Finding & Suggestions
Appendix.
Bibliography.
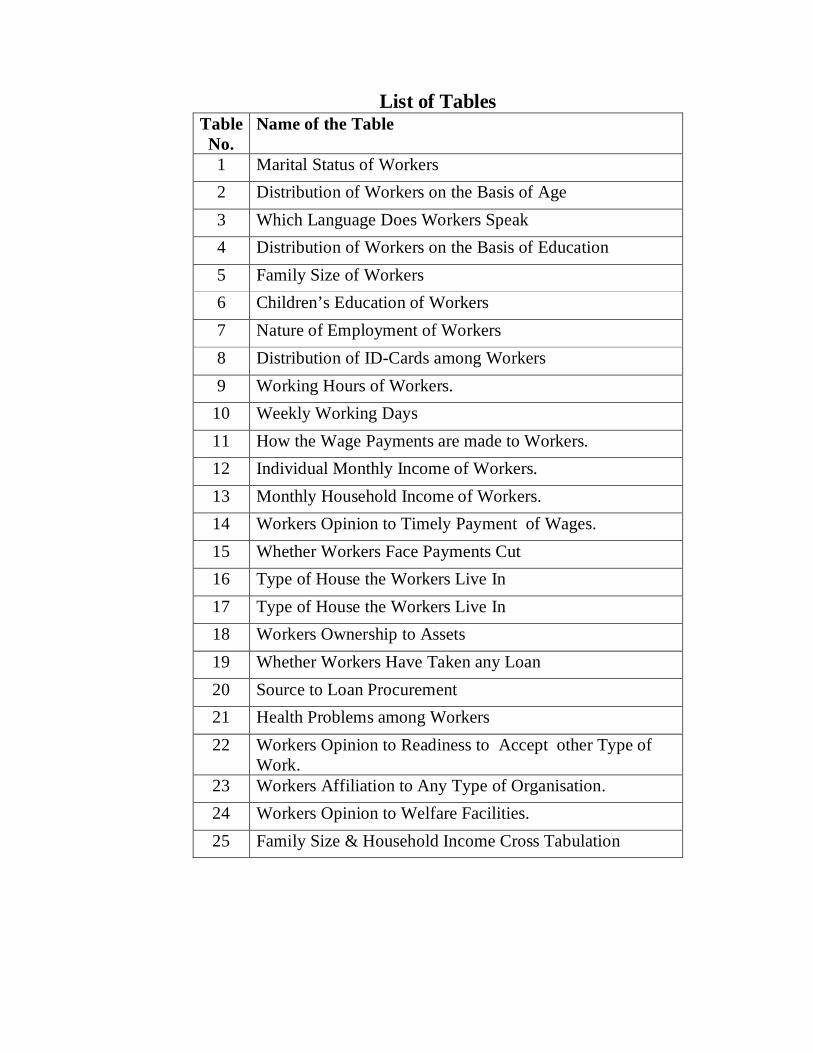
List of Tables Table No.
Name of the Table
1 Marital Status of Workers 2 Distribution of Workers on the Basis of Age 3 Which Language Does Workers Speak 4 Distribution of Workers on the Basis of Education 5 Family Size of Workers 6 Children’s Education of Workers 7 Nature of Employment of Workers 8 Distribution of ID-Cards among Workers 9 Working Hours of Workers.
10 Weekly Working Days 11 How the Wage Payments are made to Workers. 12 Individual Monthly Income of Workers. 13 Monthly Household Income of Workers. 14 Workers Opinion to Timely Payment of Wages. 15 Whether Workers Face Payments Cut 16 Type of House the Workers Live In 17 Type of House the Workers Live In 18 Workers Ownership to Assets 19 Whether Workers Have Taken any Loan 20 Source to Loan Procurement 21 Health Problems among Workers 22 Workers Opinion to Readiness to Accept other Type of
Work. 23 Workers Affiliation to Any Type of Organisation. 24 Workers Opinion to Welfare Facilities. 25 Family Size & Household Income Cross Tabulation
Introduction
1.1 Introduction to the study. Beedi rolling is one of the major informal sector activities in India. The
government of India estimates that there are about 4.4 million workers in this industry.
The majority are home based workers who live below the poverty line (BPL). Beedi is a
kind of little cigarette, made of tendu leaves (instead of paper) and tobacco. According to
conservative estimate more than 6 million persons are engaged in Beedi making
processing and allied work. Beedi workers are vulnerable segments of the country’s
labour force which has increased involvement of women and child labour in Beedi
rolling activities. The condition of Beedi workers at present as well as in the past have
not been not very conducive. The making of the Beedi is an industry that is widely
spread over the country. Hence there is a need to improve the living and working
conditions, as well as to promote decent employment and income opportunities for
women Beedi rollers.
Informal sector workers are generally not represented in the institutions and
organizations of the labour movement. The main concentration of Beedi workers are
engaged in tobacco industry. The Parliamentary standing committee on subordinate
legislation (1990) says that 20 million labours and 6 million farmers are engaged in
cultivation of tobacco. The size of the unorganized sector indicates its importance as a
major force both economically and politically. Additionally the unorganized sector is a
major contributor to the gross national product of the country contributing about 63
percent of the country’s national income in 1994 – 95. These numbers point to the urgent
need to deal with issues of social security of these workers and producers.
Historically, the system of social security in India, as elsewhere was started with
the organized sector. The first social security legislation was the workmen’s
compensation Act, 1923. The size of the unorganized sector has been growing over the
last few decades. In 1971 the unorganized sector comprised 89 percent of the workforce,
whereas in 1995 it was 92.5 percent. This increase is the result both of (casulisation) of
the existing organized sector workers and lack of growth of employment opportunities
within the organized sector employment, with 96 percent of all female worker being in
this sector.
1.2 Socio-Economic conditions.
Socioeconomic environment refers to a wide range of interrelated and diverse
aspects and variables relating to or involving a combination of social and economic
factors. These aspects and variables could, in general, be categorized into several
categories including, economic, demographic, public services, fiscal and social. Socio
economic is an important determinant of the livelihoods as it influences levels of
knowledge, skills and income conditions which means for their living. Socioeconomic
status (SES) is an economic and sociological combined total measure of a person’s work
experience and of family’s economic and social position relative to others, based on
income, education and occupation. The household income, earners education, and
occupation are examined as well as combined income, versus with an individual, when
their own attributes are assessed.
Socioeconomic status is typically broken into three categories, high SES, middle
SES, and low SES to describe the three areas of a family. Placing a family into one of
these categories any or all of the three variables ( Income, education and occupation ) has
assessed.
1.3 Socio-economic Variables and Their Empirical Measurements Used
Sex : The respondents were differentiated on the bases of Gender classification.
Typically, two gender classifications were made. (1) Male and (2) Female.
Marital Status: The concept of marital status applies to the conjugal arrangements of a
person. It includes persons who are living together as husband and wife, regardless of
whether they are legally married or in a common law relationship. The scores were (1)
Married, (2) Un-married, (3) Widow.
Age : Age refers to the number of years the respondent lived since birth at the time of
interview and was rounded to the nearest whole number. In the present study, the number
of years rounded to the nearest whole number the respondent lived since birth at the time
of interview was taken as a measure of age. The community was classified into four age
groups. Age group of the respondents in the present study were: (1) Below 20 Yrs. (2) 20
to 40 Yrs. (3) 40 to 60 Yrs. (4) Above 60Yrs.
Education : Economic status of an individual is influenced by his or her education level.
The world map of illiteracy closely coincides with the maps of poverty, malnutrition, ill
health, high infant and child mortality rates. Studies indicate that education, to some
extent, compensates the effects of poverty. To quantify the educational status of the
respondents, the scoring system followed by (Pareek and Trivedi, 1964) in their Socio-
economic Status Scale Rural was used. The scoring was as follows: (0) Illiterate, (1)
Primary, (2) Below 10th std., (3) Below 12th Std., (4) Graduation.
Income : Income strongly correlated to socio economic conditions. Greater wealth
allows a household to maintain its standard of living when income falls due to job loss or
health problems (Council of Economic Advisers for the President’s Initiative on Race
1998). In the present study, the procedure of collecting information on income of the
respondent or respondent’s family in per month was followed: (1): (Less than 1000/-),
(2) : (Rs: 1001/- to 2000/-), (3) : (Rs 2000 to Rs. 3000/-), (4): More then 3000.
Assets holding : The type of assets a person own in this family is termed as asset
holding. The holdings were (A) Land, (B) House (C) Any other.
House type : The possession of a house and the nature of the house are important
indicators of socio-economic status. The scores were for (1) Slab, (2) Tin/Asbestos, (3)
Kavelu, (4) Mud/Grass.
Family type : It refers to whether there is single or joint family system and number of
members in the respondent’s family. A family was considered as single when the person
lives alone. It consisted of husband, wife, is two and so on. In Socio-Economic Status
Scale to quantify the family type of the respondents the scores were for ( 0 ) Single, (1)
Two members, (2) Three members, (3) Four members, (4) More then four members.
Employment category : It refers whether the worker is employed in and organised
undertaking where he does his job. The other is Un-organised where the worker performs
things from home through contractors. The scores are (1) Organised, (2) Unorganised.
1.4 Overview of Solapur city. Solapur city the area under Solapur Municipal Corporation both existing as well as
newly expanse for a special area under Solapur municipal corporation and covers only
the air phase of environment in solapur city Solapur is an important district head quarter
in western Maharashtra and in famous for its bed sheet weaving industry (chadder)
Handlooms power looms and Bidi rolling industries. The textile products, especially, the
chadders and handlooms manufactured in Solapur have a great demand in abroad and
product is those are exported to several countries.
Solapur city, a district head quarter, is geographically located between 17.15
degrees east longitude the city is situated in the south east fringe of Maharashtra state
and lies in the Bhima and Sina river basins and it is drained either by Bhima river or its
tributaries Climatically the entire district Solapur city comes under rain shadow area, but
rainfall is uncertain and scanty. The monsoon period is from second fortnight of June to
end September bringing rains from south west monsoon. It adversely affects the on
socio- economic condition of peoples. The population of Solapur city is 12, 00,000, and
the area is about 180 sq kms. There are about 4783 industries in Solapur district and the
major industries in Solapur are textile, oil mills, bidi factories & sugar factories.
1.5 Overview of the Beedi Industry
Beedi manufacturing on a commercial basis is about a century old, although
beedi making for own consumption must have been practiced even earlier. Till today, the
range of beedi manufacturing varies from individual, self-employed beedi workers (who
operate and even market beedis locally) to the large branded beedi companies. Given its
labour intensive nature of work, large numbers of men, women and children have been
involved in making beedis.
A majority of the workforce is employed in the process of beedi rolling. It is this task
which is subcontracted under different systems and undertaken at home. The three point
systems under which production of beedis is organised – factory, outwork and
contractual systems.
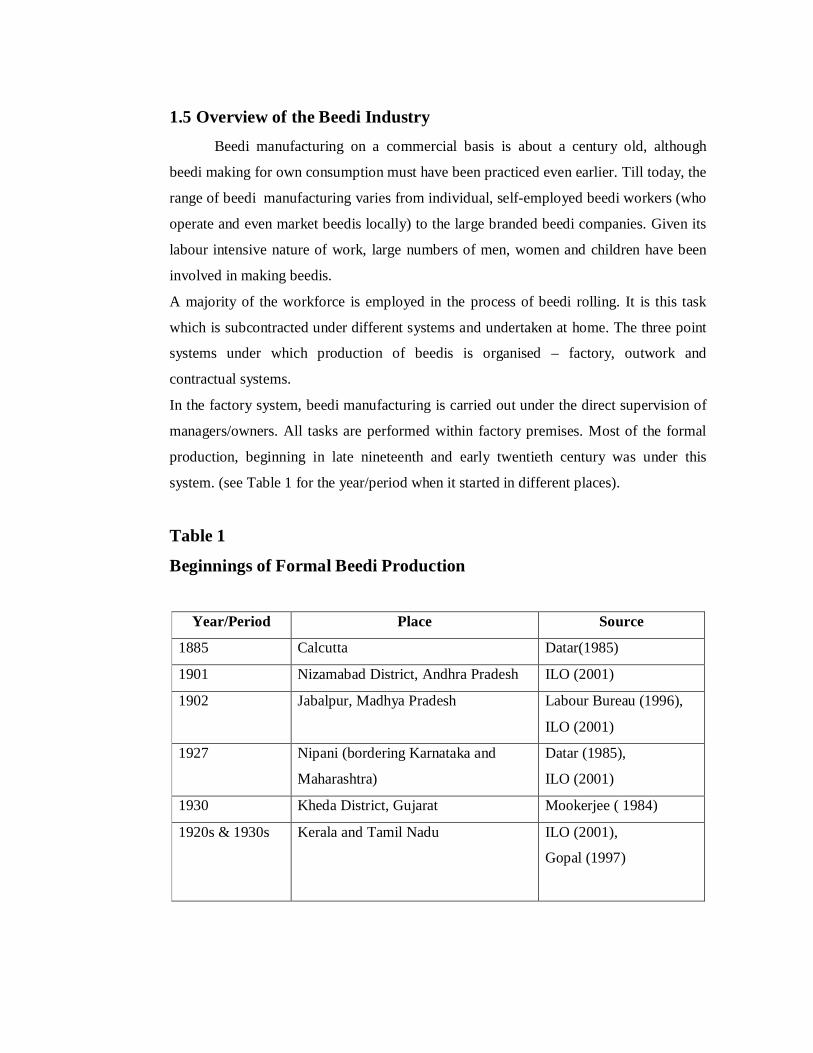
In the factory system, beedi manufacturing is carried out under the direct supervision of
managers/owners. All tasks are performed within factory premises. Most of the formal
production, beginning in late nineteenth and early twentieth century was under this
system. (see Table 1 for the year/period when it started in different places).
Table 1
Beginnings of Formal Beedi Production
Year/Period Place Source
1885 Calcutta Datar(1985)
1901 Nizamabad District, Andhra Pradesh ILO (2001)
1902 Jabalpur, Madhya Pradesh Labour Bureau (1996),
ILO (2001)
1927 Nipani (bordering Karnataka and
Maharashtra)
Datar (1985),
ILO (2001)
1930 Kheda District, Gujarat Mookerjee ( 1984)
1920s & 1930s Kerala and Tamil Nadu ILO (2001),
Gopal (1997)
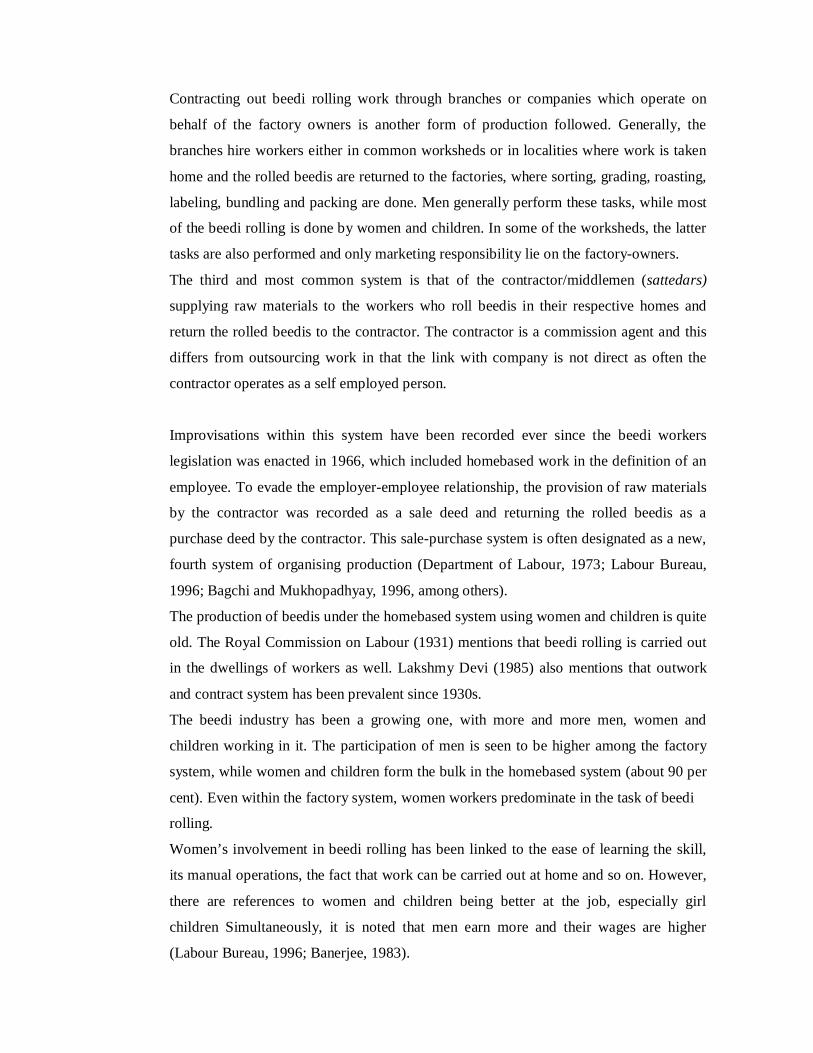
Contracting out beedi rolling work through branches or companies which operate on
behalf of the factory owners is another form of production followed. Generally, the
branches hire workers either in common worksheds or in localities where work is taken
home and the rolled beedis are returned to the factories, where sorting, grading, roasting,
labeling, bundling and packing are done. Men generally perform these tasks, while most
of the beedi rolling is done by women and children. In some of the worksheds, the latter
tasks are also performed and only marketing responsibility lie on the factory-owners.
The third and most common system is that of the contractor/middlemen (sattedars)
supplying raw materials to the workers who roll beedis in their respective homes and
return the rolled beedis to the contractor. The contractor is a commission agent and this
differs from outsourcing work in that the link with company is not direct as often the
contractor operates as a self employed person.
Improvisations within this system have been recorded ever since the beedi workers
legislation was enacted in 1966, which included homebased work in the definition of an
employee. To evade the employer-employee relationship, the provision of raw materials
by the contractor was recorded as a sale deed and returning the rolled beedis as a
purchase deed by the contractor. This sale-purchase system is often designated as a new,
fourth system of organising production (Department of Labour, 1973; Labour Bureau,
1996; Bagchi and Mukhopadhyay, 1996, among others).
The production of beedis under the homebased system using women and children is quite
old. The Royal Commission on Labour (1931) mentions that beedi rolling is carried out
in the dwellings of workers as well. Lakshmy Devi (1985) also mentions that outwork
and contract system has been prevalent since 1930s.
The beedi industry has been a growing one, with more and more men, women and
children working in it. The participation of men is seen to be higher among the factory
system, while women and children form the bulk in the homebased system (about 90 per
cent). Even within the factory system, women workers predominate in the task of beedi
rolling.
Women’s involvement in beedi rolling has been linked to the ease of learning the skill,
its manual operations, the fact that work can be carried out at home and so on. However,
there are references to women and children being better at the job, especially girl
children Simultaneously, it is noted that men earn more and their wages are higher
(Labour Bureau, 1996; Banerjee, 1983).
Bagchi and Mukhopadhyay (1996) find patriarchy at work, in addition to the illiteracy
and ignorance among women which allows for their exploitation.
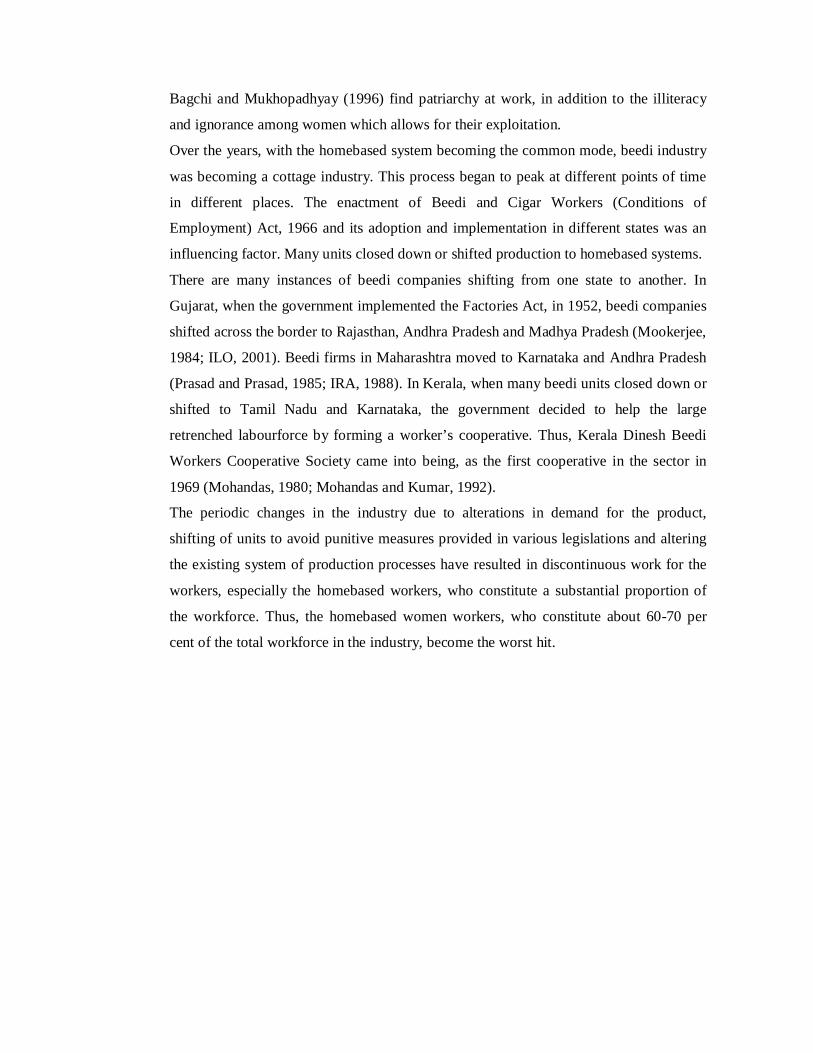
Over the years, with the homebased system becoming the common mode, beedi industry
was becoming a cottage industry. This process began to peak at different points of time
in different places. The enactment of Beedi and Cigar Workers (Conditions of
Employment) Act, 1966 and its adoption and implementation in different states was an
influencing factor. Many units closed down or shifted production to homebased systems.
There are many instances of beedi companies shifting from one state to another. In
Gujarat, when the government implemented the Factories Act, in 1952, beedi companies
shifted across the border to Rajasthan, Andhra Pradesh and Madhya Pradesh (Mookerjee,
1984; ILO, 2001). Beedi firms in Maharashtra moved to Karnataka and Andhra Pradesh
(Prasad and Prasad, 1985; IRA, 1988). In Kerala, when many beedi units closed down or
shifted to Tamil Nadu and Karnataka, the government decided to help the large
retrenched labourforce by forming a worker’s cooperative. Thus, Kerala Dinesh Beedi
Workers Cooperative Society came into being, as the first cooperative in the sector in
1969 (Mohandas, 1980; Mohandas and Kumar, 1992).
The periodic changes in the industry due to alterations in demand for the product,
shifting of units to avoid punitive measures provided in various legislations and altering
the existing system of production processes have resulted in discontinuous work for the
workers, especially the homebased workers, who constitute a substantial proportion of
the workforce. Thus, the homebased women workers, who constitute about 60-70 per
cent of the total workforce in the industry, become the worst hit.
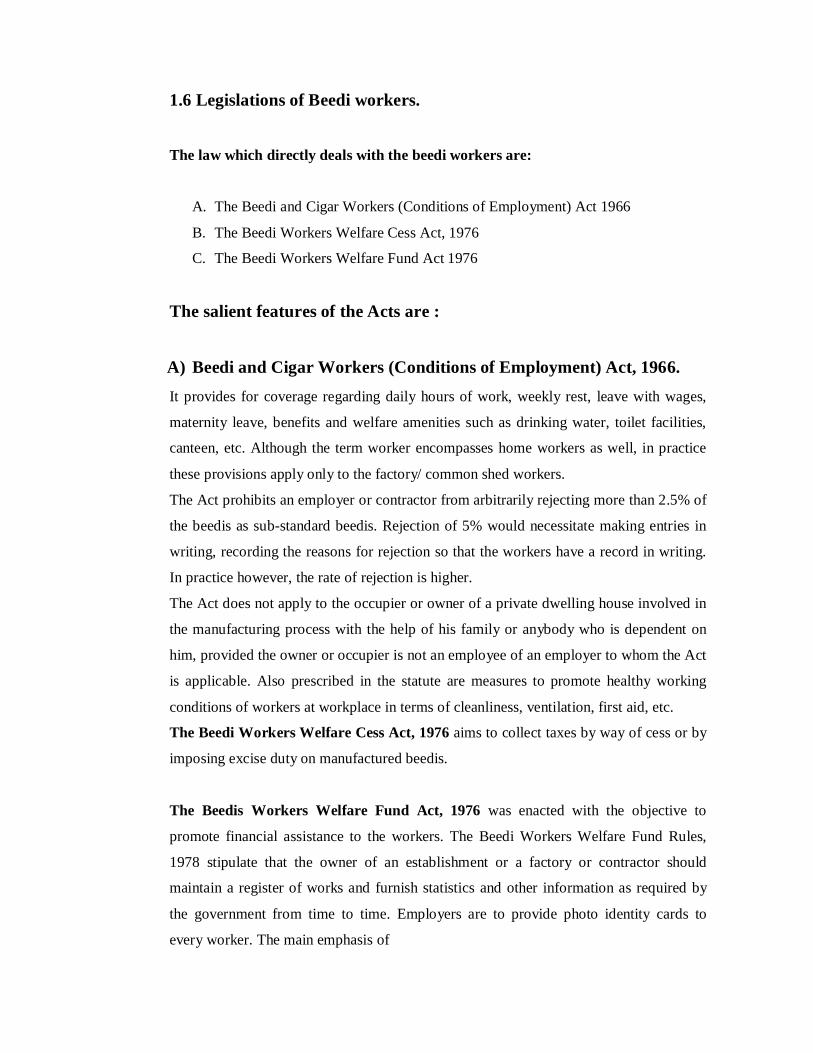
1.6 Legislations of Beedi workers.
The law which directly deals with the beedi workers are:
A. The Beedi and Cigar Workers (Conditions of Employment) Act 1966
B. The Beedi Workers Welfare Cess Act, 1976
C. The Beedi Workers Welfare Fund Act 1976
The salient features of the Acts are :
A) Beedi and Cigar Workers (Conditions of Employment) Act, 1966. It provides for coverage regarding daily hours of work, weekly rest, leave with wages,
maternity leave, benefits and welfare amenities such as drinking water, toilet facilities,
canteen, etc. Although the term worker encompasses home workers as well, in practice
these provisions apply only to the factory/ common shed workers.
The Act prohibits an employer or contractor from arbitrarily rejecting more than 2.5% of
the beedis as sub-standard beedis. Rejection of 5% would necessitate making entries in
writing, recording the reasons for rejection so that the workers have a record in writing.
In practice however, the rate of rejection is higher.
The Act does not apply to the occupier or owner of a private dwelling house involved in
the manufacturing process with the help of his family or anybody who is dependent on
him, provided the owner or occupier is not an employee of an employer to whom the Act
is applicable. Also prescribed in the statute are measures to promote healthy working
conditions of workers at workplace in terms of cleanliness, ventilation, first aid, etc.
The Beedi Workers Welfare Cess Act, 1976 aims to collect taxes by way of cess or by
imposing excise duty on manufactured beedis.
The Beedis Workers Welfare Fund Act, 1976 was enacted with the objective to
promote financial assistance to the workers. The Beedi Workers Welfare Fund Rules,
1978 stipulate that the owner of an establishment or a factory or contractor should
maintain a register of works and furnish statistics and other information as required by
the government from time to time. Employers are to provide photo identity cards to
every worker. The main emphasis of
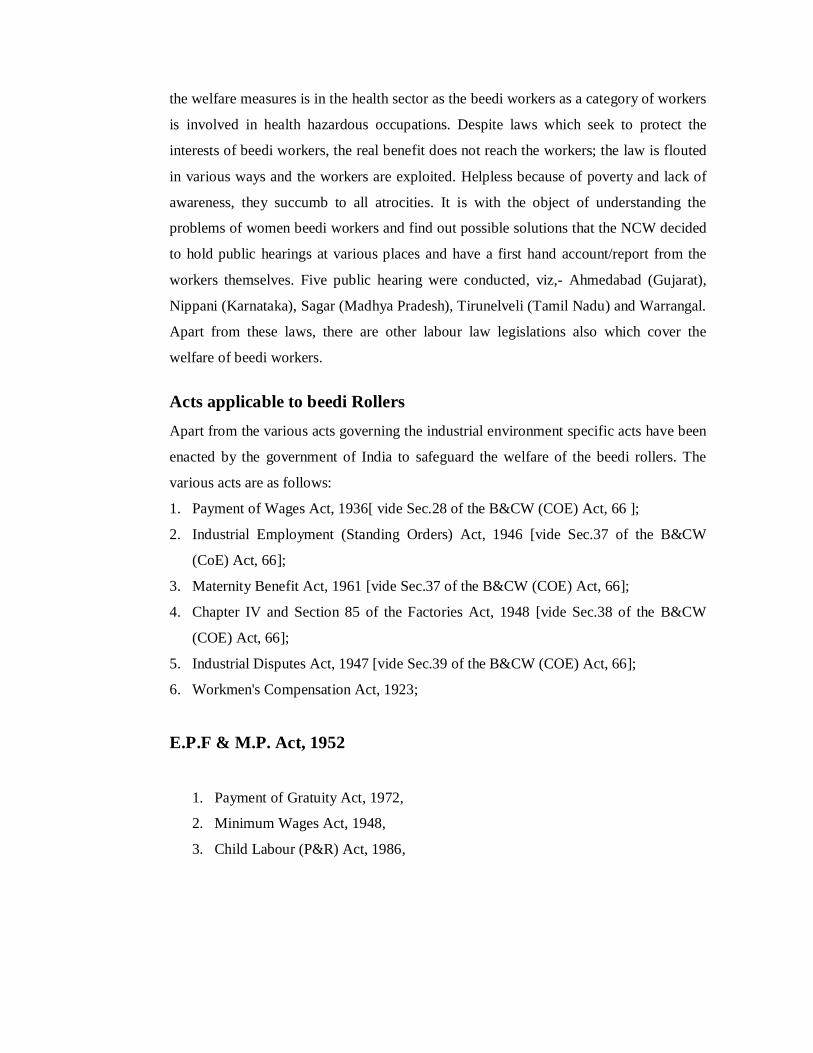
the welfare measures is in the health sector as the beedi workers as a category of workers
is involved in health hazardous occupations. Despite laws which seek to protect the
interests of beedi workers, the real benefit does not reach the workers; the law is flouted
in various ways and the workers are exploited. Helpless because of poverty and lack of
awareness, they succumb to all atrocities. It is with the object of understanding the
problems of women beedi workers and find out possible solutions that the NCW decided
to hold public hearings at various places and have a first hand account/report from the
workers themselves. Five public hearing were conducted, viz,- Ahmedabad (Gujarat),
Nippani (Karnataka), Sagar (Madhya Pradesh), Tirunelveli (Tamil Nadu) and Warrangal.
Apart from these laws, there are other labour law legislations also which cover the
welfare of beedi workers.
Acts applicable to beedi Rollers Apart from the various acts governing the industrial environment specific acts have been
enacted by the government of India to safeguard the welfare of the beedi rollers. The
various acts are as follows:
1. Payment of Wages Act, 1936[ vide Sec.28 of the B&CW (COE) Act, 66 ];
2. Industrial Employment (Standing Orders) Act, 1946 [vide Sec.37 of the B&CW
(CoE) Act, 66];
3. Maternity Benefit Act, 1961 [vide Sec.37 of the B&CW (COE) Act, 66];
4. Chapter IV and Section 85 of the Factories Act, 1948 [vide Sec.38 of the B&CW
(COE) Act, 66];
5. Industrial Disputes Act, 1947 [vide Sec.39 of the B&CW (COE) Act, 66];
6. Workmen's Compensation Act, 1923;
E.P.F & M.P. Act, 1952
1. Payment of Gratuity Act, 1972,
2. Minimum Wages Act, 1948,
3. Child Labour (P&R) Act, 1986,
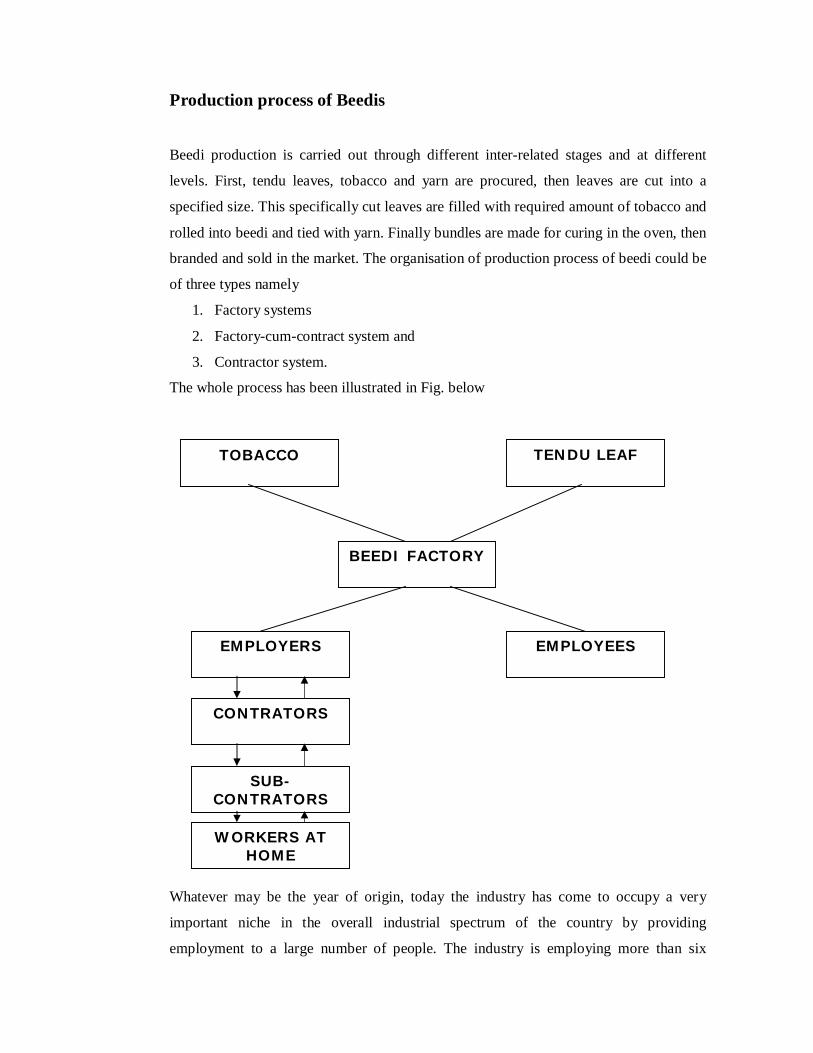
Production process of Beedis
Beedi production is carried out through different inter-related stages and at different
levels. First, tendu leaves, tobacco and yarn are procured, then leaves are cut into a
specified size. This specifically cut leaves are filled with required amount of tobacco and
rolled into beedi and tied with yarn. Finally bundles are made for curing in the oven, then
branded and sold in the market. The organisation of production process of beedi could be
of three types namely
1. Factory systems
2. Factory-cum-contract system and
3. Contractor system.
The whole process has been illustrated in Fig. below
Whatever may be the year of origin, today the industry has come to occupy a very
important niche in the overall industrial spectrum of the country by providing
employment to a large number of people. The industry is employing more than six
TOBACCO TENDU LEAF
BEEDI FACTORY
EMPLOYERS
EMPLOYEES
CONTRATORS
SUB-CONTRATORS
WORKERS AT HOME
million workers in its activities i.e in tendu leave collection and beedi rolling stages
alone. Beedi rolling itself engages more than four million workers. State wise estimate of
beedi workers shows that largest number of workers is concentrated in Madhya Pradesh,
Andhra Pradesh, Tamil Nadu, west Bengal and Uttar Pradesh.
Nature of Employment In the beginning employment in the industry was mostly concentrated in the factories.
But now most of the beedi workers are home-based workers and again the great majority
of the workers are constituted by woman and child labourers. Socially, they are mostly
constituted by the scheduled castes and scheduled tribes ( GOI, 1997).
The workers, being unorganised, are generally deprived of many facilities for instance,
minimum wages, social securities and other employment benefits. Earlier the workers
were not protected by any specific labour laws. However in 1966 an Act, namely, the
Beedi and Cigar Workers ( Conditions of Employment ) Act 1966 was passed by the
government to protect the interests of the workers.
Research Methodology
2.1 Statement of the Problem: Solapur is one of the biggest bidi rolling centre in western Maharashtra. The
study of socio- economic conditions of beedi workers in Solapur city has some
significance in overall study of Beedi industry.
There are 23 different Bidi brands in Solapur. These organised beedi
manufacturers also manufacturer some beedi’s in their unit or get it done through
contractors by given raw material at home and getting beedis done from them. It includes
male and female beedi workers. In this industry the large number of Female beedi
workers is involved. There is Less number of male workers, because some male in Beedi
industry do their joins line – wrapping Bidi, packing rolling tobacco, tendu leaves and
after weighting they given raw material to women worker, and they note all the events
and some female worker take the raw material like tobacco and tendu leaves for rolling
beedis at home.
The study is on “A Study of Socio economic conditions of Beedi Workers in
Solapur City” which will highlight the socio economic conditions of beedi workers.
Socio economic conditions focuses on the Age, sex, educational background, Family
educational status, Wages, Individual earnings, Household Income, Land holdings and
living conditions. It will also try to understand economical and social problems of beedi
workers.
Any research is not an end itself but it is a continuous process in this process new
inferences can be drawn latest information can be collected and pervious inference con
be testified. The problems have been selected to know the latest situation of beedi
workers in Solapur City.
2.2 Objectives of the study.
1. To study the socio-economic conditions among bidi workers in Solapur city.
2. To study the gender classification among bidi workers.
3. To study the awareness of welfare schemes among bidi workers.
4. To study the standard of living among workers.
5. To study whether any alternate work can be given to bidi workers.
2.3 Hypothesis of the study. The following hypotheses are framed for the present study. H0 : There is no relationship between family size and household income of beediworkers. H1 : There is a relationship between family size and household income of beediworkers. 2.4 Scope of the study. Scope:
1. The scope of the study is restricted to socio economic conditions.
2. The scope covers only Beedi workers from solapur city. So those beedi
manufacturers and beedi rollers who are residing in solapur city are only
considered for the study.
3. Only those parameters which highlight socio economic conditions are included in
the study.
2.5 Methodology.
The data which is required for the study is collected by two ways.
A) Primary Data
B) Secondary Data.
A) Source of Primary data.
It is the first hand information collected by the researcher so as to get the correct
picture. In this study for collecting the primary data structured questionnaire were
prepared and information was collected through it.
For studying “A Study of Socio Economic conditions among Beedi workers in Solapur”
the following research design is prepared.
Content of Research Design
A) Sample Size.
B) Sampling Method.
C) Tools of Data Collection.
A) Sampling Size So as to get sizeable information for analysis a total sample of 383 beedi workers were
collected from Solapur city. Only those beedi workers who were actively involved in
Beedi work and those who were willing to give information were included for the study.
B) Sampling Method Since the objective of the study is to find out the socioeconomic conditions of beedi
workers in solapur city, convenient sampling Method was adopted for data collection.
C) Tools of Data Collection.
1. Questionnaire.
Questionnaire was prepared so as to gather information from Beedi workers in
Solapur City.
2. Discussions
Discussions with the various middle men and the manufacturers in solapur city
helped to highlight the important issues among beedi workers.
3. Observations.
Some of the information in this sector were observed and noted down and was
included in the research work.
B) Source of Secondary data. It is the data which has been already collected by someone else and is taken for
the study for reference. Here information was obtained from the following sources:
1) Documents. a. Reports of Ministry of Labour, Labour Bureau, India.
b. Report on the Global Tobacco Epidemic, The World Health Organization
(WHO).
2) Journals and Periodicals. Journals are an important source of information about telecommunication
industry. Journals which are reputed which has ISSN no. and some who have impact
factor are taken into consideration for the study.
The names of various Periodicals are Business India, Facts for You, Fortune India were
used as a source of information.
3) Internet. Internet has shrunk local and International boundaries, expanding the flow of
information beyond the confines of individual systems and states. Thanks to the Internet
revolution through which information was gathered from various web-sites for the
purpose of the study.
Review of Literature
S. Shrinivasan and Dr.P.Iilonga (2014). The study revealed that the Beedi workers were from the marginalized sections of the
society and therefore they were socially and economically backward. Poverty was the
main reason that induced the respondents to take up Beedi work as an occupation. It
stressed the need of involvement of NGOs and the Government Social Welfare
Department Tamil Nadu to launch necessary schemes for the welfare of female Beedi
workers.
Mr. Ansari et.al ( 2014). Women are having inherent advantage in this job in this job of beedi rolling due to deft
fingers; yet significant gender bias exists. The job is mainly done by weaker economic
class in the country who don't have adequate education and skill to look for alternate job.
The work of beedi rolling is preferred by the women because it can be carried from home
along with domestic chores. Thus, they supplement family income along with managing
the household jobs.
Madhurima Mukherjee et.al ( 2014). The study revealed that most of the beedi workers were women and they were
economically weak without having education. Most of them were suffered from health
related disorders. Tuberculosis, lung cancer etc. were few of them. In major cases , it was
due to over exposure to the harmful tobacco dust. Women were suffering from
gynecological disorders also. Further, children were born with congenital disorders.
Therefore, the effect of tobacco dust was tremendous on the health of the beedi workers.
Pankaj Tiwari, Dr. Namrata Parashar ( 2014). The study talks about beedi workers in Allahabad distirict. All the workers were very
poor and were from socially and economically backward. Majority of workers were
working for contractors which showed that they were subject to exploitation. Nearly 70
percent of the workers stated that their health problems were due to their occupation.
Dr. Sunil G. Losarwar et.al (2014) The study highlights that unorganized sectors tries to earn maximum profits and this
thinking is said to be unethical as they believe that ethical standards may cause them
reduction in their profitability. The Corporate responsibilities of beedi industry is very
much high because it deals with the product which is no way useful to the healthier
society it only generates profits and entire benefits goes to the management though
millions of workers are engaged they get very nominal in case of each worker after the
great hardship at the cost of health and life of workers and their family members due to
regular contact with the tobacco.
Das Chandra Kanta (2013)
As the per capita daily incomes of the families are low, they consider their children as
extra helping hands. Therefore, the families are suffered from the incidents of higher
fertility rate, higher cases of school drop-outs, lower standard of living and involvement
of their children in unorganized sectors again and again. So, the generations are chased
by the obstinate trap of poverty.
Gadapani Sarma (2013) The study highlights the socio economic conditions of tea community and to which
conditions they are deprived of. Some factors which lead to low socio economic
conditions are low wages, lack of job opportunities and proper work culture.
R.Sivanesan ( 2013) It studies the working conditions of women workers in cashew industries and analyzes
the income and expenditure pattern and problems faced by women workers. It also has
identified the living conditions of women in kanyakumari district.
S.Srinivasan ( 2012) The paper highlights the aim to gain insight into the “Socio-economic conditions of
female beedi workers at Khajamalai near Trichy. Its seen that due to poverty many
people are forced to go with the beedi rolling. Majority of them were working under
contractors which again resulted in exploitation to wages.
Dr.G.R.Rathod et.al ( 2012) The socio economic is an important determinant of the livelihoods as it influences levels
of knowledge, skill and income conditions which mean for the living. The study
measures the status of urban below poverty line families in imphal city and their socio
economic status.
A.Mahalakshmi (2012) It’s an in-depth study of woman employees in tea industries and their socio economic
status. The study has focused on living conditions, wages, earnings and socio security
benefits. It also highlights the important factor for their development and the problem
faced by the employees.
Girish Kumar Painoli (2012) The study suggests that devising an appropriate social policy and a plan of action to
remedy the continuing evils of exploitative practices in this industry and protect the
workers from any threat of prospective, unemployment through sustainable
diversification strategies and skill development require a diagnostic study on the working
and living conditions of the workers. Assessing the threat potential and possibility of
their rehabilitation through employment diversification strategies through enactment of
various legislations in the interest of women beedi workers will definitely cause for the
employment in beedi industry otherwise employment in beedi work will be a risk factor
or a threat to the women’s.
Padmaja H Chowdhary et.al ( 2012) Descriptive, cross-sectional, community based study was carried in the urban slums of
Mumbai to study working condition and health hazard in beedi rollers who Hindu
females. Around 50 % were illiterate and the Mean years of service were 30 years and
they work on an average for eight hours. Children were not involved in beedi rolling.
Most common morbidity was fatigue. None were aware of the benefits provided for
them. Awareness regarding health hazard and safety measures was poor.
Pankaj Tiwari, Dr. Namrata Parashar ( 2012) A survey among women beedi workers was carried out in this regard in Allahabad
district. Majority of the beedi workers were from the marginalized sections of the society
and therefore they were socially and economically backward. Poverty was the main
reason that induced the respondents to take up beedi work as an occupation. Majority of
the respondents were working for contractors which showed that they were subjected to
exploitation.
P. C. Ghosh et.al ( 2005) The main problem for beedi workers is their poor socio-economic status, education, and
training which forces them to work in unsafe environmental conditions and improper
working postures. It throws light on various welfare measures and schemes for the beedi
workers like, Welfare measure for beedi workers, Health schemes, Education schemes,
Housing scheme, Social security, etc. In spite of various welfare measures, the socio
economic status of the beedi workers remain at low level since the welfare measures are
insufficient in comparison to the number of beedi workers in India.
Report on Socio Economic status of Domestic workers, Report submitted to
Mininstry of WCD, Govt. of India.
It highlights on the socio economic conditions of women Domestic workers (WDW).
Most of the WDW are illiterate and they stay kachha houses and straw thatched roofs. It
has considered various parameters for study like illiteracy, housing structure, drinking
water, fuel for livelihood and income. On these parameters the report projects a true
picture of domestic workers in Five major townships of Orrisa.
The World Health Organization (WHO) (2008) Report on the Global Tobacco
Epidemic.
The World Health Organization’s landmark report on the global tobacco epidemic makes
clear both the devastating scope of the global tobacco epidemic – it is the leading cause
of preventable death in the world today – and the fact that it is entirely preventable if
nations urgently implement proven solutions. This report presents the first
comprehensive picture of what the world’s nations are doing to address this public health
crisis, and it demonstrates starkly that most nations are not doing nearly enough.
Government of India. Ministry of Labour. Labour Bureau. Smila/Chandigarh (
2008).
The study is to bring into focus the working and living conditions of women workers,
social and economic aspects of life of women workers including focus on wages,
income, family size, literacy level and living conditions etc. Literary rate was good and
very few woman were illiterate. The household income also was quite good.
Reddy S, Gupta P. (2004). Report on Tobacco Control in India.
Published by the Ministry of Health and Family Welfare and written by the country’s
leading experts in the field, this is a comprehensive overview of tobacco related issues in
India. It includes culture and history, types of tobacco use throughout India, health
effects, current policies, and future policy recommendations.
The World Bank. (1999). Curbing the Epidemic: Governments and the Economics
of Tobacco Control.
This World Bank report outlines effective policy interventions to reduce smoking in
developing countries. It discusses tobacco use and its consequences both on health and
on the economy, and highlights the relationship between smoking and poverty.
Critically, for policymakers, the report discusses the impact of tobacco control programs
on economies: on jobs, tax revenue and on individual consumers. It concludes that many
of the concerns that have deterred policymakers from acting to control tobacco in the
past are unfounded or exaggerated.
National Human Rights Commission. Report on Rights of Home based Workers by
Shalini Sinha.
The report highlights on ‘Home-based worker’ which refers to the general category
of workers, within the informal or unorganized sector, who carry out remunerative work
within their homes or in the surrounding grounds. It is observed that in India 90% of bidi
workers (cigarette rollers) are women. It also highlights the various problems faced by a
bidi worker either by lack of quality of raw material or by the middlemen or health
problems faced by bidi workers.
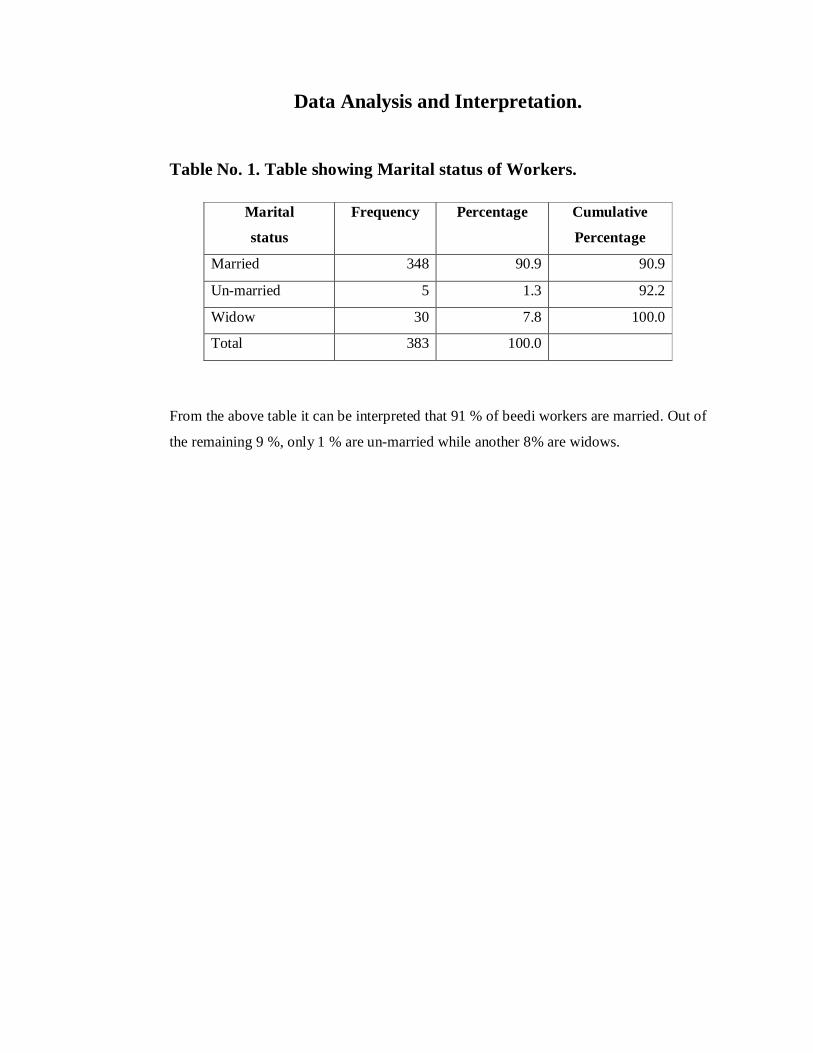
Data Analysis and Interpretation. Table No. 1. Table showing Marital status of Workers.
Marital
status
Frequency Percentage Cumulative
Percentage
Married 348 90.9 90.9
Un-married 5 1.3 92.2
Widow 30 7.8 100.0
Total 383 100.0
From the above table it can be interpreted that 91 % of beedi workers are married. Out of
the remaining 9 %, only 1 % are un-married while another 8% are widows.
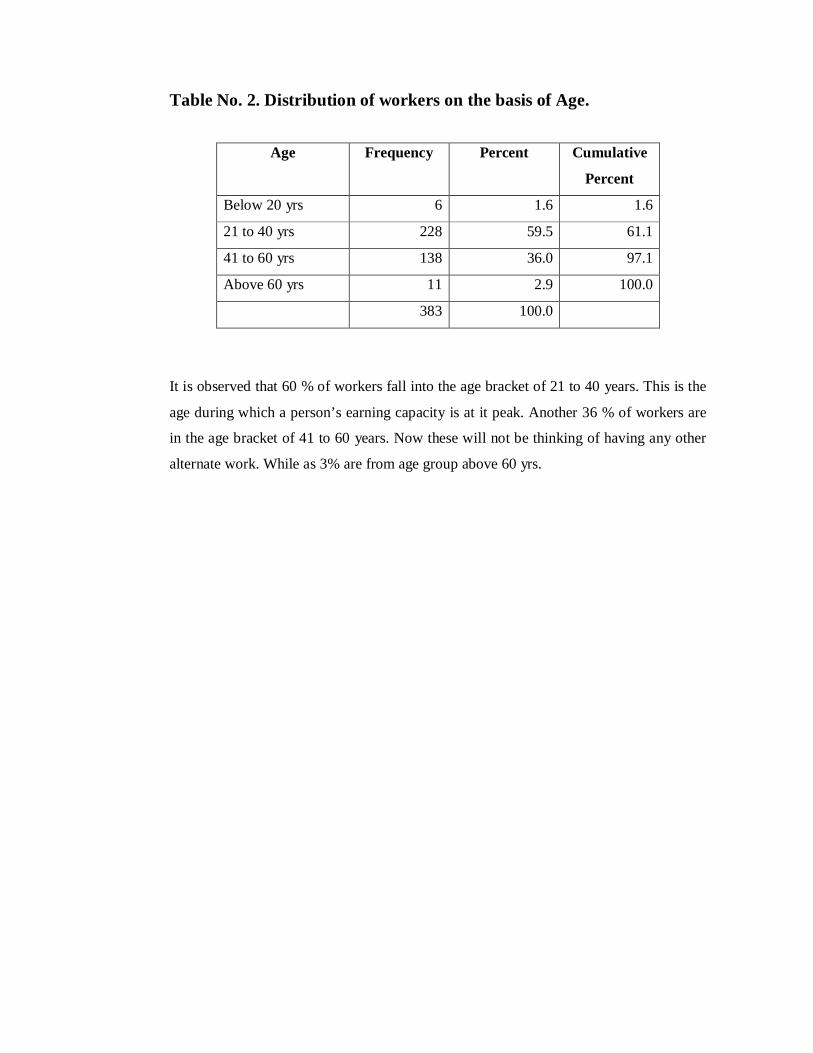
Table No. 2. Distribution of workers on the basis of Age.
Age Frequency Percent Cumulative
Percent
Below 20 yrs 6 1.6 1.6
21 to 40 yrs 228 59.5 61.1
41 to 60 yrs 138 36.0 97.1
Above 60 yrs 11 2.9 100.0
383 100.0
It is observed that 60 % of workers fall into the age bracket of 21 to 40 years. This is the
age during which a person’s earning capacity is at it peak. Another 36 % of workers are
in the age bracket of 41 to 60 years. Now these will not be thinking of having any other
alternate work. While as 3% are from age group above 60 yrs.
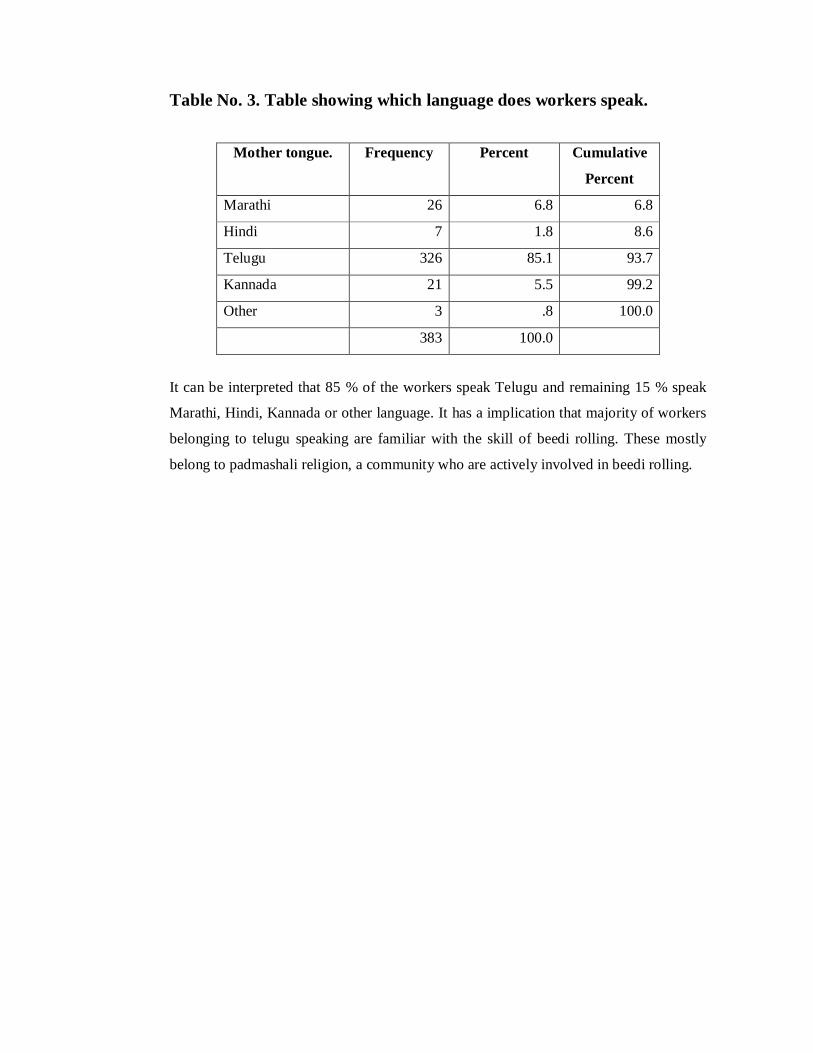
Table No. 3. Table showing which language does workers speak.
Mother tongue. Frequency Percent Cumulative
Percent
Marathi 26 6.8 6.8
Hindi 7 1.8 8.6
Telugu 326 85.1 93.7
Kannada 21 5.5 99.2
Other 3 .8 100.0
383 100.0
It can be interpreted that 85 % of the workers speak Telugu and remaining 15 % speak
Marathi, Hindi, Kannada or other language. It has a implication that majority of workers
belonging to telugu speaking are familiar with the skill of beedi rolling. These mostly
belong to padmashali religion, a community who are actively involved in beedi rolling.
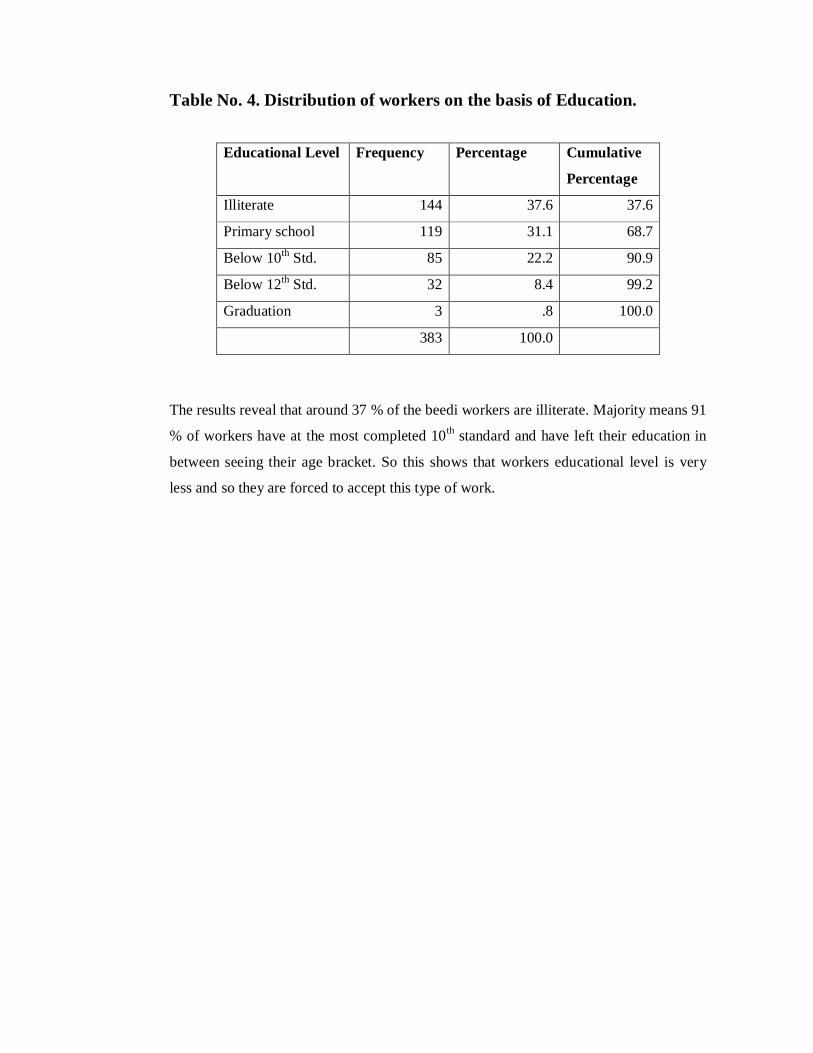
Table No. 4. Distribution of workers on the basis of Education.
Educational Level Frequency Percentage Cumulative
Percentage
Illiterate 144 37.6 37.6
Primary school 119 31.1 68.7
Below 10th Std. 85 22.2 90.9
Below 12th Std. 32 8.4 99.2
Graduation 3 .8 100.0
383 100.0
The results reveal that around 37 % of the beedi workers are illiterate. Majority means 91
% of workers have at the most completed 10th standard and have left their education in
between seeing their age bracket. So this shows that workers educational level is very
less and so they are forced to accept this type of work.
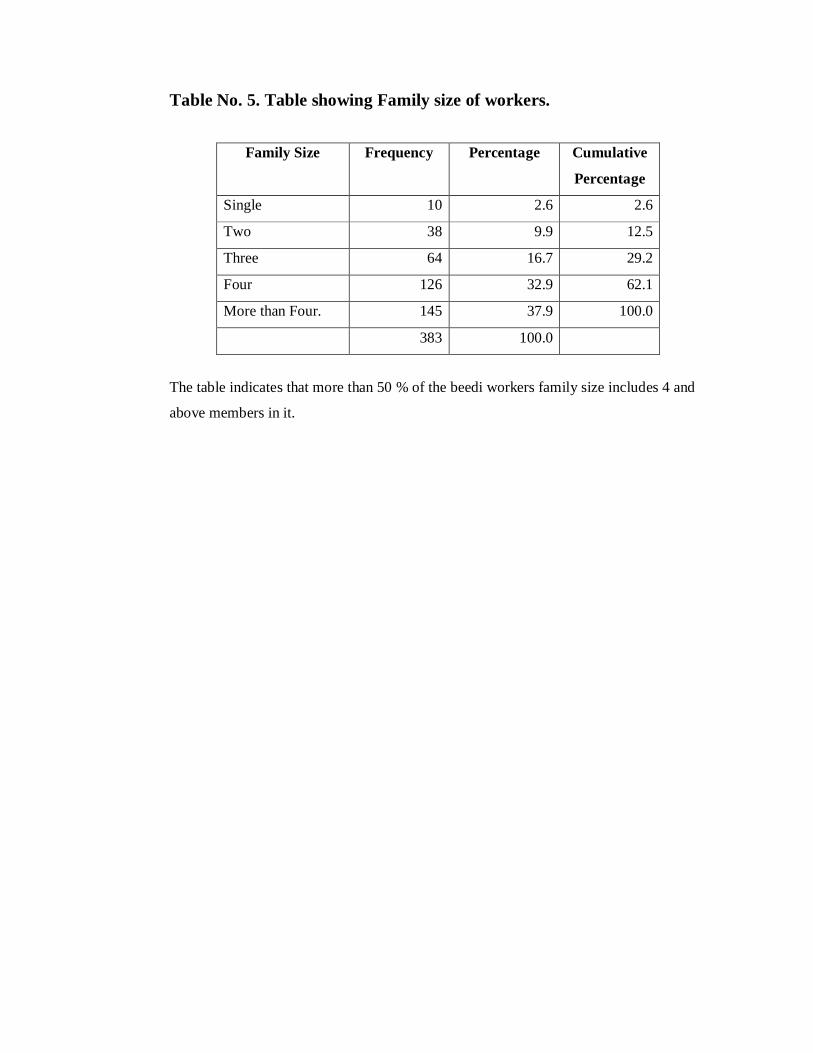
Table No. 5. Table showing Family size of workers.
Family Size Frequency Percentage Cumulative
Percentage
Single 10 2.6 2.6
Two 38 9.9 12.5
Three 64 16.7 29.2
Four 126 32.9 62.1
More than Four. 145 37.9 100.0
383 100.0
The table indicates that more than 50 % of the beedi workers family size includes 4 and
above members in it.
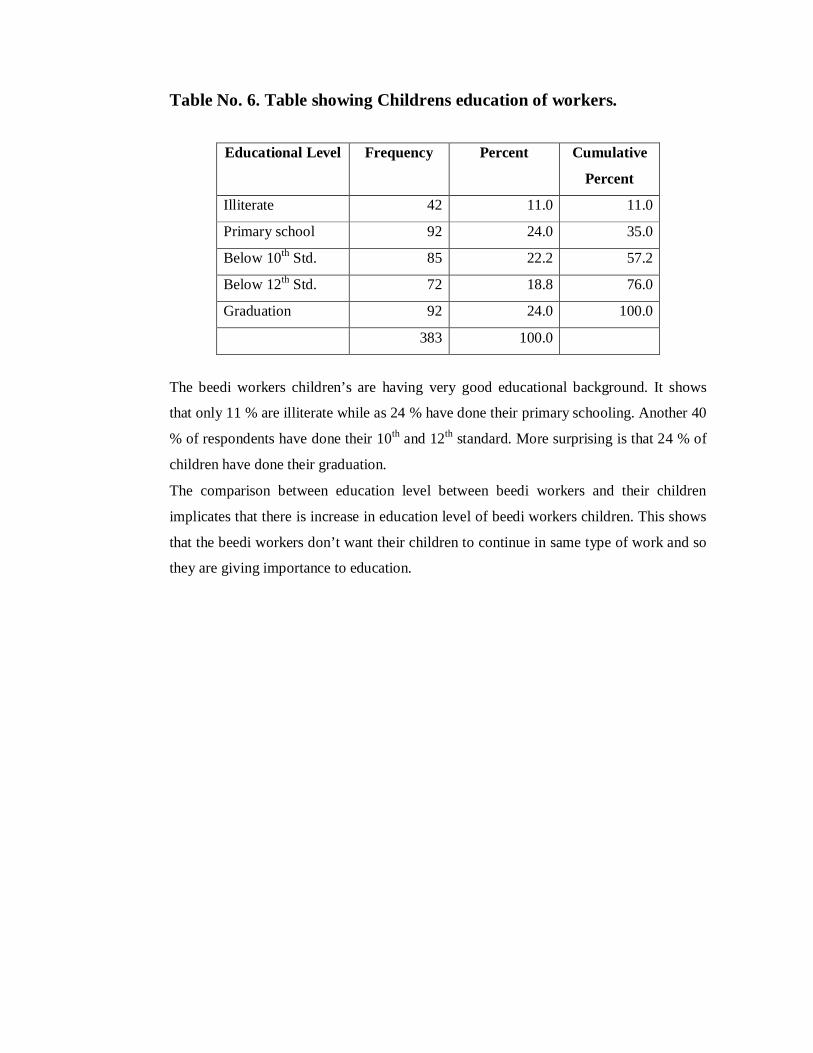
Table No. 6. Table showing Childrens education of workers.
Educational Level Frequency Percent Cumulative
Percent
Illiterate 42 11.0 11.0
Primary school 92 24.0 35.0
Below 10th Std. 85 22.2 57.2
Below 12th Std. 72 18.8 76.0
Graduation 92 24.0 100.0
383 100.0
The beedi workers children’s are having very good educational background. It shows
that only 11 % are illiterate while as 24 % have done their primary schooling. Another 40
% of respondents have done their 10th and 12th standard. More surprising is that 24 % of
children have done their graduation.
The comparison between education level between beedi workers and their children
implicates that there is increase in education level of beedi workers children. This shows
that the beedi workers don’t want their children to continue in same type of work and so
they are giving importance to education.
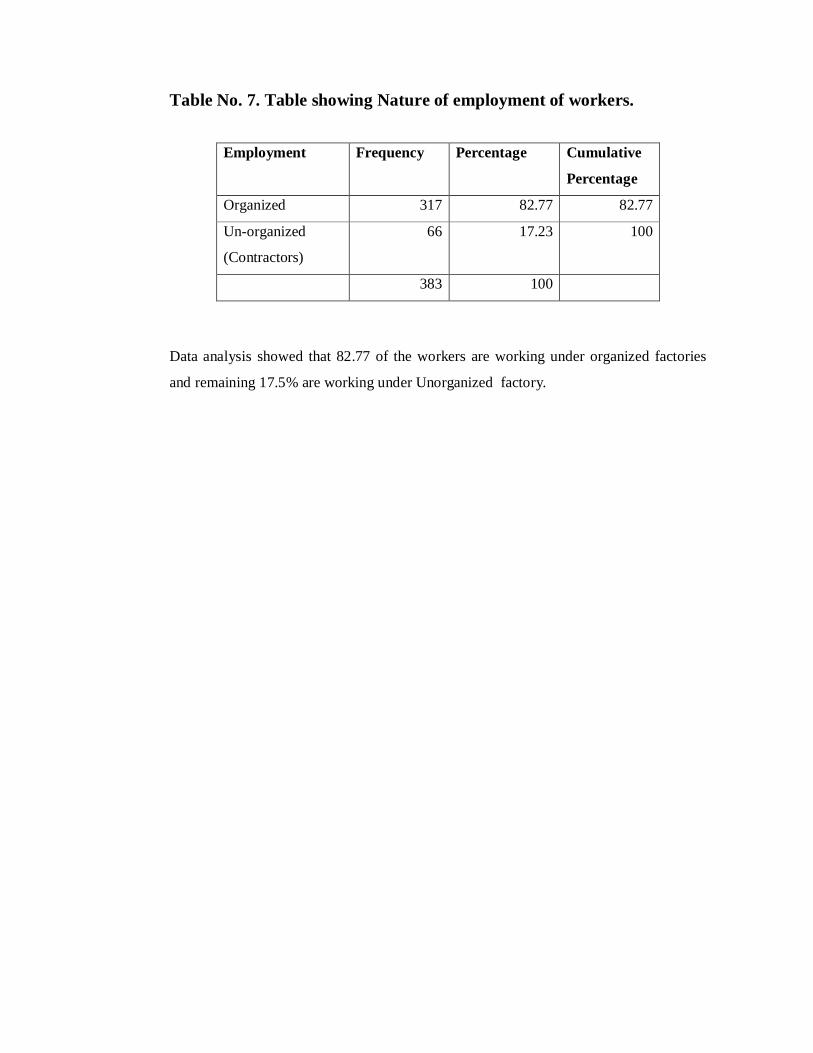
Table No. 7. Table showing Nature of employment of workers.
Employment Frequency Percentage Cumulative
Percentage
Organized 317 82.77 82.77
Un-organized
(Contractors)
66 17.23 100
383 100
Data analysis showed that 82.77 of the workers are working under organized factories
and remaining 17.5% are working under Unorganized factory.
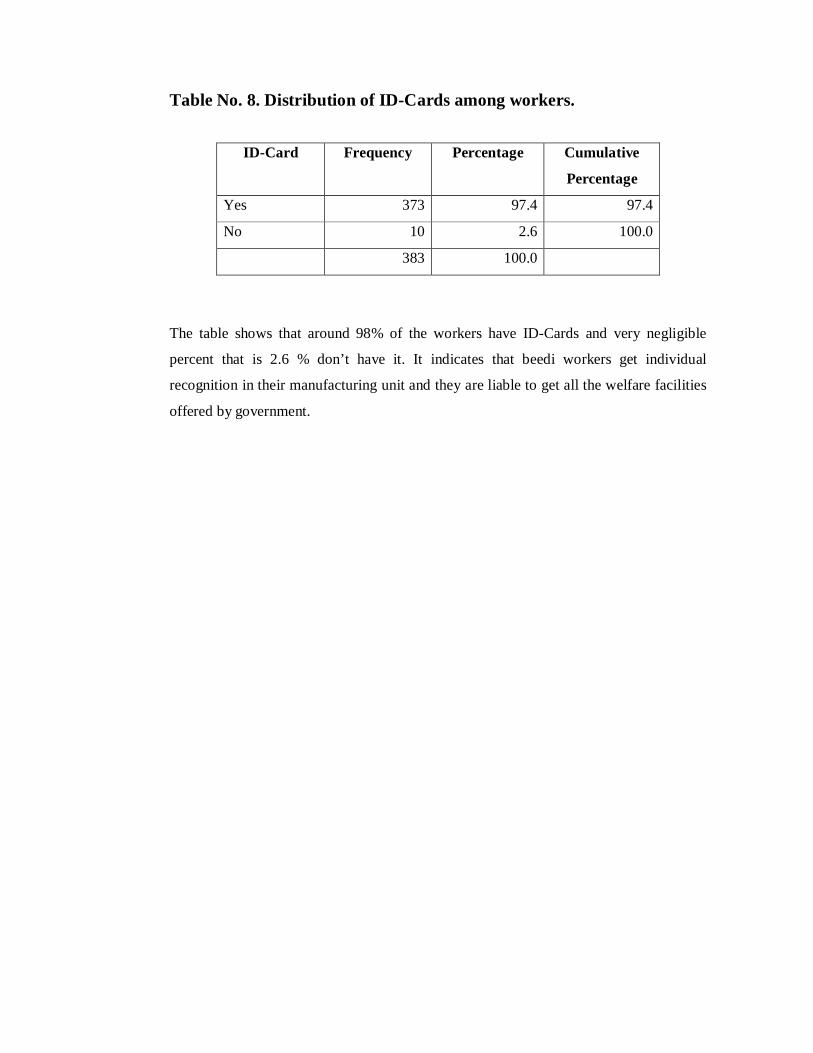
Table No. 8. Distribution of ID-Cards among workers.
ID-Card Frequency Percentage Cumulative
Percentage
Yes 373 97.4 97.4
No 10 2.6 100.0
383 100.0
The table shows that around 98% of the workers have ID-Cards and very negligible
percent that is 2.6 % don’t have it. It indicates that beedi workers get individual
recognition in their manufacturing unit and they are liable to get all the welfare facilities
offered by government.
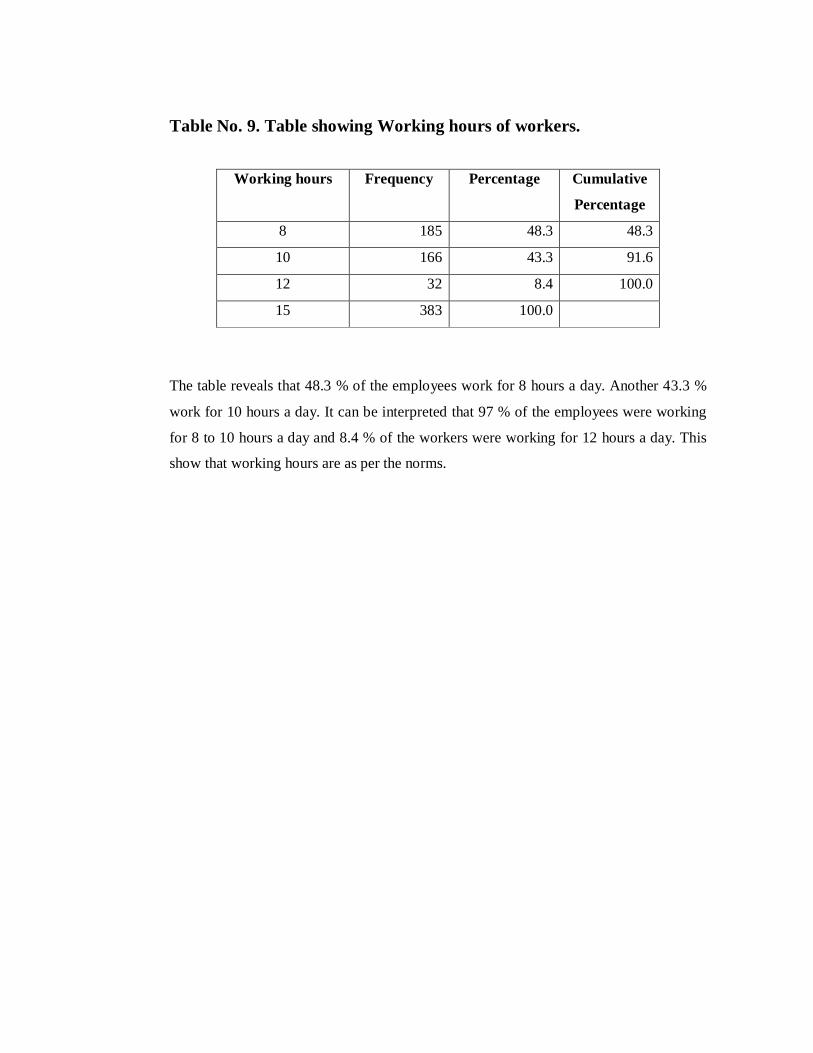
Table No. 9. Table showing Working hours of workers.
Working hours Frequency Percentage Cumulative
Percentage
8 185 48.3 48.3
10 166 43.3 91.6
12 32 8.4 100.0
15 383 100.0
The table reveals that 48.3 % of the employees work for 8 hours a day. Another 43.3 %
work for 10 hours a day. It can be interpreted that 97 % of the employees were working
for 8 to 10 hours a day and 8.4 % of the workers were working for 12 hours a day. This
show that working hours are as per the norms.
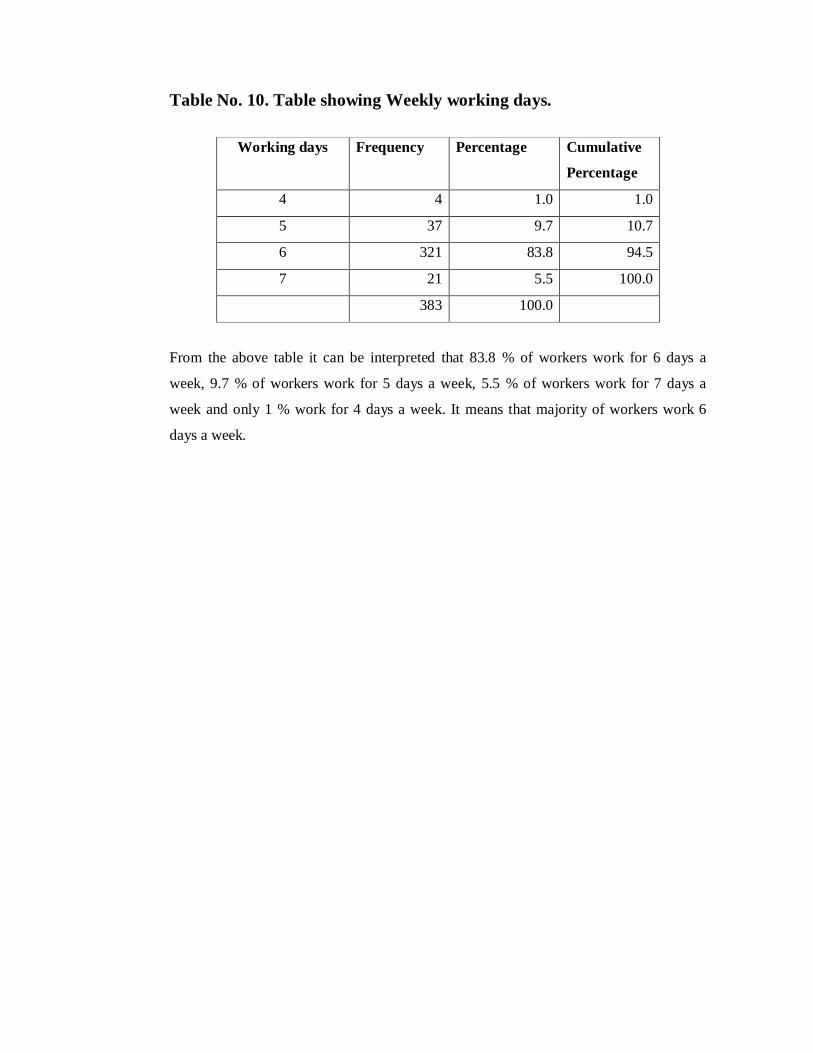
Table No. 10. Table showing Weekly working days.
Working days Frequency Percentage Cumulative
Percentage
4 4 1.0 1.0
5 37 9.7 10.7
6 321 83.8 94.5
7 21 5.5 100.0
383 100.0
From the above table it can be interpreted that 83.8 % of workers work for 6 days a
week, 9.7 % of workers work for 5 days a week, 5.5 % of workers work for 7 days a
week and only 1 % work for 4 days a week. It means that majority of workers work 6
days a week.
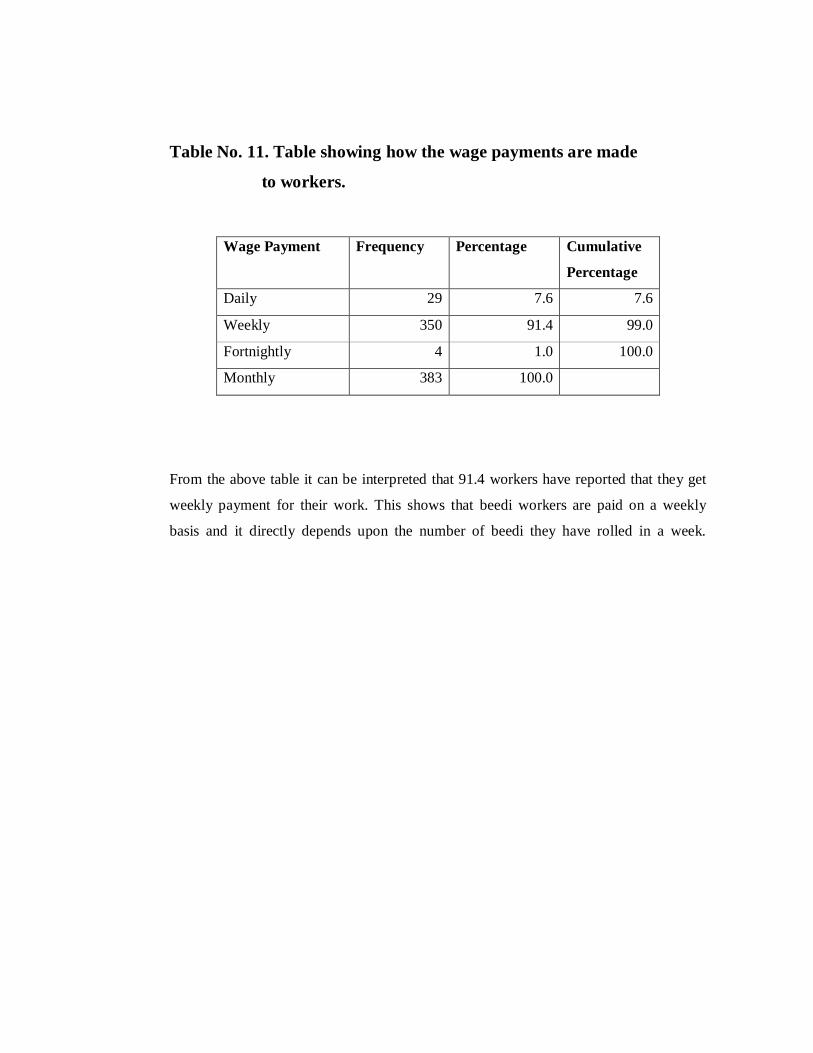
Table No. 11. Table showing how the wage payments are made
to workers.
Wage Payment Frequency Percentage Cumulative
Percentage
Daily 29 7.6 7.6
Weekly 350 91.4 99.0
Fortnightly 4 1.0 100.0
Monthly 383 100.0
From the above table it can be interpreted that 91.4 workers have reported that they get
weekly payment for their work. This shows that beedi workers are paid on a weekly
basis and it directly depends upon the number of beedi they have rolled in a week.
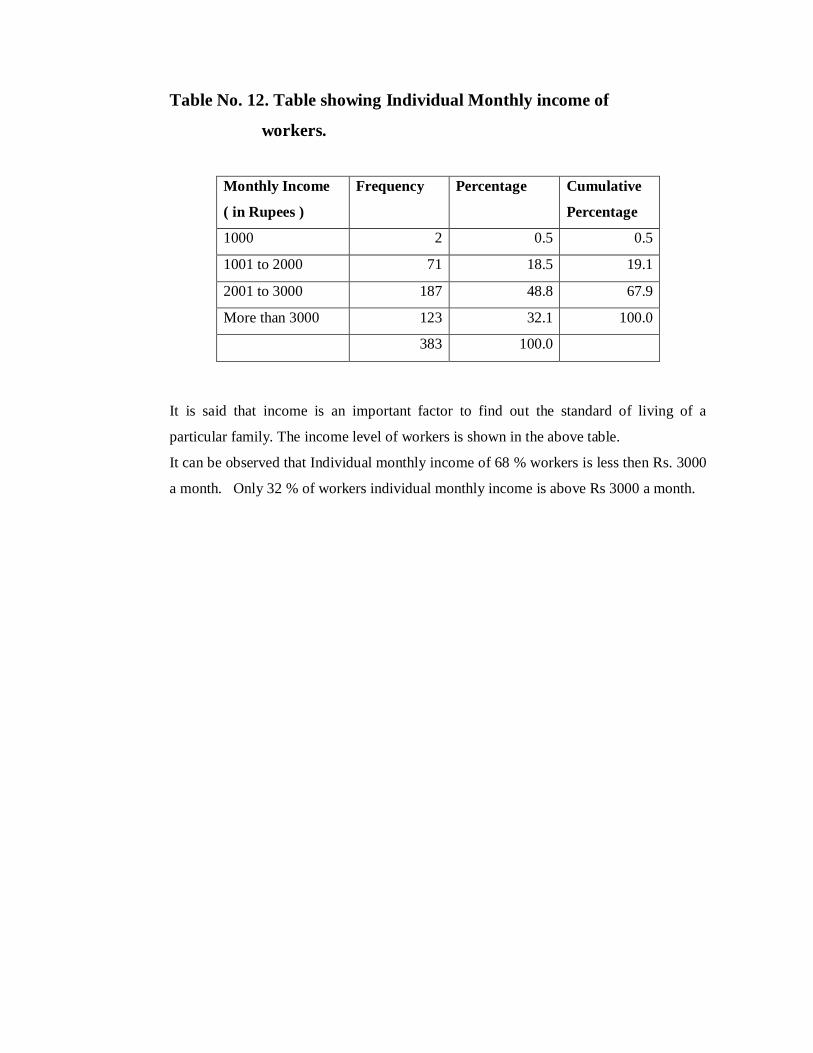
Table No. 12. Table showing Individual Monthly income of
workers.
Monthly Income
( in Rupees )
Frequency Percentage Cumulative
Percentage
1000 2 0.5 0.5
1001 to 2000 71 18.5 19.1
2001 to 3000 187 48.8 67.9
More than 3000 123 32.1 100.0
383 100.0
It is said that income is an important factor to find out the standard of living of a
particular family. The income level of workers is shown in the above table.
It can be observed that Individual monthly income of 68 % workers is less then Rs. 3000
a month. Only 32 % of workers individual monthly income is above Rs 3000 a month.
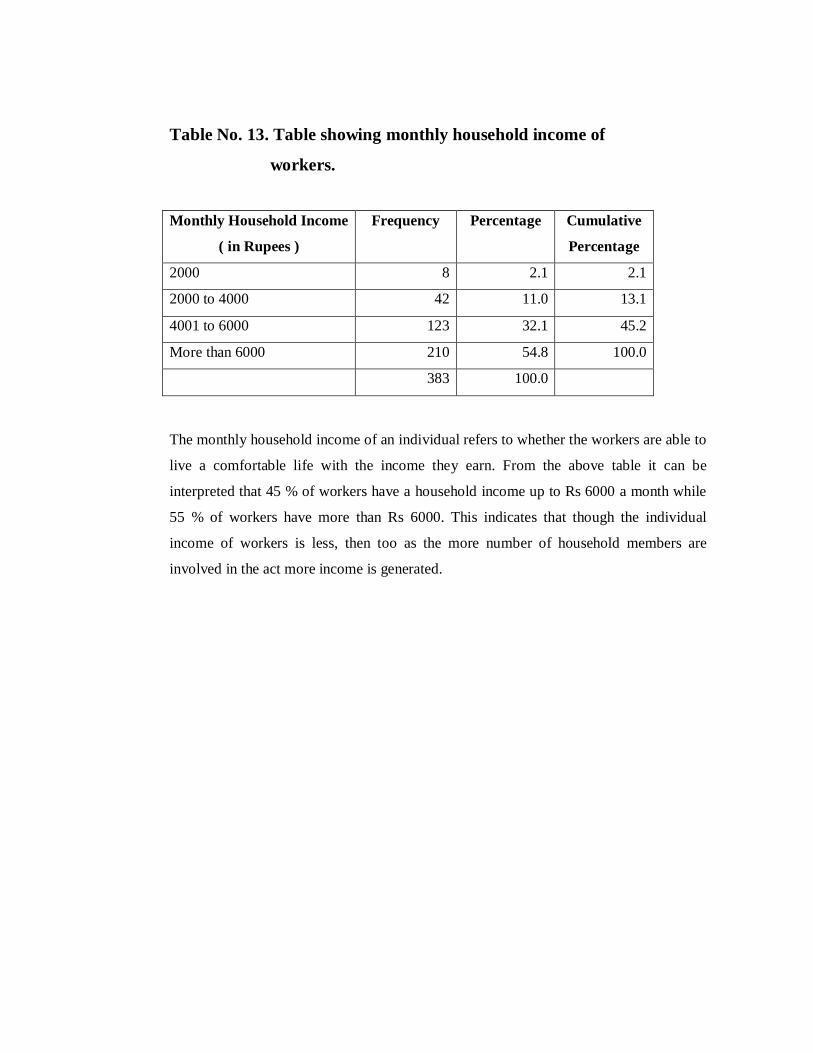
Table No. 13. Table showing monthly household income of
workers.
Monthly Household Income
( in Rupees )
Frequency Percentage Cumulative
Percentage
2000 8 2.1 2.1
2000 to 4000 42 11.0 13.1
4001 to 6000 123 32.1 45.2
More than 6000 210 54.8 100.0
383 100.0
The monthly household income of an individual refers to whether the workers are able to
live a comfortable life with the income they earn. From the above table it can be
interpreted that 45 % of workers have a household income up to Rs 6000 a month while
55 % of workers have more than Rs 6000. This indicates that though the individual
income of workers is less, then too as the more number of household members are
involved in the act more income is generated.
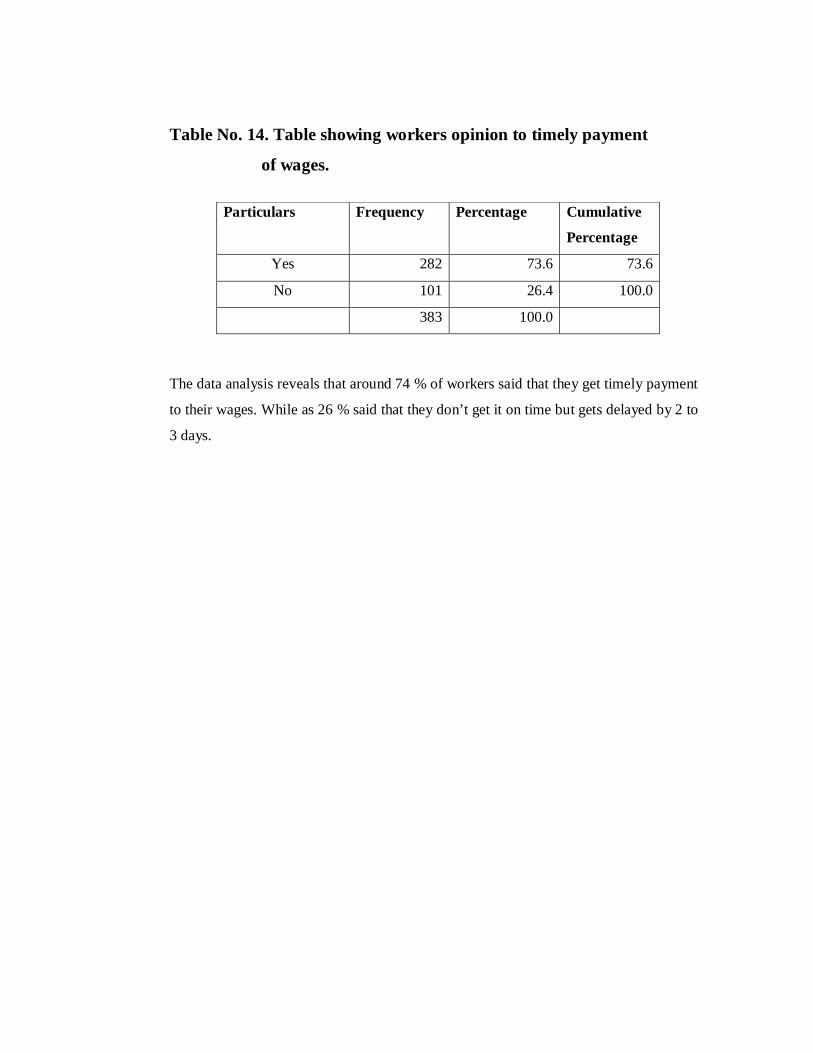
Table No. 14. Table showing workers opinion to timely payment
of wages.
Particulars Frequency Percentage Cumulative
Percentage
Yes 282 73.6 73.6
No 101 26.4 100.0
383 100.0
The data analysis reveals that around 74 % of workers said that they get timely payment
to their wages. While as 26 % said that they don’t get it on time but gets delayed by 2 to
3 days.
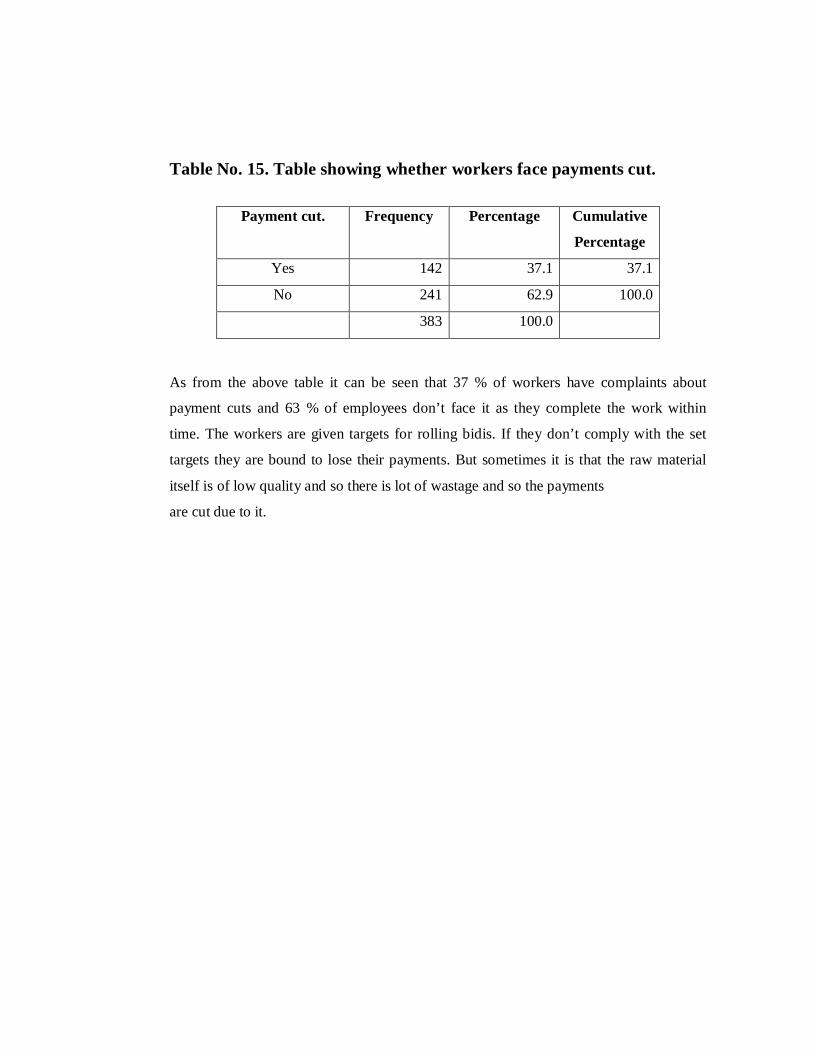
Table No. 15. Table showing whether workers face payments cut.
Payment cut. Frequency Percentage Cumulative
Percentage
Yes 142 37.1 37.1
No 241 62.9 100.0
383 100.0
As from the above table it can be seen that 37 % of workers have complaints about
payment cuts and 63 % of employees don’t face it as they complete the work within
time. The workers are given targets for rolling bidis. If they don’t comply with the set
targets they are bound to lose their payments. But sometimes it is that the raw material
itself is of low quality and so there is lot of wastage and so the payments
are cut due to it.
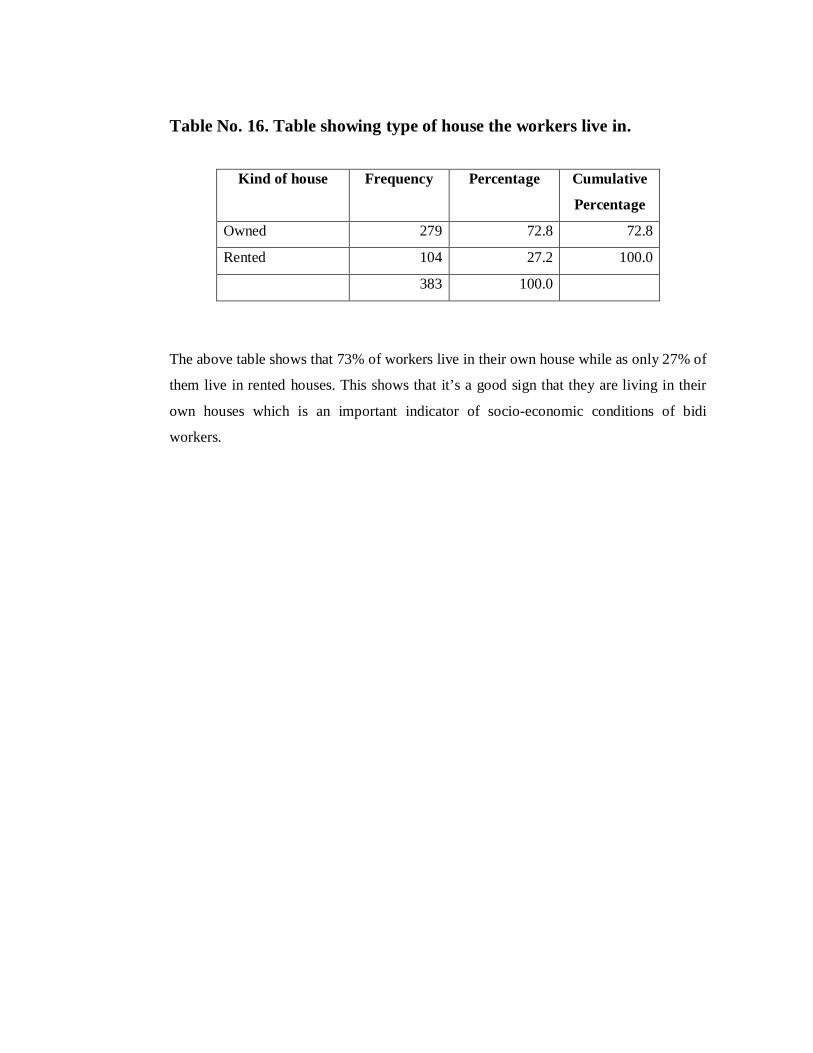
Table No. 16. Table showing type of house the workers live in.
Kind of house Frequency Percentage Cumulative
Percentage
Owned 279 72.8 72.8
Rented 104 27.2 100.0
383 100.0
The above table shows that 73% of workers live in their own house while as only 27% of
them live in rented houses. This shows that it’s a good sign that they are living in their
own houses which is an important indicator of socio-economic conditions of bidi
workers.
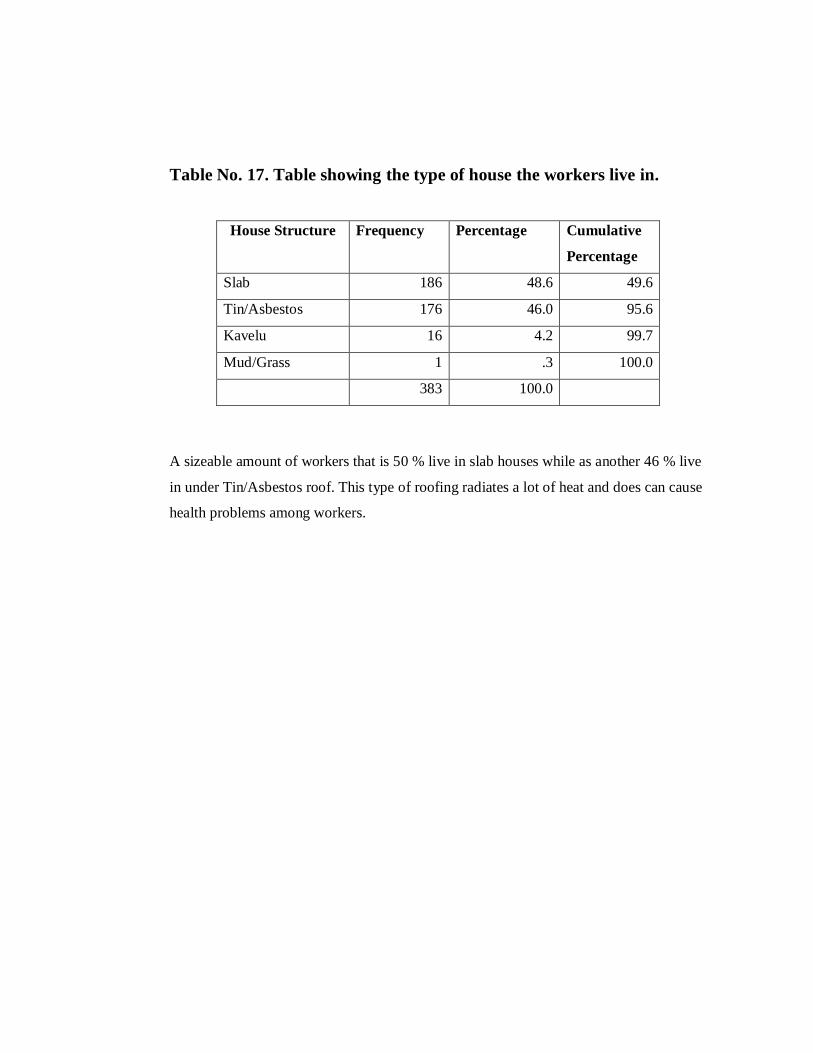
Table No. 17. Table showing the type of house the workers live in.
House Structure Frequency Percentage Cumulative
Percentage
Slab 186 48.6 49.6
Tin/Asbestos 176 46.0 95.6
Kavelu 16 4.2 99.7
Mud/Grass 1 .3 100.0
383 100.0
A sizeable amount of workers that is 50 % live in slab houses while as another 46 % live
in under Tin/Asbestos roof. This type of roofing radiates a lot of heat and does can cause
health problems among workers.
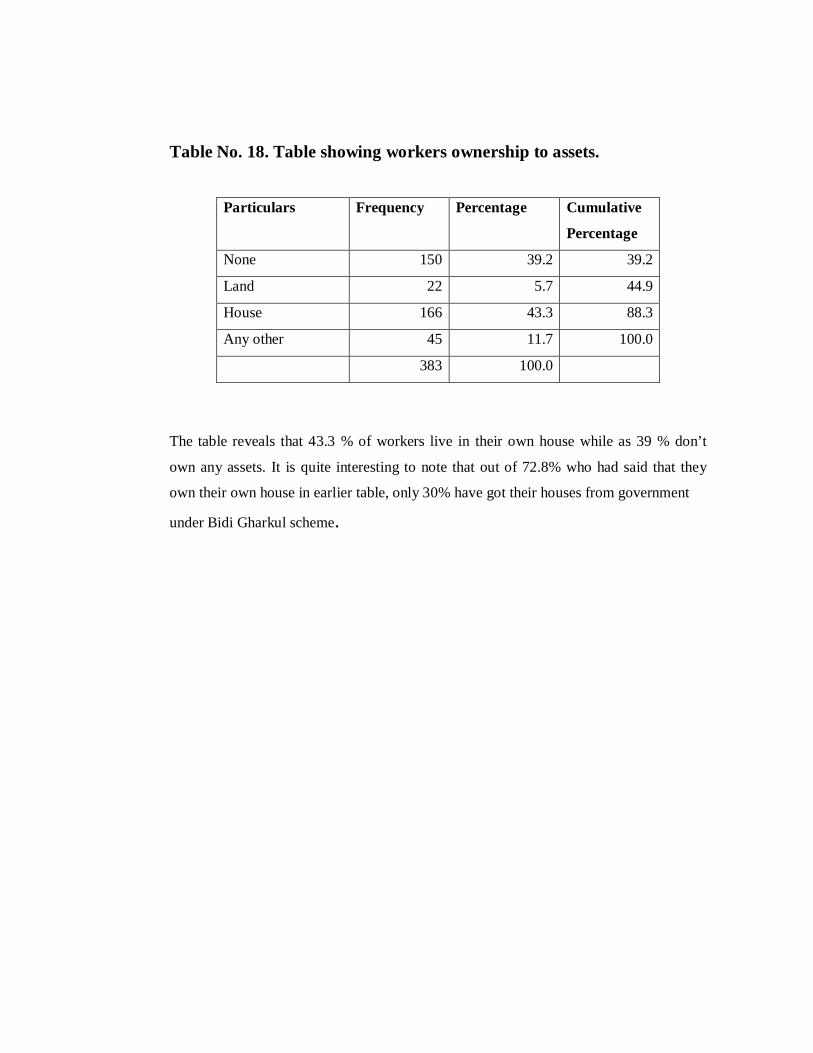
Table No. 18. Table showing workers ownership to assets.
Particulars Frequency Percentage Cumulative
Percentage
None 150 39.2 39.2
Land 22 5.7 44.9
House 166 43.3 88.3
Any other 45 11.7 100.0
383 100.0
The table reveals that 43.3 % of workers live in their own house while as 39 % don’t
own any assets. It is quite interesting to note that out of 72.8% who had said that they
own their own house in earlier table, only 30% have got their houses from government
under Bidi Gharkul scheme.
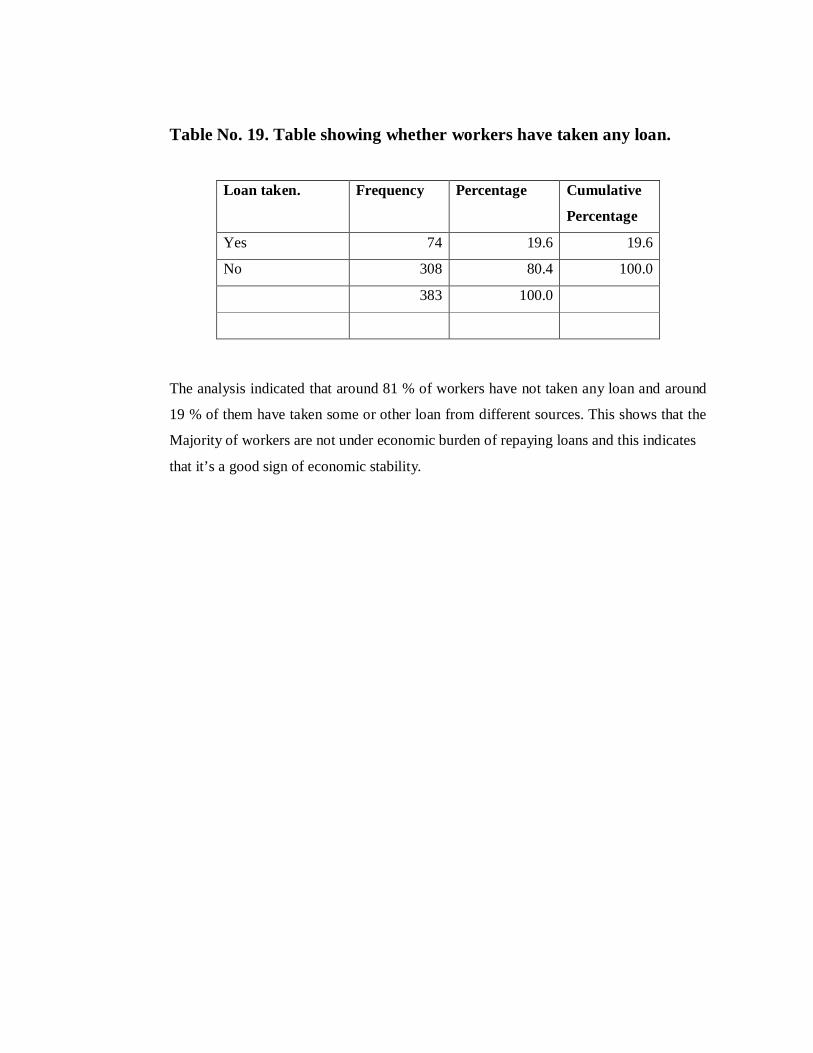
Table No. 19. Table showing whether workers have taken any loan.
Loan taken. Frequency Percentage Cumulative
Percentage
Yes 74 19.6 19.6
No 308 80.4 100.0
383 100.0
The analysis indicated that around 81 % of workers have not taken any loan and around
19 % of them have taken some or other loan from different sources. This shows that the
Majority of workers are not under economic burden of repaying loans and this indicates
that it’s a good sign of economic stability.
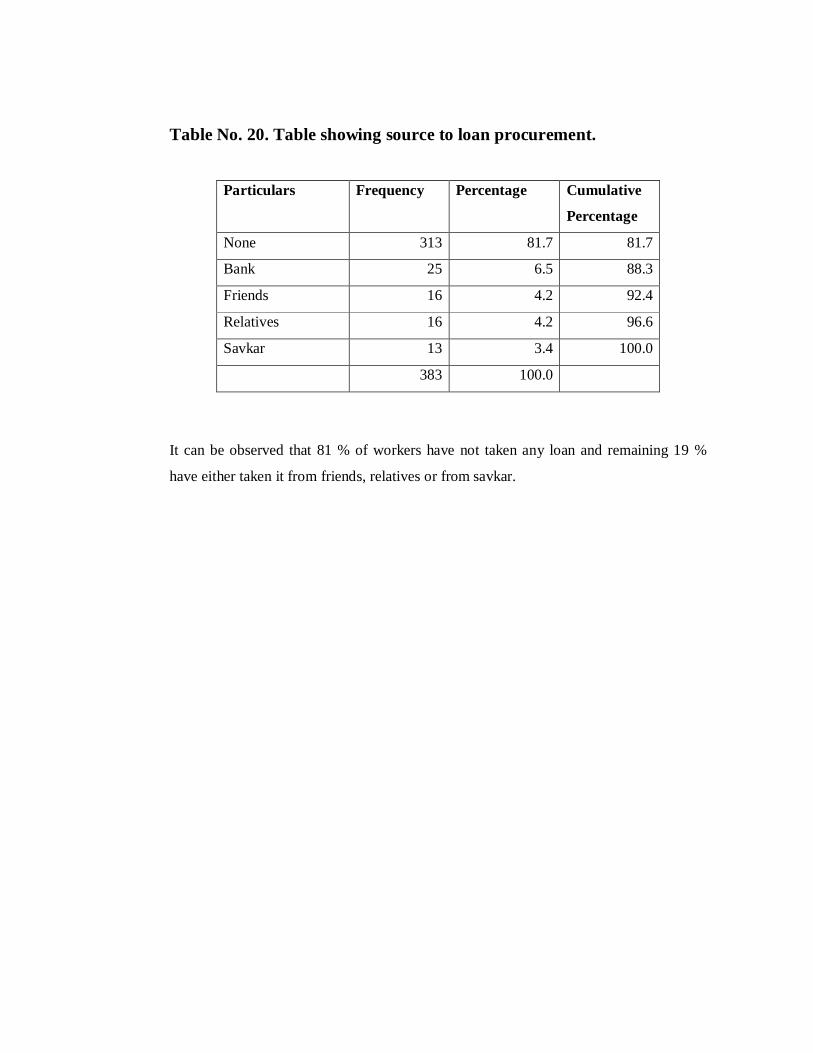
Table No. 20. Table showing source to loan procurement.
Particulars Frequency Percentage Cumulative
Percentage
None 313 81.7 81.7
Bank 25 6.5 88.3
Friends 16 4.2 92.4
Relatives 16 4.2 96.6
Savkar 13 3.4 100.0
383 100.0
It can be observed that 81 % of workers have not taken any loan and remaining 19 %
have either taken it from friends, relatives or from savkar.
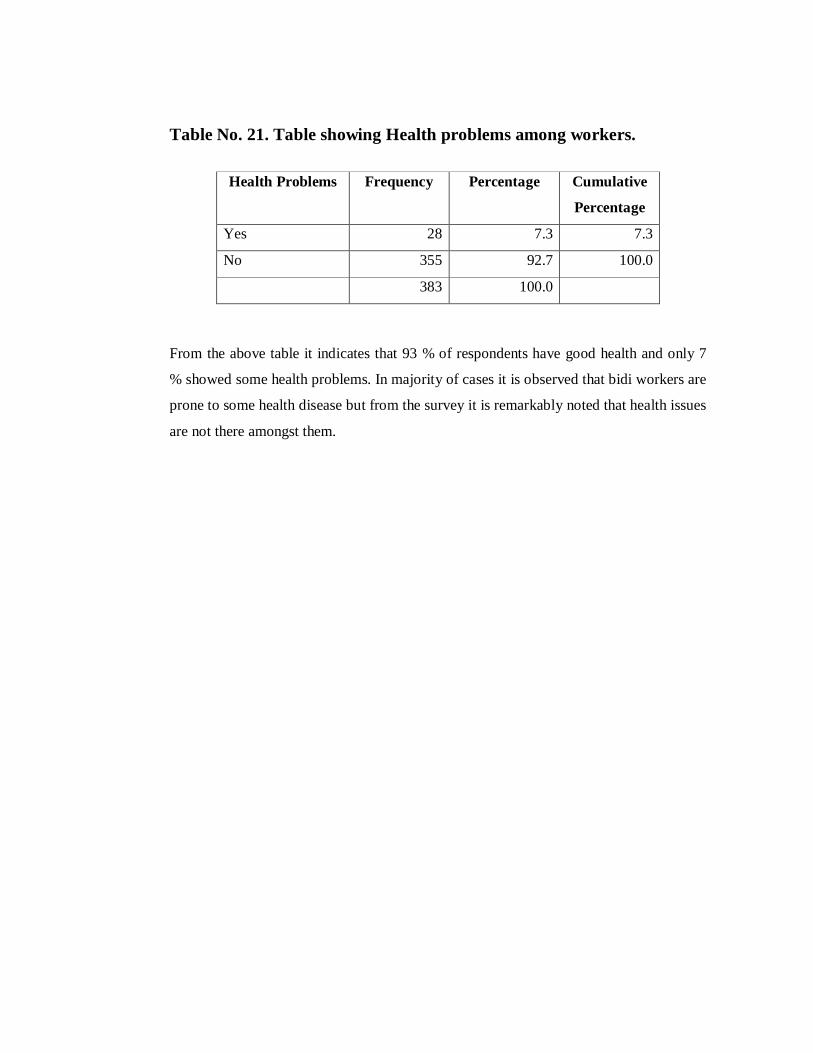
Table No. 21. Table showing Health problems among workers.
Health Problems Frequency Percentage Cumulative
Percentage
Yes 28 7.3 7.3
No 355 92.7 100.0
383 100.0
From the above table it indicates that 93 % of respondents have good health and only 7
% showed some health problems. In majority of cases it is observed that bidi workers are
prone to some health disease but from the survey it is remarkably noted that health issues
are not there amongst them.
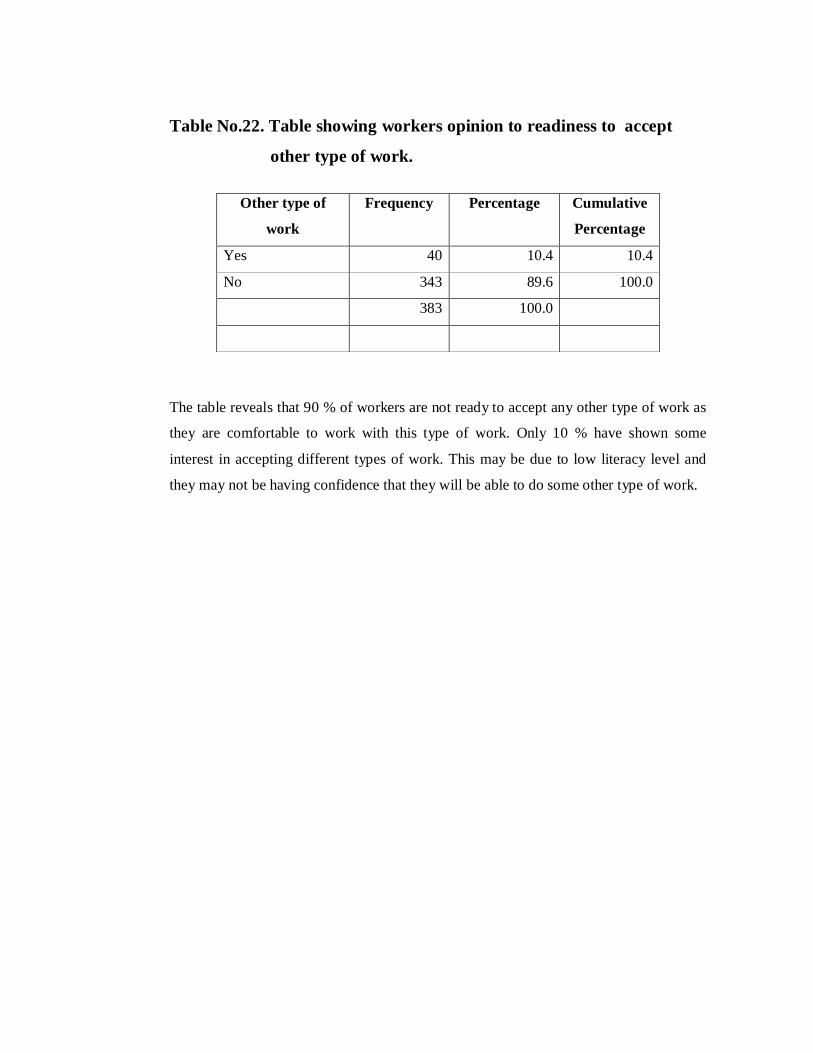
Table No.22. Table showing workers opinion to readiness to accept
other type of work.
Other type of
work
Frequency Percentage Cumulative
Percentage
Yes 40 10.4 10.4
No 343 89.6 100.0
383 100.0
The table reveals that 90 % of workers are not ready to accept any other type of work as
they are comfortable to work with this type of work. Only 10 % have shown some
interest in accepting different types of work. This may be due to low literacy level and
they may not be having confidence that they will be able to do some other type of work.
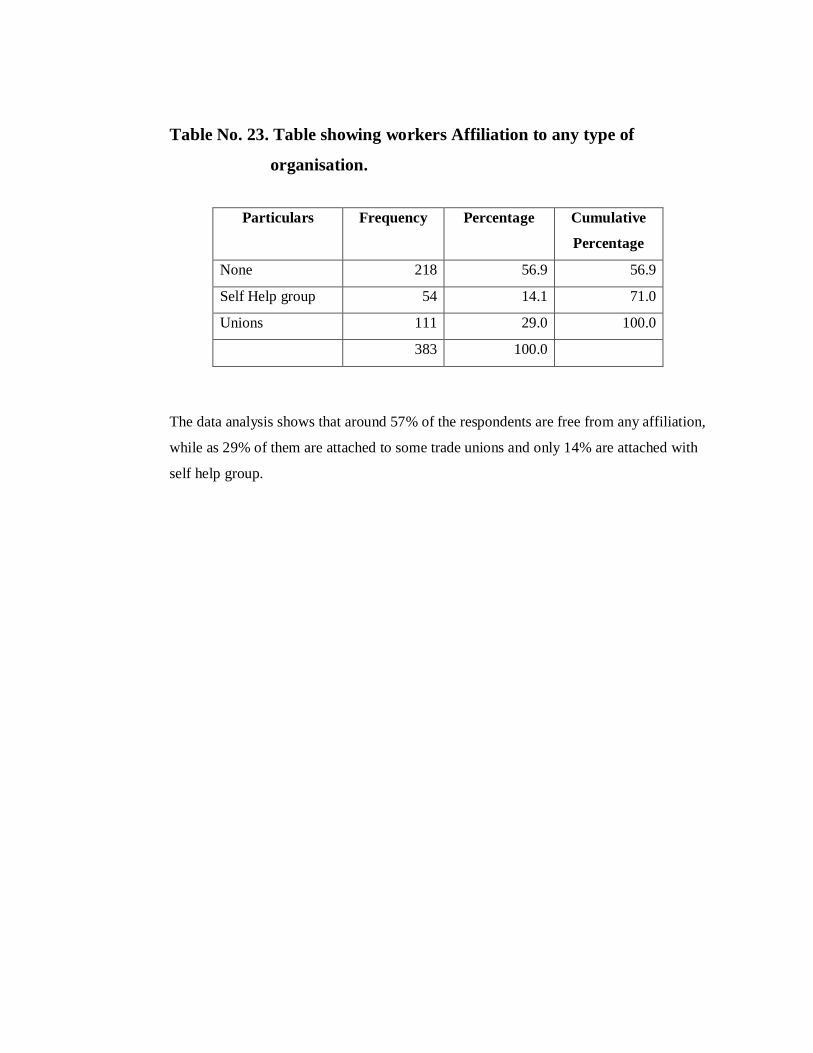
Table No. 23. Table showing workers Affiliation to any type of
organisation.
Particulars Frequency Percentage Cumulative
Percentage
None 218 56.9 56.9
Self Help group 54 14.1 71.0
Unions 111 29.0 100.0
383 100.0
The data analysis shows that around 57% of the respondents are free from any affiliation,
while as 29% of them are attached to some trade unions and only 14% are attached with
self help group.
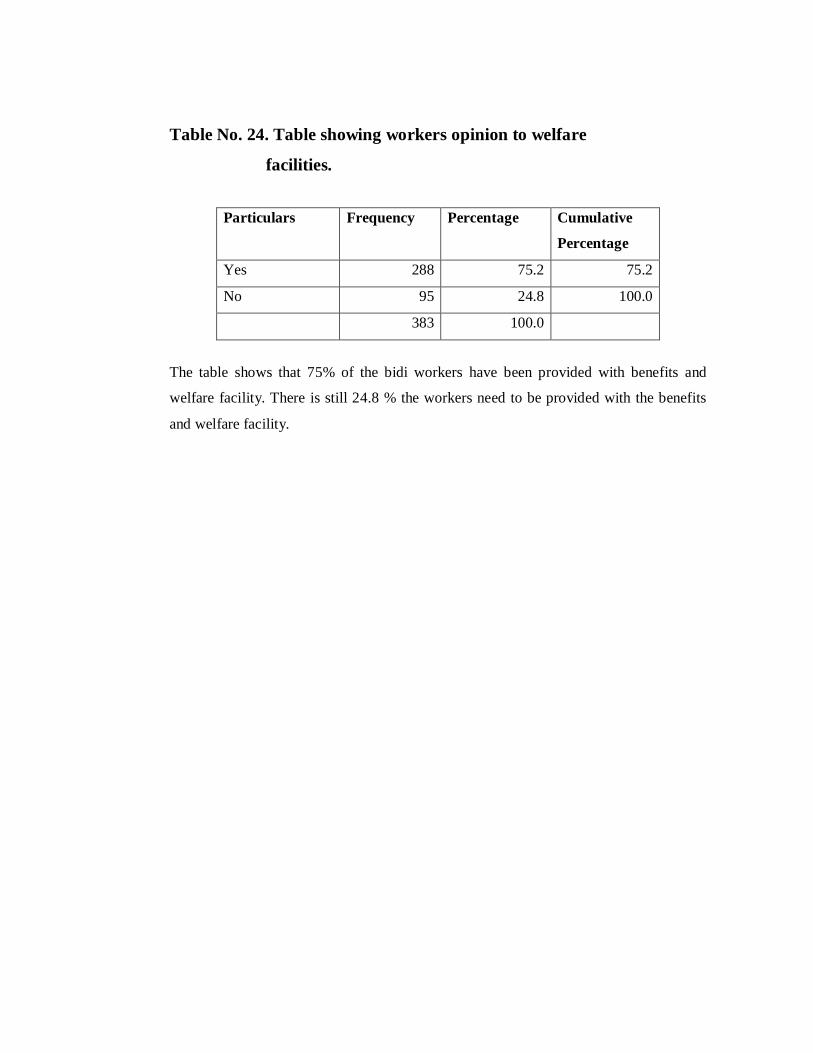
Table No. 24. Table showing workers opinion to welfare
facilities.
Particulars Frequency Percentage Cumulative
Percentage
Yes 288 75.2 75.2
No 95 24.8 100.0
383 100.0
The table shows that 75% of the bidi workers have been provided with benefits and
welfare facility. There is still 24.8 % the workers need to be provided with the benefits
and welfare facility.
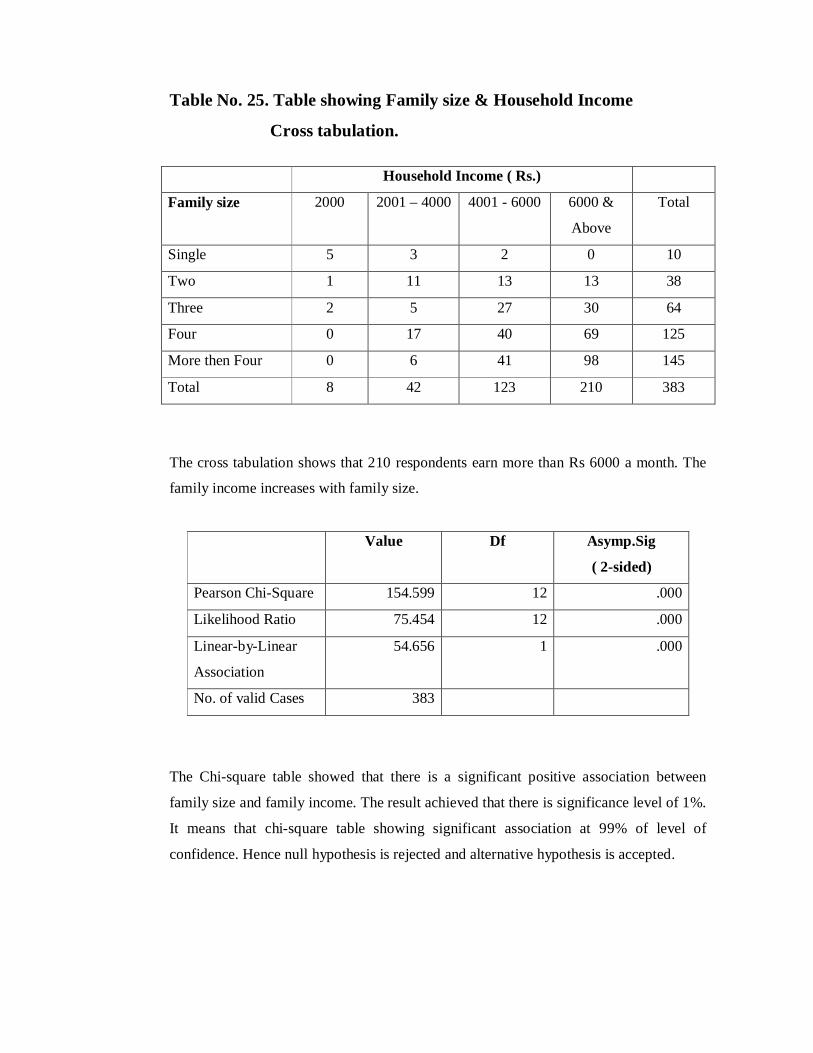
Table No. 25. Table showing Family size & Household Income
Cross tabulation. Household Income ( Rs.)
Family size 2000 2001 – 4000 4001 - 6000 6000 &
Above
Total
Single 5 3 2 0 10
Two 1 11 13 13 38
Three 2 5 27 30 64
Four 0 17 40 69 125
More then Four 0 6 41 98 145
Total 8 42 123 210 383
The cross tabulation shows that 210 respondents earn more than Rs 6000 a month. The
family income increases with family size.
Value Df Asymp.Sig
( 2-sided)
Pearson Chi-Square 154.599 12 .000
Likelihood Ratio 75.454 12 .000
Linear-by-Linear
Association
54.656 1 .000
No. of valid Cases 383
The Chi-square table showed that there is a significant positive association between
family size and family income. The result achieved that there is significance level of 1%.
It means that chi-square table showing significant association at 99% of level of
confidence. Hence null hypothesis is rejected and alternative hypothesis is accepted.
FINDINGS
1. It is found that all bidi workers are women. 91 % of bidi workers are married.
Out of the remaining 9 %, only 1 % are un-married while another 8% are
widows.
2. It is observed that 60 % of workers fall into the age bracket of 21 to 40 years.
This is the age during which a person’s earning capacity is at its peak. Another 40
% of workers are in the age bracket of 41 years and above and these are not ready
to accept alternate work.
3. It can be interpreted that 85 % of the workers speak Telugu. It has a implication
that majority of workers belonging to telugu speaking are familiar with the skill
of bidi rolling. These mostly belong to padmashali religion, a community who is
actively involved in bidi rolling.
4. Literacy can be considered as acid test of socio-economic and cultural
improvement of a society. Education is considered as the major component of
human resource development and socio-economic development of the society.
The results reveal that around 37 % of the bidi workers are illiterate. Majority
means 91 % of workers have at the most completed 10th standard and have left
their education in between. As educational level is very low, so they are forced to
accept bidi rolling job.
5. Among bidi workers more the number of members in the family the more income
will be generated as they will get a helping hand for work. 70 % of employees
have either four or more then four members in their family.
6. In concern to good educational background amongst bidi workers on 11% are
illiterate. While remaining 89 % are literate. More surprising is that 24 % of
children have done their graduation and non of these educated children are
involved in bidi rolling work.
7. The comparison between education level between bidi workers and their children
implicates that there is increase in education level of bidi workers children. This
shows that the bidi workers don’t want their children to continue in same type of
work and so they are giving importance to education.
8. 82.77 % of the workers are working under organized factories where the
manufacturing unit provides all kinds of raw material to workers and then they
prepare bidis. This type of work structure is also termed as organised
employment. Only 17.5% of workers are working under Un-organized factory
undertaking where a middleman operates between the manufacturer and worker
and this may lead to exploitation.
9. It is analysed that around 98% of the workers have ID-Cards which they get on
completing 18 years of age and which is compulsory for getting benefits offered
by the government.
10. It is observed that 92 % of the workers were working for 8 to 10 hours a day.
They have to simultaneously do household work like cooking and also bidi
rolling. Only 8 % of the workers were working for 12 hours a day.
11. Majority means 84 % of workers work for 6 days a week. They get one day
weekly off either on Wednesday or Sunday which differs from organisation to
organisation. Only 5.5 % of workers work for 7 days a week.
12. 91% workers have reported that they get weekly payment for their work
depending upon the number of bidi they have rolled in a week. The last day
before their weekly off is their payment day.
13. Income is an important factor to find out the standard of living of a particular
family. 68 % or workers get less then Rs 3000 a month while remaining have
above Rs 3000. The workers are given targets of rolling 1000 bidis a day for
which they get Rs120 as wages. In a month they get 25 days payment.
14. Most of the workers live under below poverty line. The basic cause of poverty
among bidi workers is basically inheritant in nature. As their parents are poor the
next generation also faces the same problems of poverty. A part from this cause
some other causes like low wages, lack of job opportunities and the work culture
of these workers are highly responsible for poverty.
15. The monthly household income of an individual refers to whether the workers are
able to live a comfortable life with the income they earn. 45 % of workers have a
household income up to Rs 6000 a month while 55 % of workers have more than
Rs 6000. This indicates that though the individual income of workers is less, then
too as the more number of household members are involved in the act more
income is generated.
16. 37 % of workers have complaints about payment cuts if they don’t comply with
the set standards and targets. But sometimes it is that the raw material itself is of
low quality, the shape of bidi is not proper or when the tobacco is leaking from
bidi then it is considered as wastage and so the payments is cut accordingly as per
the number of bidis get discarded. 74 % of workers said that they get timely
payment to their wages. While as 26 % said that they don’t get it on time but gets
delayed by 1 to 2 days.
17. It is observed that all the bidi workers have to travel around 5 to 6 km a day for
bringing raw material and then providing them with finished goods. This work
also of getting raw material and returning bidis of it has a shift timings. In
morning it is 10 to 1 am and in afternoon it is from 2 pm to 5 pm. The workers
have to come for collection in their allotted time only.
18. It is interesting to know that 73% of workers live in their own house which is
termed to be a good socio economic condition. Here majority of workers have
referred that they own their house as they have got it under central government
housing scheme for bidi workers.
19. A sizeable amount of workers that is 50 % live in slab houses while as another 46
% live under Tin/Asbestos roof. This type of roofing radiates a lot of heat and
does can cause health problems among workers.
20. Bidi workers who have not got houses from government do not have proper
sanitation facilities in their house. They use common sanitation facilities. The
government had given them an offer of building toilets in their houses where they
will get Rs 9000 for the same. But the scheme was a total failure as no drainage
facilities is available where they stay.
21. The analysis indicated that around 81 % of workers have not taken any loan and
around 19 % of them have taken some or other loan from different sources.
Workers are unable to get loan from any other sources due to weak economic
background. While as the savkar’s charge a lot of interest so they don’t go for
borrowing loans and have limited their needs.
22. 81 % of workers have not taken any loan due to fewer earnings and they are
unable to pay loan from their monthly earnings. Secondly as they are termed as
people under below poverty line so they don’t get easy loans. In case of
emergency they either borrow it from friend, relatives or from savkar’s. The
savkars generally charge a very high rate of interest.
23. 93 % of respondents have good health and only 7 % have some health problems.
The survey remarkably noted that majority of them don’t have serious health
issues. The only complaint was to back pain as they have to sit and roll bidis and
that too for 8 to 10 hours a day.
24. It’s revealed that 90 % of workers are not ready to accept any other type of work
as they are comfortable with bidi rolling. Only 10 % have shown some interest in
accepting different types of work. This may be due to low literacy level and they
lag confidence and awareness to whether they will be able to take some other
type of work.
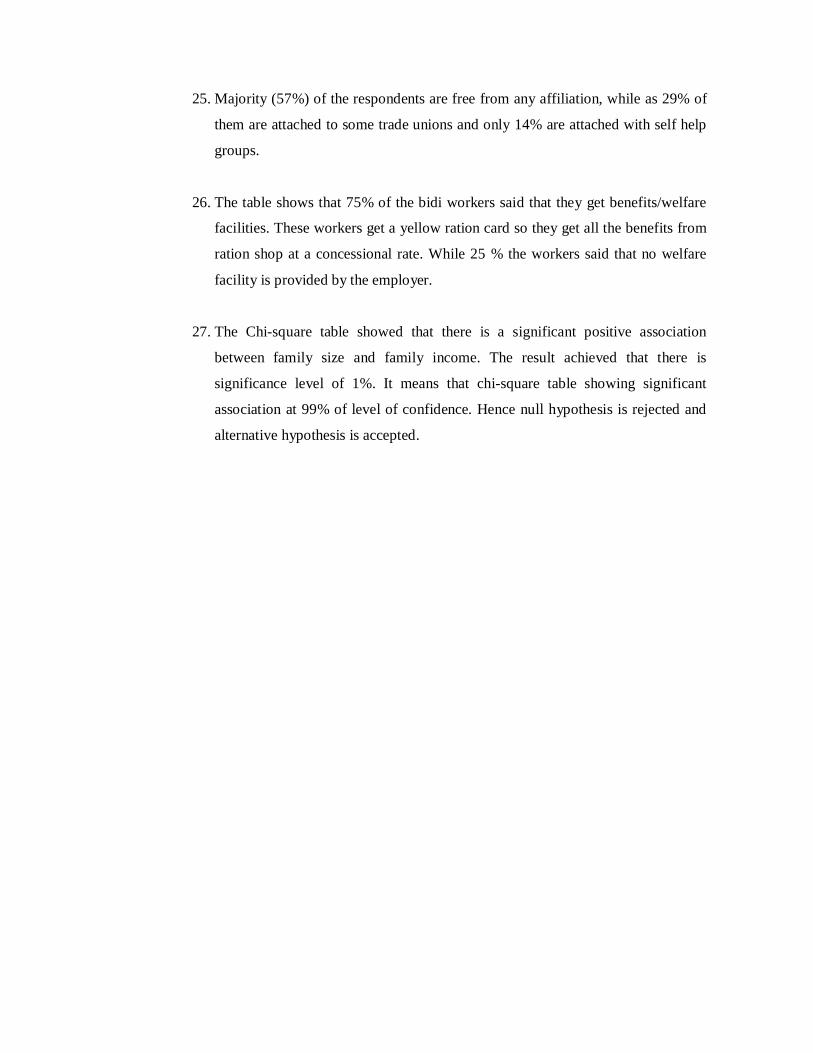
25. Majority (57%) of the respondents are free from any affiliation, while as 29% of
them are attached to some trade unions and only 14% are attached with self help
groups.
26. The table shows that 75% of the bidi workers said that they get benefits/welfare
facilities. These workers get a yellow ration card so they get all the benefits from
ration shop at a concessional rate. While 25 % the workers said that no welfare
facility is provided by the employer.
27. The Chi-square table showed that there is a significant positive association
between family size and family income. The result achieved that there is
significance level of 1%. It means that chi-square table showing significant
association at 99% of level of confidence. Hence null hypothesis is rejected and
alternative hypothesis is accepted.
SUGGESTIONS
1. The educational level of bidi workers is very low, so they don’t have confidence
of taking any alternate work. Here with the help of some NGO’s the government
can promote training for some alternate work which the bidi workers can
undertake.
2. The bidi workers now get only Rs.120 for 1000 rolled bidi’s. But there are some
state governments who have sanctioned Rs 165 for 1000 bidi’s as the minimum
wage. So the state labour department should take necessary actions to implement
the minimum wage rate.
3. The general living conditions of workers is poor. Those who haven’t got houses
from government schemes live in slums with no proper roofing, drinking water
facility and sanitation. The government should try to implement housing schemes
to those remaining workers under Bidi Gharakul where they get good houses and
other facilities in it.
4. So as to bring the workers above poverty line they should be provided with fair
wages. Some form of other work should be taught to them which may give them
higher wages. The government with some social works department can go for
skill development where they learn new things and are able to come out from the
trap of below poverty line.
5. Every bidi workers has to travel nearly 5 to 6 kilometers a day for bring bidi
material from manufacturer and returning the finished ones. This takes a lot of
time to go and come back along with material. So it is suggested that
manufacturer should provided distribution center at near by places so they can
save time which can be effectively used for making more bidis and getting more
payment.
6. It is suggested that the bidi workers should be able to sort their tendu leaves on
their own. This will avoid getting faulty leaves and thus they may not have a
payment cut due to faulty raw material.
7. As in the present generation, the children of bidi workers are getting more
literate, it is suggested that the state government should increase the amount of
bidi scholarships to their children. This will help them for future studies and help
them to come out of this inheritant work and improve their socio economic
conditions.
8. Workers are not taking loans as they get at a very higher rate from savkar.
Secondly banks are not giving loans to them as they cant give bank guarantees.
So it is suggested that the government can start a special “Bidi kamgar Loan
Scheme” under which the bank will give loans after seeing their bidi ID cards
and their length of service and give loan which can have a repayment facility to
some amount on daily basis as a recurring account.
9. As bidi workers are more prone to health diseases they should be provided with
free health check-up. This can be provided by the Health department under
Municipal Corporation. This should be provided only to yellow ration card
holders having Bidi Identity cards.
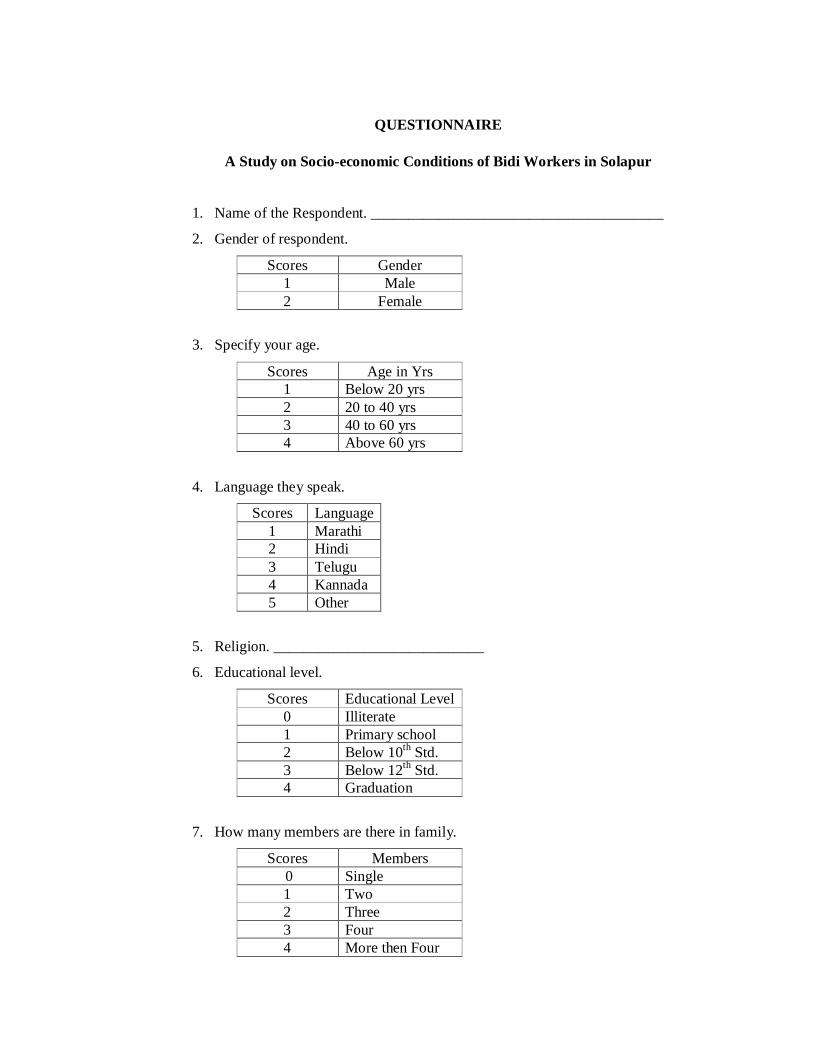
QUESTIONNAIRE
A Study on Socio-economic Conditions of Bidi Workers in Solapur
1. Name of the Respondent. _______________________________________
2. Gender of respondent.
Scores Gender 1 Male 2 Female
3. Specify your age.
Scores Age in Yrs 1 Below 20 yrs 2 20 to 40 yrs 3 40 to 60 yrs 4 Above 60 yrs
4. Language they speak.
Scores Language 1 Marathi 2 Hindi 3 Telugu 4 Kannada 5 Other
5. Religion. ____________________________
6. Educational level.
Scores Educational Level 0 Illiterate 1 Primary school 2 Below 10th Std. 3 Below 12th Std. 4 Graduation
7. How many members are there in family.
Scores Members 0 Single 1 Two 2 Three 3 Four 4 More then Four
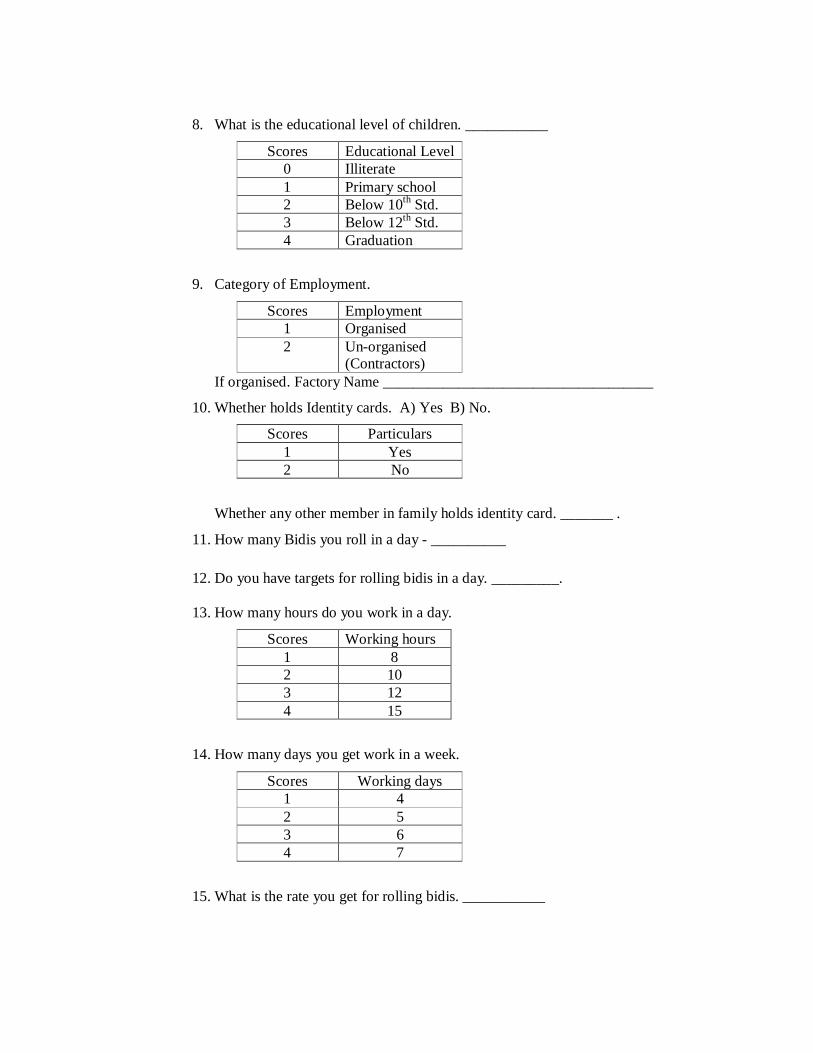
8. What is the educational level of children. ___________
Scores Educational Level 0 Illiterate 1 Primary school 2 Below 10th Std. 3 Below 12th Std. 4 Graduation
9. Category of Employment.
Scores Employment 1 Organised 2 Un-organised
(Contractors) If organised. Factory Name ____________________________________
10. Whether holds Identity cards. A) Yes B) No.
Scores Particulars 1 Yes 2 No
Whether any other member in family holds identity card. _______ .
11. How many Bidis you roll in a day - __________
12. Do you have targets for rolling bidis in a day. _________.
13. How many hours do you work in a day.
Scores Working hours 1 8 2 10 3 12 4 15
14. How many days you get work in a week.
Scores Working days 1 4 2 5 3 6 4 7
15. What is the rate you get for rolling bidis. ___________
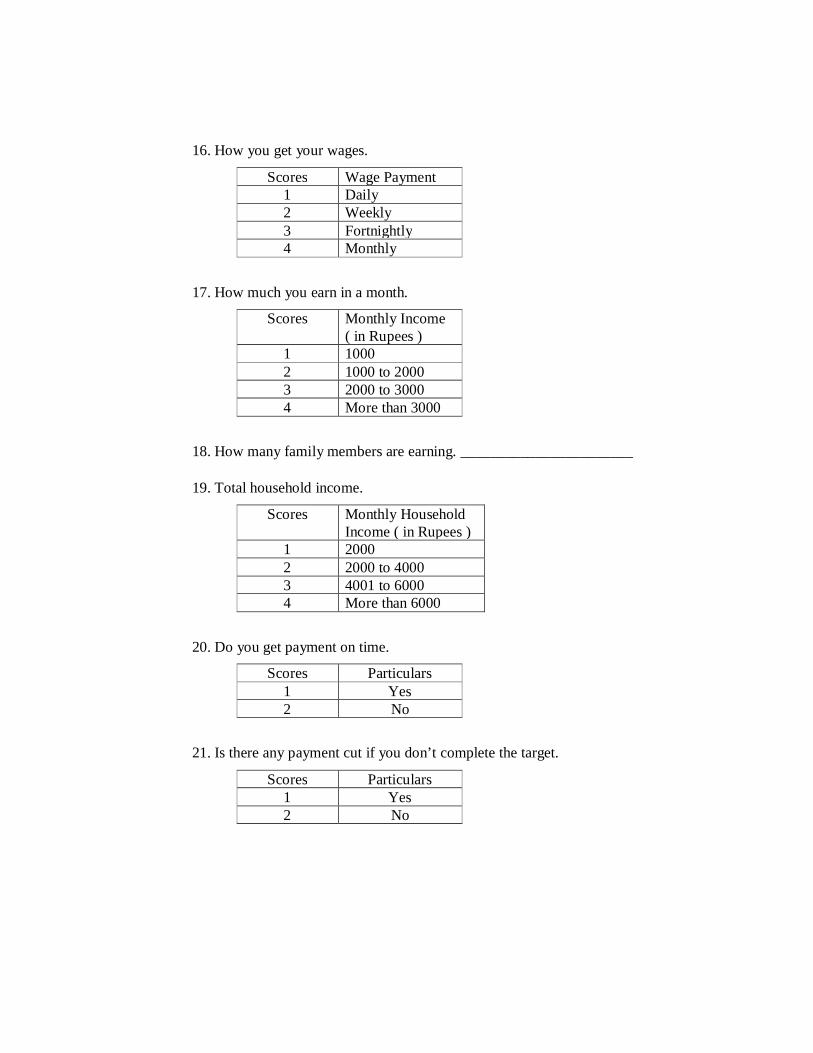
16. How you get your wages.
Scores Wage Payment 1 Daily 2 Weekly 3 Fortnightly 4 Monthly
17. How much you earn in a month.
Scores Monthly Income ( in Rupees )
1 1000 2 1000 to 2000 3 2000 to 3000 4 More than 3000
18. How many family members are earning. _______________________
19. Total household income.
Scores Monthly Household Income ( in Rupees )
1 2000 2 2000 to 4000 3 4001 to 6000 4 More than 6000
20. Do you get payment on time.
Scores Particulars 1 Yes 2 No
21. Is there any payment cut if you don’t complete the target.
Scores Particulars 1 Yes 2 No
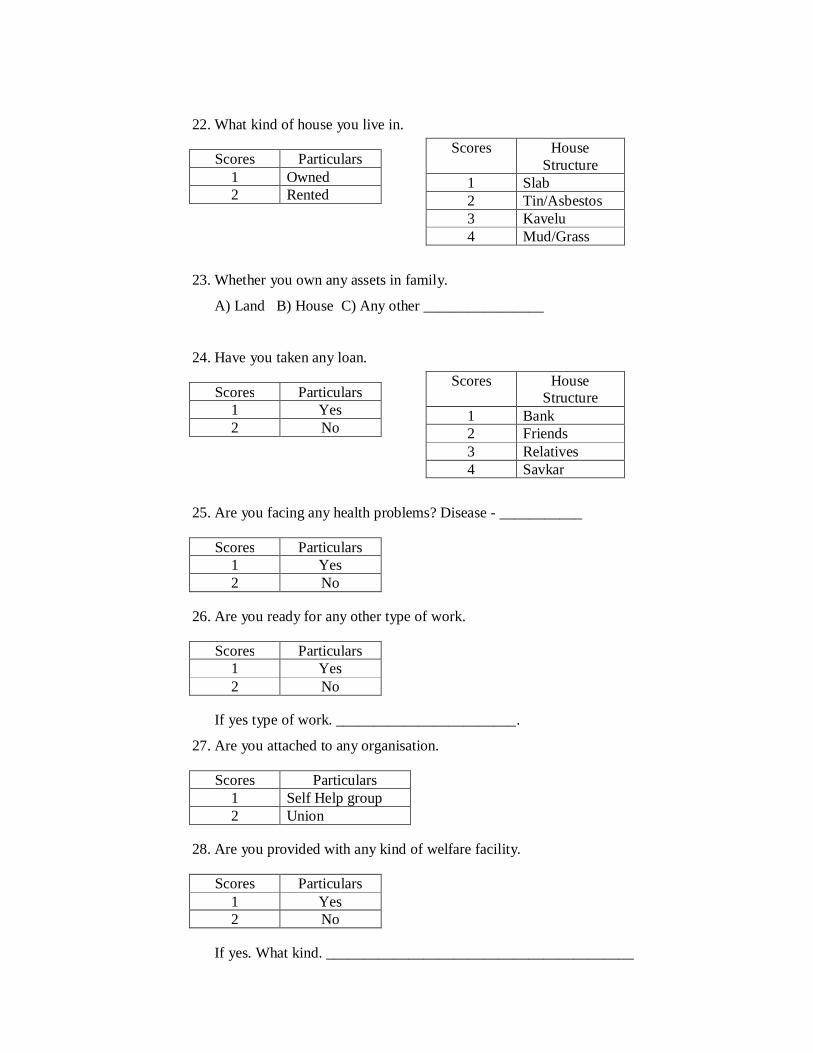
22. What kind of house you live in.
23. Whether you own any assets in family.
A) Land B) House C) Any other ________________
24. Have you taken any loan.
25. Are you facing any health problems? Disease - ___________
26. Are you ready for any other type of work.
If yes type of work. ________________________.
27. Are you attached to any organisation.
28. Are you provided with any kind of welfare facility.
If yes. What kind. _________________________________________
Scores House Structure
1 Slab 2 Tin/Asbestos 3 Kavelu 4 Mud/Grass
Scores Particulars 1 Owned 2 Rented
Scores House Structure
1 Bank 2 Friends 3 Relatives 4 Savkar
Scores Particulars 1 Yes 2 No
Scores Particulars 1 Yes 2 No
Scores Particulars 1 Yes 2 No
Scores Particulars 1 Self Help group 2 Union
Scores Particulars 1 Yes 2 No
Books The Beedi and Cigar Workers(Conditions of Employment)Act,1966 along with The Beedi Workers Welfare Cess Act,1976,The Beedi Workers Welfare Cess Rules,1976, The Beedi Workers Welfare Fund Act,1976,The Beedi Workers Welfare Fund Rules,1976, Bare Act with short notes.-New Delhi: Universal Law Book,2002. 63p. MP-R Daur, Arun Kumar Work,livelihood and employment in the beedi sector paper 4 IN Seminar on Globalisation and the Women's Movement in India(2005:New Delhi). Organised by Centre for Women's Development Studies, January 20-22, 2005. India. Ministry of Labour. Labour Bureau Report on socio-economic conditions of women workers in selected beedi units in India (1994-95).- Chandigarh: The Bureau, 1996 102p. Manjeshwar, Madhava B Study of the problems of women beedi workers in Dakshina Kannada.-sl:sn,n.d. 7p. Government of India. Ministry of Labour. Labour Bureau. Smila/Chandigarh Socio-Economic conditions of woman workers in selected food proceesing industries including sea and marine products (2008).
A study on the socio-economic status of women employees in tea plantation industries by A.Mahalakshmi International journal of Science, Engineering and Technology Research (IJSETR) Volume 1, Issue 6, December 2012. Measuring the Socio-economic status of urban below poverty line families in Imphal city, Manipur: A livelihood study. Dr.G.R.Rathod et.al International journal of marketing, Financial services & Management Research. Vol 1 Issue 12, Dec. 2012, ISSn 22773622. A study on occupational health hazards among women Beedi-workers of murshidabad district in west Bengal. By Chandra Kanta Das. International Journal of Research in commerce and Management. Vol. 4 ( 2013) Issue No. 1 (January). A study on Socioeconomic conditions of women workers in cashew industries of Kanyakumari district. By R Sivanesan. Int. Journal of Management Research & Business Strategy, Vol.2, No.4, October 2013. A Case study on Socio-economic conditions of Tea Garden Labourers- Lohpohia Tea Estate of Jorhat District, Assam. By Gadapani Sarma. A journal of Humanities & Social Science, Vol. – I, Issue – III, January 2013. Study on the Effect of Socio-economic Parameters on Health Status of the Toto, Santal, Sabar and Lodha Tribes of West Bengal, India Antara Dhargupta1, A. Gos Stud Tribes Tribals, 7(1): 31-38 (2009)