udc 669 . 1 . 012 . 4 (510) : 669 . 162 prospects of iron and steel ... · 1 . 012 . 4 (510) : 669...
TRANSCRIPT

NIPPON STEEL TECHNICAL REPORT No. 94 July 2006
- 16 -
UDC 669 . 1 . 012 . 4 (510) : 669 . 162
Prospects of Iron and Steel Production and Progress ofBlast Furnace Route in China
Yoshio OKUNO*1
Abstract
This paper reports the results relating to the following four subjects: i) current
status and future prospects of iron and steel production in China; ii) equipped plant-
size and operating condition of blast furnaces that sustain Chinese big steel produc-
tion; iii) trends of demand and supply of iron ore and coal for blast furnaces; and iv)
challenges and problems entailed by production increases. Competition with China
in the raw materials and coal market and excessive production capacity of blast
furnaces in China negatively impact blast furnaces in Japan.
ore, coal, pig iron, crude steel and steel products of the country andthe percentage shares of principal provinces. The number of compa-nies operating blast furnaces plant is estimated at approximately 800,and many of them are located in the north and northeast regions,where there are many coal and ore mines. With respect to the pro-duction of finished steel products, on the other hand, the coastal re-gions are responsible for an overwhelmingly large share. This meansthat the metal (pig iron and steel) and finished products are producedseparately in regions away from each other, and integrated steelmakersproducing from metal iron to final products at one location andsteelmakers specialized in specific products, which are commonlyseen in Japan, are difficult to form. As a result, inefficient use ofenergy and high costs due to the long-distance transportation of semi-finished products are inevitable.
Table 2 shows the crude steel outputs of major Chinesesteelmakers that produced 5 Mtpy or more in 2004 and their growthrates from 2001 to 2004. The companies having a capacity of 6 to 7Mtpy exhibited high growth rates; they are located in medium-de-veloped regions a little away from the coastal regions. In contrast,the four priority steelmakers, namely the Baoshan Group, Anshan,Shougang and Wuhan, and the steelmakers in the frontier regionsshowed comparatively low growth rates. The expansions of themiddle-scale steelmakers in the medium-developed regions are dueto aggressive shutdown of small blast furnaces and construction oflarge ones through acquisitions of small companies. However, inspite of the rapid increase in the crude steel production in these re-gions, the supply/demand problem of excessive production of semi-finished products and short supply of finished products persists be-
1. IntroductionWith the growth of the Chinese GDP, Chinese steel production
has increased dramatically, and surpassed 200 million metric tonsper year (Mtpy) in 2002 in terms of crude steel. While the rapidgrowth of the Chinese steel market has affected the Japanese steelindustry positively, it has also made it difficult for the Japanese steelindustry to secure sufficient quantities of raw materials. The rapidincrease in Chinese steel production inevitably leads to the competi-tion between the steel industries of the two countries not only in themarket of finished products but also in that of raw materials. Fur-thermore, an excessive steel production capacity or a slow-down ofthe economic growth in China will lead to the export of a great quan-tity of semi-finished products from the country, and this will signifi-cantly influence the neighboring Asian countries. For this reason, itis important to fully understand the present condition and future pros-pects of the Chinese steel industry. This paper examines the operat-ing conditions of blast furnaces in China and the trends in the supplyand demand of raw materials, prospects the steel production of thecountry in the near future, and points out problems arising from ex-panded production.
2. Present Steel Production of China and FutureProspectsSupported by the economical growth policy of the country, the
steel production of China has increased remarkably since 2000: theproduction of pig iron and crude steel reached 252 and 269 Mtpy,respectively, in 2004. Table 1 shows the national production of iron
*1 ex-Fellow

NIPPON STEEL TECHNICAL REPORT No. 94 July 2006
- 17 -
cause of an insufficiency of rolling facilities.The production capacity of pig iron in the whole country is said
to be excessive by roughly 80 Mtpy, and that of steel by 60 Mtpy asof 2005. Owing to this imbalance, the international steel trade ofChina changed dramatically from 2003 to exhibit a rapid increase inthe export of semi-finished products: the Chinese export of steel in2005 is expected to surpass import by no less than 12 million metrictons. This means that China has become another steel exporter and acompetitor of Japan in the international steel market.
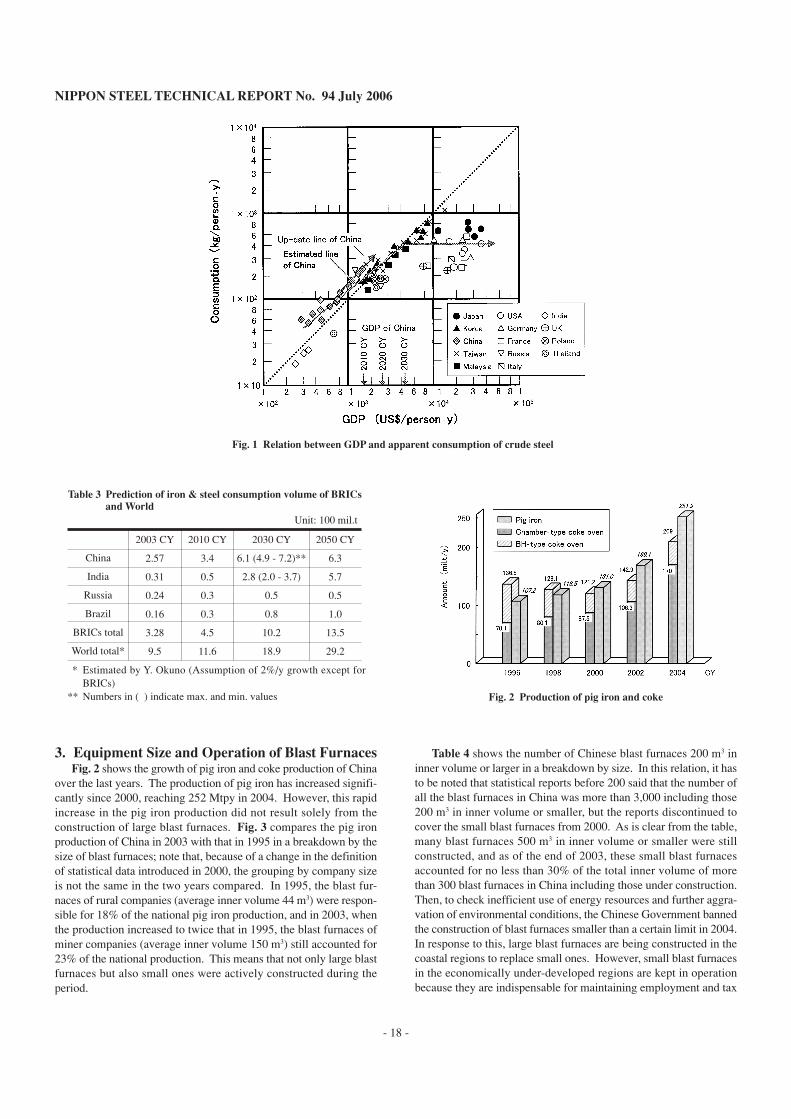
The future trend of the steel consumption of China is very impor-tant in forecasting the trends in the global markets of raw materialsand steel products. In relation to this, we estimated the steel con-sumption of China in the near future based on the relation betweenapparent crude steel consumption and GDP per person-year. Fig. 1shows the relations between the steel consumption and GDP of 14countries; the apparent steel consumption grows roughly in propor-tion to GDP up to US$ 5000/person-year. The GDP of China sur-passed US$ 1000/person-year, and the steel consumption reached127 kg/person-year in 2003, and the steel consumption has grownfollowing the same curve thereafter. If the GDP of the country in thenear future is given, then we can approximate the steel consumptionfrom the graph. A prospect of the GDP of China was reported by anorganization of the United Nations1). Then, the steel consumption ofthe country in this GDP was estimated based on a curve of the latest
consumption growth (up-date line in Fig. 1). According to the esti-mation, it will be approximately 330 Mtpy in 2010 and 650 Mtpy in2030. The IISI also estimated the steel consumptions of the fourBRICs countries up to 2050 by a similar method2); Table 3 outlinesthe results.
According to the IISI estimation, the very rapid growth of steelconsumption in China will continue and slow down from 2030s to2050s, but at that time, India will emerge as another rapidly growingsteel consumer country in place of China. As a result, the world steelconsumption in 2050 is estimated at 2,900 Mtpy, roughly three timesthat at present. While the steel consumption of a country is affected bynot only the steel production in the country but also the import andexport of steel products and scrap, the steel production of China andIndia will grow, most probably, roughly in proportion to their respec-tive steel consumptions. Currently, the steel consumption of China isgrowing at a rate higher than those estimated by various research insti-tutes, and this indicates that the short supply of iron ore and cokingcoal and the environmental problem will aggravate yet more, and thesteel production growth of China will come to a turn earlier than so farexpected. Since the supply of iron ore and coking coal is one of themost serious future problems of the Japanese steel industry, it is neces-sary that the ironmaking organizations of the industry concentrate ef-forts on the diversification of supply sources and the development ofnew technologies for using a wider variety of raw materials.
Table 1 Production of raw materials, iron and steel in each province of China
Table 2 Crude steel output and its growth rate of main companies in China (2004 CY)
Bao Gr.
Anshan
Wuhan
Shougang
Maanshan
Tangshan
Shangang
Crude steel
(10 mil. t/y)
2.14
1.13
0.93
0.85
0.80
0.77
0.76
Growth rate
(%)*
20.7
28.2
40.0
5.6
104.8
139.4
413.6
Hualing
Tinan
Handan
Hualing Gr.
Panzhihua
Benxi
Baotou
Crude steel
(10 mil. t/y)
0.71
0.69
0.68
0.66
0.55
0.54
0.54
Growth rate
(%)*
151.1
126.7
115.9
207.5
30.1
50.8
38.2
* Growth rate from 2000 CY to 2004 CY
Items
(CY)
China total (mil. t/y)
Beijing (%)
Inner Mongolia (%)
Shanxi (%)
Shandong (%)
Liaoning (%)
Hebei (%)
Shanghai (%)
Jiangsu (%)
Henan (%)
Sichuan (%)
Iron ore
(1990)
179.3
0
5.0
7.1
3.5
25.3
26.0
0
1.7
1.1
6.5
Coal
(2003)
1326.7
0.6
9.0
22.2
11.1
4.4
5.0
0
2.1
8.9
2.4
Pig iron
(2001)
155.5
5.0
3.1
13.4
5.1
10.2
14.0
9.5
2.9
3.6
3.9
Crude steel
(2001)
151.6
5.3
3.0
4.0
4.8
11.0
13.0
12.4
5.6
3.5
4.6
Steel products
(2001)
160.7
4.5
2.4
3.1
5.2
10.4
11.6
10.4
11.7
3.1
4.0
NIPPON STEEL TECHNICAL REPORT No. 94 July 2006
- 18 -
3. Equipment Size and Operation of Blast FurnacesFig. 2 shows the growth of pig iron and coke production of China
over the last years. The production of pig iron has increased signifi-cantly since 2000, reaching 252 Mtpy in 2004. However, this rapidincrease in the pig iron production did not result solely from theconstruction of large blast furnaces. Fig. 3 compares the pig ironproduction of China in 2003 with that in 1995 in a breakdown by thesize of blast furnaces; note that, because of a change in the definitionof statistical data introduced in 2000, the grouping by company sizeis not the same in the two years compared. In 1995, the blast fur-naces of rural companies (average inner volume 44 m3) were respon-sible for 18% of the national pig iron production, and in 2003, whenthe production increased to twice that in 1995, the blast furnaces ofminer companies (average inner volume 150 m3) still accounted for23% of the national production. This means that not only large blastfurnaces but also small ones were actively constructed during theperiod.
Table 4 shows the number of Chinese blast furnaces 200 m3 ininner volume or larger in a breakdown by size. In this relation, it hasto be noted that statistical reports before 200 said that the number ofall the blast furnaces in China was more than 3,000 including those200 m3 in inner volume or smaller, but the reports discontinued tocover the small blast furnaces from 2000. As is clear from the table,many blast furnaces 500 m3 in inner volume or smaller were stillconstructed, and as of the end of 2003, these small blast furnacesaccounted for no less than 30% of the total inner volume of morethan 300 blast furnaces in China including those under construction.Then, to check inefficient use of energy resources and further aggra-vation of environmental conditions, the Chinese Government bannedthe construction of blast furnaces smaller than a certain limit in 2004.In response to this, large blast furnaces are being constructed in thecoastal regions to replace small ones. However, small blast furnacesin the economically under-developed regions are kept in operationbecause they are indispensable for maintaining employment and tax
Fig. 1 Relation between GDP and apparent consumption of crude steel
Table 3 Prediction of iron & steel consumption volume of BRICsand World
China
India
Russia
Brazil
BRICs total
World total*
2003 CY
2.57
0.31
0.24
0.16
3.28
9.5
2010 CY
3.4
0.5
0.3
0.3
4.5
11.6
2030 CY
6.1 (4.9 - 7.2)**
2.8 (2.0 - 3.7)
0.5
0.8
10.2
18.9
2050 CY
6.3
5.7
0.5
1.0
13.5
29.2
Unit: 100 mil.t
* Estimated by Y. Okuno (Assumption of 2%/y growth except forBRICs)
** Numbers in ( ) indicate max. and min. values Fig. 2 Production of pig iron and coke

NIPPON STEEL TECHNICAL REPORT No. 94 July 2006
- 19 -
income, and thus, the coexistence of large and small blast furnacesstill remains widely. A noteworthy fact is that recently there aresome plans to construct smelting reduction plants by processes suchas Hismelt and COREX to fill the place of small blast furnaces slatedto shut down.
Table 5 shows the average figures of the operation data of theblast furnaces of large- and medium-size steelmakers, which account
for more than 70% of the pig iron production of the country, in 1995and thereafter. While the performance of the blast furnaces began toimprove from around 2000 thanks to the use of high-quality importedores and high-strength coke, many of them operate at low blast tem-peratures, high slag rates and low top pressure, and for this reason,their average coke rate in 2003 was higher than that of Japaneseblast furnaces by approximately 50 kg per metric ton of pig iron (kg/t-p). It should be noted, however, that some Chinese steelmakersbegan to focus attention on the development of technologies for im-proving the quality of burden materials to increase the amount ofpulverized coal injection (PCI). Based on the findings thus obtained,the blast furnaces of Baoshan, for example, have attained an excel-lent coke rate of 290 kg/t-p and a PCI rate of as high as 200 kg/t-p,approximately, by using sinter having a lower alumina content thanthat of Japanese sinter and high-strength coke. The performanceimprovement of Chinese blast furnaces in the future will depend onhow rapidly the small blast furnaces, which are operating at cokerates of 700 kg/t-p or higher, are replaced by large ones.
4. Trends in Production and Consumption of Coaland CokeChina is in the third place following U.S.A. and Russia in terms
of coal deposits, but it is in the first place in terms of coal produc-tion, accounting for roughly 30% of the world total. Table 6 showsthe principal countries’ shares of the exploitable deposits and annualproduction of coal (mainly bituminous and anthracite coals). Thecoal reserve of China is estimated to sustain about 100 years of min-ing, which is shorter than 264 years of U.S.A. and 414 years of Aus-tralia. The coal production of China has shown a dramatic increase
Fig. 3 Steel company size and production of pig iron in China
Table 4 Number of blast furnaces in China
Inner volume (m3)
2001 CY
2003 CY
Under building
200 - 500
124
164
62
500 - 1000
22
26
1
1000 - 2000
29
33
10
> 2000
21
24
20
Total
196
247
93
Total inner volume of blast furnaces: 153.8×10³ m3 / 2001 CY, 1805.8×103 m3 / 2003 CY
Table 5 Operation of blast furnaces of large and medium-sizesteelworks
Productivity
Coke rate
Coal rate
Blast temp.
Slag ratio
Sinter + Pellet
Fe in burden
Sinter strength TI
CaO / SiO2 of sinter
Fe in sinter
Coke strength M40
Coke ash
S in coke
(t-p/m3 • d)
(kg/t-p)
(kg/t-p)
(℃)
(kg/t-p)
(%)
(%)
(%)
(-)
(%)
(%)
(%)
(%)
1995 CY
1.80
537
59
922
480
89.0
54.6
74.4
1.73
52.81
80.1
13.77
0.63
2001 CY
2.34
444
124
1 061
387
91.7
57.3
71.6
1.75
56.07
82.1
12.22
0.56
2003 CY
2.47
433
118
1 082
375
92.4
58.5
71.8
1.94
56.74
81.3
12.61
0.61

NIPPON STEEL TECHNICAL REPORT No. 94 July 2006
- 20 -
Table 6 Deposit and mined amount of coal in major countries
Deposit (%)
Mined (%)
USA
26.1
25.1
Russia
16.6
4.0
China
12.1
33.2
Australia
9.6
5.9
India
7.9
8.2
Germany
7.1
1.2
World total: Deposit amount 945.3 bil.t/y
Mined amount 3.71 bil.t/y (1998 CY)
over the last years, reaching 1,610 Mtpy in 2004. Shanxi Province isresponsible for nearly 40% of the national coal production, but theshares of inland regions such as Guizhou Province and Inner MongoliaAutonomous Region are increasing recently. With respect to thesize of coalmines, national priority mines account for 47% of theproduction, provincial mines for 16%, and rural mines for 37%, andthus the rural mines still account for a considerable part of the na-tional coal production. However, the poor performance of these smallmines will deteriorate further unless drastic measures are taken tomodernize the equipment. The coking coal deposit of China amountsto 23.5 billion metric tons, accounting for 17% of the world total,and its annual production accounts for nearly a half of the nationalcoal production.
While the steel industry is responsible for roughly 15% of thenational coal consumption, the mining companies of coking coal aremostly small, and their restructuring into large companies is littleencouraged. Furthermore, the development of coking coal mines issaid to be more retarded than that of non-coking coal mines. Forthese reasons, rapid increase in the production of coking coal is littleprobable. In such a situation, the steelmakers in the coastal regionshave been placing emphasis on the import of coking coal, and theimport amount hit a record high of 6.76 Mtpy in 2004; the principalsupply sources were Australia, Canada and Mongolia. Japan im-ported 7.61 Mtpy of Chinese coking coal in 2004, but in the latestsituation of the world market where coking coal is expected to be inshort supply in 2009 and thereafter, how long Japan can continueimporting the current quantity of coking coal from China dependson the rate of production increase of the Chinese steel industry. Inthis relation, the Japanese steel industry will have to further diver-sify the coal supply sources and develop technologies for use of a
wider variety of coal brands.As seen in Fig. 2, the coke production of China increased rapidly
with the increasing production of pig iron, reaching 209 Mtpy in2004. While this is nearly 50% of the world coke production, asmuch as 39 Mtpy came from environmentally problematic beehive-type coke ovens, some of them being modified into non-recovery-type ovens. Shanxi Province holds the largest share of the coke pro-duction, with a capacity for 80 Mtpy as of 2003, and the capacity ofthe province is expected to increase to 150 Mtpy when the coke ov-ens now being constructed are commissioned. In the whole country,however, the pig iron production increased at such a high rate thatcoke supply became tight since 2000.
In this situation, the price of coke exports (approximately 14 Mtpyin recent years) has risen significantly. In response to the increasingdemands, more than 50 coke oven batteries, each having a capacityfor 0.4 Mtpy or so, were constructed in 2003, and including thesebatteries, the coke production capacity of China increased report-edly by 60 Mtpy in 2004. Japan has been importing roughly 3 Mtpyof coke from China, but in the situation where the coke export ac-counts for 80% of the total amount of the seaborne trade of the coun-try, the present difficulty in keeping the price and quantity of thecoke import from China at the current level will persist. Therefore,it is necessary for the Japanese steel industry to secure technologyand equipment for continuing to produce high-quality coke withoutbeing affected by the change in coal supply sources.
Table 7 shows the production of coke in China and its consump-tion by the steel industry in 1995 and thereafter. The unit consump-tion of coke of Chinese steelmakers decreased year by year to recorda national average of 568 kg/t-p in 2003 (the Japanese national aver-age was 444 kg/t-p). The unit consumption was improved thanks tothe decrease in the coke rate of blast furnaces; the average coke rateof all the Chinese blast furnaces was 500 kg/t-p in 2003. The na-tional averages of the unit consumption and coke rate were higherthan those of the Japanese steelmakers by roughly 120 kg/t-p; this islargely due to the fact that small blast furnaces operating at cokerates of 700 kg/t-p or so are still responsible for more than 20% ofthe pig iron production of China. The future supply and demand ofcoke in China will depend on the increase in the pig iron productionand the replacement of small blast furnaces by large ones.
Table 7 Characteristics of coke consumption in China
Production of pig iron
Production of coke
Of which: coke from BH ovens
Coke for steel industry
Coke except for steel industry
Export coke
Coke consumption unit for
pig iron production
Average coke ratio of all Chinese BFs
Coke ratio of large & medium-size BFs
Coke ratio of residual BFs
Coal rate of large & medium-size BFs
(mil. t/y)
(mil. t/y)
(mil. t/y)
(mil. t/y)
(mil. t/y)
(mil. t/y)
(kg/t-p)
(kg/t-p)
(kg/t-p)
(kg/t-p)
(kg/t-p)
1995 CY
105.3
135.1
66.5
96.2
30.0
8.9
914
640
537
1 124
59
2001 CY
145.4
131.3
36.9
80.3
29.7
13.9
552
486
444
803
124
2003 CY
202.3
177.8
39.0
115.0
45.0
14.7
568
500
433
728
118

NIPPON STEEL TECHNICAL REPORT No. 94 July 2006
- 21 -
5. Trends in Production and Consumption of IronOreThe total iron ore deposit of China is estimated at 53.2 billion
metric tons, but the exploitable deposit is no more than 9 to 11.5billion metric tons. As seen with Table 8, which shows the principalcountries’ shares of the deposit and annual production of iron ore,China is the largest iron ore mining country of the world, being re-sponsible for 25% of the world production. The iron ore reserve ofChina is estimated to sustain 33 to 40 years of mining, which is shorterthan 219 years of Brazil and 124 years of Australia. The iron oreproduction of China increased over the last years and reached 310Mtpy in 2004. The distribution of Chinese iron ore deposit is un-even: a good part of the deposit is in the northern and northeasternregions3). About 50% of the deposit is low-reducibility magnetiteand 20% is hematite in fine, and the iron content of either of them isas low as 30% or so. Many blast furnaces in the inland regions uselocal ores containing impurity elements peculiar to each mine. Withrespect to the size of mines, national priority mines are responsiblefor 42% of the production, provincial mines for 15%, and other smallmines for 43%; the small mines still account for a considerable partof the national iron ore production.
The price of the iron ores from these mines is high because of thecosts for the top soil removal, dressing and transportation to distantsteelworks in the coastal regions. For this reason, the coastal steel-works actively import high-quality ores from abroad. Actually, theiron ore import in 2004 amounted to 208 Mtpy; the supply sourceswere Australia (36%), India (23%) and Brazil (21%). Comparedwith the iron ore import of Japan, the import from India and Brazil toChina is far larger. Over the last three years, the Chinese iron oreimport increased from the countries where the Japanese import de-creased, and China is now the largest iron ore buyer for all the ironore exporting countries except for Australia. Since the iron ore im-port is stressing the cargo handling capacities of Chinese ports to thelimits, a significant increase in the production of domestic mines isstrongly required to increase the pig iron production to 300 Mtpyand more. In May 2005, the Chinese Government newly introduceda permit system for the iron ore import to check its increase, and atthe same time, is promoting development of ore mines at places suchas Sichuan Province and Mongolia. The Japanese steel industry pres-ently depends much on the supply of iron ore and coal from Austra-lia, but diversification of supply sources will become increasinglyimportant also for Japan.
6. Prospected ProblemsThe Chinese steel industry has set out the following as the prior-
ity issues: (1) construction of handling and distribution systems forthe raw materials and products, (2) establishment of clean produc-tion systems (efficient use of raw material and energy resources andenvironmental protection measures), (3) improvement in production
processes by commercial application of advanced technologies and(4) development of next-generation materials. However, the mostserious problems in increasing the production will be the supply ofraw materials and environmental conservation. A cause of these prob-lems is the low energy efficiency of small- and medium-sizesteelmakers, especially that of small blast furnaces. The Govern-ment is well aware of this, and attempting to regulate the size of newblast furnaces by issuing a series of guidance. However, small- andmedium-size steelmakers play important roles as the sources of em-ployment and tax income in the inland regions where the economicgrowth rate is low, and the Government cannot close such compa-nies without careful consideration.
A problem peculiar to China that cannot be solved by reorgani-zation of steelmakers and introduction of advanced technology isthe uneven distribution of energy resources: coal deposits are mainlyin the northern, petroleum and natural gas reserves in the northeast-ern, and hydro energy resources in the southwestern regions, andconsequently, energy transportation is costly and optimum combina-tions of these resources are not realized easily. What is more, coal isresponsible for more than 60% of the energy supply of the country,and this makes it difficult to reduce energy consumption. As a re-sult, the CO
2 emission of China is no less than 14% of the world
total, an extremely high percentage compared with the share of GDPof 3% in the world economy. The CO
2 emission of the country is
expected to increase at an average rate of 3.6% every year to reach1.82 billion metric tons (reduced into the amount of carbon) in 2020,1.15 times that of U.S.A. in 2000 (1.58 billion metric tons, same asthe above)4).
According to statistical data covering large- and medium-sizesteelmakers, the energy consumption of the Chinese steel industryhas shown considerable improvement since 2000, but as seen withTable 9, the emission of SO
2 and dust is still high5). Furthermore,
with respect to coke production, the emission of hazardous gas fromthe coke ovens of Shanxi Province, for instance, accounts for 40%of the total of the province, and that of waste water 30% of the same.Most of the capital investments of the steel industry are allocated tothe increase in production capacity, and not to environmental con-servation measures. For this reason, further aggravation of environ-mental conditions is a widespread concern.
Table 8 Deposit and mined amount of iron ore in major countries
Deposit (%)
Mined (%)
Soviet-Un.
34.9
16.3
Brazil
19.9
16.4
Australia
8.9
13.0
Canada
6.9
3.5
China
5.3
24.0
India
4.2
6.0
World total: Deposit amount 169 bil.t/y
Mined amount 935 mil.t/y (1992 CY)
Table 9 Environmental practices of Chinese main steel companies
Crude steel (Mt/y)
Energy consumption (kg-coal/t-cs*)
Fresh water (m3/t-cs)
SO2 (kg/t-cs)
Dust (kg/t-cs)
Bao steel
11.6
656
5.3
1.79
0.50
Main companies
158.9
715
15.1
3.34
2.69
* Crude steel

NIPPON STEEL TECHNICAL REPORT No. 94 July 2006
- 22 -
7. ClosingThis paper has outlined the future prospects of the rapidly ex-
panding Chinese steel industry and the problems related to the blastfurnaces of the country that support the increasing steel production.The crude steel production of the country has increased dramaticallysince 2000, and the apparent steel consumption of China is expectedto surpass 300 Mtpy in 2010 and 600 Mtpy in 2030. More than 20%of the rapidly increasing steel production still depends on small-sizemines and blast furnaces, and this fact is one of the principal reasonsfor the aggravation of environmental conditions. The constructionof ironmaking equipment is being carried on yet further, and the in-creased production capacity will depend on overseas sources of raw
materials more and more, making the world market tighter. A causefor concern of the Japanese steel industry lies in the runaway in-crease in the already excessive production capacity of Chinese blastfurnaces and the consequent competition against the Chinese steelindustry in the raw material market.
References1) Fu-chen Lo et al.: Chinese Sustainable Development Framework Sum-
mary Report. UNU/IAS, Tokyo, 1999-11, p.132) IISI Report: Iron and Steel Technology. 2(7), 19(2005)3) Inazumi T.: a Private Letter4) Li Zhidong: Proceedings of 13th Conference of Japan Institute of En-
ergy. Tokyo, Jul., 2004, p.205) He Jicheng: a Private Letter