ubl annual report 2010
TRANSCRIPT

• Honesty and integrity
• Commitment and dedication
• Fairness and meritocracy
• Teamwork and collaborative spirit
• Humility and mutual respect
• Caring and socially responsible
[ Core Values ]
[ Mission ]• Set the highest industry standard for quality, across all areas of our operation, on a sustained basis
• Optimize people, processes and technology to deliver the best possible financial solutions to our customers
• Become the most sought after investment and
• Be recognized as the employer of choice
[ Vision ]To be a world class bank dedicated to excellence and to surpass the highest expectations of
our customers and all other stakeholders.

[ Contents ]Company Information
Directors’ Profiles
Directors’ Report to the Members
Statement of Corporate Social Responsibility
President & CEO Review
Growth at a Glance
International Network
Shari'ah Advisor's Report
Statement of Compliance with the Code of Corporate Governance
Review Report to the Members on Statement of Compliance with Best Practices of Code of Corporate Governance
Statement of Internal Controls
Auditors’ Report to the Members
Unconsolidated Statement of Financial Position
Unconsolidated Profit & Loss Account
Unconsolidated Statement of Comprehensive Income
Unconsolidated Cash Flow Statement
Unconsolidated Statement of Changes in Equity
Notes to and forming part of the Unconsolidated Financial Statement
Annexure ‘A’ as referred to in note 9.8 of Bank’s Unconsolidated Financial Statements
Annexure ‘B’ as referred to in note 10.7 of the Bank's unconsolidated and consolidated financial statements
Annexure ‘C’ as referred to in note 11.7 of Bank’s Unconsolidated Financial Statements
Annexure ‘D’ of the Bank's Unconsolidated Financial Statements
Auditors’ Report to the Members
Consolidated Statement of Financial Position
Consolidated Profit & Loss Account
Consolidated Statement of Comprehensive Income
Consolidated Cash Flow Statement
Consolidated Statement of Changes in Equity
Notes to and forming part of the Consolidated Financial Statements
Annexure 'A' as referred to in note 9.8 of Group's Consolidated Financial Statements
Annexure 'C' as referred to in note 11.7 of Group's Consolidated Financial Statements
Annexure 'D' of Group's Consolidated Financial Statements
Consolidated Statement of Financial Position (in US Dollars)
Consolidated Profit and Loss Account (in US Dollars)
Categories of Shareholders
Pattern of Shareholding
Notice of 51st Annual General Meeting
Statement of Material Facts
Form of Proxy
02
03
06
12
13
17
21
23
25
26
27
29
30
31
32
33
34
35
114
122
158
166
167
168
169
170
171
172
173
264
275
284
285
286
287
288
290
292
United Bank Limited02
Board of DirectorsHis Highness Sheikh Nahayan Mabarak Al NahayanChairman
Sir Mohammed Anwar Pervez, OBE, HPkDeputy Chairman
Mr. Omar Z. Al AskariDirector
Mr. Zameer Mohammed ChoudreyDirector
Mr. Muhammad Sami SaeedDirector
Mr. Seerat AsgharDirector
Mr. Amin UddinDirector
Mr. Arshad Ahmad MirDirector
Mr. Atif R. BokhariPresident & CEO
Committees of the Board
Board Audit CommitteeMr. Zameer Mohammed ChoudreyChairman
Mr. Muhammad Sami SaeedMember
Mr. Amin UddinMember
Mr. Aqeel Ahmed NasirSecretary
Board Human Resource &Compensation CommitteeMr. Omar Z. Al AskariChairman
Mr. Seerat AsgharMember
Mr. Atif R. BokhariMember
Mr. Jamal NasirSecretary
Board Risk Management CommitteeMr. Omar Z. Al AskariChairman
Mr. Arshad Ahmad MirMember
Mr. Atif R. BokhariMember
Mr. Ali SameerMember
[ Company Information ]
Chief Financial OfficerMr. Rayomond Kotwal
Company Secretary & Chief Legal CounselMr. Aqeel Ahmed Nasir
Registered Office13th Floor, UBL Building,Jinnah Avenue, Blue Area,Islamabad, Pakistan.
Head OfficeState Life Building No.1,I.I. Chundrigar Road,Karachi - 74000, Pakistan
Share RegistrarM/s. THK Associates (Pvt.) LimitedGround Floor, State Life Building No. 3,Dr. Ziauddin Ahmed Road,Karachi - Pakistan
AuditorsM/s. Ernst & Young Ford Rhodes Sidat Hyder,Chartered Accountants
M/s. BDO Ebrahim & Co.,Chartered Accountants
Legal AdvisorsM/s. Mehmood Abdul Ghani & Co.,Advocate
ContactsUAN: 111-825-111Contact Centre: 111-825-888Website: www.ubl.com.pk
Annual Report 2010 03
[ Directors Profile ]
Sheikh Nahayan Mabarak Al NahayanChairman, Board of Directors of United Bank Limited
The Chairman of the Board, Sheikh Nahayan Mabarak Al Nahayan'slife and career have been characterized by creativity, innovation, anddedicated public service. In his role as the Minister of Higher Educationand Scientific Research, he has guided and shaped higher educationin the United Arab Emirates and has established a successful modelfor higher education throughout the Gulf region.
In private business, Sheikh Nahayan is an active, successfulbusinessman, both within the United Arab Emirates and on theinternational stage. He heads the Abu Dhabi Group, one of the largestinternational investors in Pakistan, with interests in banking, tele-communications, pharmaceuticals, construction, petrochemicals,hotels, and real estate. He is chairman of the board of many importantcompanies, including Chairman of the Union National Bank in theUAE, Founder and Chairman of Warid Communications, Founder ofBank Al-Falah, in addition to being the chairman of United BankLimited.
In business, Sheikh Nahayan insists that all his projects must be “valuebased” as well as “goal driven.” Those who would work with him musthave integrity, a sound ethical touchstone, and a genuine concern forthose who are affected by the actions they take and the decisionsthey make. Sheikh Nahayan sees his role as one who sets standards,serves as a role model, and insists on accountability. He is also agreat believer in the social responsibility of private business, whereethics, morality, and transparency are important and where theoperations, practices, and attitudes of private companies must haverelevance to contemporary community values and needs.
A noted patron of the arts, Sheikh Nahayan strongly supports a widerange of activities, from natural history to music and culture, fromnational heritage to sports. He is a strong proponent of advancedtechnology and global best practices in education and business. Anactive philanthropist with a high sense of social responsibility, hechampions many humanitarian causes and provides strong supportfor individuals with disabilities. He also chairs and actively supportsmany groups and associations. These include: the Abu Dhabi Musicand Arts Foundation, the UAE Natural History Group, the MédecinsSans Frontières in the UAE, the Society of History and HistoricalHeritage of the UAE, The Millfield Association in the Arabian Peninsula,the Young Presidents Organization (YPO), the Abu Dhabi Cricket Club,the UAE Table Tennis Federation, the Arab Universities Sports Federation,and Friends of Al-Quds University in Abu Dhabi. A strong supporterof all cultural activities in Abu Dhabi and the UAE, including literature,theater, music, painting, sculpture, photography, and folk arts, SheikhNahayan is a regular patron of art exhibitions and heritage festivals.
Sheikh Nahayan is also a recognized leader in dealing with the majorsocial and economic issues that impact the United Arab Emirates andthe Arab region. He has played a major role in policy formulation relatedto the economic and social development of the United Arab Emirates. Sheikh Nahayan has chaired several cabinet committees on manpowerplanning and social development in the United Arab Emirates;committees charged with formulating policies for human and socialdevelopment in the country. He is an accomplished public speaker.He gives more than 150 public speeches and presentations everyyear. He is also an active sportsman. His sports hobbies includehorseback riding, flying helicopters and light aircraft, and falconry.
Sheikh Nahayan is the recipient of many national and internationalhonors and awards in addition to numerous honorary degrees fromuniversities around the world.
Sir Mohammed Anwar Pervez, OBE HPkDeputy Chairman
Sir Mohammed Anwar Pervez, OBE HPk is the Deputy Chairman ofthe Board of Directors of United Bank Limited since 19 October, 2002.He is also the Chairman of Bestway (Holdings) Limited, UK & itssubsidiaries, which include Batleys Limited in UK, Bestway Cementin Pakistan & Bestway Northern Limited in UK.
Sir Anwar began his career in food business in 1963 when he openeda mini supermarket in London. He ventured into the cash & carrybusiness in 1976 and has been responsible for growing Bestway intothe second largest cash & carry operator in the UK.
Sir Anwar was awarded the Order of the British Empire (OBE) in 1992and was conferred the title of Knight's Bachelor in 1999. In 2000 hewas awarded Hilal-e-Pakistan.
In 2005, Sir Anwar Pervez was voted winner of the prestigious GrocerCup for Outstanding Business Achievement by the Institute of GroceryDistribution, UK.
In 2006 he received Sitra-e-Essar and was chosen as the MasterEntrepreneur - UK at the Ernst & Young Entrepreneur of the Year 2006Awards.
He is also the Chairman of Bestway Foundation UK and Patron-in-Chief of Bestway Foundation Pakistan and a charter member of theDuke of Edinburgh Awards Scheme.
Omar Z. Al AskariDirector
Omar Ziad Al Askari is the Chairman and Chief Executive Officer ofUnited Technical Services. In 1972 he attained an MBA degree fromthe Kellogg Graduate School of Management at Northwestern University,having graduated in 1971 from the University of Oregon with a BBAdegree in business administration. He is a Certified Public Accountant.He began his career with Arthur Andersen & Co. in 1972 where hespecialized in audit and management consulting.
In 1976, he assumed control of Technical Services and SupplyCompany, a family concern based in Abu Dhabi, United Arab Emirates.In 1980, Mr. Al Askari established United Technical Services (UTS),now a leading force in sales and service of engineered products tothe oilfield and building services industries in the United Arab Emirates.He has served on numerous public and private company Boards.Currently he is a member of the Board of Directors of United BankLimited and is Chairman of AlFalah Exchange Co.
Mr. Al Askari served as International President of the Young Presidents'Organization in 1999-2000. He is a member of the World Presidents'Organization, the Chief Executives Organization, the American Instituteof Certified Public Accountants, Illinois CPA Society and the KelloggAlumni Advisory Board. He is a director of the Emirates Cricket Board.
United Bank Limited04
Zameer Mohammed ChoudreyDirector
Mr. Zameer Mohammed Choudrey has been a Member of the Boardof Directors of United Bank Limited since 19 October, 2002. He isChairman of the Board Audit Committee. He is also a Director of UBLInsurers Limited.
He is Chief Executive of Bestway Group, which is among the top tenfamily businesses in the UK with annual turnover of £2.1 billion. TheGroup's wholesale operations are the 2nd largest in the UK with an18% market share. Its cement operation is the second largest cementmanufacturer in Pakistan.
Zameer is a Chartered Accountant by profession. He joined BestwayGroup as a financial controller in 1984. In 1990, he was promotedas the Group Finance Director. In 1995, he was given additionalresponsibilities of business diversification both in UK and Pakistan andwas promoted as Chief Executive of Bestway Cement Limited. Hewas appointed as the Group CEO in 2004.
He is a fellow of the Institute of Chartered Accounts of England &Wales and a member of the Institute of Directors.
Zameer is a trustee of Bestway Foundation UK and Chairman ofBestway Foundation Pakistan. He is also a trustee of Caravan andCrimestoppers.
Muhammad Sami SaeedDirector
Mr. Muhammad Sami Saeed has been appointed as Director of UnitedBank Limited by the Government of Pakistan with effect from26 February 2008. He is also a Member of the Board Audit Committeeof the Bank. He did his M.A. from Punjab University in 1976 and post-graduation in Development Economics from University of Cambridge,UK, in 1986. He has done professional courses in economicmanagement and public finance from the IMF Institute, Washingtonand Kennedy School of Government, Harvard University, USA.At present, he is Additional Chief Secretary, Government of Punjab.
Prior to this, he was Chairman of Planning & Development Board,Government of Punjab, Additional Finance Secretary (Banking),Government of Pakistan. He also worked as Joint Secretary/AdditionalSecretary in Prime Minister's Secretariat (2006-2008), Secretary, Excise& Taxation Department (2002-2006), Secretary Agriculture (1998-99)in Government of Punjab and Deputy Commissioner Faisalabad (1990-93). He joined the Civil Service of Pakistan (District ManagementGroup) in 1980.
He also attended various international conferences and took part inbilateral negotiations in many countries as member of Government ofPakistan delegation. In January 2007, he attended World EconomicForum 2007 in Davos, Switzerland, as a member of the Pakistandelegation headed by the Prime Minister of Pakistan.
Amin UddinDirector
Mr. Amin Uddin has been appointed as member of Board of Directorsof United Bank Limited with effect from 5 March 2009. He is a memberof Board Audit Committee of UBL. He is also a Director of UBL InsurersLimited.
He did Banking Management course in 1986-87 from McGill University,Canada and B.A. (Economics and Statistics) from Punjab University,Lahore. He also attended various international professional trainingprograms.
He has a 40 years experience in Pakistan, Middle East, Europe, Africa& Canada. He worked in Ecobank Group, a leading Pan-Africancommercial banking group (1991-2002). He also worked in Bank ofCredit and Commerce INT (1977-1990) and Habib Bank Limited(1967-1977).
Annual Report 2010 05
Arshad Ahmad MirDirector
Mr. Arshad Ahmad Mir, appointed as member of Board of Directorswith effect from 26 October 2009, has over four decades of extensivecorporate experience in financial services, oil industry, managementconsultancy, manufacturing and wholesale distribution businesses.
He has served with major corporate entities in areas of generalmanagement, corporate planning, project management, complianceand consultancy. Geographical coverage of his corporate roles andresponsibilities encompass Pakistan, Middle East, Africa, UK & Europe.
Arshad Mir is a member of Institute of Chartered Accountants andInstitute of Bankers, UK. He has attended various management coursesand conferences including Advanced Management Programme ofLondon Business School.
He is also a member of the Board Risk Management Committee ofthe Bank.
Seerat AsgharDirector
Mr. Seerat Asghar has been appointed as Director of United BankLimited by the Government of Pakistan with effect from 30 March,2010. He is also a member of the Human Resources Committee ofthe Bank. Mr. Asghar has a vast experience gathered over a span ofmore than twenty nine years in public service at key GOP posts. Hebrings with him a rich professional and academic experience. He holdsan LLB and Master's degree in Political Science from Punjab University,Lahore. His last academic pursuit was at the prestigious CornellUniversity, USA, where he attended Executive Development Programin Food and Agriculture Business Management.
With a strong base in “Executive Leadership Development” fromHarvard University, he has developed a gradual niche in ProjectManagement, Procurement, as well as macro economic planning,resulting in representation of Pakistan at key international foras likeInternational Conference on E-Procurement In Seoul - Korea, TokyoUbiquitous Network Conference, Conference on Hazard RiskManagement at Delhi - India, 25th Session of the International GrainCouncil at London - UK, 133rd Session of the FAO Council and 34thSession of FAO Conference at Rome - Italy, US-Afghanistan-PakistanAgricultural Trilateral Conference In Istanbul, Turkey.
At present, he is Additional Secretary, Ministry of Finance, Governmentof Pakistan.
Atif R. BokhariPresident & CEO
Mr. Atif R. Bokhari, currently President & CEO, United Bank Limited(UBL) is a seasoned banker with extensive experience in domesticand international banking. He started his banking career in 1985 withBank of America, where he handled diverse assignments over a periodof 15 years. Subsequent to leaving Bank of America in July 2000,Mr. Bokhari joined Habib Bank Limited wherein he was Head ofCorporate and Investment Banking.
Mr. Bokhari was appointed as President & CEO of UBL in May 2004(18 months after privatization). Since then UBL has ventured into newdiversified business and revenue streams namely consumer financing,E-commerce, asset management and general insurance.
Mr. Bokhari holds the office of Chairman or Director in several UBLGroup companies. He is also a Director of First Women Bank Limitedand is very actively involved with a private sector program for thedevelopment of education in Karachi. Specifically he is a Director forthe envisaged Karachi Business School affiliated with the JudgeBusiness School, Cambridge, UK. He has been appointed as Chairmanof the Human Resource Committee of the Institute of Bankers inPakistan, which is headed by the Governor State Bank of Pakistan.He is also a member of the Executive Committee of Pakistan Banks'Association.
On behalf of the Board of Directors, I am pleased to present to youthe 52nd Annual Report of United Bank Limited for the year endedDecember 31, 2010.
Financial Highlights
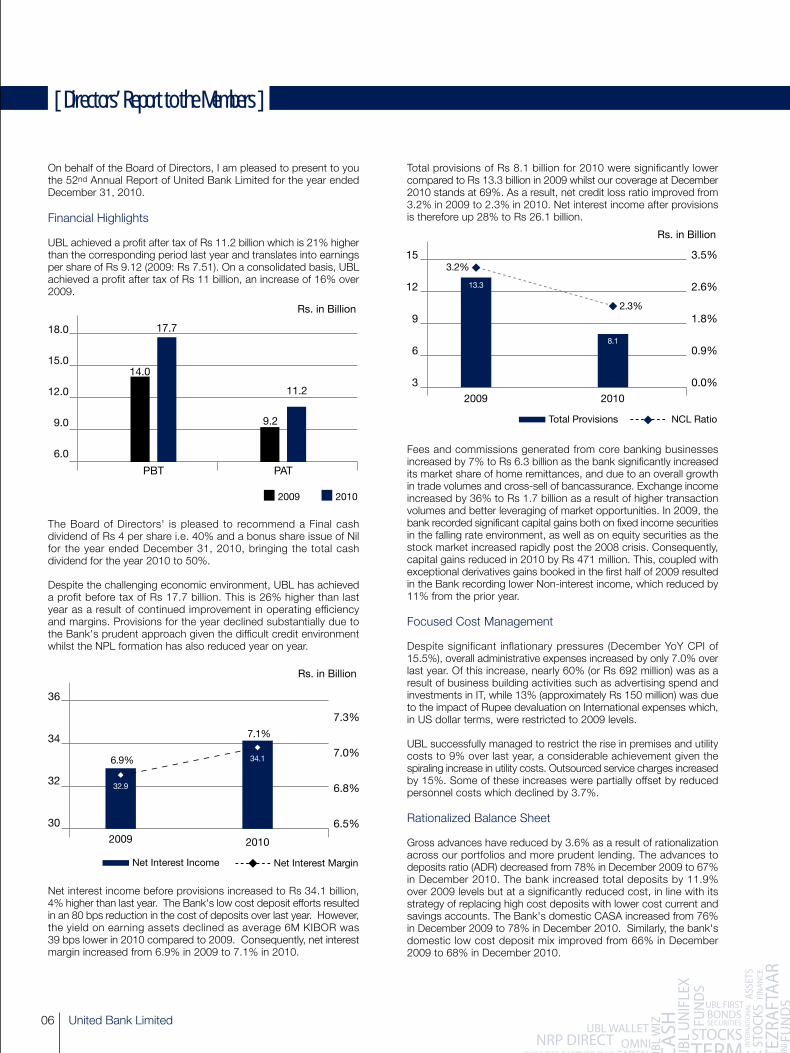
UBL achieved a profit after tax of Rs 11.2 billion which is 21% higherthan the corresponding period last year and translates into earningsper share of Rs 9.12 (2009: Rs 7.51). On a consolidated basis, UBLachieved a profit after tax of Rs 11 billion, an increase of 16% over2009.
The Board of Directors' is pleased to recommend a Final cashdividend of Rs 4 per share i.e. 40% and a bonus share issue of Nilfor the year ended December 31, 2010, bringing the total cashdividend for the year 2010 to 50%.
Despite the challenging economic environment, UBL has achieveda profit before tax of Rs 17.7 billion. This is 26% higher than lastyear as a result of continued improvement in operating efficiencyand margins. Provisions for the year declined substantially due tothe Bank's prudent approach given the difficult credit environmentwhilst the NPL formation has also reduced year on year.
Net interest income before provisions increased to Rs 34.1 billion,4% higher than last year. The Bank's low cost deposit efforts resultedin an 80 bps reduction in the cost of deposits over last year. However,the yield on earning assets declined as average 6M KIBOR was39 bps lower in 2010 compared to 2009. Consequently, net interestmargin increased from 6.9% in 2009 to 7.1% in 2010.
Total provisions of Rs 8.1 billion for 2010 were significantly lowercompared to Rs 13.3 billion in 2009 whilst our coverage at December2010 stands at 69%. As a result, net credit loss ratio improved from3.2% in 2009 to 2.3% in 2010. Net interest income after provisionsis therefore up 28% to Rs 26.1 billion.
Fees and commissions generated from core banking businessesincreased by 7% to Rs 6.3 billion as the bank significantly increasedits market share of home remittances, and due to an overall growthin trade volumes and cross-sell of bancassurance. Exchange incomeincreased by 36% to Rs 1.7 billion as a result of higher transactionvolumes and better leveraging of market opportunities. In 2009, thebank recorded significant capital gains both on fixed income securitiesin the falling rate environment, as well as on equity securities as thestock market increased rapidly post the 2008 crisis. Consequently,capital gains reduced in 2010 by Rs 471 million. This, coupled withexceptional derivatives gains booked in the first half of 2009 resultedin the Bank recording lower Non-interest income, which reduced by11% from the prior year.
Focused Cost Management
Despite significant inflationary pressures (December YoY CPI of15.5%), overall administrative expenses increased by only 7.0% overlast year. Of this increase, nearly 60% (or Rs 692 million) was as aresult of business building activities such as advertising spend andinvestments in IT, while 13% (approximately Rs 150 million) was dueto the impact of Rupee devaluation on International expenses which,in US dollar terms, were restricted to 2009 levels.
UBL successfully managed to restrict the rise in premises and utilitycosts to 9% over last year, a considerable achievement given thespiraling increase in utility costs. Outsourced service charges increasedby 15%. Some of these increases were partially offset by reducedpersonnel costs which declined by 3.7%.
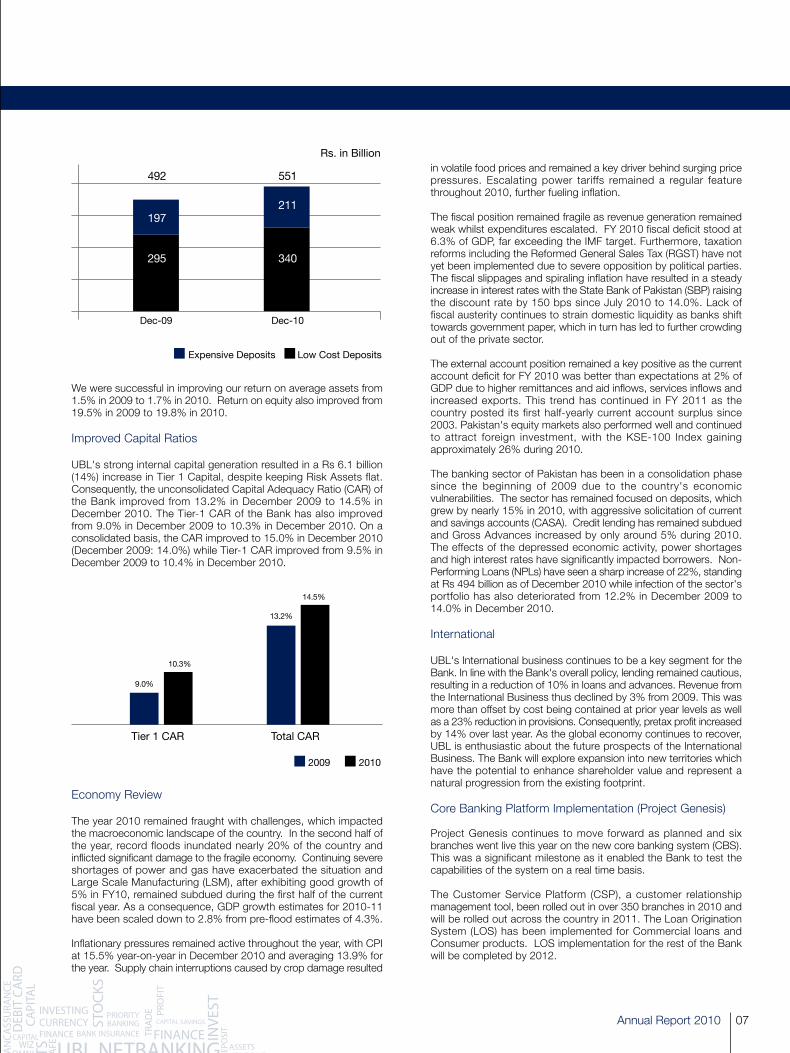
Rationalized Balance Sheet
Gross advances have reduced by 3.6% as a result of rationalizationacross our portfolios and more prudent lending. The advances todeposits ratio (ADR) decreased from 78% in December 2009 to 67%in December 2010. The bank increased total deposits by 11.9%over 2009 levels but at a significantly reduced cost, in line with itsstrategy of replacing high cost deposits with lower cost current andsavings accounts. The Bank's domestic CASA increased from 76%in December 2009 to 78% in December 2010. Similarly, the bank'sdomestic low cost deposit mix improved from 66% in December2009 to 68% in December 2010.
United Bank Limited06
[ Directors’ Report to the Members ]
18.0
15.0
12.0
9.0
6.0
PBT PAT
9.2
11.2
Rs. in Billion
17.7
14.0
2009 2010
36
34
32
30
Net Interest Income Net Interest Margin
2009
7.1%
6.9%
7.3%
7.0%
6.8%
6.5%
2010
32.9
34.1
Rs. in Billion
15
12
9
6
3
Total Provisions NCL Ratio
2009
2.3%
3.2%
13.3
8.1
3.5%
2.6%
1.8%
0.9%
0.0%2010
Rs. in Billion
We were successful in improving our return on average assets from1.5% in 2009 to 1.7% in 2010. Return on equity also improved from19.5% in 2009 to 19.8% in 2010.
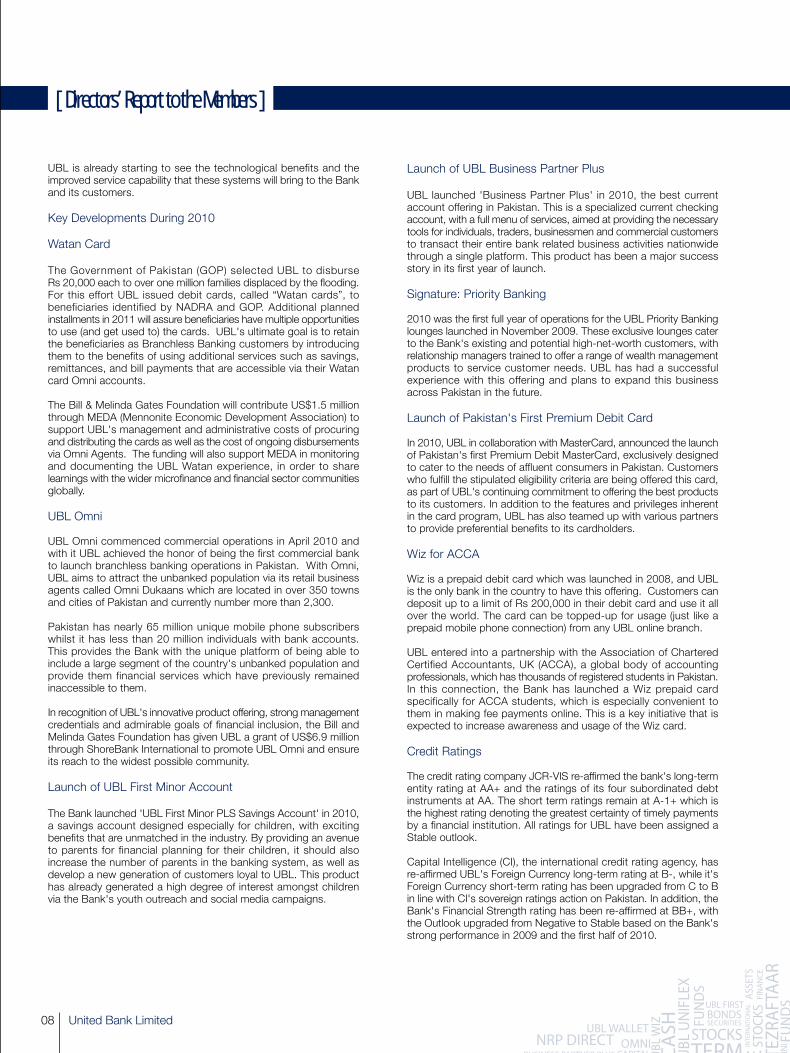
Improved Capital Ratios
UBL's strong internal capital generation resulted in a Rs 6.1 billion(14%) increase in Tier 1 Capital, despite keeping Risk Assets flat.Consequently, the unconsolidated Capital Adequacy Ratio (CAR) ofthe Bank improved from 13.2% in December 2009 to 14.5% inDecember 2010. The Tier-1 CAR of the Bank has also improvedfrom 9.0% in December 2009 to 10.3% in December 2010. On aconsolidated basis, the CAR improved to 15.0% in December 2010(December 2009: 14.0%) while Tier-1 CAR improved from 9.5% inDecember 2009 to 10.4% in December 2010.
Economy Review
The year 2010 remained fraught with challenges, which impactedthe macroeconomic landscape of the country. In the second half ofthe year, record floods inundated nearly 20% of the country andinflicted significant damage to the fragile economy. Continuing severeshortages of power and gas have exacerbated the situation andLarge Scale Manufacturing (LSM), after exhibiting good growth of5% in FY10, remained subdued during the first half of the currentfiscal year. As a consequence, GDP growth estimates for 2010-11have been scaled down to 2.8% from pre-flood estimates of 4.3%.
Inflationary pressures remained active throughout the year, with CPIat 15.5% year-on-year in December 2010 and averaging 13.9% forthe year. Supply chain interruptions caused by crop damage resulted
in volatile food prices and remained a key driver behind surging pricepressures. Escalating power tariffs remained a regular featurethroughout 2010, further fueling inflation.
The fiscal position remained fragile as revenue generation remainedweak whilst expenditures escalated. FY 2010 fiscal deficit stood at6.3% of GDP, far exceeding the IMF target. Furthermore, taxationreforms including the Reformed General Sales Tax (RGST) have notyet been implemented due to severe opposition by political parties.The fiscal slippages and spiraling inflation have resulted in a steadyincrease in interest rates with the State Bank of Pakistan (SBP) raisingthe discount rate by 150 bps since July 2010 to 14.0%. Lack offiscal austerity continues to strain domestic liquidity as banks shifttowards government paper, which in turn has led to further crowdingout of the private sector.
The external account position remained a key positive as the currentaccount deficit for FY 2010 was better than expectations at 2% ofGDP due to higher remittances and aid inflows, services inflows andincreased exports. This trend has continued in FY 2011 as thecountry posted its first half-yearly current account surplus since2003. Pakistan's equity markets also performed well and continuedto attract foreign investment, with the KSE-100 Index gainingapproximately 26% during 2010.
The banking sector of Pakistan has been in a consolidation phasesince the beginning of 2009 due to the country's economicvulnerabilities. The sector has remained focused on deposits, whichgrew by nearly 15% in 2010, with aggressive solicitation of currentand savings accounts (CASA). Credit lending has remained subduedand Gross Advances increased by only around 5% during 2010.The effects of the depressed economic activity, power shortagesand high interest rates have significantly impacted borrowers. Non-Performing Loans (NPLs) have seen a sharp increase of 22%, standingat Rs 494 billion as of December 2010 while infection of the sector'sportfolio has also deteriorated from 12.2% in December 2009 to14.0% in December 2010.
International
UBL's International business continues to be a key segment for theBank. In line with the Bank's overall policy, lending remained cautious,resulting in a reduction of 10% in loans and advances. Revenue fromthe International Business thus declined by 3% from 2009. This wasmore than offset by cost being contained at prior year levels as wellas a 23% reduction in provisions. Consequently, pretax profit increasedby 14% over last year. As the global economy continues to recover,UBL is enthusiastic about the future prospects of the InternationalBusiness. The Bank will explore expansion into new territories whichhave the potential to enhance shareholder value and represent anatural progression from the existing footprint.
Core Banking Platform Implementation (Project Genesis)
Project Genesis continues to move forward as planned and sixbranches went live this year on the new core banking system (CBS).This was a significant milestone as it enabled the Bank to test thecapabilities of the system on a real time basis.
The Customer Service Platform (CSP), a customer relationshipmanagement tool, been rolled out in over 350 branches in 2010 andwill be rolled out across the country in 2011. The Loan OriginationSystem (LOS) has been implemented for Commercial loans andConsumer products. LOS implementation for the rest of the Bankwill be completed by 2012.
Annual Report 2010 07
Expensive Deposits Low Cost Deposits
197
295
211
340
551492
Dec-09 Dec-10
Rs. in Billion
10.3%
9.0%
Tier 1 CAR Total CAR
13.2%
14.5%
2009 2010
United Bank Limited08
[ Directors’ Report to the Members ]
UBL is already starting to see the technological benefits and theimproved service capability that these systems will bring to the Bankand its customers.
Key Developments During 2010
Watan Card
The Government of Pakistan (GOP) selected UBL to disburseRs 20,000 each to over one million families displaced by the flooding.For this effort UBL issued debit cards, called “Watan cards”, tobeneficiaries identified by NADRA and GOP. Additional plannedinstallments in 2011 will assure beneficiaries have multiple opportunitiesto use (and get used to) the cards. UBL's ultimate goal is to retainthe beneficiaries as Branchless Banking customers by introducingthem to the benefits of using additional services such as savings,remittances, and bill payments that are accessible via their Watancard Omni accounts.
The Bill & Melinda Gates Foundation will contribute US$1.5 millionthrough MEDA (Mennonite Economic Development Association) tosupport UBL's management and administrative costs of procuringand distributing the cards as well as the cost of ongoing disbursementsvia Omni Agents. The funding will also support MEDA in monitoringand documenting the UBL Watan experience, in order to sharelearnings with the wider microfinance and financial sector communitiesglobally.
UBL Omni
UBL Omni commenced commercial operations in April 2010 andwith it UBL achieved the honor of being the first commercial bankto launch branchless banking operations in Pakistan. With Omni,UBL aims to attract the unbanked population via its retail businessagents called Omni Dukaans which are located in over 350 townsand cities of Pakistan and currently number more than 2,300.
Pakistan has nearly 65 million unique mobile phone subscriberswhilst it has less than 20 million individuals with bank accounts.This provides the Bank with the unique platform of being able toinclude a large segment of the country's unbanked population andprovide them financial services which have previously remainedinaccessible to them.
In recognition of UBL's innovative product offering, strong managementcredentials and admirable goals of financial inclusion, the Bill andMelinda Gates Foundation has given UBL a grant of US$6.9 millionthrough ShoreBank International to promote UBL Omni and ensureits reach to the widest possible community.
Launch of UBL First Minor Account
The Bank launched 'UBL First Minor PLS Savings Account' in 2010,a savings account designed especially for children, with excitingbenefits that are unmatched in the industry. By providing an avenueto parents for financial planning for their children, it should alsoincrease the number of parents in the banking system, as well asdevelop a new generation of customers loyal to UBL. This producthas already generated a high degree of interest amongst childrenvia the Bank's youth outreach and social media campaigns.
Launch of UBL Business Partner Plus
UBL launched 'Business Partner Plus' in 2010, the best currentaccount offering in Pakistan. This is a specialized current checkingaccount, with a full menu of services, aimed at providing the necessarytools for individuals, traders, businessmen and commercial customersto transact their entire bank related business activities nationwidethrough a single platform. This product has been a major successstory in its first year of launch.
Signature: Priority Banking
2010 was the first full year of operations for the UBL Priority Bankinglounges launched in November 2009. These exclusive lounges caterto the Bank's existing and potential high-net-worth customers, withrelationship managers trained to offer a range of wealth managementproducts to service customer needs. UBL has had a successfulexperience with this offering and plans to expand this businessacross Pakistan in the future.
Launch of Pakistan's First Premium Debit Card
In 2010, UBL in collaboration with MasterCard, announced the launchof Pakistan's first Premium Debit MasterCard, exclusively designedto cater to the needs of affluent consumers in Pakistan. Customerswho fulfill the stipulated eligibility criteria are being offered this card,as part of UBL's continuing commitment to offering the best productsto its customers. In addition to the features and privileges inherentin the card program, UBL has also teamed up with various partnersto provide preferential benefits to its cardholders.
Wiz for ACCA
Wiz is a prepaid debit card which was launched in 2008, and UBLis the only bank in the country to have this offering. Customers candeposit up to a limit of Rs 200,000 in their debit card and use it allover the world. The card can be topped-up for usage (just like aprepaid mobile phone connection) from any UBL online branch.
UBL entered into a partnership with the Association of CharteredCertified Accountants, UK (ACCA), a global body of accountingprofessionals, which has thousands of registered students in Pakistan.In this connection, the Bank has launched a Wiz prepaid cardspecifically for ACCA students, which is especially convenient tothem in making fee payments online. This is a key initiative that isexpected to increase awareness and usage of the Wiz card.
Credit Ratings
The credit rating company JCR-VIS re-affirmed the bank's long-termentity rating at AA+ and the ratings of its four subordinated debtinstruments at AA. The short term ratings remain at A-1+ which isthe highest rating denoting the greatest certainty of timely paymentsby a financial institution. All ratings for UBL have been assigned aStable outlook.
Capital Intelligence (CI), the international credit rating agency, hasre-affirmed UBL's Foreign Currency long-term rating at B-, while it'sForeign Currency short-term rating has been upgraded from C to Bin line with CI's sovereign ratings action on Pakistan. In addition, theBank's Financial Strength rating has been re-affirmed at BB+, withthe Outlook upgraded from Negative to Stable based on the Bank'sstrong performance in 2009 and the first half of 2010.
Annual Report 2010 09
Future Outlook
Going forward, achieving macroeconomic stability remains a keychallenge for Pakistan. Continued power and gas shortages alongwith high borrowing costs are expected to place further pressure onthe LSM sector and consequently on GDP growth. Inflationarypressures are expected to remain high, averaging close to 15-16%for 2011.
Achieving fiscal austerity remains of utmost significance. The deficittarget for 2011 is likely to be breached due to lower revenue generationalong with weak expenditure control. However, the external accountposition should remain healthy as higher remittances, services inflowsand increased exports are likely to continue during 2011. Inflationarypressures combined with the weak fiscal position are expected toresult in a continued tight monetary policy during 2011.
Given the macroeconomic scenario, UBL's focus will remain onproactively managing its asset portfolio while exploring the acquisitionof quality assets. The Bank will continue to grow its low cost depositbase by more efficiently leveraging its branch network. UBL alsoplans to significantly expand its Branchless Banking product to makefinancial services available to a broader range of people. The Bankis confident that, with the investments it has made in people,technology and products, it is well positioned for further growth.
Statement Under Section XIX of the Code of CorporateGovernance
The Board is committed to ensure that requirements of corporategovernance set by Securities and Exchange Commission of Pakistanare fully met. The Bank has adopted good Corporate Governancepractices and the Directors are pleased to report that:
• The financial statements present fairly the state of affairs of theBank, the result of its operations, cash flows and changes in equity.
• Proper books of account of the Bank have been maintained.
• Appropriate accounting policies have been consistently appliedin preparation of these unconsolidated financial statements,except for the changes in the accounting policies as describedin note 5.1. Accounting estimates are based on reasonable andprudent judgment.
• International Accounting Standards, as applicable to Banks inPakistan have been followed in the preparation of the Accountsof financial statements without any departure there-from.
• The system of internal control in the Bank is sound in design,and effectively implemented and monitored.
• There are no significant doubts upon the Bank's ability tocontinue as a going concern.
• There has been no material departure from the best practicesof Corporate Governance.
• The Board has appointed the following three Committees withdefined terms of references
• Board Risk Management Committee
• Board Human Resources & Compensation Committee
• Board Audit Committee
• Performance highlights for the last six years are attached tothese unconsolidated financial statements.
The Bank operates five post retirement funds Provident Fund, Gratuity,Pension, Benevolent, and General Provident Fund and two benefitschemes Post Retirement Medical and Compensated Absences.Gratuity and Provident Fund Schemes are available to staff whojoined the bank post privatization. The value of investments basedon latest audited financial statements as at December 31, 2009 ofthese funds is as follows:
Amounts in '000
Employees' Provident Fund 2,829,590
Employees' Gratuity Fund 297,030
Staff Pension Fund 6,132,050
Staff General Provident Fund 1,296,753
Officers / Non-Officers Benevolent Fund 787,303
Meetings of the Board
During the year under review, the Board of Directors met six times.The number of meetings attended by each director during the yearis shown below:
Name of the Director Meetingsattended
His Highness Sheikh Nahayan Mabarak Al NahayanChairman 03
Sir Mohammed Anwar Pervez, OBE, HPkDeputy Chairman 06
Mr. Omar Z. Al AskariDirector 06
Mr. Zameer Mohammed ChoudreyDirector 06
Dr. Ashfaque Hasan Khan *Director 01
Mr. Muhammad Sami SaeedDirector 06
Mr. Amin UddinDirector 06
Mr. Arshad Ahmad MirDirector 06
Mr. Seerat Asghar *Director 05
Mr. Atif R. BokhariPresident & CEO 06
The Board appreciated the services rendered by Dr. Ashfaque HasanKhan, the out going director.
* Mr. Seerat Asghar was appointed as a Director of UBL in place ofDr. Ashfaque Hasan Khan with effect from March 30, 2010.
United Bank Limited10
[ Directors’ Report to the Members ]
Pattern of Shareholding
The pattern of shareholding as required u/s 236 of the Companies Ordinance, 1984 and Articles (xix) of the Code of Corporate Governance isgiven below :
Shareholders No. of Shares % of ordinary Shares
Bestway Group (BG) 380,355,324 31.07
Abu Dhabi Group (ADG) 312,165,804 25.50
State Bank of Pakistan 238,567,381 19.49
Government of Pakistan 3,354,550 0.27
Privatization Commission of Pakistan 1,714 0.00
General Public & others 169,818,347 13.87
NIT 1,307,327 0.11
Bank, DFIs & NBFIs 15,267,751 1.25
Insurance Companies 7,355,969 0.60
Modarabas & Mutual Funds 17,482,437 1.43
Securities & Exchange Commission of Pakistan 1 0.00
* International GDRs (non voting shares) 78,503,082 6.41
TOTAL OUTSTANDING SHARES 1,224,179,687 100.00
* ADG also holds 4.80% additional shares in the form of GDRs.
The aggregate shares held by the following are:
No. of shares
a) Associated Companies, undertakings & related parties - Bestway (Holdings) Limited 222,775,183
- Bestway Cement Limited 93,649,744
- Al Jaber Transport & General Contracting 59,993,236
b) NIT
-National Bank of Pakistan - Trustee Department NI(U)T Fund 1,302,665
-National Investment Trust Limited 4,662
c) Public sector companies and corporations 147,515
d) Banks, DFIs, NBFIs, Insurance Companies, Modaraba & Mutual Funds 40,106,157
e) Directors / CEO / Executives
-H.H. Sheikh Nahayan Mabark Al Nahayan 78,942,102
-Sir Mohammed Anwar Pervez,OBE,HPk 62,433,163
-Omar Z. Al Askari 14,998,307
-Zameer Mohammed Choudrey 1,497,234
-Amin Uddin 2,750
-Atif R. Bokhari 931,519
-Other Executives * 2,985,792
* Figure for Other Executives includes 942 shares held by their spouses and minor children.
Shareholders holding 10% or more voting interest No. of shares % -State Bank of Pakistan 238,567,381 19.4879
-Bestway (Holdings) Limited 222,775,183 18.1979
There was no trading in UBL shares carried out by any of the directors, CEO, CFO, and Company Secretary, or their spouses and minor childrenduring the year.
Annual Report 2010 11
Risk Management Framework
The Bank has an integrated Risk Management structure in place.The Board Risk Management Committee (BRMC) oversees the wholerisk management process of the Bank. The Risk and Credit PolicyGroup assists the BRMC. The Group is organized into the functionsof Credit Administration, Market and Treasury Risk, Commercial andFI Credit Policy, Consumer and Retail Credit, Credit Risk Managementand Operational Risk & Basel II. Each risk category is headed by asenior manager who reports directly to the Group Executive, Riskand Credit Policy.
As Pakistan progresses through a period of eco-political turmoil,UBL strengthened its capacity for identifying and reducing risk. Theyear saw emphasis on close monitoring of the asset portfolio acrossall segments, including actively working with clients to help themwith repayments and restructuring. Steps were also taken to enhancethe efficiency of the credit approval process through appropriatedelegation of approval authority. A holistic Risk Management Policywas finalized in 2010. This is an umbrella policy, providing an integratedframework to encompass Credit, Liquidity, Agricultural, International,Market and Human Resource risk, aimed at portfolio qualityimprovement. A comprehensive Agriculture Credit Policy was alsodeveloped and finalized over the year. The formulation and approvalof these policies involved input from the Board and senior managementto ensure that risks were accurately assessed. In order to keepbusinesses aware of market and industry developments, the CreditPolicy & Research Division provided regular updates on majormacroeconomic issues and specific industry developments.
The Capital Adequacy Ratio (CAR) was maintained well above theprescribed regulatory threshold throughout the year. The CARcalculation process has been optimized through automation andsystem based reporting is expected to commence from 2011. TheBank continued its efforts towards implementing the OperationalRisk Management Framework across the bank and achieved thedeployment of operational risk monitor, a key milestone in this regard.The Bank plans to move to the Advanced Approach for Basel II,including all its components and has prepared a roadmap towardsimplementation.
In order to automate the loan origination process for Corporate,Commercial and SME borrowers, a Loan Origination System (LOS),one of the most critical components of UBL's new Core BankingSystem, has been implemented. LOS facilitates routing of creditapplications created on a predefined format to recommenders andapprovers electronically. During the year, the LOS has been successfullyimplemented for Consumer & SME loans. User Acceptance Testing(UAT) for Corporate and Commercial credit applications on LOS hasbeen done successfully and Bank wide roll out covering all segmentsand customers is expected in 2012.
Consumer financing portfolios remain stressed around the countrydue to the high inflationary environment with consequent escalationin borrowing costs. UBL continued to effectively manage its portfolioand developed a behavior scoring model as a risk management toolto facilitate automated credit limit management, collectionsmanagement and transaction authorization. The Bank is in theprocess of developing an Application Scoring model for identificationof quality acquisition prospects across the consumer portfolio.
The Market and Treasury Risk unit has continued to review riskpolicies and procedures to ensure that operating controls are robustand limits are in place to manage risk without unduly hamperingbusiness. Towards this end, several initiatives have been taken duringthe current year. For the equity trading portfolio, a Value-at-Risk
approach is being back tested and fine-tuned whereas for thederivatives portfolio a revised mechanism has been rolled out tomeasure and monitor pre-settlement risk. Market Risk Limit settingmechanisms have also been updated to place greater reliance onquantitative rather than subjective methods. For the banking book,several analytical tools are under review to supplement stress testingrequirements.
The Bank also continues to invest in systems and people as part ofits process of continuously strengthening the risk managementfunction.
Auditors
The present auditors M/S. Ernst & Young Ford Rhodes Sidat Hyder,Chartered Accountants and M/S. BDO Ebrahim & Co., CharteredAccountants retire and being eligible, offer themselves for re-appointment in the forthcoming Annual General Meeting.
Conclusion
In conclusion, I extend my thanks and appreciation to UBLshareholders and customers as well as to my fellow members of theBoard of Directors for their trust and support. We acknowledge theefforts and dedication demonstrated by our staff and would also liketo express our earnest appreciation to the Government, the StateBank of Pakistan, the Securities & Exchange Commission and otherregulatory bodies for their continued support.
For and on behalf of the Board,
Nahayan Mabarak Al NahayanChairman
Abu DhabiFebruary 21, 2011
United Bank Limited12
[ Statement of Corporate Social Responsibility ]
The commitment to continuously create value for its customers,employees and local communities is a major priority of UBL. In 2010,the Bank provided support of over Rs 80 million for CSR initiativesprincipally in the areas of education, health care and communitydevelopment. UBL's efforts in the field of CSR were also acknowledgedby the Pakistan Center for Philanthropy (PCP), an independentorganization, as one of the largest donors to charitable causes inPakistan.
UBL, as a “Contributing Sponsor” of the Karachi Education Initiative(KEI), contributed Rs 40 million to this cause. This initiative aims toset up a world class School of Business and Leadership in Karachi.Additionally, Rs 3.9 million were also donated to other organizationsoperating in the field of education, including The Citizens' Foundationand the Lahore University of Management Sciences.
In the areas of health and community development, UBL contributedover Rs 10 million to the Edhi Foundation, SOS Villages of Pakistan,Marie Adelaide Leprosy Centers, Special Olympics Pakistan, ThePolice Hospital Fund and Friends of Burns Center.
The massive floods across Pakistan in July 2010, resulted in almost20% of the country being inundated, and over 20 million peoplerendered homeless and stripped of basic needs such as food andclean drinking water. UBL initiated a donation program nationwide,accompanied by a significant media campaign, with a pledge tomatch each donation rupee for rupee. UBL's employees also answeredthe call; voluntarily donating one day's salary, which was also matchedby the Bank. These funds were then utilized towards rehabilitationof the flood affectees, with a focus on the provision of clean drinkingwater.
As a result of its previous success and credibility in distributingGovernment aid to the Internally Displaced Persons in Swat, theGovernment of Pakistan chose UBL to route payments of Rs 20,000each to 1 million households displaced in the floods. UBL made thispossible by collaborating with NADRA and using the Bank'sestablished Omni Branchless Banking platform to deliver paymentsto recipients via “Watan”-Visa debit cards. UBL successfully disbursedthe funds in 70 districts of Pakistan in record time, and with atransparency that has been appreciated by several internationaldonor organizations. Recognizing UBL Omni's efforts for financialinclusion of this previously unbanked population, the Bill and MelindaGates Foundation has supported UBL through a US$ 1.5 milliongrant for supporting the Watan project.
Annual Report 2010 13
[ President & CEO Review 2010 ]
Introduction
Pakistan's weak macroeconomic situation remained under pressureduring 2010, particularly in the wake of the floods that affected alarge part of the country. This was manifested through spiralinginflation driven by escalating food prices and frequent increases inutility rates, rising interest rates and slippages on fiscal targets. Inthis difficult environment, UBL has delivered a healthy growth of 26%on pretax profit.
During the year, the Bank's focus remained on prudent and proactivemanagement of its loan portfolio, low cost deposit growth and controlover costs. The Bank has been successful in these efforts as seenby lower provisions, reduced cost of funds and expense growthsubstantially below inflation levels. UBL also invested in technologyand new products and distribution channels which it believes willhelp the Bank in achieving its ambitious growth plans.
The performance of the Bank's International business also improvedover the last year as the Middle East economies stabilized. Costswere held at prior year levels while active portfolio managementresulted in significantly lower provisions. This business remains akey part of UBL's strategy and the Bank will be looking to consolidateand build on gains achieved this year.
Key financials
Despite the challenging economic environment, UBL has achievedan unconsolidated profit before tax of Rs 17.7 billion, 26% higherthan last year as a result of continued improvement in operatingefficiency and margins.
Deposits grew by nearly 12% as the Bank remained focused onmobilizing low cost deposits. UBL's domestic low cost deposit miximproved from 66% to 68% resulting in a reduction of 80 bps in thecost of deposits. Gross advances reduced by 4% as a result ofrationalization across our portfolios, and more prudent lending which,along with a lower average KIBOR, led to lower asset yields.Consequently, net interest margin increased from 6.9% in 2009 to7.1% in 2010 and Net interest income before provisions increasedto Rs 34.1 billion, 4% higher than last year.
Management of the loan portfolio remained a key priority for theBank which actively worked with borrowers to restructure those withgenuine difficulties while pursuing recoveries from defaulters. Lendingparameters were also tightened to ensure growth of quality assets.The Bank was thus able to reduce provisions to Rs 8.1 billion for2010 from Rs 13.3 billion in 2009, while also slowing the growth innon-performing loans. Net credit loss ratio improved to 2.3% in 2010.
Fees and commissions generated from core banking businessesincreased by 7% to Rs 6.3 billion through growth in home remittances,trade volumes and cross-sell of bancassurance. Exchange incomeincreased by 36% to Rs 1.7 billion as a result of higher transactionvolumes and better leveraging of market opportunities. However,the high capital gains recorded in 2009 were not repeated and thesereduced to Rs 159 million in 2010. Income from the derivativesbusiness also reduced as 2009 results included one-off gains whichwere not expected to recur.
Despite inflation of around 14%, overall administrative expensesincreased by only 7% over last year. Of this increase, the majoritywas for business building activities such as advertising spend andinvestments in IT. UBL remains committed to managing its costsprudently, in the best interests of its shareholders and customers.
UBL's key ratios showed improvement as the unconsolidated CARimproved from 13.2% to 14.5%, while Tier-1 CAR of the Bankimproved from 9.1% to 10.3%. The consolidated CAR also improvedby similar amounts. Shareholder returns also improved as the Returnon Assets improved from 1.5% to 1.7% and the Return on Equityimproved from 19.5% to 19.8%. The advances to deposits ratio(ADR) also reduced from 78% to 67% reflecting the improved liquiditysituation of the Bank.
Retail Bank
The Retail Bank consists of Commercial and Consumer Assets andAgri Lending. This business is also responsible for the majority ofthe branch network and deposit mobilization. In 2010, the RetailBank undertook some major new initiatives and product introductionsto supplement the menu of products and services.
The liabilities and branch banking business had a strong year, resultingin an improved deposit mix. Low cost deposit generation remainedthe key element of the deposit strategy and enabled the Bank toachieve a significantly lower cost of deposits. For the asset businesses,2010 was a year of consolidation, focusing on leveraging the rightmix of technology and people to manage the portfolio. There wasalso a focus on the newly introduced Relationship Model, to bestdeploy the strengths of the branch network in initiating and managingasset relationships.
Market conditions are still not conducive for large scale consumerlending. Consequently, the focus was on quality acquisitions, losscontainment from the legacy portfolio, and cost rationalization. Thisstrategy was complemented with key strategic alliances on both theacquisitions and the collections fronts, and initiatives to improve theoffering and service levels to our existing customers to maximizeloyalty.
During 2010, UBL also reached out to two significant segments; onewas the high net worth segment, through Signature, UBL's PriorityBanking offering. This has shown encouraging results in its first yearof operation, and is augmented by the introduction of the PremiumDebit MasterCard, a product which offers a range of benefits to theBank's large base of affluent customers.
The other segment targeted by the Retail Bank was the youth. Over70% of the population of Pakistan is under the age of 21, and varioustargeted offerings were developed for this market. UBL First MinorSavings Account, a product with exciting benefits targeted specificallyat children and their parents, offers a creative vehicle for parents tosave for their children as well as to teach them about sound financialplanning. UBL First will also serve to introduce a new generation toUBL and build customers for life.
Islamic Bank
UBL's Islamic Banking business, “Ameen”, also took steps towardsestablishing itself with an additional dedicated Islamic Banking branchand better leveraging of the availability of Islamic Banking servicesthroughout all UBL branches, including specialist Islamic Bankingwindows in key areas. The business doubled its deposit base in2010, and expects further strong growth in 2011.
Corporate Bank
The Corporate Banking Group at UBL continues to remain a preferredprovider of strategic and structured financial solutions to the top tiercorporate clientele in Pakistan. Backed by an experienced RelationshipManagement team stationed at Regional Corporate Centers across
United Bank Limited14
[ President & CEO Review 2010 ]
the country, the team is recognized for their knowledge and innovativesolutions which help maintain the highest quality of service standardsand further allows cross-sell of other UBL products within theInvestment Banking Group, Treasury, Trade Finance and CashManagement.
For the Corporate Bank, 2010 has been a year of proactivemanagement of its loan book, restructuring of stressed assets andrecovery. Despite the prevailing strained credit and economicenvironment, good progress was made as provisions declined by60% and NPL formation reduced substantially. However, with acontinued focused approach towards marketing, fees andcommissions revenue generated during the year increased by 50%over the previous year, primarily due to the innovative products andthe superior client servicing capabilities of the bank in the areas ofTrade Finance, Cash Management and Home Remittances.Complementing this healthy growth, operating cost increase wasrestricted to only 5%.
The Cash Management Business sustains its market leadershipposition and continued to provide around 31% growth over last year.Overall transaction volume handled reached nearly Rs 450 billionthrough provision of industry specific products and solutions forcollections and payments, despite increasing competitive pressures.The migration to the new core banking system (Symbols) is likely tofurther enhance maneuverability in terms of centralized data basemanagement and improved working capital cycle management.
The Home Remittances business during the year has furtherestablished UBL as a lead player, where market share has increasedto 18% recording an aggregate volume of US$1.7 billion. This YOYgrowth in volumes by around 43% is a result of continued supportof the Bank's correspondents all over the globe, persistent marketingefforts, development of new products and high quality servicestandards. UBL continued to launch innovative products for domesticand offshore clients, using its in-house state of the art cashmanagement and net banking solutions. Products like TezraftaarCheque and Account to Account Transfer have been in the marketfor some time while “Tezraftaar Cash” - Cash Over the Counterproduct was introduced during the year and was a significantcontributor towards attainment of these volumes. UBL plans tofurther expand its presence through actively pursuing foreigncounterparty tie-ups with the support from the Pakistan RemittanceInitiative and has already taken several steps in this direction.
Investment Banking
Despite a difficult environment, the Investment Banking Group (IBG)maintained its leadership in the domestic market during 2010. UBLcontinues to build on its Middle East initiative with a significant risein overseas earnings supplementing domestic revenues. A landmarktransaction during 2010 was the successful close of the first eversyndicated project finance transaction in Yemen amounting toUS$ 20 million.
Debt Capital Markets & Syndications remained a strong performerby successfully concluding a number of large and importanttransactions including leading one of the most high profile localmarket transactions of the year, i.e. the Rs 8 billion syndicatedfinancing facility for Qasim International Container Terminal.
Project & Structured Finance remained the largest contributor toIBG's fee earnings for the fifth consecutive year. Focus for the yearwas on soliciting and executing non-fund-based project advisoryassignments domestically, most notably that for a hydro powerproject sponsored by a Government of Korea owned entity. The
Middle East initiative remained a priority area during the year,especially in Yemen and the smaller UAE emirates with a focus onthe Energy and Power sectors.
The Equity & Advisory business emerged as a strong private equityshop within the domestic banking industry, aimed at developing andgrowing a middle-market M&A expertise both in Pakistan and theGCC. Carrying a sustainable deal pipeline into 2011, the businesshas gained significant momentum over the last eighteen months witha notable success being the successful arrangement of foreign directinvestment by a Korean multinational in one of the country's mostnotable food brands.
International
The impact of the global financial crisis that started in 2008 continuedto be felt in 2010, however, in general, macroeconomic stability wasseen in most GCC economies. Oil prices continued to rise andenhanced the revenue generation of two key markets of the franchise,Abu Dhabi and Qatar. The restructuring of the Dubai Worldconglomerate provided a much needed boost and helped reviveinvestor confidence in the region. This was evidenced by the launchof new bonds that were extremely well received and heavily over-subscribed.
The International Business continued to remain focused on liquiditymanagement, asset quality management and expense control.
The Asset portfolio was under constant scrutiny in every territorythrough proactive relationship management and prudent risk taking.Corporate Banking, the mainstay of the bank in most of the overseasoperations, performed well, and the bank continued to do businesswith top rated borrowers. Delinquencies in the unsecured retailportfolio have stabilized; however, the mortgage portfolio in UAEsuffered on account of the further downturn in the real estate market.
The overall lending was very closely monitored, with prudentprovisioning of loans as evidenced by the improvement in thecoverage ratio.
The Bank successfully completed the first syndicated investmentbanking transaction for a private power project in Yemen. This wasthe first ever transaction of its nature in Yemen and also the first everfor the Bank outside Pakistan. It has opened up new avenues forrevenue generation for the international operations and also enhancedthe brand image of the franchise.
Going forward, the international business of the bank is well positionedto build on the momentum started in 2010 with particular emphasison optimizing the existing customer base, focusing on non-fundincome streams and continuing proactive risk management strategies.The business remains alert to potential opportunities and will continueto enhance its presence both in existing and in new markets, whereappropriate returns are available.
Branchless & E-Banking
UBL rolled out the commercial launch of “Branchless Banking” inApril 2010. The array of services offered include basic bankingservices such as account opening, cash withdrawals and depositsas well as several value added services including remittances, billpayments and purchase of mobile airtime. Branchless Banking usershave access to multiple channels including ATMs and Phone Banking.In its first eight months, UBL Omni has managed to grow to a networkof more than 2,300 Dukaans (i.e. retail business agents) spreadacross more than 350 cities and towns of Pakistan. In 2010, more

Annual Report 2010 15
than 4 million transactions amounting to more than Rs 22 billionwere carried out through the Omni platform, including the paymentsto the flood affected population.
UBL Omni also managed to take the lead in transforming theGovernment to People (G2P) arena in Pakistan by working closelywith the GOP and multilateral agencies. The Bank provided transparentand efficient cash disbursement services for more than one millionflood affected people in KPK, Punjab, Sind and AJK, more than20,000 World Food Program beneficiaries and more than 400,000recipients of the Benazir Income Support Program in different remoteparts of Pakistan. These efforts have led UBL Omni to be recognizedas a benchmark and a role model for G2P payment services notonly locally but also internationally.
UBL Omni was also the recipient of a US$ 1.5 million grant by theBill & Melinda Gates Foundation through MEDA, for supporting theflood relief payments “Watan” project. In addition, the Bill & MelindaGates Foundation has also announced a US$ 6.9 million grantthrough ShoreBank to support enhanced financial inclusion of thecountry's underbanked population through UBL Omni. This grantwill be made available over a period of two years.
UBL Omni continues to create new and more efficient businessmodels and is already providing cash management services toFMCGs, fee collection services to schools and facilitating microfinanceinstitutions in increasing their reach by leveraging the 2,300 strongDukaan network for disbursements and collections services. UBLOmni plans to continue offering new products and services throughits platform. In addition to providing convenience to the Bank'scustomers, this channel also allows UBL to service its branchcustomers more efficiently by leveraging the agent network to divertroutine, repetitive transactions out of the branches.
Within the E-Banking area, products introduced by UBL over theyears such as Click-N-Remit, Click-N-Bank and NRP Direct havealready had wide acceptance. During 2010, UBL's Middle Eastbusiness was enabled to offer “netbanking” service to its customers- a feature that has been eagerly anticipated for a while by the Bank'sclients in those countries. At the same time, the internet bankingplatform is being enhanced locally to enable Corporate and SMEcustomers to also use this facility.
Treasury & Capital Markets
UBL promoted the introduction of SBP's electronic platform for GOPSecurities trading which was launched in January 2010. As a leadingPrimary Dealer, UBL provided support by actively trading on theBloomberg Electronic Bond platform, establishing itself as one ofthe top players for GOP Securities distribution. UBL has also beenranked amongst the top 3 Primary Dealers for the fiscal year 2009-2010.
UBL has been able to strengthen its liquidity management by investingin Securities portfolios which are generating regular inflows. TheInvestments portfolio has grown significantly and UBL has successfullytaken advantage of higher interest rates to optimize portfolio returns.
2010 saw a strong performance from the Treasury Sales desk witha focus towards greater client coverage in FX, Fixed Income andDerivatives products. The Treasury Sales team was strengthenedwith the addition of new dealers, along with formal training for theexisting staff. A separate Fixed Income desk was successfully setup and secondary market activity was doubled, making UBL a leadingplayer in the fixed income market.
A major milestone was the development and implementation of anew FX Sales system allowing streamlining of operational requirementsat all levels, and strengthening the MIS and transaction trackingsystem. Cross-functional training sessions were held for brancheshandling Foreign Exchange transactions, resulting in better clienthandling, transaction booking and efficient reporting. UBL hasimproved the turnover ratio for usage of its allocated limits andincreased its FX trading volumes resulting in substantial increase inprofitability
The Capital Markets team has consolidated and restructured itsEquity Trading portfolio and the Derivatives business continuesto provide innovative solutions and competitive pricing toCorporate clients.
Human Resources
In 2010 UBL maintained its focus on enhancing the quality of thestaff through development initiatives as well as induction of talent atvarious levels. As part of its annual plan, the Bank inducted over 180Retail Banking Officers and provided them comprehensive trainingin its Karachi, Lahore and Islamabad training centers, subsequentto which they have currently been assigned to various Retail branchesfor on-the-job training. The Bank also inducted 250 Cash officersinto the permanent cadre through a rigorous selection process afterhaving completed on-the-job training of over one year.
The emphasis on training and development of employees continued,with approximately 30,000 man days of training conducted duringthe year. The focus remained on enhancing technical and productknowledge with the goal of ultimately improving the service providedto the Bank's customers.
Investment was also initiated in the implementation of a state-of-theart employee and managerial self service system along with e-learningcapability. This is expected to be in place by early 2011 and willprovide the basis for enhanced skill and knowledge developmentcapability as well as management of staff related issues such as loanprocessing, leave applications, etc.
Nearly 200 UBL staff were also affected by the flooding in the country.The Bank provided all such staff logistical and financial support tohelp them in their hour of need.
Risk and Credit Policy
With the economy in a turbulent state, Risk & Credit Policy Groupincreased efforts to improve the Bank's risk management frameworkto bolster the asset quality of the corporate, commercial, consumerand international portfolios. Proactive portfolio management wasconducted through stringent monitoring of troubled accounts,specifically those of the Power and Textile sectors, coupled withfacilitating recovery through active restructuring. Steps were takento enhance the efficiency of the approval process through appropriatedelegation of credit approval authority, along with automation of theapproval process.
A comprehensive Risk Management Policy was finalized in 2010.This is an umbrella policy which develops an integrated frameworkto encompass Liquidity, Agricultural Credit, International/Local Credit,Market as well as Human Resource risk. An Agriculture Credit Policyhas also been developed and finalized over the year. Efforts toimplement the Operational Risk Management Framework across theBank have been ongoing and deployment of an Operational Risk
United Bank Limited16
[ President & CEO Review 2010 ]
Monitor system is one of the major milestones in this regard. In orderto automate the loan origination process for Corporate, Commercialand SME borrowers, a Loan Origination (LO) module has also beenindigenously designed. During the year the LO has been successfullyimplemented for SME and Consumer loans in Karachi and this isexpected to be rolled out Bank-wide in 2012.
For the equity trading portfolio, a value-at-risk methodology hasbeen implemented and is being back tested, while for the derivativesportfolio a revised mechanism has been rolled out for measurementand monitoring of pre-settlement risk. Market Risk limit settingmechanisms have also been revised to rely on quantitative ratherthan subjective methods. With regards to consumer credit, behavioralscoring and automated delinquent collection strategies have beenimplemented in order to perform customer segregation and thesubsequent curative action in a more efficient manner. UBL is alsoin the process of implementing an Application Scoring model, whichwill enable the risk decision makers to allocate limits/pricing facilitieson the basis of risk profile. Steps have also been taken towardsbetter information management during the year, with the Credit Policy& Research Division providing regular updates to business units onmajor macroeconomic and specific industry related happenings.
Core Banking Platform Implementation (Project Genesis)
During the year 2010, Project Genesis achieved a major milestone;six branches went live on the new Core Banking System (CBS).These included three Retail Branches and the Corporate branch ofKarachi besides Mortgage and Personal loan branches. This enabledthe bank to test the CBS with almost the entire spectrum oftransactions being conducted in UBL. With this migration, UBL alsoachieved a single Customer Information File for all the Bank'scustomers, providing a full view of all the customer's products withthe Bank.
The Enterprise Banking Suite (EBS) is the front end solution for CBScomprising the customer service platform (CSP) and the loanorigination system (LOS). CSP is a customer relationship managementtool and has been rolled out in over 350 branches. LOS has beenimplemented for Commercial loans and Consumer products and isunderway for Corporate loans and Credit Cards. During 2011, CSPwill be rolled out across the country while LOS implementation forall products will be completed in 2012. The implementation andintegration of CBS and EBS has provided seamless end to endprocessing for customer transactions.
Corporate Social Responsibility
UBL undertook several initiatives in its role as a good CorporateCitizen, which are described in detail on Page 12. The most importantof these was where UBL and its employees contributed nearly Rs38 million towards helping their fellow countrymen who were badlyaffected by the floods. UBL provided flood affectees with a unique“LifeStraw” filter, each of which purifies enough dirty water to caterto a family of five for 3 years. This not only ameliorated their immediateconcerns of access to clean drinking water, but had an equallyimportant secondary impact of staving off water-borne diseases, agreat threat in those conditions. UBL also ran a campaign encouragingthe general public to contribute towards this initiative and receivedgenerous contributions which were matched by UBL.
Conclusion
Through a difficult year, UBL has demonstrated a strong performance.This has been made possible through attention to several core issues,stringent monitoring of asset quality and credit performance andhiring and development of high quality talent. While the Bank remainsconscious of costs, it continues to make selective investments intechnology and new products and channels to maintain its reputationas an innovator. Although economic conditions remain challenging,the actions taken during the year position the Bank well to build onits solid base and take advantage of opportunities both locally andin overseas markets.
Atif R. BokhariPresident & CEO
Karachi.February 22, 2011
Annual Report 2010 17
[ Growth at a Glance ]
Six Years Financial Summary Standalone
PKR 'millionDecember 31 2010 2009 2008 2007 2006 2005
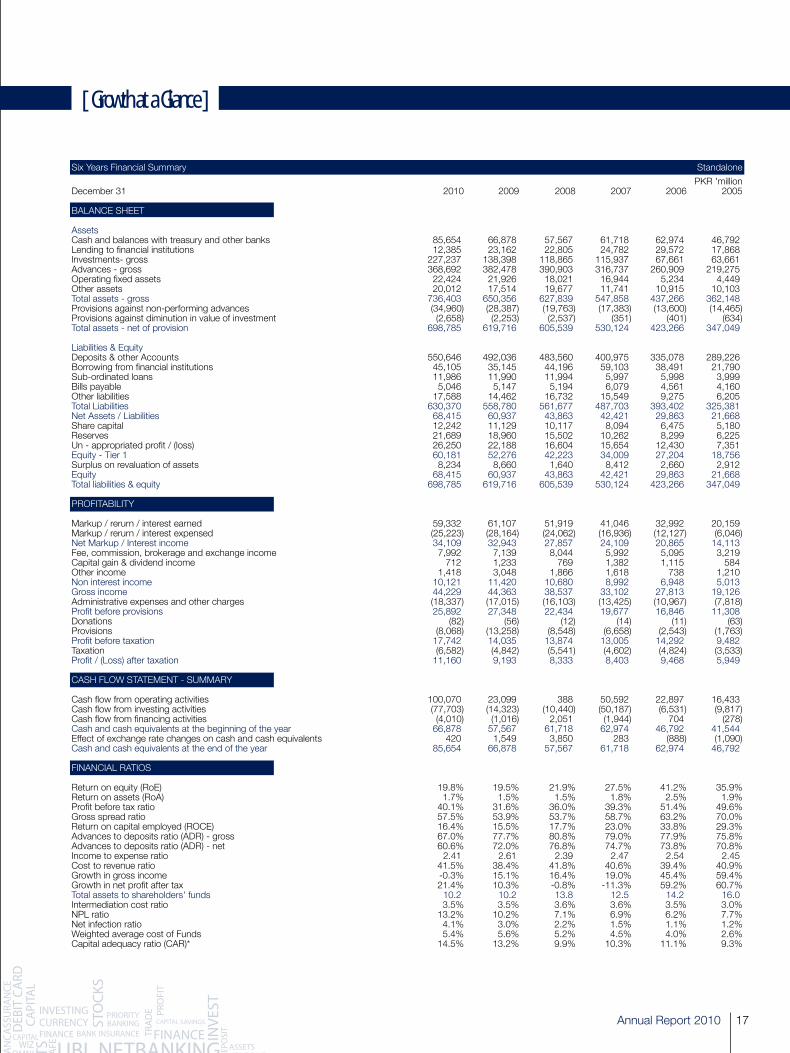
BALANCE SHEET Assets Cash and balances with treasury and other banks 85,654 66,878 57,567 61,718 62,974 46,792Lending to financial institutions 12,385 23,162 22,805 24,782 29,572 17,868Investments- gross 227,237 138,398 118,865 115,937 67,661 63,661Advances - gross 368,692 382,478 390,903 316,737 260,909 219,275Operating fixed assets 22,424 21,926 18,021 16,944 5,234 4,449Other assets 20,012 17,514 19,677 11,741 10,915 10,103Total assets - gross 736,403 650,356 627,839 547,858 437,266 362,148Provisions against non-performing advances (34,960) (28,387) (19,763) (17,383) (13,600) (14,465)Provisions against diminution in value of investment (2,658) (2,253) (2,537) (351) (401) (634)Total assets - net of provision 698,785 619,716 605,539 530,124 423,266 347,049 Liabilities & Equity Deposits & other Accounts 550,646 492,036 483,560 400,975 335,078 289,226Borrowing from financial institutions 45,105 35,145 44,196 59,103 38,491 21,790Sub-ordinated loans 11,986 11,990 11,994 5,997 5,998 3,999Bills payable 5,046 5,147 5,194 6,079 4,561 4,160Other liabilities 17,588 14,462 16,732 15,549 9,275 6,205Total Liabilities 630,370 558,780 561,677 487,703 393,402 325,381Net Assets / Liabilities 68,415 60,937 43,863 42,421 29,863 21,668Share capital 12,242 11,129 10,117 8,094 6,475 5,180Reserves 21,689 18,960 15,502 10,262 8,299 6,225Un - appropriated profit / (loss) 26,250 22,188 16,604 15,654 12,430 7,351Equity - Tier 1 60,181 52,276 42,223 34,009 27,204 18,756Surplus on revaluation of assets 8,234 8,660 1,640 8,412 2,660 2,912Equity 68,415 60,937 43,863 42,421 29,863 21,668Total liabilities & equity 698,785 619,716 605,539 530,124 423,266 347,049 PROFITABILITY Markup / rerurn / interest earned 59,332 61,107 51,919 41,046 32,992 20,159Markup / rerurn / interest expensed (25,223) (28,164) (24,062) (16,936) (12,127) (6,046)Net Markup / Interest income 34,109 32,943 27,857 24,109 20,865 14,113Fee, commission, brokerage and exchange income 7,992 7,139 8,044 5,992 5,095 3,219Capital gain & dividend income 712 1,233 769 1,382 1,115 584Other income 1,418 3,048 1,866 1,618 738 1,210Non interest income 10,121 11,420 10,680 8,992 6,948 5,013Gross income 44,229 44,363 38,537 33,102 27,813 19,126Administrative expenses and other charges (18,337) (17,015) (16,103) (13,425) (10,967) (7,818)Profit before provisions 25,892 27,348 22,434 19,677 16,846 11,308Donations (82) (56) (12) (14) (11) (63)Provisions (8,068) (13,258) (8,548) (6,658) (2,543) (1,763)Profit before taxation 17,742 14,035 13,874 13,005 14,292 9,482Taxation (6,582) (4,842) (5,541) (4,602) (4,824) (3,533)Profit / (Loss) after taxation 11,160 9,193 8,333 8,403 9,468 5,949 CASH FLOW STATEMENT - SUMMARY Cash flow from operating activities 100,070 23,099 388 50,592 22,897 16,433Cash flow from investing activities (77,703) (14,323) (10,440) (50,187) (6,531) (9,817)Cash flow from financing activities (4,010) (1,016) 2,051 (1,944) 704 (278)Cash and cash equivalents at the beginning of the year 66,878 57,567 61,718 62,974 46,792 41,544Effect of exchange rate changes on cash and cash equivalents 420 1,549 3,850 283 (888) (1,090)Cash and cash equivalents at the end of the year 85,654 66,878 57,567 61,718 62,974 46,792 FINANCIAL RATIOS Return on equity (RoE) 19.8% 19.5% 21.9% 27.5% 41.2% 35.9%Return on assets (RoA) 1.7% 1.5% 1.5% 1.8% 2.5% 1.9%Profit before tax ratio 40.1% 31.6% 36.0% 39.3% 51.4% 49.6%Gross spread ratio 57.5% 53.9% 53.7% 58.7% 63.2% 70.0%Return on capital employed (ROCE) 16.4% 15.5% 17.7% 23.0% 33.8% 29.3%Advances to deposits ratio (ADR) - gross 67.0% 77.7% 80.8% 79.0% 77.9% 75.8%Advances to deposits ratio (ADR) - net 60.6% 72.0% 76.8% 74.7% 73.8% 70.8%Income to expense ratio 2.41 2.61 2.39 2.47 2.54 2.45Cost to revenue ratio 41.5% 38.4% 41.8% 40.6% 39.4% 40.9%Growth in gross income -0.3% 15.1% 16.4% 19.0% 45.4% 59.4%Growth in net profit after tax 21.4% 10.3% -0.8% -11.3% 59.2% 60.7%Total assets to shareholders' funds 10.2 10.2 13.8 12.5 14.2 16.0Intermediation cost ratio 3.5% 3.5% 3.6% 3.6% 3.5% 3.0%NPL ratio 13.2% 10.2% 7.1% 6.9% 6.2% 7.7%Net infection ratio 4.1% 3.0% 2.2% 1.5% 1.1% 1.2%Weighted average cost of Funds 5.4% 5.6% 5.2% 4.5% 4.0% 2.6%Capital adequacy ratio (CAR)* 14.5% 13.2% 9.9% 10.3% 11.1% 9.3%
United Bank Limited18
[ Growth at a Glance ]
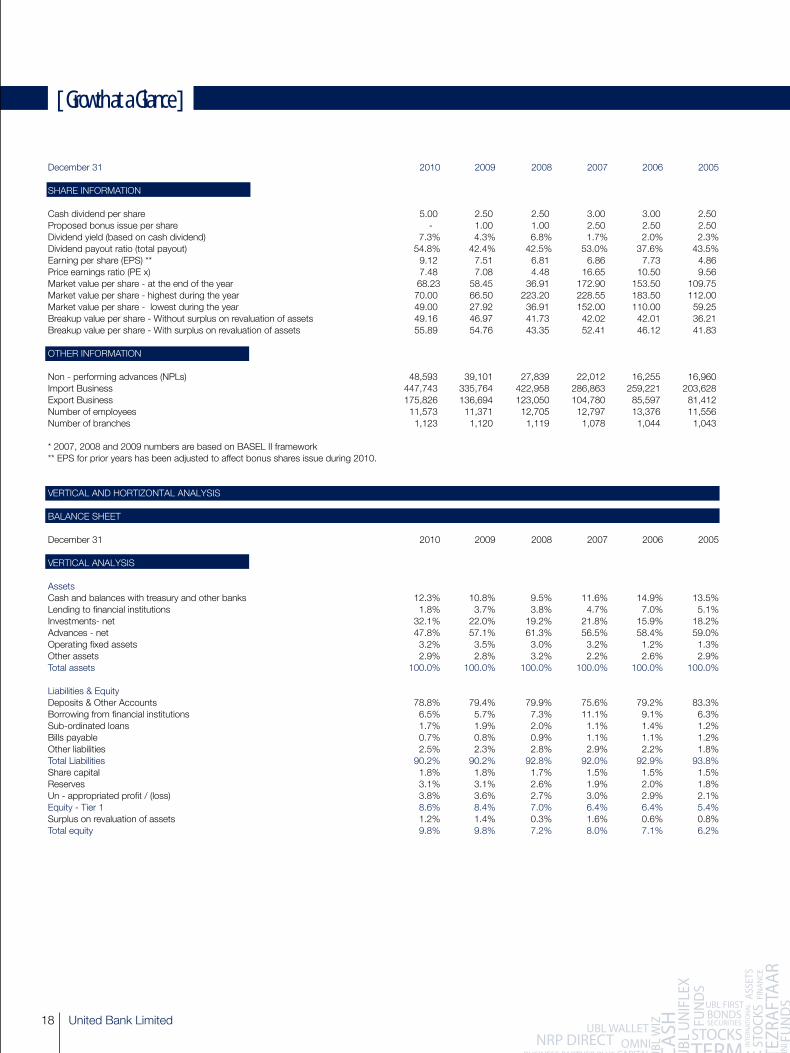
December 31 2010 2009 2008 2007 2006 2005 SHARE INFORMATION Cash dividend per share 5.00 2.50 2.50 3.00 3.00 2.50Proposed bonus issue per share - 1.00 1.00 2.50 2.50 2.50Dividend yield (based on cash dividend) 7.3% 4.3% 6.8% 1.7% 2.0% 2.3%Dividend payout ratio (total payout) 54.8% 42.4% 42.5% 53.0% 37.6% 43.5%Earning per share (EPS) ** 9.12 7.51 6.81 6.86 7.73 4.86Price earnings ratio (PE x) 7.48 7.08 4.48 16.65 10.50 9.56Market value per share - at the end of the year 68.23 58.45 36.91 172.90 153.50 109.75Market value per share - highest during the year 70.00 66.50 223.20 228.55 183.50 112.00Market value per share - lowest during the year 49.00 27.92 36.91 152.00 110.00 59.25Breakup value per share - Without surplus on revaluation of assets 49.16 46.97 41.73 42.02 42.01 36.21Breakup value per share - With surplus on revaluation of assets 55.89 54.76 43.35 52.41 46.12 41.83 OTHER INFORMATION Non - performing advances (NPLs) 48,593 39,101 27,839 22,012 16,255 16,960Import Business 447,743 335,764 422,958 286,863 259,221 203,628Export Business 175,826 136,694 123,050 104,780 85,597 81,412Number of employees 11,573 11,371 12,705 12,797 13,376 11,556Number of branches 1,123 1,120 1,119 1,078 1,044 1,043 * 2007, 2008 and 2009 numbers are based on BASEL II framework ** EPS for prior years has been adjusted to affect bonus shares issue during 2010.
VERTICAL AND HORTIZONTAL ANALYSIS BALANCE SHEET December 31 2010 2009 2008 2007 2006 2005 VERTICAL ANALYSIS Assets Cash and balances with treasury and other banks 12.3% 10.8% 9.5% 11.6% 14.9% 13.5%Lending to financial institutions 1.8% 3.7% 3.8% 4.7% 7.0% 5.1%Investments- net 32.1% 22.0% 19.2% 21.8% 15.9% 18.2%Advances - net 47.8% 57.1% 61.3% 56.5% 58.4% 59.0%Operating fixed assets 3.2% 3.5% 3.0% 3.2% 1.2% 1.3%Other assets 2.9% 2.8% 3.2% 2.2% 2.6% 2.9%Total assets 100.0% 100.0% 100.0% 100.0% 100.0% 100.0% Liabilities & Equity Deposits & Other Accounts 78.8% 79.4% 79.9% 75.6% 79.2% 83.3%Borrowing from financial institutions 6.5% 5.7% 7.3% 11.1% 9.1% 6.3%Sub-ordinated loans 1.7% 1.9% 2.0% 1.1% 1.4% 1.2%Bills payable 0.7% 0.8% 0.9% 1.1% 1.1% 1.2%Other liabilities 2.5% 2.3% 2.8% 2.9% 2.2% 1.8%Total Liabilities 90.2% 90.2% 92.8% 92.0% 92.9% 93.8%Share capital 1.8% 1.8% 1.7% 1.5% 1.5% 1.5%Reserves 3.1% 3.1% 2.6% 1.9% 2.0% 1.8%Un - appropriated profit / (loss) 3.8% 3.6% 2.7% 3.0% 2.9% 2.1%Equity - Tier 1 8.6% 8.4% 7.0% 6.4% 6.4% 5.4%Surplus on revaluation of assets 1.2% 1.4% 0.3% 1.6% 0.6% 0.8%Total equity 9.8% 9.8% 7.2% 8.0% 7.1% 6.2%
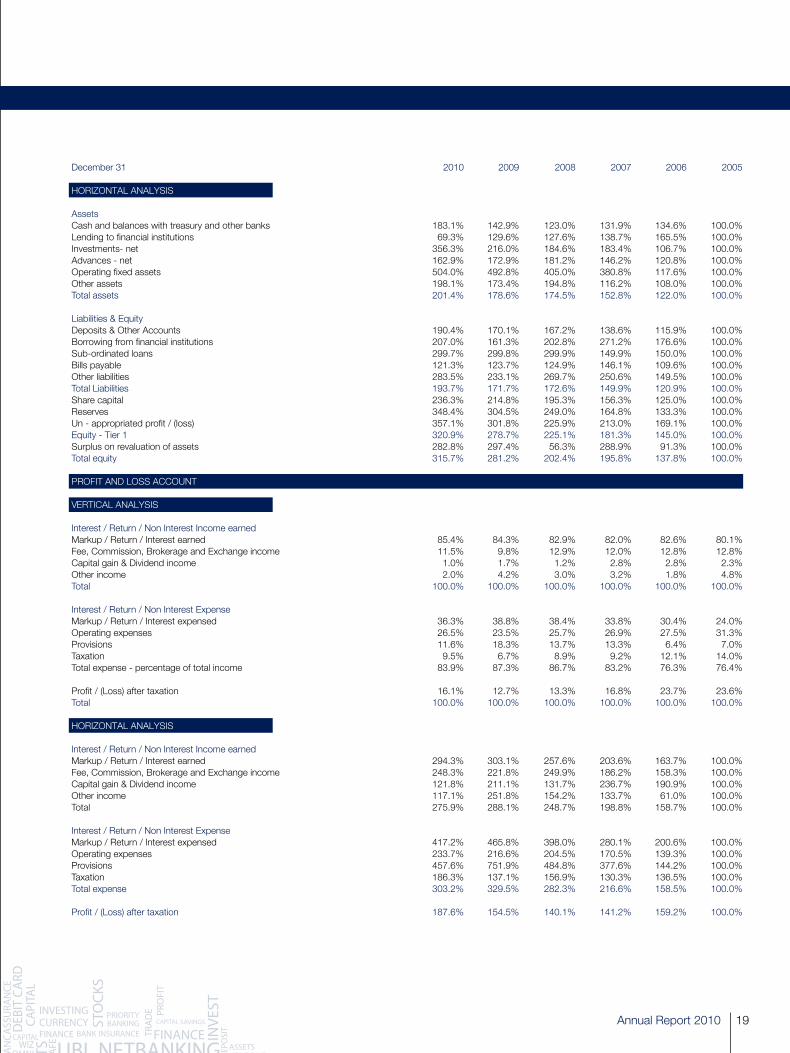
Annual Report 2010 19
December 31 2010 2009 2008 2007 2006 2005
HORIZONTAL ANALYSIS Assets Cash and balances with treasury and other banks 183.1% 142.9% 123.0% 131.9% 134.6% 100.0%Lending to financial institutions 69.3% 129.6% 127.6% 138.7% 165.5% 100.0%Investments- net 356.3% 216.0% 184.6% 183.4% 106.7% 100.0%Advances - net 162.9% 172.9% 181.2% 146.2% 120.8% 100.0%Operating fixed assets 504.0% 492.8% 405.0% 380.8% 117.6% 100.0%Other assets 198.1% 173.4% 194.8% 116.2% 108.0% 100.0%Total assets 201.4% 178.6% 174.5% 152.8% 122.0% 100.0%
Liabilities & Equity Deposits & Other Accounts 190.4% 170.1% 167.2% 138.6% 115.9% 100.0%Borrowing from financial institutions 207.0% 161.3% 202.8% 271.2% 176.6% 100.0%Sub-ordinated loans 299.7% 299.8% 299.9% 149.9% 150.0% 100.0%Bills payable 121.3% 123.7% 124.9% 146.1% 109.6% 100.0%Other liabilities 283.5% 233.1% 269.7% 250.6% 149.5% 100.0%Total Liabilities 193.7% 171.7% 172.6% 149.9% 120.9% 100.0%Share capital 236.3% 214.8% 195.3% 156.3% 125.0% 100.0%Reserves 348.4% 304.5% 249.0% 164.8% 133.3% 100.0%Un - appropriated profit / (loss) 357.1% 301.8% 225.9% 213.0% 169.1% 100.0%Equity - Tier 1 320.9% 278.7% 225.1% 181.3% 145.0% 100.0%Surplus on revaluation of assets 282.8% 297.4% 56.3% 288.9% 91.3% 100.0%Total equity 315.7% 281.2% 202.4% 195.8% 137.8% 100.0% PROFIT AND LOSS ACCOUNT VERTICAL ANALYSIS Interest / Return / Non Interest Income earned Markup / Return / Interest earned 85.4% 84.3% 82.9% 82.0% 82.6% 80.1%Fee, Commission, Brokerage and Exchange income 11.5% 9.8% 12.9% 12.0% 12.8% 12.8%Capital gain & Dividend income 1.0% 1.7% 1.2% 2.8% 2.8% 2.3%Other income 2.0% 4.2% 3.0% 3.2% 1.8% 4.8%Total 100.0% 100.0% 100.0% 100.0% 100.0% 100.0% Interest / Return / Non Interest Expense Markup / Return / Interest expensed 36.3% 38.8% 38.4% 33.8% 30.4% 24.0%Operating expenses 26.5% 23.5% 25.7% 26.9% 27.5% 31.3%Provisions 11.6% 18.3% 13.7% 13.3% 6.4% 7.0%Taxation 9.5% 6.7% 8.9% 9.2% 12.1% 14.0%Total expense - percentage of total income 83.9% 87.3% 86.7% 83.2% 76.3% 76.4% Profit / (Loss) after taxation 16.1% 12.7% 13.3% 16.8% 23.7% 23.6%Total 100.0% 100.0% 100.0% 100.0% 100.0% 100.0% HORIZONTAL ANALYSIS Interest / Return / Non Interest Income earned Markup / Return / Interest earned 294.3% 303.1% 257.6% 203.6% 163.7% 100.0%Fee, Commission, Brokerage and Exchange income 248.3% 221.8% 249.9% 186.2% 158.3% 100.0%Capital gain & Dividend income 121.8% 211.1% 131.7% 236.7% 190.9% 100.0%Other income 117.1% 251.8% 154.2% 133.7% 61.0% 100.0%Total 275.9% 288.1% 248.7% 198.8% 158.7% 100.0% Interest / Return / Non Interest Expense Markup / Return / Interest expensed 417.2% 465.8% 398.0% 280.1% 200.6% 100.0%Operating expenses 233.7% 216.6% 204.5% 170.5% 139.3% 100.0%Provisions 457.6% 751.9% 484.8% 377.6% 144.2% 100.0%Taxation 186.3% 137.1% 156.9% 130.3% 136.5% 100.0%Total expense 303.2% 329.5% 282.3% 216.6% 158.5% 100.0% Profit / (Loss) after taxation 187.6% 154.5% 140.1% 141.2% 159.2% 100.0%
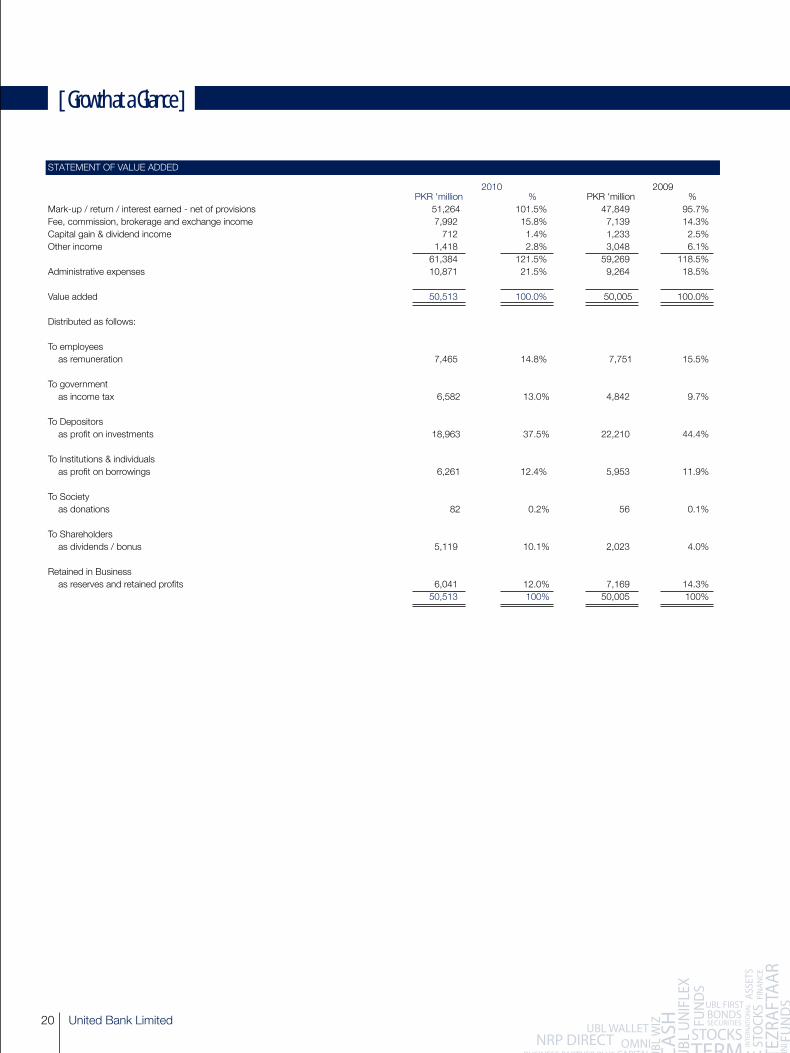
United Bank Limited20
[ Growth at a Glance ]
STATEMENT OF VALUE ADDED
2010 2009 PKR 'million % PKR 'million %Mark-up / return / interest earned - net of provisions 51,264 101.5% 47,849 95.7%Fee, commission, brokerage and exchange income 7,992 15.8% 7,139 14.3%Capital gain & dividend income 712 1.4% 1,233 2.5%Other income 1,418 2.8% 3,048 6.1%
61,384 121.5% 59,269 118.5%Administrative expenses 10,871 21.5% 9,264 18.5%
Value added 50,513 100.0% 50,005 100.0%
Distributed as follows:
To employees as remuneration 7,465 14.8% 7,751 15.5%
To government as income tax 6,582 13.0% 4,842 9.7%
To Depositors as profit on investments 18,963 37.5% 22,210 44.4%
To Institutions & individuals as profit on borrowings 6,261 12.4% 5,953 11.9%
To Society as donations 82 0.2% 56 0.1%
To Shareholders as dividends / bonus 5,119 10.1% 2,023 4.0%
Retained in Business as reserves and retained profits 6,041 12.0% 7,169 14.3% 50,513 100% 50,005 100%
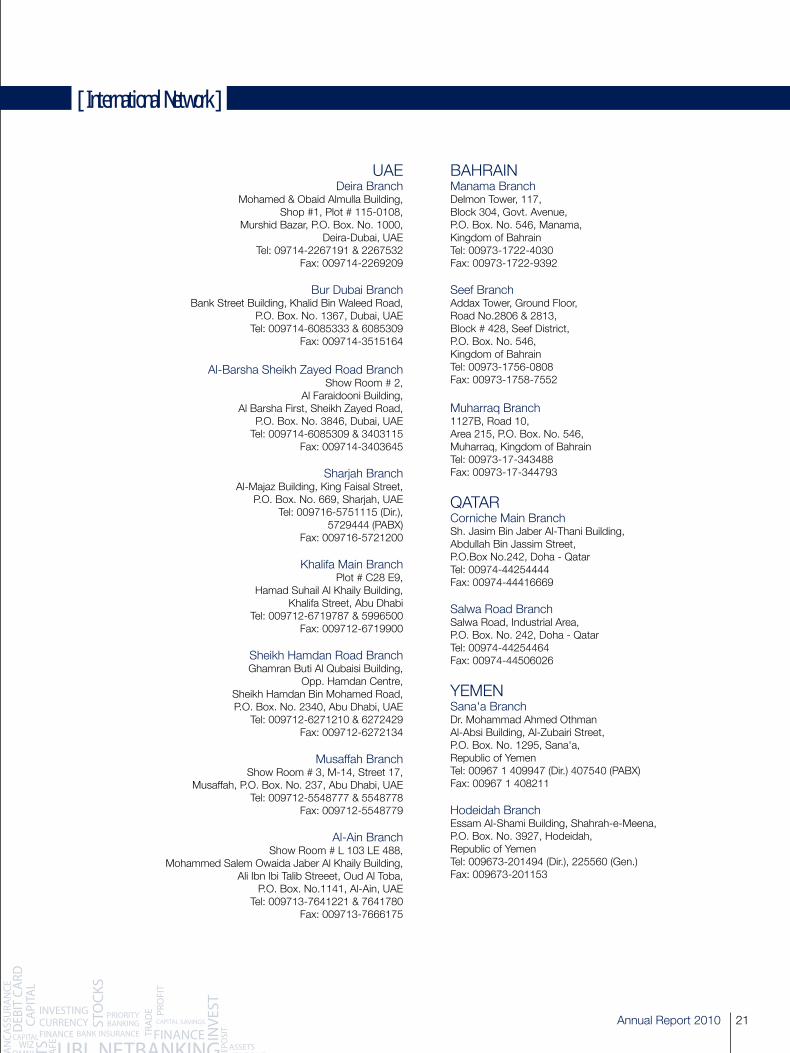
Annual Report 2010 21
[ International Network ]
UAEDeira Branch
Mohamed & Obaid Almulla Building,Shop #1, Plot # 115-0108,
Murshid Bazar, P.O. Box. No. 1000,Deira-Dubai, UAE
Tel: 09714-2267191 & 2267532Fax: 009714-2269209
Bur Dubai BranchBank Street Building, Khalid Bin Waleed Road,
P.O. Box. No. 1367, Dubai, UAETel: 009714-6085333 & 6085309
Fax: 009714-3515164
Al-Barsha Sheikh Zayed Road BranchShow Room # 2,
Al Faraidooni Building,Al Barsha First, Sheikh Zayed Road,
P.O. Box. No. 3846, Dubai, UAETel: 009714-6085309 & 3403115
Fax: 009714-3403645
Sharjah BranchAl-Majaz Building, King Faisal Street,
P.O. Box. No. 669, Sharjah, UAETel: 009716-5751115 (Dir.),
5729444 (PABX)Fax: 009716-5721200
Khalifa Main BranchPlot # C28 E9,
Hamad Suhail Al Khaily Building,Khalifa Street, Abu Dhabi
Tel: 009712-6719787 & 5996500Fax: 009712-6719900
Sheikh Hamdan Road BranchGhamran Buti Al Qubaisi Building,
Opp. Hamdan Centre,Sheikh Hamdan Bin Mohamed Road,P.O. Box. No. 2340, Abu Dhabi, UAE
Tel: 009712-6271210 & 6272429Fax: 009712-6272134
Musaffah BranchShow Room # 3, M-14, Street 17,
Musaffah, P.O. Box. No. 237, Abu Dhabi, UAETel: 009712-5548777 & 5548778
Fax: 009712-5548779
Al-Ain BranchShow Room # L 103 LE 488,
Mohammed Salem Owaida Jaber Al Khaily Building,Ali Ibn Ibi Talib Streeet, Oud Al Toba,
P.O. Box. No.1141, Al-Ain, UAETel: 009713-7641221 & 7641780
Fax: 009713-7666175
BAHRAINManama BranchDelmon Tower, 117,Block 304, Govt. Avenue,P.O. Box. No. 546, Manama,Kingdom of BahrainTel: 00973-1722-4030Fax: 00973-1722-9392
Seef BranchAddax Tower, Ground Floor,Road No.2806 & 2813,Block # 428, Seef District,P.O. Box. No. 546,Kingdom of BahrainTel: 00973-1756-0808Fax: 00973-1758-7552
Muharraq Branch1127B, Road 10,Area 215, P.O. Box. No. 546,Muharraq, Kingdom of BahrainTel: 00973-17-343488Fax: 00973-17-344793
QATARCorniche Main BranchSh. Jasim Bin Jaber Al-Thani Building,Abdullah Bin Jassim Street,P.O.Box No.242, Doha - QatarTel: 00974-44254444Fax: 00974-44416669
Salwa Road BranchSalwa Road, Industrial Area,P.O. Box. No. 242, Doha - QatarTel: 00974-44254464Fax: 00974-44506026
YEMENSana'a BranchDr. Mohammad Ahmed OthmanAl-Absi Building, Al-Zubairi Street,P.O. Box. No. 1295, Sana'a,Republic of YemenTel: 00967 1 409947 (Dir.) 407540 (PABX)Fax: 00967 1 408211
Hodeidah BranchEssam Al-Shami Building, Shahrah-e-Meena,P.O. Box. No. 3927, Hodeidah,Republic of YemenTel: 009673-201494 (Dir.), 225560 (Gen.)Fax: 009673-201153

United Bank Limited22
[ International Network ]
Aden BranchAden Mall, Crater, P.O. Box No.104, Aden,
Republic of YemenTel: 00967 2 269191, 00967 2 269063
Fax: 00967 2 269065
USANew York Branch
80 Broad Street, 24th Floor, New York,N.Y.10004 - 2209, U.S.A.
Tel: 001-212-943-1275Fax: 001-212-9680557
OBU - EPZEPZ Branch (Karachi)
Export Processing Zone, Landhi Industrial Area,Mehran Highway, Landhi, Karachi
Tel: 009221 35082301-3Fax: 009221 35082305
REPRESENTATIVE OFFICESIRAN
Tehran Rep. OfficeUnit 41, 4th floor,
Negin Gholhak Tower, Kolahdouz crossing,Shariati Ave., Tehran, Iran
Tel: +9821-26601350-1Fax: +9821-22611297
KAZAKHSTANAlmaty Rep. Office
Suite 205, SAT Business Centre,32A Manasa Street, Bostandykski District,
Almay, 050008, Republic of KazakhstanTel: 00 7-727-2378432 & 2378433
Fax: 00 7-727-2378432
CHINABeijing Rep. Office
Room # 2110, The Exchange Beijing,No.118, Jianguo Road,
Chaoyang District, Beijing,100022, Peoples Republic of China
Tel: 0086-10-65675560 & 65675579Fax: 0086-10-65675560
SUBSIDIARYSWITZERLANDUnited Bank AG (Zurich)Feldeggstrasse 55, P.O. Box. No. 1176, 8034Zurich, SwitzerlandTel: 0041 43 4991920Fax: 0041 43 4991933
UKUnited National Bank Limited2 Brook Street, London - W1S 1BQ, U.K.Tel: 0044 20 7290 8000Fax: 0044 20 7290 3054
ASSOCIATE COMPANYOMANOman United Exchange Co. LLC, (Muscat)(i) Ruwi Branch P.O. Box. No. 889, Near Ruwi Police Station,Postal code 100, Ruwi, Muscat,Sultanate of OmanTel: 00968 24794305, 24782048Fax: 00968 24794344
ii) Salalah BranchP.O. Box. No. 2052, Postal code 211,Salalah, Sultanate of OmanTel: 00968 23290323Fax: 00968 23290323
iii) Sohar BranchP.O. Box. No. 889, Postal code 100,Muscat, Sultanate of OmanTel: 00968 26847021Fax: 00968 26847022
iv) Ghoubra BranchP.O. Box. No. 889, Postal code 100,Muscat, Sultanate of OmanTel: 00968 24495645Fax: 00968 24495624
v) Industrial Area Salalah BranchP.O. Box. No. 2052,Postal code 211, Salalah,Sultanate of OmanTel: 00968 23213264Fax: 00968 23211260
Annual Report 2010 23
The year 2010 was the fourth year in progress of Islamic commercialbanking for United Bank Limited. During the year, the Bank hasmaintained its product offering and has focused mainly on buildingup deposits. The bank has focused much on the liability side and hasdeveloped Islamic banking deposit product after due approval fromthe Shariah Advisor extending its product line.
Following were the developments that took place during the year:
Product Development
During the year the Product Development Department of the bankhas designed a new deposit product “Ameen Business Account” toattract corporate customers requiring free facilities as provided byconventional counter parts to their current account holders. UBLAmeen Business Account caters corporate customers providing freevalue added services and profit together.
Expansion of Branch Network
During the year there was an addition of an Islamic Banking Branch.The process of conversion was duly vetted and successfully completed.
Islamic Banking Training
It's the people who are the asset of an organization and it's them whoare behind the success of it. Enhancing the quality of these assetswill paint a better portrait.
UBL Ameen needs to emphasize on training their staff in order to upbreast them with Islamic banking and ensure Shariah compliance.This will lead to the success of the whole team. Human resourcedevelopment is basically an investment in the asset of the organization.Alhamdulillah, this year has been declared “The year of Learning andKnowledge”. This will help in achieving the milestone with concretemeasures.
Review of Assets
The Bank's major financing activities during the year were made inMurabaha, Ijarah and Diminishing Musharakah. Ijarah transactionsconstitute 44.61% of the total financing portfolio while the percentageof Diminishing Musharakah and Murabaha was 30.92% and 24.47%respectively. The Bank's total financing portfolio reduced to PKR832.848 million as of December 31, 2010 compared to PKR 1,152.522million in December 31, 2009.
Review of Liabilities
On the liability side, the Bank offered different Shariah Compliantdeposit products based on the modes of Mudarabah & Qardh. Thetotal deposits of the Bank was doubled, notably reaching to PKR4,459.221 million as at December 31, 2010 compared to PKR2,208.418 million of last year, showing an impressive growth of101.92%. It was also encouraging that there was nothing contradictoryto the dictates of Shariah.
Shariah Audit
During the year 2010, Shariah Audit was carried out by the ShariahAudit, Compliance and Advisory department, to check the overallShariah compliance of the bank's operation and their adherence to
the guidelines issued by SBP and Shariah Advisor. In the Audit,following operations were reviewed:
• Allocation of funds and Pool Management System• Weightages and profit sharing ratios• Declarations, description of Assets, relevant purchase invoices,
sequence and order of the documents, and time difference betweenpurchases and declaration in Murabaha.
• Treatment of ownership related cost and recovery of rentals inIjarah transactions.
• Import Finance transactions and related documentation.• Other related documents and procedures followed by different
functional areas.
As per SBP guidelines it has been decided to separate Shariah Auditfrom Shariah Compliance. Under the new system Shariah Audit shouldbe carried out by Internal Audit Department of the bank through adedicated resource in order to ensure transactions are carried outaccording to the approved process flows and manuals withindependence. The Shariah Audit Report will be placed in front of theShariah Advisor for review and decision.
Charity
The charity policy was duly vetted by the Shariah Advisor and wasapproved by the board of directors.
During the year total charity amounting to PKR 0.840 Million from non-Shariah compliant sources has been credited to the Charity Accountand an amount of PKR 9.780 million was disbursed after the approvalof the Shariah Advisor.
Shariah Compliance
In order to maintain Shariah compliance following measures weretaken;
• Internal memos on Shariah compliance guidelines were issued bythe Shariah Advisor from time to time. In order to avoid anymisunderstanding with the customer and voidance of the transaction,it was made mandatory to involve Shariah Compliance from thevery inception of the proposal.
• Prior any formal commitment to the customer in principle approvalmust be sought from the Shariah Advisor.
• The Standardize Credit Application (SCA) is shared with the ShariahCompliance Department before any disbursement and processflow of the financing activity approved by the Shariah ComplianceDepartment forms an integral part of the SCA.
• In order to avoid any delay a turnaround time (TAT) of maximumtwo days for SCA Shariah approval was decided.
Shariah AdvisoryDuring the year the bank provided Shariah Advisory on restructuringof two Sukuk where UBL was acting as the trustee.
In order to avail the benefit from the in house expertise Shariah advisoryservices should be extended to local and international markets especiallyin the GCC, Europe and USA regions where UBL has a track recordand presence.
[ Shariah Advisor’s Report ]
United Bank Limited24
Shariah Advisory
During the year the bank provided Shariah Advisory on restructuringof two Sukuk where UBL was acting as the trustee.
In order to avail the benefit from the in house expertise Shariah advisoryservices should be extended to local and international markets especiallyin the GCC, Europe and USA regions where UBL has a track recordand presence.
Recommendation
Based on the review of various transactions we recommend that:
• The quality growth of the Islamic banking division is connectedwith employees' training. Utmost focus should be shifted towardsproper training of staff. A comprehensive program with resultoriented outcomes should be designed and a reasonable budgetshould be allocated in this regard. The outcomes of the trainingshould become an integral part of employees' appraisal.
• The Bank should also focus on customer awareness. Properinformation should be communicated in order to avoidmisunderstanding.
• The Corporate and Commercial Banking Departments of the Bankshould strictly adhere to the Shariah compliance mechanism setout by the bank in order to strengthen the Shariah compliance.
• Charity should invariably be disbursed to the organizations onceenlisted with the bank unless any discrepancy is found.
• Risk and Credit Departments should allocate a dedicated resourcewithin the department to ensure that there is no non-Shariahcompliance risk associated while managing approvals.
• As now the bank is gathering pace in its activities, it is suggestedthat in all Shariah related decisions, especially matters pertainingto Shariah compliance, audit, and training, Shariah Advisor'sconsent may be sought invariably. This will improve the overallquality of Shariah compliance within the bank.
• It is also suggested that as the bank is growing, a proper ShariahCompliance Manual describing the overall mechanism should befinalized incorporating the instruction laid by the Shariah Advisorfrom time to time.
Conclusion
It is the responsibility of the Bank's management and employees toensure application of Shariah principles and guidelines issued by theShariah Advisor from time to time and to ensure Shariah compliancein all activities of the Islamic Banking Division.
Based on the review and management representations, in our opinionthe activities and transactions performed by the Islamic banking divisionduring the year comply with the Principles and Guidelines of IslamicJurisprudence, issued and directed by the Shariah Advisor of UnitedBank Limited.
Mufti Ehsan Waquar AhmadShariah AdvisorUnited Bank LimitedIslamic Banking Group
[ Shariah Advisor’s Report ]
Annual Report 2010 25
[ Statement of Compliance with the code of Corporate Governance year ended December 31, 2010 ]
This statement is being presented to comply with the Code of CorporateGovernance (The Code) contained in the Regulation No. 37, XIII & 36of Listing Regulations of Karachi, Lahore & Islamabad Stock Exchangesfor the purpose of establishing a framework of good governance,whereby a listed company is managed in compliance with the bestpractices of corporate governance.
The Board of Directors has adopted the Code of Corporate Governanceand applied the principles contained in the Code in the followingmanner:
1. Except for the Chief Executive Officer, all other directors, includingChairman and Deputy Chairman are non-executive directors.
2. The directors have confirmed that none of them is serving as adirector in more than ten listed companies, including this Bank.
3. All the resident directors of the Bank are registered as taxpayersand none of them has defaulted in payment of any loan to abanking company, a DFI or an NBFI or, being a member of astock exchange, has been declared as a defaulter by that stockexchange.
4. During the year Government of Pakistan (GOP) has appointedMr. Seerat Asghar as director with effect from 30 March 2010in place of Dr. Ashfaque Hasan Khan.
5. During the year 2009, the Board of Directors approved andsigned “Statement of Ethics and Business Practices” and obtainingthe signature of employees is under process.
6. The Board has developed a vision / mission statement, overallcorporate strategy and significant policies of the Bank. A set ofsignificant policies are maintained by the Bank.
7. All the powers of the Board have been duly exercised and decisionon material transactions, including appointment and determinationof remuneration and terms and conditions of employment of theChief Executive Officer have been taken by the Board.
8. The meetings of the Board were presided over by the Chairmanand, in his absence, by the Deputy Chairman and in absence ofDeputy Chairman by any other director. The Board met at leastonce in every quarter. Written notices of the Board meeting,along with agenda and working papers, were circulated at leastseven days before the meetings. The minutes of the meetingswere appropriately recorded and circulated. The CompanySecretary and Chief Financial Officer attended the meetings ofthe Board of Directors.
9. The appointments of Chief Financial Officer, Company Secretaryand Head of Internal Audit including their remuneration and termsof employment have been approved by the Board.
10. In compliance of Sub Clause (xiv) of Clause 35 of ListingRegulations, three directors have attended and completed Part 1of Corporate Governance Leadership Skills program on 20December 2010 under the Board Development Series of PakistanInstitute of Corporate Governance.
11. The directors’ report for this year has been prepared in compliancewith the requirements of the Code and fully describes the salientmatters required to be disclosed.
12. The financial statements of the Bank were duly endorsed by theChief Executive Officer and Chief Financial Officer before approvalof the Board.
13. The Directors, Chief Executive Officer and executives do not holdany interest in the shares of the Bank other than those disclosedin pattern of shareholding.
14. The Bank has complied with all the corporate and financialreporting requirements.
15. The Board has formed an audit committee. It comprises of threemembers, all of whom are non-executive directors including theChairman of the Committee.
16. The meetings of the audit committee are held at least once everyquarter prior to approval of interim and final results of the Bank,as required by the Code. The terms of reference of the committeehave been formulated and advised to the committee forcompliance.
17. The Board has set up an effective internal audit function. Personnelof the Internal Audit Department are suitably qualified andexperienced for the purpose and are conversant with the policiesand procedures of the Bank and they are involved in the internalaudit function on a full time basis.
18. The statutory auditors of the Bank have confirmed that they havebeen given a satisfactory rating under the Quality Control ReviewProgram of The Institute of Chartered Accountants of Pakistan,that they or any of the partners of the firm, their spouses andminor children do not hold shares of the Bank and that the firmand all its partners are in compliance with International Federationof Accountants (IFAC) guidelines on Code of Ethics as adoptedby the Institute of Chartered Accountants of Pakistan.
19. The statutory auditors or the persons associated with them havenot been appointed to provide services other than approvedservices and the auditors have confirmed that they have observedIFAC guidelines in this regard.
20. We confirm that all other material principles contained in theCode have been complied with.
For and on behalf of the Board of Directors
Nahayan Mabarak Al NahayanChairmanAbu Dhabi
Date: February 21, 2011
United Bank Limited26
We have reviewed the Statement of Compliance with the bestpractices (the Statement) contained in the Code of CorporateGovernance (the Code) for the year ended December 31, 2010prepared by the Board of Directors of UNITED BANK LIMITED (theBank) to comply with the Listing Regulation No.35 (Chapter XI) ofthe Karachi Stock Exchange (Guarantee) Limited, Lahore StockExchange (Guarantee) Limited and Islamabad Stock Exchange(Guarantee) Limited, where the Bank is listed.
The responsibility for compliance with the Code of CorporateGovernance is that of the Board of Directors of the Bank. Ourresponsibility is to review, to the extent where such compliance canbe objectively verified, whether the Statement of Compliance reflectsthe status of the Bank’s compliance with the provisions of the Codeof Corporate Governance and report if it does not. A review is limitedprimarily to inquiries of the Bank’s personnel and review of variousdocuments prepared by the Bank to comply with the Code.
As part of our audit of the financial statements we are required toobtain an understanding of the accounting and internal controlsystems sufficient to plan the audit and develop an effective auditapproach. We are not required to consider whether the Board’sstatement on internal control covers all risks and controls, or to forman opinion on the effectiveness of such internal controls, the Bank’scorporate governance procedures and risks.
Further, the Listing Regulations require the Bank to place before theBoard of Directors for their consideration and approval, related partytransactions distinguishing between transactions carried out onterms equivalent to those that prevail in arm’s length transactionsand transactions which are not executed at arm’s length pricerecording proper justification for using such alternate pricingmechanism. Further, all such transactions are also required to beseparately placed before the Audit Committee. We are only requiredand have ensured compliance of requirement to the extent of approval
of related party transactions by the Board of Directors and placementof such transactions before the Audit Committee. We have notcarried out any procedures to determine whether the related partytransactions were undertaken at arm’s length price or not.
Based on our review nothing has come to our attention which causesus to believe that the Statement of Compliance does not appropriatelyreflect the Bank’s compliance, in all material respects, with the bestpractices contained in the Code of Corporate Governance asapplicable to the Bank for the year ended December 31, 2010.
Review Report to the Members on Statement of Compliance with best practices of Code of Corporate Governance
BDO Ebrahim & Co.Chartered Accountants2nd Floor, Block CLakson Square Building No.1Sarwar Shaheed RoadKarachi 74200
Ernst & Young Ford Rhodes Sidat HyderChartered AccountantsProgressive PlazaBeaumont RoadPO Box 15541Karachi 75530
BDO Ebrahim & Co.Chartered AccountantsAudit Engagement Partner:Zulfikar Ali Causer
Ernst & Young Ford Rhodes Sidat HyderChartered AccountantsAudit Engagement Partner:Shabbir Yunus
Date: February 21, 2011Karachi
The Internal Control system comprises various inter-related componentsincluding Control Environment, Risk Assessment, ControlActivities, Information & Communication and Monitoring.
It is the responsibility of Bank's management to establish an InternalControl System to maintain an adequate and effective Internal ControlEnvironment. It is a process designed to identify and mitigate the riskof failure to achieve overall business objectives of the Bank. Internalcontrols and policies are designed to provide reasonable assuranceregarding effectiveness and efficiency of the Bank's operations, reliabilityof financial information and compliance with applicable laws andregulations.
Evaluation
Evaluation of the Bank's Internal Control System comprises differentlevels of monitoring activities i.e. Line Management, Internal ControlDepartment and Internal Audit. Internal Audit Group continued toevaluate the implementation & efficacy of internal controls throughoutthe year 2010 by carrying out bank-wide audit activities.
The Compliance and Control Assurance Group (CCAG) continued toreview the Bank's process manuals developed during 2010 or anychange in existing process manuals to ensure the existence of propercontrols in the design of processes. CCAG also conducted reviewsof branches and departments to identify gaps in execution of approvedprocesses.
All significant and material findings of the internal and external auditorsand regulators were addressed on priority basis and reported to theBoard Audit Committee, who ensured that management put in placea system for the strengthening of the control environment, identifyingareas requiring improvement and devising appropriate remedial actionon a timely basis to safeguard the Bank's interest.
Management's consistent & continuous monitoring through automationinitiatives has also helped in reducing the error rate and shall helpfurther in improving the overall control environment in the Bank.
The Bank endeavors to follow the guidelines on Internal Controls.Testing of effectiveness of Internal Controls over Financial Reporting(ICFR) prevalent throughout the Bank was carried out. However, noneof the deficiencies identified are expected to have a material impacton the accurate reporting of Financial Statements.
The Bank has made enhanced efforts to ensure that an effective andefficient Internal Control System remained active & implemented. The
Bank's Internal Control system has been designed to provide reasonableassurance to the shareholders and Board of Directors; however thesesystems may not entirely eliminate the risk of misreporting and failureof certain controls under a changing environment.
Based upon the results achieved from reviews and audits conductedduring the year, management considers that the existing InternalControl system is adequate and has been effectively implementedand monitored, though room for improvement always exists.
[ Annual Statement on Internal Controls - 2010 ]
Rayomond KotwalChief Financial Officer
Atif RasheedHead Compliance &Control Assurance
M. EjazuddinGroup Executive -Audit & Inspection
Atif R. BokhariPresident & CEO
Annual Report 2010 27

29
BDO Ebrahim & Co.Chartered Accountants2nd Floor, Block CLakson Square Building No.1Sarwar Shaheed RoadKarachi 74200
Ernst & Young Ford Rhodes Sidat HyderChartered AccountantsProgressive PlazaBeaumont RoadPO Box 15541Karachi 75530
BDO Ebrahim & Co.Chartered AccountantsAudit Engagement Partner:Zulfikar Ali Causer
Ernst & Young Ford Rhodes Sidat HyderChartered AccountantsAudit Engagement Partner:Shabbir Yunus
Annual Report 2010
We have audited the annexed unconsolidated statement offinancial position of UNITED BANK LIMITED (the Bank) as atDecember 31, 2010 and the related unconsolidated profit andloss account, unconsolidated statement of comprehensiveincome, unconsolidated cash flow statement, andunconsolidated statement of changes in equity, together withthe notes forming part thereof (here-in-after referred to as the‘financial statements’) for the year then ended, in which areincorporated the unaudited certified returns from the branchesexcept for thirty six branches which have been audited by usand seventeen branches audited by auditors abroad and westate that we have obtained all the information andexplanations which, to the best of our knowledge and belief,were necessary for the purposes of our audit.
It is the responsibility of the Bank’s Board of Directors toestablish and maintain a system of internal control, andprepare and present the financial statements in conformitywith approved accounting standards and the requirements ofthe Banking Companies Ordinance, 1962 (LVII of 1962), andthe Companies Ordinance, 1984 (XLVII of 1984). Ourresponsibility is to express an opinion on these statementsbased on our audit.
We conducted our audit in accordance with the InternationalStandards on Auditing as applicable in Pakistan. Thesestandards require that we plan and perform the audit to obtainreasonable assurance about whether the financial statementsare free of any material misstatement. An audit includesexamining, on a test basis, evidence supporting the amountsand disclosures in the financial statements. An audit alsoincludes assessing the accounting policies and significantestimates made by management, as well as, evaluating theoverall presentation of the financial statements. We believethat our audit provides a reasonable basis for our opinion andafter due verification, which in case of loans and advancescovered more than sixty percent of the total loans andadvances of the Bank, we report that:
(a) in our opinion proper books of account have been kept bythe Bank as required by the Companies Ordinance, 1984(XLVII of 1984), and the returns referred to above receivedfrom the branches have been found adequate for thepurposes of our audit;
(b) in our opinion:
(i) the unconsolidated statement of financial position andunconsolidated profit and loss account together withthe notes thereon have been drawn up in conformitywith the Banking Companies Ordinance, 1962 (LVII of1962), and the Companies Ordinance, 1984 (XLVII of1984), and are in agreement with the books of accountand are further in accordance with accounting policiesconsistently applied except for the changes inaccounting policies as disclosed in note 5.1 to theaccompanying financial statements, with which weconcur;
(ii) the expenditure incurred during the year was for thepurpose of the Bank’s business; and
(iii) the business conducted, investments made and theexpenditure incurred during the year were inaccordance with the objects of the Bank and thetransactions of the Bank which have come to ournotice have been within the powers of the Bank;
(c) in our opinion and to the best of our information andaccording to the explanations given to us theunconsolidated statement of financial position,unconsolidated profit and loss account, unconsolidatedstatement of comprehensive income, unconsolidated cashflow statement and unconsolidated statement of changesin equity, together with the notes forming part thereofconform with approved accounting standards asapplicable in Pakistan and give the information required bythe Banking Companies Ordinance, 1962 (LVII of 1962),and the Companies Ordinance, 1984 (XLVII of 1984), inthe manner so required and give a true and fair view of thestate of the Bank’s affairs as at December 31, 2010 and itstrue balance of the profit, its comprehensive income, itscash flows and changes in equity for the year then ended;and
(d) in our opinion zakat deductible at source under the Zakatand Ushr Ordinance, 1980 (XVIII of 1980), was deductedby the Bank and deposited in the Central Zakat Fundestablished under Section 7 of that Ordinance.
Auditors’ Report to the Members
Date: February 21, 2011Karachi
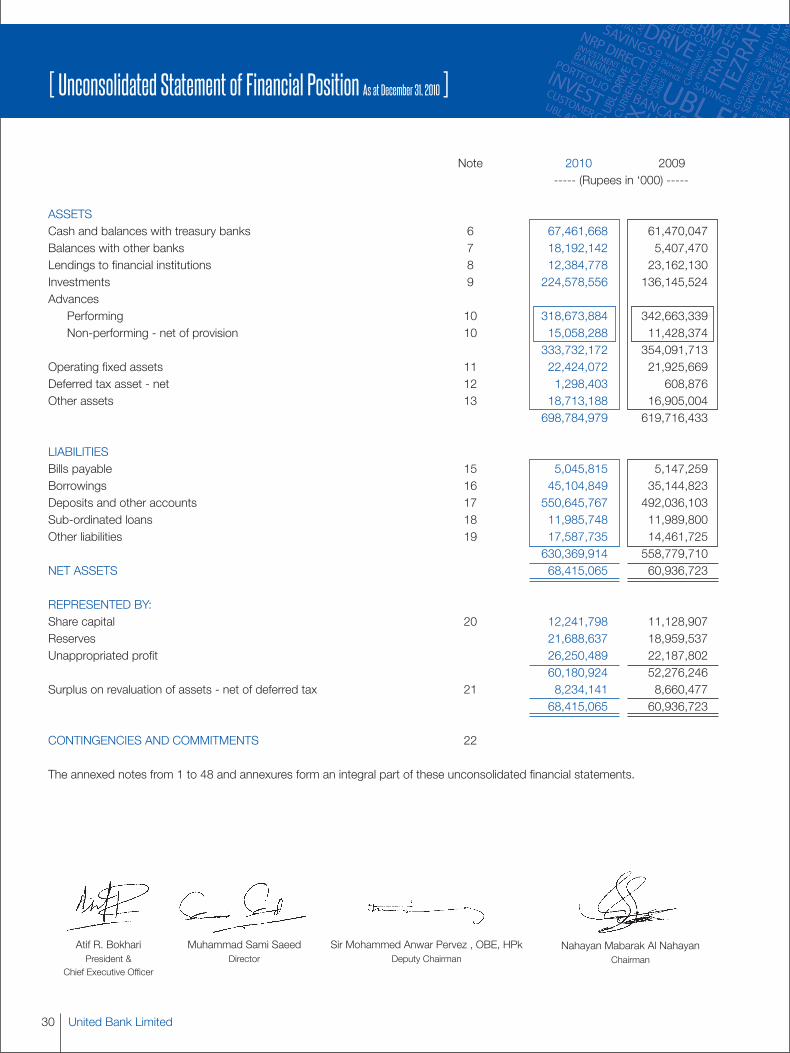
United Bank Limited30
[ Unconsolidated Statement of Financial Position As at December 31, 2010 ]
Note 2010 2009----- (Rupees in ‘000) -----
ASSETSCash and balances with treasury banks 6 67,461,668 61,470,047Balances with other banks 7 18,192,142 5,407,470Lendings to financial institutions 8 12,384,778 23,162,130Investments 9 224,578,556 136,145,524Advances
Performing 10 318,673,884 342,663,339Non-performing - net of provision 10 15,058,288 11,428,374
333,732,172 354,091,713Operating fixed assets 11 22,424,072 21,925,669Deferred tax asset - net 12 1,298,403 608,876Other assets 13 18,713,188 16,905,004
698,784,979 619,716,433
LIABILITIESBills payable 15 5,045,815 5,147,259Borrowings 16 45,104,849 35,144,823Deposits and other accounts 17 550,645,767 492,036,103Sub-ordinated loans 18 11,985,748 11,989,800Other liabilities 19 17,587,735 14,461,725
630,369,914 558,779,710NET ASSETS 68,415,065 60,936,723
REPRESENTED BY:Share capital 20 12,241,798 11,128,907Reserves 21,688,637 18,959,537Unappropriated profit 26,250,489 22,187,802
60,180,924 52,276,246Surplus on revaluation of assets - net of deferred tax 21 8,234,141 8,660,477
68,415,065 60,936,723
CONTINGENCIES AND COMMITMENTS 22
The annexed notes from 1 to 48 and annexures form an integral part of these unconsolidated financial statements.
Atif R. BokhariPresident &
Chief Executive Officer
Muhammad Sami SaeedDirector
Sir Mohammed Anwar Pervez , OBE, HPkDeputy Chairman
Nahayan Mabarak Al NahayanChairman
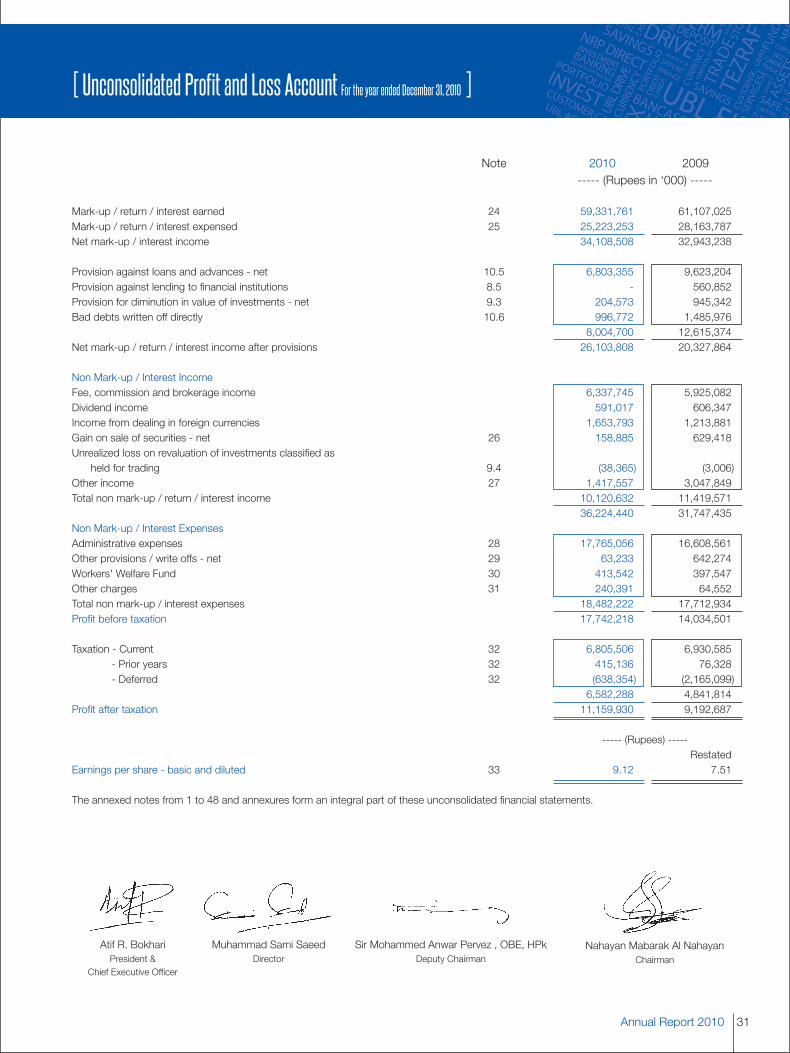
31
[ Unconsolidated Profit and Loss Account For the year ended December 31, 2010 ]
Annual Report 2010
Note 2010 2009----- (Rupees in ‘000) -----
Mark-up / return / interest earned 24 59,331,761 61,107,025Mark-up / return / interest expensed 25 25,223,253 28,163,787Net mark-up / interest income 34,108,508 32,943,238
Provision against loans and advances - net 10.5 6,803,355 9,623,204Provision against lending to financial institutions 8.5 - 560,852Provision for diminution in value of investments - net 9.3 204,573 945,342Bad debts written off directly 10.6 996,772 1,485,976
8,004,700 12,615,374Net mark-up / return / interest income after provisions 26,103,808 20,327,864
Non Mark-up / Interest IncomeFee, commission and brokerage income 6,337,745 5,925,082Dividend income 591,017 606,347Income from dealing in foreign currencies 1,653,793 1,213,881Gain on sale of securities - net 26 158,885 629,418Unrealized loss on revaluation of investments classified as
held for trading 9.4 (38,365) (3,006)Other income 27 1,417,557 3,047,849Total non mark-up / return / interest income 10,120,632 11,419,571
36,224,440 31,747,435Non Mark-up / Interest ExpensesAdministrative expenses 28 17,765,056 16,608,561Other provisions / write offs - net 29 63,233 642,274Workers' Welfare Fund 30 413,542 397,547Other charges 31 240,391 64,552Total non mark-up / interest expenses 18,482,222 17,712,934Profit before taxation 17,742,218 14,034,501
Taxation - Current 32 6,805,506 6,930,585- Prior years 32 415,136 76,328- Deferred 32 (638,354) (2,165,099)
6,582,288 4,841,814Profit after taxation 11,159,930 9,192,687
----- (Rupees) -----Restated
Earnings per share - basic and diluted 33 9.12 7.51
The annexed notes from 1 to 48 and annexures form an integral part of these unconsolidated financial statements.
Atif R. BokhariPresident &
Chief Executive Officer
Muhammad Sami SaeedDirector
Sir Mohammed Anwar Pervez , OBE, HPkDeputy Chairman
Nahayan Mabarak Al NahayanChairman
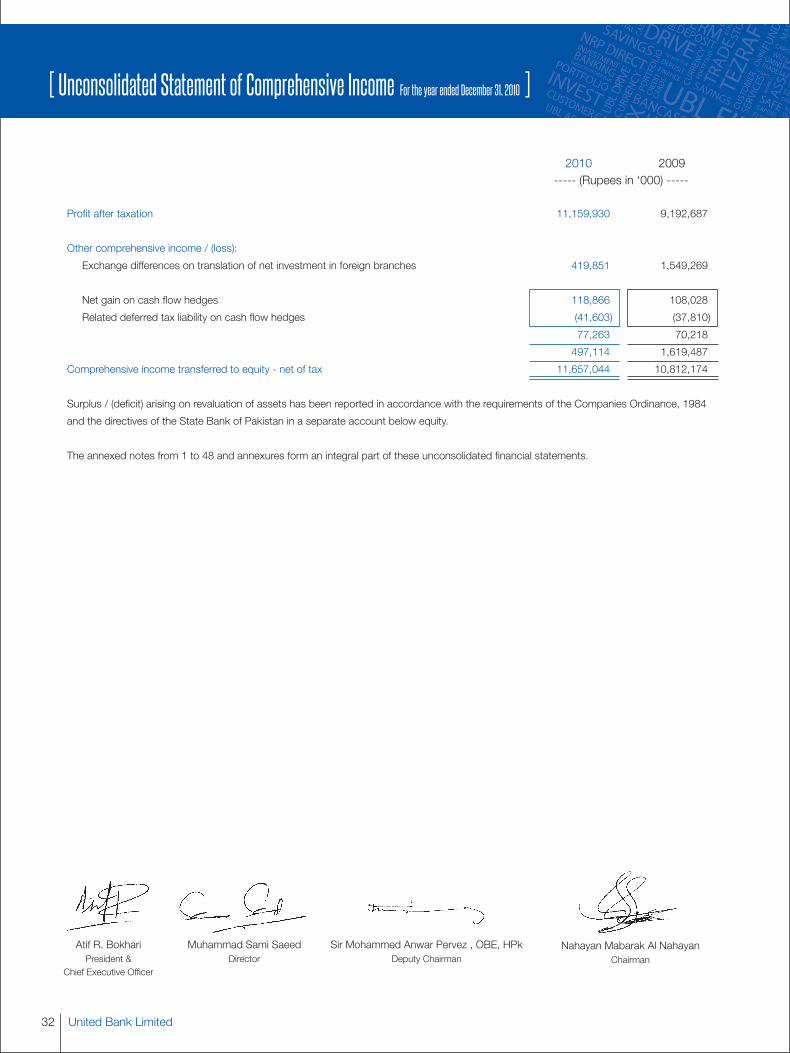
United Bank Limited32
[ Unconsolidated Statement of Comprehensive Income For the year ended December 31, 2010 ]
2010 2009----- (Rupees in ‘000) -----
Profit after taxation 11,159,930 9,192,687
Other comprehensive income / (loss):
Exchange differences on translation of net investment in foreign branches 419,851 1,549,269
Net gain on cash flow hedges 118,866 108,028
Related deferred tax liability on cash flow hedges (41,603) (37,810)
77,263 70,218
497,114 1,619,487
Comprehensive income transferred to equity - net of tax 11,657,044 10,812,174
Surplus / (deficit) arising on revaluation of assets has been reported in accordance with the requirements of the Companies Ordinance, 1984
and the directives of the State Bank of Pakistan in a separate account below equity.
The annexed notes from 1 to 48 and annexures form an integral part of these unconsolidated financial statements.
Atif R. BokhariPresident &
Chief Executive Officer
Muhammad Sami SaeedDirector
Sir Mohammed Anwar Pervez , OBE, HPkDeputy Chairman
Nahayan Mabarak Al NahayanChairman
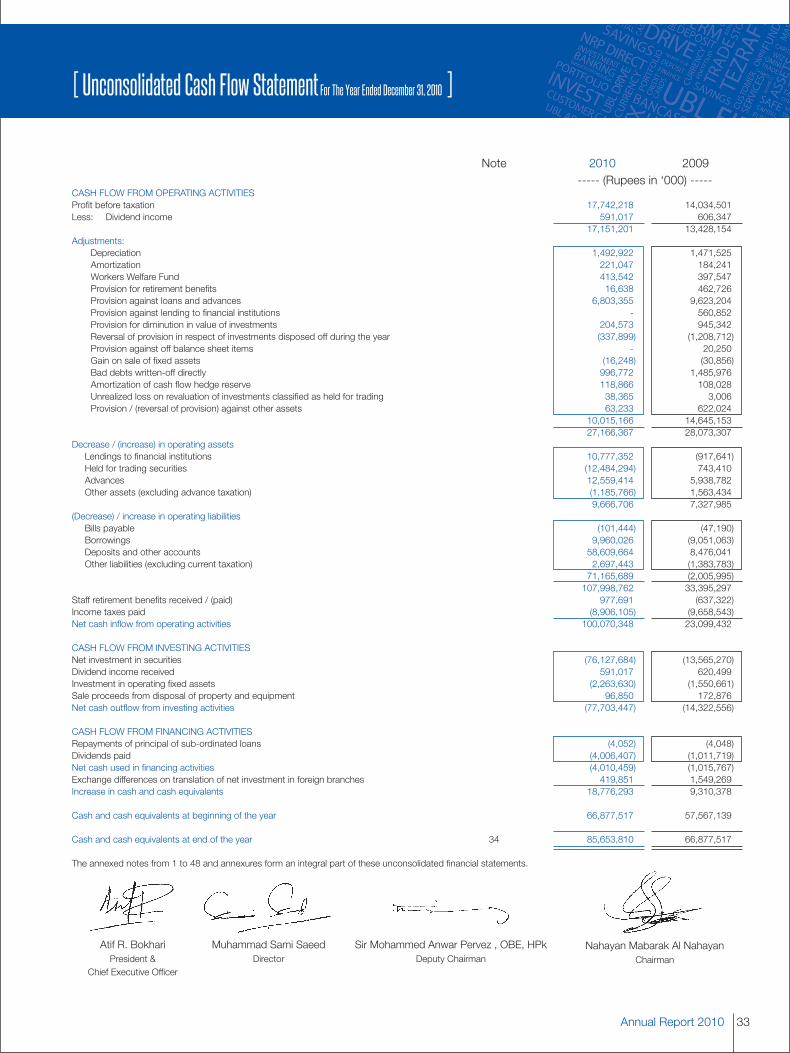
33
[ Unconsolidated Cash Flow Statement For The Year Ended December 31, 2010 ]
Annual Report 2010
Note 2010 2009----- (Rupees in ‘000) -----
CASH FLOW FROM OPERATING ACTIVITIESProfit before taxation 17,742,218 14,034,501Less: Dividend income 591,017 606,347
17,151,201 13,428,154Adjustments:
Depreciation 1,492,922 1,471,525Amortization 221,047 184,241Workers Welfare Fund 413,542 397,547Provision for retirement benefits 16,638 462,726Provision against loans and advances 6,803,355 9,623,204Provision against lending to financial institutions - 560,852Provision for diminution in value of investments 204,573 945,342Reversal of provision in respect of investments disposed off during the year (337,899) (1,208,712)Provision against off balance sheet items - 20,250Gain on sale of fixed assets (16,248) (30,856)Bad debts written-off directly 996,772 1,485,976Amortization of cash flow hedge reserve 118,866 108,028Unrealized loss on revaluation of investments classified as held for trading 38,365 3,006Provision / (reversal of provision) against other assets 63,233 622,024
10,015,166 14,645,15327,166,367 28,073,307
Decrease / (increase) in operating assetsLendings to financial institutions 10,777,352 (917,641)Held for trading securities (12,484,294) 743,410Advances 12,559,414 5,938,782Other assets (excluding advance taxation) (1,185,766) 1,563,434
9,666,706 7,327,985(Decrease) / increase in operating liabilitiesBills payable (101,444) (47,190)Borrowings 9,960,026 (9,051,063)Deposits and other accounts 58,609,664 8,476,041Other liabilities (excluding current taxation) 2,697,443 (1,383,783)
71,165,689 (2,005,995)107,998,762 33,395,297
Staff retirement benefits received / (paid) 977,691 (637,322)Income taxes paid (8,906,105) (9,658,543)Net cash inflow from operating activities 100,070,348 23,099,432
CASH FLOW FROM INVESTING ACTIVITIESNet investment in securities (76,127,684) (13,565,270)Dividend income received 591,017 620,499Investment in operating fixed assets (2,263,630) (1,550,661)Sale proceeds from disposal of property and equipment 96,850 172,876Net cash outflow from investing activities (77,703,447) (14,322,556)
CASH FLOW FROM FINANCING ACTIVITIESRepayments of principal of sub-ordinated loans (4,052) (4,048)Dividends paid (4,006,407) (1,011,719)Net cash used in financing activities (4,010,459) (1,015,767)Exchange differences on translation of net investment in foreign branches 419,851 1,549,269Increase in cash and cash equivalents 18,776,293 9,310,378
Cash and cash equivalents at beginning of the year 66,877,517 57,567,139
Cash and cash equivalents at end of the year 34 85,653,810 66,877,517
The annexed notes from 1 to 48 and annexures form an integral part of these unconsolidated financial statements.
Atif R. BokhariPresident &
Chief Executive Officer
Muhammad Sami SaeedDirector
Sir Mohammed Anwar Pervez , OBE, HPkDeputy Chairman
Nahayan Mabarak Al NahayanChairman

Capital reservesShare Statutory Exchange Reserve for Cash flow Unappro-Capital reserve translation issue of bo- hedge priated Total
reserve nus shares reserve profit
------------------------------------------- (Rupees in '000) -------------------------------------------
Balance as at January 1, 2009 10,117,188 10,376,375 5,401,771 - (276,633) 16,604,076 42,222,777
Final cash dividend for the year ended December 31, 2008declared subsequent to year end at Re.1.00 per share - - - - - (1,011,719) (1,011,719)
Transfer to reserve for issue of bonus share - - - 1,011,719 - (1,011,719) -
Issue of bonus shares at 10% 1,011,719 - - (1,011,719) - - -
Changes in equity for 2009
Profit after taxation for the year ended December 31, 2009 - - - - - 9,192,687 9,192,687Other comprehensive income - net of tax - - 1,549,269 - 70,218 - 1,619,487Total comprehensive income - - 1,549,269 - 70,218 9,192,687 10,812,174
Transfer from surplus on revaluation of fixed assetsto unappropriated profit - net of tax - - - - - 253,014 253,014
Transfer to statutory reserve - 1,838,537 - - - (1,838,537) -
Balance as at December 31, 2009 11,128,907 12,214,912 6,951,040 - (206,415) 22,187,802 52,276,246
Final cash dividend for the year ended December 31, 2009declared subsequent to year end at Rs.2.50 per share - - - - - (2,782,227) (2,782,227)
Interim cash dividend for the half year ended June 30, 2010declared at Re. 1.00 per share - - - - - (1,224,180) (1,224,180)
Transfer to reserve for issue of bonus shares - - - 1,112,891 - (1,112,891) -
Issue of bonus shares at 10% 1,112,891 - - (1,112,891) - - -
Changes in equity for 2010
Profit after taxation for the year ended December 31, 2010 - - - - - 11,159,930 11,159,930Other comprehensive income - net of tax - - 419,851 - 77,263 - 497,114Total comprehensive income - - 419,851 - 77,263 11,159,930 11,657,044
Transfer from surplus on revaluation of fixed assetsto unappropriated profit - net of tax - - - - - 254,041 254,041
Transfer to statutory reserve - 2,231,986 - - - (2,231,986) -
Balance as at December 31, 2010 12,241,798 14,446,898 7,370,891 - (129,152) 26,250,489 60,180,924
Appropriations made by the Directors subsequent to the year ended December 31, 2010 are disclosed in note 46 to these unconsolidated financial statements.
The annexed notes from 1 to 48 and annexures form an integral part of these unconsolidated financial statements.
United Bank Limited34
[ Unconsolidated Statement of Changes in Equity For the year ended December 31, 2010 ]
Atif R. BokhariPresident &
Chief Executive Officer
Muhammad Sami SaeedDirector
Sir Mohammed Anwar Pervez , OBE, HPkDeputy Chairman
Nahayan Mabarak Al NahayanChairman

35
[ Notes to and forming part of the UnconsolidatedFinancial Statements For the year ended December 31, 2010 ]
Annual Report 2010
1. STATUS AND NATURE OF BUSINESS
United Bank Limited (the Bank) is a banking company incorporated in Pakistan and is engaged in commercial banking andrelated services. The Bank's registered office and principal office are situated at UBL building, Jinnah Avenue, Blue Area,Islamabad and at State Life Building No. 1, I. I. Chundrigar Road, Karachi respectively. The Bank operates 1,123 (2009: 1,120)branches including 6 (2009: 5) Islamic banking branches, 1 (2009: 1) branch in Karachi Export Processing Zone (KEPZ) and17 (2009: 17) branches outside Pakistan.
The Bank's Ordinary shares are listed on all three stock exchanges in Pakistan whereas its Global Depository Receipts (GDRs)are on the list of the UK Listing Authority and the London Stock Exchange Professional Securities Market. These GDRs arealso eligible for trading on the International Order Book System of the London Stock Exchange. Further, the GDRs constitutean offering in the United States only to qualified institutional buyers in reliance on Rule 144A under the US Securities Act of1933 and an offering outside the United States in reliance on Regulation S.
2. BASIS OF PRESENTATION
2.1 In accordance with the directives of the Federal Government regarding the shifting of the banking system to Islamic modes,the State Bank of Pakistan (SBP) has issued various circulars from time to time. Permissible forms of trade-related modes offinancing include purchase of goods by banks from their customers and immediate resale to them at appropriate mark-up inprice on deferred payment basis. The purchases and sales arising under these arrangements are not reflected in theseunconsolidated financial statements as such, but are restricted to the amount of facility actually utilized and the appropriateportion of mark-up thereon. However, the Islamic Banking branches of the Bank have complied with the requirements set outunder the Islamic Financial Accounting Standards issued by the Institute of Chartered Accountants of Pakistan and notifiedunder the provisions of the Companies Ordinance, 1984.
2.2 The financial results of the Islamic banking branches of the Bank have been included in these unconsolidated financialstatements for reporting purposes, after eliminating material inter-branch transactions / balances. Key financial figures of theIslamic banking branches are disclosed in note 45 to these unconsolidated financial statements.
2.3 With effect from the current year, 'Balance Sheet' has been renamed as 'Statement of Financial Position' keeping in view therequirement of BSD Circular letter No.7 of 2010 dated April 20, 2010 issued by the SBP.
3. STATEMENT OF COMPLIANCE
3.1 These unconsolidated financial statements have been prepared in accordance with approved accounting standards asapplicable in Pakistan. Approved accounting standards comprise of such International Financial Reporting Standards (IFRS)and interpretations issued by the International Accounting Standards Board and Islamic Financial Accounting Standards (IFAS)issued by the Institute of Chartered Accountants of Pakistan, the requirements of the Companies Ordinance, 1984, BankingCompanies Ordinance, 1962 or directives issued by the Securities and Exchange Commission of Pakistan and the StateBank of Pakistan. Wherever the requirements of the Companies Ordinance, 1984, Banking Companies Ordinance, 1962 ordirectives issued by the Securities and Exchange Commission of Pakistan and the State Bank of Pakistan differ with therequirements of IFRS or IFAS, the requirements of the Companies Ordinance, 1984, Banking Companies Ordinance, 1962or said directives prevail.
3.2 The SBP vide BSD Circular letter No. 10, dated August 26, 2002 has deferred the applicability of International AccountingStandard 39, Financial Instruments: Recognition and Measurement (IAS 39) and International Accounting Standard 40,Investment Property (IAS 40) for banking companies till further instructions. Further, according to the notification of SECPissued vide SRO 411(I)/2008 dated April 28, 2008, IFRS - 7 "Financial Instruments: Disclosures" has not been made applicablefor banks. Accordingly, the requirements of these standards have not been considered in the preparation of these financialstatements. However, investments have been classified and valued in accordance with the requirements of various circularsissued by the SBP.
United Bank Limited36
[ Notes to and forming part of the UnconsolidatedFinancial Statements For the year ended December 31, 2010 ]
3.3 These unconsolidated financial statements represent the separate standalone financial statements of the Bank. Theconsolidated financial statements of the Bank and its subsidiary companies are presented separately.
3.4 Standards, interpretations and amendments to approved accounting standards that are not yet effective
The following revised standards, amendments and interpretations with respect to approved accounting standards asapplicable in Pakistan would be effective from the dates mentioned below against the respective standard or interpretation:
Standard or Interpretation Effective date(annual periods beginning
on or after)
IAS 32 - Financial Instruments: Presentation -Classification of Rights Issues (Amendment) 01 February 2010
IAS 24 - Related Party Disclosures (Revised) 01 January 2011
IAS 12 - Income Taxes: Deferred Tax Amendment –Recognition of Underlying Assets 01 January 2012
IFRIC 14 - IAS 19 – The Limit on a Defined Benefit Asset,Minimum Funding Requirements and their Interaction (Amendments) 01 January 2011
IFRIC 19 - Extinguishing Financial Liabilities with Equity Instruments 01 July 2010
The Bank expects that the adoption of the above revisions, amendments and interpretations of the standards will not affectthe Bank's financial statements in the period of initial application.
In addition to the above, amendments to various accounting standards have also been issued by the IASB. Suchimprovements are generally effective for accounting periods beginning on or after 01 January 2011. The Bank expects thatsuch improvements to the standards will not have any material impact on the Bank's financial statements in the period of initialapplication.
4. BASIS OF MEASUREMENT
4.1 Accounting convention
These unconsolidated financial statements have been prepared under the historical cost convention except that certainoperating fixed assets have been stated at revalued amounts and certain investments and derivative financial instruments havebeen stated at fair value.
4.2 Critical accounting estimates and judgments
The preparation of these unconsolidated financial statements in conformity with approved accounting standards requiresmanagement to make judgments, estimates and assumptions that affect the reported amounts of assets and liabilities andincome and expenses. It also requires management to exercise judgment in application of its accounting policies. Theestimates and associated assumptions are based on historical experience and various other factors that are believed to bereasonable under the circumstances. These estimates and assumptions are reviewed on an ongoing basis. Revisions toaccounting estimates are recognized in the period in which the estimate is revised if the revision affects only that period, orin the period of revision and future periods if the revision affects both current and future periods.
37
[ Notes to and forming part of the UnconsolidatedFinancial Statements For the year ended December 31, 2010 ]
Annual Report 2010
Significant accounting estimates and areas where judgments were made by the management in the application of accountingpolicies are as follows:
i) classification of investments (notes 5.4 and 9)ii) provision against investments (notes 5.4 and 9.3) and advances (notes 5.5 and 10.5)iii) income taxes (notes 5.8 and 32)iv) staff retirement benefits (notes 5.10 and 36)v) fair value of derivatives (notes 5.15 and 19.4)vi) operating fixed assets, depreciation and amortization (notes 5.6 and 11)vii) impairment (note 5.7)
5. SUMMARY OF SIGNIFICANT ACCOUNTING POLICIES
5.1 Significant accounting policies
The accounting policies adopted in the preparation of these financial statements are consistent with those of the previousfinancial year except as follows:
The Bank has adopted the following new and amended IFRS and related interpretations which became effective during the year:
IFRS 2 - Share-based Payments: Amendments relating to Group Cash-settled Share-based Payment Transactions
IFRS 3 - Business Combinations (Revised)
IAS 27 - Consolidated and Separate Financial Statements (Amendment)
IFRIC 17 - Distributions of Non-cash Assets to owners
In May 2008 and April 2009, International Accounting Standards Board issued amendments to various standards primarilywith a view to removing inconsistencies and clarifying wording. These improvements are listed below:
Issued in May 2008IFRS 5 – Non-Current Assets Held for Sale and Discontinued Operations
Issued in April 2009IFRS 2 – Share-based Payments (note 37.3)IFRS 5 – Non-Current Assets Held for Sale and Discontinued OperationsIFRS 8 – Operating SegmentsIAS 1 – Presentation of Financial StatementsIAS 7 – Statement of Cash FlowsIAS 17 – LeasesIAS 36 – Impairment of AssetsIAS 38 – Intangible AssetsIAS 39 – Financial Instruments: Recognition and measurementIFRIC 9 – Reassessment of Embedded DerivativesIFRIC 16 – Hedges of a Net Investment in a Foreign Operation
The adoption of the above standards, amendments / improvements and interpretations did not have a material effect on thefinancial statements.
United Bank Limited38
5.2 Cash and cash equivalents
Cash and cash equivalents for the purpose of the cash flow statement represent cash and balances with treasury banks andbalances with other banks in current and deposit accounts.
5.3 Lendings to / borrowings from financial institutions
The Bank enters into transactions of repos and reverse repos at contracted rates for a specified period of time. These arerecorded as under:
5.3.1 Sale under repurchase agreements
Securities sold subject to a re-purchase agreement (repo) are retained in the unconsolidated financial statements asinvestments and the counter party liability is included in borrowings from financial institutions. The differential in sale and re-purchase value is accrued over the period of the agreement and recorded as an expense.
5.3.2 Purchase under resale agreements
Securities purchased under agreement to resell (reverse repo) are included in lendings to financial institutions. The differentialbetween the purchase price and resale price is amortized over the period of the agreement and recorded as income.
Securities held as collateral are not recognized in the unconsolidated financial statements, unless these are sold to thirdparties, in which case the obligation to return them is recorded at fair value as a trading liability under borrowings fromfinancial institutions.
5.4 Investments
Investments of the Bank, other than investments in subsidiaries and associates are classified as held for trading, held-to-maturity and available for sale.
Held for trading
These are securities which are either acquired for generating a profit from short-term fluctuations in market prices, interest ratemovements, dealer's margin or are securities included in a portfolio in which a pattern of short-term profit taking exists.
Held to maturity
These are securities with fixed or determinable payments and fixed maturity in respect of which the Bank has the positive intentand ability to hold to maturity.
Available for sale
These are investments, other than those in subsidiaries and associates, that do not fall under the held for trading or held tomaturity categories.
Initial measurement
All “regular way” purchases and sales of investments are recognized on the trade date, i.e., the date that the Bank commitsto purchase or sell the asset. Regular way purchases or sales are purchases or sales of investments that require delivery ofassets within the time frame generally established by regulation or convention in the market place.
[ Notes to and forming part of the UnconsolidatedFinancial Statements For the year ended December 31, 2010 ]
39Annual Report 2010
Investments are initially recognized at fair value which, in the case of investments other than held-for-trading, includestransaction costs associated with the investments.
Subsequent measurement
Held for trading
These are measured at subsequent reporting dates at fair value. Gains and losses on re-measurement are included in the profitand loss account.
Held to maturity
These are measured at amortized cost using the effective interest rate method, less any impairment loss recognized to reflectirrecoverable amounts.
Available for sale
Quoted-securities classified as available-for-sale investments are measured at subsequent reporting dates at fair value. Anysurplus / deficit arising thereon is kept in a separate account shown in the balance sheet below equity and taken to the profitand loss account when actually realized upon disposal or when the investment is considered to be impaired.
Unquoted equity securities are valued at the lower of cost and break-up value. A decline in the carrying value is charged tothe profit and loss account. The break-up value of these equity securities is calculated with reference to the net assets of theinvestee company as per the latest available audited financial statements. Investments in other unquoted securities are valuedat cost less impairment losses.
Provision for diminution in the value of securities (except term finance certificates) is made for impairment, if any. Provision fordiminution in the value of term finance certificates is made as per the aging criteria prescribed by the Prudential Regulationsissued by the SBP.
Investments in Subsidiaries and Associates
Investments in subsidiaries and associates are valued at cost less impairment, if any. A reversal of an impairment loss onassociates and subsidiaries is recognized as it arises provided the increased carrying value does not exceed that it would havebeen had no impairment loss been recognized.
Gain or loss on sale of investments in subsidiaries and associates is included in the profit and loss account for the year.
5.5 Advances
Advances are stated net of specific and general provisions. Specific provision against domestic advances is determined onthe basis of the Prudential Regulations and other directives issued by the SBP and is charged to the profit and loss account.General provision against consumer loans is made in accordance with the requirements of the Prudential Regulations issuedby the SBP. General and specific provisions pertaining to overseas advances are made in accordance with the requirementsof the monetary agencies and the regulatory authorities of the respective countries. The Bank, from time to time, makesgeneral provision against weaknesses in its portfolio if circumstances warrant on the basis of management's estimation.Advances are written off when there is no realistic prospect of recovery. The amount so written off is a book entry withoutprejudice to the Bank's right of recovery against the customer.
The Bank determines write-offs in accordance with the criteria prescribed by the SBP vide BPRD Circular No. 06 dated June05, 2007.
[ Notes to and forming part of the UnconsolidatedFinancial Statements For the year ended December 31, 2010 ]
United Bank Limited40
[ Notes to and forming part of the UnconsolidatedFinancial Statements For the year ended December 31, 2010 ]
5.6 Operating fixed assets and depreciation
5.6.1 Owned
Property and equipment, other than freehold land (which is not depreciated) and capital work-in-progress, are stated at costor revalued amount less accumulated depreciation and accumulated impairment losses (if any). Freehold land is carried atrevalued amount less impairment losses while capital work-in-progress is stated at cost less impairment losses. The cost ofproperty and equipment of foreign branches includes exchange difference arising on currency translation at the year-endrates of exchange.
Depreciation is calculated so as to write off the depreciable amount of the assets over their expected economic lives at therates specified in note 11.2 to these unconsolidated financial statements. The depreciation charge for the year is calculatedafter taking into account residual value, if any, and using methods depending on the nature of the asset and the country ofits location. The residual values, useful lives and depreciation methods are reviewed and adjusted, if appropriate, at eachstatement of financial position date.
Depreciation on additions is charged from the month the asset is available for use. No depreciation is charged in the monthof disposal.
Land and buildings are revalued by professionally qualified valuers with sufficient regularity to ensure that their net carrying valuedoes not differ materially from their fair value.
Surplus arising on revaluation is credited to the surplus on revaluation of fixed assets account. Deficit arising on subsequentrevaluation of fixed assets is adjusted against the balance in the above-mentioned surplus account as allowed under theprovisions of the Companies Ordinance, 1984. The surplus on revaluation of fixed assets, to the extent of incrementaldepreciation charged on the related assets, is transferred to unappropriated profit.
Gains and losses on sale of fixed assets are included in income currently, except that the related surplus on revaluation of fixedassets (net of deferred taxation) is transferred directly to unappropriated profit.
Major renewals and improvements are capitalized and the assets so replaced, if any, are retired. Normal repairs andmaintenance are charged to the profit and loss account as and when incurred.
5.6.2 Leased (Ijarah)
Assets leased out under Ijarah are stated at cost less accumulated depreciation and accumulated impairment losses, if any.Assets under Ijarah are depreciated over the period of the lease term.
Ijarah income is recognized on an accrual basis as and when the rental becomes due.
5.6.3 Intangible assets
Intangible assets having a finite useful life are stated at cost less accumulated amortization and accumulated impairmentlosses, if any. Intangible assets are amortized using the straight line method, from the month when these assets are availablefor use, whereby the cost of the intangible asset is amortized on the basis of the estimated useful life over which economicbenefits are expected to flow to the Bank. The residual values and useful lives are reviewed and adjusted, if appropriate, ateach statement of financial position date.
41Annual Report 2010
[ Notes to and forming part of the UnconsolidatedFinancial Statements For the year ended December 31, 2010 ]
5.7 Impairment
Impairment in available for sale equity investments
Available for sale equity investments are impaired when there has been a significant or prolonged decline in the fair valuebelow its cost. The determination of what is significant or prolonged requires judgment. In making this judgment, the Bankevaluates among other factors, the normal volatility in share price.
Impairment in investments in associates and subsidiaries
The Bank considers that a decline in the recoverable value of investment in associates and subsidiaries below their cost maybe evidence of impairment. Recoverable value is calculated as the higher of fair value less costs to sell and value in use. Animpairment loss is recognized when the recoverable value falls below the carrying value and is charged to the profit and lossaccount. Subsequent reversal of impairment loss, upto the cost of investment in associates and subsidiaries is credited tothe profit and loss account.
Impairment in non-financial assets (excluding deferred tax)
The carrying amounts of non-financial assets are reviewed at each reporting date for impairment whenever events or changesin circumstances indicate that the carrying amounts of the assets may not be recoverable. If such indication exists, and wherethe carrying value exceeds the estimated recoverable amount, assets are written down to their recoverable amount. Theresulting impairment loss is taken to the profit and loss account except for impairment loss on revalued assets, which isadjusted against the related revaluation surplus to the extent that the impairment loss does not exceed the surplus onrevaluation of the revalued assets.
5.8 Taxation
5.8.1 Current
Provision for current taxation is based on taxable income for the year determined in accordance with the prevailing laws fortaxation on income earned from local as well as foreign operations, as applicable to the respective jurisdictions. The chargefor current tax is calculated using prevailing tax rates. The charge for current tax also includes, where considered necessary,adjustments relating to prior years, arising from assessments made during the year.
5.8.2 Deferred
Deferred tax is recognized using the liability method on all major temporary differences between the amounts attributed toassets and liabilities for financial reporting purposes and the amounts used for taxation purposes. In addition, the Bank alsorecords a deferred tax asset on available tax losses. Deferred tax is calculated at the rates that are expected to apply to theperiod when the differences are expected to reverse, based on tax rates that have been enacted or substantively enacted atthe statement of financial position date.
Deferred tax assets are recognized only to the extent that it is probable that future taxable profits will be available against whichthe assets can be utilized.
The carrying amount of the deferred tax asset is reviewed at each statement of financial position date and reduced to the extentthat it is no longer probable that sufficient taxable profits will be available to allow all or part of the deferred tax asset to beutilized.
The Bank also recognizes a deferred tax asset / liability on deficit / surplus on revaluation of fixed assets, cash flow hedgereserve and securities which is adjusted against the related deficit / surplus in accordance with the requirements of the revisedInternational Accounting Standard (IAS) 12, Income Taxes.

United Bank Limited42
5.9 Provisions
Provisions are recognized when the Bank has a legal or constructive obligation as a result of past events which makes it probablethat an outflow of resources will be required to settle the obligation and a reliable estimate of the amount can be made.
Provision against identified non-funded losses is recognized when intimated and reasonable certainty exists for the Bank tosettle the obligation. The loss is charged to the profit and loss account net of expected recovery and the provision is classifiedunder other liabilities.
Provisions are reviewed at each statement of financial position date and are adjusted to reflect the current best estimate.
5.10 Staff retirement and other benefits
5.10.1 Staff retirement benefit schemes
The Bank operates the following staff retirement schemes for its employees
a) For new employees and for those who opted for the new scheme introduced in 1991, the Bank operates an
- approved contributory provident fund (defined contribution scheme); and- approved gratuity scheme (defined benefit scheme).
b) For employees who have not opted for the new scheme introduced in 1991, the Bank operates an
- approved funded pension scheme, introduced in 1986 (defined benefit scheme); and- approved non-contributory provident fund in lieu of the contributory provident fund.
In the year 2001, the Bank modified the pension scheme and introduced a conversion option for employees covered underoption (b) above to move to option (a). This conversion option ceased on December 31, 2003.
The Bank also operates a contributory benevolent fund for all its eligible employees (defined benefit scheme).
Annual contributions towards the defined benefit schemes are made on the basis of actuarial advice using the Projected UnitCredit Method.
For defined contribution plans, the Bank pays contributions to the Fund on a periodic basis. The Bank has no further paymentobligation once the contributions have been paid. The contributions are recognized as an expense when they are due. Prepaidcontributions are recognized as an asset to the extent that a cash refund or a reduction of the future payments is available.
5.10.2 Other benefits
a) Employees' compensated absences
The Bank makes provisions for compensated vested and non-vested absences accumulated by its eligible employees onthe basis of actuarial advice under the Projected Unit Credit Method.
[ Notes to and forming part of the UnconsolidatedFinancial Statements For the year ended December 31, 2010 ]
43Annual Report 2010
b) Post retirement medical benefits (defined benefit scheme)
The Bank provides post retirement medical benefits to eligible retired employees. Provision is made annually to meet thecost of such medical benefits on the basis of actuarial advice under the Projected Unit Credit Method.
c) Employee motivation and retention scheme
The Bank operates a long term motivation and retention scheme for its employees with the objective of rewarding,motivating and retaining its high performing executives and officers. The liability of the Bank is fixed and is determined eachyear based on the performance of the Bank.
5.10.3 Actuarial gains and losses
Actuarial gains and losses arising from experience adjustments and changes in actuarial assumptions in excess of the greaterof 10% of the value of the plan assets or 10% of the defined benefit obligation at the end of the last reporting year are chargedor credited to income over the employees' expected average remaining working lives. These limits are calculated and appliedseparately for each defined benefit plan.
Actuarial gains and losses pertaining to long term compensated absences are recognized immediately.
5.11 Sub-ordinated Debt
Sub-ordinated debt is initially recorded at the amount of proceeds received. Mark-up accrued on subordinated debt isrecognised separately as part of other liabilities and is charged to the profit and loss account over the period on an accrual basis.
5.12 Borrowings / deposits and their cost
a) Borrowings / deposits are recorded at the proceeds received.
b) Borrowings / deposits costs are recognized as an expense in the period in which these are incurred.
5.13 Revenue recognition
Revenue is recognized to the extent that the economic benefits will flow to the Bank and the revenue can be reliably measured.The following recognition criteria must be met before revenue is recognized.
5.13.1 Advances and investments
Mark-up / return on performing advances and investments is recognized on a time proportionate basis over the term of theadvances and investments. Where debt securities are purchased at premium or discount, such premium / discount isamortized through the profit and loss account over the remaining period of maturity.
Interest or mark-up recoverable on non-performing advances and classified investments is recognized on receipt basis.Interest / return / mark-up on rescheduled / restructured loans and advances and investments is recognized as permitted bythe regulations of the SBP or overseas regulatory authorities of the countries where the branches operate, except where, inthe opinion of the management, it would not be prudent to do so.
5.13.2 Dividend income
Dividend income is recognised when the right to receive the dividend is established.
[ Notes to and forming part of the UnconsolidatedFinancial Statements For the year ended December 31, 2010 ]

United Bank Limited44
5.13.3 Fee, brokerage and commission
Fee, brokerage, commission and other income is recognized on an accrual basis.
5.14 Foreign currencies
5.14.1 Functional and presentation currency
Items included in the financial statements are measured using the currency of the primary economic environment in whichthe Bank operates. The financial statements are presented in Pakistani Rupees, which is the Bank's functional andpresentation currency.
5.14.2 Foreign currency transactions
Transactions in foreign currencies are translated to rupees at the foreign exchange rates prevailing on the transaction date.Monetary assets and liabilities in foreign currencies are expressed in rupee terms at the rates of exchange prevailing at thestatement of financial position date. Forward foreign exchange contracts and foreign bills purchased are valued at forward ratesapplicable to their respective maturities.
5.14.3 Foreign operations
The assets and liabilities of foreign operations are translated to rupees at exchange rates prevailing at the statement of financialposition date. The results of foreign operations are translated at the average rate of exchange for the year.
5.14.4 Translation gains and losses
Translation gains and losses are taken to the profit and loss account, except those arising on the translation of net investmentin foreign branches which are taken to capital reserve (Exchange Translation Reserve) until the disposal of the net investmentat which time these are recognised in the profit and loss account.
5.14.5 Commitments
Commitments for outstanding forward foreign exchange contracts are disclosed in the unconsolidated financial statementsat contracted rates. Contingent liabilities / commitments for letters of credit and letters of guarantee denominated in foreigncurrencies are expressed in rupee terms at the rates of exchange prevailing at the date of the statement of financial position.All other commitments are disclosed in the unconsolidated financial statements at the committed amount.
5.15 Financial instruments
5.15.1 Financial assets and liabilities
Financial instruments carried on the statement of financial position include cash and bank balances, lendings to financialinstitutions, investments, advances, certain receivables, bills payable, borrowings from financial institutions, deposits, sub-ordinated loans and certain other payables. The particular recognition methods adopted for significant financial assets andfinancial liabilities are disclosed in the individual policy notes associated with them.
5.15.2 Derivative financial instruments
Derivative financial instruments are initially recognized at fair value on the date on which the derivative contract is entered intoand are subsequently re-measured at fair value using appropriate valuation techniques. All derivative financial instruments arecarried as assets when their fair value is positive and liabilities when their fair value is negative. Any change in the fair value ofderivative financial instruments is taken to the profit and loss account.
[ Notes to and forming part of the UnconsolidatedFinancial Statements For the year ended December 31, 2010 ]
45Annual Report 2010
5.15.3 Hedge accounting
The Bank makes use of derivative instruments to manage exposures to interest rate, foreign currency and credit risks, includingexposures arising from forecast transactions. In order to manage particular risks, the Bank applies hedge accounting fortransactions which meet the specified criteria.
At the inception of the hedge relationship, the Bank formally documents the relationship between the hedged item and thehedging instrument, including the nature of the risk, the objective and strategy for undertaking the hedge and the method thatwill be used to assess the effectiveness of the hedging relationship.
Also, at the inception of the hedge relationship, a formal assessment is undertaken to ensure the hedging instrument isexpected to be highly effective in offsetting the designated risk in the hedged item. Hedges are formally assessed each quarter.A hedge is regarded as highly effective if the changes in fair value or cash flows attributable to the hedged risk during the periodfor which the hedge is designated are expected to offset in a range of 80% to 125%. For situations where the hedged itemis a forecast transaction, the Bank assesses whether the transaction is highly probable and presents an exposure to variationsin cash flows that could ultimately affect the profit and loss account.
(a) Fair value hedges
For designated and qualifying fair value hedges, the change in the fair value of a hedging derivative is recognised in the profitand loss account within other income. The change in the fair value of the hedged item attributable to the risk hedged is recordedas part of the carrying value of the hedged item and is also recognised in the profit and loss account within other income.
(b) Cash flow hedges
For qualifying cash flow hedges, the fair value gain or loss associated with the effective portion of the cash flow hedge isrecognised initially in the statement of changes in equity, and recycled to the profit and loss account in the periods when thehedged item will affect profit or loss. Any ineffective portion of the gain or loss on the hedging instrument is recognised in theprofit and loss account immediately.
When a hedging instrument expires or is sold, or when a hedge no longer meets the criteria for hedge accounting, anycumulative gain or loss existing in equity at that time remains in equity and is recognised when the hedged item is ultimatelyrecognised in the profit and loss account . When a forecast transaction occurs or is no longer expected to occur, thecumulative gain or loss that was recognised in equity is immediately transferred to the profit and loss account.
5.15.4 Off setting
Financial assets and financial liabilities are set off and the net amount is reported in the unconsolidated financial statementswhen there is a legally enforceable right to set off and the Bank intends to either settle on a net basis, or to realize the assetsand to settle the liabilities simultaneously.
5.16 Segment reporting
A segment is a distinguishable component of the Bank that is engaged either in providing particular products or services(business segment), or in providing products or services within a particular economic environment (geographical segment),which is subject to risks and rewards that are different from those of other segments.
[ Notes to and forming part of the UnconsolidatedFinancial Statements For the year ended December 31, 2010 ]
United Bank Limited46
5.16.1 Business segments
(a) Corporate finance
Corporate banking includes services provided in connection with mergers and acquisition, underwriting, privatization,securitization, research, debts instruments, equity, syndication, IPO and secondary private placements.
(b) Trading and sales
Trading and sales includes fixed income, equity, foreign exchange, commodities, credit, funding, own position securities,lending and repos, brokerage debt and prime brokerage.
(c) Retail banking
Retail banking includes retail lending and deposits, banking services, trusts and estates, private lending and deposits,investment advice, merchant / commercial / corporate cards.
(d) Commercial banking
Commercial banking includes project finance, real estate, export finance, trade finance, factoring, leasing, lending,guarantees, bills of exchange and deposits.
(e) Others
Other includes support functions of the bank which can not be classified in any of the above segment.
5.16.2 Geographical segments
The Bank operates in four geographical regions being:
- Pakistan- Karachi Export Processing Zone- United States of America- Middle East
5.17 Dividends and appropriations to reserves
Dividends and appropriations to reserves are recorded in the year in which these are approved, except appropriations requiredby the law which are recorded in the period to which they pertain.
5.18 Earnings per share
The Bank presents basic and diluted earnings per share (EPS) for its shareholders. Basic EPS is calculated by dividing theprofit or loss attributable to ordinary shareholders of the bank by the weighted average number of ordinary shares outstandingduring the year.
[ Notes to and forming part of the UnconsolidatedFinancial Statements For the year ended December 31, 2010 ]
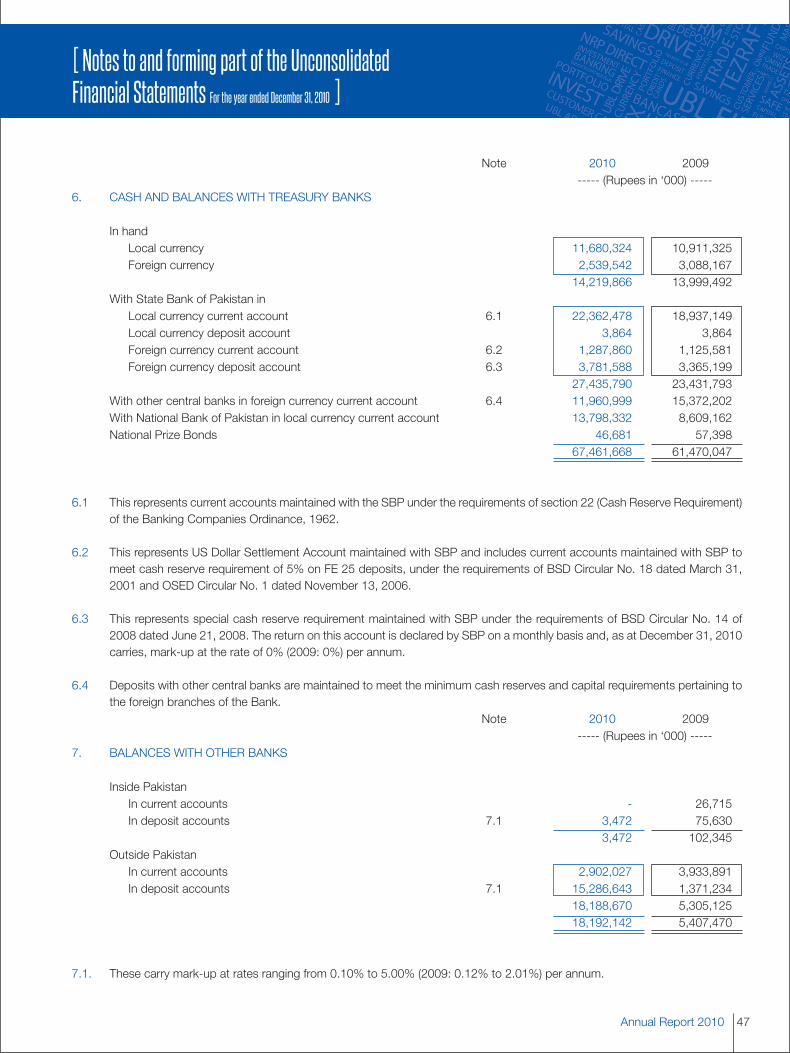
47Annual Report 2010
Note 2010 2009----- (Rupees in ‘000) -----
6. CASH AND BALANCES WITH TREASURY BANKS
In handLocal currency 11,680,324 10,911,325Foreign currency 2,539,542 3,088,167
14,219,866 13,999,492With State Bank of Pakistan in
Local currency current account 6.1 22,362,478 18,937,149Local currency deposit account 3,864 3,864Foreign currency current account 6.2 1,287,860 1,125,581Foreign currency deposit account 6.3 3,781,588 3,365,199
27,435,790 23,431,793With other central banks in foreign currency current account 6.4 11,960,999 15,372,202With National Bank of Pakistan in local currency current account 13,798,332 8,609,162National Prize Bonds 46,681 57,398
67,461,668 61,470,047
6.1 This represents current accounts maintained with the SBP under the requirements of section 22 (Cash Reserve Requirement)of the Banking Companies Ordinance, 1962.
6.2 This represents US Dollar Settlement Account maintained with SBP and includes current accounts maintained with SBP tomeet cash reserve requirement of 5% on FE 25 deposits, under the requirements of BSD Circular No. 18 dated March 31,2001 and OSED Circular No. 1 dated November 13, 2006.
6.3 This represents special cash reserve requirement maintained with SBP under the requirements of BSD Circular No. 14 of2008 dated June 21, 2008. The return on this account is declared by SBP on a monthly basis and, as at December 31, 2010carries, mark-up at the rate of 0% (2009: 0%) per annum.
6.4 Deposits with other central banks are maintained to meet the minimum cash reserves and capital requirements pertaining tothe foreign branches of the Bank.
Note 2010 2009----- (Rupees in ‘000) -----
7. BALANCES WITH OTHER BANKS
Inside PakistanIn current accounts - 26,715In deposit accounts 7.1 3,472 75,630
3,472 102,345Outside Pakistan
In current accounts 2,902,027 3,933,891In deposit accounts 7.1 15,286,643 1,371,234
18,188,670 5,305,12518,192,142 5,407,470
7.1. These carry mark-up at rates ranging from 0.10% to 5.00% (2009: 0.12% to 2.01%) per annum.
[ Notes to and forming part of the UnconsolidatedFinancial Statements For the year ended December 31, 2010 ]
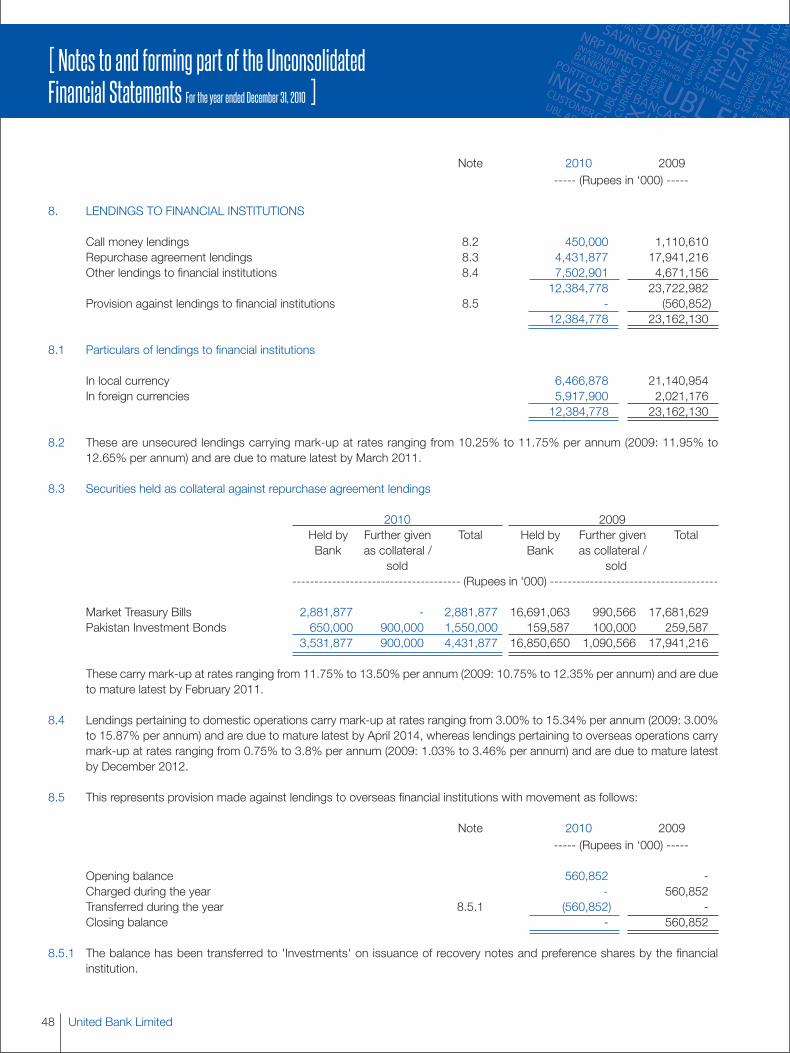
United Bank Limited48
Note 2010 2009----- (Rupees in ‘000) -----
8. LENDINGS TO FINANCIAL INSTITUTIONS
Call money lendings 8.2 450,000 1,110,610Repurchase agreement lendings 8.3 4,431,877 17,941,216Other lendings to financial institutions 8.4 7,502,901 4,671,156
12,384,778 23,722,982Provision against lendings to financial institutions 8.5 - (560,852)
12,384,778 23,162,130
8.1 Particulars of lendings to financial institutions
In local currency 6,466,878 21,140,954In foreign currencies 5,917,900 2,021,176
12,384,778 23,162,130
8.2 These are unsecured lendings carrying mark-up at rates ranging from 10.25% to 11.75% per annum (2009: 11.95% to12.65% per annum) and are due to mature latest by March 2011.
8.3 Securities held as collateral against repurchase agreement lendings
2010 2009Held by Further given Total Held by Further given TotalBank as collateral / Bank as collateral /
sold sold-------------------------------------- (Rupees in '000) --------------------------------------
Market Treasury Bills 2,881,877 - 2,881,877 16,691,063 990,566 17,681,629Pakistan Investment Bonds 650,000 900,000 1,550,000 159,587 100,000 259,587
3,531,877 900,000 4,431,877 16,850,650 1,090,566 17,941,216
These carry mark-up at rates ranging from 11.75% to 13.50% per annum (2009: 10.75% to 12.35% per annum) and are dueto mature latest by February 2011.
8.4 Lendings pertaining to domestic operations carry mark-up at rates ranging from 3.00% to 15.34% per annum (2009: 3.00%to 15.87% per annum) and are due to mature latest by April 2014, whereas lendings pertaining to overseas operations carrymark-up at rates ranging from 0.75% to 3.8% per annum (2009: 1.03% to 3.46% per annum) and are due to mature latestby December 2012.
8.5 This represents provision made against lendings to overseas financial institutions with movement as follows:
Note 2010 2009----- (Rupees in ‘000) -----
Opening balance 560,852 -Charged during the year - 560,852Transferred during the year 8.5.1 (560,852) -Closing balance - 560,852
8.5.1 The balance has been transferred to 'Investments' on issuance of recovery notes and preference shares by the financialinstitution.
[ Notes to and forming part of the UnconsolidatedFinancial Statements For the year ended December 31, 2010 ]

49Annual Report 2010
[ Notes to and forming part of the UnconsolidatedFinancial Statements For the year ended December 31, 2010 ]
9. INVESTMENTS2010 2009
9.1 Investments by types Note Held by Given as Total Held by Given as TotalBank collateral Bank collateral
----------------------------------------- (Rupees in '000) -----------------------------------------
Held for trading securities
Market Treasury Bills 12,984,400 1,189,144 14,173,544 3,268,035 - 3,268,035Pakistan Investment Bonds 805,257 - 805,257 438,505 97,306 535,811Ordinary shares of listed companies 8,928 - 8,928 - - -Foreign securities 1,297,405 - 1,297,405 - - -
15,095,990 1,189,144 16,285,134 3,706,540 97,306 3,803,846Available for sale securities
Market Treasury Bills 39,519,598 20,695,498 60,215,096 35,572,747 3,978,323 39,551,070Pakistan Investment Bonds 18,988,194 536,428 19,524,622 16,728,759 - 16,728,759Government of Pakistan - Sukuk 4,122,000 - 4,122,000 3,470,000 - 3,470,000Government of Pakistan Eurobonds 3,938,516 - 3,938,516 3,870,557 - 3,870,557Ordinary shares of listed companies 3,629,299 - 3,629,299 3,639,088 - 3,639,088Preference shares 463,977 - 463,977 188,895 - 188,895Ordinary shares of unlisted companies 9.7 445,382 - 445,382 441,574 - 441,574Term Finance Certificates 2,163,810 - 2,163,810 1,948,689 - 1,948,689Units of mutual funds 164,662 - 164,662 191,299 - 191,299Foreign securities 14,878,099 - 14,878,099 12,740,879 - 12,740,879
88,313,537 21,231,926 109,545,463 78,792,487 3,978,323 82,770,810Held to maturity securities
Market Treasury Bills 58,843,648 - 58,843,648 11,611,110 - 11,611,110Pakistan Investment Bonds 4,392,225 - 4,392,225 2,497,301 - 2,497,301Government of Pakistan - Sukuk 30,000 - 30,000 30,000 - 30,000Government of Pakistan - Eurobonds - - - 478,184 - 478,184Government of Pakistan - Guaranteed Bonds 51,399 - 51,399 1,485,057 - 1,485,057Term Finance Certificates 27,106,749 - 27,106,749 25,289,199 - 25,289,199Sukuk Bonds 2,548,739 - 2,548,739 2,640,040 - 2,640,040Participation Term Certificates 19,202 - 19,202 26,838 - 26,838Debentures 4,392 - 4,392 4,592 - 4,592Foreign securities 2,184,264 - 2,184,264 1,687,712 - 1,687,712CDC SAARC Fund 428 - 428 421 - 421
95,181,046 - 95,181,046 45,750,454 - 45,750,454Associates
United Growth and Income Fund 3,030,136 - 3,030,136 5,002,027 - 5,002,027UBL Liquidity Plus Fund 2,600,000 - 2,600,000 600,000 - 600,000United Composite Islamic Fund 250,000 - 250,000 386,997 - 386,997United Islamic Income Fund 200,000 - 200,000 250,000 - 250,000United Stock Advantage Fund 250,000 - 250,000 250,000 - 250,000UBL Participation Protected Plan 200,000 - 200,000 200,000 - 200,000UBL Capital Protected Fund - II 100,000 - 100,000 - - -UBL Savings Income Fund 100,000 - 100,000 - - -UBL Islamic Savings Fund 150,000 - 150,000 - - -UBL Islamic Retirement Savings Fund 90,000 - 90,000 - - -UBL Retirement Savings Fund 90,000 - 90,000 - - -UBL Capital Protected Fund - I 75,075 - 75,075 75,075 - 75,075UBL Insurers Limited 240,000 - 240,000 150,000 - 150,000Oman United Exchange Company, Muscat 6,981 - 6,981 6,981 - 6,981
9.9 7,382,192 - 7,382,192 6,921,080 - 6,921,080
Subsidiaries
United National Bank, UK 1,482,011 - 1,482,011 1,482,011 - 1,482,011United Bank AG Zurich, Switzerland 589,837 - 589,837 589,837 - 589,837UBL Fund Managers Limited 100,000 - 100,000 100,000 - 100,000United Executors and Trustees Company Ltd 30,100 - 30,100 30,100 - 30,100
2,201,948 - 2,201,948 2,201,948 - 2,201,948208,174,713 22,421,070 230,595,783 137,372,509 4,075,629 141,448,138
Provision for diminution in value of investments 9.3 (2,658,000) - (2,658,000) (2,252,653) - (2,252,653)
Investments (net of provisions) 205,516,713 22,421,070 227,937,783 135,119,856 4,075,629 139,195,485
Deficit on revaluation of available for sale securities 21.2 (3,309,144) (11,718) (3,320,862) (3,049,359) 2,404 (3,046,955)Deficit on revaluation of held for trading securities 9.4 (38,201) (164) (38,365) (2,286) (720) (3,006)
Total investments 202,169,368 22,409,188 224,578,556 132,068,211 4,077,313 136,145,524

United Bank Limited50
[ Notes to and forming part of the UnconsolidatedFinancial Statements For the year ended December 31, 2010 ]
Note 2010 2009----- (Rupees in ‘000) -----
9.2 Investments by segments
Federal Government SecuritiesMarket Treasury Bills 127,315,215 48,577,758Pakistan Investment Bonds 24,722,104 19,761,871Government of Pakistan - Sukuk 4,152,000 3,500,000Government of Pakistan - Eurobonds 3,938,516 4,348,741Government of Pakistan - Guaranteed Bonds 51,399 1,485,057
160,179,234 77,673,427
Foreign SecuritiesMarket Treasury Bills 5,917,073 5,852,457Government securities 4,770,078 3,214,893CDC SAARC Fund 428 421Other securities 13,589,690 11,213,698
24,277,269 20,281,469
Ordinary SharesListed companies 3,638,227 3,639,088Unlisted companies 9.7 445,382 441,574
4,083,609 4,080,662
Preference Shares 463,977 188,895
Units of Mutual Funds 164,662 191,299
Term Finance CertificatesListed companies 2,437,296 2,667,774Unlisted companies 26,833,263 24,570,114
29,270,559 27,237,888
Sukuk Bonds 2,548,739 2,640,040Debentures 4,392 4,592Participation Term Certificates 19,202 26,838
Investments in subsidiaries and associates 9.9 9,584,140 9,123,028
Total investments at cost 230,595,783 141,448,138
Provision for diminution in value of investments 9.3 (2,658,000) (2,252,653)
Investments (net of provisions) 227,937,783 139,195,485
Deficit on revaluation of available for sale securities 21.2 (3,320,862) (3,046,955)Deficit on revaluation of held for trading securities 9.4 (38,365) (3,006)
Total investments 224,578,556 136,145,524
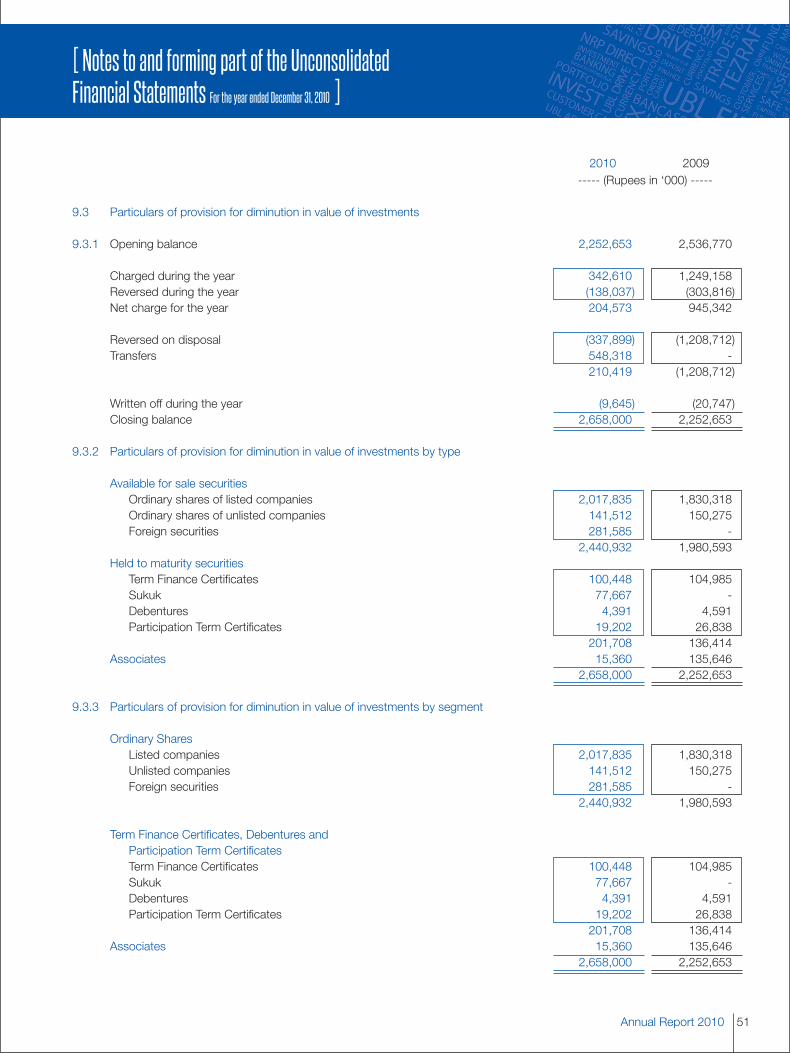
51Annual Report 2010
[ Notes to and forming part of the UnconsolidatedFinancial Statements For the year ended December 31, 2010 ]
2010 2009----- (Rupees in ‘000) -----
9.3 Particulars of provision for diminution in value of investments
9.3.1 Opening balance 2,252,653 2,536,770
Charged during the year 342,610 1,249,158Reversed during the year (138,037) (303,816)Net charge for the year 204,573 945,342
Reversed on disposal (337,899) (1,208,712)Transfers 548,318 -
210,419 (1,208,712)
Written off during the year (9,645) (20,747)Closing balance 2,658,000 2,252,653
9.3.2 Particulars of provision for diminution in value of investments by type
Available for sale securitiesOrdinary shares of listed companies 2,017,835 1,830,318Ordinary shares of unlisted companies 141,512 150,275Foreign securities 281,585 -
2,440,932 1,980,593Held to maturity securities
Term Finance Certificates 100,448 104,985Sukuk 77,667 -Debentures 4,391 4,591Participation Term Certificates 19,202 26,838
201,708 136,414Associates 15,360 135,646
2,658,000 2,252,653
9.3.3 Particulars of provision for diminution in value of investments by segment
Ordinary SharesListed companies 2,017,835 1,830,318Unlisted companies 141,512 150,275Foreign securities 281,585 -
2,440,932 1,980,593
Term Finance Certificates, Debentures andParticipation Term CertificatesTerm Finance Certificates 100,448 104,985Sukuk 77,667 -Debentures 4,391 4,591Participation Term Certificates 19,202 26,838
201,708 136,414Associates 15,360 135,646
2,658,000 2,252,653
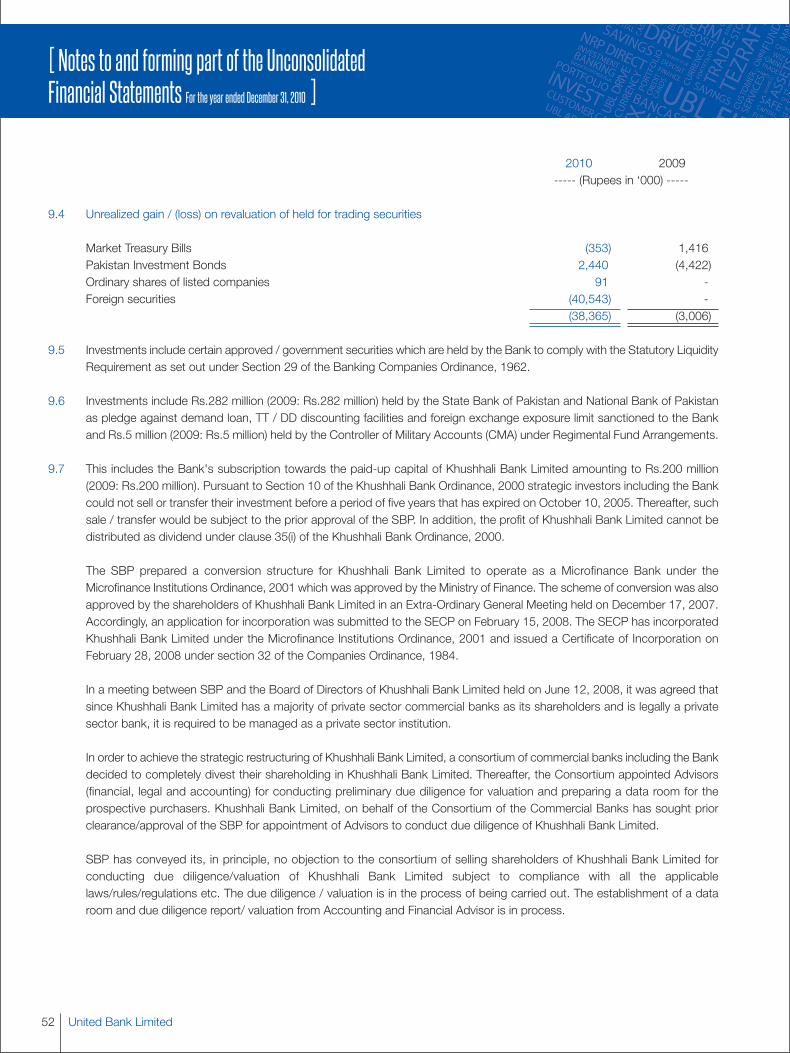
United Bank Limited52
[ Notes to and forming part of the UnconsolidatedFinancial Statements For the year ended December 31, 2010 ]
2010 2009----- (Rupees in ‘000) -----
9.4 Unrealized gain / (loss) on revaluation of held for trading securities
Market Treasury Bills (353) 1,416Pakistan Investment Bonds 2,440 (4,422)Ordinary shares of listed companies 91 -Foreign securities (40,543) -
(38,365) (3,006)
9.5 Investments include certain approved / government securities which are held by the Bank to comply with the Statutory LiquidityRequirement as set out under Section 29 of the Banking Companies Ordinance, 1962.
9.6 Investments include Rs.282 million (2009: Rs.282 million) held by the State Bank of Pakistan and National Bank of Pakistanas pledge against demand loan, TT / DD discounting facilities and foreign exchange exposure limit sanctioned to the Bankand Rs.5 million (2009: Rs.5 million) held by the Controller of Military Accounts (CMA) under Regimental Fund Arrangements.
9.7 This includes the Bank's subscription towards the paid-up capital of Khushhali Bank Limited amounting to Rs.200 million(2009: Rs.200 million). Pursuant to Section 10 of the Khushhali Bank Ordinance, 2000 strategic investors including the Bankcould not sell or transfer their investment before a period of five years that has expired on October 10, 2005. Thereafter, suchsale / transfer would be subject to the prior approval of the SBP. In addition, the profit of Khushhali Bank Limited cannot bedistributed as dividend under clause 35(i) of the Khushhali Bank Ordinance, 2000.
The SBP prepared a conversion structure for Khushhali Bank Limited to operate as a Microfinance Bank under theMicrofinance Institutions Ordinance, 2001 which was approved by the Ministry of Finance. The scheme of conversion was alsoapproved by the shareholders of Khushhali Bank Limited in an Extra-Ordinary General Meeting held on December 17, 2007.Accordingly, an application for incorporation was submitted to the SECP on February 15, 2008. The SECP has incorporatedKhushhali Bank Limited under the Microfinance Institutions Ordinance, 2001 and issued a Certificate of Incorporation onFebruary 28, 2008 under section 32 of the Companies Ordinance, 1984.
In a meeting between SBP and the Board of Directors of Khushhali Bank Limited held on June 12, 2008, it was agreed thatsince Khushhali Bank Limited has a majority of private sector commercial banks as its shareholders and is legally a privatesector bank, it is required to be managed as a private sector institution.
In order to achieve the strategic restructuring of Khushhali Bank Limited, a consortium of commercial banks including the Bankdecided to completely divest their shareholding in Khushhali Bank Limited. Thereafter, the Consortium appointed Advisors(financial, legal and accounting) for conducting preliminary due diligence for valuation and preparing a data room for theprospective purchasers. Khushhali Bank Limited, on behalf of the Consortium of the Commercial Banks has sought priorclearance/approval of the SBP for appointment of Advisors to conduct due diligence of Khushhali Bank Limited.
SBP has conveyed its, in principle, no objection to the consortium of selling shareholders of Khushhali Bank Limited forconducting due diligence/valuation of Khushhali Bank Limited subject to compliance with all the applicablelaws/rules/regulations etc. The due diligence / valuation is in the process of being carried out. The establishment of a dataroom and due diligence report/ valuation from Accounting and Financial Advisor is in process.
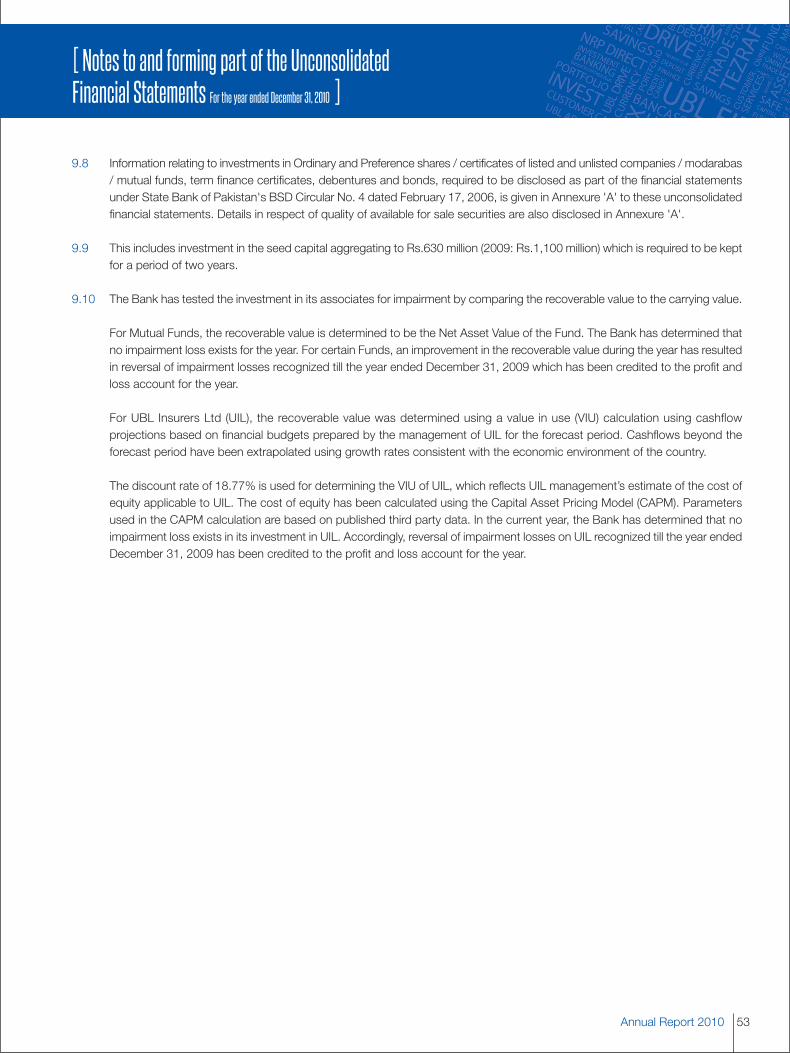
53Annual Report 2010
[ Notes to and forming part of the UnconsolidatedFinancial Statements For the year ended December 31, 2010 ]
9.8 Information relating to investments in Ordinary and Preference shares / certificates of listed and unlisted companies / modarabas/ mutual funds, term finance certificates, debentures and bonds, required to be disclosed as part of the financial statementsunder State Bank of Pakistan's BSD Circular No. 4 dated February 17, 2006, is given in Annexure 'A' to these unconsolidatedfinancial statements. Details in respect of quality of available for sale securities are also disclosed in Annexure 'A'.
9.9 This includes investment in the seed capital aggregating to Rs.630 million (2009: Rs.1,100 million) which is required to be keptfor a period of two years.
9.10 The Bank has tested the investment in its associates for impairment by comparing the recoverable value to the carrying value.
For Mutual Funds, the recoverable value is determined to be the Net Asset Value of the Fund. The Bank has determined thatno impairment loss exists for the year. For certain Funds, an improvement in the recoverable value during the year has resultedin reversal of impairment losses recognized till the year ended December 31, 2009 which has been credited to the profit andloss account for the year.
For UBL Insurers Ltd (UIL), the recoverable value was determined using a value in use (VIU) calculation using cashflowprojections based on financial budgets prepared by the management of UIL for the forecast period. Cashflows beyond theforecast period have been extrapolated using growth rates consistent with the economic environment of the country.
The discount rate of 18.77% is used for determining the VIU of UIL, which reflects UIL management’s estimate of the cost ofequity applicable to UIL. The cost of equity has been calculated using the Capital Asset Pricing Model (CAPM). Parametersused in the CAPM calculation are based on published third party data. In the current year, the Bank has determined that noimpairment loss exists in its investment in UIL. Accordingly, reversal of impairment losses on UIL recognized till the year endedDecember 31, 2009 has been credited to the profit and loss account for the year.

United Bank Limited54
[ Notes to and forming part of the UnconsolidatedFinancial Statements For the year ended December 31, 2010 ]
Note Performing Non-performing Total2010 2009 2010 2009 2010 2009
--------------------------------------- (Rupees in '000) ---------------------------------------10. ADVANCES
Loans, cash credits, running finances, etc.
In Pakistan 10.2 228,034,418 244,389,399 40,726,130 32,220,534 268,760,548 276,609,933Outside Pakistan 75,230,030 82,463,971 5,198,923 4,064,166 80,428,953 86,528,137
303,264,448 326,853,370 45,925,053 36,284,700 349,189,501 363,138,070Bills discounted and purchased
Payable in Pakistan 12,429,950 11,607,055 2,235,582 2,400,013 14,665,532 14,007,068Payable outside Pakistan 4,404,982 4,916,421 431,925 416,683 4,836,907 5,333,104
16,834,932 16,523,476 2,667,507 2,816,696 19,502,439 19,340,172Advances - gross 320,099,380 343,376,846 48,592,560 39,101,396 368,691,940 382,478,242
Provision against advances 10.5- Specific - - (33,534,272) (27,673,022) (33,534,272) (27,673,022)- General (1,425,496) (713,507) - - (1,425,496) (713,507)
(1,425,496) (713,507) (33,534,272) (27,673,022) (34,959,768) (28,386,529)
Advances - net of provision 318,673,884 342,663,339 15,058,288 11,428,374 333,732,172 354,091,713
Performing Non-performing Total2010 2009 2010 2009 2010 2009
--------------------------------------- (Rupees in '000) ---------------------------------------10.1 Particulars of advances - gross
10.1.1 In local currency 235,079,268 253,182,814 42,816,359 33,781,868 277,895,627 286,964,682In foreign currencies 85,020,112 90,194,032 5,776,201 5,319,528 90,796,313 95,513,560
320,099,380 343,376,846 48,592,560 39,101,396 368,691,940 382,478,242
10.1.2 Short term 244,216,178 230,096,641 - - 244,216,178 230,096,641Long term 75,883,202 113,280,205 48,592,560 39,101,396 124,475,762 152,381,601
320,099,380 343,376,846 48,592,560 39,101,396 368,691,940 382,478,242
10.2 This includes performing advances given under various Islamic financing modes amounting to Rs.461.342 million (2009: Rs.638.131 million).
10.3 Non-performing advances include advances having gross book value of Rs.5,774.675 million (2009: Rs.1,596.136 million) and net book valueof Rs. 2,110.614 million (2009: Rs.919.006 million) which, though restructured and performing have been placed under non-performing statusas required by the revised Prudential Regulations issued by the SBP, which requires monitoring for at least one year before any upgradationis considered.
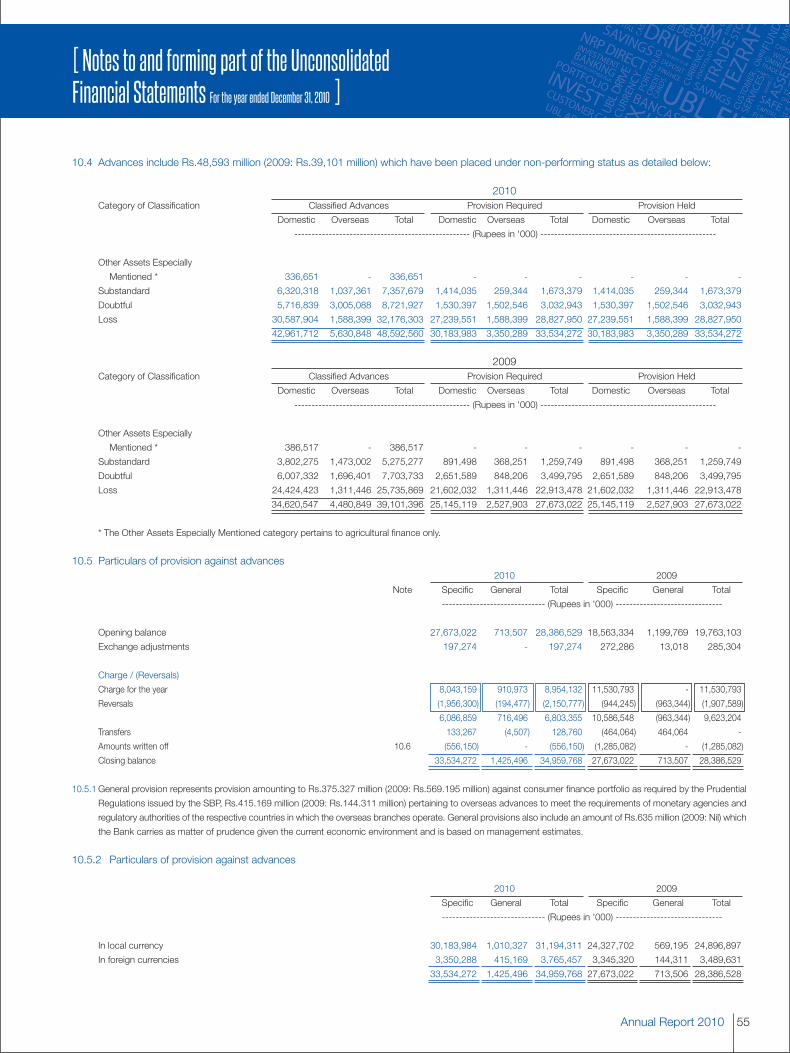
55Annual Report 2010
[ Notes to and forming part of the UnconsolidatedFinancial Statements For the year ended December 31, 2010 ]
10.4 Advances include Rs.48,593 million (2009: Rs.39,101 million) which have been placed under non-performing status as detailed below:
2010Category of Classification Classified Advances Provision Required Provision Held
Domestic Overseas Total Domestic Overseas Total Domestic Overseas Total
--------------------------------------------------- (Rupees in '000) ---------------------------------------------------
Other Assets Especially
Mentioned * 336,651 - 336,651 - - - - - -
Substandard 6,320,318 1,037,361 7,357,679 1,414,035 259,344 1,673,379 1,414,035 259,344 1,673,379
Doubtful 5,716,839 3,005,088 8,721,927 1,530,397 1,502,546 3,032,943 1,530,397 1,502,546 3,032,943
Loss 30,587,904 1,588,399 32,176,303 27,239,551 1,588,399 28,827,950 27,239,551 1,588,399 28,827,950
42,961,712 5,630,848 48,592,560 30,183,983 3,350,289 33,534,272 30,183,983 3,350,289 33,534,272
2009Category of Classification Classified Advances Provision Required Provision Held
Domestic Overseas Total Domestic Overseas Total Domestic Overseas Total
--------------------------------------------------- (Rupees in '000) ---------------------------------------------------
Other Assets Especially
Mentioned * 386,517 - 386,517 - - - - - -
Substandard 3,802,275 1,473,002 5,275,277 891,498 368,251 1,259,749 891,498 368,251 1,259,749
Doubtful 6,007,332 1,696,401 7,703,733 2,651,589 848,206 3,499,795 2,651,589 848,206 3,499,795
Loss 24,424,423 1,311,446 25,735,869 21,602,032 1,311,446 22,913,478 21,602,032 1,311,446 22,913,478
34,620,547 4,480,849 39,101,396 25,145,119 2,527,903 27,673,022 25,145,119 2,527,903 27,673,022
* The Other Assets Especially Mentioned category pertains to agricultural finance only.
10.5 Particulars of provision against advances2010 2009
Note Specific General Total Specific General Total
------------------------------ (Rupees in '000) -------------------------------
Opening balance 27,673,022 713,507 28,386,529 18,563,334 1,199,769 19,763,103
Exchange adjustments 197,274 - 197,274 272,286 13,018 285,304
Charge / (Reversals)
Charge for the year 8,043,159 910,973 8,954,132 11,530,793 - 11,530,793
Reversals (1,956,300) (194,477) (2,150,777) (944,245) (963,344) (1,907,589)
6,086,859 716,496 6,803,355 10,586,548 (963,344) 9,623,204
Transfers 133,267 (4,507) 128,760 (464,064) 464,064 -
Amounts written off 10.6 (556,150) - (556,150) (1,285,082) - (1,285,082)
Closing balance 33,534,272 1,425,496 34,959,768 27,673,022 713,507 28,386,529
10.5.1 General provision represents provision amounting to Rs.375.327 million (2009: Rs.569.195 million) against consumer finance portfolio as required by the Prudential
Regulations issued by the SBP, Rs.415.169 million (2009: Rs.144.311 million) pertaining to overseas advances to meet the requirements of monetary agencies and
regulatory authorities of the respective countries in which the overseas branches operate. General provisions also include an amount of Rs.635 million (2009: Nil) which
the Bank carries as matter of prudence given the current economic environment and is based on management estimates.
10.5.2 Particulars of provision against advances
2010 2009
Specific General Total Specific General Total
------------------------------ (Rupees in '000) -------------------------------
In local currency 30,183,984 1,010,327 31,194,311 24,327,702 569,195 24,896,897
In foreign currencies 3,350,288 415,169 3,765,457 3,345,320 144,311 3,489,631
33,534,272 1,425,496 34,959,768 27,673,022 713,506 28,386,528

United Bank Limited56
[ Notes to and forming part of the UnconsolidatedFinancial Statements For the year ended December 31, 2010 ]
Note 2010 2009----- (Rupees in ‘000) -----
10.6 Particulars of write-offs
10.6.1 Against provisions 10.5 556,150 1,285,082Directly charged to profit and loss account 996,772 1,485,976
1,552,922 2,771,058
10.6.2 Write-offs of Rs.500,000 and above 10.7 764,563 1,588,946Write-offs of below Rs.500,000 788,359 1,182,112
1,552,922 2,771,058
10.7 Details of loan write-offs of Rs.500,000 and above
In terms of sub-section (3) of Section 33A of the Banking Companies Ordinance, 1962 the statement in respect of written-off loans or any other financial relief of five hundred thousand rupees or above allowed to a person during the year endedDecember 31, 2010 is given in Annexure 'B' to these unconsolidated financial statements. These loans are written off as abook entry without prejudice to the Bank's right of recovery against the customers.
Note 2010 2009----- (Rupees in ‘000) -----
10.8 Particulars of loans and advances to executives, directors,associated companies etc.
Debts due by directors or executives of the Bank or any of themeither severally or jointly with any other persons
Balance at the beginning of the year 1,482,474 981,319Loans granted during the year 717,242 1,020,264Repayments made during the year (581,135) (519,109)Balance at the end of the year 1,618,581 1,482,474
11. OPERATING FIXED ASSETS
Capital work-in-progress 11.1 1,334,951 997,617Property and equipment 11.2 20,166,071 20,439,417Intangible assets 11.3 923,050 488,635
22,424,072 21,925,66911.1 Capital work-in-progress
Civil works 11.1.1 537,257 484,612Equipment 268,949 202,119Software 11.1.2 517,776 297,984Advances to suppliers and contractors 10,969 12,902
1,334,951 997,617
11.1.1 This includes Rs.437.916 million (2009: Rs.297.430 million) paid in respect of construction of the Head Office building.
11.1.2 This includes Rs.516.081 million (2009: Rs.221.56 million) paid in respect of the Core Banking Software.

57Annual Report 2010
[ Notes to and forming part of the UnconsolidatedFinancial Statements For the year ended December 31, 2010 ]
11.2 Property and equipment
2010COST/ REVALUATION ACCUMULATED DEPRECIATION
Note At Additions / Surplus on Reclassif- Exchange At At Charge for Reversal Exchange At Net book AnnualJanuary (deletions) revaluation / ication Adjustment / December January the year / due to Adjustment / December value at rate of01, 2010 (Reversal of Other 31, 2010 01, 2010 (deprec- revaluation Other 31, 2010 December deprec-
accumulated adjustments iation on adjustments 31, 2010 iation %depreciation) deletions)
------------------------------------------------------------------ (Rupees in '000) ------------------------------------------------------------------
OwnedFreehold land 1,825,754 125,305 - 1,090,717 - 3,041,776 - - - - - 3,041,776 -
Leasehold land 12,802,015 9,865 - - 22 11,721,185 1,052 291,697 - 18 292,767 11,428,418 1 - 3.33- - (1,090,717) - - - -
Buildings on freehold land 118,967 22,025 - 173,900 - 314,892 - 15,002 - - 15,002 299,890 5- - - - - - -
Buildings on leasehold land 2,149,539 56,072 8,788 - 161 2,026,522 36,283 99,979 - 347 122,471 1,904,051 5(5,431) (8,707) (173,900) - (5,431) (8,707) -
Leasehold Improvements 1,495,013 169,079 - - 4,911 1,661,185 415,414 153,380 - - 562,856 1,098,329 10(7,818) - - - (5,436) - (502)
Furniture and fixtures 885,786 75,064 - - 2,192 945,272 477,661 78,998 - 2,196 544,095 401,177 10(17,770) - - - (14,760) - -
Electrical, office and computer 3,896,827 704,628 - - - 4,562,070 2,427,235 682,097 - - 3,054,986 1,507,084 20-25equipment (31,186) - - (8,199) (29,681) - (24,665)
Vehicles 267,752 48,877 - - 174 281,949 158,981 34,307 - - 168,108 113,841 20(34,854) - - - (22,631) - (2,549)
Assets held underoperatinglease Ijarah assets 11.8 810,456 59,658 - - 2,931 739,979 296,066 137,463 - - 368,474 371,505 20 - 33.33
(133,066) - - - (65,055) - -2010 24,252,109 1,270,573 8,788 1,264,617 10,391 25,294,830 3,812,692 1,492,923 - 2,561 5,128,759 20,166,071
(230,125) (8,707) (1,264,617) (8,199) (142,994) (8,707) (27,716)
2009COST/ REVALUATION ACCUMULATED DEPRECIATION
At Additions / Surplus on Reclassif- Exchange At At Charge for Reversal Exchange At Net book AnnualJanuary (deletions) revaluation / ication Adjustment / December January the year / due to Adjustment / December value at rate of01, 2009 (Reversal of Other 31, 2009 01, 2009 (depriciation revaluation Other 31, 2009 December deprec-
accumulated adjustments on deletions) adjustments 31, 2009 iation %depreciation)
------------------------------------------------------------------ (Rupees in '000) ------------------------------------------------------------------
OwnedFreehold land 1,502,746 1,724 332,426 - - 1,825,754 - - - - - 1,825,754 -
(11,142)Leasehold land 10,092,131 9,470 3,328,235 - 1,793 12,802,015 307,447 305,640 - 63 1,052 12,800,963 1 - 3.33
(106,551) (523,063) - (87,760) (523,063) (1,275)Buildings on freehold land 81,021 - 44,923 - 975 118,967 3,826 4,126 - - - 118,967 5
(112) (7,840) - - (112) (7,840) -Buildings on leasehold land 1,904,654 - 434,008 - 587 2,149,539 128,769 93,934 - 498 36,283 2,113,256 5
(5,240) (184,470) - - (1,965) (184,470) (483)Leasehold Improvements 1,169,850 305,714 - - 19,449 1,495,013 255,761 149,724 - 9,929 415,414 1,079,599 10
- - - - - - -Furniture and fixtures 801,949 104,078 - - 8,745 885,786 418,311 73,279 - 8,805 477,661 408,125 10
(28,986) - - - (22,734) - -Electrical, office and computer 3,137,525 777,812 - - 33,966 3,896,827 1,833,212 616,013 - 20,440 2,427,235 1,469,592 20-25equipment (52,476) - - - (42,430) - -Vehicles 272,066 51,958 - - 2,697 267,752 141,973 58,523 - 2,175 158,981 108,771 20
(58,969) - - - (43,690) - -Assets held under operatinglease Ijarah assets 11.8 895,217 39,648 - - - 810,456 153,297 170,285 - - 296,066 514,390 20-33.33
(104,750) - (19,659) (27,516) - -2009 19,857,159 1,290,404 4,139,592 - 68,212 24,252,109 3,242,596 1,471,524 - 41,910 3,812,692 20,439,417
(368,226) (715,373) - (19,659) (226,207) (715,373) (1,758)
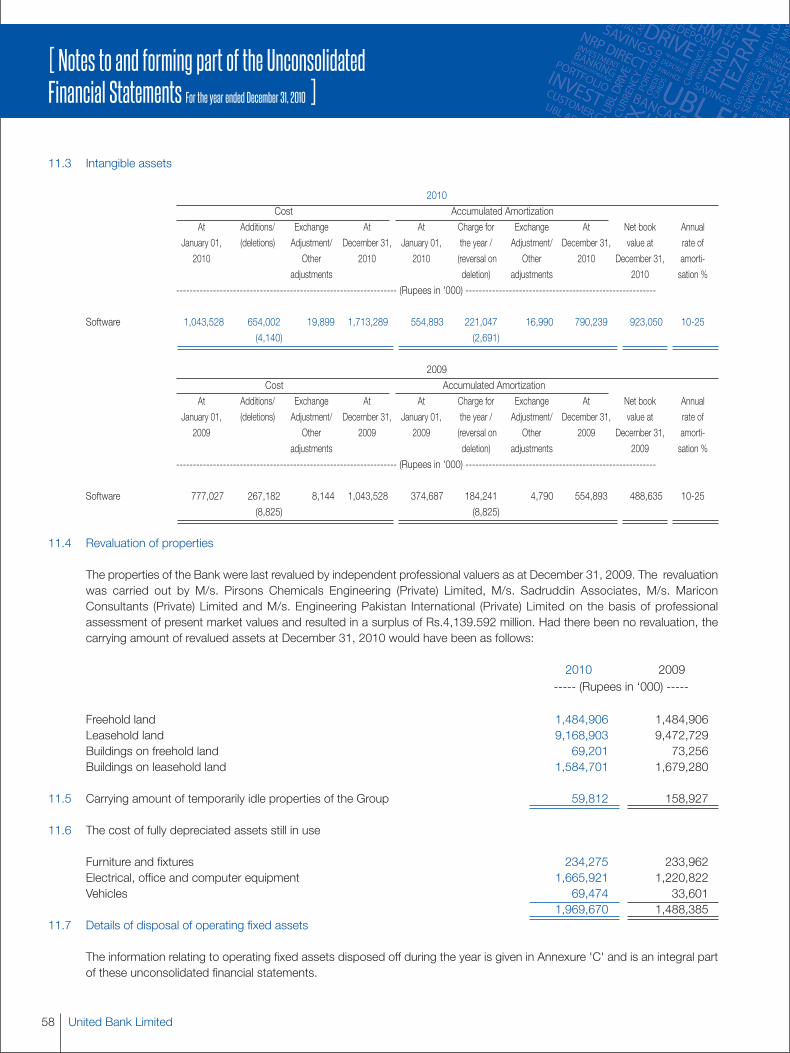
United Bank Limited58
[ Notes to and forming part of the UnconsolidatedFinancial Statements For the year ended December 31, 2010 ]
11.3 Intangible assets
2010
Cost Accumulated Amortization
At Additions/ Exchange At At Charge for Exchange At Net book Annual
January 01, (deletions) Adjustment/ December 31, January 01, the year / Adjustment/ December 31, value at rate of
2010 Other 2010 2010 (reversal on Other 2010 December 31, amorti-
adjustments deletion) adjustments 2010 sation %
------------------------------------------------------------------ (Rupees in '000) ---------------------------------------------------------
Software 1,043,528 654,002 19,899 1,713,289 554,893 221,047 16,990 790,239 923,050 10-25
(4,140) (2,691)
2009
Cost Accumulated Amortization
At Additions/ Exchange At At Charge for Exchange At Net book Annual
January 01, (deletions) Adjustment/ December 31, January 01, the year / Adjustment/ December 31, value at rate of
2009 Other 2009 2009 (reversal on Other 2009 December 31, amorti-
adjustments deletion) adjustments 2009 sation %
------------------------------------------------------------------ (Rupees in '000) ---------------------------------------------------------
Software 777,027 267,182 8,144 1,043,528 374,687 184,241 4,790 554,893 488,635 10-25
(8,825) (8,825)
11.4 Revaluation of properties
The properties of the Bank were last revalued by independent professional valuers as at December 31, 2009. The revaluationwas carried out by M/s. Pirsons Chemicals Engineering (Private) Limited, M/s. Sadruddin Associates, M/s. MariconConsultants (Private) Limited and M/s. Engineering Pakistan International (Private) Limited on the basis of professionalassessment of present market values and resulted in a surplus of Rs.4,139.592 million. Had there been no revaluation, thecarrying amount of revalued assets at December 31, 2010 would have been as follows:
2010 2009----- (Rupees in ‘000) -----
Freehold land 1,484,906 1,484,906Leasehold land 9,168,903 9,472,729Buildings on freehold land 69,201 73,256Buildings on leasehold land 1,584,701 1,679,280
11.5 Carrying amount of temporarily idle properties of the Group 59,812 158,927
11.6 The cost of fully depreciated assets still in use
Furniture and fixtures 234,275 233,962Electrical, office and computer equipment 1,665,921 1,220,822Vehicles 69,474 33,601
1,969,670 1,488,38511.7 Details of disposal of operating fixed assets
The information relating to operating fixed assets disposed off during the year is given in Annexure 'C' and is an integral partof these unconsolidated financial statements.
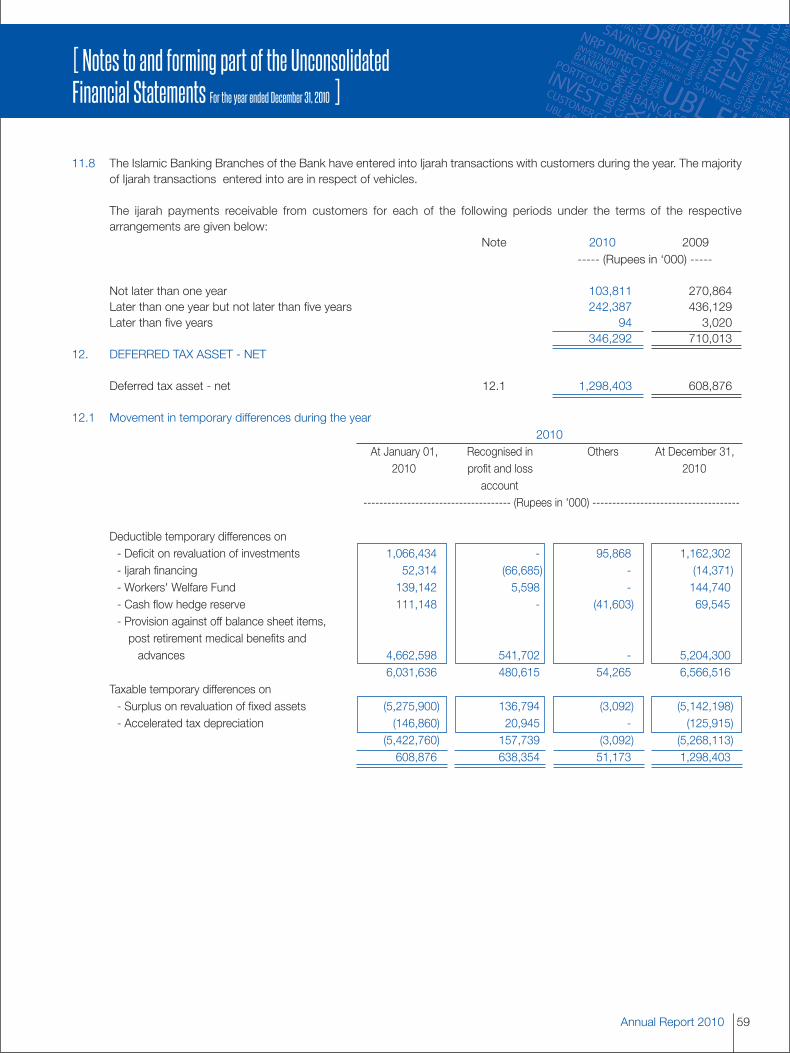
59Annual Report 2010
[ Notes to and forming part of the UnconsolidatedFinancial Statements For the year ended December 31, 2010 ]
11.8 The Islamic Banking Branches of the Bank have entered into Ijarah transactions with customers during the year. The majorityof Ijarah transactions entered into are in respect of vehicles.
The ijarah payments receivable from customers for each of the following periods under the terms of the respectivearrangements are given below:
Note 2010 2009----- (Rupees in ‘000) -----
Not later than one year 103,811 270,864Later than one year but not later than five years 242,387 436,129Later than five years 94 3,020
346,292 710,01312. DEFERRED TAX ASSET - NET
Deferred tax asset - net 12.1 1,298,403 608,876
12.1 Movement in temporary differences during the year2010
At January 01, Recognised in Others At December 31,2010 profit and loss 2010
account------------------------------------- (Rupees in '000) -------------------------------------
Deductible temporary differences on- Deficit on revaluation of investments 1,066,434 - 95,868 1,162,302- Ijarah financing 52,314 (66,685) - (14,371)- Workers' Welfare Fund 139,142 5,598 - 144,740- Cash flow hedge reserve 111,148 - (41,603) 69,545- Provision against off balance sheet items,post retirement medical benefits andadvances 4,662,598 541,702 - 5,204,300
6,031,636 480,615 54,265 6,566,516Taxable temporary differences on- Surplus on revaluation of fixed assets (5,275,900) 136,794 (3,092) (5,142,198)- Accelerated tax depreciation (146,860) 20,945 - (125,915)
(5,422,760) 157,739 (3,092) (5,268,113)608,876 638,354 51,173 1,298,403
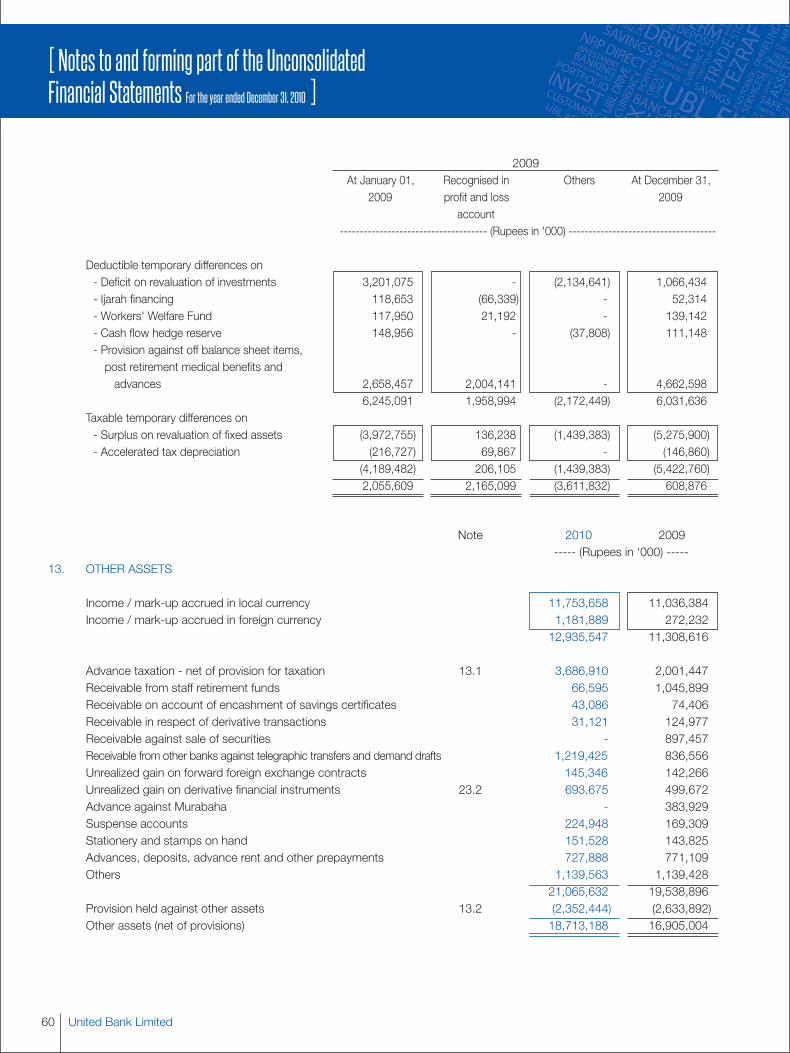
United Bank Limited60
[ Notes to and forming part of the UnconsolidatedFinancial Statements For the year ended December 31, 2010 ]
2009At January 01, Recognised in Others At December 31,
2009 profit and loss 2009account
------------------------------------- (Rupees in '000) -------------------------------------
Deductible temporary differences on- Deficit on revaluation of investments 3,201,075 - (2,134,641) 1,066,434- Ijarah financing 118,653 (66,339) - 52,314- Workers' Welfare Fund 117,950 21,192 - 139,142- Cash flow hedge reserve 148,956 - (37,808) 111,148- Provision against off balance sheet items,post retirement medical benefits andadvances 2,658,457 2,004,141 - 4,662,598
6,245,091 1,958,994 (2,172,449) 6,031,636Taxable temporary differences on- Surplus on revaluation of fixed assets (3,972,755) 136,238 (1,439,383) (5,275,900)- Accelerated tax depreciation (216,727) 69,867 - (146,860)
(4,189,482) 206,105 (1,439,383) (5,422,760)2,055,609 2,165,099 (3,611,832) 608,876
Note 2010 2009----- (Rupees in ‘000) -----
13. OTHER ASSETS
Income / mark-up accrued in local currency 11,753,658 11,036,384Income / mark-up accrued in foreign currency 1,181,889 272,232
12,935,547 11,308,616
Advance taxation - net of provision for taxation 13.1 3,686,910 2,001,447Receivable from staff retirement funds 66,595 1,045,899Receivable on account of encashment of savings certificates 43,086 74,406Receivable in respect of derivative transactions 31,121 124,977Receivable against sale of securities - 897,457Receivable from other banks against telegraphic transfers and demand drafts 1,219,425 836,556Unrealized gain on forward foreign exchange contracts 145,346 142,266Unrealized gain on derivative financial instruments 23.2 693,675 499,672Advance against Murabaha - 383,929Suspense accounts 224,948 169,309Stationery and stamps on hand 151,528 143,825Advances, deposits, advance rent and other prepayments 727,888 771,109Others 1,139,563 1,139,428
21,065,632 19,538,896Provision held against other assets 13.2 (2,352,444) (2,633,892)Other assets (net of provisions) 18,713,188 16,905,004
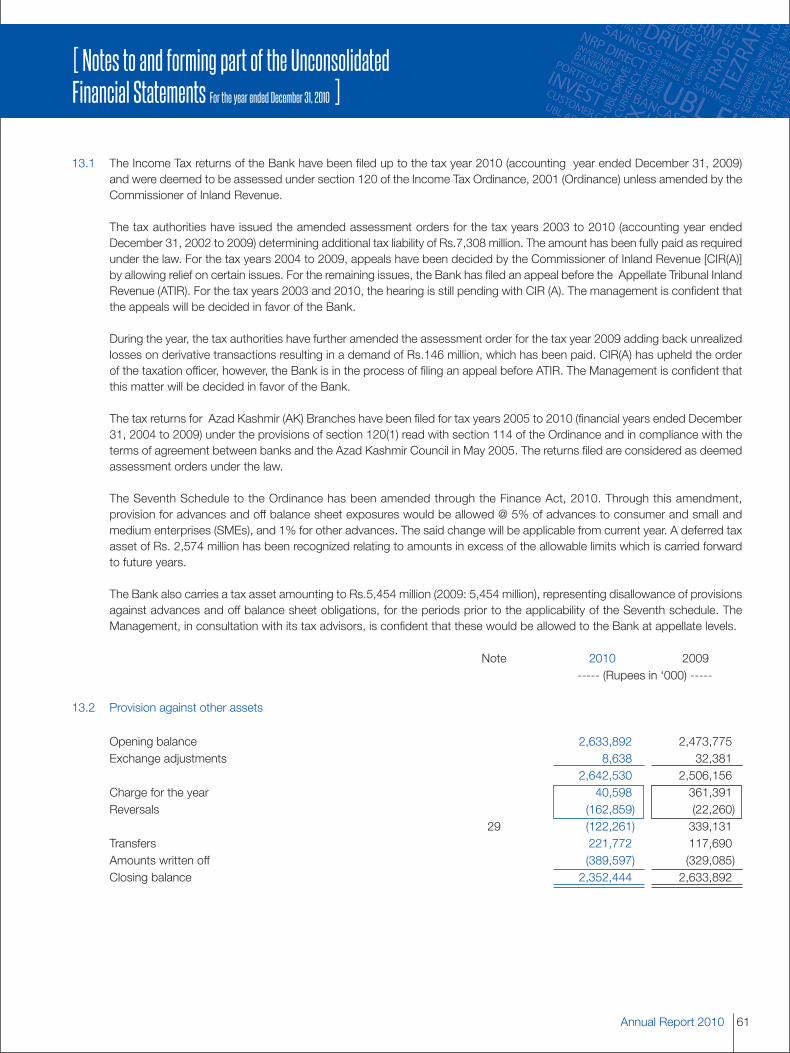
61Annual Report 2010
[ Notes to and forming part of the UnconsolidatedFinancial Statements For the year ended December 31, 2010 ]
13.1 The Income Tax returns of the Bank have been filed up to the tax year 2010 (accounting year ended December 31, 2009)and were deemed to be assessed under section 120 of the Income Tax Ordinance, 2001 (Ordinance) unless amended by theCommissioner of Inland Revenue.
The tax authorities have issued the amended assessment orders for the tax years 2003 to 2010 (accounting year endedDecember 31, 2002 to 2009) determining additional tax liability of Rs.7,308 million. The amount has been fully paid as requiredunder the law. For the tax years 2004 to 2009, appeals have been decided by the Commissioner of Inland Revenue [CIR(A)]by allowing relief on certain issues. For the remaining issues, the Bank has filed an appeal before the Appellate Tribunal InlandRevenue (ATIR). For the tax years 2003 and 2010, the hearing is still pending with CIR (A). The management is confident thatthe appeals will be decided in favor of the Bank.
During the year, the tax authorities have further amended the assessment order for the tax year 2009 adding back unrealizedlosses on derivative transactions resulting in a demand of Rs.146 million, which has been paid. CIR(A) has upheld the orderof the taxation officer, however, the Bank is in the process of filing an appeal before ATIR. The Management is confident thatthis matter will be decided in favor of the Bank.
The tax returns for Azad Kashmir (AK) Branches have been filed for tax years 2005 to 2010 (financial years ended December31, 2004 to 2009) under the provisions of section 120(1) read with section 114 of the Ordinance and in compliance with theterms of agreement between banks and the Azad Kashmir Council in May 2005. The returns filed are considered as deemedassessment orders under the law.
The Seventh Schedule to the Ordinance has been amended through the Finance Act, 2010. Through this amendment,provision for advances and off balance sheet exposures would be allowed @ 5% of advances to consumer and small andmedium enterprises (SMEs), and 1% for other advances. The said change will be applicable from current year. A deferred taxasset of Rs. 2,574 million has been recognized relating to amounts in excess of the allowable limits which is carried forwardto future years.
The Bank also carries a tax asset amounting to Rs.5,454 million (2009: 5,454 million), representing disallowance of provisionsagainst advances and off balance sheet obligations, for the periods prior to the applicability of the Seventh schedule. TheManagement, in consultation with its tax advisors, is confident that these would be allowed to the Bank at appellate levels.
Note 2010 2009----- (Rupees in ‘000) -----
13.2 Provision against other assets
Opening balance 2,633,892 2,473,775Exchange adjustments 8,638 32,381
2,642,530 2,506,156Charge for the year 40,598 361,391Reversals (162,859) (22,260)
29 (122,261) 339,131Transfers 221,772 117,690Amounts written off (389,597) (329,085)Closing balance 2,352,444 2,633,892
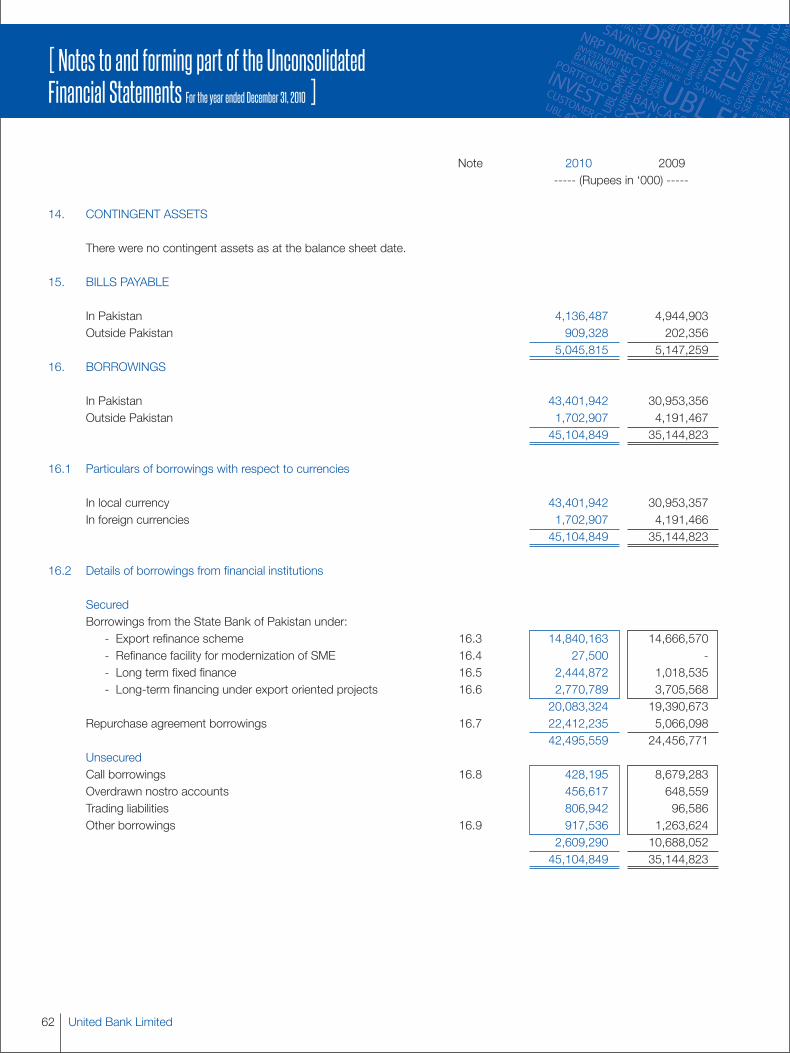
United Bank Limited62
[ Notes to and forming part of the UnconsolidatedFinancial Statements For the year ended December 31, 2010 ]
Note 2010 2009----- (Rupees in ‘000) -----
14. CONTINGENT ASSETS
There were no contingent assets as at the balance sheet date.
15. BILLS PAYABLE
In Pakistan 4,136,487 4,944,903Outside Pakistan 909,328 202,356
5,045,815 5,147,25916. BORROWINGS
In Pakistan 43,401,942 30,953,356Outside Pakistan 1,702,907 4,191,467
45,104,849 35,144,823
16.1 Particulars of borrowings with respect to currencies
In local currency 43,401,942 30,953,357In foreign currencies 1,702,907 4,191,466
45,104,849 35,144,823
16.2 Details of borrowings from financial institutions
SecuredBorrowings from the State Bank of Pakistan under:
- Export refinance scheme 16.3 14,840,163 14,666,570- Refinance facility for modernization of SME 16.4 27,500 -- Long term fixed finance 16.5 2,444,872 1,018,535- Long-term financing under export oriented projects 16.6 2,770,789 3,705,568
20,083,324 19,390,673Repurchase agreement borrowings 16.7 22,412,235 5,066,098
42,495,559 24,456,771UnsecuredCall borrowings 16.8 428,195 8,679,283Overdrawn nostro accounts 456,617 648,559Trading liabilities 806,942 96,586Other borrowings 16.9 917,536 1,263,624
2,609,290 10,688,05245,104,849 35,144,823
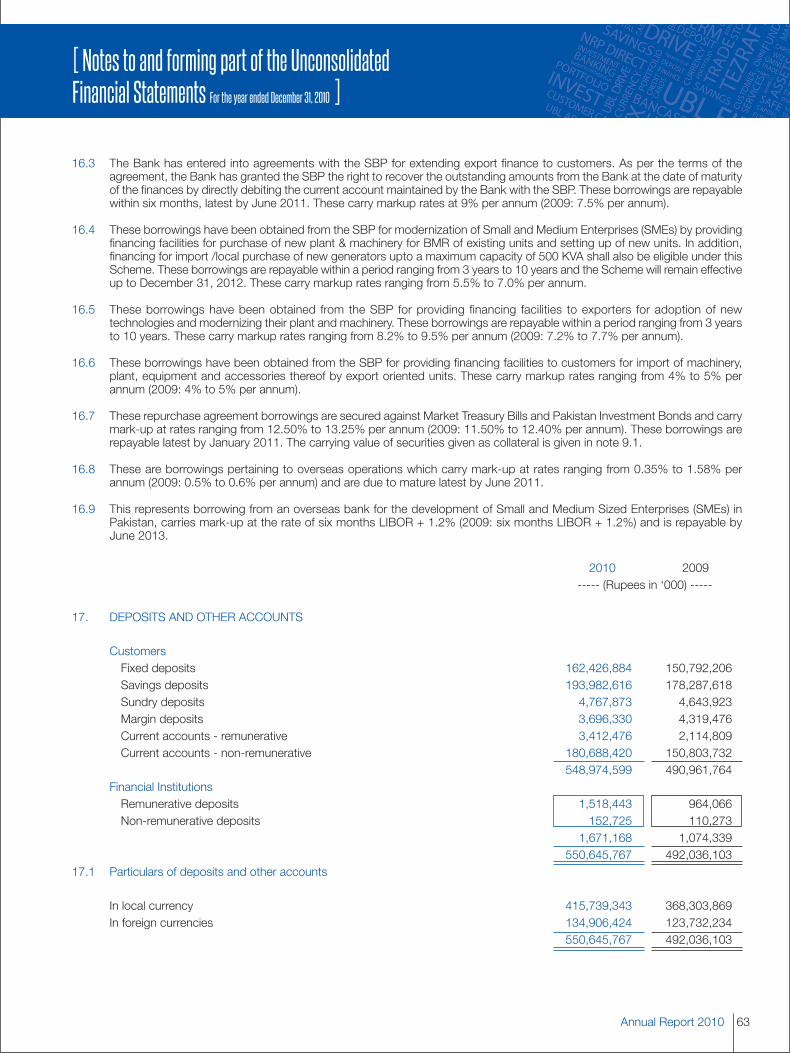
63Annual Report 2010
[ Notes to and forming part of the UnconsolidatedFinancial Statements For the year ended December 31, 2010 ]
16.3 The Bank has entered into agreements with the SBP for extending export finance to customers. As per the terms of theagreement, the Bank has granted the SBP the right to recover the outstanding amounts from the Bank at the date of maturityof the finances by directly debiting the current account maintained by the Bank with the SBP. These borrowings are repayablewithin six months, latest by June 2011. These carry markup rates at 9% per annum (2009: 7.5% per annum).
16.4 These borrowings have been obtained from the SBP for modernization of Small and Medium Enterprises (SMEs) by providingfinancing facilities for purchase of new plant & machinery for BMR of existing units and setting up of new units. In addition,financing for import /local purchase of new generators upto a maximum capacity of 500 KVA shall also be eligible under thisScheme. These borrowings are repayable within a period ranging from 3 years to 10 years and the Scheme will remain effectiveup to December 31, 2012. These carry markup rates ranging from 5.5% to 7.0% per annum.
16.5 These borrowings have been obtained from the SBP for providing financing facilities to exporters for adoption of newtechnologies and modernizing their plant and machinery. These borrowings are repayable within a period ranging from 3 yearsto 10 years. These carry markup rates ranging from 8.2% to 9.5% per annum (2009: 7.2% to 7.7% per annum).
16.6 These borrowings have been obtained from the SBP for providing financing facilities to customers for import of machinery,plant, equipment and accessories thereof by export oriented units. These carry markup rates ranging from 4% to 5% perannum (2009: 4% to 5% per annum).
16.7 These repurchase agreement borrowings are secured against Market Treasury Bills and Pakistan Investment Bonds and carrymark-up at rates ranging from 12.50% to 13.25% per annum (2009: 11.50% to 12.40% per annum). These borrowings arerepayable latest by January 2011. The carrying value of securities given as collateral is given in note 9.1.
16.8 These are borrowings pertaining to overseas operations which carry mark-up at rates ranging from 0.35% to 1.58% perannum (2009: 0.5% to 0.6% per annum) and are due to mature latest by June 2011.
16.9 This represents borrowing from an overseas bank for the development of Small and Medium Sized Enterprises (SMEs) inPakistan, carries mark-up at the rate of six months LIBOR + 1.2% (2009: six months LIBOR + 1.2%) and is repayable byJune 2013.
2010 2009----- (Rupees in ‘000) -----
17. DEPOSITS AND OTHER ACCOUNTS
CustomersFixed deposits 162,426,884 150,792,206Savings deposits 193,982,616 178,287,618Sundry deposits 4,767,873 4,643,923Margin deposits 3,696,330 4,319,476Current accounts - remunerative 3,412,476 2,114,809Current accounts - non-remunerative 180,688,420 150,803,732
548,974,599 490,961,764Financial InstitutionsRemunerative deposits 1,518,443 964,066Non-remunerative deposits 152,725 110,273
1,671,168 1,074,339550,645,767 492,036,103
17.1 Particulars of deposits and other accounts
In local currency 415,739,343 368,303,869In foreign currencies 134,906,424 123,732,234
550,645,767 492,036,103
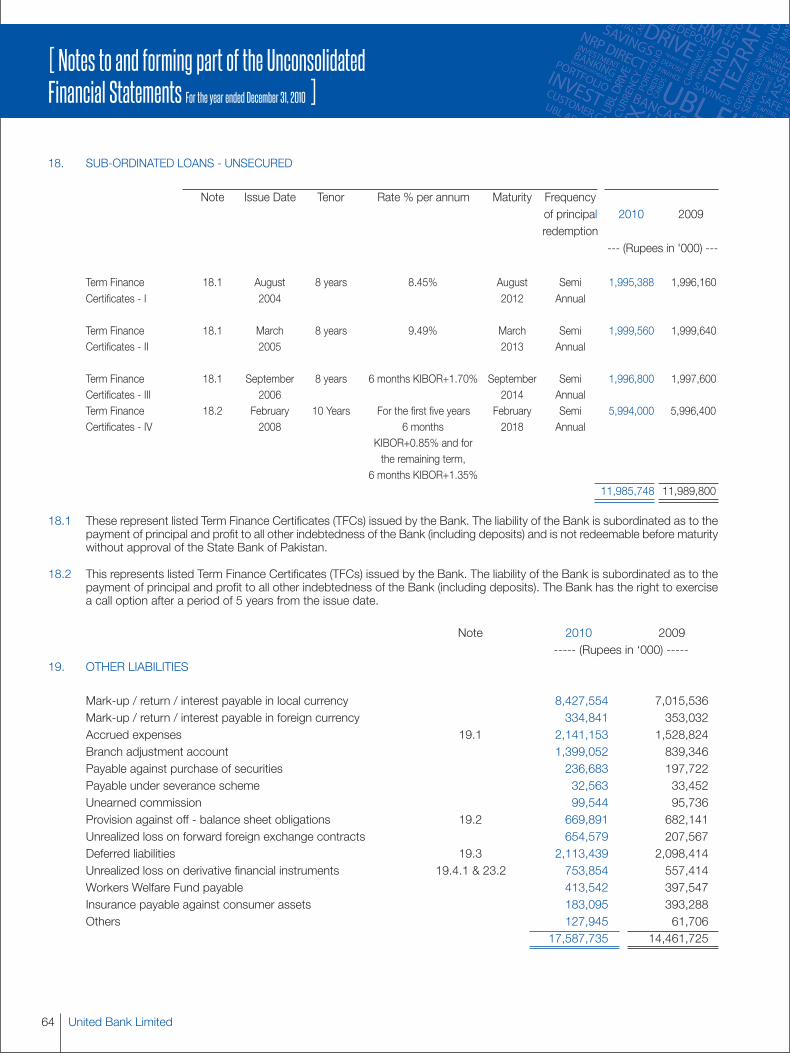
United Bank Limited64
[ Notes to and forming part of the UnconsolidatedFinancial Statements For the year ended December 31, 2010 ]
18. SUB-ORDINATED LOANS - UNSECURED
Note Issue Date Tenor Rate % per annum Maturity Frequencyof principal 2010 2009redemption
--- (Rupees in '000) ---
Term Finance 18.1 August 8 years 8.45% August Semi 1,995,388 1,996,160Certificates - I 2004 2012 Annual
Term Finance 18.1 March 8 years 9.49% March Semi 1,999,560 1,999,640Certificates - II 2005 2013 Annual
Term Finance 18.1 September 8 years 6 months KIBOR+1.70% September Semi 1,996,800 1,997,600Certificates - III 2006 2014 AnnualTerm Finance 18.2 February 10 Years For the first five years February Semi 5,994,000 5,996,400Certificates - IV 2008 6 months 2018 Annual
KIBOR+0.85% and forthe remaining term,
6 months KIBOR+1.35%11,985,748 11,989,800
18.1 These represent listed Term Finance Certificates (TFCs) issued by the Bank. The liability of the Bank is subordinated as to thepayment of principal and profit to all other indebtedness of the Bank (including deposits) and is not redeemable before maturitywithout approval of the State Bank of Pakistan.
18.2 This represents listed Term Finance Certificates (TFCs) issued by the Bank. The liability of the Bank is subordinated as to thepayment of principal and profit to all other indebtedness of the Bank (including deposits). The Bank has the right to exercisea call option after a period of 5 years from the issue date.
Note 2010 2009----- (Rupees in ‘000) -----
19. OTHER LIABILITIES
Mark-up / return / interest payable in local currency 8,427,554 7,015,536Mark-up / return / interest payable in foreign currency 334,841 353,032Accrued expenses 19.1 2,141,153 1,528,824Branch adjustment account 1,399,052 839,346Payable against purchase of securities 236,683 197,722Payable under severance scheme 32,563 33,452Unearned commission 99,544 95,736Provision against off - balance sheet obligations 19.2 669,891 682,141Unrealized loss on forward foreign exchange contracts 654,579 207,567Deferred liabilities 19.3 2,113,439 2,098,414Unrealized loss on derivative financial instruments 19.4.1 & 23.2 753,854 557,414Workers Welfare Fund payable 413,542 397,547Insurance payable against consumer assets 183,095 393,288Others 127,945 61,706
17,587,735 14,461,725
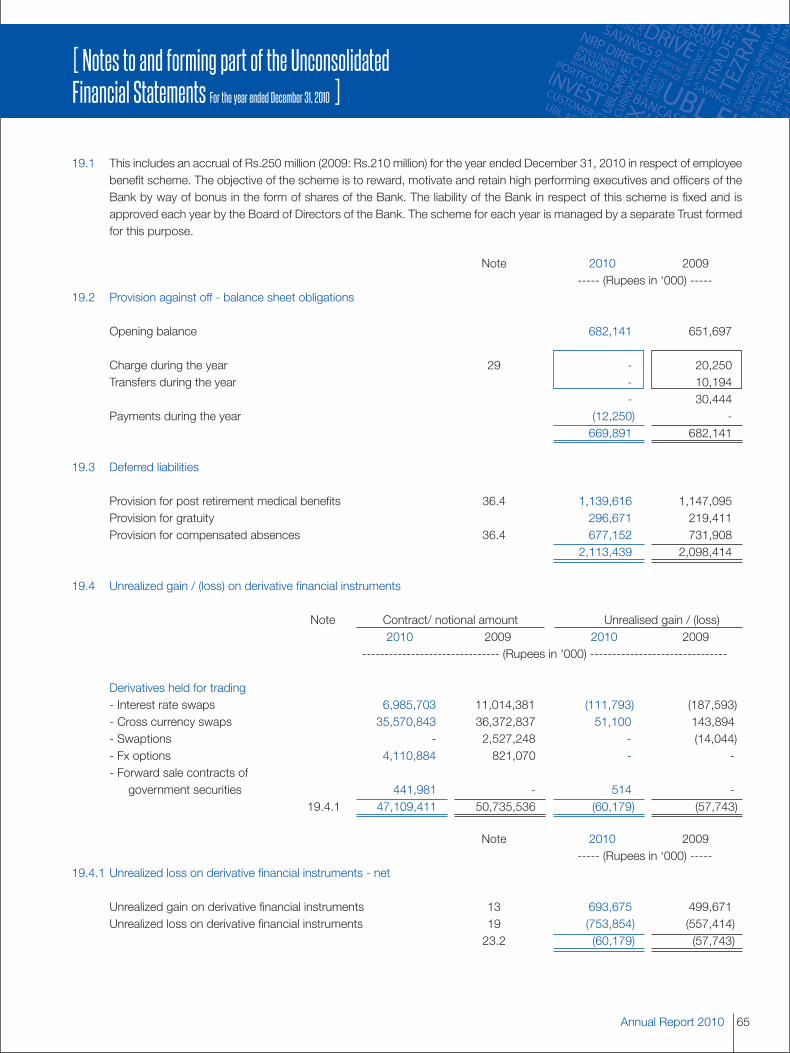
65Annual Report 2010
[ Notes to and forming part of the UnconsolidatedFinancial Statements For the year ended December 31, 2010 ]
19.1 This includes an accrual of Rs.250 million (2009: Rs.210 million) for the year ended December 31, 2010 in respect of employeebenefit scheme. The objective of the scheme is to reward, motivate and retain high performing executives and officers of theBank by way of bonus in the form of shares of the Bank. The liability of the Bank in respect of this scheme is fixed and isapproved each year by the Board of Directors of the Bank. The scheme for each year is managed by a separate Trust formedfor this purpose.
Note 2010 2009----- (Rupees in ‘000) -----
19.2 Provision against off - balance sheet obligations
Opening balance 682,141 651,697
Charge during the year 29 - 20,250Transfers during the year - 10,194
- 30,444Payments during the year (12,250) -
669,891 682,141
19.3 Deferred liabilities
Provision for post retirement medical benefits 36.4 1,139,616 1,147,095Provision for gratuity 296,671 219,411Provision for compensated absences 36.4 677,152 731,908
2,113,439 2,098,414
19.4 Unrealized gain / (loss) on derivative financial instruments
Note Contract/ notional amount Unrealised gain / (loss)2010 2009 2010 2009
------------------------------- (Rupees in '000) -------------------------------
Derivatives held for trading- Interest rate swaps 6,985,703 11,014,381 (111,793) (187,593)- Cross currency swaps 35,570,843 36,372,837 51,100 143,894- Swaptions - 2,527,248 - (14,044)- Fx options 4,110,884 821,070 - -- Forward sale contracts of
government securities 441,981 - 514 -19.4.1 47,109,411 50,735,536 (60,179) (57,743)
Note 2010 2009----- (Rupees in ‘000) -----
19.4.1 Unrealized loss on derivative financial instruments - net
Unrealized gain on derivative financial instruments 13 693,675 499,671Unrealized loss on derivative financial instruments 19 (753,854) (557,414)
23.2 (60,179) (57,743)

United Bank Limited66
[ Notes to and forming part of the UnconsolidatedFinancial Statements For the year ended December 31, 2010 ]
20. SHARE CAPITAL
20.1 Authorized Capital
2010 2009 2010 2009(Number of shares) ----- (Rupees in ‘000) -----
2,000,000,000 2,000,000,000 Ordinary shares of Rs.10 each 20,000,000 20,000,000
20.2 Issued, subscribed and paid-up capital
Fully paid-up ordinary shares of Rs. 10 each
2010 2009(Number of shares)
Fully paid-up ordinary shares of Rs.10 each518,000,000 518,000,000 Issued for cash 5,180,000 5,180,000706,179,687 594,890,625 Issued as bonus shares 7,061,798 5,948,907
1,224,179,687 1,112,890,625 12,241,798 11,128,907
20.3 During the year 2007, the Bank was admitted to the official list of the UK Listing Authority and to the London Stock ExchangeProfessional Securities Market for trading of Global Depository Receipts (GDRs), each representing four ordinary equity sharesissued by the Bank. The GDRs constitute an offering in the United States only to qualified institutional buyers in reliance onRule 144A under the U.S Securities Act of 1933 and an offering outside the United States in reliance on Regulation S.
Holders of GDRs are entitled, subject to the provision of the depository agreement, to receive dividends, if any, and rank paripassu with other equity shareholders in respect of such entitlement to receive dividends. However, the holders of GDRs haveno voting rights or other direct rights of shareholders with respect to the equity shares underlying such GDRs. Subject to theterms and restrictions set out in the offering circular dated June 25, 2007, the deposited equity shares in respect of whichthe GDRs were issued may be withdrawn from the depository facility. Upon withdrawal, the holders will rank pari passu withother equity shareholders in respect of voting powers. As at December 31, 2010: 78,503,082 (2009: 92,519,435) GDR shareswere in issue.
20.4 Major shareholders (holding more than 5% of total paid-up capital)
2010 2009Number of Percentage of Number of Percentage of
Name of shareholders shares held shareholding shares held shareholding
Government of Pakistan 238,567,381 19.49% 216,879,438 19.49%Bestway (Holdings) Limited 222,775,183 18.20% 202,522,894 18.20%Bestway Cement Limited 93,649,744 7.65% 85,136,131 7.65%His Highness Shaikh Nahayan Mabarak Al Nahayan 78,942,102 6.45% 71,765,548 6.45%H.E. Dr. Mana'a Saeed Al Otaiba 67,492,392 5.51% 61,356,720 5.51%Sir Mohammed Anwar Pervez, OBE, HPk 62,433,163 5.10% 56,757,421 5.10%
As at December 31, 2010 the Abu Dhabi Group (ADG) held 30.30% (2009: 30.30%) shareholding (including GDRs) and theBestway Group (Bestway) held 31.07% (2009: 31.07%) shareholding of the Bank.
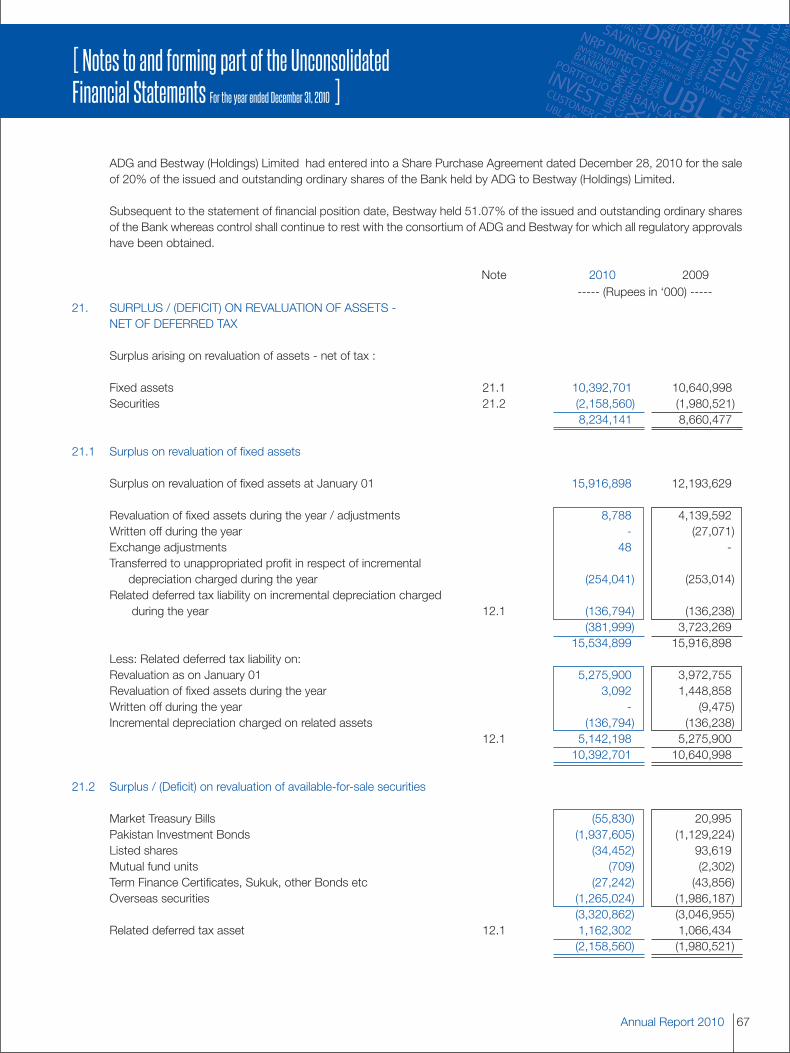
67Annual Report 2010
[ Notes to and forming part of the UnconsolidatedFinancial Statements For the year ended December 31, 2010 ]
ADG and Bestway (Holdings) Limited had entered into a Share Purchase Agreement dated December 28, 2010 for the saleof 20% of the issued and outstanding ordinary shares of the Bank held by ADG to Bestway (Holdings) Limited.
Subsequent to the statement of financial position date, Bestway held 51.07% of the issued and outstanding ordinary sharesof the Bank whereas control shall continue to rest with the consortium of ADG and Bestway for which all regulatory approvalshave been obtained.
Note 2010 2009----- (Rupees in ‘000) -----
21. SURPLUS / (DEFICIT) ON REVALUATION OF ASSETS -NET OF DEFERRED TAX
Surplus arising on revaluation of assets - net of tax :
Fixed assets 21.1 10,392,701 10,640,998Securities 21.2 (2,158,560) (1,980,521)
8,234,141 8,660,477
21.1 Surplus on revaluation of fixed assets
Surplus on revaluation of fixed assets at January 01 15,916,898 12,193,629
Revaluation of fixed assets during the year / adjustments 8,788 4,139,592Written off during the year - (27,071)Exchange adjustments 48 -Transferred to unappropriated profit in respect of incremental
depreciation charged during the year (254,041) (253,014)Related deferred tax liability on incremental depreciation charged
during the year 12.1 (136,794) (136,238)(381,999) 3,723,269
15,534,899 15,916,898Less: Related deferred tax liability on:Revaluation as on January 01 5,275,900 3,972,755Revaluation of fixed assets during the year 3,092 1,448,858Written off during the year - (9,475)Incremental depreciation charged on related assets (136,794) (136,238)
12.1 5,142,198 5,275,90010,392,701 10,640,998
21.2 Surplus / (Deficit) on revaluation of available-for-sale securities
Market Treasury Bills (55,830) 20,995Pakistan Investment Bonds (1,937,605) (1,129,224)Listed shares (34,452) 93,619Mutual fund units (709) (2,302)Term Finance Certificates, Sukuk, other Bonds etc (27,242) (43,856)Overseas securities (1,265,024) (1,986,187)
(3,320,862) (3,046,955)Related deferred tax asset 12.1 1,162,302 1,066,434
(2,158,560) (1,980,521)
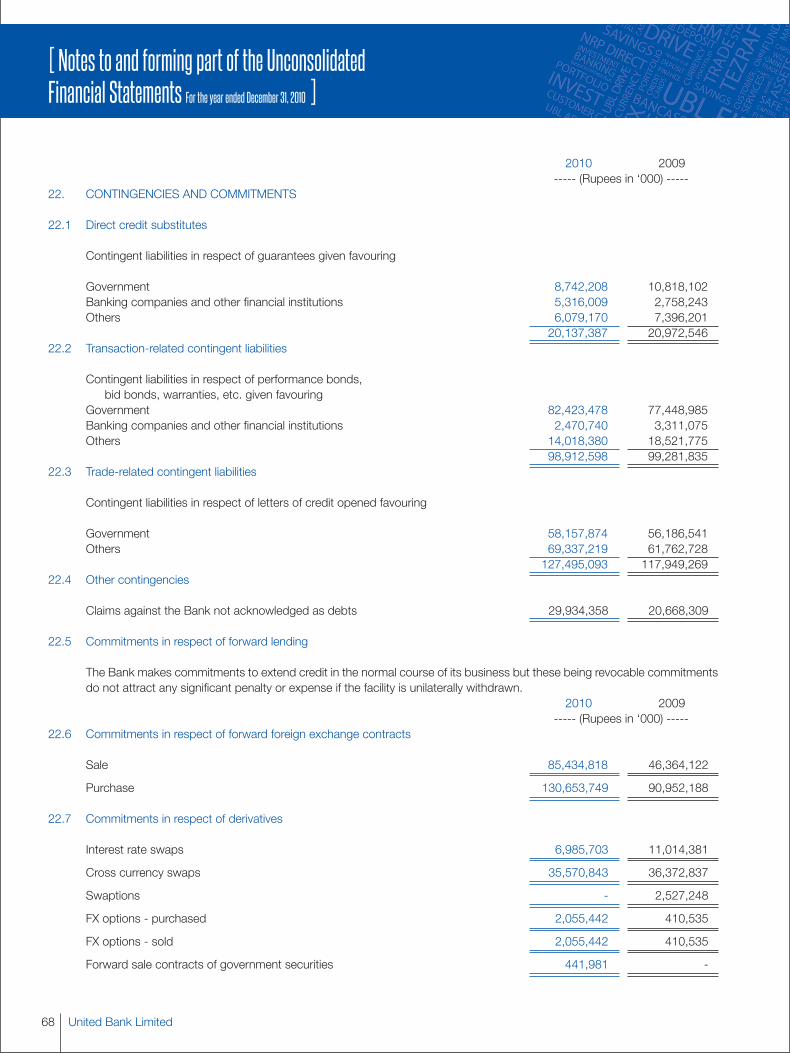
United Bank Limited68
[ Notes to and forming part of the UnconsolidatedFinancial Statements For the year ended December 31, 2010 ]
2010 2009----- (Rupees in ‘000) -----
22. CONTINGENCIES AND COMMITMENTS
22.1 Direct credit substitutes
Contingent liabilities in respect of guarantees given favouring
Government 8,742,208 10,818,102Banking companies and other financial institutions 5,316,009 2,758,243Others 6,079,170 7,396,201
20,137,387 20,972,54622.2 Transaction-related contingent liabilities
Contingent liabilities in respect of performance bonds,bid bonds, warranties, etc. given favouring
Government 82,423,478 77,448,985Banking companies and other financial institutions 2,470,740 3,311,075Others 14,018,380 18,521,775
98,912,598 99,281,83522.3 Trade-related contingent liabilities
Contingent liabilities in respect of letters of credit opened favouring
Government 58,157,874 56,186,541Others 69,337,219 61,762,728
127,495,093 117,949,26922.4 Other contingencies
Claims against the Bank not acknowledged as debts 29,934,358 20,668,309
22.5 Commitments in respect of forward lending
The Bank makes commitments to extend credit in the normal course of its business but these being revocable commitmentsdo not attract any significant penalty or expense if the facility is unilaterally withdrawn.
2010 2009----- (Rupees in ‘000) -----
22.6 Commitments in respect of forward foreign exchange contracts
Sale 85,434,818 46,364,122
Purchase 130,653,749 90,952,188
22.7 Commitments in respect of derivatives
Interest rate swaps 6,985,703 11,014,381
Cross currency swaps 35,570,843 36,372,837
Swaptions - 2,527,248
FX options - purchased 2,055,442 410,535
FX options - sold 2,055,442 410,535
Forward sale contracts of government securities 441,981 -
69Annual Report 2010
[ Notes to and forming part of the UnconsolidatedFinancial Statements For the year ended December 31, 2010 ]
2010 2009----- (Rupees in ‘000) -----
22.8 Commitments in respect of capital expenditure 571,403 567,882
22.9 For contingencies relating to taxation refer note 13.1
23. DERIVATIVE INSTRUMENTS
Derivatives are a type of financial contract, the value of which is determined by reference to one or more underlying assets orindices. The major categories of such contracts include forwards, futures, swaps and options. Derivatives also includestructured financial products that have one or more characteristics of forwards, futures, swaps and options.
The Bank as an Authorized Derivative Dealer (ADD) is an active participant in the Pakistan derivatives market. Although theADD license covers the below mentioned transactions only (permitted under Financial Derivatives Business Regulations issuedby the SBP), the Bank offers a wide variety of derivative products to satisfy customers’ needs, specific approval for which issought from the SBP on a transaction by transaction basis:
(a) Foreign Currency Options(b) Forward Rate Agreements(c) Interest Rate Swaps(d) Cross Currency Swaps(e) Equity indices(f) Commodity options
These transactions cover the aspects of both market making and hedging.
The authority for approving policies lies with the Board of Directors (BoD) and Board Risk Management Committee (BRMC),who has delegated its powers to the Market Risk Committee (MRC).
With regard to derivatives, the MRC is authorized to:
- Review the derivatives business with reference to market risk exposure and assign various limits in accordance with therisk appetite of the Bank
- Review and approve the Derivatives Business Policy
- Review and sign off derivatives product programs
- Authorize changes in procedures and processes regarding derivatives and structured products
Overall responsibility for derivatives trading activity lies with the Treasury and Capital Markets Group (TCM). Identifying andquantifying market risk on derivatives, coordinating approvals on temporary or permanent market risk limits, formulation ofpolicies and procedures with respect to market risk arising from derivatives, formal monitoring of market and credit riskexposure and limits and its reporting to the senior management and BoD is done by the Treasury and Market Risk (TMR)Department. Treasury Operations records derivative activity in the Bank’s books, and handles its reporting to the SBP.
United Bank Limited70
Derivative Risk Management
There are a number of risks undertaken by the Bank, which need to be monitored and assessed, and they include:
Credit Risk
Credit risk refers to the risk of non-performance or default by a party (a customer, guarantor, trade counterparty, third party,etc.), resulting in an adverse impact on the Bank’s profitability. Credit risk associated with derivative transactions is categorizedinto settlement risk and pre-settlement risk. Credit limit proposals for derivative transactions are reviewed by Head Market andTreasury Risk who recomends the appropriate limits to the Credit Committee for approval. Credit exposure of eachcounterparty is estimated and monitored by Treasury Middle Office on daily basis. Settlement risk is also mitigated by nettingoff the amounts receivable and payable i.e., the net amount is either received or paid.
Market Risk
The Bank, as a policy, hedges back-to-back all Options transactions. The Bank also does not carry any exchange risk onits Cross Currency Swaps portfolio as it hedges the exposure in the interbank market. To manage interest rate risk of InterestRate Derivatives the Bank has implemented various limits which are monitored and reported by Treasury Middle Office ondaily basis.
Liquidity Risk
Derivative transactions, usually being non-funded in nature, do not involve funds therefore there is no specific liquidity risk.
However, there is another aspect of liquidity which is the availability of certain instruments or hedges in the market. This isrelevant to the Pakistan market, as interest rate derivatives have a uni-directional demand, and no perfect hedge is available.The Bank mitigates its risk, on one side, by limiting the portfolio in terms of tenor, notional and sensitivity limits, and on theother side by taking on and off balance sheet positions in the interbank market, where available.
Operational Risk
The staff involved in the process of trading, settlement and risk management of derivatives are carefully trained to deal withthe complexities involved in the process. A state-of-the-art system has been put in place which handles derivative transactions.Each transaction is processed in accordance with the product program or transaction memo, which contains detailedaccounting and operational aspects of the transaction to further mitigate operational risk. In addition, the Treasury Middle Officeand the Compliance and Control Department are assigned the responsibility of monitoring any deviation from the policiesand procedures. The Bank’s Audit and Inspection Group also reviews this function, which covers regular review of systems,transactional processes, accounting practices, end-user roles and responsibilities.
[ Notes to and forming part of the UnconsolidatedFinancial Statements For the year ended December 31, 2010 ]
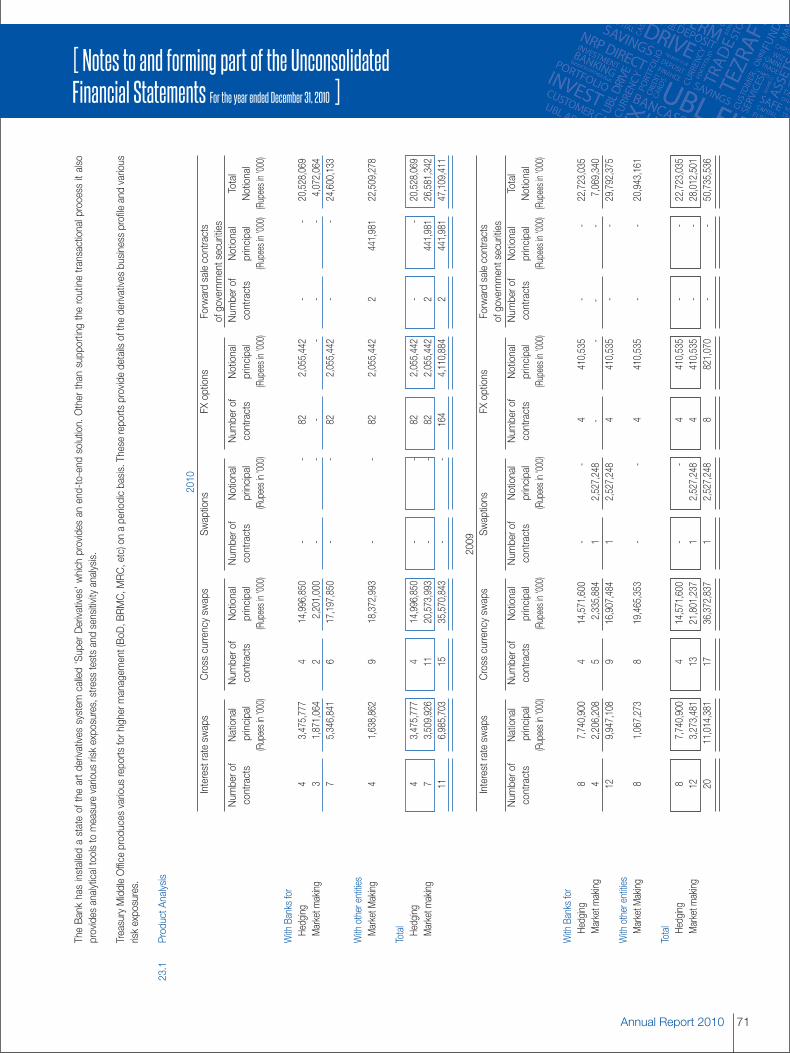
71Annual Report 2010
[ Notes to and forming part of the UnconsolidatedFinancial Statements For the year ended December 31, 2010 ]
TheBankhasinstalledastateoftheartderivativessystem
called'SuperDerivatives'whichprovidesanend-to-end
solution.Otherthansupportingtheroutinetransactionalprocessitalso
providesanalyticaltoolstomeasurevariousriskexposures,stresstestsandsensitivityanalysis.
TreasuryMiddleOfficeproducesvariousreportsforhigherm
anagement(BoD,BRMC,MRC,etc)onaperiodicbasis.Thesereportsprovidedetailsofthederivativesbusinessprofileandvarious
riskexposures.
23.1
ProductAnalysis
2010
Interestrateswaps
Crosscurrencyswaps
Swaptions
FXoptions
Forwardsalecontracts
ofgovernmentsecurities
Numberof
National
Numberof
Notional
Numberof
Notional
Numberof
Notional
Numberof
Notional
Total
contracts
principal
contracts
principal
contracts
principal
contracts
principal
contracts
principal
Notional
(Rupeesin'000)
(Rupeesin'000)
(Rupeesin'000)
(Rupeesin'000)
(Rupeesin'000)
(Rupeesin'000)
WithBanksfor
Hedging
43,475,777
414,996,850
--
822,055,442
--
20,528,069
Marketmaking
31,871,064
22,201,000
--
--
--
4,072,064
75,346,841
617,197,850
--
822,055,442
--
24,600,133
Withotherentities
MarketMaking
41,638,862
918,372,993
--
822,055,442
2441,981
22,509,278
Total
Hedging
43,475,777
414,996,850
--
822,055,442
--
20,528,069
Marketmaking
73,509,926
1120,573,993
--
822,055,442
2441,981
26,581,342
116,985,703
1535,570,843
--
164
4,110,884
2441,981
47,109,411
2009
Interestrateswaps
Crosscurrencyswaps
Swaptions
FXoptions
Forwardsalecontracts
ofgovernmentsecurities
Numberof
National
Numberof
Notional
Numberof
Notional
Numberof
Notional
Numberof
Notional
Total
contracts
principal
contracts
principal
contracts
principal
contracts
principal
contracts
principal
Notional
(Rupeesin'000)
(Rupeesin'000)
(Rupeesin'000)
(Rupeesin'000)
(Rupeesin'000)
(Rupeesin'000)
WithBanksfor
Hedging
87,740,900
414,571,600
--
4410,535
--
22,723,035
Marketmaking
42,206,208
52,335,884
12,527,248
--
--
7,069,340
129,947,108
916,907,484
12,527,248
4410,535
--
29,792,375
Withotherentities
MarketMaking
81,067,273
819,465,353
--
4410,535
--
20,943,161
Total Hedging
87,740,900
414,571,600
--
4410,535
--
22,723,035
Marketmaking
123,273,481
1321,801,237
12,527,248
4410,535
--
28,012,501
2011,014,381
1736,372,837
12,527,248
8821,070
--
50,735,536
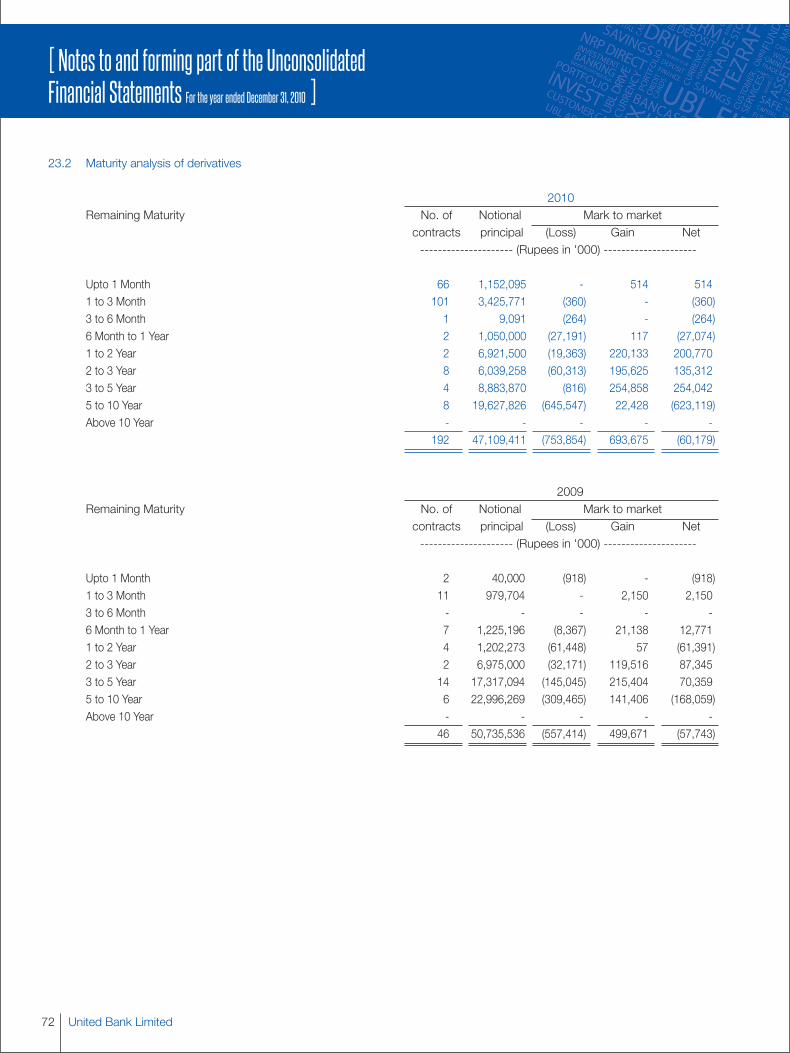
United Bank Limited72
[ Notes to and forming part of the UnconsolidatedFinancial Statements For the year ended December 31, 2010 ]
23.2 Maturity analysis of derivatives
2010Remaining Maturity No. of Notional Mark to market
contracts principal (Loss) Gain Net--------------------- (Rupees in '000) ---------------------
Upto 1 Month 66 1,152,095 - 514 5141 to 3 Month 101 3,425,771 (360) - (360)3 to 6 Month 1 9,091 (264) - (264)6 Month to 1 Year 2 1,050,000 (27,191) 117 (27,074)1 to 2 Year 2 6,921,500 (19,363) 220,133 200,7702 to 3 Year 8 6,039,258 (60,313) 195,625 135,3123 to 5 Year 4 8,883,870 (816) 254,858 254,0425 to 10 Year 8 19,627,826 (645,547) 22,428 (623,119)Above 10 Year - - - - -
192 47,109,411 (753,854) 693,675 (60,179)
2009Remaining Maturity No. of Notional Mark to market
contracts principal (Loss) Gain Net--------------------- (Rupees in '000) ---------------------
Upto 1 Month 2 40,000 (918) - (918)1 to 3 Month 11 979,704 - 2,150 2,1503 to 6 Month - - - - -6 Month to 1 Year 7 1,225,196 (8,367) 21,138 12,7711 to 2 Year 4 1,202,273 (61,448) 57 (61,391)2 to 3 Year 2 6,975,000 (32,171) 119,516 87,3453 to 5 Year 14 17,317,094 (145,045) 215,404 70,3595 to 10 Year 6 22,996,269 (309,465) 141,406 (168,059)Above 10 Year - - - - -
46 50,735,536 (557,414) 499,671 (57,743)
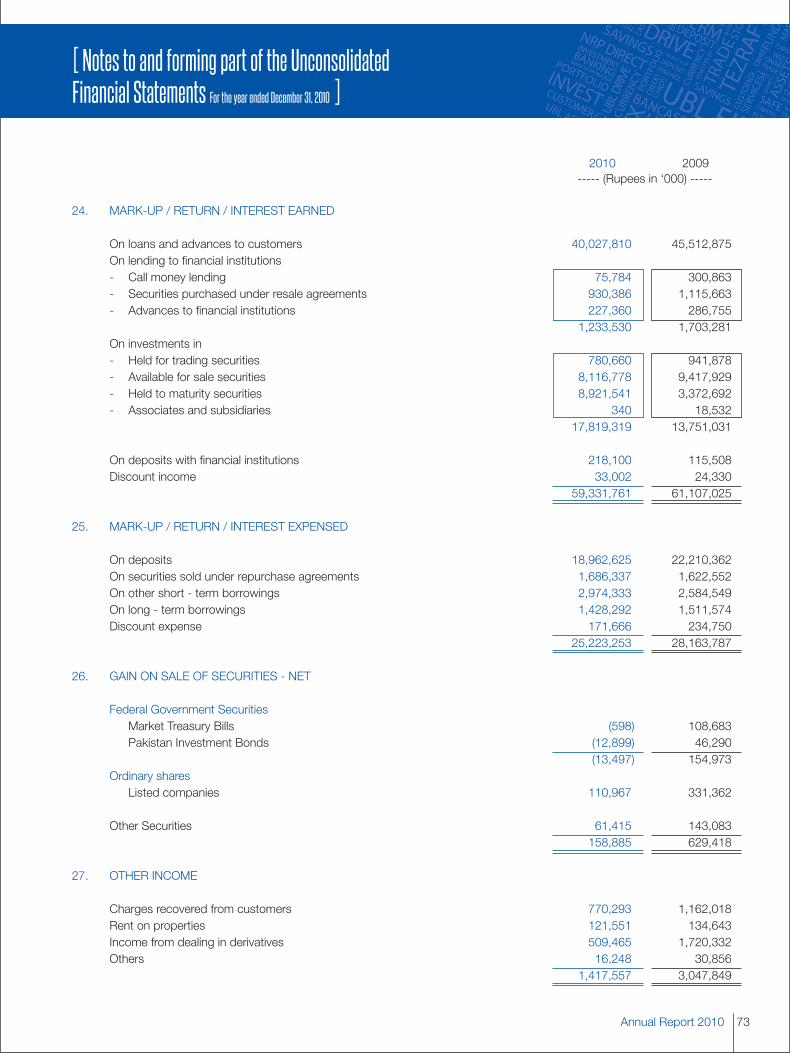
73Annual Report 2010
[ Notes to and forming part of the UnconsolidatedFinancial Statements For the year ended December 31, 2010 ]
2010 2009----- (Rupees in ‘000) -----
24. MARK-UP / RETURN / INTEREST EARNED
On loans and advances to customers 40,027,810 45,512,875On lending to financial institutions- Call money lending 75,784 300,863- Securities purchased under resale agreements 930,386 1,115,663- Advances to financial institutions 227,360 286,755
1,233,530 1,703,281On investments in- Held for trading securities 780,660 941,878- Available for sale securities 8,116,778 9,417,929- Held to maturity securities 8,921,541 3,372,692- Associates and subsidiaries 340 18,532
17,819,319 13,751,031
On deposits with financial institutions 218,100 115,508Discount income 33,002 24,330
59,331,761 61,107,025
25. MARK-UP / RETURN / INTEREST EXPENSED
On deposits 18,962,625 22,210,362On securities sold under repurchase agreements 1,686,337 1,622,552On other short - term borrowings 2,974,333 2,584,549On long - term borrowings 1,428,292 1,511,574Discount expense 171,666 234,750
25,223,253 28,163,787
26. GAIN ON SALE OF SECURITIES - NET
Federal Government SecuritiesMarket Treasury Bills (598) 108,683Pakistan Investment Bonds (12,899) 46,290
(13,497) 154,973Ordinary shares
Listed companies 110,967 331,362
Other Securities 61,415 143,083158,885 629,418
27. OTHER INCOME
Charges recovered from customers 770,293 1,162,018Rent on properties 121,551 134,643Income from dealing in derivatives 509,465 1,720,332Others 16,248 30,856
1,417,557 3,047,849
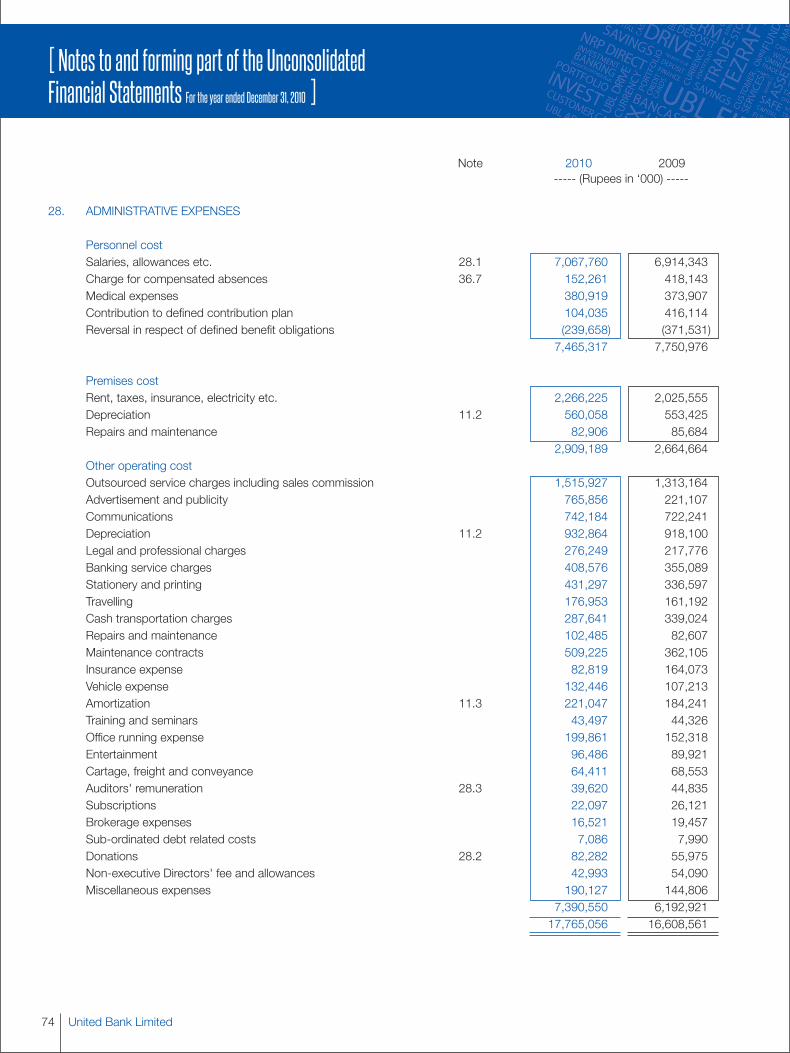
United Bank Limited74
[ Notes to and forming part of the UnconsolidatedFinancial Statements For the year ended December 31, 2010 ]
Note 2010 2009----- (Rupees in ‘000) -----
28. ADMINISTRATIVE EXPENSES
Personnel costSalaries, allowances etc. 28.1 7,067,760 6,914,343Charge for compensated absences 36.7 152,261 418,143Medical expenses 380,919 373,907Contribution to defined contribution plan 104,035 416,114Reversal in respect of defined benefit obligations (239,658) (371,531)
7,465,317 7,750,976
Premises costRent, taxes, insurance, electricity etc. 2,266,225 2,025,555Depreciation 11.2 560,058 553,425Repairs and maintenance 82,906 85,684
2,909,189 2,664,664Other operating costOutsourced service charges including sales commission 1,515,927 1,313,164Advertisement and publicity 765,856 221,107Communications 742,184 722,241Depreciation 11.2 932,864 918,100Legal and professional charges 276,249 217,776Banking service charges 408,576 355,089Stationery and printing 431,297 336,597Travelling 176,953 161,192Cash transportation charges 287,641 339,024Repairs and maintenance 102,485 82,607Maintenance contracts 509,225 362,105Insurance expense 82,819 164,073Vehicle expense 132,446 107,213Amortization 11.3 221,047 184,241Training and seminars 43,497 44,326Office running expense 199,861 152,318Entertainment 96,486 89,921Cartage, freight and conveyance 64,411 68,553Auditors' remuneration 28.3 39,620 44,835Subscriptions 22,097 26,121Brokerage expenses 16,521 19,457Sub-ordinated debt related costs 7,086 7,990Donations 28.2 82,282 55,975Non-executive Directors' fee and allowances 42,993 54,090Miscellaneous expenses 190,127 144,806
7,390,550 6,192,92117,765,056 16,608,561
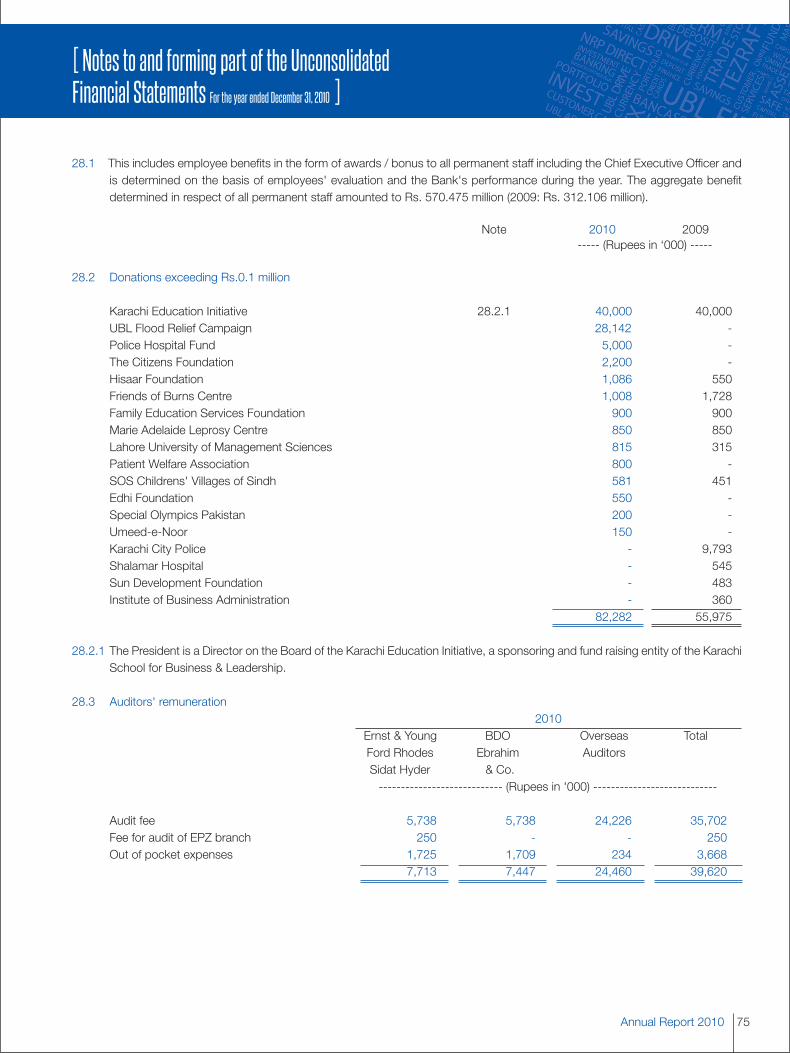
75Annual Report 2010
[ Notes to and forming part of the UnconsolidatedFinancial Statements For the year ended December 31, 2010 ]
28.1 This includes employee benefits in the form of awards / bonus to all permanent staff including the Chief Executive Officer andis determined on the basis of employees' evaluation and the Bank's performance during the year. The aggregate benefitdetermined in respect of all permanent staff amounted to Rs. 570.475 million (2009: Rs. 312.106 million).
Note 2010 2009----- (Rupees in ‘000) -----
28.2 Donations exceeding Rs.0.1 million
Karachi Education Initiative 28.2.1 40,000 40,000UBL Flood Relief Campaign 28,142 -Police Hospital Fund 5,000 -The Citizens Foundation 2,200 -Hisaar Foundation 1,086 550Friends of Burns Centre 1,008 1,728Family Education Services Foundation 900 900Marie Adelaide Leprosy Centre 850 850Lahore University of Management Sciences 815 315Patient Welfare Association 800 -SOS Childrens' Villages of Sindh 581 451Edhi Foundation 550 -Special Olympics Pakistan 200 -Umeed-e-Noor 150 -Karachi City Police - 9,793Shalamar Hospital - 545Sun Development Foundation - 483Institute of Business Administration - 360
82,282 55,975
28.2.1 The President is a Director on the Board of the Karachi Education Initiative, a sponsoring and fund raising entity of the KarachiSchool for Business & Leadership.
28.3 Auditors' remuneration2010
Ernst & Young BDO Overseas TotalFord Rhodes Ebrahim AuditorsSidat Hyder & Co.---------------------------- (Rupees in '000) ----------------------------
Audit fee 5,738 5,738 24,226 35,702Fee for audit of EPZ branch 250 - - 250Out of pocket expenses 1,725 1,709 234 3,668
7,713 7,447 24,460 39,620
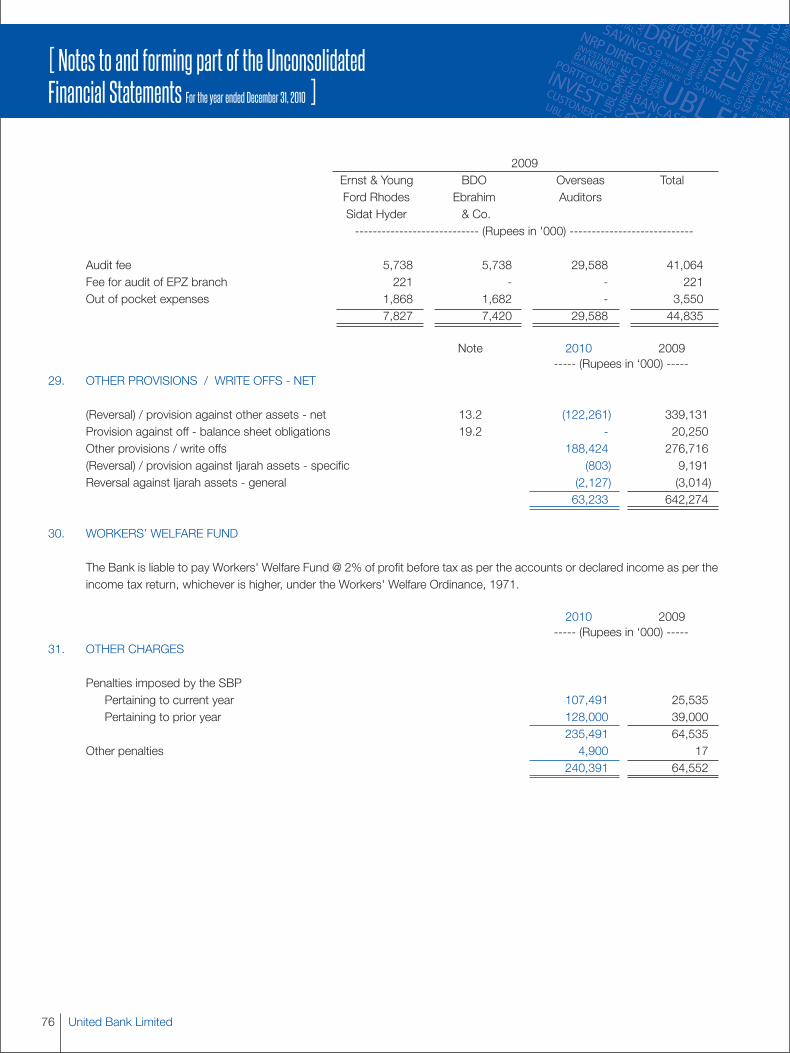
United Bank Limited76
[ Notes to and forming part of the UnconsolidatedFinancial Statements For the year ended December 31, 2010 ]
2009Ernst & Young BDO Overseas TotalFord Rhodes Ebrahim AuditorsSidat Hyder & Co.---------------------------- (Rupees in '000) ----------------------------
Audit fee 5,738 5,738 29,588 41,064Fee for audit of EPZ branch 221 - - 221Out of pocket expenses 1,868 1,682 - 3,550
7,827 7,420 29,588 44,835
Note 2010 2009----- (Rupees in ‘000) -----
29. OTHER PROVISIONS / WRITE OFFS - NET
(Reversal) / provision against other assets - net 13.2 (122,261) 339,131Provision against off - balance sheet obligations 19.2 - 20,250Other provisions / write offs 188,424 276,716(Reversal) / provision against Ijarah assets - specific (803) 9,191Reversal against Ijarah assets - general (2,127) (3,014)
63,233 642,274
30. WORKERS’ WELFARE FUND
The Bank is liable to pay Workers' Welfare Fund @ 2% of profit before tax as per the accounts or declared income as per theincome tax return, whichever is higher, under the Workers' Welfare Ordinance, 1971.
2010 2009----- (Rupees in ‘000) -----
31. OTHER CHARGES
Penalties imposed by the SBPPertaining to current year 107,491 25,535Pertaining to prior year 128,000 39,000
235,491 64,535Other penalties 4,900 17
240,391 64,552
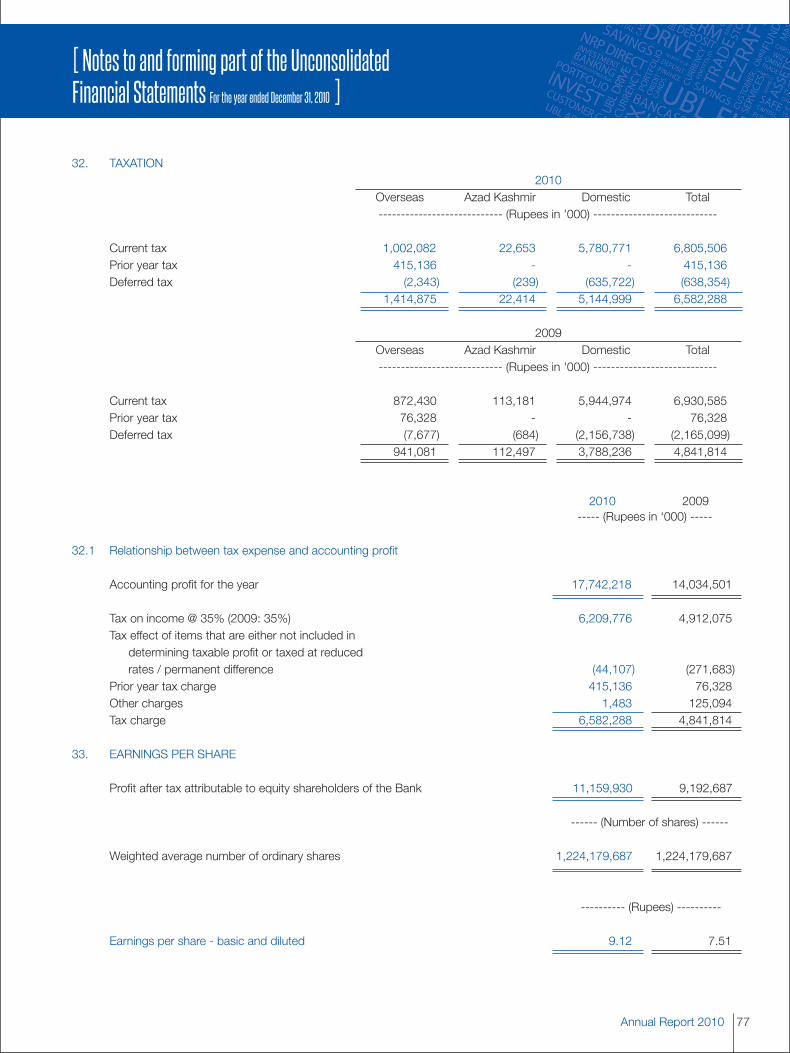
77Annual Report 2010
[ Notes to and forming part of the UnconsolidatedFinancial Statements For the year ended December 31, 2010 ]
32. TAXATION2010
Overseas Azad Kashmir Domestic Total---------------------------- (Rupees in '000) ----------------------------
Current tax 1,002,082 22,653 5,780,771 6,805,506Prior year tax 415,136 - - 415,136Deferred tax (2,343) (239) (635,722) (638,354)
1,414,875 22,414 5,144,999 6,582,288
2009Overseas Azad Kashmir Domestic Total---------------------------- (Rupees in '000) ----------------------------
Current tax 872,430 113,181 5,944,974 6,930,585Prior year tax 76,328 - - 76,328Deferred tax (7,677) (684) (2,156,738) (2,165,099)
941,081 112,497 3,788,236 4,841,814
2010 2009----- (Rupees in ‘000) -----
32.1 Relationship between tax expense and accounting profit
Accounting profit for the year 17,742,218 14,034,501
Tax on income @ 35% (2009: 35%) 6,209,776 4,912,075Tax effect of items that are either not included in
determining taxable profit or taxed at reducedrates / permanent difference (44,107) (271,683)
Prior year tax charge 415,136 76,328Other charges 1,483 125,094Tax charge 6,582,288 4,841,814
33. EARNINGS PER SHARE
Profit after tax attributable to equity shareholders of the Bank 11,159,930 9,192,687
------ (Number of shares) ------
Weighted average number of ordinary shares 1,224,179,687 1,224,179,687
---------- (Rupees) ----------
Earnings per share - basic and diluted 9.12 7.51
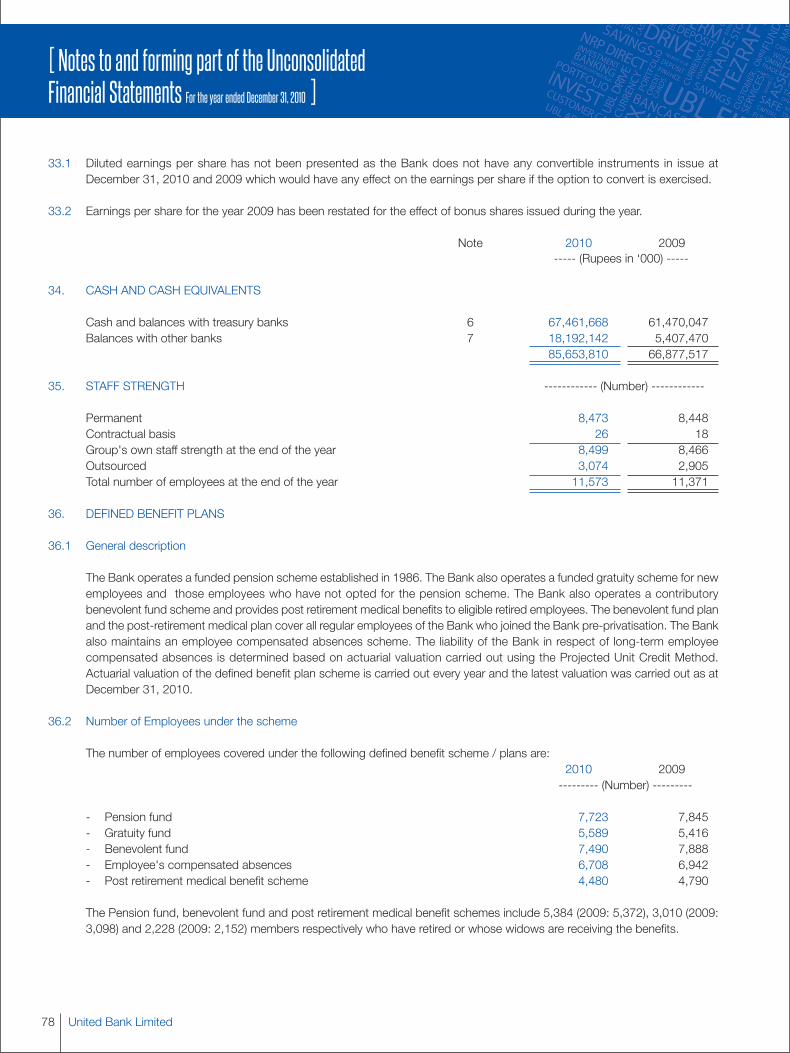
United Bank Limited78
[ Notes to and forming part of the UnconsolidatedFinancial Statements For the year ended December 31, 2010 ]
33.1 Diluted earnings per share has not been presented as the Bank does not have any convertible instruments in issue atDecember 31, 2010 and 2009 which would have any effect on the earnings per share if the option to convert is exercised.
33.2 Earnings per share for the year 2009 has been restated for the effect of bonus shares issued during the year.
Note 2010 2009----- (Rupees in ‘000) -----
34. CASH AND CASH EQUIVALENTS
Cash and balances with treasury banks 6 67,461,668 61,470,047Balances with other banks 7 18,192,142 5,407,470
85,653,810 66,877,517
35. STAFF STRENGTH ------------ (Number) ------------
Permanent 8,473 8,448Contractual basis 26 18Group's own staff strength at the end of the year 8,499 8,466Outsourced 3,074 2,905Total number of employees at the end of the year 11,573 11,371
36. DEFINED BENEFIT PLANS
36.1 General description
The Bank operates a funded pension scheme established in 1986. The Bank also operates a funded gratuity scheme for newemployees and those employees who have not opted for the pension scheme. The Bank also operates a contributorybenevolent fund scheme and provides post retirement medical benefits to eligible retired employees. The benevolent fund planand the post-retirement medical plan cover all regular employees of the Bank who joined the Bank pre-privatisation. The Bankalso maintains an employee compensated absences scheme. The liability of the Bank in respect of long-term employeecompensated absences is determined based on actuarial valuation carried out using the Projected Unit Credit Method.Actuarial valuation of the defined benefit plan scheme is carried out every year and the latest valuation was carried out as atDecember 31, 2010.
36.2 Number of Employees under the scheme
The number of employees covered under the following defined benefit scheme / plans are:2010 2009--------- (Number) ---------
- Pension fund 7,723 7,845- Gratuity fund 5,589 5,416- Benevolent fund 7,490 7,888- Employee's compensated absences 6,708 6,942- Post retirement medical benefit scheme 4,480 4,790
The Pension fund, benevolent fund and post retirement medical benefit schemes include 5,384 (2009: 5,372), 3,010 (2009:3,098) and 2,228 (2009: 2,152) members respectively who have retired or whose widows are receiving the benefits.
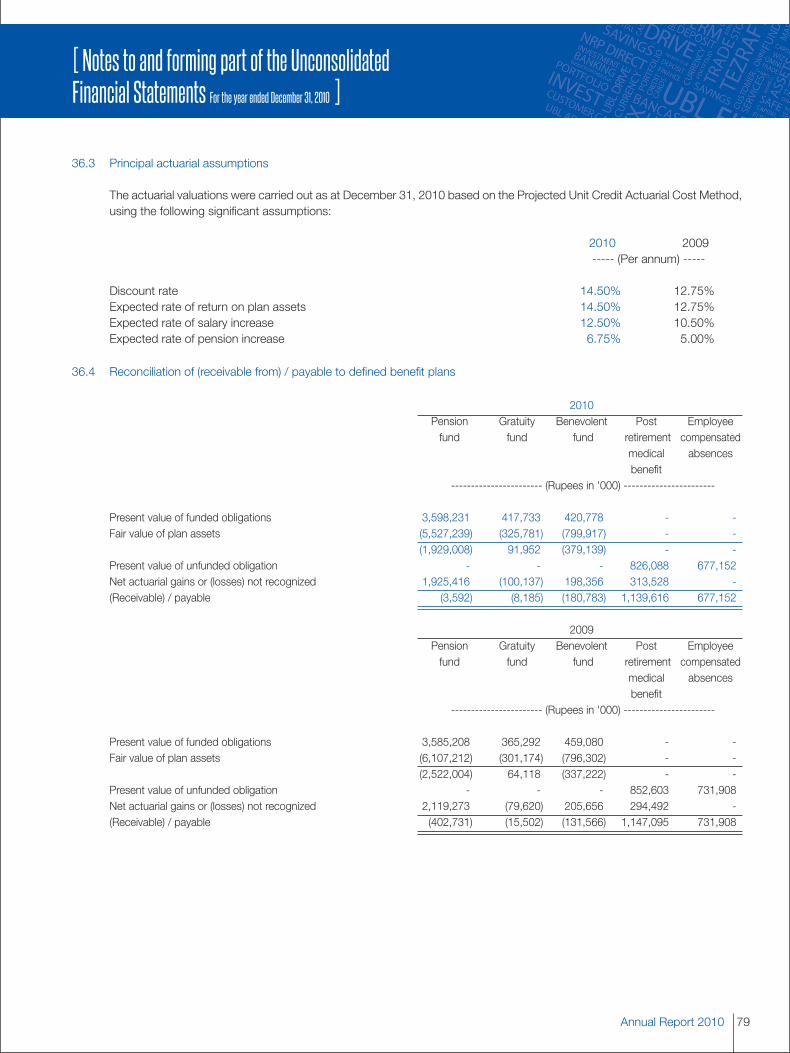
79Annual Report 2010
[ Notes to and forming part of the UnconsolidatedFinancial Statements For the year ended December 31, 2010 ]
36.3 Principal actuarial assumptions
The actuarial valuations were carried out as at December 31, 2010 based on the Projected Unit Credit Actuarial Cost Method,using the following significant assumptions:
2010 2009----- (Per annum) -----
Discount rate 14.50% 12.75%Expected rate of return on plan assets 14.50% 12.75%Expected rate of salary increase 12.50% 10.50%Expected rate of pension increase 6.75% 5.00%
36.4 Reconciliation of (receivable from) / payable to defined benefit plans
2010Pension Gratuity Benevolent Post Employeefund fund fund retirement compensated
medical absencesbenefit
----------------------- (Rupees in '000) -----------------------
Present value of funded obligations 3,598,231 417,733 420,778 - -Fair value of plan assets (5,527,239) (325,781) (799,917) - -
(1,929,008) 91,952 (379,139) - -Present value of unfunded obligation - - - 826,088 677,152Net actuarial gains or (losses) not recognized 1,925,416 (100,137) 198,356 313,528 -(Receivable) / payable (3,592) (8,185) (180,783) 1,139,616 677,152
2009Pension Gratuity Benevolent Post Employeefund fund fund retirement compensated
medical absencesbenefit
----------------------- (Rupees in '000) -----------------------
Present value of funded obligations 3,585,208 365,292 459,080 - -Fair value of plan assets (6,107,212) (301,174) (796,302) - -
(2,522,004) 64,118 (337,222) - -Present value of unfunded obligation - - - 852,603 731,908Net actuarial gains or (losses) not recognized 2,119,273 (79,620) 205,656 294,492 -(Receivable) / payable (402,731) (15,502) (131,566) 1,147,095 731,908
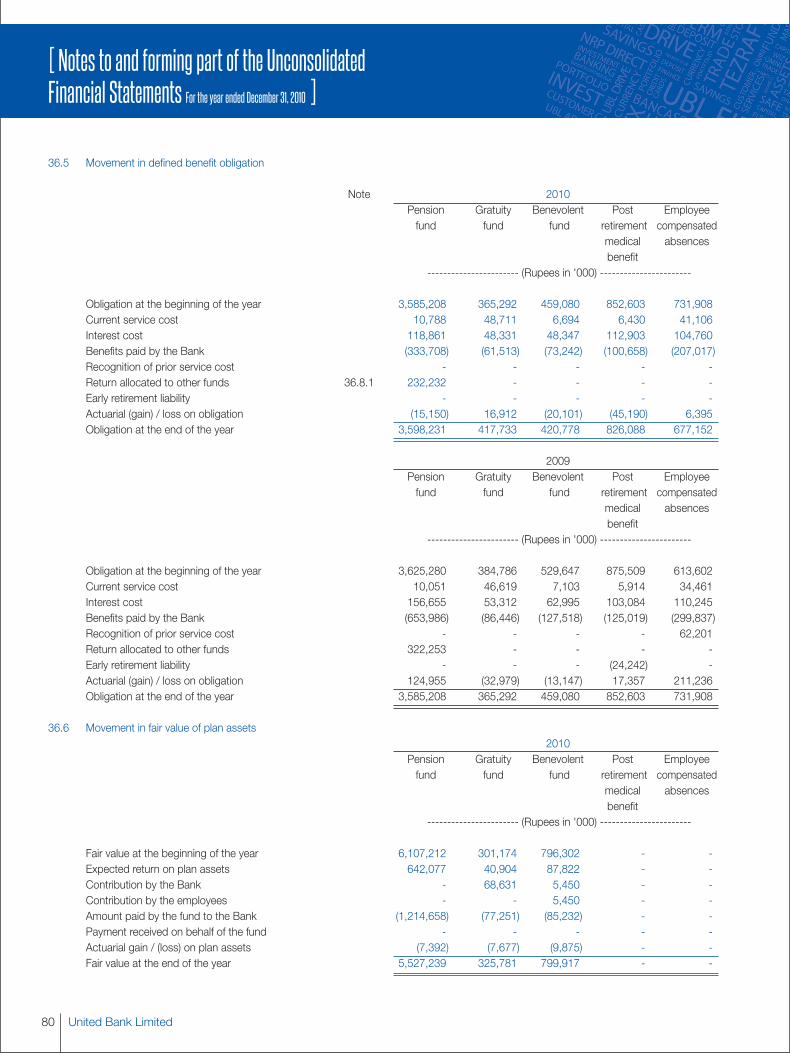
United Bank Limited80
[ Notes to and forming part of the UnconsolidatedFinancial Statements For the year ended December 31, 2010 ]
36.5 Movement in defined benefit obligation
Note 2010Pension Gratuity Benevolent Post Employeefund fund fund retirement compensated
medical absencesbenefit
----------------------- (Rupees in '000) -----------------------
Obligation at the beginning of the year 3,585,208 365,292 459,080 852,603 731,908Current service cost 10,788 48,711 6,694 6,430 41,106Interest cost 118,861 48,331 48,347 112,903 104,760Benefits paid by the Bank (333,708) (61,513) (73,242) (100,658) (207,017)Recognition of prior service cost - - - - -Return allocated to other funds 36.8.1 232,232 - - - -Early retirement liability - - - - -Actuarial (gain) / loss on obligation (15,150) 16,912 (20,101) (45,190) 6,395Obligation at the end of the year 3,598,231 417,733 420,778 826,088 677,152
2009Pension Gratuity Benevolent Post Employeefund fund fund retirement compensated
medical absencesbenefit
----------------------- (Rupees in '000) -----------------------
Obligation at the beginning of the year 3,625,280 384,786 529,647 875,509 613,602Current service cost 10,051 46,619 7,103 5,914 34,461Interest cost 156,655 53,312 62,995 103,084 110,245Benefits paid by the Bank (653,986) (86,446) (127,518) (125,019) (299,837)Recognition of prior service cost - - - - 62,201Return allocated to other funds 322,253 - - - -Early retirement liability - - - (24,242) -Actuarial (gain) / loss on obligation 124,955 (32,979) (13,147) 17,357 211,236Obligation at the end of the year 3,585,208 365,292 459,080 852,603 731,908
36.6 Movement in fair value of plan assets2010
Pension Gratuity Benevolent Post Employeefund fund fund retirement compensated
medical absencesbenefit
----------------------- (Rupees in '000) -----------------------
Fair value at the beginning of the year 6,107,212 301,174 796,302 - -Expected return on plan assets 642,077 40,904 87,822 - -Contribution by the Bank - 68,631 5,450 - -Contribution by the employees - - 5,450 - -Amount paid by the fund to the Bank (1,214,658) (77,251) (85,232) - -Payment received on behalf of the fund - - - - -Actuarial gain / (loss) on plan assets (7,392) (7,677) (9,875) - -Fair value at the end of the year 5,527,239 325,781 799,917 - -
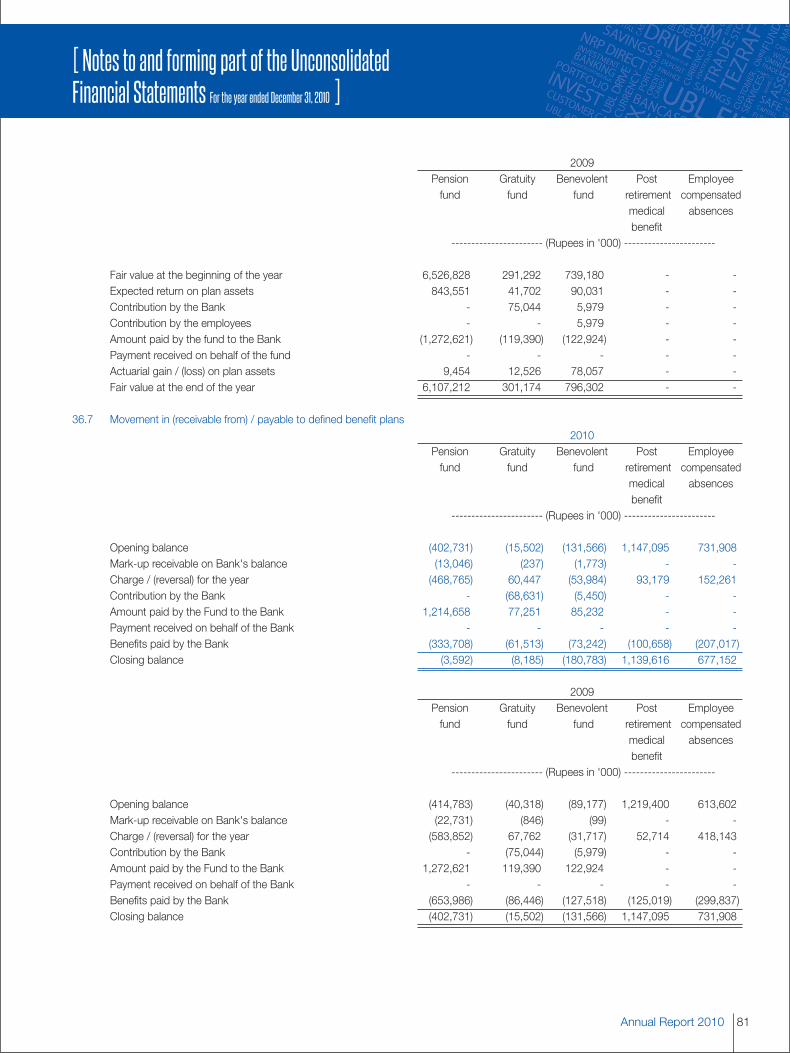
81Annual Report 2010
[ Notes to and forming part of the UnconsolidatedFinancial Statements For the year ended December 31, 2010 ]
2009Pension Gratuity Benevolent Post Employeefund fund fund retirement compensated
medical absencesbenefit
----------------------- (Rupees in '000) -----------------------
Fair value at the beginning of the year 6,526,828 291,292 739,180 - -Expected return on plan assets 843,551 41,702 90,031 - -Contribution by the Bank - 75,044 5,979 - -Contribution by the employees - - 5,979 - -Amount paid by the fund to the Bank (1,272,621) (119,390) (122,924) - -Payment received on behalf of the fund - - - - -Actuarial gain / (loss) on plan assets 9,454 12,526 78,057 - -Fair value at the end of the year 6,107,212 301,174 796,302 - -
36.7 Movement in (receivable from) / payable to defined benefit plans2010
Pension Gratuity Benevolent Post Employeefund fund fund retirement compensated
medical absencesbenefit
----------------------- (Rupees in '000) -----------------------
Opening balance (402,731) (15,502) (131,566) 1,147,095 731,908Mark-up receivable on Bank's balance (13,046) (237) (1,773) - -Charge / (reversal) for the year (468,765) 60,447 (53,984) 93,179 152,261Contribution by the Bank - (68,631) (5,450) - -Amount paid by the Fund to the Bank 1,214,658 77,251 85,232 - -Payment received on behalf of the Bank - - - - -Benefits paid by the Bank (333,708) (61,513) (73,242) (100,658) (207,017)Closing balance (3,592) (8,185) (180,783) 1,139,616 677,152
2009Pension Gratuity Benevolent Post Employeefund fund fund retirement compensated
medical absencesbenefit
----------------------- (Rupees in '000) -----------------------
Opening balance (414,783) (40,318) (89,177) 1,219,400 613,602Mark-up receivable on Bank's balance (22,731) (846) (99) - -Charge / (reversal) for the year (583,852) 67,762 (31,717) 52,714 418,143Contribution by the Bank - (75,044) (5,979) - -Amount paid by the Fund to the Bank 1,272,621 119,390 122,924 - -Payment received on behalf of the Bank - - - - -Benefits paid by the Bank (653,986) (86,446) (127,518) (125,019) (299,837)Closing balance (402,731) (15,502) (131,566) 1,147,095 731,908
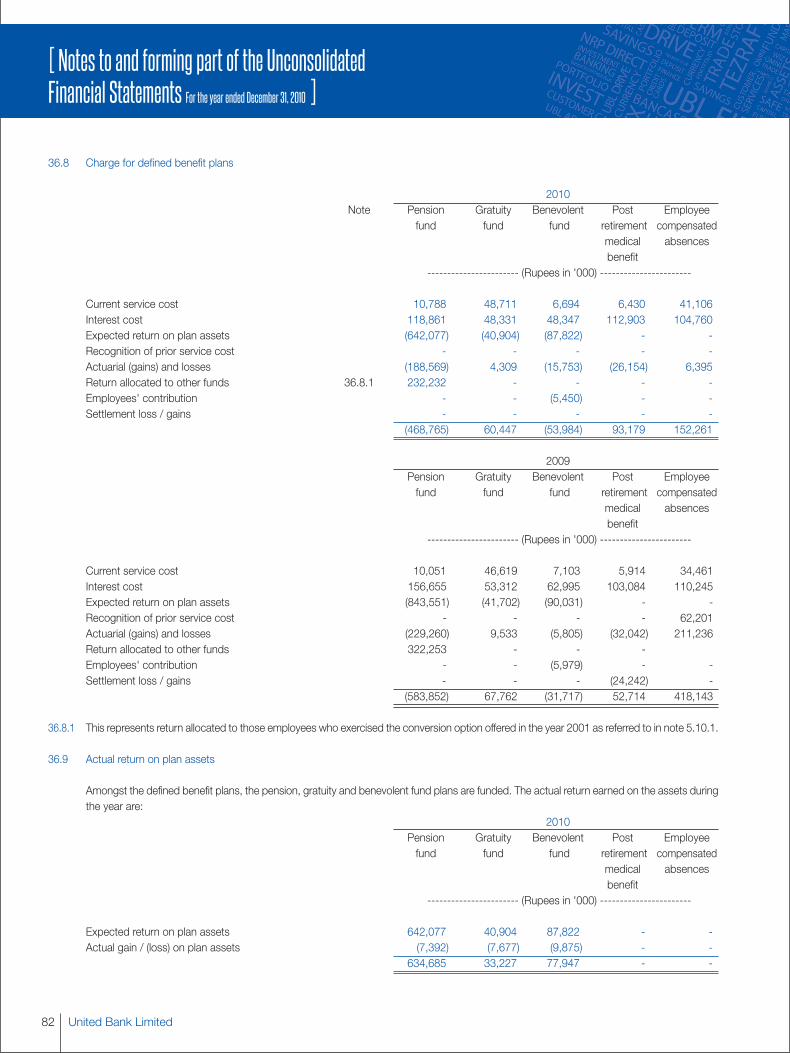
United Bank Limited82
[ Notes to and forming part of the UnconsolidatedFinancial Statements For the year ended December 31, 2010 ]
36.8 Charge for defined benefit plans
2010Note Pension Gratuity Benevolent Post Employee
fund fund fund retirement compensatedmedical absencesbenefit
----------------------- (Rupees in '000) -----------------------
Current service cost 10,788 48,711 6,694 6,430 41,106Interest cost 118,861 48,331 48,347 112,903 104,760Expected return on plan assets (642,077) (40,904) (87,822) - -Recognition of prior service cost - - - - -Actuarial (gains) and losses (188,569) 4,309 (15,753) (26,154) 6,395Return allocated to other funds 36.8.1 232,232 - - - -Employees' contribution - - (5,450) - -Settlement loss / gains - - - - -
(468,765) 60,447 (53,984) 93,179 152,261
2009Pension Gratuity Benevolent Post Employeefund fund fund retirement compensated
medical absencesbenefit
----------------------- (Rupees in '000) -----------------------
Current service cost 10,051 46,619 7,103 5,914 34,461Interest cost 156,655 53,312 62,995 103,084 110,245Expected return on plan assets (843,551) (41,702) (90,031) - -Recognition of prior service cost - - - - 62,201Actuarial (gains) and losses (229,260) 9,533 (5,805) (32,042) 211,236Return allocated to other funds 322,253 - - -Employees' contribution - - (5,979) - -Settlement loss / gains - - - (24,242) -
(583,852) 67,762 (31,717) 52,714 418,143
36.8.1 This represents return allocated to those employees who exercised the conversion option offered in the year 2001 as referred to in note 5.10.1.
36.9 Actual return on plan assets
Amongst the defined benefit plans, the pension, gratuity and benevolent fund plans are funded. The actual return earned on the assets duringthe year are:
2010Pension Gratuity Benevolent Post Employeefund fund fund retirement compensated
medical absencesbenefit
----------------------- (Rupees in '000) -----------------------
Expected return on plan assets 642,077 40,904 87,822 - -Actual gain / (loss) on plan assets (7,392) (7,677) (9,875) - -
634,685 33,227 77,947 - -
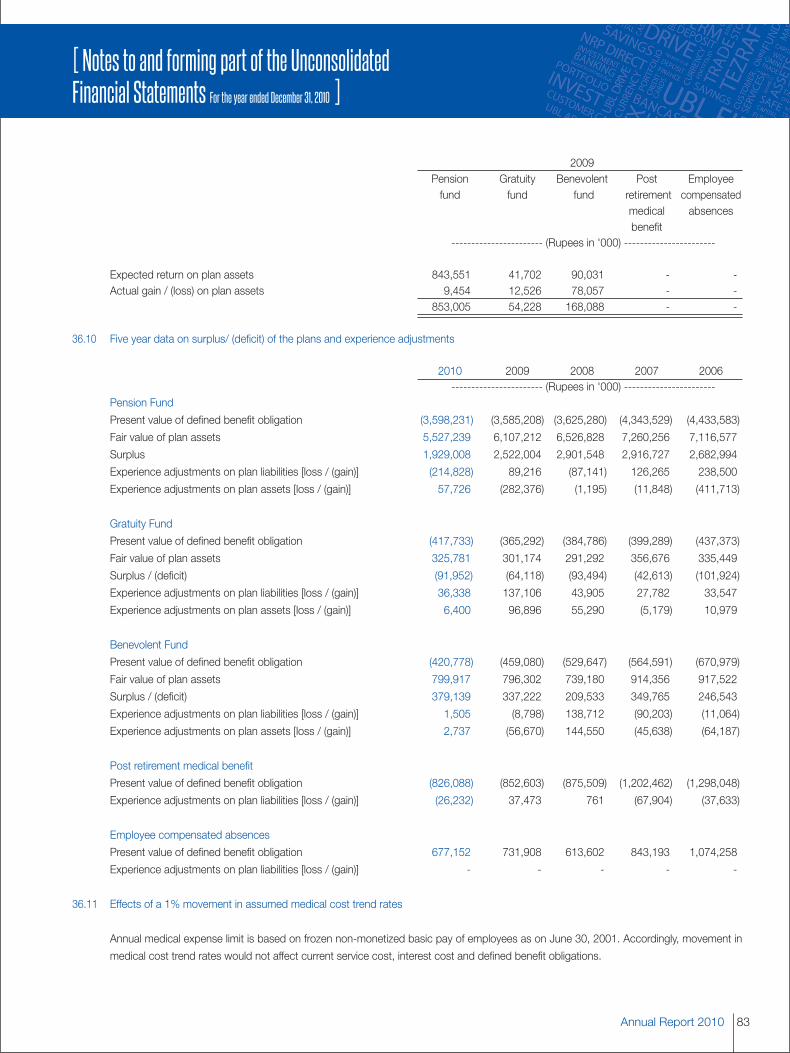
83Annual Report 2010
[ Notes to and forming part of the UnconsolidatedFinancial Statements For the year ended December 31, 2010 ]
2009Pension Gratuity Benevolent Post Employeefund fund fund retirement compensated
medical absencesbenefit
----------------------- (Rupees in '000) -----------------------
Expected return on plan assets 843,551 41,702 90,031 - -Actual gain / (loss) on plan assets 9,454 12,526 78,057 - -
853,005 54,228 168,088 - -
36.10 Five year data on surplus/ (deficit) of the plans and experience adjustments
2010 2009 2008 2007 2006----------------------- (Rupees in '000) -----------------------
Pension Fund
Present value of defined benefit obligation (3,598,231) (3,585,208) (3,625,280) (4,343,529) (4,433,583)
Fair value of plan assets 5,527,239 6,107,212 6,526,828 7,260,256 7,116,577
Surplus 1,929,008 2,522,004 2,901,548 2,916,727 2,682,994
Experience adjustments on plan liabilities [loss / (gain)] (214,828) 89,216 (87,141) 126,265 238,500
Experience adjustments on plan assets [loss / (gain)] 57,726 (282,376) (1,195) (11,848) (411,713)
Gratuity Fund
Present value of defined benefit obligation (417,733) (365,292) (384,786) (399,289) (437,373)
Fair value of plan assets 325,781 301,174 291,292 356,676 335,449
Surplus / (deficit) (91,952) (64,118) (93,494) (42,613) (101,924)
Experience adjustments on plan liabilities [loss / (gain)] 36,338 137,106 43,905 27,782 33,547
Experience adjustments on plan assets [loss / (gain)] 6,400 96,896 55,290 (5,179) 10,979
Benevolent Fund
Present value of defined benefit obligation (420,778) (459,080) (529,647) (564,591) (670,979)
Fair value of plan assets 799,917 796,302 739,180 914,356 917,522
Surplus / (deficit) 379,139 337,222 209,533 349,765 246,543
Experience adjustments on plan liabilities [loss / (gain)] 1,505 (8,798) 138,712 (90,203) (11,064)
Experience adjustments on plan assets [loss / (gain)] 2,737 (56,670) 144,550 (45,638) (64,187)
Post retirement medical benefit
Present value of defined benefit obligation (826,088) (852,603) (875,509) (1,202,462) (1,298,048)
Experience adjustments on plan liabilities [loss / (gain)] (26,232) 37,473 761 (67,904) (37,633)
Employee compensated absences
Present value of defined benefit obligation 677,152 731,908 613,602 843,193 1,074,258
Experience adjustments on plan liabilities [loss / (gain)] - - - - -
36.11 Effects of a 1% movement in assumed medical cost trend rates
Annual medical expense limit is based on frozen non-monetized basic pay of employees as on June 30, 2001. Accordingly, movement in
medical cost trend rates would not affect current service cost, interest cost and defined benefit obligations.
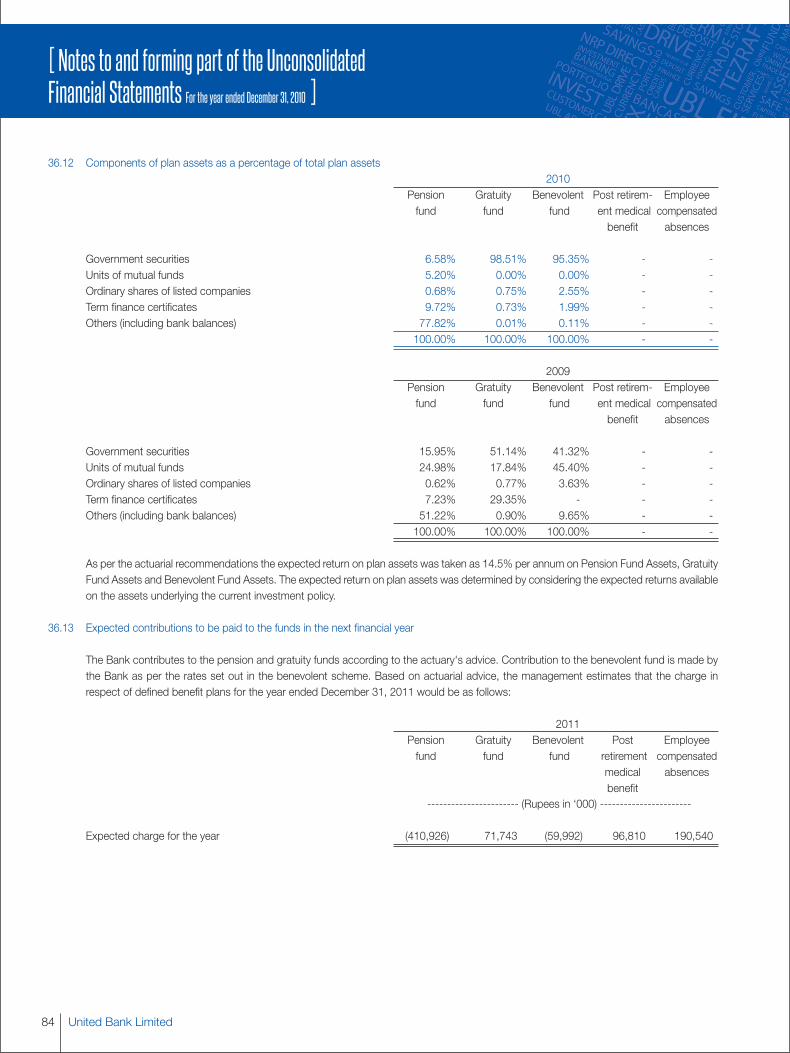
United Bank Limited84
[ Notes to and forming part of the UnconsolidatedFinancial Statements For the year ended December 31, 2010 ]
36.12 Components of plan assets as a percentage of total plan assets2010
Pension Gratuity Benevolent Post retirem- Employeefund fund fund ent medical compensated
benefit absences
Government securities 6.58% 98.51% 95.35% - -Units of mutual funds 5.20% 0.00% 0.00% - -Ordinary shares of listed companies 0.68% 0.75% 2.55% - -Term finance certificates 9.72% 0.73% 1.99% - -Others (including bank balances) 77.82% 0.01% 0.11% - -
100.00% 100.00% 100.00% - -
2009Pension Gratuity Benevolent Post retirem- Employeefund fund fund ent medical compensated
benefit absences
Government securities 15.95% 51.14% 41.32% - -Units of mutual funds 24.98% 17.84% 45.40% - -Ordinary shares of listed companies 0.62% 0.77% 3.63% - -Term finance certificates 7.23% 29.35% - - -Others (including bank balances) 51.22% 0.90% 9.65% - -
100.00% 100.00% 100.00% - -
As per the actuarial recommendations the expected return on plan assets was taken as 14.5% per annum on Pension Fund Assets, GratuityFund Assets and Benevolent Fund Assets. The expected return on plan assets was determined by considering the expected returns availableon the assets underlying the current investment policy.
36.13 Expected contributions to be paid to the funds in the next financial year
The Bank contributes to the pension and gratuity funds according to the actuary's advice. Contribution to the benevolent fund is made bythe Bank as per the rates set out in the benevolent scheme. Based on actuarial advice, the management estimates that the charge inrespect of defined benefit plans for the year ended December 31, 2011 would be as follows:
2011Pension Gratuity Benevolent Post Employeefund fund fund retirement compensated
medical absencesbenefit
----------------------- (Rupees in ‘000) -----------------------
Expected charge for the year (410,926) 71,743 (59,992) 96,810 190,540
85Annual Report 2010
[ Notes to and forming part of the UnconsolidatedFinancial Statements For the year ended December 31, 2010 ]
37. OTHER EMPLOYEE BENEFITS
37.1 Defined contribution plan
The Bank operates a contributory provident fund scheme for 5,209 (2009: 5,356) employees who are not in the pensionscheme. The employer and employee both contribute 8.33% of the basic salary to the funded scheme every month.
37.2 Employee Motivation and Retention Scheme
The Bank operates a long term motivation and retention scheme for its employees. The objective of the scheme is to reward,motivate and retain high performing executives and officers of the Bank by way of bonus in the form of shares of the Bank.The liability of the Bank in respect of this scheme is fixed and approved each year by the Board of Directors of the Bank .Thescheme is managed by separate Trusts formed in respect of each year. During the year, Rs. 206.819 million (2009: Rs. 40.212million) and Rs. 33.817 million (2009: Rs. 6.409 million) were received by the executives and the chief executive respectivelyfrom the scheme. For further details, refer note 19.1.
37.3 Benazir Employees’ Stock Option Scheme
The Government of Pakistan (GoP), being one of the shareholders of the Bank, decided to launch the Benazir Employees’Stock Option Scheme on August 14, 2009, whereby the GoP intends to transfer free of cost 26,391,483 shares of the Bank,including 26,025,533 shares held by the SBP as at December 31, 2010, to UBL Employees Empowerment Trust [the “Trust”].
As per the Trust Deed such shares will be allocated through Unit Certificates to eligible employees in proportion to theirentitlement which will be based on length of service subject to certain restrictions. The Trust is entitled to receive dividendsdeclared, of which 50 percent will be distributed amongst employees on the basis of units held. The balance 50 percentwould be remitted to a Central Revolving Fund of the Privatization Commission of Pakistan for payment to employees at thetime of end of service settlement on fulfilment of vesting conditions, against surrendered units with the shares underlying suchsurrendered units being transferred back to the GoP.
This generalized scheme being a government policy to provide empowerment to employees of State Owned Enterprises andother entities where the GoP has a shareholding, may attract the provisions of amended IFRS- 2 (Share-based Payments).However, keeping in view the nature, characteristics, exceptions and manner of operation of the generalized scheme, theapplicability of IFRS-2 to the said scheme is under consideration of the Institute of Chartered Accountants of Pakistan andthe Securities and Exchange Commission of Pakistan.
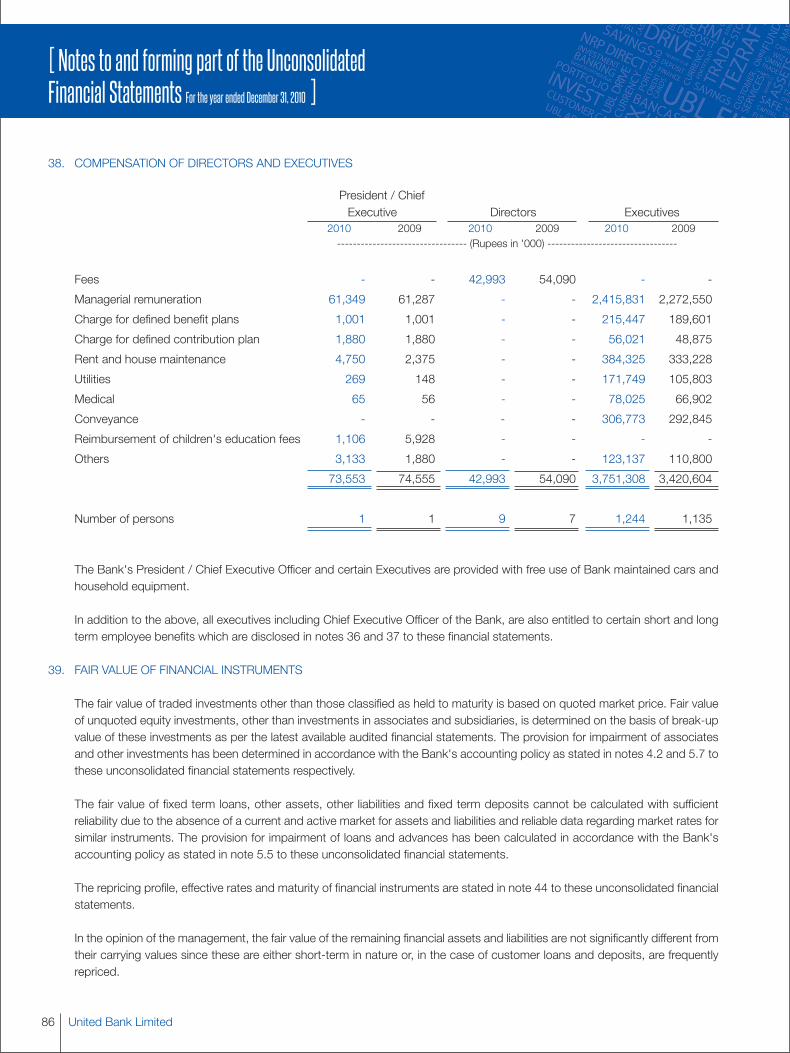
United Bank Limited86
[ Notes to and forming part of the UnconsolidatedFinancial Statements For the year ended December 31, 2010 ]
38. COMPENSATION OF DIRECTORS AND EXECUTIVES
President / ChiefExecutive Directors Executives
2010 2009 2010 2009 2010 2009--------------------------------- (Rupees in '000) ---------------------------------
Fees - - 42,993 54,090 - -
Managerial remuneration 61,349 61,287 - - 2,415,831 2,272,550
Charge for defined benefit plans 1,001 1,001 - - 215,447 189,601
Charge for defined contribution plan 1,880 1,880 - - 56,021 48,875
Rent and house maintenance 4,750 2,375 - - 384,325 333,228
Utilities 269 148 - - 171,749 105,803
Medical 65 56 - - 78,025 66,902
Conveyance - - - - 306,773 292,845
Reimbursement of children's education fees 1,106 5,928 - - - -
Others 3,133 1,880 - - 123,137 110,800
73,553 74,555 42,993 54,090 3,751,308 3,420,604
Number of persons 1 1 9 7 1,244 1,135
The Bank's President / Chief Executive Officer and certain Executives are provided with free use of Bank maintained cars andhousehold equipment.
In addition to the above, all executives including Chief Executive Officer of the Bank, are also entitled to certain short and longterm employee benefits which are disclosed in notes 36 and 37 to these financial statements.
39. FAIR VALUE OF FINANCIAL INSTRUMENTS
The fair value of traded investments other than those classified as held to maturity is based on quoted market price. Fair valueof unquoted equity investments, other than investments in associates and subsidiaries, is determined on the basis of break-upvalue of these investments as per the latest available audited financial statements. The provision for impairment of associatesand other investments has been determined in accordance with the Bank's accounting policy as stated in notes 4.2 and 5.7 tothese unconsolidated financial statements respectively.
The fair value of fixed term loans, other assets, other liabilities and fixed term deposits cannot be calculated with sufficientreliability due to the absence of a current and active market for assets and liabilities and reliable data regarding market rates forsimilar instruments. The provision for impairment of loans and advances has been calculated in accordance with the Bank'saccounting policy as stated in note 5.5 to these unconsolidated financial statements.
The repricing profile, effective rates and maturity of financial instruments are stated in note 44 to these unconsolidated financialstatements.
In the opinion of the management, the fair value of the remaining financial assets and liabilities are not significantly different fromtheir carrying values since these are either short-term in nature or, in the case of customer loans and deposits, are frequentlyrepriced.
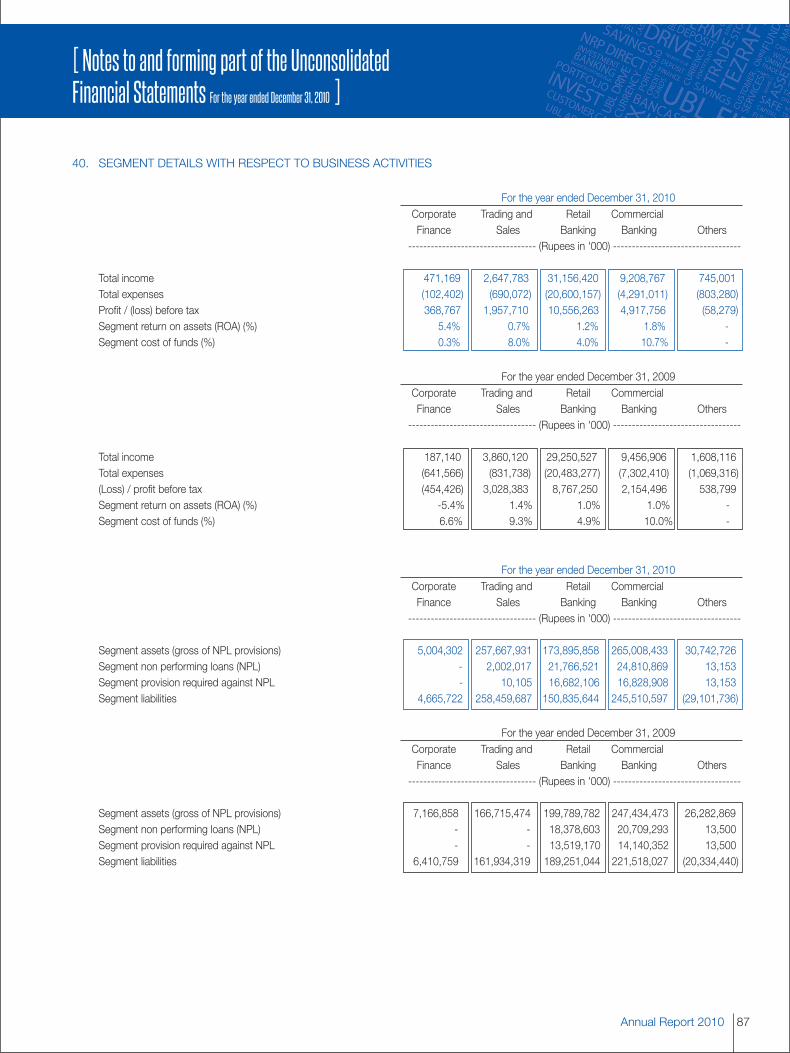
87Annual Report 2010
[ Notes to and forming part of the UnconsolidatedFinancial Statements For the year ended December 31, 2010 ]
40. SEGMENT DETAILS WITH RESPECT TO BUSINESS ACTIVITIES
For the year ended December 31, 2010Corporate Trading and Retail CommercialFinance Sales Banking Banking Others
---------------------------------- (Rupees in '000) ----------------------------------
Total income 471,169 2,647,783 31,156,420 9,208,767 745,001Total expenses (102,402) (690,072) (20,600,157) (4,291,011) (803,280)Profit / (loss) before tax 368,767 1,957,710 10,556,263 4,917,756 (58,279)Segment return on assets (ROA) (%) 5.4% 0.7% 1.2% 1.8% -Segment cost of funds (%) 0.3% 8.0% 4.0% 10.7% -
For the year ended December 31, 2009Corporate Trading and Retail CommercialFinance Sales Banking Banking Others
---------------------------------- (Rupees in '000) ----------------------------------
Total income 187,140 3,860,120 29,250,527 9,456,906 1,608,116Total expenses (641,566) (831,738) (20,483,277) (7,302,410) (1,069,316)(Loss) / profit before tax (454,426) 3,028,383 8,767,250 2,154,496 538,799Segment return on assets (ROA) (%) -5.4% 1.4% 1.0% 1.0% -Segment cost of funds (%) 6.6% 9.3% 4.9% 10.0% -
For the year ended December 31, 2010Corporate Trading and Retail CommercialFinance Sales Banking Banking Others
---------------------------------- (Rupees in '000) ----------------------------------
Segment assets (gross of NPL provisions) 5,004,302 257,667,931 173,895,858 265,008,433 30,742,726Segment non performing loans (NPL) - 2,002,017 21,766,521 24,810,869 13,153Segment provision required against NPL - 10,105 16,682,106 16,828,908 13,153Segment liabilities 4,665,722 258,459,687 150,835,644 245,510,597 (29,101,736)
For the year ended December 31, 2009Corporate Trading and Retail CommercialFinance Sales Banking Banking Others
---------------------------------- (Rupees in '000) ----------------------------------
Segment assets (gross of NPL provisions) 7,166,858 166,715,474 199,789,782 247,434,473 26,282,869Segment non performing loans (NPL) - - 18,378,603 20,709,293 13,500Segment provision required against NPL - - 13,519,170 14,140,352 13,500Segment liabilities 6,410,759 161,934,319 189,251,044 221,518,027 (20,334,440)

United Bank Limited88
[ Notes to and forming part of the UnconsolidatedFinancial Statements For the year ended December 31, 2010 ]
41. TRUST ACTIVITIES
The Bank is not engaged in any significant trust activities. However, it acts as custodian for some of the Term Finance Certificatesit arranges and distributes on behalf of its customers.
42. RELATED PARTY TRANSACTIONS
The Bank has related party transactions with its associates, subsidiary companies (refer note 9), employee benefit plans (refernotes 36 and 37) and its directors and executive officers (including their associates).
Details of loans and advances to key management personnel, the companies or firms in which the Directors of the Bank areinterested as directors, partners or in case of private companies as members are given in note 10.8 to these unconsolidatedfinancial statements.
Contributions to and accruals in respect of staff retirements and other benefit plans are made in accordance with the actuarialvaluations / terms of the contribution plan (refer note 36 to these unconsolidated financial statements for the details of plans).
42.1 RELATED PARTY TRANSACTIONS
Details of transactions with related parties during the year, other than those which have been disclosed elsewhere in thesefinancial statements, are as follows:
2010 2009Key Other Key Other
management Subsidiaries Associates related management Subsidiaries Associates relatedpersonnel parties personnel parties--------------------------------------------------------- (Rupees in '000) ---------------------------------------------------------
Balances with other banks
In current accounts - 1,274,033 - - - 564,453 - -
In saving accounts - - - 2,773 - - - -
In deposit accounts
Opening balance - - - - - - - -
Placements during the year - 4,960,214 - - - 1,251,860 - -
Settled during the year - (4,960,214) - - - (1,251,860) - -
Closing balance - - - - - - - -
Lendings to financial institutions
Call Money Lendings - - - 350,000 - - - -
Investments
In shares / mutual funds - cost
Opening balance - 2,201,948 6,921,080 50,372 - 2,201,948 2,899,663 50,372
Investment made during the year - - 2,620,000 - - - 4,157,468 -
Investment sold / liquidated during the year - - (2,158,888) - - - (136,051) -
Closing balance - 2,201,948 7,382,192 50,372 - 2,201,948 6,921,080 50,372
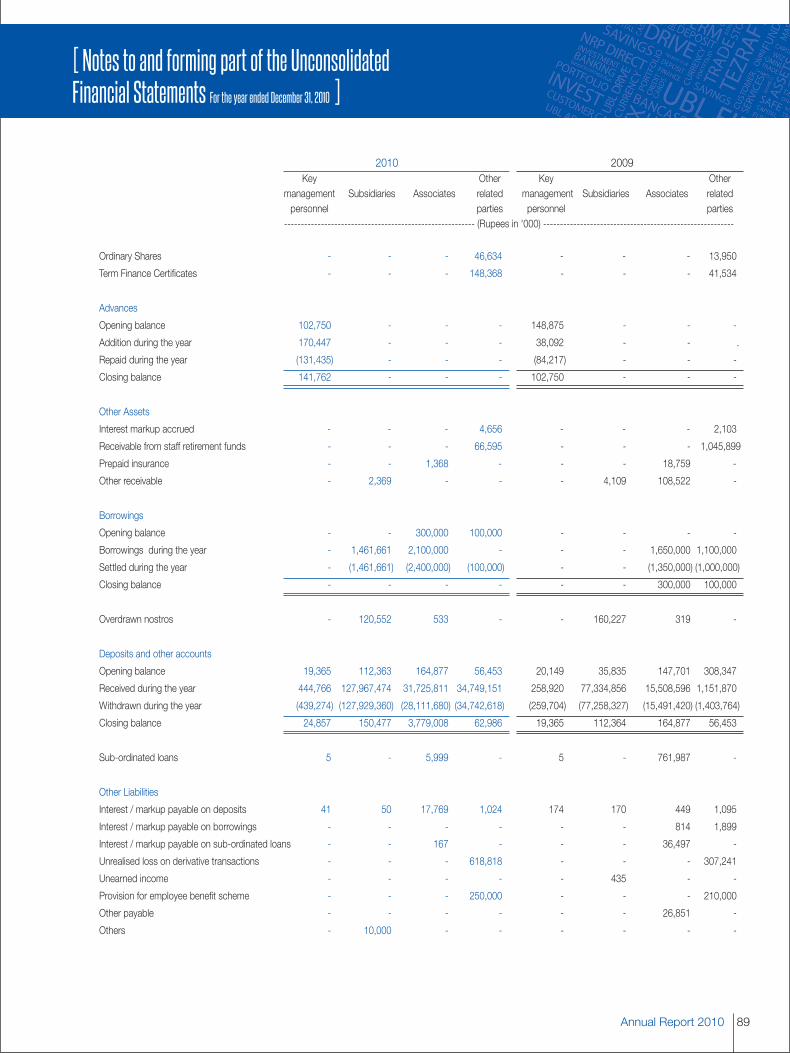
89Annual Report 2010
[ Notes to and forming part of the UnconsolidatedFinancial Statements For the year ended December 31, 2010 ]
2010 2009Key Other Key Other
management Subsidiaries Associates related management Subsidiaries Associates relatedpersonnel parties personnel parties--------------------------------------------------------- (Rupees in '000) ---------------------------------------------------------
Ordinary Shares - - - 46,634 - - - 13,950
Term Finance Certificates - - - 148,368 - - - 41,534
Advances
Opening balance 102,750 - - - 148,875 - - -
Addition during the year 170,447 - - - 38,092 - - .
Repaid during the year (131,435) - - - (84,217) - - -
Closing balance 141,762 - - - 102,750 - - -
Other Assets
Interest markup accrued - - - 4,656 - - - 2,103
Receivable from staff retirement funds - - - 66,595 - - - 1,045,899
Prepaid insurance - - 1,368 - - - 18,759 -
Other receivable - 2,369 - - - 4,109 108,522 -
Borrowings
Opening balance - - 300,000 100,000 - - - -
Borrowings during the year - 1,461,661 2,100,000 - - - 1,650,000 1,100,000
Settled during the year - (1,461,661) (2,400,000) (100,000) - - (1,350,000) (1,000,000)
Closing balance - - - - - - 300,000 100,000
Overdrawn nostros - 120,552 533 - - 160,227 319 -
Deposits and other accounts
Opening balance 19,365 112,363 164,877 56,453 20,149 35,835 147,701 308,347
Received during the year 444,766 127,967,474 31,725,811 34,749,151 258,920 77,334,856 15,508,596 1,151,870
Withdrawn during the year (439,274) (127,929,360) (28,111,680) (34,742,618) (259,704) (77,258,327) (15,491,420) (1,403,764)
Closing balance 24,857 150,477 3,779,008 62,986 19,365 112,364 164,877 56,453
Sub-ordinated loans 5 - 5,999 - 5 - 761,987 -
Other Liabilities
Interest / markup payable on deposits 41 50 17,769 1,024 174 170 449 1,095
Interest / markup payable on borrowings - - - - - - 814 1,899
Interest / markup payable on sub-ordinated loans - - 167 - - - 36,497 -
Unrealised loss on derivative transactions - - - 618,818 - - - 307,241
Unearned income - - - - - 435 - -
Provision for employee benefit scheme - - - 250,000 - - - 210,000
Other payable - - - - - - 26,851 -
Others - 10,000 - - - - - -
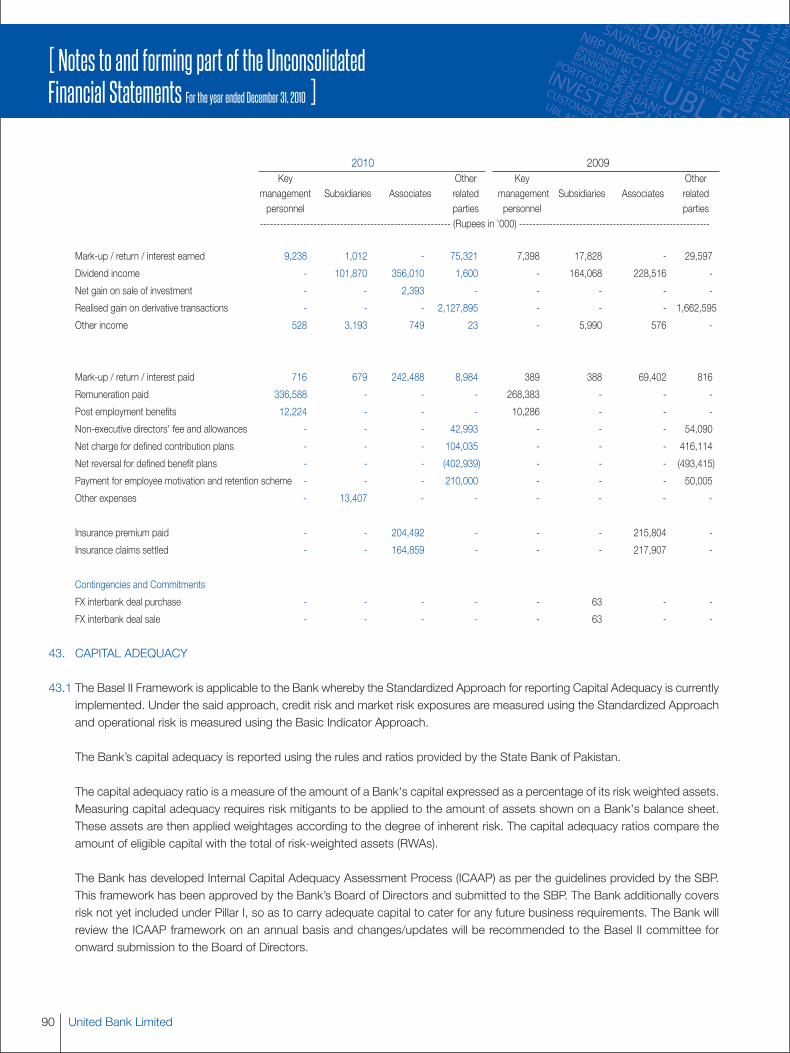
United Bank Limited90
[ Notes to and forming part of the UnconsolidatedFinancial Statements For the year ended December 31, 2010 ]
2010 2009Key Other Key Other
management Subsidiaries Associates related management Subsidiaries Associates relatedpersonnel parties personnel parties--------------------------------------------------------- (Rupees in '000) ---------------------------------------------------------
Mark-up / return / interest earned 9,238 1,012 - 75,321 7,398 17,828 - 29,597
Dividend income - 101,870 356,010 1,600 - 164,068 228,516 -
Net gain on sale of investment - - 2,393 - - - - -
Realised gain on derivative transactions - - - 2,127,895 - - - 1,662,595
Other income 528 3,193 749 23 - 5,990 576 -
Mark-up / return / interest paid 716 679 242,488 8,984 389 388 69,402 816
Remuneration paid 336,588 - - - 268,383 - - -
Post employment benefits 12,224 - - - 10,286 - - -
Non-executive directors' fee and allowances - - - 42,993 - - - 54,090
Net charge for defined contribution plans - - - 104,035 - - - 416,114
Net reversal for defined benefit plans - - - (402,939) - - - (493,415)
Payment for employee motivation and retention scheme - - - 210,000 - - - 50,005
Other expenses - 13,407 - - - - - -
Insurance premium paid - - 204,492 - - - 215,804 -
Insurance claims settled - - 164,859 - - - 217,907 -
Contingencies and Commitments
FX interbank deal purchase - - - - - 63 - -
FX interbank deal sale - - - - - 63 - -
43. CAPITAL ADEQUACY
43.1 The Basel II Framework is applicable to the Bank whereby the Standardized Approach for reporting Capital Adequacy is currentlyimplemented. Under the said approach, credit risk and market risk exposures are measured using the Standardized Approachand operational risk is measured using the Basic Indicator Approach.
The Bank’s capital adequacy is reported using the rules and ratios provided by the State Bank of Pakistan.
The capital adequacy ratio is a measure of the amount of a Bank's capital expressed as a percentage of its risk weighted assets.Measuring capital adequacy requires risk mitigants to be applied to the amount of assets shown on a Bank's balance sheet.These assets are then applied weightages according to the degree of inherent risk. The capital adequacy ratios compare theamount of eligible capital with the total of risk-weighted assets (RWAs).
The Bank has developed Internal Capital Adequacy Assessment Process (ICAAP) as per the guidelines provided by the SBP.This framework has been approved by the Bank’s Board of Directors and submitted to the SBP. The Bank additionally coversrisk not yet included under Pillar I, so as to carry adequate capital to cater for any future business requirements. The Bank willreview the ICAAP framework on an annual basis and changes/updates will be recommended to the Basel II committee foronward submission to the Board of Directors.

91Annual Report 2010
[ Notes to and forming part of the UnconsolidatedFinancial Statements For the year ended December 31, 2010 ]
The Bank plans to move towards the Advanced Approach for Basel II, including the Foundation Internal Ratings Based Approachfor credit risk, Internal Models Approach for market risk and the Alternate Standardized Approach for operational risk.
43.2 Capital Management
The objective of managing capital is to safeguard the Bank's ability to continue as a going concern. It is the policy of the Bankto maintain a strong capital base so as to maintain investor, creditor and market confidence and to sustain future developmentof the business. The impact of the level of capital on shareholders’ return is also recognized and the Bank recognizes the needto maintain a balance between the higher returns that might be possible with greater gearing and the advantages and securityafforded by a sound capital position.
Statutory minimum capital and capital adequacy requirements
The SBP through its BSD Circular No. 07 dated April 15, 2009 has prescribed the minimum paid-up capital (net of accumulatedlosses) for Banks / Development Finance Institutions to be raised to Rs.10 billion by the year ending December 31, 2013.
The paid-up capital of the Bank for the year ended December 31, 2010 stood at Rs.12,241.798 million (2009:11,128.907million) and is in compliance with SBP requirements. In addition, banks are also required to maintain a minimum CapitalAdequacy Ratio (CAR) of 10% of the risk weighted exposure of the Bank. The Bank’s CAR as at December 31, 2010 was14.51% (2009: 13.18%). The Bank and its individually regulated operations have complied with all capital requirementsthroughout the year.
Tier 1 capital, includes fully paid-up capital, balance in share premium account, general reserves as per the financial statementsand net un-appropriated profits after deduction of book value of goodwill / intangibles, deficit on revaluation of available for saleinvestments and 50% of investments in equity and other regulatory capital of majority owned securities or other financialsubsidiaries not consolidated in the statement of financial position as per the guidelines laid under the Basel II Framework.
Tier 2 capital includes general provisions for loan losses, reserves on the revaluation of fixed assets and equity investments,foreign exchange translation reserves and subordinated debts (upto maximum of 50% of total eligible tier 1 capital) afterdeduction of 50% of investments in equity and other regulatory capital of majority owned securities or other financial subsidiariesnot consolidated in the statement of financial position as per the guidelines laid under the Basel II Framework.
Tier 3 capital has also been prescribed by the SBP for managing market risk; however, the Bank does not have any Tier 3 capital.
Banking operations are categorized as either trading book or banking book and risk-weighted assets are determined accordingto specified requirements of the SBP that seek to reflect the varying levels of risk attached to assets and off-balance sheetexposures. The total risk-weighted exposures comprise of credit risk, market risk and operational risk.
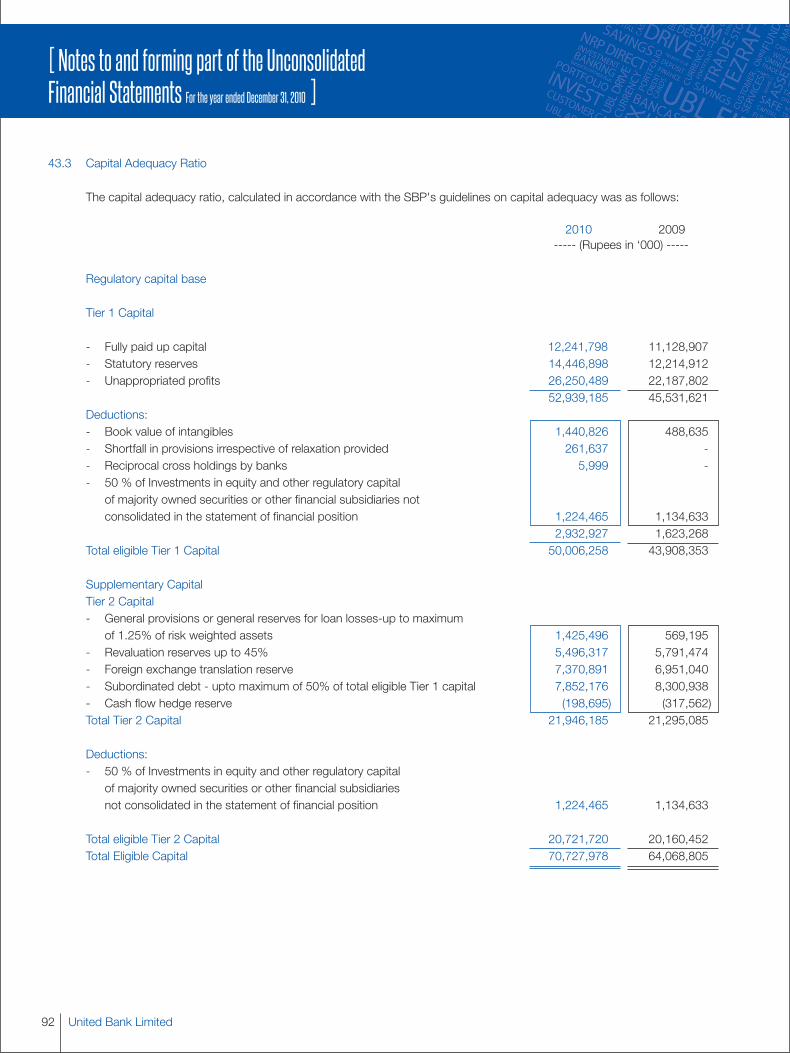
United Bank Limited92
[ Notes to and forming part of the UnconsolidatedFinancial Statements For the year ended December 31, 2010 ]
43.3 Capital Adequacy Ratio
The capital adequacy ratio, calculated in accordance with the SBP's guidelines on capital adequacy was as follows:
2010 2009----- (Rupees in ‘000) -----
Regulatory capital base
Tier 1 Capital
- Fully paid up capital 12,241,798 11,128,907- Statutory reserves 14,446,898 12,214,912- Unappropriated profits 26,250,489 22,187,802
52,939,185 45,531,621Deductions:- Book value of intangibles 1,440,826 488,635- Shortfall in provisions irrespective of relaxation provided 261,637 -- Reciprocal cross holdings by banks 5,999 -- 50 % of Investments in equity and other regulatory capital
of majority owned securities or other financial subsidiaries notconsolidated in the statement of financial position 1,224,465 1,134,633
2,932,927 1,623,268Total eligible Tier 1 Capital 50,006,258 43,908,353
Supplementary CapitalTier 2 Capital- General provisions or general reserves for loan losses-up to maximum
of 1.25% of risk weighted assets 1,425,496 569,195- Revaluation reserves up to 45% 5,496,317 5,791,474- Foreign exchange translation reserve 7,370,891 6,951,040- Subordinated debt - upto maximum of 50% of total eligible Tier 1 capital 7,852,176 8,300,938- Cash flow hedge reserve (198,695) (317,562)Total Tier 2 Capital 21,946,185 21,295,085
Deductions:- 50 % of Investments in equity and other regulatory capital
of majority owned securities or other financial subsidiariesnot consolidated in the statement of financial position 1,224,465 1,134,633
Total eligible Tier 2 Capital 20,721,720 20,160,452Total Eligible Capital 70,727,978 64,068,805
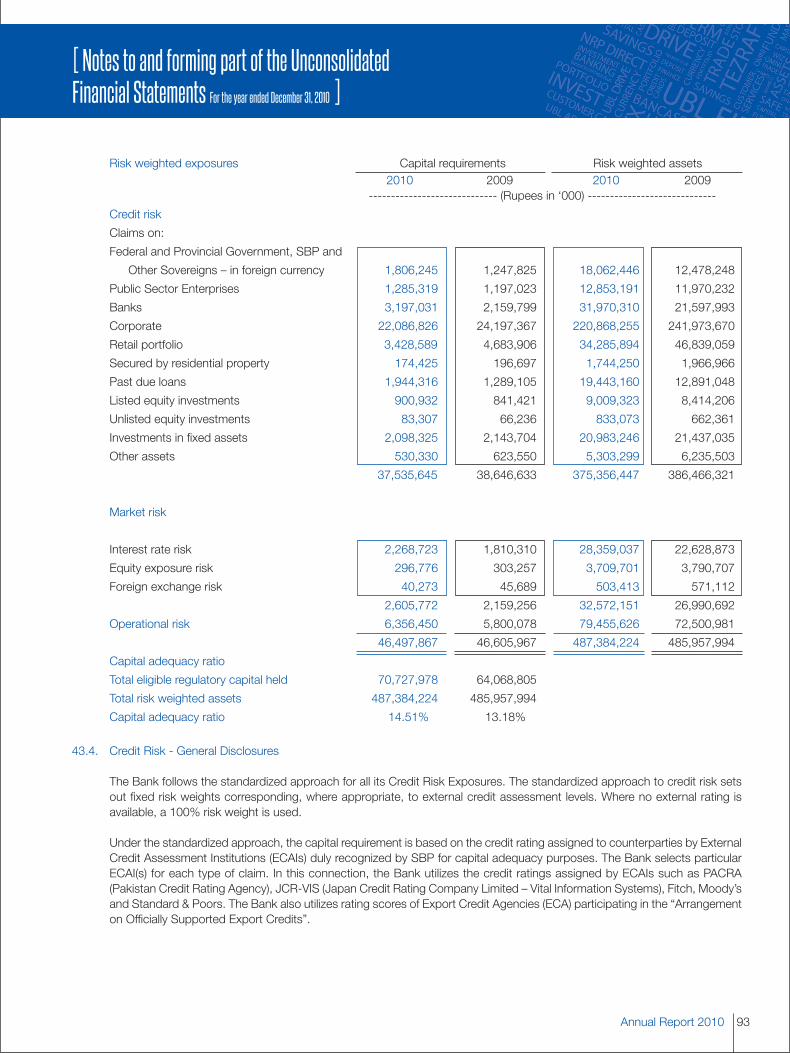
93Annual Report 2010
[ Notes to and forming part of the UnconsolidatedFinancial Statements For the year ended December 31, 2010 ]
Risk weighted exposures Capital requirements Risk weighted assets2010 2009 2010 2009
----------------------------- (Rupees in ‘000) -----------------------------
Credit risk
Claims on:
Federal and Provincial Government, SBP and
Other Sovereigns – in foreign currency 1,806,245 1,247,825 18,062,446 12,478,248
Public Sector Enterprises 1,285,319 1,197,023 12,853,191 11,970,232
Banks 3,197,031 2,159,799 31,970,310 21,597,993
Corporate 22,086,826 24,197,367 220,868,255 241,973,670
Retail portfolio 3,428,589 4,683,906 34,285,894 46,839,059
Secured by residential property 174,425 196,697 1,744,250 1,966,966
Past due loans 1,944,316 1,289,105 19,443,160 12,891,048
Listed equity investments 900,932 841,421 9,009,323 8,414,206
Unlisted equity investments 83,307 66,236 833,073 662,361
Investments in fixed assets 2,098,325 2,143,704 20,983,246 21,437,035
Other assets 530,330 623,550 5,303,299 6,235,503
37,535,645 38,646,633 375,356,447 386,466,321
Market risk
Interest rate risk 2,268,723 1,810,310 28,359,037 22,628,873
Equity exposure risk 296,776 303,257 3,709,701 3,790,707
Foreign exchange risk 40,273 45,689 503,413 571,112
2,605,772 2,159,256 32,572,151 26,990,692
Operational risk 6,356,450 5,800,078 79,455,626 72,500,981
46,497,867 46,605,967 487,384,224 485,957,994
Capital adequacy ratio
Total eligible regulatory capital held 70,727,978 64,068,805
Total risk weighted assets 487,384,224 485,957,994
Capital adequacy ratio 14.51% 13.18%
43.4. Credit Risk - General Disclosures
The Bank follows the standardized approach for all its Credit Risk Exposures. The standardized approach to credit risk setsout fixed risk weights corresponding, where appropriate, to external credit assessment levels. Where no external rating isavailable, a 100% risk weight is used.
Under the standardized approach, the capital requirement is based on the credit rating assigned to counterparties by ExternalCredit Assessment Institutions (ECAIs) duly recognized by SBP for capital adequacy purposes. The Bank selects particularECAI(s) for each type of claim. In this connection, the Bank utilizes the credit ratings assigned by ECAIs such as PACRA(Pakistan Credit Rating Agency), JCR-VIS (Japan Credit Rating Company Limited – Vital Information Systems), Fitch, Moody’sand Standard & Poors. The Bank also utilizes rating scores of Export Credit Agencies (ECA) participating in the “Arrangementon Officially Supported Export Credits”.
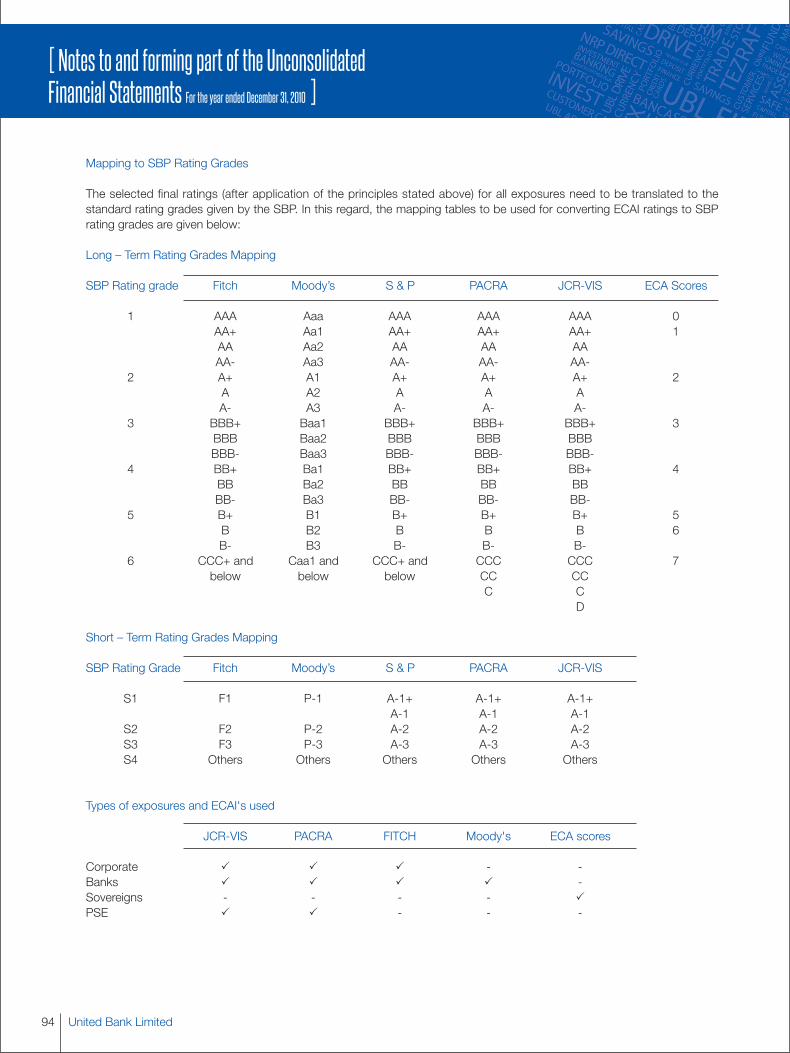
United Bank Limited94
[ Notes to and forming part of the UnconsolidatedFinancial Statements For the year ended December 31, 2010 ]
Mapping to SBP Rating Grades
The selected final ratings (after application of the principles stated above) for all exposures need to be translated to thestandard rating grades given by the SBP. In this regard, the mapping tables to be used for converting ECAI ratings to SBPrating grades are given below:
Long – Term Rating Grades Mapping
SBP Rating grade Fitch Moody’s S & P PACRA JCR-VIS ECA Scores
1 AAA Aaa AAA AAA AAA 0AA+ Aa1 AA+ AA+ AA+ 1AA Aa2 AA AA AAAA- Aa3 AA- AA- AA-
2 A+ A1 A+ A+ A+ 2A A2 A A AA- A3 A- A- A-
3 BBB+ Baa1 BBB+ BBB+ BBB+ 3BBB Baa2 BBB BBB BBBBBB- Baa3 BBB- BBB- BBB-
4 BB+ Ba1 BB+ BB+ BB+ 4BB Ba2 BB BB BBBB- Ba3 BB- BB- BB-
5 B+ B1 B+ B+ B+ 5B B2 B B B 6B- B3 B- B- B-
6 CCC+ and Caa1 and CCC+ and CCC CCC 7below below below CC CC
C CD
Short – Term Rating Grades Mapping
SBP Rating Grade Fitch Moody’s S & P PACRA JCR-VIS
S1 F1 P-1 A-1+ A-1+ A-1+A-1 A-1 A-1
S2 F2 P-2 A-2 A-2 A-2S3 F3 P-3 A-3 A-3 A-3S4 Others Others Others Others Others
Types of exposures and ECAI's used
JCR-VIS PACRA FITCH Moody's ECA scores
Corporate � � � - -Banks � � � � -Sovereigns - - - - �PSE � � - - -
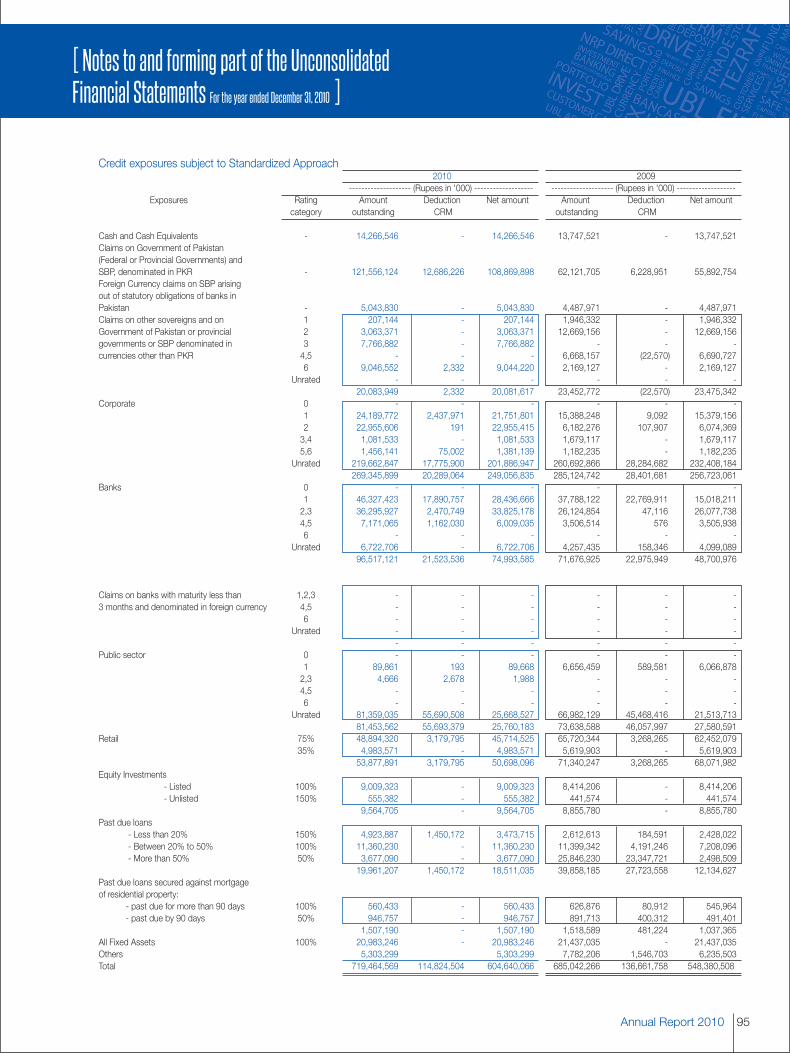
95Annual Report 2010
[ Notes to and forming part of the UnconsolidatedFinancial Statements For the year ended December 31, 2010 ]
Credit exposures subject to Standardized Approach2010 2009
-------------------- (Rupees in '000) ------------------- -------------------- (Rupees in '000) -------------------Exposures Rating Amount Deduction Net amount Amount Deduction Net amount
category outstanding CRM outstanding CRM
Cash and Cash Equivalents - 14,266,546 - 14,266,546 13,747,521 - 13,747,521Claims on Government of Pakistan(Federal or Provincial Governments) andSBP, denominated in PKR - 121,556,124 12,686,226 108,869,898 62,121,705 6,228,951 55,892,754Foreign Currency claims on SBP arisingout of statutory obligations of banks inPakistan - 5,043,830 - 5,043,830 4,487,971 - 4,487,971Claims on other sovereigns and on 1 207,144 - 207,144 1,946,332 - 1,946,332Government of Pakistan or provincial 2 3,063,371 - 3,063,371 12,669,156 - 12,669,156governments or SBP denominated in 3 7,766,882 - 7,766,882 - - -currencies other than PKR 4,5 - - - 6,668,157 (22,570) 6,690,727
6 9,046,552 2,332 9,044,220 2,169,127 - 2,169,127Unrated - - - - - -
20,083,949 2,332 20,081,617 23,452,772 (22,570) 23,475,342Corporate 0 - - - - - -
1 24,189,772 2,437,971 21,751,801 15,388,248 9,092 15,379,1562 22,955,606 191 22,955,415 6,182,276 107,907 6,074,3693,4 1,081,533 - 1,081,533 1,679,117 - 1,679,1175,6 1,456,141 75,002 1,381,139 1,182,235 - 1,182,235
Unrated 219,662,847 17,775,900 201,886,947 260,692,866 28,284,682 232,408,184269,345,899 20,289,064 249,056,835 285,124,742 28,401,681 256,723,061
Banks 0 - - - - -1 46,327,423 17,890,757 28,436,666 37,788,122 22,769,911 15,018,2112,3 36,295,927 2,470,749 33,825,178 26,124,854 47,116 26,077,7384,5 7,171,065 1,162,030 6,009,035 3,506,514 576 3,505,9386 - - - - - -
Unrated 6,722,706 - 6,722,706 4,257,435 158,346 4,099,08996,517,121 21,523,536 74,993,585 71,676,925 22,975,949 48,700,976
Claims on banks with maturity less than 1,2,3 - - - - - -3 months and denominated in foreign currency 4,5 - - - - - -
6 - - - - - -Unrated - - - - - -
- - - - - -Public sector 0 - - - - - -
1 89,861 193 89,668 6,656,459 589,581 6,066,8782,3 4,666 2,678 1,988 - - -4,5 - - - - - -6 - - - - - -
Unrated 81,359,035 55,690,508 25,668,527 66,982,129 45,468,416 21,513,71381,453,562 55,693,379 25,760,183 73,638,588 46,057,997 27,580,591
Retail 75% 48,894,320 3,179,795 45,714,525 65,720,344 3,268,265 62,452,07935% 4,983,571 - 4,983,571 5,619,903 - 5,619,903
53,877,891 3,179,795 50,698,096 71,340,247 3,268,265 68,071,982Equity Investments
- Listed 100% 9,009,323 - 9,009,323 8,414,206 - 8,414,206- Unlisted 150% 555,382 - 555,382 441,574 - 441,574
9,564,705 - 9,564,705 8,855,780 - 8,855,780Past due loans
- Less than 20% 150% 4,923,887 1,450,172 3,473,715 2,612,613 184,591 2,428,022- Between 20% to 50% 100% 11,360,230 - 11,360,230 11,399,342 4,191,246 7,208,096- More than 50% 50% 3,677,090 - 3,677,090 25,846,230 23,347,721 2,498,509
19,961,207 1,450,172 18,511,035 39,858,185 27,723,558 12,134,627Past due loans secured against mortgageof residential property:
- past due for more than 90 days 100% 560,433 - 560,433 626,876 80,912 545,964- past due by 90 days 50% 946,757 - 946,757 891,713 400,312 491,401
1,507,190 - 1,507,190 1,518,589 481,224 1,037,365All Fixed Assets 100% 20,983,246 - 20,983,246 21,437,035 - 21,437,035Others 5,303,299 5,303,299 7,782,206 1,546,703 6,235,503Total 719,464,569 114,824,504 604,640,066 685,042,266 136,661,758 548,380,508
United Bank Limited96
[ Notes to and forming part of the UnconsolidatedFinancial Statements For the year ended December 31, 2010 ]
Credit Risk: Disclosures with respect to Credit Risk Mitigation for Standardized Approach
The Bank has adopted the Comprehensive Approach of Credit Risk Mitigation for the Banking Book. No credit risk mitigationbenefit is taken in the Trading Book. In instances where the Bank’s exposure on an obligor is secured by collateral that conformsto the eligibility criteria under the Comprehensive Approach of CRM, then the Bank reduces its exposure under that particulartransaction by taking into account the risk mitigating effect of the collateral for the calculation of capital requirement i.e. the riskweight of the collateral instrument securing the exposure is substituted for the risk weight of the counter party.
Cash, lien on deposits, government securities and eligible guarantees etc. are considered as eligible collateral under theComprehensive Approach of Credit Risk Mitigation. The Bank has in place detailed guidelines with respect to valuation andmanagement of these types of collateral. In order to be prudent, the Bank calculates the Credit Risk Mitigation benefit using therealizable value of eligible collateral.
44. RISK MANAGEMENT
This section presents information about the Bank’s exposure to and its management and control of risks, in particular, theprimary risks associated with its use of financial instruments:
- Credit risk is the risk of loss resulting from client or counterparty default
- Market risk is the risk of loss arising from adverse movements in market variables such as interest rates, exchange rates andequity indices
- Liquidity risk is the risk that the Bank may be unable to meet its payment obligations when due
- Operational risk is the risk of loss resulting from inadequate or failed internal processes, people and systems or from externalevents, and therefore includes legal risk
- Equity position risk is the risk that arises due to changes in prices of individual stocks or levels of equity indices.
Managing risk continues to present a major challenge to the entire banking industry. Success in the banking business dependson how well an institution manages its risks. The main goal is not to eliminate risk, but rather to be proactive in identifying,assessing and managing risks to the organisation’s strategic advantage at the optimum.
The Bank has an integrated risk management structure in place. The Board Risk Management Committee oversees the wholerisk management process of the bank. The Risk & Credit Policy Group assists the Board Risk Management Committee. Thegroup is organized into the functions of Credit Administration, Market and Treasury Risk, Commercial and FIRMU Credit Policy,Consumer and Retail Credit, Credit Risk Management and Operational Risk and Basel II. Each risk category is headed by a seniormanager who reports directly to the Group Executive, Risk and Credit Policy. The role of the Risk and Credit Policy Groupincludes:
- Determining guidelines relating to Bank’s appetite for risk.
- Recommending risk management policies in accordance with the Basel-II framework and international best practices.
- Reviewing policies/ manuals and ensuring that these are in accordance with the risk management policies.
97Annual Report 2010
[ Notes to and forming part of the UnconsolidatedFinancial Statements For the year ended December 31, 2010 ]
- Developing systems and resources to review the key risk exposures of the Bank .
- Approving credits.
- Granting approval authority to qualified and experienced individuals.
- Reviewing the adequacy of credit training across the Bank.
- Organizing portfolio reviews focusing on quality assessment, risk profiles, industry concentrations, etc.
- Setting systems to identify significant portfolio indicators, problem credits and level of provisioning required.
44.1 Credit risk
Credit risk is the risk that a customer or counterparty may not settle an obligation for full value, either when due or at any timethereafter. This risk arises from the potential that a customer or counterparty is either unwilling to perform an obligation or itsability to perform such an obligation is impaired resulting in an economic loss to the Bank.
The credit risk management process is driven by the Bank's Credit Policy, which provides policies and procedures in relationto credit initiation, approval, documentation and disbursement, credit maintenance and remedial management.
The Credit risk function is organized into Corporate, Commercial/SME and Retail credit. Corporate and Retail credit functionsare centrally organized while the Commercial credit function is organized regionally across the network. Individual creditauthorities are delegated by the Board according to seasoning/maturity of respective credit officers.
The Bank manages, limits and controls concentrations of credit risk as identified, in particular, to individual counterparties andgroups, and to industries, where appropriate. Concentrations of credit risk exist if clients are engaged in similar activities, or arelocated in the same geographical region or have comparable economic characteristics such that their ability to meet contractualobligations would be similarly affected by changes in economic, political or other conditions. Limits are also applied in a varietyof forms to portfolios or sectors where the Bank considers it appropriate to restrict credit risk concentrations or areas of higherrisk, or to control the rate of portfolio growth.

United Bank Limited98
[ Notes to and forming part of the UnconsolidatedFinancial Statements For the year ended December 31, 2010 ]
44.2 Segmental information
44.2.1 Segments by class of business
2010Gross Advances Deposits Contingencies and
commitments(Rupees in '000) Percent (Rupees in '000) Percent (Rupees in '000) Percent
Chemical and pharmaceuticals 6,217,583 1.69% 8,389,268 1.52% 6,082,131 1.13%Agri business 53,034,196 14.38% 33,824,201 6.14% 315,807 0.06%Textile spinning 17,497,654 4.75% 1,289,002 0.23% 5,058,213 0.94%Textile weaving 6,722,278 1.82% 2,477,437 0.45% 4,289,442 0.79%Textile composite 23,145,685 6.28% 330,764 0.06% 814,737 0.15%Textile others 13,779,179 3.74% 2,182,465 0.40% 3,740,450 0.69%Cement 6,803,468 1.85% 1,908,802 0.35% 2,801,403 0.52%Sugar 8,153,681 2.21% 3,078,292 0.56% 358,817 0.07%Shoes and leather garments 2,447,523 0.66% 2,216,787 0.40% 298,515 0.06%Automobile and transportation equipment 4,455,055 1.21% 3,027,770 0.55% 4,940,641 0.92%Financial 4,895,906 1.33% 15,918,040 2.89% 298,818,733 55.37%Insurance - 0.00% 22,443,630 4.08% 43,143 0.01%Electronics and electrical appliances 2,385,744 0.65% 3,265,744 0.59% 1,541,579 0.29%Production and transmission of energy 39,057,078 10.59% 17,157,862 3.12% 58,716,619 10.88%Paper and allied 789,310 0.21% 2,189,563 0.40% 660,772 0.12%Surgical and metal 2,265,932 0.61% 1,450,750 0.26% 335,306 0.06%Contractors 4,263,223 1.16% 16,640,821 3.02% 19,463,140 3.61%Wholesale traders 20,775,990 5.64% 36,074,167 6.55% 1,290,820 0.24%Fertilizer dealers 6,823,565 1.85% 8,494,701 1.54% 677,458 0.13%Sports goods 803,919 0.22% 840,738 0.15% 17,885 0.00%Food industries 6,848,598 1.86% 3,931,436 0.71% 3,699,826 0.69%Airlines 6,033,039 1.64% 308,457 0.06% 108,106 0.02%Cables 661,900 0.18% 96,185 0.02% 744,510 0.14%Construction 21,866,860 5.93% 8,675,833 1.58% 10,260,326 1.90%Containers and ports 1,813,903 0.49% 1,543,051 0.28% 2,974,909 0.55%Engineering 1,531,426 0.42% 3,472,111 0.63% 1,618,692 0.30%Glass and allied 301,653 0.08% 385,593 0.07% 220,958 0.04%Hotels 2,708,633 0.73% 1,223,853 0.22% 438,627 0.08%Infrastructure 2,273,671 0.62% 4,285,714 0.78% 31,461,991 5.83%Media 620,575 0.17% 365,056 0.07% 40,879 0.01%Polyester and fibre 1,980,509 0.54% 623,175 0.11% 78,234 0.01%Telecommunication 11,333,927 3.07% 3,894,923 0.71% 1,167,952 0.22%Individuals 65,802,937 17.85% 267,478,119 48.58% 17,737,304 3.29%Others 20,597,340 5.59% 71,161,457 12.92% 58,859,489 10.91%
368,691,940 100.00% 550,645,767 100.00% 539,677,414 100.00%
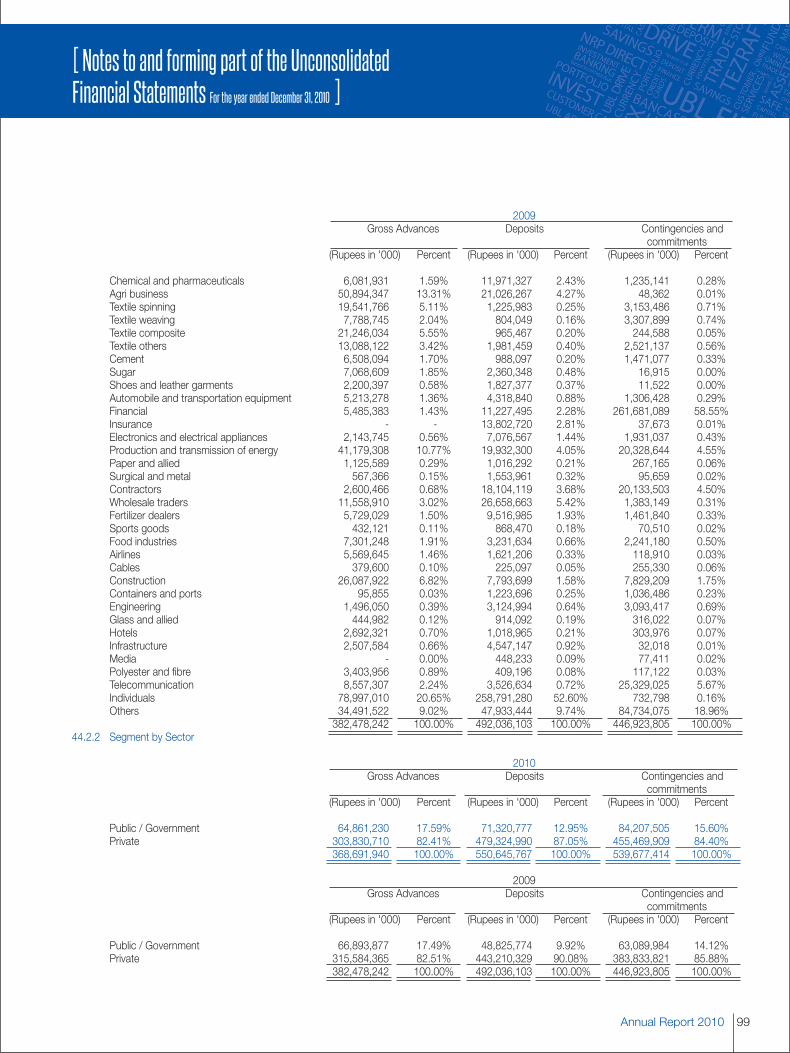
99Annual Report 2010
[ Notes to and forming part of the UnconsolidatedFinancial Statements For the year ended December 31, 2010 ]
2009Gross Advances Deposits Contingencies and
commitments(Rupees in '000) Percent (Rupees in '000) Percent (Rupees in '000) Percent
Chemical and pharmaceuticals 6,081,931 1.59% 11,971,327 2.43% 1,235,141 0.28%Agri business 50,894,347 13.31% 21,026,267 4.27% 48,362 0.01%Textile spinning 19,541,766 5.11% 1,225,983 0.25% 3,153,486 0.71%Textile weaving 7,788,745 2.04% 804,049 0.16% 3,307,899 0.74%Textile composite 21,246,034 5.55% 965,467 0.20% 244,588 0.05%Textile others 13,088,122 3.42% 1,981,459 0.40% 2,521,137 0.56%Cement 6,508,094 1.70% 988,097 0.20% 1,471,077 0.33%Sugar 7,068,609 1.85% 2,360,348 0.48% 16,915 0.00%Shoes and leather garments 2,200,397 0.58% 1,827,377 0.37% 11,522 0.00%Automobile and transportation equipment 5,213,278 1.36% 4,318,840 0.88% 1,306,428 0.29%Financial 5,485,383 1.43% 11,227,495 2.28% 261,681,089 58.55%Insurance - - 13,802,720 2.81% 37,673 0.01%Electronics and electrical appliances 2,143,745 0.56% 7,076,567 1.44% 1,931,037 0.43%Production and transmission of energy 41,179,308 10.77% 19,932,300 4.05% 20,328,644 4.55%Paper and allied 1,125,589 0.29% 1,016,292 0.21% 267,165 0.06%Surgical and metal 567,366 0.15% 1,553,961 0.32% 95,659 0.02%Contractors 2,600,466 0.68% 18,104,119 3.68% 20,133,503 4.50%Wholesale traders 11,558,910 3.02% 26,658,663 5.42% 1,383,149 0.31%Fertilizer dealers 5,729,029 1.50% 9,516,985 1.93% 1,461,840 0.33%Sports goods 432,121 0.11% 868,470 0.18% 70,510 0.02%Food industries 7,301,248 1.91% 3,231,634 0.66% 2,241,180 0.50%Airlines 5,569,645 1.46% 1,621,206 0.33% 118,910 0.03%Cables 379,600 0.10% 225,097 0.05% 255,330 0.06%Construction 26,087,922 6.82% 7,793,699 1.58% 7,829,209 1.75%Containers and ports 95,855 0.03% 1,223,696 0.25% 1,036,486 0.23%Engineering 1,496,050 0.39% 3,124,994 0.64% 3,093,417 0.69%Glass and allied 444,982 0.12% 914,092 0.19% 316,022 0.07%Hotels 2,692,321 0.70% 1,018,965 0.21% 303,976 0.07%Infrastructure 2,507,584 0.66% 4,547,147 0.92% 32,018 0.01%Media - 0.00% 448,233 0.09% 77,411 0.02%Polyester and fibre 3,403,956 0.89% 409,196 0.08% 117,122 0.03%Telecommunication 8,557,307 2.24% 3,526,634 0.72% 25,329,025 5.67%Individuals 78,997,010 20.65% 258,791,280 52.60% 732,798 0.16%Others 34,491,522 9.02% 47,933,444 9.74% 84,734,075 18.96%
382,478,242 100.00% 492,036,103 100.00% 446,923,805 100.00%44.2.2 Segment by Sector
2010Gross Advances Deposits Contingencies and
commitments(Rupees in '000) Percent (Rupees in '000) Percent (Rupees in '000) Percent
Public / Government 64,861,230 17.59% 71,320,777 12.95% 84,207,505 15.60%Private 303,830,710 82.41% 479,324,990 87.05% 455,469,909 84.40%
368,691,940 100.00% 550,645,767 100.00% 539,677,414 100.00%
2009Gross Advances Deposits Contingencies and
commitments(Rupees in '000) Percent (Rupees in '000) Percent (Rupees in '000) Percent
Public / Government 66,893,877 17.49% 48,825,774 9.92% 63,089,984 14.12%Private 315,584,365 82.51% 443,210,329 90.08% 383,833,821 85.88%
382,478,242 100.00% 492,036,103 100.00% 446,923,805 100.00%
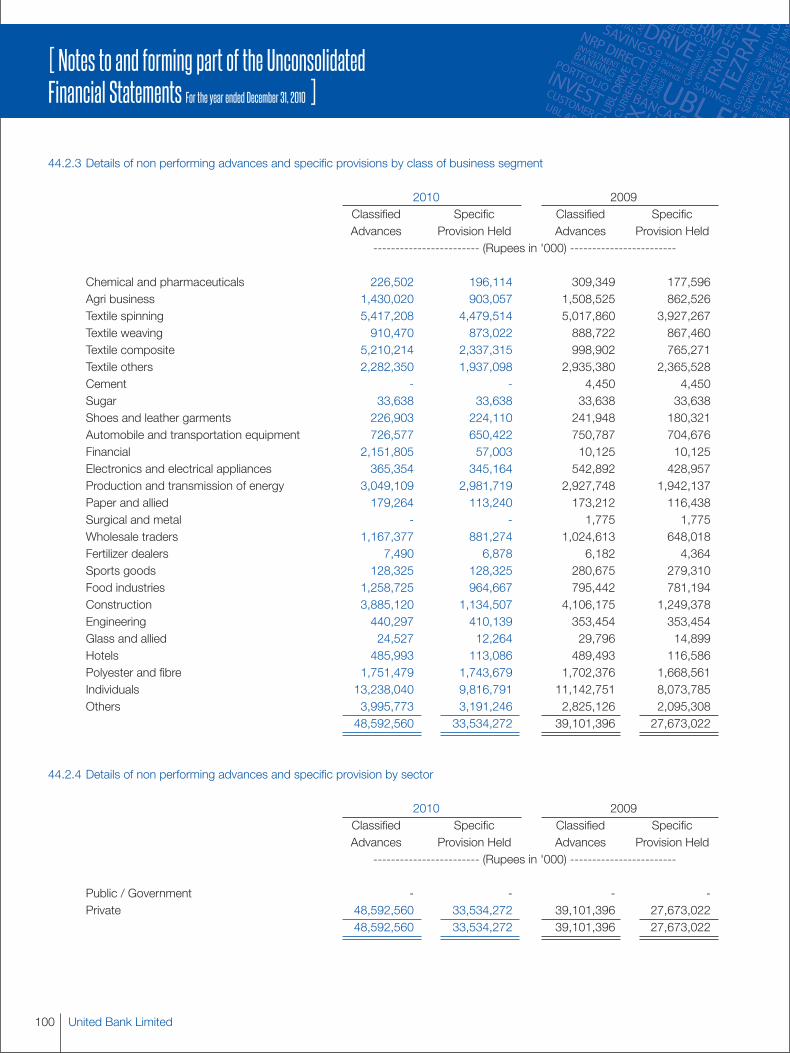
United Bank Limited100
[ Notes to and forming part of the UnconsolidatedFinancial Statements For the year ended December 31, 2010 ]
44.2.3 Details of non performing advances and specific provisions by class of business segment
2010 2009Classified Specific Classified SpecificAdvances Provision Held Advances Provision Held
------------------------ (Rupees in '000) ------------------------
Chemical and pharmaceuticals 226,502 196,114 309,349 177,596Agri business 1,430,020 903,057 1,508,525 862,526Textile spinning 5,417,208 4,479,514 5,017,860 3,927,267Textile weaving 910,470 873,022 888,722 867,460Textile composite 5,210,214 2,337,315 998,902 765,271Textile others 2,282,350 1,937,098 2,935,380 2,365,528Cement - - 4,450 4,450Sugar 33,638 33,638 33,638 33,638Shoes and leather garments 226,903 224,110 241,948 180,321Automobile and transportation equipment 726,577 650,422 750,787 704,676Financial 2,151,805 57,003 10,125 10,125Electronics and electrical appliances 365,354 345,164 542,892 428,957Production and transmission of energy 3,049,109 2,981,719 2,927,748 1,942,137Paper and allied 179,264 113,240 173,212 116,438Surgical and metal - - 1,775 1,775Wholesale traders 1,167,377 881,274 1,024,613 648,018Fertilizer dealers 7,490 6,878 6,182 4,364Sports goods 128,325 128,325 280,675 279,310Food industries 1,258,725 964,667 795,442 781,194Construction 3,885,120 1,134,507 4,106,175 1,249,378Engineering 440,297 410,139 353,454 353,454Glass and allied 24,527 12,264 29,796 14,899Hotels 485,993 113,086 489,493 116,586Polyester and fibre 1,751,479 1,743,679 1,702,376 1,668,561Individuals 13,238,040 9,816,791 11,142,751 8,073,785Others 3,995,773 3,191,246 2,825,126 2,095,308
48,592,560 33,534,272 39,101,396 27,673,022
44.2.4 Details of non performing advances and specific provision by sector
2010 2009Classified Specific Classified SpecificAdvances Provision Held Advances Provision Held
------------------------ (Rupees in '000) ------------------------
Public / Government - - - -Private 48,592,560 33,534,272 39,101,396 27,673,022
48,592,560 33,534,272 39,101,396 27,673,022
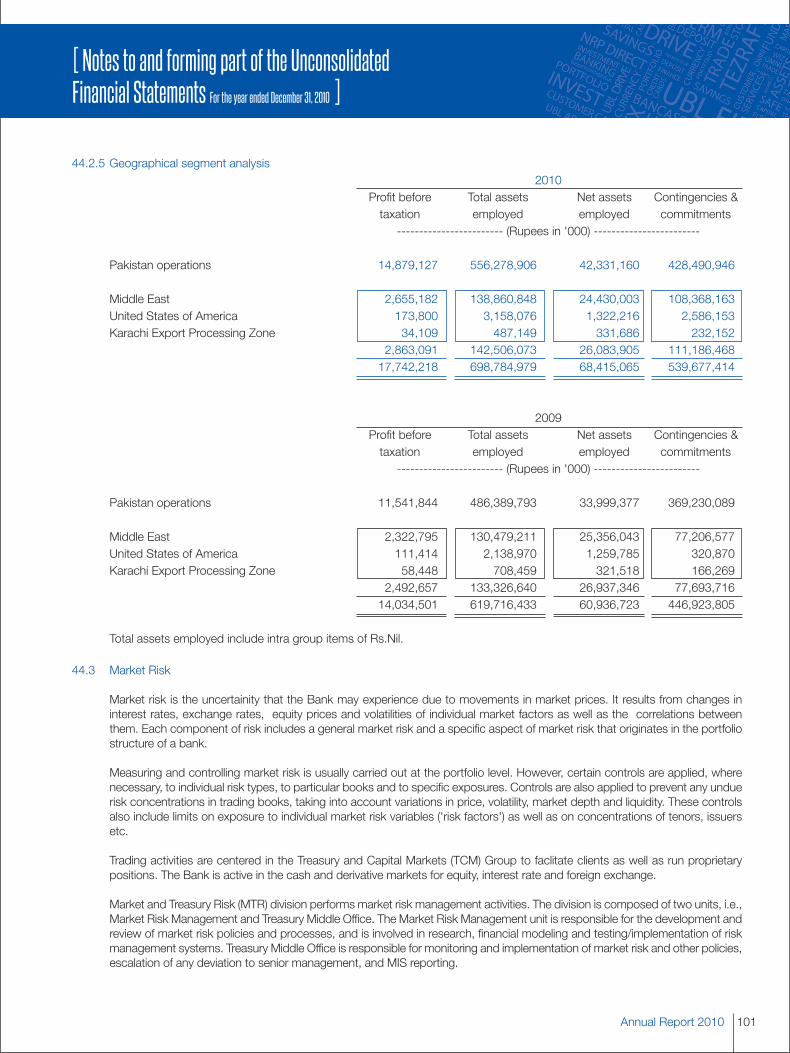
101Annual Report 2010
[ Notes to and forming part of the UnconsolidatedFinancial Statements For the year ended December 31, 2010 ]
44.2.5 Geographical segment analysis2010
Profit before Total assets Net assets Contingencies &taxation employed employed commitments
------------------------ (Rupees in '000) ------------------------
Pakistan operations 14,879,127 556,278,906 42,331,160 428,490,946
Middle East 2,655,182 138,860,848 24,430,003 108,368,163United States of America 173,800 3,158,076 1,322,216 2,586,153Karachi Export Processing Zone 34,109 487,149 331,686 232,152
2,863,091 142,506,073 26,083,905 111,186,46817,742,218 698,784,979 68,415,065 539,677,414
2009Profit before Total assets Net assets Contingencies &taxation employed employed commitments
------------------------ (Rupees in '000) ------------------------
Pakistan operations 11,541,844 486,389,793 33,999,377 369,230,089
Middle East 2,322,795 130,479,211 25,356,043 77,206,577United States of America 111,414 2,138,970 1,259,785 320,870Karachi Export Processing Zone 58,448 708,459 321,518 166,269
2,492,657 133,326,640 26,937,346 77,693,71614,034,501 619,716,433 60,936,723 446,923,805
Total assets employed include intra group items of Rs.Nil.
44.3 Market Risk
Market risk is the uncertainity that the Bank may experience due to movements in market prices. It results from changes ininterest rates, exchange rates, equity prices and volatilities of individual market factors as well as the correlations betweenthem. Each component of risk includes a general market risk and a specific aspect of market risk that originates in the portfoliostructure of a bank.
Measuring and controlling market risk is usually carried out at the portfolio level. However, certain controls are applied, wherenecessary, to individual risk types, to particular books and to specific exposures. Controls are also applied to prevent any unduerisk concentrations in trading books, taking into account variations in price, volatility, market depth and liquidity. These controlsalso include limits on exposure to individual market risk variables ('risk factors') as well as on concentrations of tenors, issuersetc.
Trading activities are centered in the Treasury and Capital Markets (TCM) Group to faclitate clients as well as run proprietarypositions. The Bank is active in the cash and derivative markets for equity, interest rate and foreign exchange.
Market and Treasury Risk (MTR) division performs market risk management activities. The division is composed of two units, i.e.,Market Risk Management and Treasury Middle Office. The Market Risk Management unit is responsible for the development andreview of market risk policies and processes, and is involved in research, financial modeling and testing/implementation of riskmanagement systems. Treasury Middle Office is responsible for monitoring and implementation of market risk and other policies,escalation of any deviation to senior management, and MIS reporting.

United Bank Limited102
[ Notes to and forming part of the UnconsolidatedFinancial Statements For the year ended December 31, 2010 ]
The scope of market risk management is as follows:
- To keep the market risk exposure within the Bank’s risk appetite as assigned by the Board of Directors (BoD) and the BoardRisk Management Committee (BRMC).
- To implement Risk Management policies approved by the BoD and BRMC jointly with the senior management throughMarket Risk Committee (MRC).
- To review new product proposals, propose/recommend/approve procedures for market risk management. Various limitsare assigned to different businesses on a product-portfolio basis. The products are approved through product programs,where risks are identified and limits and parameters are set. Any transaction/ product falling beyond the Product PolicyManual are approved through separate transaction / product memos.
- To develop, review and upgrade procedures for effective implementation of market risk management policy. It also includesimplementation of an Enterprise Risk Management solution for market risk.
- To maintain a comprehensive database for performing risk analysis, stress testing and scenario analysis. Stress testingactivities are performed on a quarterly basis which also includes banking book along with trading book.
44.3.1 Foreign Exchange Risk2010
Assets Liabilities Off - balance Net foreignsheet items currency
exposure------------------------ (Rupees in '000) ------------------------
Pakistan Rupee 546,744,646 470,070,512 (8,122,491) 68,551,643US Dollar 51,721,592 39,509,427 (12,599,803) (387,638)Pound Sterling 4,441,658 9,743,709 5,342,193 40,142Japanese Yen 10,406 7,916 1,053 3,543Euro 2,731,292 5,970,493 3,414,013 174,812UAE Dirham 73,556,548 82,624,436 8,968,295 (99,593)Bahraini Dinar 9,079,631 11,750,538 2,654,725 (16,182)Qatari Riyal 3,541,983 3,746,636 256,878 52,225Other Currencies 6,957,223 6,946,247 85,137 96,113
698,784,979 630,369,914 - 68,415,065
2009Assets Liabilities Off - balance Net foreign
sheet items currencyexposure
------------------------ (Rupees in '000) ------------------------
Pakistan Rupee 546,286,005 477,497,360 (7,384,117) 61,404,528US Dollar 33,366,944 33,073,859 (544,997) (251,912)Pound Sterling 998,474 7,051,265 5,995,613 (57,178)Japanese Yen 315,278 275,066 (41,117) (905)Euro 1,040,133 4,601,339 3,497,421 (63,785)UAE Dirham 3,078,195 2,121,758 (1,061,846) (105,409)Bahraini Dinar 18,850,218 18,874,901 - (24,683)Qatari Riyal 795,762 - (842,508) (46,746)Other Currencies 14,985,424 15,284,162 381,551 82,813
619,716,433 558,779,710 - 60,936,723
103Annual Report 2010
[ Notes to and forming part of the UnconsolidatedFinancial Statements For the year ended December 31, 2010 ]
Foreign Exchange Risk is the uncertainty that the Bank is exposed to due to changes in exchange rates. Foreign exchangepositions are reported on a consolidated basis and limits are used to monitor exposure in individual currencies.
The Bank is an active participant in currency cash and derivatives markets and carries currency risk from these tradingactivities, conducted primarily by Treasury and Capital Markets Group. These trading exposures are subject to prescribedstress tests and sensitivity analysis.
The Bank's reporting currency is the Pakistani Rupee, but its assets, liabilities, income and expenses are denominated indifferent currencies. Treasury and Capital Markets Group from time to time, proactively hedges significant expected foreigncurrency earnings / costs within a time horizon of up to one year, in accordance with the instructions of the SBP and subjectto pre-defined limits.
44.3.2 Equity position risk
Equity position risk arises due to changes in prices of individual stocks or levels of equity indices. The Bank’s equity bookcomprises of Held for Trading (HFT) & Available for Sale (AFS) portfolios. The objective of the HFT portfolio is to make short-term capital gains, whilst the AFS portfolio is maintained with a medium-term view of capital gains and dividend income.Separate product program manuals have been developed to discuss in detail the objectives and policies, risks and mitigants,limits and controls for the equity portfolios of the Bank.
44.3.3 Yield / Interest Rate Risk
Interest rate risk is the uncertainty resulting from changes in interest rates, including changes in the shape of yield curves.Interest rate risk is inherent in many of the Bank's businesses and arises from factors such as mismatches between contractualmaturities or re-pricing of on and off balance sheet assets and liabilities. Interest rate risk arises mainly through HTMinvestments, advances and deposits. The interest sensitivity profile is prepared on a quarterly basis based on the re-pricingor maturities of assets and liabilities.
The objective of yield / interest rate risk management is to minimize adverse variances in the Bank's profitability. Interest raterisk in the banking book is managed by performing periodic gap analysis, sensitivity analysis and stress testing.
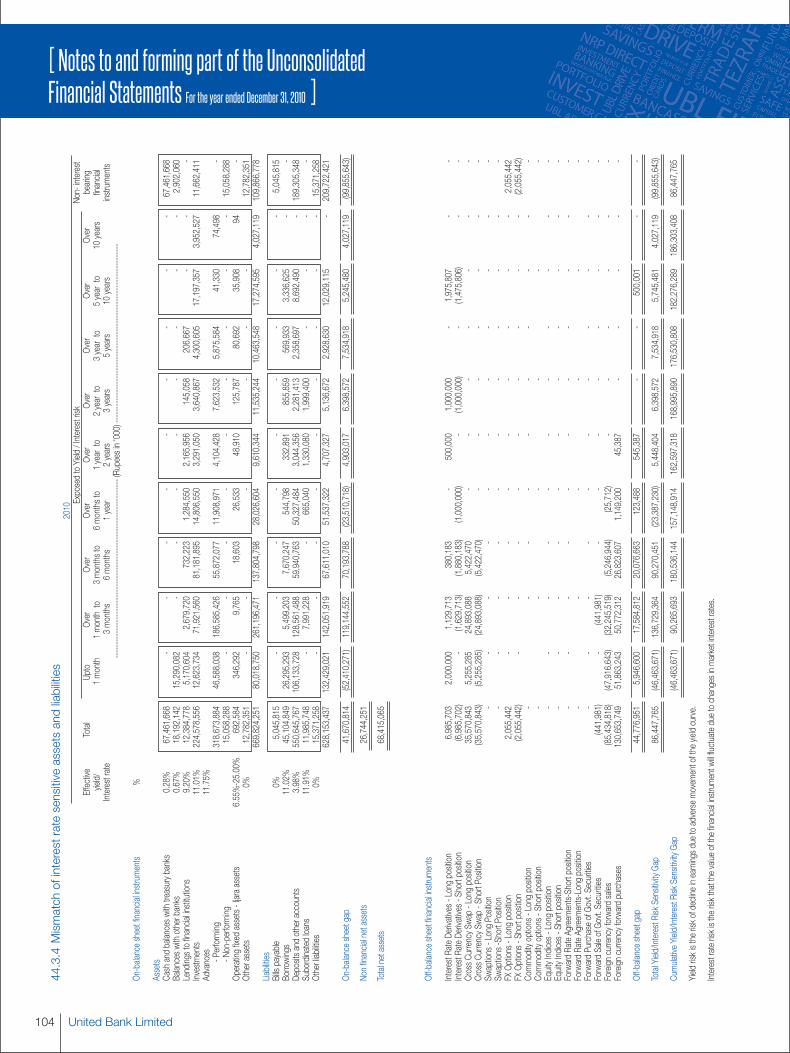
United Bank Limited104
[ Notes to and forming part of the UnconsolidatedFinancial Statements For the year ended December 31, 2010 ]
44.3.4Mismatchofinterestratesensitiveassetsandliabilities
2010ExposedtoYield
/Interestrisk
Non-interest
Effective
Total
Upto
Over
Over
Over
Over
Over
Over
Over
Over
bearing
yield/
1month
1monthto
3monthsto
6monthsto
1yearto
2yearto
3yearto
5yearto
10years
financial
Interestrate
3months
6months
1year
2years
3years
5years
10years
instruments
-----------------------------------------------------------------(Rupeesin'000)-----------------------------------------------------------------
On-balancesheetfinancialinstruments
%
Assets
Cashandbalanceswithtreasurybanks
0.28%
67,461,668
--
--
--
--
-67,461,668
Balanceswithotherbanks
0.67%
18,192,142
15,290,082
--
--
--
--
2,902,060
Lendingstofinancialinstitutions
9.20%
12,384,778
5,170,604
2,679,720
732,223
1,284,550
2,165,956
145,058
206,667
--
-Investments
11.01%
224,578,556
12,623,734
71,921,560
81,181,895
14,806,550
3,291,050
3,640,867
4,300,605
17,197,357
3,952,527
11,662,411
Advances
11.75%
-Performing
318,673,884
46,588,038
186,585,426
55,872,077
11,908,971
4,104,428
7,623,532
5,875,584
41,330
74,498
--Non-performing
15,058,288
--
--
--
--
-15,058,288
Operatingfixedassets-Ijaraassets
6.55%-25.00%
692,584
346,292
9,765
18,603
26,533
48,910
125,787
80,692
35,908
94-
Otherassets
0%12,782,351
--
--
--
12,782,351
669,824,251
80,018,750
261,196,471
137,804,798
28,026,604
9,610,344
11,535,244
10,463,548
17,274,595
4,027,119
109,866,778
Liabilities
Billspayable
0%5,045,815
--
--
--
--
-5,045,815
Borrowings
11.02%
45,104,849
26,295,293
5,499,203
7,670,247
544,798
332,891
855,859
569,933
3,336,625
--
Depositsandotheraccounts
3.98%
550,645,767
106,133,728
128,561,488
59,940,763
50,327,484
3,044,356
2,281,413
2,358,697
8,692,490
-189,305,348
Subordinatedloans
11.91%
11,985,748
-7,991,228
-665,040
1,330,080
1,999,400
--
--
Otherliabilities
0%15,371,258
--
--
--
--
-15,371,258
628,153,437
132,429,021
142,051,919
67,611,010
51,537,322
4,707,327
5,136,672
2,928,630
12,029,115
-209,722,421
On-balancesheetgap
41,670,814
(52,410,271)
119,144,552
70,193,788
(23,510,718)
4,903,017
6,398,572
7,534,918
5,245,480
4,027,119
(99,855,643)
Nonfinancialnetassets
26,744,251
Totalnetassets
68,415,065
Off-balancesheetfinancialinstruments
InterestRateDerivatives-Longposition
6,985,703
2,000,000
1,129,713
380,183
-500,000
1,000,000
-1,975,807
--
InterestRateDerivatives-Shortposition
(6,985,702)
-(1,629,713)
(1,880,183)
(1,000,000)
-(1,000,000)
-(1,475,806)
--
CrossCurrencySwap-Longposition
35,570,843
5,255,285
24,893,088
5,422,470
--
--
--
-CrossCurrencySwap-ShortPosition
(35,570,843)
(5,255,285)
(24,893,088)
(5,422,470)
--
--
--
-Swaptions-LongPosition
--
--
--
--
--
-Swaptions-ShortPosition
--
--
--
--
--
-FXOptions-Longposition
2,055,442
--
--
--
--
-2,055,442
FXOptions-Shortposition
(2,055,442)
--
--
--
--
-(2,055,442)
Commodityoptions-Longposition
--
--
--
--
--
Commodityoptions-Shortposition
--
--
--
EquityIndices-Longposition
--
--
--
--
--
-EquityIndices-Shortposition
--
--
--
--
--
-ForwardRateAgreements-Shortposition
--
--
--
--
--
-ForwardRateAgreements-Longposition
--
--
--
ForwardPurchaseofGovt.Securities
--
--
--
--
--
-ForwardSaleofGovt.Securities
(441,981)
-(441,981)
--
--
--
--
Foreigncurrencyforwardsales
(85,434,818)
(47,916,643)
(32,245,519)
(5,246,944)
(25,712)
--
--
--
Foreigncurrencyforwardpurchases
130,653,749
51,863,243
50,772,312
26,823,607
1,149,200
45,387
--
--
-
Off-balancesheetgap
44,776,951
5,946,600
17,584,812
20,076,663
123,488
545,387
--
500,001
--
TotalYield/InterestRiskSensitivityGap
86,447,765
(46,463,671)
136,729,364
90,270,451
(23,387,230)
5,448,404
6,398,572
7,534,918
5,745,481
4,027,119
(99,855,643)
CumulativeYield/InterestRiskSensitivityGap
(46,463,671)
90,265,693
180,536,144
157,148,914
162,597,318
168,995,890
176,530,808
182,276,289
186,303,408
86,447,765
Yield
riskistheriskofdeclineinearningsduetoadversemovementoftheyieldcurve.
Interestrateriskistheriskthatthevalue
ofthefinancialinstrumentwillfluctuateduetochangesinmarketinterestrates.
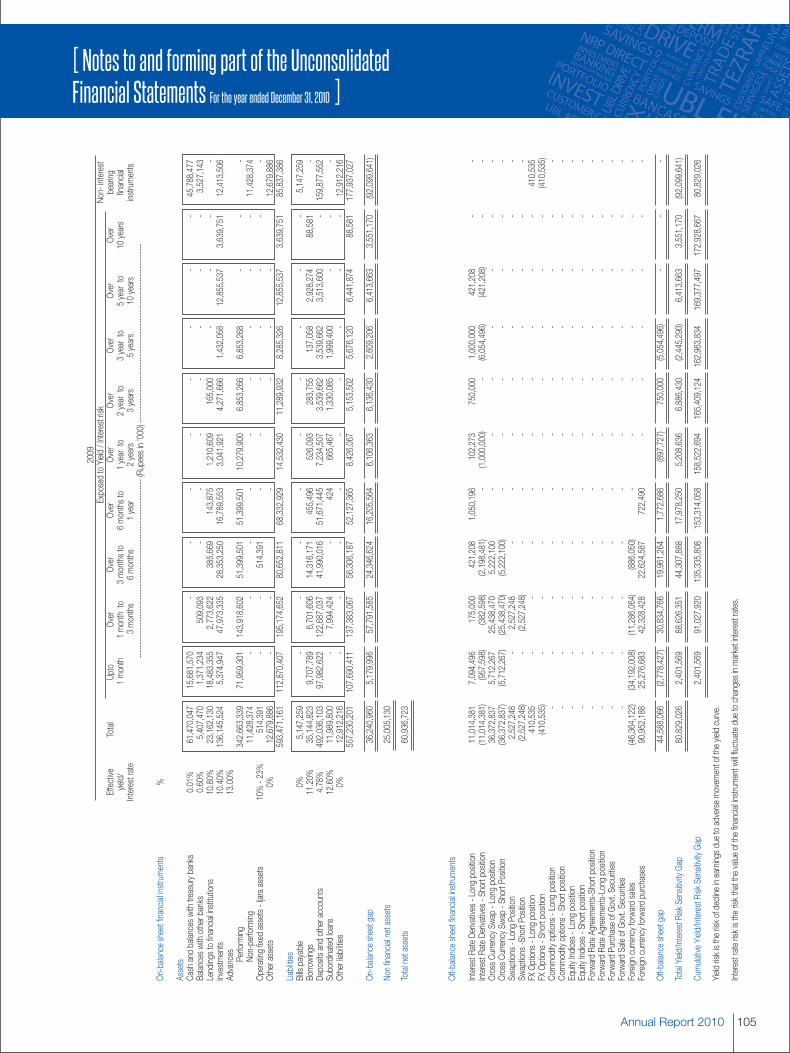
105Annual Report 2010
[ Notes to and forming part of the UnconsolidatedFinancial Statements For the year ended December 31, 2010 ]
2009
ExposedtoYield
/Interestrisk
Non-interest
Effective
Total
Upto
Over
Over
Over
Over
Over
Over
Over
Over
bearing
yield/
1month
1monthto
3monthsto
6monthsto
1yearto
2yearto
3yearto
5yearto
10years
financial
Interestrate
3months
6months
1year
2years
3years
5years
10years
instruments
-----------------------------------------------------------------(Rupeesin'000)-----------------------------------------------------------------
On-balancesheetfinancialinstruments
%
Assets
Cashandbalanceswithtreasurybanks
0.01%
61,470,047
15,681,570
--
--
--
--
45,788,477
Balanceswithotherbanks
0.60%
5,407,470
1,371,234
509,093
--
--
--
-3,527,143
Lendingstofinancialinstitutions
10.80%
23,162,130
18,483,355
2,773,622
385,669
143,875
1,210,609
165,000
--
--
Investments
10.40%
136,145,524
5,374,947
47,973,335
28,353,250
16,789,553
3,041,921
4,271,666
1,432,058
12,855,537
3,639,751
12,413,506
Advances
13.00%
Performing
342,663,339
71,959,301
143,918,602
51,399,501
51,399,501
10,279,900
6,853,266
6,853,268
--
-Non-performing
11,428,374
--
--
--
--
-11,428,374
Operatingfixedassets-Ijaraassets
10%-23%
514,391
--
514,391
--
--
--
-Otherassets
0%12,679,886
--
--
--
12,679,886
593,471,161
112,870,407
195,174,652
80,652,811
68,332,929
14,532,430
11,289,932
8,285,326
12,855,537
3,639,751
85,837,386
Liabilities
Billspayable
0%5,147,259
--
--
--
--
-5,147,259
Borrowings
11.20%
35,144,823
9,707,789
6,701,606
14,316,171
455,496
526,093
283,755
137,058
2,928,274
88,581
-Depositsandotheraccounts
4.78%
492,036,103
97,982,622
122,687,037
41,990,016
51,671,445
7,234,507
3,539,662
3,539,662
3,513,600
-159,877,552
Subordinatedloans
12.60%
11,989,800
-7,994,424
-424
665,467
1,330,085
1,999,400
--
-Otherliabilities
0%12,912,216
--
--
--
--
-12,912,216
557,230,201
107,690,411
137,383,067
56,306,187
52,127,365
8,426,067
5,153,502
5,676,120
6,441,874
88,581
177,937,027
On-balancesheetgap
36,240,960
5,179,996
57,791,585
24,346,624
16,205,564
6,106,363
6,136,430
2,609,206
6,413,663
3,551,170
(92,099,641)
Nonfinancialnetassets
25,005,130
Totalnetassets
60,936,723
Off-balancesheetfinancialinstruments
InterestRateDerivatives-Longposition
11,014,381
7,094,496
175,000
421,208
1,050,196
102,273
750,000
1,000,000
421,208
--
InterestRateDerivatives-Shortposition
(11,014,381)
(957,598)
(382,598)
(2,198,481)
-(1,000,000)
-(6,054,496)
(421,208)
--
CrossCurrencySwap-Longposition
36,372,837
5,712,267
25,438,470
5,222,100
--
--
--
-CrossCurrencySwap-ShortPosition
(36,372,837)
(5,712,267)
(25,438,470)
(5,222,100)
--
--
--
-Swaptions-LongPosition
2,527,248
-2,527,248
--
--
--
--
Swaptions-ShortPosition
(2,527,248)
-(2,527,248)
--
--
--
--
FXOptions-Longposition
410,535
--
--
--
--
-410,535
FXOptions-Shortposition
(410,535)
--
--
--
--
-(410,535)
Commodityoptions-Longposition
--
--
--
--
--
-Commodityoptions-Shortposition
--
--
--
--
--
-EquityIndices-Longposition
--
--
--
--
--
-EquityIndices-Shortposition
--
--
--
--
--
-ForwardRateAgreements-Shortposition
--
--
--
--
--
-ForwardRateAgreements-Longposition
--
--
--
--
--
-ForwardPurchaseofGovt.Securities
--
--
--
--
--
-ForwardSaleofGovt.Securities
--
--
--
--
--
-Foreigncurrencyforwardsales
(46,364,122)
(34,192,008)
(11,286,064)
(886,050)
--
--
--
-Foreigncurrencyforwardpurchases
90,952,188
25,276,683
42,328,428
22,624,587
722,490
--
--
--
Off-balancesheetgap
44,588,066
(2,778,427)
30,834,766
19,961,264
1,772,686
(897,727)
750,000
(5,054,496)
--
-
TotalYield/InterestRiskSensitivityGap
80,829,026
2,401,569
88,626,351
44,307,888
17,978,250
5,208,636
6,886,430
(2,445,290)
6,413,663
3,551,170
(92,099,641)
CumulativeYield/InterestRiskSensitivityGap
2,401,569
91,027,920
135,335,808
153,314,058
158,522,694
165,409,124
162,963,834
169,377,497
172,928,667
80,829,026
Yield
riskistheriskofdeclineinearningsduetoadversemovementoftheyieldcurve.
Interestrateriskistheriskthatthevalue
ofthefinancialinstrumentwillfluctuateduetochangesinmarketinterestrates.
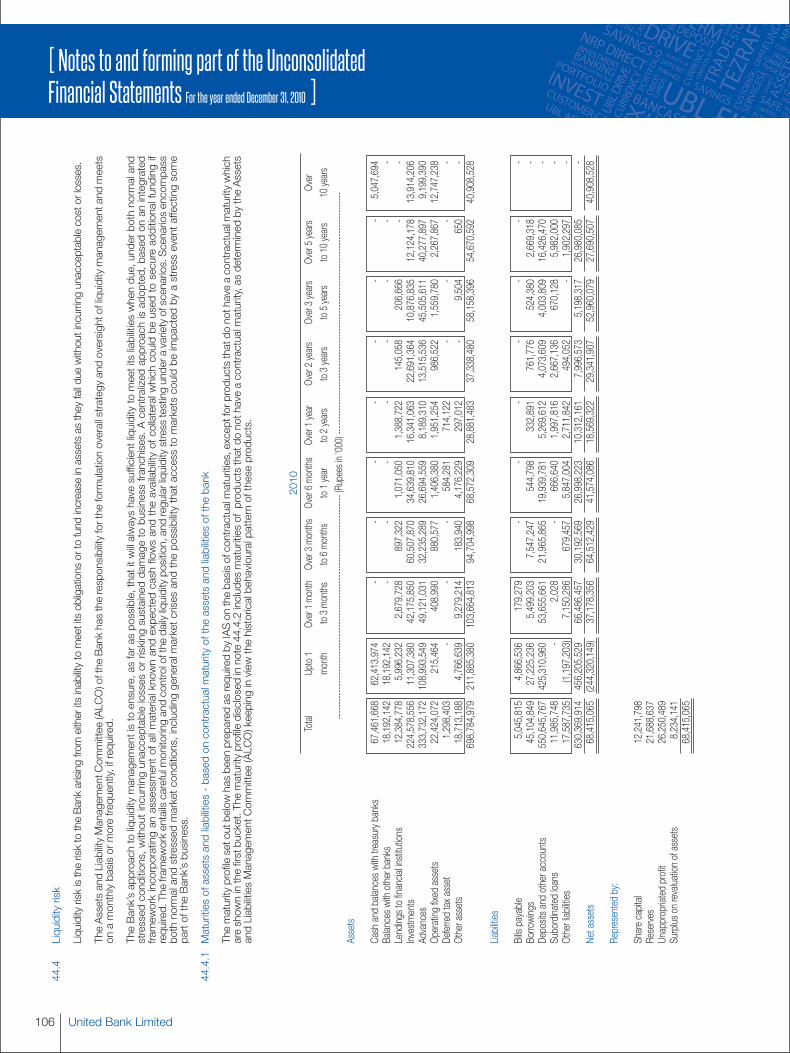
United Bank Limited106
[ Notes to and forming part of the UnconsolidatedFinancial Statements For the year ended December 31, 2010 ]
44.4
Liquidityrisk
LiquidityriskistherisktotheBankarisingfromeitheritsinabilitytomeetitsobligationsortofundincreaseinassetsastheyfallduewithoutincurringunacceptablecostorlosses.
TheAssetsandLiabilityManagementCommittee(ALCO)oftheBankhastheresponsibilityfortheformulationoverallstrategyandoversightofliquiditymanagementandmeets
onamonthlybasisormorefrequently,ifrequired.
TheBank’sapproachtoliquiditymanagementistoensure,asfaraspossible,thatitwillalwayshavesufficientliquiditytomeetitsliabilitieswhendue,underbothnormaland
stressed
conditions,withoutincurringunacceptablelossesorrisking
sustaineddamagetobusinessfranchises.Acentralized
approachisadopted,basedon
anintegrated
frameworkincorporatinganassessmentofallmaterialknownandexpected
cashflowsandtheavailabilityofcollateralwhichcouldbe
used
tosecureadditionalfunding
ifrequired.Theframeworkentailscarefulmonitoringandcontrolofthedailyliquidityposition,andregularliquiditystresstestingunderavarietyofscenarios.Scenariosencompass
bothnormalandstressedmarketconditions,includinggeneralmarketcrisesandthepossibilitythataccesstomarketscouldbeimpactedbyastresseventaffectingsome
partoftheBank’sbusiness.
44.4.1
Maturitiesofassetsandliabilities-basedoncontractualmaturityoftheassetsandliabilitiesofthebank
ThematurityprofilesetoutbelowhasbeenpreparedasrequiredbyIASonthebasisofcontractualmaturities,exceptforproductsthatdonothaveacontractualmaturitywhich
areshowninthefirstbucket.Thematurityprofiledisclosedinnote44.4.2includesmaturitiesofproductsthatdonothaveacontractualmaturity,asdeterminedbytheAssets
andLiabilitiesManagementCommittee(ALCO)keepinginview
thehistoricalbehaviouralpatternoftheseproducts.
2010
Total
Upto1
Over1month
Over3months
Over6months
Over1year
Over2years
Over3years
Over5years
Over
month
to3months
to6months
to1year
to2years
to3years
to5years
to10years
10years
----------------------------------------------------------------------------(Rupeesin'000)----------------------------------------------------------------------------------
Assets
Cashandbalanceswithtreasurybanks
67,461,668
62,413,974
--
--
--
-5,047,694
Balanceswithotherbanks
18,192,142
18,192,142
--
--
--
--
Lendingstofinancialinstitutions
12,384,778
5,996,232
2,679,728
897,322
1,071,050
1,388,722
145,058
206,666
--
Investments
224,578,556
11,307,380
42,175,850
60,507,870
34,639,810
16,341,063
22,691,364
10,876,835
12,124,178
13,914,206
Advances
333,732,172
108,993,549
49,121,031
32,235,289
26,694,559
8,189,310
13,515,536
45,505,611
40,277,897
9,199,390
Operatingfixedassets
22,424,072
215,464
408,990
880,577
1,406,380
1,951,254
986,522
1,559,780
2,267,867
12,747,238
Deferredtaxasset
1,298,403
--
-584,281
714,122
--
--
Otherassets
18,713,188
4,766,639
9,279,214
183,940
4,176,229
297,012
-9,504
650
-698,784,979
211,885,380
103,664,813
94,704,998
68,572,309
28,881,483
37,338,480
58,158,396
54,670,592
40,908,528
Liabilities
Billspayable
5,045,815
4,866,536
179,279
--
--
--
-Borrowings
45,104,849
27,225,236
5,499,203
7,547,247
544,798
332,891
761,776
524,380
2,669,318
-Depositsandotheraccounts
550,645,767
425,310,960
53,655,661
21,965,865
19,939,781
5,269,612
4,073,609
4,003,809
16,426,470
-Subordinatedloans
11,985,748
-2,028
-666,640
1,997,816
2,667,136
670,128
5,982,000
-Otherliabilities
17,587,735
(1,197,203)
7,150,286
679,457
5,847,004
2,711,842
494,052
-1,902,297
-630,369,914
456,205,529
66,486,457
30,192,569
26,998,223
10,312,161
7,996,573
5,198,317
26,980,085
-Netassets
68,415,065
(244,320,149)
37,178,356
64,512,429
41,574,086
18,569,322
29,341,907
52,960,079
27,690,507
40,908,528
Representedby:
Sharecapital
12,241,798
Reserves
21,688,637
Unappropriatedprofit
26,250,489
Surplus
onrevaluationofassets
8,234,141
68,415,065
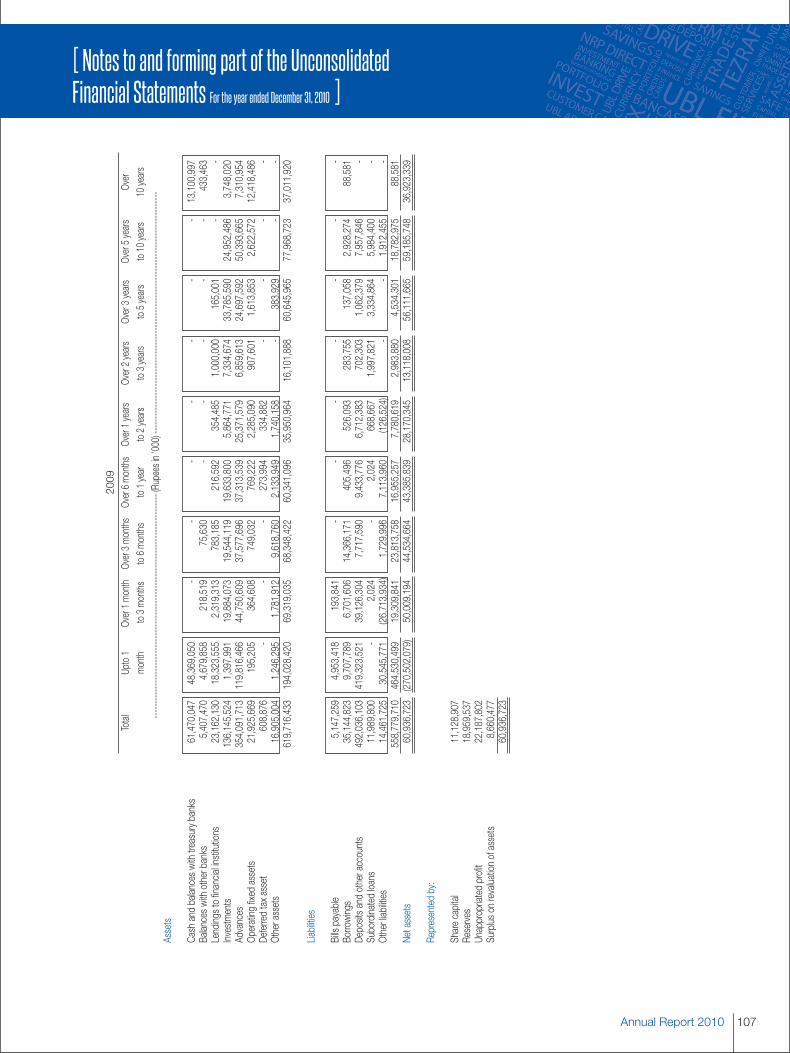
107Annual Report 2010
[ Notes to and forming part of the UnconsolidatedFinancial Statements For the year ended December 31, 2010 ]
2009
Total
Upto1
Over1month
Over3months
Over6months
Over1years
Over2years
Over3years
Over5years
Over
month
to3months
to6months
to1year
to2years
to3years
to5years
to10years
10years
----------------------------------------------------------------------------(Rupeesin'000)----------------------------------------------------------------------------------
Assets
Cashandbalanceswithtreasurybanks
61,470,047
48,369,050
--
--
--
-13,100,997
Balanceswithotherbanks
5,407,470
4,679,858
218,519
75,630
--
--
-433,463
Lendingstofinancialinstitutions
23,162,130
18,323,555
2,319,313
783,185
216,592
354,485
1,000,000
165,001
--
Investments
136,145,524
1,397,991
19,884,073
19,544,119
19,633,800
5,864,771
7,334,674
33,785,590
24,952,486
3,748,020
Advances
354,091,713
119,816,466
44,750,609
37,577,696
37,313,539
25,371,579
6,859,613
24,697,592
50,393,665
7,310,954
Operatingfixedassets
21,925,669
195,205
364,608
749,032
769,222
2,285,090
907,601
1,613,853
2,622,572
12,418,486
Deferredtaxasset
608,876
--
-273,994
334,882
--
--
Otherassets
16,905,004
1,246,295
1,781,912
9,618,760
2,133,949
1,740,158
-383,929
--
619,716,433
194,028,420
69,319,035
68,348,422
60,341,096
35,950,964
16,101,888
60,645,965
77,968,723
37,011,920
Liabilities
Billspayable
5,147,259
4,953,418
193,841
--
--
--
-Borrowings
35,144,823
9,707,789
6,701,606
14,366,171
405,496
526,093
283,755
137,058
2,928,274
88,581
Depositsandotheraccounts
492,036,103
419,323,521
39,126,304
7,717,590
9,433,776
6,712,383
702,303
1,062,379
7,957,846
-Subordinatedloans
11,989,800
-2,024
-2,024
668,667
1,997,821
3,334,864
5,984,400
-Otherliabilities
14,461,725
30,545,771
(26,713,934)
1,729,996
7,113,960
(126,524)
--
1,912,455
-558,779,710
464,530,499
19,309,841
23,813,758
16,955,257
7,780,619
2,983,880
4,534,301
18,782,975
88,581
Netassets
60,936,723
(270,502,079)
50,009,194
44,534,664
43,385,839
28,170,345
13,118,008
56,111,665
59,185,748
36,923,339
Representedby:
Sharecapital
11,128,907
Reserves
18,959,537
Unappropriatedprofit
22,187,802
Surplus
onrevaluationofassets
8,660,477
60,936,723
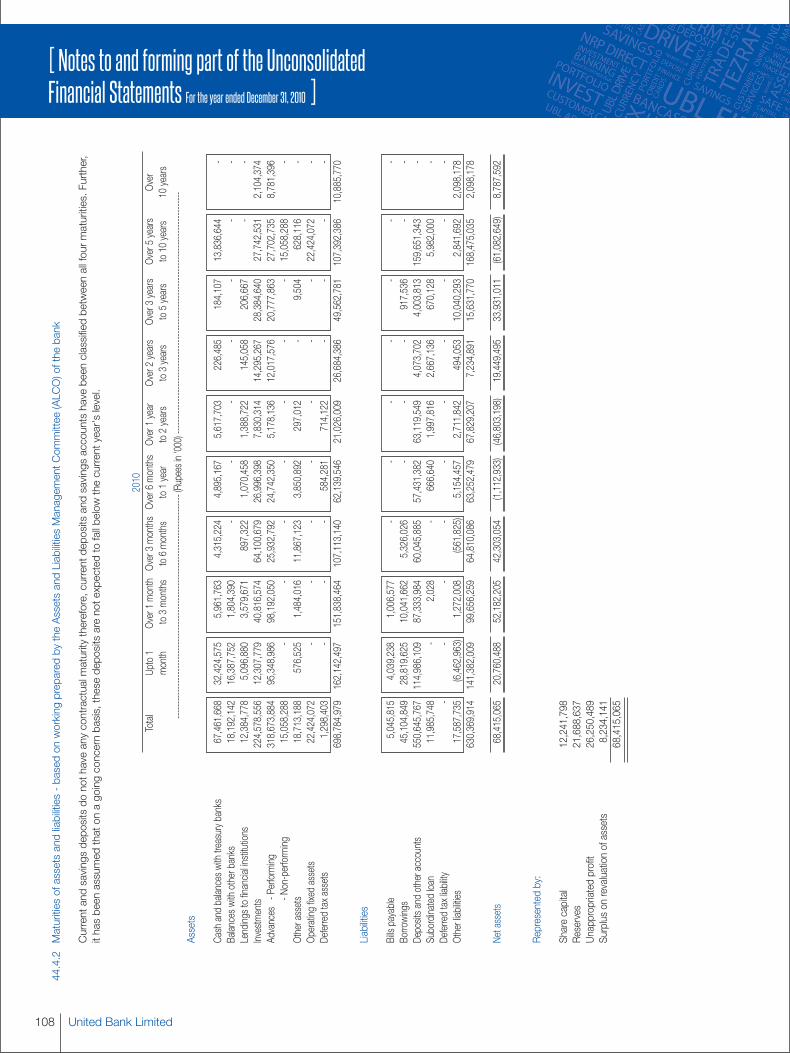
United Bank Limited108
[ Notes to and forming part of the UnconsolidatedFinancial Statements For the year ended December 31, 2010 ]
44.4.2
Maturitiesofassetsandliabilities-basedonworkingpreparedbytheAssetsandLiabilitiesManagementCommittee(ALCO)ofthebank
Currentandsavingsdepositsdonothaveanycontractualmaturitytherefore,currentdepositsandsavingsaccountshavebeenclassifiedbetweenallfourmaturities.Further,
ithasbeenassumedthatonagoingconcernbasis,thesedepositsarenotexpectedtofallbelowthecurrentyear'slevel.
2010
Total
Upto1
Over1
month
Over3
monthsOver6
months
Over1
year
Over2
years
Over3
years
Over5
years
Over
month
to3months
to6months
to1year
to2years
to3years
to5years
to10years
10years
----------------------------------------------------------------------------(Rupeesin'000)----------------------------------------------------------------------------------
Assets
Cashandbalanceswithtreasurybanks
67,461,668
32,424,575
5,961,763
4,315,224
4,895,167
5,617,703
226,485
184,107
13,836,644
-Balanceswithotherbanks
18,192,142
16,387,752
1,804,390
--
--
--
-Lendingstofinancialinstitutions
12,384,778
5,096,880
3,579,671
897,322
1,070,458
1,388,722
145,058
206,667
--
Investments
224,578,556
12,307,779
40,816,574
64,100,679
26,996,398
7,830,314
14,295,267
28,384,640
27,742,531
2,104,374
Advances
-Performing
318,673,884
95,348,986
98,192,050
25,932,792
24,742,350
5,178,136
12,017,576
20,777,863
27,702,735
8,781,396
-Non-performing
15,058,288
--
--
--
-15,058,288
-Otherassets
18,713,188
576,525
1,484,016
11,867,123
3,850,892
297,012
-9,504
628,116
-Operatingfixedassets
22,424,072
--
--
--
-22,424,072
-Deferredtaxassets
1,298,403
--
-584,281
714,122
--
--
698,784,979
162,142,497
151,838,464
107,113,140
62,139,546
21,026,009
26,684,386
49,562,781
107,392,386
10,885,770
Liabilities
Billspayable
5,045,815
4,039,238
1,006,577
--
--
--
-Borrowings
45,104,849
28,819,625
10,041,662
5,326,026
--
-917,536
--
Depositsandotheraccounts
550,645,767
114,986,109
87,333,984
60,045,885
57,431,382
63,119,549
4,073,702
4,003,813
159,651,343
-Subordinatedloan
11,985,748
-2,028
-666,640
1,997,816
2,667,136
670,128
5,982,000
-Deferredtaxliability
--
--
--
--
--
Otherliabilities
17,587,735
(6,462,963)
1,272,008
(561,825)
5,154,457
2,711,842
494,053
10,040,293
2,841,692
2,098,178
630,369,914
141,382,009
99,656,259
64,810,086
63,252,479
67,829,207
7,234,891
15,631,770
168,475,035
2,098,178
Netassets
68,415,065
20,760,488
52,182,205
42,303,054
(1,112,933)
(46,803,198)
19,449,495
33,931,011
(61,082,649)
8,787,592
Representedby:
Sharecapital
12,241,798
Reserves
21,688,637
Unappropriatedprofit
26,250,489
Surplusonrevaluationofassets
8,234,141
68,415,065
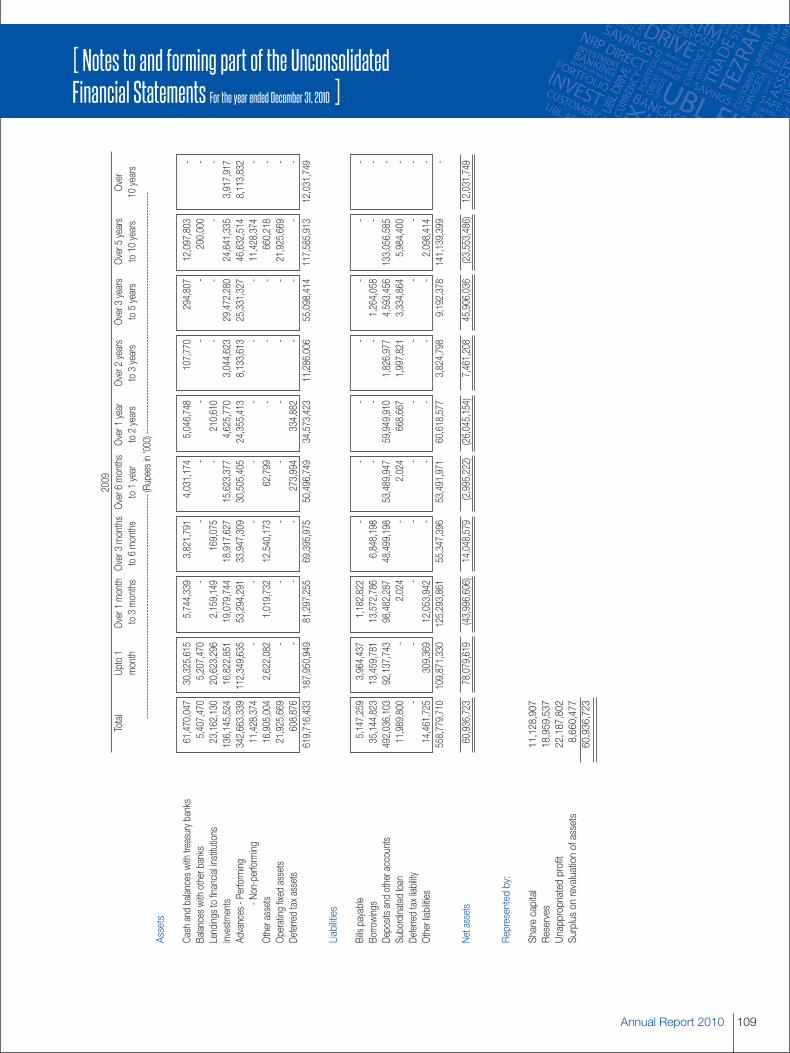
109Annual Report 2010
[ Notes to and forming part of the UnconsolidatedFinancial Statements For the year ended December 31, 2010 ]
2009
Total
Upto1
Over1
month
Over3
monthsOver6
months
Over1
year
Over2
years
Over3
years
Over5
years
Over
month
to3months
to6months
to1year
to2years
to3years
to5years
to10years
10years
----------------------------------------------------------------------------(Rupeesin'000)----------------------------------------------------------------------------------
Assets
Cashandbalanceswithtreasurybanks
61,470,047
30,325,615
5,744,339
3,821,791
4,031,174
5,046,748
107,770
294,807
12,097,803
-Balanceswithotherbanks
5,407,470
5,207,470
--
--
--
200,000
-Lendingstofinancialinstitutions
23,162,130
20,623,296
2,159,149
169,075
-210,610
--
--
Investments
136,145,524
16,822,851
19,079,744
18,917,627
15,623,377
4,625,770
3,044,623
29,472,280
24,641,335
3,917,917
Advances-Performing
342,663,339
112,349,635
53,294,291
33,947,309
30,505,405
24,355,413
8,133,613
25,331,327
46,632,514
8,113,832
-Non-performing
11,428,374
--
--
--
-11,428,374
-Otherassets
16,905,004
2,622,082
1,019,732
12,540,173
62,799
--
-660,218
-Operatingfixedassets
21,925,669
--
--
--
-21,925,669
-Deferredtaxassets
608,876
--
-273,994
334,882
--
--
619,716,433
187,950,949
81,297,255
69,395,975
50,496,749
34,573,423
11,286,006
55,098,414
117,585,913
12,031,749
Liabilities
Billspayable
5,147,259
3,964,437
1,182,822
--
--
--
-Borrowings
35,144,823
13,459,781
13,572,786
6,848,198
--
-1,264,058
--
Depositsandotheraccounts
492,036,103
92,137,743
98,482,287
48,499,198
53,489,947
59,949,910
1,826,977
4,593,456
133,056,585
-Subordinatedloan
11,989,800
-2,024
-2,024
668,667
1,997,821
3,334,864
5,984,400
-Deferredtaxliability
--
--
--
--
--
Otherliabilities
14,461,725
309,369
12,053,942
--
--
-2,098,414
-558,779,710
109,871,330
125,293,861
55,347,396
53,491,971
60,618,577
3,824,798
9,192,378
141,139,399
-
Netassets
60,936,723
78,079,619
(43,996,606)
14,048,579
(2,995,222)
(26,045,154)
7,461,208
45,906,036
(23,553,486)
12,031,749
Representedby:
Sharecapital
11,128,907
Reserves
18,959,537
Unappropriatedprofit
22,187,802
Surplusonrevaluationofassets
8,660,477
60,936,723
United Bank Limited110
[ Notes to and forming part of the UnconsolidatedFinancial Statements For the year ended December 31, 2010 ]
44.5 Operational risk
Operational risk is the risk of loss resulting from inadequate or failed internal processes, people and systems or fromexternal events.
The Bank’s Operational Risk Management implementation framework is based on the advanced risk management architecture.The framework is flexible enough to implement in stages, and permits the overall risk management approach to evolve inresponse to organizational learning and the future needs of the organization.
Following are the high-level strategic initiatives that the Bank has undertaken for the effective implementation of OperationalRisk Management:
- Recruiting skilled resources for Operational Risk Management.
- Developing an operational risk management infrastructure.
- Determining the current state of key risks and their controls residing in each business unit.
- Developing policies, procedures and defining end-to-end information flow to establish a vigorous governance infrastructure.
- Implementing systems for data collection, migration, validation and retention for current and historical reference and calculation.
A consolidated Business Continuity Plan is being augmented for the Bank which encompasses roles and responsibilities,recovery strategy, IT and structural backups, scenario and impact analyses and testing directives.
There are several IT developments underway in the credit, market and operational risk areas. Specifically for operational riskmitigation and control, an IT infrastructure is being developed along with the other high-level initiatives, including process re-engineering and creating an inventory of risks and controls within the Bank. A methodology for Risk and Control SelfAssessment has been implemented at all core units of the Bank.
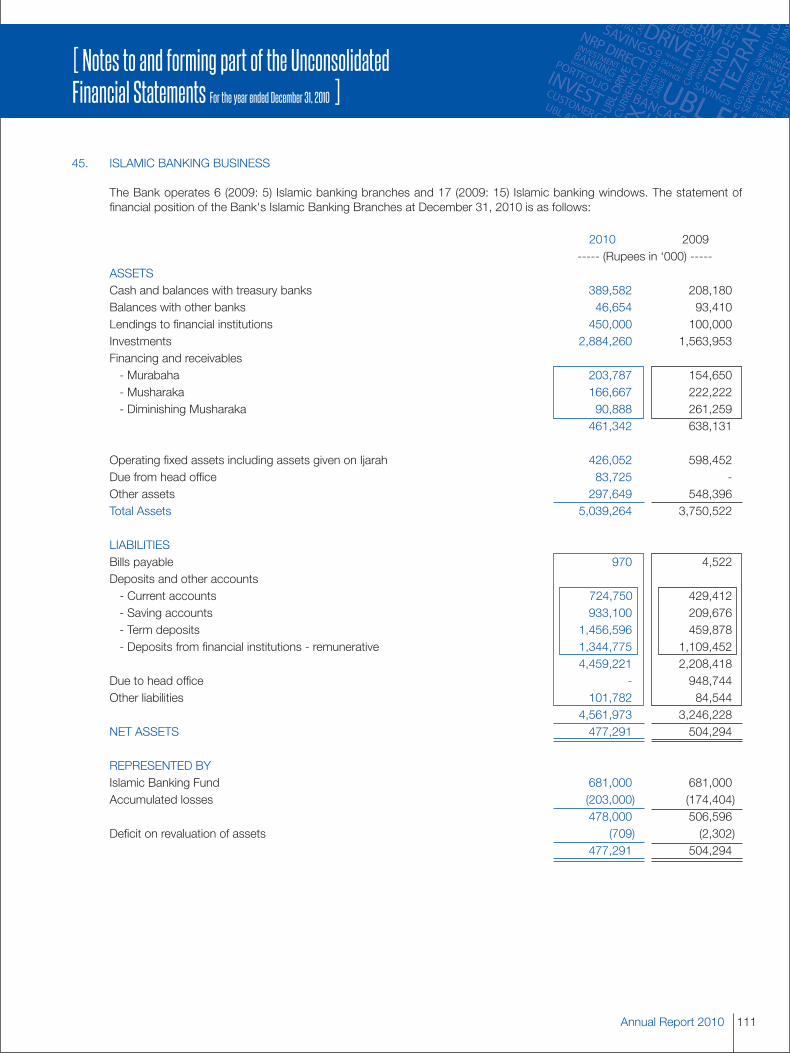
111Annual Report 2010
[ Notes to and forming part of the UnconsolidatedFinancial Statements For the year ended December 31, 2010 ]
45. ISLAMIC BANKING BUSINESS
The Bank operates 6 (2009: 5) Islamic banking branches and 17 (2009: 15) Islamic banking windows. The statement offinancial position of the Bank's Islamic Banking Branches at December 31, 2010 is as follows:
2010 2009----- (Rupees in ‘000) -----
ASSETSCash and balances with treasury banks 389,582 208,180Balances with other banks 46,654 93,410Lendings to financial institutions 450,000 100,000Investments 2,884,260 1,563,953Financing and receivables- Murabaha 203,787 154,650- Musharaka 166,667 222,222- Diminishing Musharaka 90,888 261,259
461,342 638,131
Operating fixed assets including assets given on Ijarah 426,052 598,452Due from head office 83,725 -Other assets 297,649 548,396Total Assets 5,039,264 3,750,522
LIABILITIESBills payable 970 4,522Deposits and other accounts- Current accounts 724,750 429,412- Saving accounts 933,100 209,676- Term deposits 1,456,596 459,878- Deposits from financial institutions - remunerative 1,344,775 1,109,452
4,459,221 2,208,418Due to head office - 948,744Other liabilities 101,782 84,544
4,561,973 3,246,228NET ASSETS 477,291 504,294
REPRESENTED BYIslamic Banking Fund 681,000 681,000Accumulated losses (203,000) (174,404)
478,000 506,596Deficit on revaluation of assets (709) (2,302)
477,291 504,294
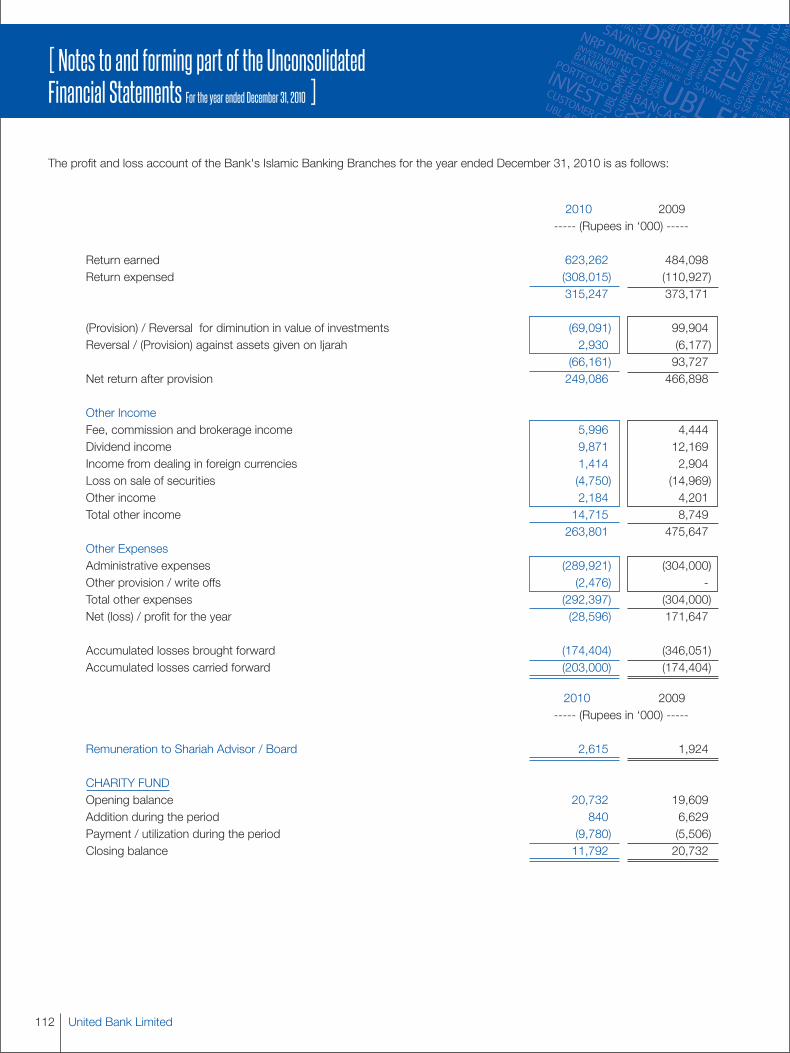
United Bank Limited112
[ Notes to and forming part of the UnconsolidatedFinancial Statements For the year ended December 31, 2010 ]
The profit and loss account of the Bank's Islamic Banking Branches for the year ended December 31, 2010 is as follows:
2010 2009----- (Rupees in ‘000) -----
Return earned 623,262 484,098Return expensed (308,015) (110,927)
315,247 373,171
(Provision) / Reversal for diminution in value of investments (69,091) 99,904Reversal / (Provision) against assets given on Ijarah 2,930 (6,177)
(66,161) 93,727Net return after provision 249,086 466,898
Other IncomeFee, commission and brokerage income 5,996 4,444Dividend income 9,871 12,169Income from dealing in foreign currencies 1,414 2,904Loss on sale of securities (4,750) (14,969)Other income 2,184 4,201Total other income 14,715 8,749
263,801 475,647Other ExpensesAdministrative expenses (289,921) (304,000)Other provision / write offs (2,476) -Total other expenses (292,397) (304,000)Net (loss) / profit for the year (28,596) 171,647
Accumulated losses brought forward (174,404) (346,051)Accumulated losses carried forward (203,000) (174,404)
2010 2009----- (Rupees in ‘000) -----
Remuneration to Shariah Advisor / Board 2,615 1,924
CHARITY FUNDOpening balance 20,732 19,609Addition during the period 840 6,629Payment / utilization during the period (9,780) (5,506)Closing balance 11,792 20,732
113Annual Report 2010
[ Notes to and forming part of the UnconsolidatedFinancial Statements For the year ended December 31, 2010 ]
46. NON-ADJUSTING EVENT AFTER THE BALANCE SHEET DATE
The Board of Directors in its meeting held on February 21, 2011 has proposed a cash dividend in respect of 2010 of Rs.4per share (2009: cash dividend Rs.2.50 per share). In addition, the directors have also announced a bonus issue of Nil (2009:10%). These appropriations will be approved in the forthcoming Annual General Meeting. The unconsolidated financialstatements for the year ended December 31, 2010 do not include the effect of these appropriations which will be accountedfor in the unconsolidated financial statements for the year ending December 31, 2011.
47. DATE OF AUTHORIZATION
These financial statements were authorized for issue on February 21, 2011, by the Board of Directors of the Bank.
48. GENERAL
48.1 Comparatives
Comparative information has been re-classified, re-arranged or additionally incorporated in these unconsolidated financialstatements for the purposes of better presentation. Major reclassifications made are as follows:
- Rs.249.990 million has been reclassified from other income - others to mark-up/interest earned on advances to customers(income on ijarah financing)
- Rs.1,122.772 million has been reclassified from balance with SBP in foreign currency deposit account to balance with SBPin foreign currency current account
- Rs.1,650.896 million has been reclassified from borrowing in Pakistan to borrowing outside Pakistan.
- Unrealized mark-up held in suspense account amounting to Rs. 1,087.189 million has been merged with provision againstother assets.
48.2 Figures have been rounded off to the nearest thousand rupees unless otherwise stated.
Atif R. BokhariPresident &
Chief Executive Officer
Muhammad Sami SaeedDirector
Sir Mohammed Anwar Pervez , OBE, HPkDeputy Chairman
Nahayan Mabarak Al NahayanChairman

United Bank Limited114
[ Annexure 'A' as referred to in note 9.8 of Bank'sUnconsolidated Financial Statements ]
1) Particulars of Investment held in listed companies and modarbas
Investee Number of Paid up value Total paid up Costshares / per share / value
certificates held certificate
(Rupees) (Rupees in '000)Held for trading securities
Investment in ordinary shares
Engro Corporation Limited 20,000 10.00 200 3,912Lotte Pakistan PTA Limited 250,000 10.00 2,500 3,287Nishat Chunian Limited 50,000 10.00 500 1,150Pakistan Telecommunication Company Limited 30,000 10.00 300 579
8,928Available for sale securities
Investment in ordinary shares
Adamjee Insurance Company Limited 2,006,000 10.00 20,060 269,001Arif Habib Corporation Limited 1,810,000 10.00 18,100 78,803Atlas Fund Of Funds 800,000 10.00 8,000 7,619Bank Al-Falah Limited 3,683,029 10.00 36,830 46,634BOC Pakistan Limited 338,202 10.00 3,382 44,831D.G. Khan Cement Limited 3,337,387 10.00 33,374 192,199Engro Polymer & Chemicals Limited 3,950,857 10.00 39,509 69,785Fauji Cement Company Limited 105,378,671 10.00 1,053,787 1,710,520First Dawood Mutual Fund 491,000 10.00 4,910 4,227Hira Textile Mills Limited 2,000,000 10.00 20,000 25,000IGI Investment Bank Limited 9,986,501 10.00 99,865 99,865Jahangir Siddiqui & Company Limited 2,000,000 10.00 20,000 91,564KASB Securities Limited 2,342,117 10.00 23,421 158,093Kohat Textile Mills Ltd 100,000 10.00 1,000 1,000Lotte Pakistan PTA Limited 2,489,771 10.00 24,898 33,593National Bank Of Pakistan 1,000,000 10.00 10,000 75,073Nishat Mills Limited 400,000 10.00 4,000 23,230Nishat Power Limited 3,359,679 10.00 33,597 53,318Pak Oilfields Limited 300,000 10.00 3,000 88,111Pakistan Petroleum Limited 523,148 10.00 5,231 113,580Pakistan State Oil Company Limited 1,003,000 10.00 10,030 301,337Pakistan Telecommunication Company Limited 650,000 10.00 6,500 32,800Sakrand Sugar Mills Limited 1,443,540 10.00 14,435 10,936Saritow Spinning Mills Limited 409,000 10.00 4,090 4,090Shell Pakistan Limited 106,672 10.00 1,067 24,966Visa Inc. 12,805 4,193.83 53,702 53,702DP World 138,528 8.56 1,186 15,422
3,629,299Investments in preference shares
Chenab Limited 7,889,482 10.00 78,895 78,895Masood Textile Mills Limited 11,000,000 10.00 110,000 110,000JSC Alliance Bank 95,720 3,892.00 275,082 275,082
463,977Investments in units of mutual funds
Atlas Stock Market Fund 17,364 100.00 1,736 5,000Faysal Asset Allocation Fund 406,890 500.00 203,445 38,386Faysal Balance Growth Funds 117,392 50.00 5,870 7,201Meezan Islamic Income Funds 2,209,003 50.00 110,450 114,075
164,662
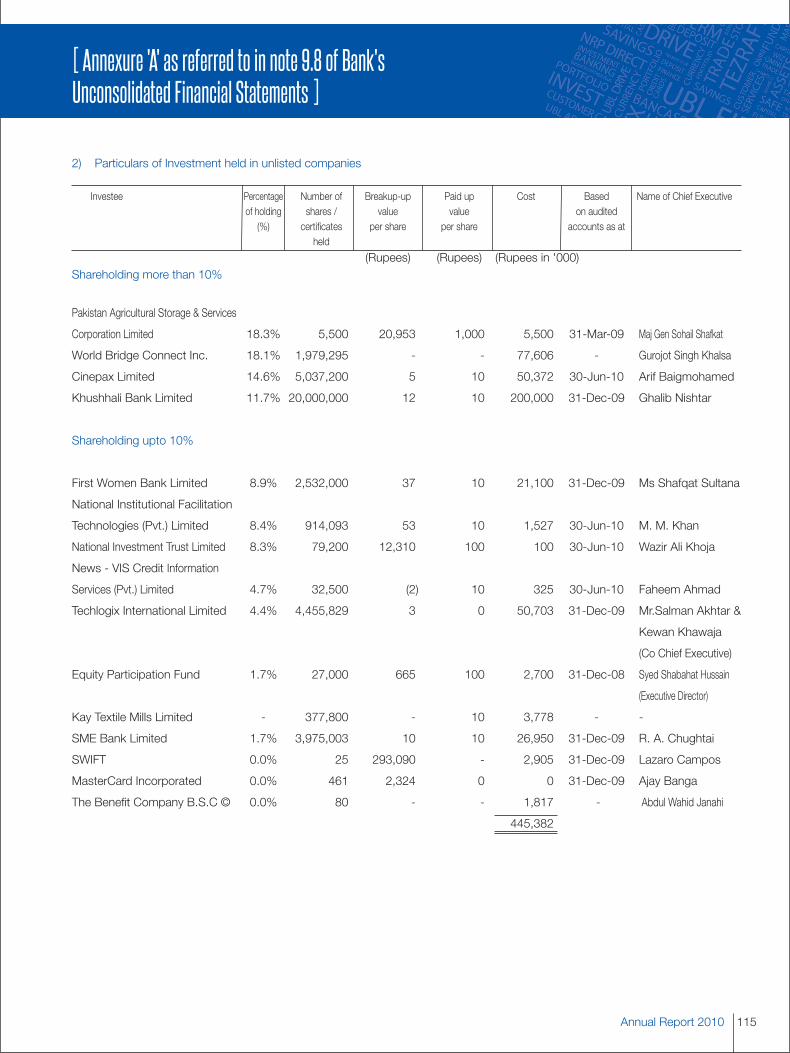
115Annual Report 2010
[ Annexure 'A' as referred to in note 9.8 of Bank'sUnconsolidated Financial Statements ]
2) Particulars of Investment held in unlisted companies
Investee Percentage Number of Breakup-up Paid up Cost Based Name of Chief Executiveof holding shares / value value on audited(%) certificates per share per share accounts as at
held
(Rupees) (Rupees) (Rupees in '000)Shareholding more than 10%
Pakistan Agricultural Storage & Services
Corporation Limited 18.3% 5,500 20,953 1,000 5,500 31-Mar-09 Maj Gen Sohail Shafkat
World Bridge Connect Inc. 18.1% 1,979,295 - - 77,606 - Gurojot Singh Khalsa
Cinepax Limited 14.6% 5,037,200 5 10 50,372 30-Jun-10 Arif Baigmohamed
Khushhali Bank Limited 11.7% 20,000,000 12 10 200,000 31-Dec-09 Ghalib Nishtar
Shareholding upto 10%
First Women Bank Limited 8.9% 2,532,000 37 10 21,100 31-Dec-09 Ms Shafqat Sultana
National Institutional Facilitation
Technologies (Pvt.) Limited 8.4% 914,093 53 10 1,527 30-Jun-10 M. M. Khan
National Investment Trust Limited 8.3% 79,200 12,310 100 100 30-Jun-10 Wazir Ali Khoja
News - VIS Credit Information
Services (Pvt.) Limited 4.7% 32,500 (2) 10 325 30-Jun-10 Faheem Ahmad
Techlogix International Limited 4.4% 4,455,829 3 0 50,703 31-Dec-09 Mr.Salman Akhtar &
Kewan Khawaja
(Co Chief Executive)
Equity Participation Fund 1.7% 27,000 665 100 2,700 31-Dec-08 Syed Shabahat Hussain
(Executive Director)
Kay Textile Mills Limited - 377,800 - 10 3,778 - -
SME Bank Limited 1.7% 3,975,003 10 10 26,950 31-Dec-09 R. A. Chughtai
SWIFT 0.0% 25 293,090 - 2,905 31-Dec-09 Lazaro Campos
MasterCard Incorporated 0.0% 461 2,324 0 0 31-Dec-09 Ajay Banga
The Benefit Company B.S.C © 0.0% 80 - - 1,817 - Abdul Wahid Janahi
445,382
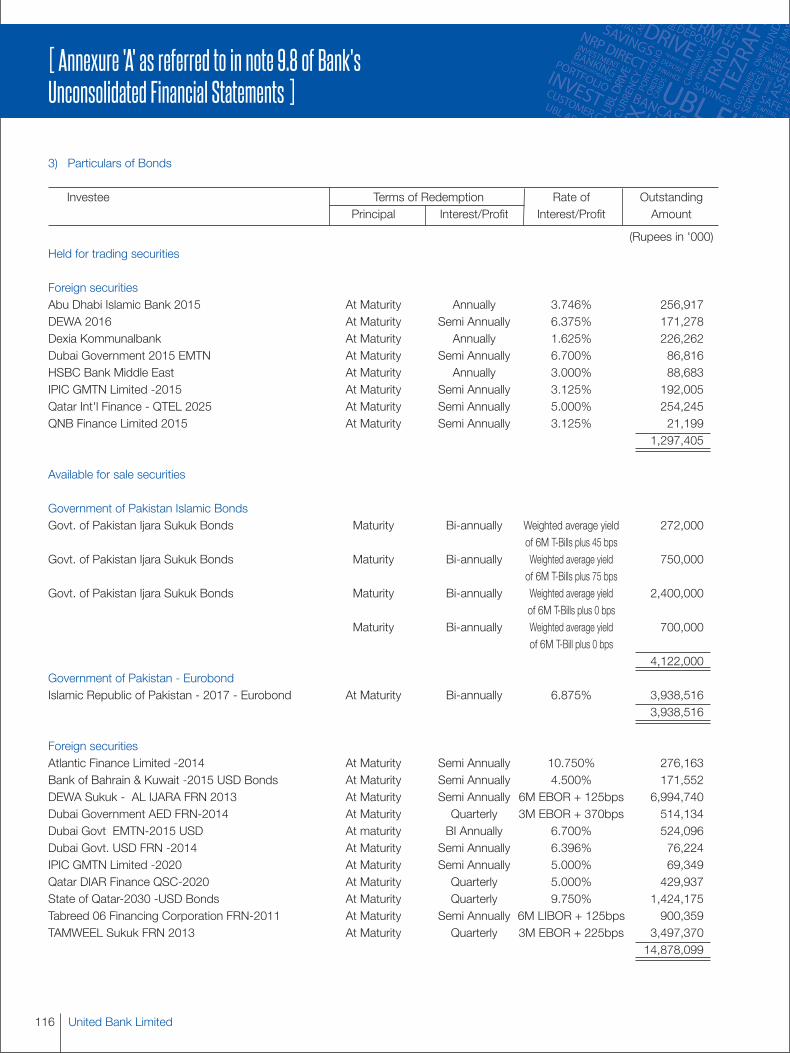
United Bank Limited116
[ Annexure 'A' as referred to in note 9.8 of Bank'sUnconsolidated Financial Statements ]
3) Particulars of Bonds
Investee Terms of Redemption Rate of OutstandingPrincipal Interest/Profit Interest/Profit Amount
(Rupees in '000)Held for trading securities
Foreign securitiesAbu Dhabi Islamic Bank 2015 At Maturity Annually 3.746% 256,917DEWA 2016 At Maturity Semi Annually 6.375% 171,278Dexia Kommunalbank At Maturity Annually 1.625% 226,262Dubai Government 2015 EMTN At Maturity Semi Annually 6.700% 86,816HSBC Bank Middle East At Maturity Annually 3.000% 88,683IPIC GMTN Limited -2015 At Maturity Semi Annually 3.125% 192,005Qatar Int'l Finance - QTEL 2025 At Maturity Semi Annually 5.000% 254,245QNB Finance Limited 2015 At Maturity Semi Annually 3.125% 21,199
1,297,405
Available for sale securities
Government of Pakistan Islamic BondsGovt. of Pakistan Ijara Sukuk Bonds Maturity Bi-annually Weighted average yield 272,000
of 6M T-Bills plus 45 bpsGovt. of Pakistan Ijara Sukuk Bonds Maturity Bi-annually Weighted average yield 750,000
of 6M T-Bills plus 75 bpsGovt. of Pakistan Ijara Sukuk Bonds Maturity Bi-annually Weighted average yield 2,400,000
of 6M T-Bills plus 0 bpsMaturity Bi-annually Weighted average yield 700,000
of 6M T-Bill plus 0 bps4,122,000
Government of Pakistan - EurobondIslamic Republic of Pakistan - 2017 - Eurobond At Maturity Bi-annually 6.875% 3,938,516
3,938,516
Foreign securitiesAtlantic Finance Limited -2014 At Maturity Semi Annually 10.750% 276,163Bank of Bahrain & Kuwait -2015 USD Bonds At Maturity Semi Annually 4.500% 171,552DEWA Sukuk - AL IJARA FRN 2013 At Maturity Semi Annually 6M EBOR + 125bps 6,994,740Dubai Government AED FRN-2014 At Maturity Quarterly 3M EBOR + 370bps 514,134Dubai Govt EMTN-2015 USD At maturity BI Annually 6.700% 524,096Dubai Govt. USD FRN -2014 At Maturity Semi Annually 6.396% 76,224IPIC GMTN Limited -2020 At Maturity Semi Annually 5.000% 69,349Qatar DIAR Finance QSC-2020 At Maturity Quarterly 5.000% 429,937State of Qatar-2030 -USD Bonds At Maturity Quarterly 9.750% 1,424,175Tabreed 06 Financing Corporation FRN-2011 At Maturity Semi Annually 6M LIBOR + 125bps 900,359TAMWEEL Sukuk FRN 2013 At Maturity Quarterly 3M EBOR + 225bps 3,497,370
14,878,099
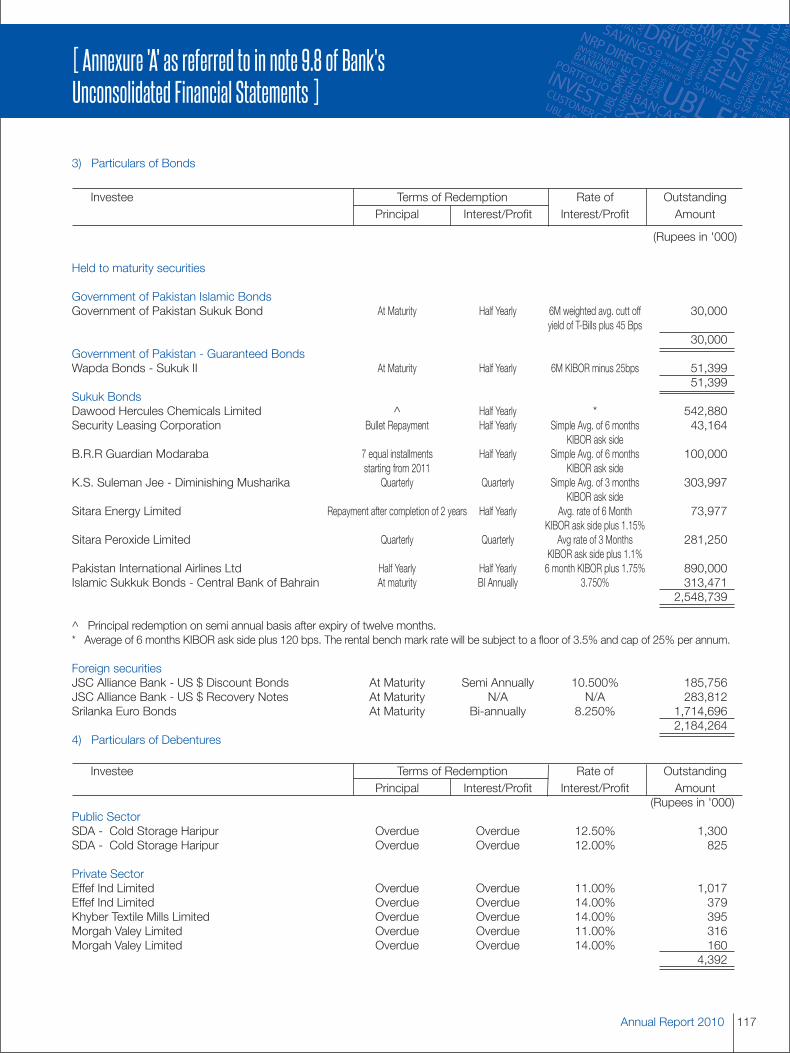
117Annual Report 2010
[ Annexure 'A' as referred to in note 9.8 of Bank'sUnconsolidated Financial Statements ]
3) Particulars of Bonds
Investee Terms of Redemption Rate of OutstandingPrincipal Interest/Profit Interest/Profit Amount
(Rupees in '000)
Held to maturity securities
Government of Pakistan Islamic BondsGovernment of Pakistan Sukuk Bond At Maturity Half Yearly 6M weighted avg. cutt off 30,000
yield of T-Bills plus 45 Bps30,000
Government of Pakistan - Guaranteed BondsWapda Bonds - Sukuk II At Maturity Half Yearly 6M KIBOR minus 25bps 51,399
51,399Sukuk BondsDawood Hercules Chemicals Limited ^ Half Yearly * 542,880Security Leasing Corporation Bullet Repayment Half Yearly Simple Avg. of 6 months 43,164
KIBOR ask sideB.R.R Guardian Modaraba 7 equal installments Half Yearly Simple Avg. of 6 months 100,000
starting from 2011 KIBOR ask sideK.S. Suleman Jee - Diminishing Musharika Quarterly Quarterly Simple Avg. of 3 months 303,997
KIBOR ask sideSitara Energy Limited Repayment after completion of 2 years Half Yearly Avg. rate of 6 Month 73,977
KIBOR ask side plus 1.15%Sitara Peroxide Limited Quarterly Quarterly Avg rate of 3 Months 281,250
KIBOR ask side plus 1.1%Pakistan International Airlines Ltd Half Yearly Half Yearly 6 month KIBOR plus 1.75% 890,000Islamic Sukkuk Bonds - Central Bank of Bahrain At maturity BI Annually 3.750% 313,471
2,548,739
^ Principal redemption on semi annual basis after expiry of twelve months.* Average of 6 months KIBOR ask side plus 120 bps. The rental bench mark rate will be subject to a floor of 3.5% and cap of 25% per annum.
Foreign securitiesJSC Alliance Bank - US $ Discount Bonds At Maturity Semi Annually 10.500% 185,756JSC Alliance Bank - US $ Recovery Notes At Maturity N/A N/A 283,812Srilanka Euro Bonds At Maturity Bi-annually 8.250% 1,714,696
2,184,2644) Particulars of Debentures
Investee Terms of Redemption Rate of OutstandingPrincipal Interest/Profit Interest/Profit Amount
(Rupees in '000)Public SectorSDA - Cold Storage Haripur Overdue Overdue 12.50% 1,300SDA - Cold Storage Haripur Overdue Overdue 12.00% 825
Private SectorEffef Ind Limited Overdue Overdue 11.00% 1,017Effef Ind Limited Overdue Overdue 14.00% 379Khyber Textile Mills Limited Overdue Overdue 14.00% 395Morgah Valey Limited Overdue Overdue 11.00% 316Morgah Valey Limited Overdue Overdue 14.00% 160
4,392

United Bank Limited118
[ Annexure 'A' as referred to in note 9.8 of Bank'sUnconsolidated Financial Statements For the year ended December 31, 2010 ]
5) Particulars of Investments in Term Finance Certificates
Investee No. of Paid up value Total Paid up Outstanding Name of Chief ExecutiveCertificates held per certificate value Amount
(Rupees) (Rupees in '000)
Unlisted - available for salePakistan International Airlines 1,700 5,000 8,500 8,495 Captain Muhammad Aijaz HaroonEngro Corporation Limited 7,000 100,000 700,000 702,241 Asad UmarFaysal Bank Limited 46,000 5,000 230,000 230,000 Naved A. Khan
940,736Listed - available for saleAllied Bank Limited TFC-II 53,000 5,000 265,000 273,208 Khalid A. SherwaniAzgard Nine Limited 60,000 5,000 300,000 224,694 Ahmed H. ShaikhBank Al Falah Limited TFC II 3,000 5,000 15,000 15,061 Sirajuddin AzizBank Al Falah Limited TFC III 26,200 5,000 131,000 133,307 Sirajuddin AzizBank Al Habib Limited TFC II 44,766 5,000 223,830 228,860 Abbas D. HabibBank Al Habib Limited TFC III 46,000 5,000 230,000 229,724 Abbas D. HabibEngro Corporation Limited TFC III 22,562 5,000 112,810 113,220 Asad UmarStandard Chartered Bank Pakistan Limited TFC II 4,000 5,000 20,000 5,000 Mohsin Ali Nathani
1,223,074Unlisted - held to maturityPower Holding (Pvt) Limited 4,615,800 5,000 23,079,000 23,079,000 Fazeel AsifPakistan International Airlines Corporation 408,867 5,000 2,044,335 2,043,518 Captain Muhammad Aijaz HaroonOrix Leasing Pakistan Limited 2,000 100,000 200,000 166,667 Teizoon KisatCrescent Textile Mills Limited 110,000 5,000 550,000 99,985 Muhammad AnwarAl Abbas Sugar Mills Limited 12,000 5,000 60,000 36,000 Shunaid QureshiDewan Farooq Spining Mills Limited 30,000 5,000 150,000 37,472 Dewan Abdul Baqi FarooquiSecurity Leasing Corporation Limited 40,000 5,000 200,000 60,937 Mohammad Khalid AliSME Leasing Limited 24,000 5,000 120,000 30,000 Mrs. Arjumand QaziFaysal Bank Limited 24,000 5,000 120,000 120,000 Naved A. KhanAl-Azhar Textile Mills Ltd 14 774,670 10,845 5,418 Mirza Muhammad Azhar BaigBachani Sugar Mills Ltd. - - - 25,500 Noorul Amin BachaniBentonite (Pakistan) Ltd 14 268,894 3,765 3,417 Khalid ShakilBlue Star Textile Mills Ltd 17 497,020 8,449 3,392 Chaudry Ghulam FaridCast-N-Link Products Limited 16 369,054 5,905 2,549 Nisar AhmedFrontier Ceramics Limited 46 370 17 1,965 Omer KhalidKhairpur Sugar Mills Limited 28 1,642,964 46,003 2,783 Mubeen JumaniRegency Textile Ltd 24 108,958 2,615 6,165 M. Iqtidar PervaizTanocrafts Ltd 22 156,227 3,437 537 Ashfaq HussainTharparkar Sugar Mills 5 1,754,000 8,770 26,238 Irfan Ali Shah
25,751,543Listed - held to maturityAllied Bank Limited TFC II 129,397 5,000 646,985 646,352 Khalid A. SherwaniAskari Commercial Bank Limited 43,525 5,000 217,625 217,146 Mohammad Rafiquddin MehkariAskari Commercial Bank Limited 40,000 5,000 200,000 199,600 Mohammad Rafiquddin MehkariBank Al Habib Limited 5,000 5,000 25,000 24,940 Abbas D. HabibFaysal Bank Limited (Formerly Royal Bank of Scotland) 22,000 5,000 110,000 82,346 Naved A. KhanSoneri Bank Limited 999 5,000 4,995 4,984 Atif A. BajwaIGI Investment Bank Limited 31,083 5,000 155,415 38,838 Syed Javed HassanPak Arab Fertilizer (Private) Limited 30,000 5,000 150,000 141,000 Fawad Ahmad Mukhtar
1,355,206
6) Particulars of Participation Term Certificates
Investee No. of Paid up value Total Paid up Outstanding Name of Chief ExecutiveCertificates held per certificate value Amount
(Rupees) (Rupees in '000)Brother Steel Industries Limited 17 108,024 2,144,313 2,144 Mian Yousuf AzizCrystal Chemicals Limited 14 145,933 3,897,000 3,897 Maqsood A. ShaikhLeatherite Limited 15 22,200 888,603 889 -Mass Dairies Limited 11 136,818 2,523,000 2,523 Mian Mohammad Akhtar PaganwalaMorgah Valey Limited 16 29,250 436,414 436 Air Marshal A. Rahim KhanPangrio Sugar Mills Limited 44 64,000 11,198,023 6,955 Aftab AhmedZamrock Fibers Glass Limited 12 32,833 2,358,000 2,358 -
19,202
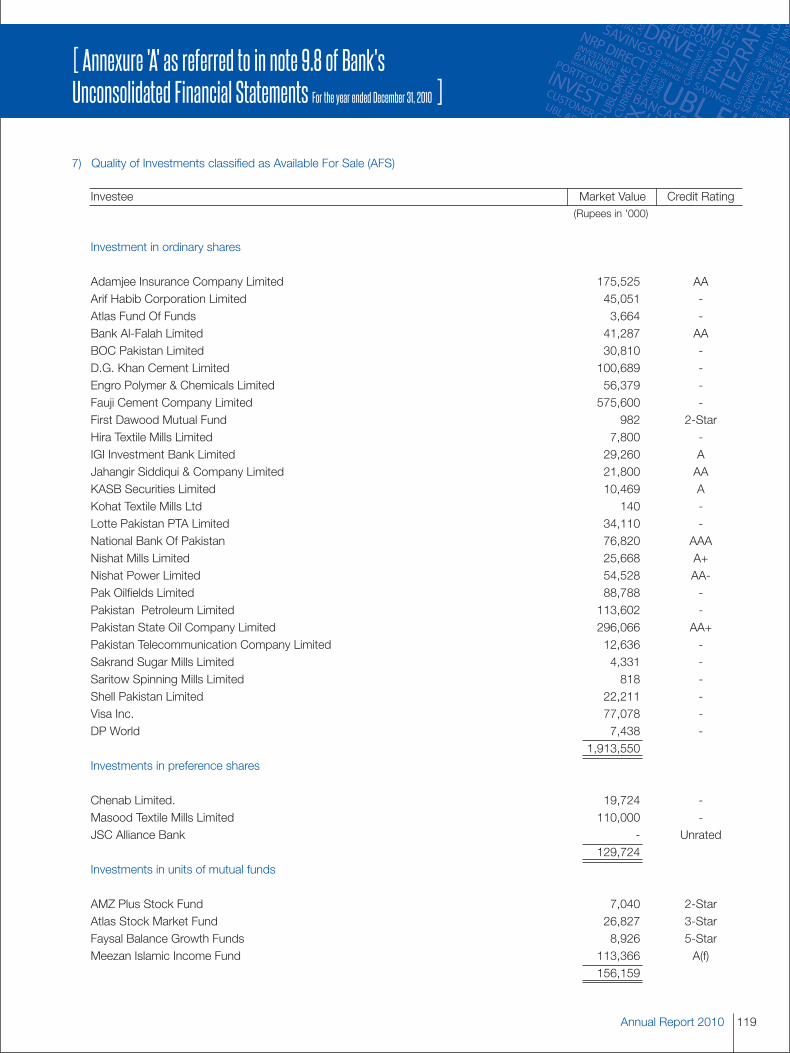
119Annual Report 2010
[ Annexure 'A' as referred to in note 9.8 of Bank'sUnconsolidated Financial Statements For the year ended December 31, 2010 ]
7) Quality of Investments classified as Available For Sale (AFS)
Investee Market Value Credit Rating(Rupees in '000)
Investment in ordinary shares
Adamjee Insurance Company Limited 175,525 AAArif Habib Corporation Limited 45,051 -Atlas Fund Of Funds 3,664 -Bank Al-Falah Limited 41,287 AABOC Pakistan Limited 30,810 -D.G. Khan Cement Limited 100,689 -Engro Polymer & Chemicals Limited 56,379 -Fauji Cement Company Limited 575,600 -First Dawood Mutual Fund 982 2-StarHira Textile Mills Limited 7,800 -IGI Investment Bank Limited 29,260 AJahangir Siddiqui & Company Limited 21,800 AAKASB Securities Limited 10,469 AKohat Textile Mills Ltd 140 -Lotte Pakistan PTA Limited 34,110 -National Bank Of Pakistan 76,820 AAANishat Mills Limited 25,668 A+Nishat Power Limited 54,528 AA-Pak Oilfields Limited 88,788 -Pakistan Petroleum Limited 113,602 -Pakistan State Oil Company Limited 296,066 AA+Pakistan Telecommunication Company Limited 12,636 -Sakrand Sugar Mills Limited 4,331 -Saritow Spinning Mills Limited 818 -Shell Pakistan Limited 22,211 -Visa Inc. 77,078 -DP World 7,438 -
1,913,550Investments in preference shares
Chenab Limited. 19,724 -Masood Textile Mills Limited 110,000 -JSC Alliance Bank - Unrated
129,724Investments in units of mutual funds
AMZ Plus Stock Fund 7,040 2-StarAtlas Stock Market Fund 26,827 3-StarFaysal Balance Growth Funds 8,926 5-StarMeezan Islamic Income Fund 113,366 A(f)
156,159
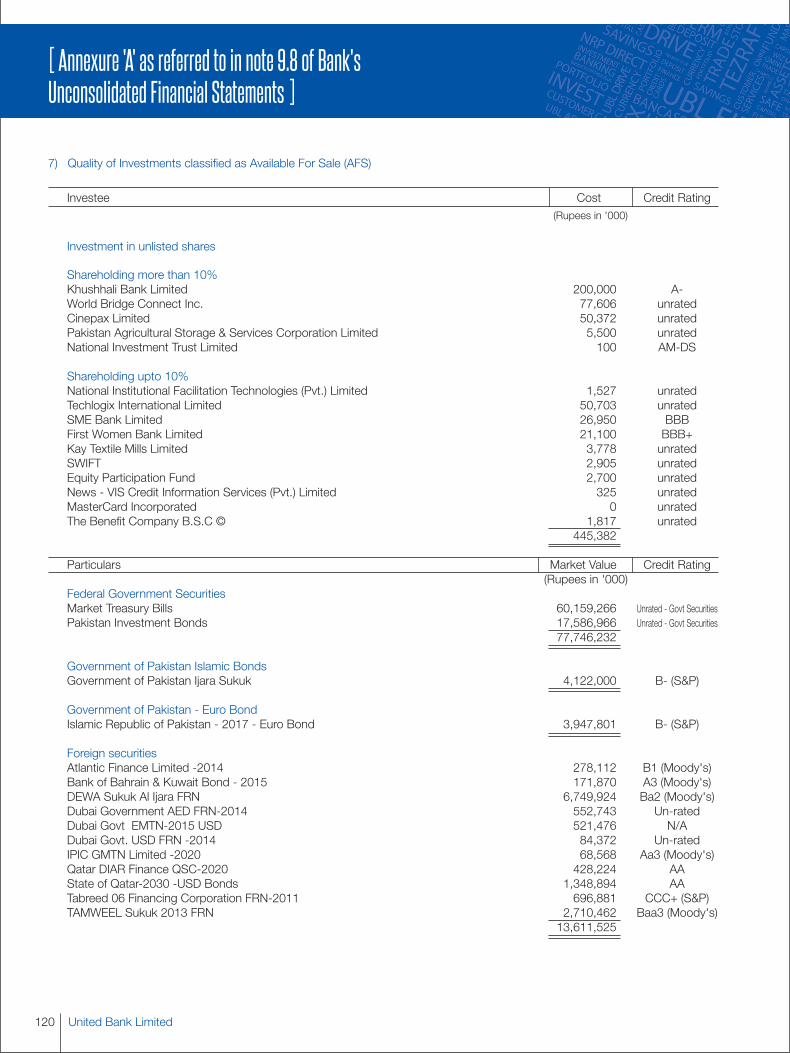
United Bank Limited120
[ Annexure 'A' as referred to in note 9.8 of Bank'sUnconsolidated Financial Statements ]
7) Quality of Investments classified as Available For Sale (AFS)
Investee Cost Credit Rating(Rupees in '000)
Investment in unlisted shares
Shareholding more than 10%Khushhali Bank Limited 200,000 A-World Bridge Connect Inc. 77,606 unratedCinepax Limited 50,372 unratedPakistan Agricultural Storage & Services Corporation Limited 5,500 unratedNational Investment Trust Limited 100 AM-DS
Shareholding upto 10%National Institutional Facilitation Technologies (Pvt.) Limited 1,527 unratedTechlogix International Limited 50,703 unratedSME Bank Limited 26,950 BBBFirst Women Bank Limited 21,100 BBB+Kay Textile Mills Limited 3,778 unratedSWIFT 2,905 unratedEquity Participation Fund 2,700 unratedNews - VIS Credit Information Services (Pvt.) Limited 325 unratedMasterCard Incorporated 0 unratedThe Benefit Company B.S.C © 1,817 unrated
445,382
Particulars Market Value Credit Rating(Rupees in '000)
Federal Government SecuritiesMarket Treasury Bills 60,159,266 Unrated - Govt SecuritiesPakistan Investment Bonds 17,586,966 Unrated - Govt Securities
77,746,232
Government of Pakistan Islamic BondsGovernment of Pakistan Ijara Sukuk 4,122,000 B- (S&P)
Government of Pakistan - Euro BondIslamic Republic of Pakistan - 2017 - Euro Bond 3,947,801 B- (S&P)
Foreign securitiesAtlantic Finance Limited -2014 278,112 B1 (Moody's)Bank of Bahrain & Kuwait Bond - 2015 171,870 A3 (Moody's)DEWA Sukuk Al Ijara FRN 6,749,924 Ba2 (Moody's)Dubai Government AED FRN-2014 552,743 Un-ratedDubai Govt EMTN-2015 USD 521,476 N/ADubai Govt. USD FRN -2014 84,372 Un-ratedIPIC GMTN Limited -2020 68,568 Aa3 (Moody's)Qatar DIAR Finance QSC-2020 428,224 AAState of Qatar-2030 -USD Bonds 1,348,894 AATabreed 06 Financing Corporation FRN-2011 696,881 CCC+ (S&P)TAMWEEL Sukuk 2013 FRN 2,710,462 Baa3 (Moody's)
13,611,525
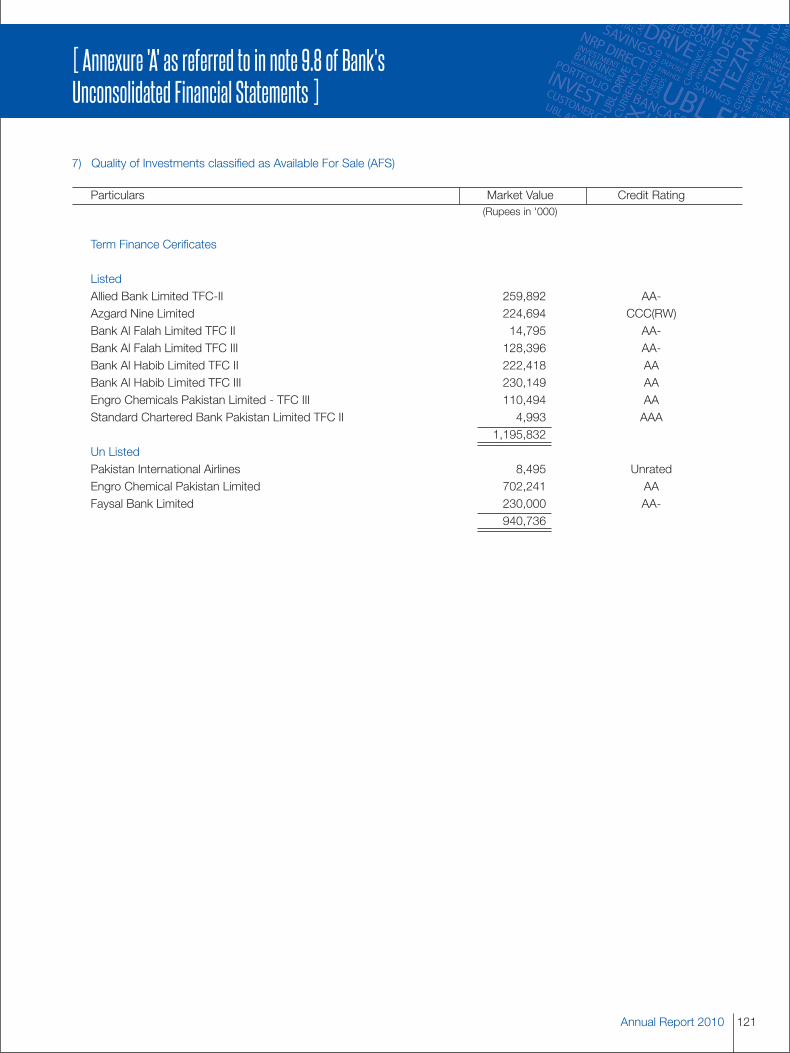
121Annual Report 2010
[ Annexure 'A' as referred to in note 9.8 of Bank'sUnconsolidated Financial Statements ]
7) Quality of Investments classified as Available For Sale (AFS)
Particulars Market Value Credit Rating(Rupees in '000)
Term Finance Cerificates
ListedAllied Bank Limited TFC-II 259,892 AA-Azgard Nine Limited 224,694 CCC(RW)Bank Al Falah Limited TFC II 14,795 AA-Bank Al Falah Limited TFC III 128,396 AA-Bank Al Habib Limited TFC II 222,418 AABank Al Habib Limited TFC III 230,149 AAEngro Chemicals Pakistan Limited - TFC III 110,494 AAStandard Chartered Bank Pakistan Limited TFC II 4,993 AAA
1,195,832Un ListedPakistan International Airlines 8,495 UnratedEngro Chemical Pakistan Limited 702,241 AAFaysal Bank Limited 230,000 AA-
940,736
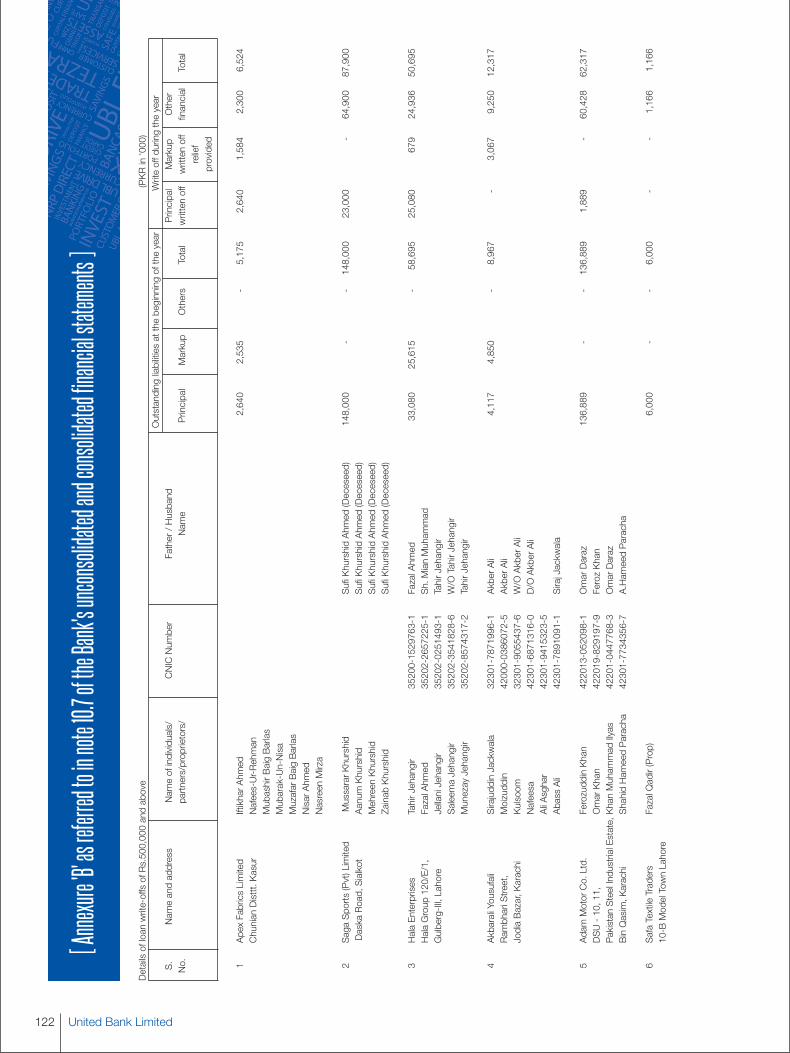
United Bank Limited122
[Annexu
re'B'
asref
erred
toinn
ote10.
7ofth
eBank's
uncon
solida
tedandc
onsol
idated
financia
lstate
ments
]
1ApexFabricsLimited
IftikharAhmed
2,640
2,535
-5,175
2,640
1,584
2,300
6,524
ChunianDisttt.Kasur
Nafees-Ur-Rehman
MubashirBaigBarlas
Mubarak-Un-Nisa
MuzafarBaigBarlas
NisarAhmed
NasreenMirza
2SagaSports(Pvt)Limited
MussararKhurshid
SufiKhurshidAhmed(Deceseed)
148,000
--
148,000
23,000
-64,900
87,900
DaskaRoad,Sialkot
Aanum
Khurshid
SufiKhurshidAhmed(Deceseed)
MehreenKhurshid
SufiKhurshidAhmed(Deceseed)
ZainabKhurshid
SufiKhurshidAhmed(Deceseed)
3HalaEnterprises
TahirJehangir
35200-1529763-1
FazalAhmed
33,080
25,615
-58,695
25,080
679
24,936
50,695
HalaGroup120/E/1,
FazalAhmed
35202-2657225-1
Sh.MianMuhammad
Gulberg-III,Lahore
JellaniJehangir
35202-0251493-1
TahirJehangir
SaleemaJehangir
35202-3541828-6
W/OTahirJehangir
MunezayJehangir
35202-8574317-2
TahirJehangir
4AkbaraliYousufali
SirajuddinJackwala
32301-7871996-1
AkberAli
4,117
4,850
-8,967
-3,067
9,250
12,317
RambhariStreet,
Moizuddin
42000-0386072-5
AkberAli
JodiaBazar,Karachi
Kulsoom
32301-9055437-6
W/OAkberAli
Nafeesa
42301-6871316-0
D/OAkberAli
AliAsghar
42301-9415323-5
AbassAli
42301-7891091-1
SirajJackwala
5AdamMotorCo.Ltd.
FerozuddinKhan
422013-052098-1
OmarDaraz
136,889
--
136,889
1,889
-60,428
62,317
DSU-10,11,
OmarKhan
422019-829197-9
FerozKhan
PakistanSteelIndustrialEstate,KhanMuhammadIlyas
42201-0447768-3
OmarDaraz
BinQasim,Karachi
ShahidHameedParacha
42301-7734356-7
A.HameedParacha
6SafaTextileTraders
FazalQadir(Prop)
6,000
--
6,000
--
1,166
1,166
10-BModelTownLahore
Detailsofloanwrite-offsofRs.500,000andabove
(PKRin'000)
Outstandingliabilitiesatthebeginningoftheyear
Writeoffduringtheyear
S.
Nameandaddress
Nameofindividuals/
CNICNumber
Father/Husband
Principal
Markup
Other
No.
partners/proprietors/
Name
Principal
Markup
Others
Total
writtenoff
writtenoff
financial
Total
relief
provided

123Annual Report 2010
[Annexu
re'B'
asref
erred
toinn
ote10.
7ofth
eBank's
uncon
solida
tedandc
onsol
idated
financia
lstate
ments
]
Detailsofloanwrite-offsofRs.500,000andabove
(PKRin'000)
Outstandingliabilitiesatthebeginningoftheyear
Writeoffduringtheyear
S.
Nameandaddress
Nameofindividuals/
CNICNumber
Father/Husband
Principal
Markup
Other
No.
partners/proprietors/
Name
Principal
Markup
Others
Total
writtenoff
writtenoff
financial
Total
relief
provided
7SajjadTextileMillsLtd
MehrAllahYar
38403-9701620-5
MehrAhmedYar
75,976
--
75,976
--
11,991
11,991
GulbergV,Lahore.
SultanMahmood
38403-2214042-1
MuhammadIqbal
M.AsimSajjad
35202-7748317-9
SajjadAslam
SalmanM.Aslam
35202-1081956-7
SajjadAslam
MuhammadAmjad
33100-3065319-1
MuhammadSaeed
MissBatoolZahra
35202-4509799-2
D/OGhulamHussain
AftabAnwar
38403-4061922-5
MuhammadAnwar
8AtlanticCarpetCorporation
AbdulSattarNasir
36302-0452624-9
305
302
-607
--
788
788
1347-C/IIOutsidePakGate,
MohallahKariDawoodKhan,
Multan
9AliPaper&BoardIndustriesLtd.
Farooq
AlamButt
GhulamNabiButt
5,581
2,070
-7,651
5,581
1,666
13,026
20,272
27-KMLahoreSheikhupura
SirajDinButt
N.A
Road,Lahore
AsadAkhtar
N.A
M.SaleemLone
N.A
SheikhAmirAli
Sh.DaulatAli
SheikhAmirHaider
Sh.AmirAli
SyedNisarAhmed
N.A
GhulamNabiButt
N.A
MaqboolAlamButt
GhulamNabiButt
SheikhYawarHussain
GhulamNabiButt
SheikhMahmudHussain
GhulamNabiButt
10StateTextilePvt.Ltd.
Shamsuzaman(Deceased)
AbdulMajeed(Deceased)
3,655
591
-4,246
--
12,974
12,974
3/3-C&B-3/75,
ShamsaZamaniBegum
W/OShamsuzaman
ShahFaisalColony,Karachi.
YasminZaman
Shamsuzaman
SafdarJamil(AliasAfshanJamil)
W/OS.Jamil
ChaudhryAbdulMajeed
ChaudhryghulamMohiuddin
11MalikJohar&Co
MalikMohammadJohar
17101-0301470-5
MalikMohammadUmerKhan
1,527
--
1,527
458
-133
591
KhanMainBazarAkoraKhattak
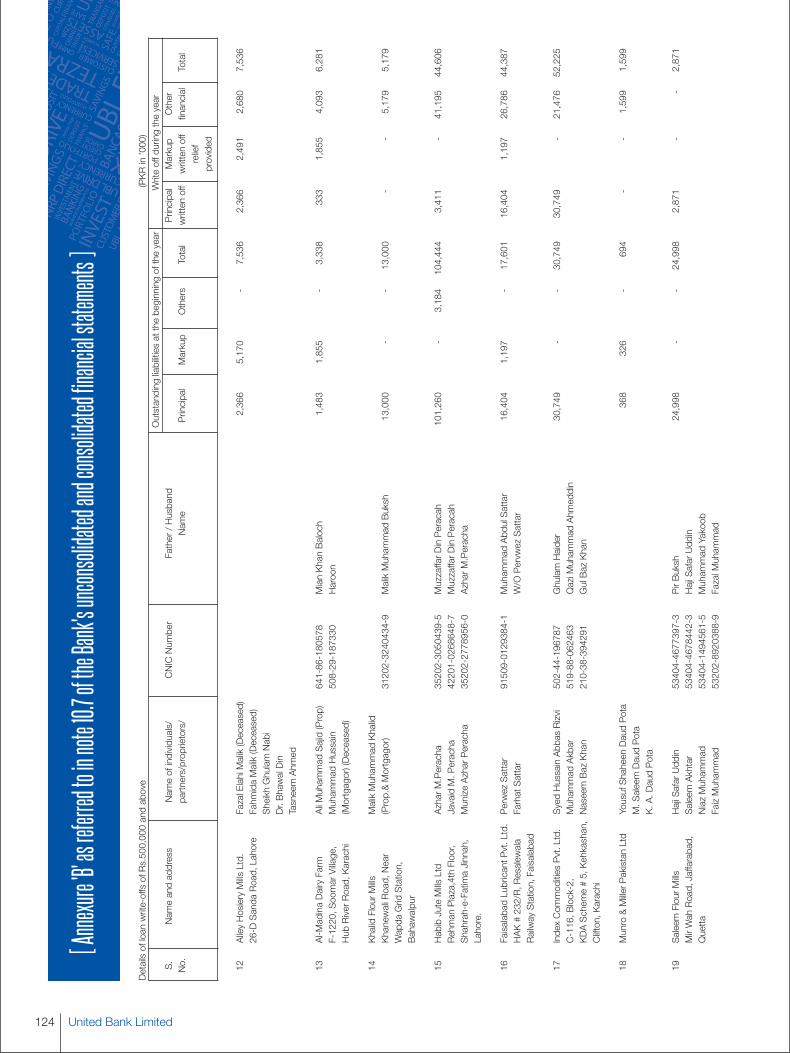
United Bank Limited124
[Annexu
re'B'
asref
erred
toinn
ote10.
7ofth
eBank's
uncon
solida
tedandc
onsol
idated
financia
lstate
ments
]
12AlleyHosieryMillsLtd.
FazalElahiMalik(Deceased)
2,366
5,170
-7,536
2,366
2,491
2,680
7,536
26-DSandaRoad,Lahore
FahmidaMalik(Deceased)
SheikhGhulamNabi
Dr.BhawalDin
TasneemAhmed
13Al-MadinaDairyFarm
AliMuhammadSajid(Prop)
641-86-180578
MianKhanBaloch
1,483
1,855
-3,338
333
1,855
4,093
6,281
F-1220,SoomarVillage,
MuhammadHussain
508-29-187330
Haroon
HubRiverRoad,Karachi
(Mortgagor)(Deceased)
14KhalidFlourMills
MalikMuhammadKhalid
KhanewaliRoad,Near
(Prop.&Mortgagor)
31202-3240434-9
MalikMuhammadBuksh
13,000
--
13,000
--
5,179
5,179
WapdaGridStation,
Bahawalpur
15HabibJuteMillsLtd
AzharM.Peracha
35202-3050439-5
MuzzaffarDinPeracah
101,260
-3,184
104,444
3,411
-41,195
44,606
RehmanPlaza,4thFloor,
JavaidM.Peracha
42201-0268648-7
MuzzaffarDinPeracah
Shahrah-e-FatimaJinnah,
MunizeAzharPeracha
35202-2778956-0
AzharM.Peracha
Lahore.
16FaisalabadLubricantPvt.Ltd.PerwezSattar
91509-0129384-1
MuhammadAbdulSattar
16,404
1,197
-17,601
16,404
1,197
26,786
44,387
HAK#232/R,Resalewala
FarhatSattar
W/OPervwezSattar
RailwayStation,Faisalabad
17IndexCommoditiesPvt.Ltd.
SyedHussainAbbasRizvi
502-44-196787
GhulamHaider
30,749
--
30,749
30,749
-21,476
52,225
C-116,Block-2,
MuhammadAkbar
519-88-062463
QaziMuhammadAhmeddin
KDAScheme#5,Kehkashan,NaseemBazKhan
210-38-394291
GulBazKhan
Clifton,Karachi
18Munro&MillerPakistanLtd
YousufShaheenDaudPota
368
326
-694
--
1,599
1,599
M.SaleemDaudPota
K.A.DaudPota
19SaleemFlourMills
HajiSafarUddin
53404-4677397-3
PirBuksh
24,998
--
24,998
2,871
--
2,871
MirWahRoad,Jaffarabad,
SaleemAkhtar
53404-4678442-3
HajiSafarUddin
Quetta
NiazMuhammad
53404-1494561-5
MuhammadYakoob
FaizMuhammad
53202-8920388-9
FazalMuhammad
Detailsofloanwrite-offsofRs.500,000andabove
(PKRin'000)
Outstandingliabilitiesatthebeginningoftheyear
Writeoffduringtheyear
S.
Nameandaddress
Nameofindividuals/
CNICNumber
Father/Husband
Principal
Markup
Other
No.
partners/proprietors/
Name
Principal
Markup
Others
Total
writtenoff
writtenoff
financial
Total
relief
provided
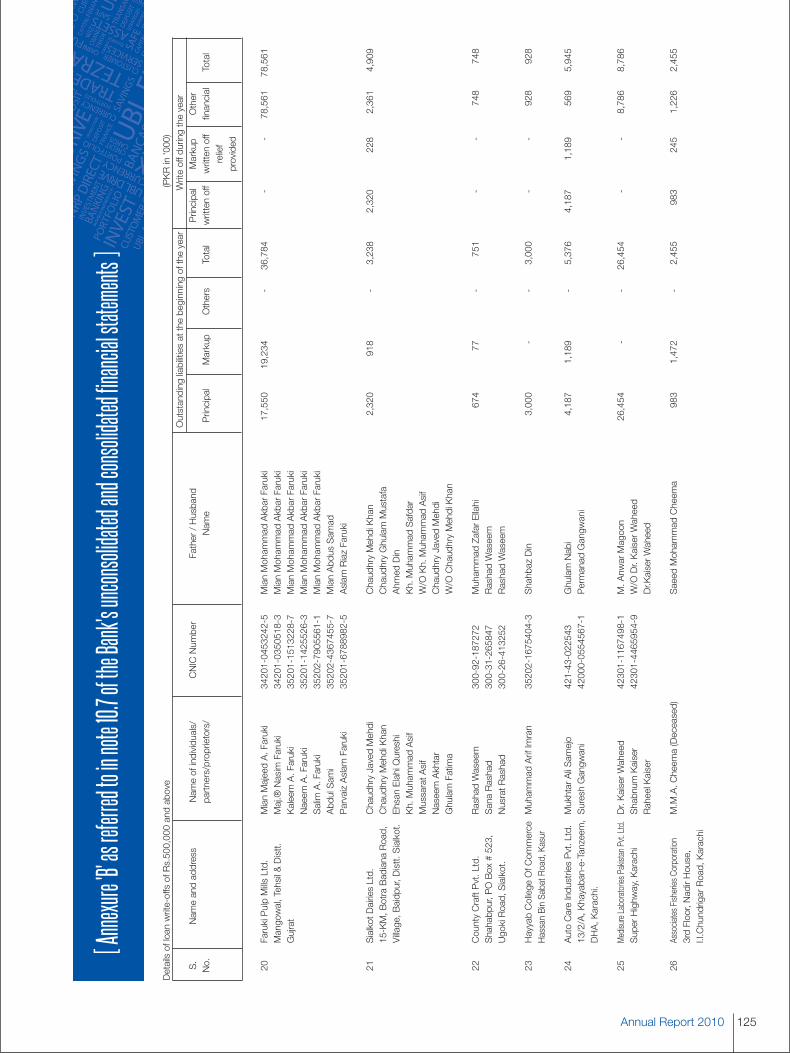
125Annual Report 2010
[Annexu
re'B'
asref
erred
toinn
ote10.
7ofth
eBank's
uncon
solida
tedandc
onsol
idated
financia
lstate
ments
]
20FarukiPulpMillsLtd.
MianMajeedA.Faruki
34201-0453242-5
MianMohammadAkbarFaruki
17,550
19,234
-36,784
--
78,561
78,561
Mangowal,Tehsil&Distt.
Maj.®NasimFaruki
34201-0350518-3
MianMohammadAkbarFaruki
Gujrat
KaleemA.Faruki
35201-1513228-7
MianMohammadAkbarFaruki
Naeem
A.Faruki
35201-1425526-3
MianMohammadAkbarFaruki
SalimA.Faruki
35202-7905561-1
MianMohammadAkbarFaruki
AbdulSami
35202-4367455-7
MianAbdusSamad
ParvaizAslam
Faruki
35201-6788982-5
Aslam
RiazFaruki
21SialkotDairiesLtd.
ChaudhryJavedMehdi
ChaudhryMehdiKhan
2,320
918
-3,238
2,320
228
2,361
4,909
15-KM,BotraBadianaRoad,
ChaudhryMehdiKhan
ChaudhryGhulamMustafa
Village,Baidpur,Distt.Sialkot.EhsanElahiQureshi
AhmedDin
Kh.MuhammadAsif
Kh.MuhammadSafdar
MussaratAsif
W/OKh.MuhammadAsif
NaseemAkhtar
ChaudhryJavedMehdi
GhulamFatima
W/OChaudhryMehdiKhan
22CountyCraftPvt.Ltd.
RashadWaseem
300-92-187272
MuhammadZafarEllahi
674
77-
751
--
748
748
Shahabpur,POBox#523,
SanaRashad
300-31-265847
RashadWaseem
UgokiRoad,Sialkot.
NusratRashad
300-26-413252
RashadWaseem
23HayyabCollegeOfCommerce
MuhammadArifImran
35202-1675404-3
ShahbazDin
3,000
--
3,000
--
928
928
HassanBinSabatRoad,Kasur
24AutoCareIndustriesPvt.Ltd.
MukhtarAliSamejo
421-43-022543
GhulamNabi
4,187
1,189
-5,376
4,187
1,189
569
5,945
13/2/A,Khayaban-e-Tanzeem,SureshGangwani
42000-0554567-1
PermanadGangwani
DHA,Karachi.
25MedisureLaboratoriesPakistanPvt.Ltd.Dr.KaiserWaheed
42301-1167498-1
M.AnwarMagoon
26,454
--
26,454
--
8,786
8,786
SuperHighway,Karachi
Shabnum
Kaiser
42301-4465954-9
W/ODr.KaiserWaheed
RaheelKaiser
Dr.KaiserWaheed
26AssociatesFisheriesCorporation
M.M.A.Cheema(Deceased)
SaeedMohammadCheema
983
1,472
-2,455
983
245
1,226
2,455
3rdFloor,NadirHouse,
I.I.ChundrigarRoad,Karachi
Detailsofloanwrite-offsofRs.500,000andabove
(PKRin'000)
Outstandingliabilitiesatthebeginningoftheyear
Writeoffduringtheyear
S.
Nameandaddress
Nameofindividuals/
CNICNumber
Father/Husband
Principal
Markup
Other
No.
partners/proprietors/
Name
Principal
Markup
Others
Total
writtenoff
writtenoff
financial
Total
relief
provided
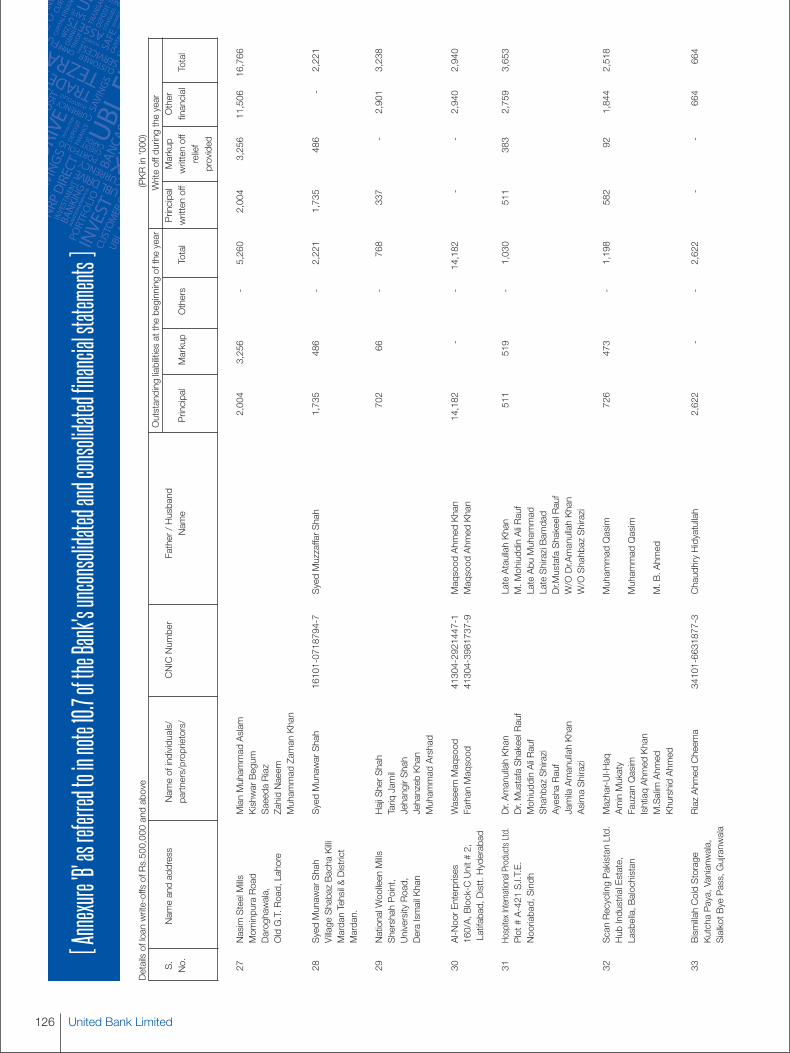
United Bank Limited126
[Annexu
re'B'
asref
erred
toinn
ote10.
7ofth
eBank's
uncon
solida
tedandc
onsol
idated
financia
lstate
ments
]
27NasimSteelMills
MianMuhammadAslam
2,004
3,256
-5,260
2,004
3,256
11,506
16,766
MominpuraRoad
KishwarBegum
Daroghawala,
SaeedaRiaz
OldG.T.Road,Lahore
ZahidNaeem
MuhammadZamanKhan
28SyedMunawarShah
SyedMunawarShah
16101-0718794-7
SyedMuzzaffarShah
1,735
486
-2,221
1,735
486
-2,221
VillageShabazBachaKilli
MardanTehsil&District
Mardan.
29NationalWoolleenMills
HajiSherShah
702
66-
768
337
-2,901
3,238
ShershahPoint,
TariqJamil
UniversityRoad,
JehangirShah
DeraIsmailKhan
JehanzebKhan
MuhammadArshad
30Al-NoorEnterprises
WaseemMaqsood
41304-2921447-1
MaqsoodAhmedKhan
14,182
--
14,182
--
2,940
2,940
160/A,Block-CUnit#
2,FarhanMaqsood
41304-3981737-9
MaqsoodAhmedKhan
Latifabad,Distt.Hyderabad
31HospitexInternationalProductsLtd.
Dr.AmanullahKhan
LateAtaullahKhan
511
519
-1,030
511
383
2,759
3,653
Plot#A-421S.I.T.E.
Dr.MustafaShakeelRauf
M.MohiuddinAliRauf
Nooriabad,Sindh
MohiuddinAliRauf
LateAbuMuhammad
ShahbazShirazi
LateShiraziBamdad
AyeshaRauf
Dr.MustafaShakeelRauf
JamilaAmanullahKhan
W/ODr.AmanullahKhan
AsimaShirazi
W/OShahbazShirazi
32ScanRecyclingPakistanLtd.
Mazhar-Ul-Haq
MuhammadQasim
726
473
-1,198
582
921,844
2,518
HubIndustrialEstate,
AminMukaty
Lasbella,Balochistan
FauzanQasim
MuhammadQasim
IshtiaqAhmedKhan
M.SalimAhmed
M.B.Ahmed
KhurshidAhmed
33BismillahColdStorage
RiazAhmedCheema
34101-6631877-3
ChaudhryHidyatullah
2,622
--
2,622
--
664
664
KutchaPaya,Vanianwala,
SialkotByePass,Gujranwala
Detailsofloanwrite-offsofRs.500,000andabove
(PKRin'000)
Outstandingliabilitiesatthebeginningoftheyear
Writeoffduringtheyear
S.
Nameandaddress
Nameofindividuals/
CNICNumber
Father/Husband
Principal
Markup
Other
No.
partners/proprietors/
Name
Principal
Markup
Others
Total
writtenoff
writtenoff
financial
Total
relief
provided
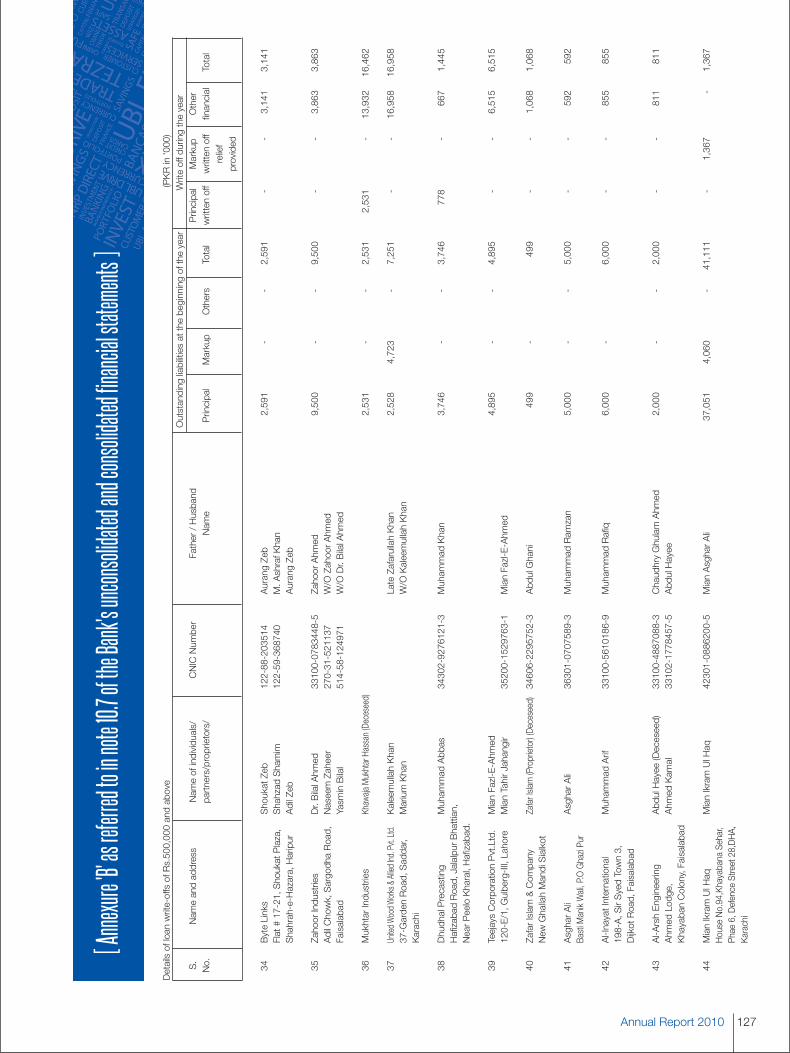
127Annual Report 2010
[Annexu
re'B'
asref
erred
toinn
ote10.
7ofth
eBank's
uncon
solida
tedandc
onsol
idated
financia
lstate
ments
]
34ByteLinks
ShoukatZeb
122-88-203514
AurangZeb
2,591
--
2,591
--
3,141
3,141
Flat#17-21,ShoukatPlaza,
ShahzadShamim
122-59-368740
M.AshrafKhan
Shahrah-e-Hazara,Haripur
AdilZeb
AurangZeb
35ZahoorIndustries
Dr.BilalAhmed
33100-0783448-5
ZahoorAhmed
9,500
--
9,500
--
3,863
3,863
AdilChowk,SargodhaRoad,
NaseemZaheer
270-31-521137
W/OZahoorAhmed
Faisalabad
YasminBilal
514-58-124971
W/ODr.BilalAhmed
36MukhtarIndustries
Khawaja
MukhtarHassan(Deceseed)
2,531
--
2,531
2,531
-13,932
16,462
37UnitedWoodWorks&Allied
Ind.Pvt.Ltd.
KaleemullahKhan
LateZafarullahKhan
2,528
4,723
-7,251
--
16,958
16,958
37-GardenRoad,Saddar,
MariumKhan
W/OKaleemullahKhan
Karachi
38DhudhalPrecasting
MuhammadAbbas
34302-9276121-3
MuhammadKhan
3,746
--
3,746
778
-667
1,445
HafizabadRoad,JalalpurBhattian,
NearPeeloKharal,Hafizabad.
39TeejaysCorporationPvt.Ltd.
MianFazl-E-Ahmed
4,895
--
4,895
--
6,515
6,515
120-E/1,Gulberg-III,Lahore
MianTahirJahangir
35200-1529763-1
MianFazl-E-Ahmed
40ZafarIslam&Company
ZafarIslam(Proprietor)(Deceseed)
34606-2295752-3
AbdulGhani
499
-499
--
1,068
1,068
New
GhallahMandiSialkot
41AsgharAli
AsgharAli
36301-0707589-3
MuhammadRamzan
5,000
--
5,000
--
592
592
BastiManikWali,P.OGhaziPur
42Al-InayatInternational
MuhammadArif
33100-5610186-9
MuhammadRafiq
6,000
-6,000
--
855
855
198-A,SirSyedTown3,
DijkotRoad,Faisalabad
43Al-ArshEngineering
AbdulHayee(Deceseed)
33100-4887088-3
ChaudhryGhulamAhmed
2,000
--
2,000
--
811
811
AhmedLodge,
AhmedKamal
33102-1778457-5
AbdulHayee
KhayabanColony,Faisalabad
44MianIkramUlHaq
MianIkramUlHaq
42301-0886200-5
MianAsgharAli
37,051
4,060
-41,111
-1,367
-1,367
HouseNo.94,KhayabanaSehar,
Phae6,DefenceStreet28,DHA,
Karachi
Detailsofloanwrite-offsofRs.500,000andabove
(PKRin'000)
Outstandingliabilitiesatthebeginningoftheyear
Writeoffduringtheyear
S.
Nameandaddress
Nameofindividuals/
CNICNumber
Father/Husband
Principal
Markup
Other
No.
partners/proprietors/
Name
Principal
Markup
Others
Total
writtenoff
writtenoff
financial
Total
relief
provided

United Bank Limited128
[Annexu
re'B'
asref
erred
toinn
ote10.
7ofth
eBank's
uncon
solida
tedandc
onsol
idated
financia
lstate
ments
]
45Aslam
&Company
Aslam
Hussain
35200-1549664-5
SheikhNazirHussain
17,103
--
17,103
--
1,145
1,145
SirajDinPark,AmirRoad,
Shadbagh,Lahore.
46YasmeenBegum
YasmeenBegum
42201-7448160-4
Nizamuddin
300
103
403
176
-464
640
O-44,SectorO,
Korangi,Karachi
47MuhammadAkbar
MuhammadAkbar
SarfrazKhan
2,900
--
2,900
-900
-900
Ghanipur
48AijazAhmed
AijazAhmed
41303-8738635-9
MuhammadImran
721
264
110
1,094
206
264
110
579
ByPassHyderabadHalaNaka
49MuhammadAzam
MuhammadAzam
42501-8176797-5
AliAsgharBhatti
676
151
273
1,100
155
151
273
580
PlotSurvy#16Road
#10CattleColony
50MukhtarAhmed
MukhtarAhmed
35201-1649246-3
LalDinButt
496
195
304
995
114
195
304
613
GulistanColonyNo1,
StNo5,WaltonRoad
51SyedZameerHaider
SyedZameerHaider
42201-5533300-5
SyedZulHussain
475
376
62913
75376
62513
HouseNo-69-BBlock-2
Gulshan-e-IqbalKarachi
52JavedHussain
JavedHussain
35202-1975429-3
DinMuhammad
500
448
34983
110
448
34593
KachiKothi,AllaqaNawabSahib,
2-KM
,Raiw
indRoadLahoreLahore
53MuhammadAslam
MuhammadAslam
33100-6786141-5
2,715
681
53,401
-646
4650
P-216,StreetNo.15,
ModelTownB,NearFawaraChowk,
54IbrarHussain
IbrarHussainNaqvi
42301-8646639-1
3,411
759
-4,170
-759
-759
Imaging
TechnologiesPvtLtd
WheelHouse30-CNo.1
BaddarCommercialAreaPhase5
Detailsofloanwrite-offsofRs.500,000andabove
(PKRin'000)
Outstandingliabilitiesatthebeginningoftheyear
Writeoffduringtheyear
S.
Nameandaddress
Nameofindividuals/
CNICNumber
Father/Husband
Principal
Markup
Other
No.
partners/proprietors/
Name
Principal
Markup
Others
Total
writtenoff
writtenoff
financial
Total
relief
provided
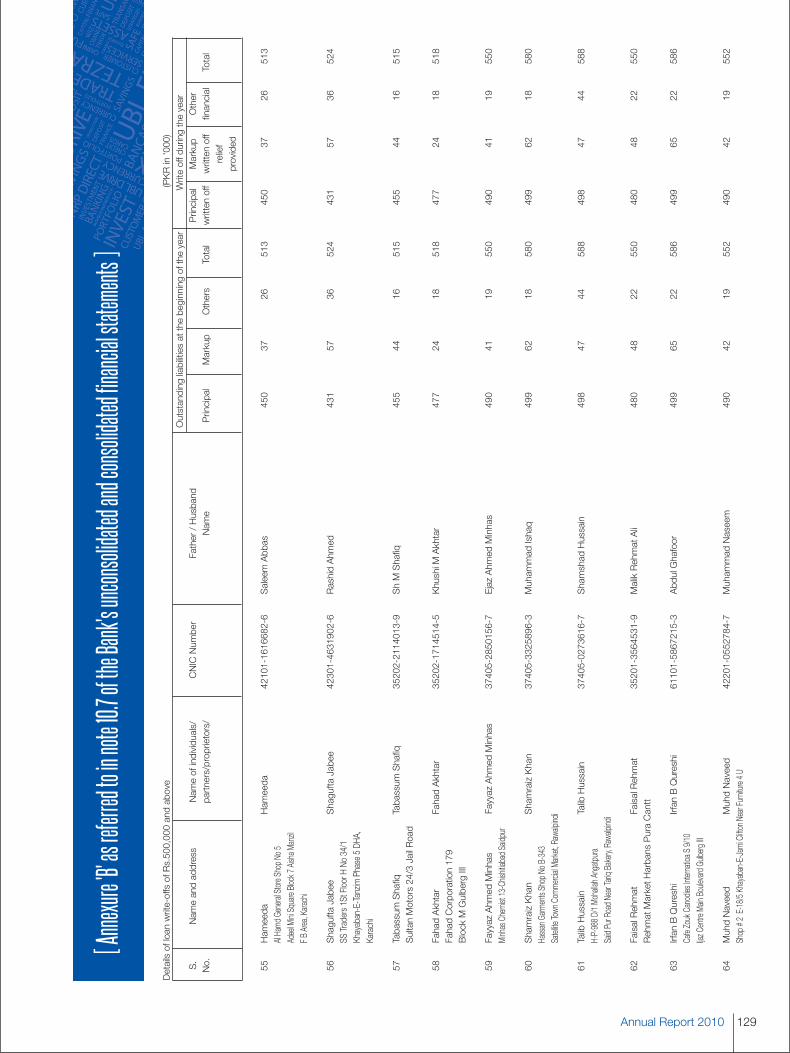
129Annual Report 2010
[Annexu
re'B'
asref
erred
toinn
ote10.
7ofth
eBank's
uncon
solida
tedandc
onsol
idated
financia
lstate
ments
]
55Hameeda
Hameeda
42101-1616682-6
SaleemAbbas
450
3726
513
450
3726
513
AlHamd
GeneralStoreS
hopNo
5AdeelMiniSquareBlock7
AishaManzil
FBArea,Karachi
56ShaguftaJabee
ShaguftaJabee
42301-4631902-6
RashidAhmed
431
5736
524
431
5736
524
SSTraders1StFloorHNo
34/1
Khayaban-E-Tanzim
Phase5DHA,
Karachi
57Tabassum
Shafiq
Tabassum
Shafiq
35202-2114013-9
ShMShafiq
455
4416
515
455
4416
515
SultanMotors24/3JailRoad
58FahadAkhtar
FahadAkhtar
35202-1714514-5
KhushiM
Akhtar
477
2418
518
477
2418
518
FahadCorporation179
BlockMGulbergIII
59FayyazAhmedMinhas
FayyazAhmedMinhas
37405-2850156-7
EjazAhmedMinhas
490
4119
550
490
4119
550
MinhasChemist13-ChishitiabadSaidpur
60ShamraizKhan
ShamraizKhan
37405-3325896-3
MuhammadIshaq
499
6218
580
499
6218
580
HassanGarmentsShop
NoB-343
Satellite
Town
Comm
ercialMarket,Rawalpindi
61TalibHussain
TalibHussain
37405-0273616-7
ShamshadHussain
498
4744
588
498
4744
588
H-P-988D
/1MohallahA
ngatpura
SaidPurRoadNearTariqBakery,Rawalpindi
62FaisalRehmat
FaisalRehmat
35201-3564531-9
MalikRehmatAli
480
4822
550
480
4822
550
RehmatMarketHarbansPuraCantt
63IrfanBQureshi
IrfanBQureshi
61101-5867215-3
AbdulGhafoor
499
6522
586
499
6522
586
CafeZoukCanodiesInternatioaS9/10
IjazC
entreMainBoulevardGulbergIII
64MuhdNaveed
MuhdNaveed
42201-0552784-7
MuhammadNaseem
490
4219
552
490
4219
552
Shop
#2E-18/5Khayaban-E-JamiCliftonNearFurniture4U
Detailsofloanwrite-offsofRs.500,000andabove
(PKRin'000)
Outstandingliabilitiesatthebeginningoftheyear
Writeoffduringtheyear
S.
Nameandaddress
Nameofindividuals/
CNICNumber
Father/Husband
Principal
Markup
Other
No.
partners/proprietors/
Name
Principal
Markup
Others
Total
writtenoff
writtenoff
financial
Total
relief
provided

United Bank Limited130
[Annexu
re'B'
asref
erred
toinn
ote10.
7ofth
eBank's
uncon
solida
tedandc
onsol
idated
financia
lstate
ments
]
65AzizAnjum
AzizAnjum
33100-8536155-5
ChSaifUrRehman
497
4021
558
497
4021
558
Anjum
WeavingFactory
P-1421StNo3FiazAbad
66MalikMohammadAyub
MalikMohammadAyub
35202-2680499-9
MalikHassanAhmed
481
3519
535
481
3519
535
MadinaCorporation8/9
AliParkThokarNiazBaig
MultanRoad
67KashifAli
KashifAli
35201-2615522-7
SaleemAkbarFarooqi
433
5224
509
433
5224
509
AkzInternational71-C-3
GulbergIII
68ZeeshanFakhar
ZeeshanFakhar
42201-0320956-7
FakarUddin
494
4622
561
494
4622
561
Khawaja
Electronics
AmirElec
Mark
Shop
No1112SurahabKhata
RoadSaddar
69MohammadFarooq
MohammadFarooq
42201-7061810-3
AbdulJabbar
476
6520
561
476
6520
561
ParekhP
lasticEntGroundFloorAm
-4MadinaB
ldgBurnsR
oad
70ZulfiqarMehmood
ZulfiqarMehmood
35200-1454124-1
ChRiasatAli
494
5926
579
494
5926
579
InterSystemE-14/5Kora
ChowkWaltonRoad
71HumayunSiddiq
HumayunSiddiq
42201-0361123-1
MohammadSiddiq
478
3718
533
478
3718
533
ShopNo-9AmijeeValijeeBldg
Shahrah-E-LiaqatNew
Challi
72ChaudhryAbidAli
ChaudhryAbidAli
35200-1510430-9
ChGhullamMurtaza
498
5824
580
498
5824
580
ChaudhryAbidAliSteelTraders27/A
PecoRoadBadamiBaghNrBaf
73ChaudhryAzharHameed
ChaudhryAzharHameed
35201-8820070-3
HameedUllah
500
5321
573
500
5321
573
MadinaM
otorsC
haraghia
Market
DefenceChowkW
altonRoad
Detailsofloanwrite-offsofRs.500,000andabove
(PKRin'000)
Outstandingliabilitiesatthebeginningoftheyear
Writeoffduringtheyear
S.
Nameandaddress
Nameofindividuals/
CNICNumber
Father/Husband
Principal
Markup
Other
No.
partners/proprietors/
Name
Principal
Markup
Others
Total
writtenoff
writtenoff
financial
Total
relief
provided

131Annual Report 2010
[Annexu
re'B'
asref
erred
toinn
ote10.
7ofth
eBank's
uncon
solida
tedandc
onsol
idated
financia
lstate
ments
]
74Naeem
Sadiq
Naeem
Sadiq
33100-0866720-5
SadiqAli
498
5516
570
498
5516
570
NewArifZariHouseS
ultaniaCentre
Shop
No18StNo
7/10MunshiMuhalla
75MuhammadRizwan
MuhammadRizwan
42301-3516141-9
AbdulAziz
-54
478
532
-54
478
532
MusicInnPlotNo
10-CPhase2
ExtSunsetLane4DHA
76AdeelRazzaq
AdeelRazzaq
33100-4119030-5
AbdulRazzaq
498
6320
581
498
6320
581
AhmadAdeelClothR
oomNo
142NdFloor
AminPlazM
uhammadiMakkiTrailBazar
77MohammadIqbalKhan
MohammadIqbalKhan
42301-1061080-9
MLatifKhan
478
1418
509
478
1418
509
TniGroupPlotNo
26-C1StFloor
Stadium
LaneNo
1DHAPhase5
78RahatJaved
RahatJaved
33100-0868498-5
AbdulSattar
440
5718
515
440
5718
515
QaiserEnterprisesP-163
SabziMandi
79MuhammadNazim
MuhammadNazim
35202-7365915-3
MohdNazir
478
5919
557
478
5919
557
MalikNoorAutos85-Lytton
RoadLahore
80ImranADhamee
ImranADhamee
42301-3716809-3
AmirHussainDhamee
474
822
503
474
822
503
GacS
hippingP
vtLtd
GroundFloorU/67
TradeTowerAbdullahHaroonRoadSaddar
81RajaMTariq
RajaMTariq
37401-4151088-1
RajaMuhammadAshraf
490
4319
553
490
4319
553
NewModrenWayDryC
leanerShopNo
11MehranCentreB
lk2P
lotNo
10-AClifton
82QaisarShahzad
QaisarShahzad
61101-9641807-9
SMuhammadSharif
491
4019
550
491
4019
550
JamilPerfumery
ShNo
01NoneBoharBazar
83MalikShahzad
MalikShahzad
35202-1410699-7
MalikMuhammad
458
6019
537
458
6019
537
M-YModelHigh
School36Em
press
ParkBibiPakD
aman
Detailsofloanwrite-offsofRs.500,000andabove
(PKRin'000)
Outstandingliabilitiesatthebeginningoftheyear
Writeoffduringtheyear
S.
Nameandaddress
Nameofindividuals/
CNICNumber
Father/Husband
Principal
Markup
Other
No.
partners/proprietors/
Name
Principal
Markup
Others
Total
writtenoff
writtenoff
financial
Total
relief
provided

United Bank Limited132
[Annexu
re'B'
asref
erred
toinn
ote10.
7ofth
eBank's
uncon
solida
tedandc
onsol
idated
financia
lstate
ments
]
84TariqMehmood
TariqMehmood
35202-8576098-9
GhulamRasool
472
2413
509
472
2413
509
RanaAndSonsGarmentsPlotNo46
StNo
4ToheedPark,Mugalpura
85HussainAliKhan
HussainAliKhan
42201-0431076-9
MohammadAliKhan
485
5122
558
485
5122
558
PowerrexC
omputers,A-148Blk2
Gulshan-E-IqbalNearRubMedicalCentre
86Moazzam
Masaud
Moazzam
Masaud
35202-2808334-5
TajUddin
489
4020
550
489
4020
550
PentagonE
ngineers
TradersOfficeN
o234
AbidChamberFatima
JinahRoadLahore
87HaroonUrRashid
HaroonUrRashid
35201-1583333-1
MianAbdulHamid
408
5739
504
408
5739
504
MAHRiceMillPvtLtd
433M
Block
ModelTownE
xtension
88MalikMuhammadAli
MalikMuhammadAli
35201-1617927-1
MalikBarkatAli
498
6220
579
498
6220
579
AlHamd
MobilesShop
No18RoyalArcade
FerozpurRoadQanchiAm
erSidhu
89ZahirKhitab
ZahirKhitab
42101-9818544-5
SharkandBadshah
603
132
27762
603
132
27762
AsmacsAgencyM-14Mezzanine
Floor
CornicheR
esidencBlk2
Clifton
90NazarUlIslam
NazarUlIslam
42201-0778608-5
QamarulIslam
479
2530
533
479
2530
533
SaifEnterpries
A-756Eo
Society
AbulHasanAsphahniRoad
91SohailAlamKhan
SohailAlamKhan
37405-0246757-7
SardarAlamKhan
1,152
300
991,551
1,152
300
991,551
PhotoS
tatPointShop
No2B
asement
NazarPlazaC
ommercialMarket
92AdnanJLari
AdnanJLari
42101-4192171-9
JavedAnwerLari
458
5917
534
458
5917
534
UnitedBankLim
itedDeptSales
Manager
8ThFlorSlicB
ldgNo
1IChu
93FarhanAnjum
FarhanAnjum
42201-9977204-9
Anjum
Mushtaq
461
5554
570
461
5554
570
FarhanLeatherM-86MznFloorM
unir
Parad
iseBlock17G
ulistan-E-Johar
Detailsofloanwrite-offsofRs.500,000andabove
(PKRin'000)
Outstandingliabilitiesatthebeginningoftheyear
Writeoffduringtheyear
S.
Nameandaddress
Nameofindividuals/
CNICNumber
Father/Husband
Principal
Markup
Other
No.
partners/proprietors/
Name
Principal
Markup
Others
Total
writtenoff
writtenoff
financial
Total
relief
provided

133Annual Report 2010
[Annexu
re'B'
asref
erred
toinn
ote10.
7ofth
eBank's
uncon
solida
tedandc
onsol
idated
financia
lstate
ments
]
94ShahidRashid
ShahidRashid
42501-6563666-7
ChoudhryAbdul
400
9540
535
400
9540
535
H#94-B,Street#7I-10/3
Islamabad
95SohailFarooq
SohailFarooq
42301-4807797-3
MohammadFarooq
499
6623
587
499
6623
587
FarooqSonsSuit9059TFlr
AlRaheem
ToweIIChundrigarRoad
96ShoaibAhmad
ShoaibAhmad
35201-1488777-9
MianGhulamAhmed
432
2747
506
432
2747
506
SSGroupOfCompanies31Km
MultanRoadNearSundarLahore
97MuhammadJafferGM
MuhammadJafferGM
42000-0422308-7
GulMohammadEssa
452
5421
528
452
5421
528
UniversalTractorPakistanPvt.Ltd172-G
AhmedShoppingM
allPechsB
lock-2
MainTariqRoad
98ShaikhRehanEllahi
ShaikhRehanEllahi
42201-0855118-5
ShaikhMushtaq
457
6021
538
457
6021
538
Link.N
etFranchise
Shop
No2G
roundFloor
GulTowerIIChundrigarRoad
99GhousBakhsh
GhousBakhsh
42201-0430019-9
WahidBakhsh
875
231
401,146
875
231
401,146
ShfayInterNationalShopNo
30Navy
HeightsNearKallaPul
100
MuhammadAkram
MuhammadAkram
33100-7997516-1
SafdarAzeem
499
5624
579
499
5624
579
DataSteelWorksShop
ShNo
201N
aya
Pathak84/AResalaRoadSamanabad
101
BilalIqbal
BilalIqbal
33100-1585852-3
SheikhMuhammadIqbal
447
5014
511
447
5014
511
Al-MustafaCentreB
asementShop#7
Street#
3Montgomery
Bazar
102
AzamAli
AzamAli
35202-1195924-5
Nazam
Din
498
6420
582
498
6420
582
NizamFabrics
AndZariS
hopNo
201-G
LibertyPlazaLibertyMarketGulberg
III
103
SadiqNadeem
SadiqNadeem
35202-9020972-9
SheikhManzoor
479
3117
527
479
3117
527
StarCarriersRahim
SteelMillS
top
Shera
KoBundRoad
Detailsofloanwrite-offsofRs.500,000andabove
(PKRin'000)
Outstandingliabilitiesatthebeginningoftheyear
Writeoffduringtheyear
S.
Nameandaddress
Nameofindividuals/
CNICNumber
Father/Husband
Principal
Markup
Other
No.
partners/proprietors/
Name
Principal
Markup
Others
Total
writtenoff
writtenoff
financial
Total
relief
provided

United Bank Limited134
[Annexu
re'B'
asref
erred
toinn
ote10.
7ofth
eBank's
uncon
solida
tedandc
onsol
idated
financia
lstate
ments
]
104
MuhammadShiraz
MuhammadShiraz
33100-6494863-5
ShMuhammadIqbal
500
5215
567
500
5215
567
SbInternationalOffN
o7Basement
AlMustafaCenterStreetNo
3MantgomryBazar
105
MuhammadRashid
MuhammadRashid
42201-0483211-3
ShaikhMYousuf
483
6421
567
483
6421
567
Fabricon407/BAnam
Classic
4ThFloor
DCHS
Shahrah-E-Fasial
106
TanveerAhmed
TanveerAhmed
37405-7470450-5
HajiMuhammadAslam
450
3518
503
450
3518
503
FutureTechOffNo
2JavedPlaza
MezzFloorBlueArea
107
SheikhAmir
SheikhAmir
37405-9171508-1
SheikhMAsgher
442
5418
514
442
5418
514
AsgharTradersAndMillStoreSh
No352
Babo
MohallahS
addar
108
NadeemBhurgri
NadeemBhurgri
42301-2039704-3
CaptA
QBhurgri
499
1122
532
499
1122
532
UblNationalSalesCenter
SchonCircleBrClifton
109
SyedHassanMehdi
SyedHassanMehdi
42201-9474869-9
SyedIftikharMehdi
429
6922
519
429
6922
519
Shop
NoM1-
11HongKongCentre
DrDaudPotaRoadSaddar
110
ImranFarooqChema
ImranFarooq
Chema
34603-1792850-9
ChFarooqAhmed
498
4924
571
498
4924
571
Recto
SportsPvtLtdDaskaR
oadSialkot
111
MansourHussain
MansourHussain
61101-4385324-5
ManzoorHussain
499
2930
557
499
2930
557
NationalCommercialTradersFlatNo8
3RdFloorUnitedCentreS
hamsabad
112
MJunaidArshad
MJunaidArshad
35202-2384945-9
MianMuhammadArshad
484
1618
518
484
1618
518
47-C-1AgroSquareShadmanMarket
113
MuhammadIjaz
MuhammadIjaz
35202-2413206-1
MuhammadAshraf
455
4318
515
455
4318
515
IqraM
obileAndCustomerCenteShop
No11,30
ZaildarRoadUm
erMarketIchra
Detailsofloanwrite-offsofRs.500,000andabove
(PKRin'000)
Outstandingliabilitiesatthebeginningoftheyear
Writeoffduringtheyear
S.
Nameandaddress
Nameofindividuals/
CNICNumber
Father/Husband
Principal
Markup
Other
No.
partners/proprietors/
Name
Principal
Markup
Others
Total
writtenoff
writtenoff
financial
Total
relief
provided

135Annual Report 2010
[Annexu
re'B'
asref
erred
toinn
ote10.
7ofth
eBank's
uncon
solida
tedandc
onsol
idated
financia
lstate
ments
]
114
IftikharAhmed
IftikharAhmed
42301-0996052-1
AbdulGani
476
5619
552
476
5619
552
NewAbrar
JewellersPlotNo281-AGround
FlrCorpGateMehmoodabadMainRoad
115
JamSaleemAli
JamSaleemAli
42301-3496663-3
NawabJamSaddiqAliKhan
474
5248
574
474
5248
574
SangharFarm
sSangharFarmsJam
GothSanghar
116
SaifUlMansoorKhan
SaifUlMansoorKhan
42000-0560374-1
MansoorKhan
479
4719
545
479
4719
545
SaifElectronicsShopNo
G-11Motiwala
Mansion
SarmadRoadSaddar
117
Azeem
WarisKhan
Azeem
WarisKhan
42201-8633557-5
KhanKamalWaris
448
6023
532
448
6023
532
AlWarisTradersHNo
175-J
Block2Pechs
118
ChaudhryGQumais
ChaudhryGQumais
61101-3216595-5
ChNizam
UlDin
483
6519
567
483
6519
567
AfacoHNo
731StNo
74None
119
ArabianGulfCompany
AbdulMohsinAliHassan
AliHassan
4,453
769
-5,223
4,453
769
4,453
9,676
P.O.Box1922AlAin
NazarHussainKhan
SaduKhan
120
PaperMate.
H.E.ShaikhS
audKhalidSultan(Sponsor)
4,174
1,516
-5,689
4,174
1,516
3,101
8,790
P.O.Box.23257,Sharjah
VinayKumarTandon
121
AliaContractingCoLlc
AbdullahGhaloom
Abdullah
-1,865
-1,865
-1,865
-1,865
P.O.Box.45427
AbuDhabi
MohammadMoinuddinGhori
122
HamadAzanMohammadAlMazroui
HamadAzanMohammadAlMazroui
38,821
--
38,821
38,821
-24,785
63,606
P.O.Box.5025AbuDhabi
123
KhizarAbdullahAhmed.
KhizarAbdullahAhmed.
979
1,585
-2,565
979
1,585
956
3,521
P.O.Box.791,AbuDhabi
124
GulfGroupInformation
IssaAmanObaidAman
-4,080
-4,080
-4,080
-4,080
P.O.Box.46964,20,AbuDhabiAsaadAlAmiri
Detailsofloanwrite-offsofRs.500,000andabove
(PKRin'000)
Outstandingliabilitiesatthebeginningoftheyear
Writeoffduringtheyear
S.
Nameandaddress
Nameofindividuals/
CNICNumber
Father/Husband
Principal
Markup
Other
No.
partners/proprietors/
Name
Principal
Markup
Others
Total
writtenoff
writtenoff
financial
Total
relief
provided
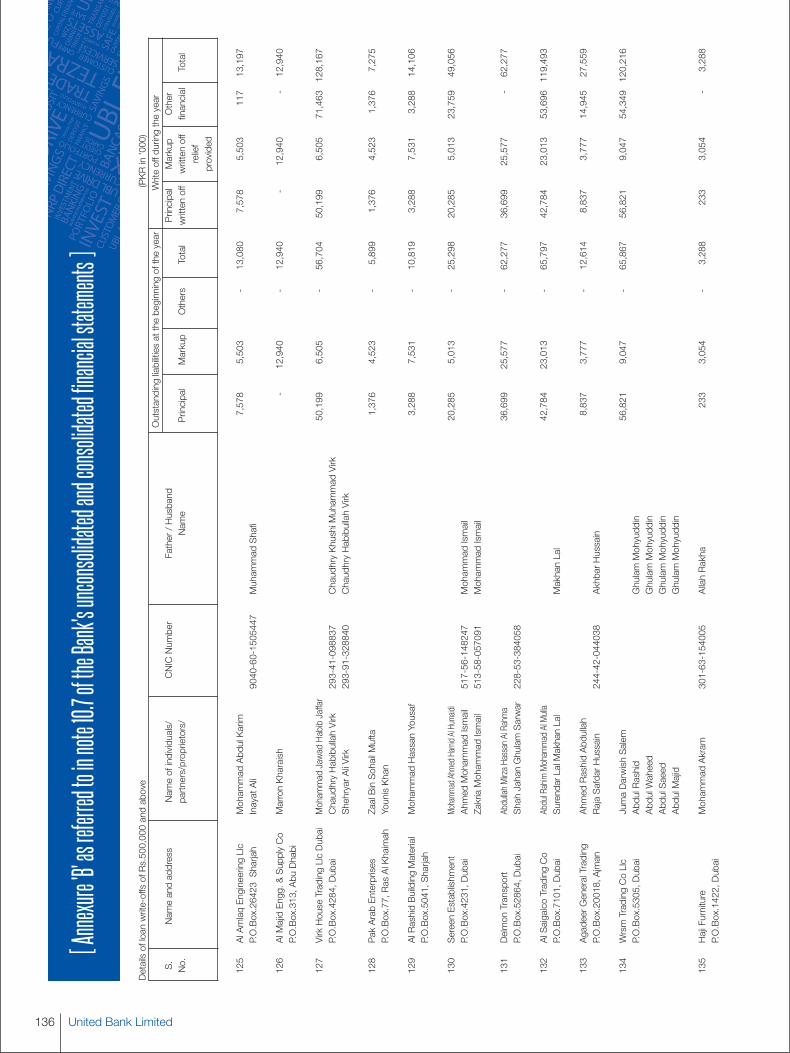
United Bank Limited136
[Annexu
re'B'
asref
erred
toinn
ote10.
7ofth
eBank's
uncon
solida
tedandc
onsol
idated
financia
lstate
ments
]
125
AlAmlaqEngineeringLlc
MohammadAbdulKarim
7,578
5,503
-13,080
7,578
5,503
117
13,197
P.O.Box.26423
Sharjah
InayatAli
9040-60-1505447
MuhammadShafi
126
AlMajidEngg.&SupplyCo
MarronKharaish
-12,940
-12,940
-12,940
-12,940
P.O.Box.313,AbuDhabi
127
VirkHouseTradingLlcDubai
MohammadJawadHabibJaffar
50,199
6,505
-56,704
50,199
6,505
71,463
128,167
P.O.Box.4284,Dubai
ChaudhryHabibullahVirk
293-41-098837
ChaudhryKhushiMuhammadVirk
ShehryarAliVirk
293-91-328840
ChaudhryHabibullahVirk
128
PakArabEnterprises
ZaalBinSohailMufta
1,376
4,523
-5,899
1,376
4,523
1,376
7,275
P.O.Box.77,RasAlKhaimah
YounisKhan
129
AlRashidBuildingMaterial
MohammadHassanYousaf
3,288
7,531
-10,819
3,288
7,531
3,288
14,106
P.O.Box.5041,Sharjah
130
SereenEstablishment
Mohamm
adAhmedHamidAlHumaidi
20,285
5,013
-25,298
20,285
5,013
23,759
49,056
P.O.Box.4231,Dubai
AhmedMohammadIsmail
517-56-148247
MohammadIsmail
ZakriaMohammadIsmail
513-58-057091
MohammadIsmail
131
DelmonTransport
AbdullahMirzaHassanAlRahma
36,699
25,577
-62,277
36,699
25,577
-62,277
P.O.Box.52864,Dubai
ShahJahanGhulamSarwar
228-53-384058
132
AlSaigalcoTradingCo
AbdulRahimMohammadAlMulla
42,784
23,013
-65,797
42,784
23,013
53,696
119,493
P.O.Box.7101,Dubai
SurendarLalMakhanLal
MakhanLal
133
AgadeerGeneralTrading
AhmedRashidAbdullah
8,837
3,777
-12,614
8,837
3,777
14,945
27,559
P.O.Box.20018,Ajman
RajaSafdarHussain
244-42-044038
AkhbarHussain
134
WrsmTradingCoLlc
JumaDarwishSalem
56,821
9,047
-65,867
56,821
9,047
54,349
120,216
P.O.Box.5305,Dubai
AbdulRashid
GhulamMohyuddin
AbdulWaheed
GhulamMohyuddin
AbdulSaeed
GhulamMohyuddin
AbdulMajid
GhulamMohyuddin
135
HajiFurniture
MohammadAkram
301-63-154005
AllahRakha
233
3,054
-3,288
233
3,054
-3,288
P.O.Box.1422,Dubai
Detailsofloanwrite-offsofRs.500,000andabove
(PKRin'000)
Outstandingliabilitiesatthebeginningoftheyear
Writeoffduringtheyear
S.
Nameandaddress
Nameofindividuals/
CNICNumber
Father/Husband
Principal
Markup
Other
No.
partners/proprietors/
Name
Principal
Markup
Others
Total
writtenoff
writtenoff
financial
Total
relief
provided
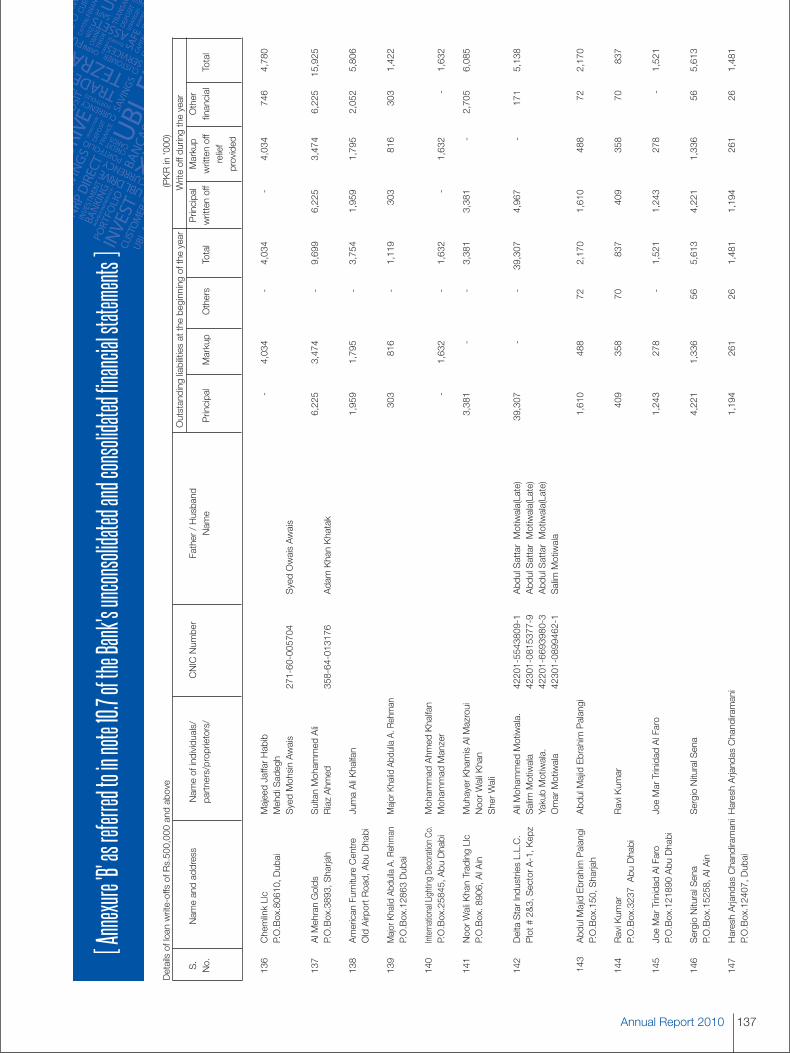
137Annual Report 2010
[Annexu
re'B'
asref
erred
toinn
ote10.
7ofth
eBank's
uncon
solida
tedandc
onsol
idated
financia
lstate
ments
]
136
ChemlinkLlc
MajeedJaffarHabib
-4,034
-4,034
-4,034
746
4,780
P.O.Box.80610,Dubai
MehdiSadegh
SyedMohsinAwais
271-60-005704
SyedOwaisAwais
137
AlMehranGolds
SultanMohammedAli
6,225
3,474
-9,699
6,225
3,474
6,225
15,925
P.O.Box.3893,Sharjah
RiazAhmed
358-64-013176
AdamKhanKhatak
138
AmericanFurnitureCentre
JumaAliKhalfan
1,959
1,795
-3,754
1,959
1,795
2,052
5,806
OldAirportRoad,AbuDhabi
139
MajorKhalidAbdullaA.Rehman
MajorKhalidAbdullaA.Rehman
303
816
-1,119
303
816
303
1,422
P.O.Box.12863Dubai
140
InternationalLighting
DecorationCo.
MohammadAhmedKhalfan
P.O.Box.25845,AbuDhabi
MohammadManzer
-1,632
-1,632
-1,632
-1,632
141
NoorWaliKhanTradingLlc
MuhayerKhamisAlMazroui
3,381
--
3,381
3,381
-2,705
6,085
P.O.Box.8906,AlAin
NoorWaliKhan
SherWali
142
DeltaStarIndustriesL.L.C.
AliMohammedMotiwala.
42201-5543809-1
AbdulSattarMotiwala(Late)
39,307
--
39,307
4,967
-171
5,138
Plot#2&3,SectorA-1,Kepz
SalimMotiwala
42301-0815377-9
AbdulSattarMotiwala(Late)
YakubMotiwala.
42201-6693980-3
AbdulSattarMotiwala(Late)
OmarMotiwala
42301-0899462-1
SalimMotiwala
143
AbdulMajidEbrahimPalangi
AbdulMajidEbrahimPalangi
1,610
488
722,170
1,610
488
722,170
P.O.Box.150,Sharjah
144
RaviKumar
RaviKumar
409
358
70837
409
358
70837
P.O.Box.3237AbuDhabi
145
JoeMarTrinidadAlFaro
JoeMarTrinidadAlFaro
1,243
278
-1,521
1,243
278
-1,521
P.O.Box.121890AbuDhabi
146
SergioNituralSena
SergioNituralSena
4,221
1,336
565,613
4,221
1,336
565,613
P.O.Box.15258,AlAin
147
HareshArjandasChandiramaniHareshArjandasChandiramani
1,194
261
261,481
1,194
261
261,481
P.O.Box.12407,Dubai
Detailsofloanwrite-offsofRs.500,000andabove
(PKRin'000)
Outstandingliabilitiesatthebeginningoftheyear
Writeoffduringtheyear
S.
Nameandaddress
Nameofindividuals/
CNICNumber
Father/Husband
Principal
Markup
Other
No.
partners/proprietors/
Name
Principal
Markup
Others
Total
writtenoff
writtenoff
financial
Total
relief
provided
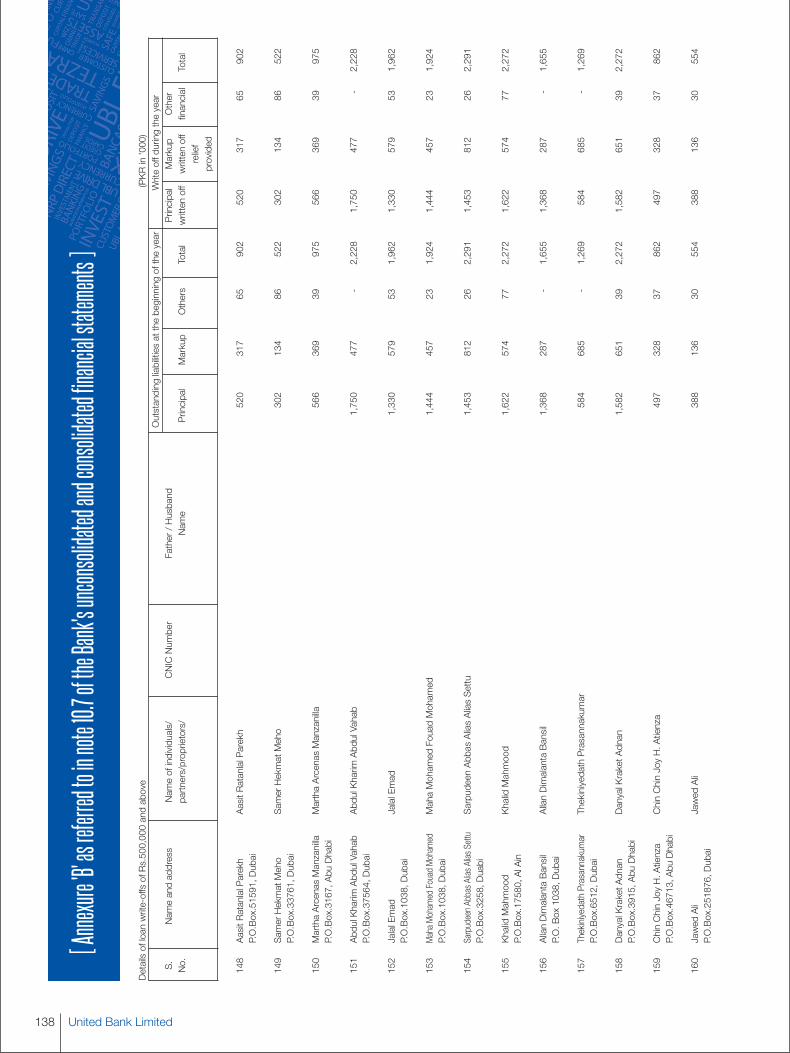
United Bank Limited138
[Annexu
re'B'
asref
erred
toinn
ote10.
7ofth
eBank's
uncon
solida
tedandc
onsol
idated
financia
lstate
ments
]
148
AasitRatanlalParekh
AasitRatanlalParekh
520
317
65902
520
317
65902
P.O.Box.51591,Dubai
149
SamerHekmatMeho
SamerHekmatMeho
302
134
86522
302
134
86522
P.O.Box.33761,Dubai
150
MarthaArcenasManzanilla
MarthaArcenasManzanilla
566
369
39975
566
369
39975
P.O.Box.3167,AbuDhabi
151
AbdulKharim
AbdulVahab
AbdulKharim
AbdulVahab
1,750
477
-2,228
1,750
477
-2,228
P.O.Box.37564,Dubai
152
JalalEmad
JalalEmad
1,330
579
531,962
1,330
579
531,962
P.O.Box.1038,Dubai
153
MahaMohamedFouadMohamed
MahaMohamedFouadMohamed
1,444
457
231,924
1,444
457
231,924
P.O.Box.1038,Dubai
154
SarpudeenAbbasAlias
Alias
Settu
SarpudeenAbbasAliasAliasSettu
1,453
812
262,291
1,453
812
262,291
P.O.Box.3258,Duabi
155
KhalidMahmood
KhalidMahmood
1,622
574
772,272
1,622
574
772,272
P.O.Box.17580,AlAin
156
AllanDimalantaBansil
AllanDimalantaBansil
1,368
287
-1,655
1,368
287
-1,655
P.O.Box1038,Dubai
157
ThekiniyedathPrasannakumar
ThekiniyedathPrasannakumar
584
685
-1,269
584
685
-1,269
P.O.Box.6512,Dubai
158
DanyalKraketAdnan
DanyalKraketAdnan
1,582
651
392,272
1,582
651
392,272
P.O.Box.3915,AbuDhabi
159
ChinChinJoyH.Atienza
ChinChinJoyH.Atienza
497
328
37862
497
328
37862
P.O.Box.46713,AbuDhabi
160
JawedAli
JawedAli
388
136
30554
388
136
30554
P.O.Box.251876,Dubai
Detailsofloanwrite-offsofRs.500,000andabove
(PKRin'000)
Outstandingliabilitiesatthebeginningoftheyear
Writeoffduringtheyear
S.
Nameandaddress
Nameofindividuals/
CNICNumber
Father/Husband
Principal
Markup
Other
No.
partners/proprietors/
Name
Principal
Markup
Others
Total
writtenoff
writtenoff
financial
Total
relief
provided

139Annual Report 2010
[Annexu
re'B'
asref
erred
toinn
ote10.
7ofth
eBank's
uncon
solida
tedandc
onsol
idated
financia
lstate
ments
]
161
ZulfiqarAliTahir
ZulfiqarAliTahir
664
278
-942
664
278
-942
P.O.Box.894,Dubai
162
ShrawanaKumarShukla
ShrawanaKumarShukla
1,743
451
262,220
1,743
451
262,220
P.O.Box.6891,Dubai
163
YudaraMalithDeSilvaManam
YudaraMalithDeSilvaManam
1,279
312
-1,591
1,279
312
-1,591
P.O.Box.6891,Dubai
164
ShahulHameedSyeduAli
ShahulHameedSyeduAli
540
222
56819
540
222
56819
P.O.Box.22577,Dubai
165
ChackoThomas
ChackoThomas
560
187
-747
560
187
-747
P.O.Box.286,Dubai
166
HasanAhmedAzeri
HasanAhmedAzeri
2,421
592
-3,013
2,421
592
-3,013
P.O.Box.4017,AbuDhabi
167
BrianJoseAysonBarin
BrianJoseAysonBarin
394
227
-622
394
227
-622
P.O.Box.30439,Dubai
168
MuhammadJunaidBawany
MuhammadJunaidBawany
1,701
826
-2,527
1,701
826
-2,527
P.O.Box.1123,Dubai
169
NihalChristopherPaul.F.Maln
NihalChristopherPaul.F.Maln
1,691
464
582,213
1,691
464
582,213
P.O.Box.3668,AbuDhabi
170
MohamedNayefOmarNourEldinB
esiso
MohamedNayefOmarNourEldinBesiso
656
220
26902
656
220
26902
P.O.Box.839,AbuDhabi
171
MustafaTuren
MustafaTuren
656
356
651,078
656
356
651,078
P.O.Box.898,AbuDhabi
172
ReginoSantaderLaders
ReginoSantaderLaders
1,636
376
-2,012
1,636
376
-2,012
P.O.Box.15258,AbuDhabi
173
ElmerNagalesDelaCruz
ElmerNagalesDelaCruz
3,519
574
-4,092
3,519
574
-4,092
P.O.Box.46153,AbuDhabi
Detailsofloanwrite-offsofRs.500,000andabove
(PKRin'000)
Outstandingliabilitiesatthebeginningoftheyear
Writeoffduringtheyear
S.
Nameandaddress
Nameofindividuals/
CNICNumber
Father/Husband
Principal
Markup
Other
No.
partners/proprietors/
Name
Principal
Markup
Others
Total
writtenoff
writtenoff
financial
Total
relief
provided
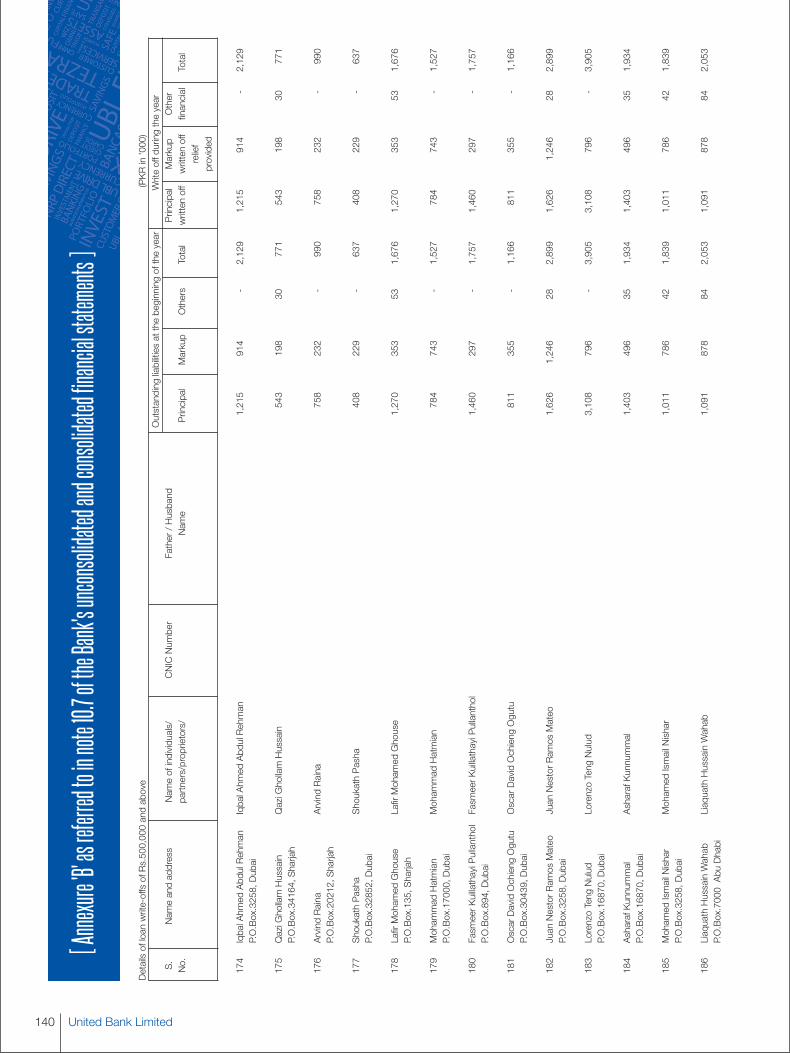
United Bank Limited140
[Annexu
re'B'
asref
erred
toinn
ote10.
7ofth
eBank's
uncon
solida
tedandc
onsol
idated
financia
lstate
ments
]
174
IqbalAhmedAbdulRehman
IqbalAhmedAbdulRehman
1,215
914
-2,129
1,215
914
-2,129
P.O.Box.3258,Dubai
175
QaziGhollamHussain
QaziGhollamHussain
543
198
30771
543
198
30771
P.O.Box.34164,Sharjah
176
ArvindRaina
ArvindRaina
758
232
-990
758
232
-990
P.O.Box.20212,Sharjah
177
ShoukathPasha
ShoukathPasha
408
229
-637
408
229
-637
P.O.Box.32852,Dubai
178
LafirMohamedGhouse
LafirMohamedGhouse
1,270
353
531,676
1,270
353
531,676
P.O.Box.135,Sharjah
179
MohammadHatmian
MohammadHatmian
784
743
-1,527
784
743
-1,527
P.O.Box.17000,Dubai
180
FasmeerKuillathayiPullantholFasmeerKuillathayiPullanthol
1,460
297
-1,757
1,460
297
-1,757
P.O.Box.894,Dubai
181
OscarDavidOchiengOgutu
OscarDavidOchiengOgutu
811
355
-1,166
811
355
-1,166
P.O.Box.30439,Dubai
182
JuanNestorRamosMateo
JuanNestorRamosMateo
1,626
1,246
282,899
1,626
1,246
282,899
P.O.Box.3258,Dubai
183
LorenzoTengNulud
LorenzoTengNulud
3,108
796
-3,905
3,108
796
-3,905
P.O.Box.16870,Dubai
184
AsharafKunnummal
AsharafKunnummal
1,403
496
351,934
1,403
496
351,934
P.O.Box.16870,Dubai
185
MohamedIsmailNishar
MohamedIsmailNishar
1,011
786
421,839
1,011
786
421,839
P.O.Box.3258,Dubai
186
LiaquathHussainWahab
LiaquathHussainWahab
1,091
878
842,053
1,091
878
842,053
P.O.Box.7000AbuDhabi
Detailsofloanwrite-offsofRs.500,000andabove
(PKRin'000)
Outstandingliabilitiesatthebeginningoftheyear
Writeoffduringtheyear
S.
Nameandaddress
Nameofindividuals/
CNICNumber
Father/Husband
Principal
Markup
Other
No.
partners/proprietors/
Name
Principal
Markup
Others
Total
writtenoff
writtenoff
financial
Total
relief
provided

141Annual Report 2010
[Annexu
re'B'
asref
erred
toinn
ote10.
7ofth
eBank's
uncon
solida
tedandc
onsol
idated
financia
lstate
ments
]
187
AmparoBananaAmpey
AmparoBananaAmpey
937
275
601,272
937
275
601,272
P.O.Box.46713AbuDhabi
188
ChamindaJayanathKuruppuG
ChamindaJayanathKuruppuG
1,028
338
281,394
1,028
338
281,394
P.O.Box.16876,Dubai
189
AmirMassoudAhmedMoezziAmirMassoudAhmedMoezzi
350
147
26523
350
147
26523
P.O.Box.27237,Dubai
190
MuhammadMobeen
MuhammadMobeen
427
376
77879
427
376
77879
P.O.Box.99999,Dubai
191
AnicetoMoralesGabinete
AnicetoMoralesGabinete
748
448
491,245
748
448
491,245
P.O.Box.32835,AbuDhabi
192
EdmonDeJesusMagat
EdmonDeJesusMagat
989
643
321,665
989
643
321,665
P.O.Box.47814,Dubai
193
MargeeJoyGarcesa
MargeeJoyGarcesa
1,215
374
211,609
1,215
374
211,609
P.O.Box.500220,Dubai
194
RamilSantosParinas
RamilSantosParinas
357
534
109
1,000
357
534
109
1,000
P.O.Box.44486
AbuDhabi
195
AghiadWaelKujan
AghiadWaelKujan
490
310
49849
490
310
49849
P.O.Box.60772,Dubai
196
SajidMahmood
SajidMahmood
748
212
23983
748
212
23983
P.O.Box.115242,Dubai
197
GeetaAasitParekh
GeetaAasitParekh
493
191
53737
493
191
53737
P.O.Box.51591,Dubai
198
MuhammedAqeelKhan
MuhammedAqeelKhan
371
120
53544
371
120
53544
P.O.Box.42457,Dubai
199
AndoorNilathKunjuMMusthafaAndoorNilathKunjuMMusthafa
1,443
783
-2,226
1,443
783
-2,226
P.O.Box.3258,Dubai
Detailsofloanwrite-offsofRs.500,000andabove
(PKRin'000)
Outstandingliabilitiesatthebeginningoftheyear
Writeoffduringtheyear
S.
Nameandaddress
Nameofindividuals/
CNICNumber
Father/Husband
Principal
Markup
Other
No.
partners/proprietors/
Name
Principal
Markup
Others
Total
writtenoff
writtenoff
financial
Total
relief
provided
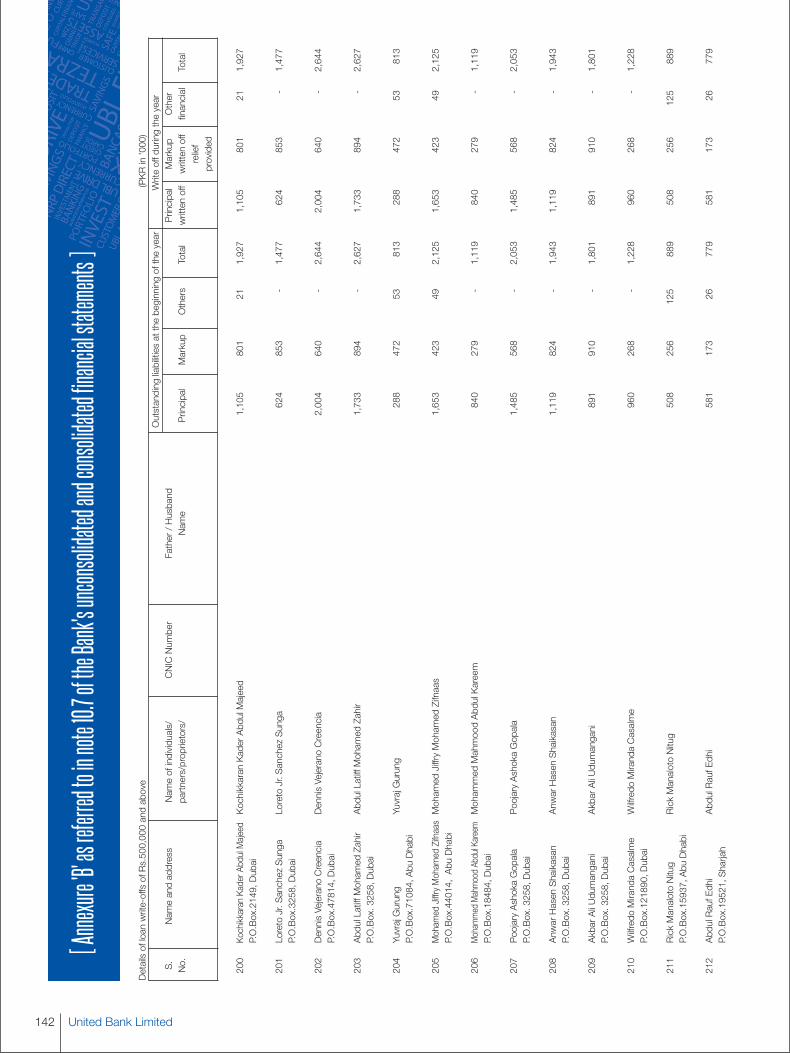
United Bank Limited142
[Annexu
re'B'
asref
erred
toinn
ote10.
7ofth
eBank's
uncon
solida
tedandc
onsol
idated
financia
lstate
ments
]
200
KochikkaranKaderAbdulMajeedKochikkaranKaderAbdulMajeed
1,105
801
211,927
1,105
801
211,927
P.O.Box.2149,Dubai
201
LoretoJr.SanchezSunga
LoretoJr.SanchezSunga
624
853
-1,477
624
853
-1,477
P.O.Box.3258,Dubai
202
DennisVejeranoCreencia
DennisVejeranoCreencia
2,004
640
-2,644
2,004
640
-2,644
P.O.Box.47814,Dubai
203
AbdulLatiffMohamedZahir
AbdulLatiffMohamedZahir
1,733
894
-2,627
1,733
894
-2,627
P.O.Box.3258,Dubai
204
YuvrajGurung
YuvrajGurung
288
472
53813
288
472
53813
P.O.Box.71084,AbuDhabi
205
MohamedJiffryMohamedZifnaasMohamedJiffryMohamedZifnaas
1,653
423
492,125
1,653
423
492,125
P.O.Box.44014,AbuDhabi
206
MohammedMahmoodAbdulKareem
MohammedMahmoodAbdulKareem
840
279
-1,119
840
279
-1,119
P.O.Box.18484,Dubai
207
PoojaryAshokaGopala
PoojaryAshokaGopala
1,485
568
-2,053
1,485
568
-2,053
P.O.Box.3258,Dubai
208
AnwarHasenShaikasan
AnwarHasenShaikasan
1,119
824
-1,943
1,119
824
-1,943
P.O.Box.3258,Dubai
209
AkbarAliUdumangani
AkbarAliUdumangani
891
910
-1,801
891
910
-1,801
P.O.Box.3258,Dubai
210
WilfredoMirandaCasalme
Wilfredo
MirandaCasalme
960
268
-1,228
960
268
-1,228
P.O.Box.121890,Dubai
211
RickManalotoNitug
RickManalotoNitug
508
256
125
889
508
256
125
889
P.O.Box.15937,AbuDhabi
212
AbdulRaufEdhi
AbdulRaufEdhi
581
173
26779
581
173
26779
P.O.Box.19521,Sharjah
Detailsofloanwrite-offsofRs.500,000andabove
(PKRin'000)
Outstandingliabilitiesatthebeginningoftheyear
Writeoffduringtheyear
S.
Nameandaddress
Nameofindividuals/
CNICNumber
Father/Husband
Principal
Markup
Other
No.
partners/proprietors/
Name
Principal
Markup
Others
Total
writtenoff
writtenoff
financial
Total
relief
provided

143Annual Report 2010
[Annexu
re'B'
asref
erred
toinn
ote10.
7ofth
eBank's
uncon
solida
tedandc
onsol
idated
financia
lstate
ments
]
213
AliIbrahimJama
AliIbrahimJama
509
125
30664
509
125
30664
P.O.Box.928,AbuDhabi
214
MShafaqatShazad
MShafaqatShazad
509
113
28650
509
113
28650
P.O.Box.20814,Sharjah
215
KamalKanayalalAhuja
KamalKanayalalAhuja
472
117
26614
472
117
26614
P.O.Box.8799,Dubai
216
AmapolaArnocoMayuga
AmapolaArnocoMayuga
278
282
-560
278
282
-560
P.O.Box.202088AlAin
217
JaikishanShyamdasGamnani
JaikishanShyamdasGamnani
354
129
63546
354
129
63546
P.O.Box.46444,Dubai
218
MuhammadNadeemHameedPuri
MuhammadNadeemHameedPuri
392
124
26542
392
124
26542
P.O.Box.40132,Ajman
219
AbdullahMohammadRamkaniAbdullahMohammadRamkani
376
9726
499
376
9726
499
P.O.Box.15469,Dubai
220
HashimMohamm
adJaddouaA
lQurnen
HashimMohammadJaddouaAlQurnen
2,925
2,175
565,155
2,925
2,175
565,155
P.O.Box.15258,AlAin
221
NeliaSantezoTejero
NeliaSantezoTejero
2,214
895
-3,109
2,214
895
-3,109
P.O.Box.15258,AlAin
222
ClaroJrRioRamirez
ClaroJrRioRamirez
1,520
1,352
-2,872
1,520
1,352
-2,872
P.O.Box.3258,Dubai
223
IbrahimRamosUri
IbrahimRamosUri
1,851
529
582,438
1,851
529
582,438
P.O.Box.3668,AbuDhabi
224
ThandiyakkalR.RadhaKrishnan
ThandiyakkalR.RadhaKrishnan
2,295
1,143
193,456
2,295
1,143
193,456
P.O.Box.65948,Dubai
225
MuhammadAbdiIsmail
MuhammadAbdiIsmail
2,655
749
-3,403
2,655
749
-3,403
P.O.Box.51900
AbuDhabi
Detailsofloanwrite-offsofRs.500,000andabove
(PKRin'000)
Outstandingliabilitiesatthebeginningoftheyear
Writeoffduringtheyear
S.
Nameandaddress
Nameofindividuals/
CNICNumber
Father/Husband
Principal
Markup
Other
No.
partners/proprietors/
Name
Principal
Markup
Others
Total
writtenoff
writtenoff
financial
Total
relief
provided
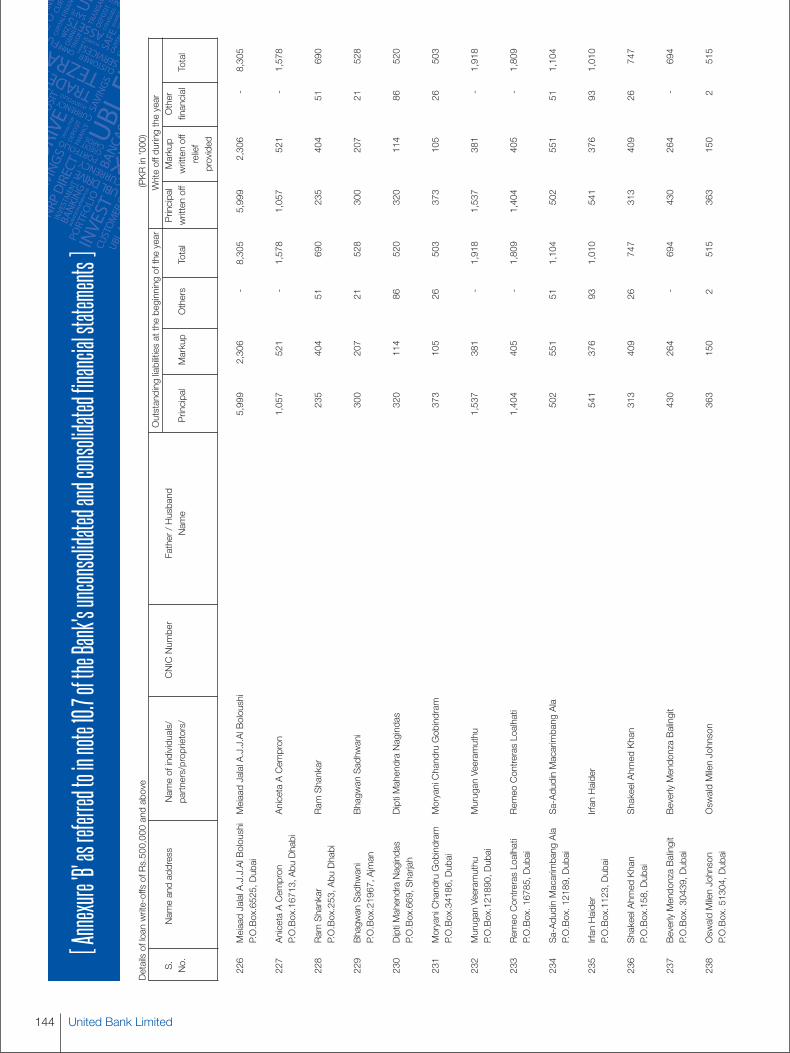
United Bank Limited144
[Annexu
re'B'
asref
erred
toinn
ote10.
7ofth
eBank's
uncon
solida
tedandc
onsol
idated
financia
lstate
ments
]
226
MeiaadJalalA.J.J.AlBoloushiMeiaadJalalA.J.J.AlBoloushi
5,999
2,306
-8,305
5,999
2,306
-8,305
P.O.Box.6525,Dubai
227
AnicetaACempron
AnicetaACempron
1,057
521
-1,578
1,057
521
-1,578
P.O.Box.16713,AbuDhabi
228
Ram
Shankar
Ram
Shankar
235
404
51690
235
404
51690
P.O.Box.253,AbuDhabi
229
BhagwanSadhwani
BhagwanSadhwani
300
207
21528
300
207
21528
P.O.Box.21967,Ajman
230
DiptiMahendraNagindas
DiptiMahendraNagindas
320
114
86520
320
114
86520
P.O.Box.669,Sharjah
231
MoryaniChandruGobindram
MoryaniChandruGobindram
373
105
26503
373
105
26503
P.O.Box.34186,Dubai
232
MuruganVeeramuthu
MuruganVeeramuthu
1,537
381
-1,918
1,537
381
-1,918
P.O.Box.121890,Dubai
233
RemeoContrerasLoalhati
RemeoContrerasLoalhati
1,404
405
-1,809
1,404
405
-1,809
P.O.Box.16785,Dubai
234
Sa-AdudinMacarimbangAla
Sa-AdudinMacarimbangAla
502
551
511,104
502
551
511,104
P.O.Box.12189,Dubai
235
IrfanHaider
IrfanHaider
541
376
931,010
541
376
931,010
P.O.Box.1123,Dubai
236
ShakeelAhmedKhan
ShakeelAhmedKhan
313
409
26747
313
409
26747
P.O.Box.158,Dubai
237
BeverlyMendonzaBalingit
BeverlyMendonzaBalingit
430
264
-694
430
264
-694
P.O.Box.30439,Dubai
238
OswaldMilenJohnson
OswaldMilenJohnson
363
150
2515
363
150
2515
P.O.Box.51304,Dubai
Detailsofloanwrite-offsofRs.500,000andabove
(PKRin'000)
Outstandingliabilitiesatthebeginningoftheyear
Writeoffduringtheyear
S.
Nameandaddress
Nameofindividuals/
CNICNumber
Father/Husband
Principal
Markup
Other
No.
partners/proprietors/
Name
Principal
Markup
Others
Total
writtenoff
writtenoff
financial
Total
relief
provided

145Annual Report 2010
[Annexu
re'B'
asref
erred
toinn
ote10.
7ofth
eBank's
uncon
solida
tedandc
onsol
idated
financia
lstate
ments
]
239
JuraijPunnakkantakkath
JuraijPunnakkantakkath
1,140
465
211,626
1,140
465
211,626
P.O.Box.13001,Dubai
240
PoikayilMathaiGinumon
PoikayilMathaiGinumon
1,084
467
261,577
1,084
467
261,577
P.O.Box320,Dubai
241
RashidMehboob
RashidMehboob
630
440
211,091
630
440
211,091
P.O.Box.7631,Dubai
242
HaniSalahE.IbrahimMohammad
HaniSalahE.IbrahimMohammad
712
219
32964
712
219
32964
P.O.Box.1184,Dubai
243
ChidambaramShenbagaKumarChidambaramShenbagaKumar
643
185
56884
643
185
56884
P.O.Box.30165,Sharjah
243
HilarionaRiveraAblalle
HilarionaRiveraAblalle
1,342
570
-1,912
1,342
570
-1,912
P.O.Box.502300,Dubai
244
MuhammadYousafSaeedi
MuhammadYousafSaeedi
567
5723
647
567
5723
647
P.O.Box.31308,Dubai
245
EyattuP.A.RehmanBinshad
EyattuP.A.RehmanBinshad
1,173
534
421,749
1,173
534
421,749
P.O.Box.61450,Dubai
246
ShubanAli
ShubanAli
551
249
-800
551
249
-800
P.O.Box.25672,AbuDhabi
247
MuhammadImranChaudhry
MuhammadImranChaudhry
364
192
67622
364
192
67622
P.O.Box.62524,Sharjah
248
MaryJoseph
MaryJoseph
2,659
691
-3,350
2,659
691
-3,350
P.O.Box.62870,Dubai
250
AgnesMandocdoc
AgnesMandocdoc
1,675
367
-2,043
1,675
367
-2,043
P.O.Box.62532,Dubai
251
RedaAbdelKader.
RedaAbdelKader.
1,260
894
-2,155
1,260
894
-2,155
P.O.Box.17000,Dubai
Detailsofloanwrite-offsofRs.500,000andabove
(PKRin'000)
Outstandingliabilitiesatthebeginningoftheyear
Writeoffduringtheyear
S.
Nameandaddress
Nameofindividuals/
CNICNumber
Father/Husband
Principal
Markup
Other
No.
partners/proprietors/
Name
Principal
Markup
Others
Total
writtenoff
writtenoff
financial
Total
relief
provided

United Bank Limited146
[Annexu
re'B'
asref
erred
toinn
ote10.
7ofth
eBank's
uncon
solida
tedandc
onsol
idated
financia
lstate
ments
]
252
JorgeGaluraNulud
JorgeGaluraNulud
276
169
63507
276
169
63507
P.O.Box.2222,Dubai
253
AdnanAliSyed
AdnanAliSyed
2,326
399
462,771
2,326
399
462,771
P.O.Box.63111,AbuDhabi
254
MildredInocencioMercado
MildredInocencioMercado
959
911
100
1,970
959
911
100
1,970
P.O.Box.34491,AbuDhabi
255
MartinVargheese
MartinVargheese
224
324
49597
224
324
49597
P.O.Box.2403,AbuDhabi
256
AmritBahadurKhadka
AmritBahadurKhadka
592
184
46822
592
184
46822
P.O.Box.580,AbuDhabi
257
AliAbd
MohammadDhaif
AliAbd
MohammadDhaif
1,936
1,012
-2,949
1,936
1,012
-2,949
P.O.Box.3649,AbuDhabi
258
JosephineOrbanan
JosephineOrbanan
186
247
118
551
186
247
118
551
P.O.Box.3147,AbuDhabi
259
MdAzizulHaque
MdAzizulHaque
530
327
104
961
530
327
104
961
P.O.Box.253,AbuDhabi
260
JohnPius
JohnPius
1,408
671
-2,079
1,408
671
-2,079
P.O.Box.17322AbuDhabi
261
RajMohammadHajaMydeen
RajMohammadHajaMydeen
1,134
929
372,100
1,134
929
372,100
P.O.Box.3147,AbuDhabi
262
WimalaWeeraLiyanag
WimalaWeeraLiyanag
1,210
406
-1,616
1,210
406
-1,616
P.O.Box.3668,AbuDhabi
263
HamzaMannanthara
HamzaMannanthara
431
7642
549
431
7642
549
P.O.Box.95857,Sharjah
264
AudrylaneRubia
AudrylaneRubia
521
345
74939
521
345
74939
P.O.Box.46713,AbuDhabi
Detailsofloanwrite-offsofRs.500,000andabove
(PKRin'000)
Outstandingliabilitiesatthebeginningoftheyear
Writeoffduringtheyear
S.
Nameandaddress
Nameofindividuals/
CNICNumber
Father/Husband
Principal
Markup
Other
No.
partners/proprietors/
Name
Principal
Markup
Others
Total
writtenoff
writtenoff
financial
Total
relief
provided
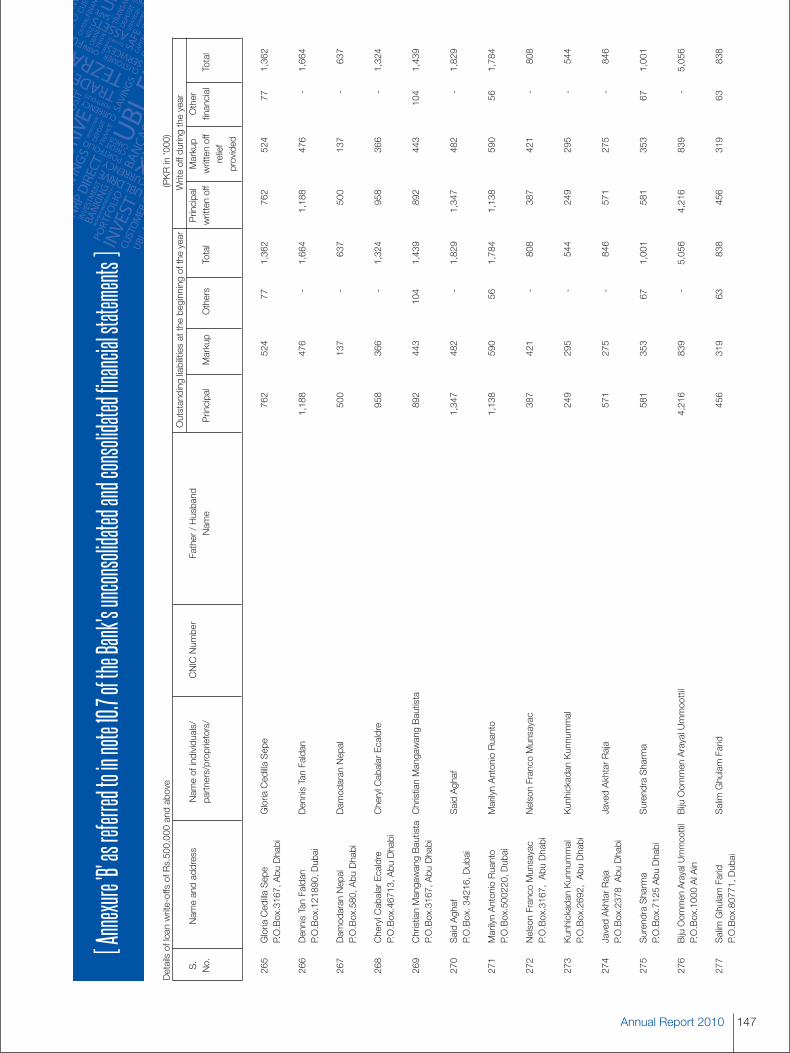
147Annual Report 2010
[Annexu
re'B'
asref
erred
toinn
ote10.
7ofth
eBank's
uncon
solida
tedandc
onsol
idated
financia
lstate
ments
]
265
GloriaCedillaSepe
GloriaCedillaSepe
762
524
771,362
762
524
771,362
P.O.Box.3167,AbuDhabi
266
DennisTanFaldan
DennisTanFaldan
1,188
476
-1,664
1,188
476
-1,664
P.O.Box.121890,Dubai
267
DamodaranNepal
DamodaranNepal
500
137
-637
500
137
-637
P.O.Box.580,AbuDhabi
268
CherylCabalarEcaldre
CherylCabalarEcaldre
958
366
-1,324
958
366
-1,324
P.O.Box.46713,AbuDhabi
269
ChristianMangawangBautista
ChristianMangawangBautista
892
443
104
1,439
892
443
104
1,439
P.O.Box.3167,AbuDhabi
270
SaidAghaf
SaidAghaf
1,347
482
-1,829
1,347
482
-1,829
P.O.Box.34216,Dubai
271
MarilynAntonioRuanto
MarilynAntonioRuanto
1,138
590
561,784
1,138
590
561,784
P.O.Box.500220,Dubai
272
NelsonFrancoMunsayac
NelsonFrancoMunsayac
387
421
-808
387
421
-808
P.O.Box.3167,AbuDhabi
273
KunhickadanKunnummal
KunhickadanKunnummal
249
295
-544
249
295
-544
P.O.Box.2692,AbuDhabi
274
JavedAkhtarRaja
JavedAkhtarRaja
571
275
-846
571
275
-846
P.O.Box.2378AbuDhabi
275
SurendraSharma
SurendraSharma
581
353
671,001
581
353
671,001
P.O.Box.7125AbuDhabi
276
BijuOommenArayalUmmoottilBijuOommenArayalUmmoottil
4,216
839
-5,056
4,216
839
-5,056
P.O.Box.1000AlAin
277
SalimGhulamFarid
SalimGhulamFarid
456
319
63838
456
319
63838
P.O.Box.80771,Dubai
Detailsofloanwrite-offsofRs.500,000andabove
(PKRin'000)
Outstandingliabilitiesatthebeginningoftheyear
Writeoffduringtheyear
S.
Nameandaddress
Nameofindividuals/
CNICNumber
Father/Husband
Principal
Markup
Other
No.
partners/proprietors/
Name
Principal
Markup
Others
Total
writtenoff
writtenoff
financial
Total
relief
provided
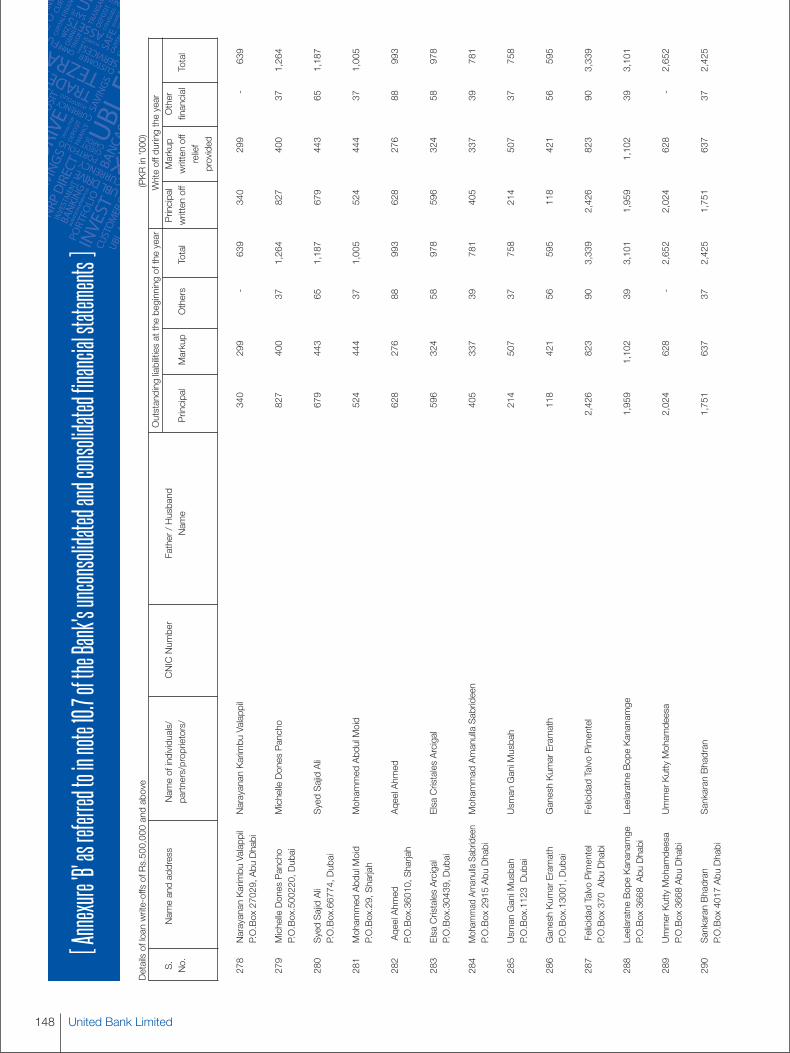
United Bank Limited148
[Annexu
re'B'
asref
erred
toinn
ote10.
7ofth
eBank's
uncon
solida
tedandc
onsol
idated
financia
lstate
ments
]
278
NarayananKarimbuValappil
NarayananKarimbuValappil
340
299
-639
340
299
-639
P.O.Box27029,AbuDhabi
279
MichelleDonesPancho
MichelleDonesPancho
827
400
371,264
827
400
371,264
P.O.Box.500220,Dubai
280
SyedSajidAli
SyedSajidAli
679
443
651,187
679
443
651,187
P.O.Box.66774,Dubai
281
MohammedAbdulMoid
MohammedAbdulMoid
524
444
371,005
524
444
371,005
P.O.Box.29,Sharjah
282
AqeelAhmed
AqeelAhmed
628
276
88993
628
276
88993
P.O.Box.36010,Sharjah
283
ElsaCristalesArcigal
ElsaCristalesArcigal
596
324
58978
596
324
58978
P.O.Box.30439,Dubai
284
MohammadAm
anullaSabrideen
MohammadAmanullaSabrideen
405
337
39781
405
337
39781
P.O.Box2915AbuDhabi
285
UsmanGaniMusbah
UsmanGaniMusbah
214
507
37758
214
507
37758
P.O.Box.1123Dubai
286
GaneshKumarEramath
GaneshKumarEramath
118
421
56595
118
421
56595
P.O.Box.13001,Dubai
287
FelicidadTalvoPimentel
FelicidadTalvoPimentel
2,426
823
903,339
2,426
823
903,339
P.O.Box370AbuDhabi
288
LeelaratneBopeKananamge
LeelaratneBopeKananamge
1,959
1,102
393,101
1,959
1,102
393,101
P.O.Box3668
AbuDhabi
289
UmmerKuttyMohamdeesa
UmmerKuttyMohamdeesa
2,024
628
-2,652
2,024
628
-2,652
P.O.Box3668AbuDhabi
290
SankaranBhadran
SankaranBhadran
1,751
637
372,425
1,751
637
372,425
P.O.Box4017AbuDhabi
Detailsofloanwrite-offsofRs.500,000andabove
(PKRin'000)
Outstandingliabilitiesatthebeginningoftheyear
Writeoffduringtheyear
S.
Nameandaddress
Nameofindividuals/
CNICNumber
Father/Husband
Principal
Markup
Other
No.
partners/proprietors/
Name
Principal
Markup
Others
Total
writtenoff
writtenoff
financial
Total
relief
provided

149Annual Report 2010
[Annexu
re'B'
asref
erred
toinn
ote10.
7ofth
eBank's
uncon
solida
tedandc
onsol
idated
financia
lstate
ments
]
291
AbdulSaleamAppattillath
AbdulSaleamAppattillath
1,193
694
811,969
1,193
694
811,969
P.O.Box1065AlAin
292
RobinaLasolaMartin
RobinaLasolaMartin
1,333
469
601,863
1,333
469
601,863
P.O.Box23727AlAin
293
HamdanAm
edMohamm
adKhalidAlafar
HamdanAmedMohammadKhalidAlafar
1,117
93-
1,210
1,117
93-
1,210
P.O.Box1969AlAin
294
MohammadRamzan
MohammadRamzan
568
461
211,050
568
461
211,050
P.O.Box.80771,Dubai
295
RuelIlaoCuevas
RuelIlaoCuevas
673
204
-877
673
204
-877
P.O.Box.5530,Dubai
296
AbdulNaserAliHussein
AbdulNaserAliHussein
543
243
70856
543
243
70856
P.O.Box46231AbuDhabi
297
AliFawziAbdelRahimNatour
AliFawziAbdelRahimNatour
137
672
42851
137
672
42851
P.O.Box.500220,Dubai
298
SunilVarikkayilHeriya
Ayyappan
SunilVarikkayilHeriyaAyyappan
331
388
26744
331
388
26744
P.O.Box.54372,Dubai
299
SultanMapillaiThambi
SultanMapillaiThambi
363
340
35737
363
340
35737
P.O.Box.22577Dubai
300
AkberAliQureshi
AkberAliQureshi
460
230
-690
460
230
-690
P.O.Box372AbuDhabi
301
GhanemJumaaKhalfaAlRomaithi
GhanemJumaaKhalfaAlRomaithi
633
-51
684
633
-51
684
P.O.Box31196AbuDhabi
302
PoonkaranJohnBiju
PoonkaranJohnBiju
300
302
58660
300
302
58660
P.O.Box47600AbuDhabi
303
SunnyJohn
SunnyJohn
258
380
-638
258
380
-638
P.O.Box.2623,Dubai
Detailsofloanwrite-offsofRs.500,000andabove
(PKRin'000)
Outstandingliabilitiesatthebeginningoftheyear
Writeoffduringtheyear
S.
Nameandaddress
Nameofindividuals/
CNICNumber
Father/Husband
Principal
Markup
Other
No.
partners/proprietors/
Name
Principal
Markup
Others
Total
writtenoff
writtenoff
financial
Total
relief
provided

United Bank Limited150
[Annexu
re'B'
asref
erred
toinn
ote10.
7ofth
eBank's
uncon
solida
tedandc
onsol
idated
financia
lstate
ments
]
304
RajaHaroonSaleemKayani
RajaHaroonSaleemKayani
283
281
51614
283
281
51614
P.O.Box.6597,Sharjah
305
SyedMussaratHussainShah
SyedMussaratHussainShah
137
470
-607
137
470
-607
P.O.Box.27016,Dubai
306
SaoodMohammedHassan
Saood
MohammedHassan
1,841
194
282,063
1,841
194
282,063
P.O.Box.67747,Sharjah
307
HassanJumaAhmed
HassanJumaAhmed
659
119
56834
659
119
56834
P.O.Box.19280,Sharjah
308
ObaidAlMansouri
ObaidAlMansouri
217
324
70610
217
324
70610
P.O.Box.1367,Dubai
309
ShaikhaKhazalSaedKhair
ShaikhaKhazalSaedKhair
411
8749
547
411
8749
547
P.O.Box.1367,Dubai
310
RajendranKalliyottuM.AcharyRajendranKalliyottuM.Achary
1,038
806
100
1,944
1,038
806
100
1,944
P.O.Box46121AbuDhabi
311
NajeeruDeenSayedHameed
NajeeruDeenSayedHameed
1,316
206
-1,522
1,316
206
-1,522
P.O.Box45553AbuDhabi
312
Md.AbulKalam
Md.AbulKalam
922
583
-1,505
922
583
-1,505
P.O.Box640,AbuDhabi
313
WalidFawzy
WalidFawzy
1,143
266
951,504
1,143
266
951,504
P.O.Box3167AbuDhabi
314
RayammarVeettilPulipambilAbdul
RayammarVeettilPulipambilAbdul
578
535
-1,113
578
535
-1,113
P.O.Box97,AbuDhabi
315
EliasBairam
EliasBairam
464
598
-1,062
464
598
-1,062
P.O.Box45041,AbuDhabi
316
VazhavilaK.T.John
VazhavilaK.T.John
460
332
72864
460
332
72864
P.O.Box2378,AbuDhabi
Detailsofloanwrite-offsofRs.500,000andabove
(PKRin'000)
Outstandingliabilitiesatthebeginningoftheyear
Writeoffduringtheyear
S.
Nameandaddress
Nameofindividuals/
CNICNumber
Father/Husband
Principal
Markup
Other
No.
partners/proprietors/
Name
Principal
Markup
Others
Total
writtenoff
writtenoff
financial
Total
relief
provided

151Annual Report 2010
[Annexu
re'B'
asref
erred
toinn
ote10.
7ofth
eBank's
uncon
solida
tedandc
onsol
idated
financia
lstate
ments
]
317
MuhammadIqbal
MuhammadIqbal
427
316
72815
427
316
72815
P.O.Box.42,Dubai
318
NoushadPayayil
NoushadPayayil
363
321
49732
363
321
49732
P.O.Box.12848,Dubai
319
ReynaldoGaluraNulud
ReynaldoGaluraNulud
368
279
21667
368
279
21667
P.O.Box.2222,Dubai
320
KhadimHussain
KhadimHussain
180
342
-522
180
342
-522
P.O.Box1828,AlAin
321
SidiOuldMohamedSalem
MrSidiOuldMohamedSalem
3,499
889
-4,388
3,499
889
-4,388
P.O.Box7644
AlAin
322
FayazGhafoor
FayazGhafoor
1,957
1,586
603,604
1,957
1,586
603,604
P.O.Box.1123,Dubai
323
KamalEldinHamadaA.R.ShalabiKamalEldinHamadaA.R.Shalabi
2,101
1,316
633,479
2,101
1,316
633,479
P.O.Box2283,AbuDhabi
324
MohammedIsrail
MohammedIsrail
1,302
1,123
882,513
1,302
1,123
882,513
P.O.Box.3258,Dubai
325
MohanVettiyattilKarappandy
MohanVettiyattilKarappandy
1,045
394
-1,439
1,045
394
-1,439
P.O.Box9138
AbuDhabi
326
GhasemChakeri
GhasemChakeri
832
561
-1,393
832
561
-1,393
P.O.Box.29,Sharjah
327
RiyazAbdulShukoorSab
RiyazAbdulShukoorSab
406
259
-665
406
259
-665
P.O.Box.1123,Dubai
328
ChristianIgnacio
ChristianIgnacio
278
310
-588
278
310
-588
P.O.Box6258,AbuDhabi
329
AmjadAli
AmjadAli
357
185
-542
357
185
-542
P.O.Box124,AbuDhabi
Detailsofloanwrite-offsofRs.500,000andabove
(PKRin'000)
Outstandingliabilitiesatthebeginningoftheyear
Writeoffduringtheyear
S.
Nameandaddress
Nameofindividuals/
CNICNumber
Father/Husband
Principal
Markup
Other
No.
partners/proprietors/
Name
Principal
Markup
Others
Total
writtenoff
writtenoff
financial
Total
relief
provided
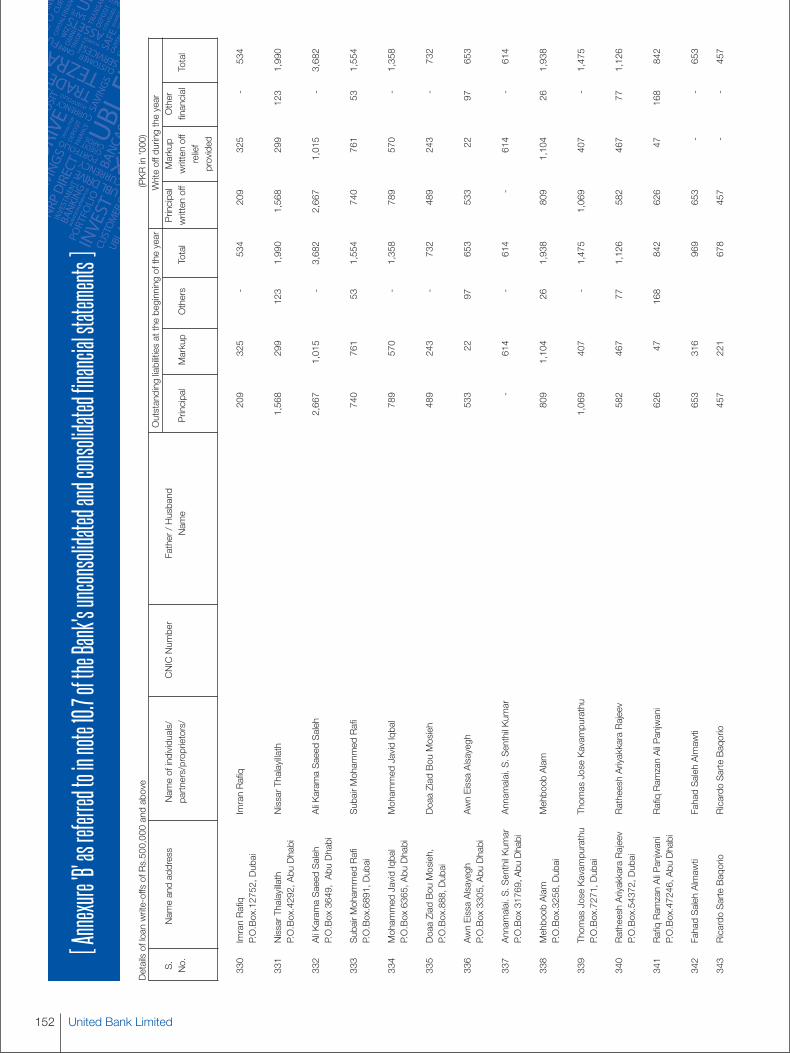
United Bank Limited152
[Annexu
re'B'
asref
erred
toinn
ote10.
7ofth
eBank's
uncon
solida
tedandc
onsol
idated
financia
lstate
ments
]
330
ImranRafiq
ImranRafiq
209
325
-534
209
325
-534
P.O.Box.12752,Dubai
331
NissarThalayillath
NissarThalayillath
1,568
299
123
1,990
1,568
299
123
1,990
P.O.Box.4292,AbuDhabi
332
AliKaramaSaeedSaleh
AliKaramaSaeedSaleh
2,667
1,015
-3,682
2,667
1,015
-3,682
P.O.Box3649,AbuDhabi
333
SubairMohammedRafi
SubairMohammedRafi
740
761
531,554
740
761
531,554
P.O.Box.6891,Dubai
334
MohammedJavidIqbal
MohammedJavidIqbal
789
570
-1,358
789
570
-1,358
P.O.Box6365,AbuDhabi
335
DoaaZiadBouMosieh,
DoaaZiadBouMosieh
489
243
-732
489
243
-732
P.O.Box.888,Dubai
336
AwnEissaAlsayegh
AwnEissaAlsayegh
533
2297
653
533
2297
653
P.O.Box3305,AbuDhabi
337
Annamalai.S.SenthilKumar
Annamalai.S.SenthilKumar
-614
-614
-614
-614
P.O.Box31769,AbuDhabi
338
MehboobAlam
Mehboob
Alam
809
1,104
261,938
809
1,104
261,938
P.O.Box.3258,Dubai
339
ThomasJoseKavampurathu
ThomasJoseKavampurathu
1,069
407
-1,475
1,069
407
-1,475
P.O.Box.7271,Dubai
340
RatheeshAriyakkaraRajeev
RatheeshAriyakkaraRajeev
582
467
771,126
582
467
771,126
P.O.Box.54372,Dubai
341
RafiqRamzanAliPanjwani
RafiqRamzanAliPanjwani
626
47168
842
626
47168
842
P.O.Box.47246,AbuDhabi
342
FahadSalehAlmawti
FahadSalehAlmawti
653
316
969
653
--
653
343
RicardoSarteBaqorio
Ricardo
SarteBaqorio
457
221
678
457
--
457
Detailsofloanwrite-offsofRs.500,000andabove
(PKRin'000)
Outstandingliabilitiesatthebeginningoftheyear
Writeoffduringtheyear
S.
Nameandaddress
Nameofindividuals/
CNICNumber
Father/Husband
Principal
Markup
Other
No.
partners/proprietors/
Name
Principal
Markup
Others
Total
writtenoff
writtenoff
financial
Total
relief
provided

153Annual Report 2010
[Annexu
re'B'
asref
erred
toinn
ote10.
7ofth
eBank's
uncon
solida
tedandc
onsol
idated
financia
lstate
ments
]
344
AdrianaNatalia
AdrianaNatalia
1,349
532
1,881
1,328
--
1,328
345
ManalYousifFarah
ManalYousifFarah
549
88637
549
--
549
346
JonathanGasper
JonathanGasper
503
220
724
503
--
503
347
GaneshNavaneethaNambi
GaneshNavaneethaNambi
1,137
145
1,282
1,137
--
1,137
348
JamalHussainSaeed
JamalHussainSaeed
1,936
461
2,397
1,936
--
1,936
349
JuliaPowell
JuliaPowell
-1,022
1,022
-943
-943
350
ShaileshKumar
ShaileshKumar
531
227
758
531
--
531
351
AmeerM
ohammadHammooda
AmeerM
ohammadHammood
1,073
1,097
2,169
1,072
--
1,072
352
TuanTaraam
Jaliel
TuanTaraam
Jaliel
525
113
638
523
--
523
353
ChempattuvilaiMasillamony
ChempattuvilaiMasillamony
435
289
723
433
--
433
354
CamiloJrDailegTolention
CamiloJrDailegTolention
579
399
978
579
--
579
355
HasanAbdulrahmanAbuBakr
HasanAbdulrahmanAbuBakr
415
98513
413
--
413
356
RamyalalDeSilvaDeva
RamyalalDeSilvaDeva
379
204
583
379
--
379
357
NomanKhanZulfiqarKhan
NomanKhanZulfiqarKhan
425
150
575
424
--
424
358
RodrickJosephDemicoli
RodrickJosephDemicoli
950
840
1,790
946
--
946
359
PrajithLalCheeni
PrajithLalCheeni
475
121
596
473
--
473
360
RashidHussainHaji
RashidHussainHaji
339
354
692
339
--
339
361
A.BasitHajiMurad
AbdulBasitHajiMurad
603
1,012
1,615
603
--
603
362
AymanMoosa
AymanMoosa
-783
783
-783
-783
363
ShirleyJoaquin
ShirleyJoaquin
750
396
1,146
745
--
745
Detailsofloanwrite-offsofRs.500,000andabove
(PKRin'000)
Outstandingliabilitiesatthebeginningoftheyear
Writeoffduringtheyear
S.
Nameandaddress
Nameofindividuals/
CNICNumber
Father/Husband
Principal
Markup
Other
No.
partners/proprietors/
Name
Principal
Markup
Others
Total
writtenoff
writtenoff
financial
Total
relief
provided
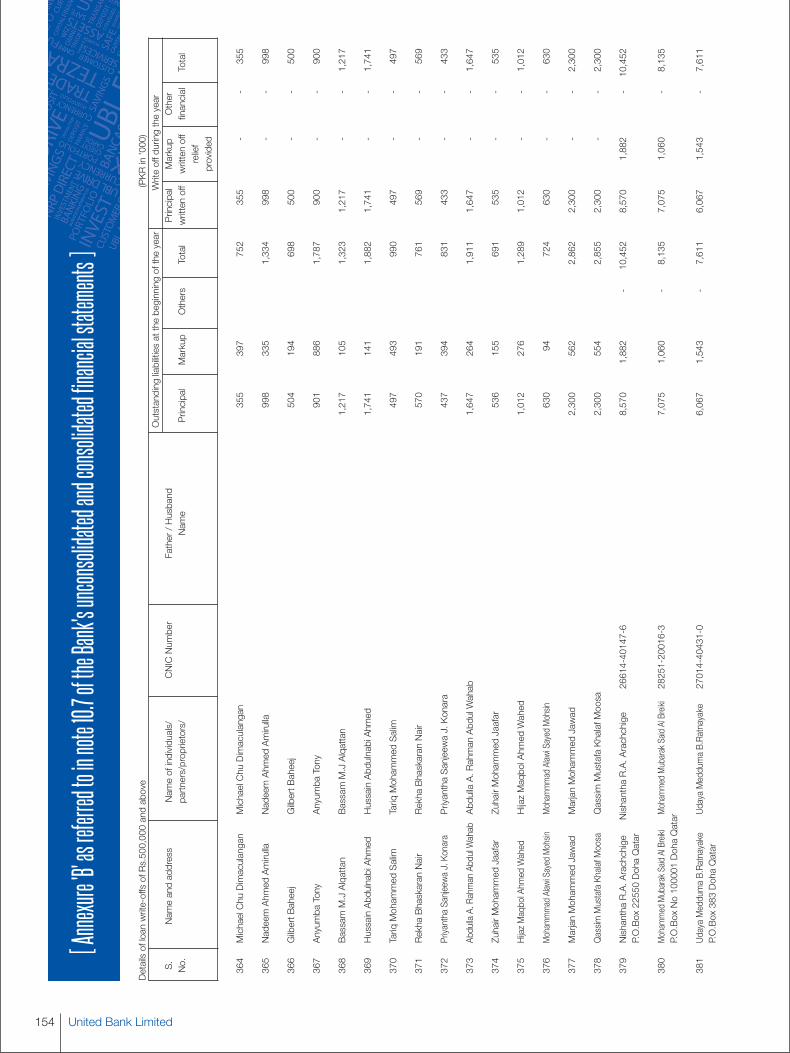
United Bank Limited154
[Annexu
re'B'
asref
erred
toinn
ote10.
7ofth
eBank's
uncon
solida
tedandc
onsol
idated
financia
lstate
ments
]
364
MichaelChuDimaculangan
MichaelChuDimaculangan
355
397
752
355
--
355
365
NadeemAhmedAmirulla
NadeemAhmedAmirulla
998
335
1,334
998
--
998
366
GilbertBaheej
GilbertBaheej
504
194
698
500
--
500
367
AnyumbaTony
AnyumbaTony
901
886
1,787
900
--
900
368
BassamM.JAlqattan
BassamM.JAlqattan
1,217
105
1,323
1,217
--
1,217
369
HussainAbdulnabiAhmed
HussainAbdulnabiAhmed
1,741
141
1,882
1,741
--
1,741
370
TariqMohammedSalim
TariqMohammedSalim
497
493
990
497
--
497
371
RekhaBhaskaranNair
RekhaBhaskaranNair
570
191
761
569
--
569
372
PriyanthaSanjeewaJ.Konara
PriyanthaSanjeewaJ.Konara
437
394
831
433
--
433
373
AbdullaA.RahmanAbdulWahab
AbdullaA.RahmanAbdulWahab
1,647
264
1,911
1,647
--
1,647
374
ZuhairMohammedJaafar
ZuhairMohammedJaafar
536
155
691
535
--
535
375
HijazMaqbolAhmedWahed
HijazMaqbolAhmedWahed
1,012
276
1,289
1,012
--
1,012
376
MohammmadAlawiSayedMohsin
MohammmadAlawiSayedMohsin
630
94724
630
--
630
377
MarjanMohammedJawad
MarjanMohammedJawad
2,300
562
2,862
2,300
--
2,300
378
QassimMustafaKhalafMoosa
QassimMustafaKhalafMoosa
2,300
554
2,855
2,300
--
2,300
379
NishanthaR.A.Arachchige
NishanthaR.A.Arachchige
26614-40147-6
8,570
1,882
-10,452
8,570
1,882
-10,452
P.O.Box22550DohaQatar
380
MohammedMubarakSaidAlBreiki
MohammedMubarakSaidAlBreiki
28251-20016-3
7,075
1,060
-8,135
7,075
1,060
-8,135
P.O.BoxNo100001DohaQatar
381
UdayaMeddumaB.Ratnayake
UdayaMeddumaB.Ratnayake
27014-40431-0
6,067
1,543
-7,611
6,067
1,543
-7,611
P.O.Box383DohaQatar
Detailsofloanwrite-offsofRs.500,000andabove
(PKRin'000)
Outstandingliabilitiesatthebeginningoftheyear
Writeoffduringtheyear
S.
Nameandaddress
Nameofindividuals/
CNICNumber
Father/Husband
Principal
Markup
Other
No.
partners/proprietors/
Name
Principal
Markup
Others
Total
writtenoff
writtenoff
financial
Total
relief
provided

155Annual Report 2010
[Annexu
re'B'
asref
erred
toinn
ote10.
7ofth
eBank's
uncon
solida
tedandc
onsol
idated
financia
lstate
ments
]
382
Ibrahim
MohammedRashidAlJabri
Ibrahim
MohammedRashidAlJabri28351-20020-2
3,770
1,300
-5,070
3,770
1,300
-5,070
P.O.BoxNo50227DohaQatar
383
NapoleonEmitDionzon
NapoleonEmitDionzon
25960-80329-0
3,675
1,233
-4,908
3,675
1,233
-4,908
P.O.BoxNo383DohaQatar
384
SharifJahan
SharifJahan
26005-00238-3
3,908
790
-4,698
3,908
790
-4,698
P.O.Box22383DohaQatar
385
KhalilI.Salim
KhalilI.Salim
28551-20016-4
4,034
612
-4,647
4,034
612
-4,647
P.O.Box90555DohaQatar
386
MajeedKhanKhaderKhan
MajeedKhanKhaderKhan
27235-60391-9
3,649
883
-4,532
3,649
883
-4,532
P.O.Box22550DohaQatar
387
SultanQamarEjaz
SultanQamarEjaz
26458-60204-1
3,280
1,088
-4,368
3,280
1,088
-4,368
P.O.BoxNo16750DohaQatar
388
ManoharanVellian
ManoharanVellian
26735-60087-7
2,970
1,231
-4,201
2,970
1,231
-4,201
P.O.BoxNo383DohaQatar
389
EdithaGalangDizon
EdithaGalangDizon
27060-80183-1
3,032
952
-3,984
3,032
952
-3,984
P.O.Box22550DohaQatar
390
RedentorRegalaTolentino
RedentorRegalaTolentino
26060-80351-5
3,233
659
-3,892
3,233
659
-3,892
P.O.Box383DohaQatar
391
NadiaFawazKamhaz
NadiaFawazKamhaz
27542-20023-9
2,614
732
-3,346
2,614
732
-3,346
P.O.BoxNo82DohaQatar
392
WilfredoAlCoberTolibas
Wilfredo
AlCoberTolibas
26660-80300-9
2,467
527
-2,995
2,467
527
-2,995
P.O.Box3050DohaQatar
393
MohantyAbhayaKumar
MohantyAbhayaKumar
25835-60377-5
2,220
677
-2,896
2,220
677
-2,896
P.O.Box50090DohaQatar
394
AbdulRahimanM.Ahmad
AbdulRahimanM.Ahmad
26735-60015-6
2,214
612
-2,826
2,214
612
-2,826
P.O.BoxNo22550DohaQatar
Detailsofloanwrite-offsofRs.500,000andabove
(PKRin'000)
Outstandingliabilitiesatthebeginningoftheyear
Writeoffduringtheyear
S.
Nameandaddress
Nameofindividuals/
CNICNumber
Father/Husband
Principal
Markup
Other
No.
partners/proprietors/
Name
Principal
Markup
Others
Total
writtenoff
writtenoff
financial
Total
relief
provided
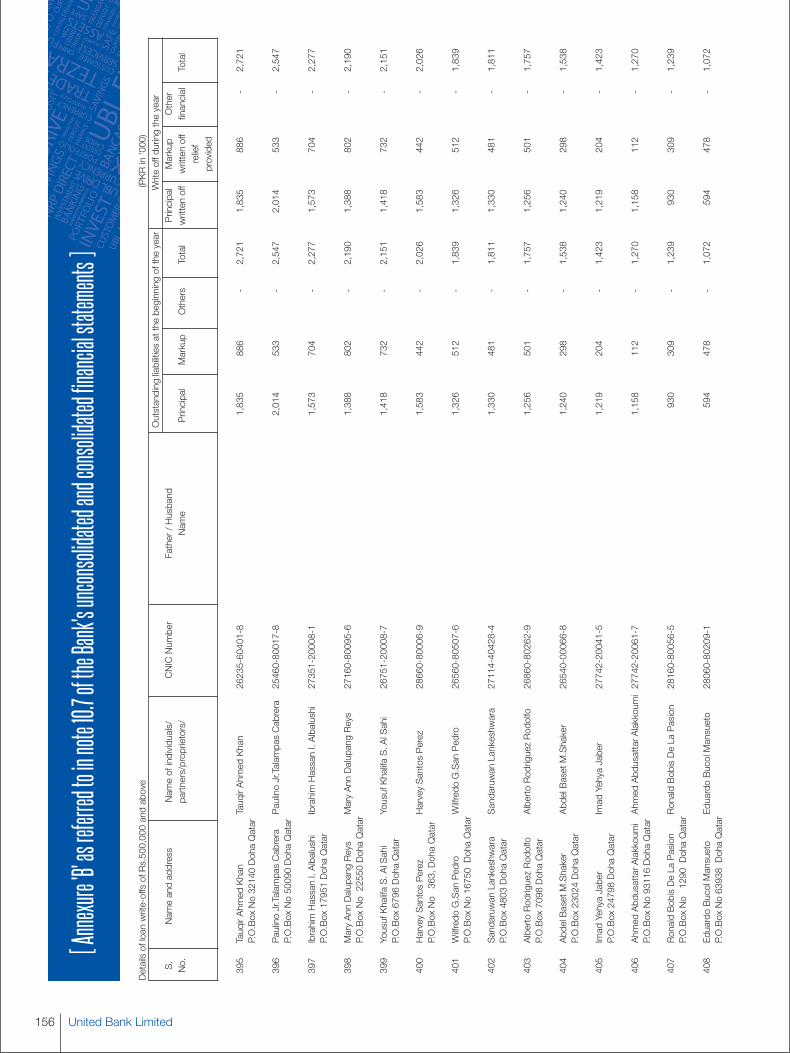
United Bank Limited156
[Annexu
re'B'
asref
erred
toinn
ote10.
7ofth
eBank's
uncon
solida
tedandc
onsol
idated
financia
lstate
ments
]
395
TauqirAhmedKhan
TauqirAhmedKhan
26235-60401-8
1,835
886
-2,721
1,835
886
-2,721
P.O.BoxNo32140DohaQatar
396
PaulinoJr.TalampasCabrera
PaulinoJr.TalampasCabrera
25460-80017-8
2,014
533
-2,547
2,014
533
-2,547
P.O.BoxNo50090DohaQatar
397
IbrahimHassanI.Albalushi
IbrahimHassanI.Albalushi
27351-20008-1
1,573
704
-2,277
1,573
704
-2,277
P.O.Box17951DohaQatar
398
MaryAnnDalupangReys
MaryAnnDalupangReys
27160-80095-6
1,388
802
-2,190
1,388
802
-2,190
P.O.BoxNo22550DohaQatar
399
YousufKhalifaS.AlSahi
YousufKhalifaS.AlSahi
26751-20008-7
1,418
732
-2,151
1,418
732
-2,151
P.O.Box6796DohaQatar
400
HarveySantosPerez
HarveySantosPerez
28660-80006-9
1,583
442
-2,026
1,583
442
-2,026
P.O.BoxNo363,DohaQatar
401
WilfredoG.SanPedro
Wilfredo
G.SanPedro
26560-80507-6
1,326
512
-1,839
1,326
512
-1,839
P.O.BoxNo16750DohaQatar
402
SandaruwanLankeshwara
SandaruwanLankeshwara
27114-40428-4
1,330
481
-1,811
1,330
481
-1,811
P.O.Box4803DohaQatar
403
AlbertoRodriguezRodolfo
AlbertoRodriguezRodolfo
26860-80262-9
1,256
501
-1,757
1,256
501
-1,757
P.O.Box7098DohaQatar
404
AbdelBasetM.Shaker
AbdelBasetM.Shaker
26540-00066-8
1,240
298
-1,538
1,240
298
-1,538
P.O.Box23024DohaQatar
405
ImadYehyaJaber
ImadYehyaJaber
27742-20041-5
1,219
204
-1,423
1,219
204
-1,423
P.O.Box24798DohaQatar
406
AhmedAbdusattarAlakkoumiAhmedAbdusattarAlakkoumi27742-20061-7
1,158
112
-1,270
1,158
112
-1,270
P.O.BoxNo93116DohaQatar
407
RonaldBobisDeLaPasion
RonaldBobisDeLaPasion
28160-80056-5
930
309
-1,239
930
309
-1,239
P.O.BoxNo1290
DohaQatar
408
EduardoBucolMansueto
Eduardo
BucolMansueto
28060-80209-1
594
478
-1,072
594
478
-1,072
P.O.BoxNo63938DohaQatar
Detailsofloanwrite-offsofRs.500,000andabove
(PKRin'000)
Outstandingliabilitiesatthebeginningoftheyear
Writeoffduringtheyear
S.
Nameandaddress
Nameofindividuals/
CNICNumber
Father/Husband
Principal
Markup
Other
No.
partners/proprietors/
Name
Principal
Markup
Others
Total
writtenoff
writtenoff
financial
Total
relief
provided
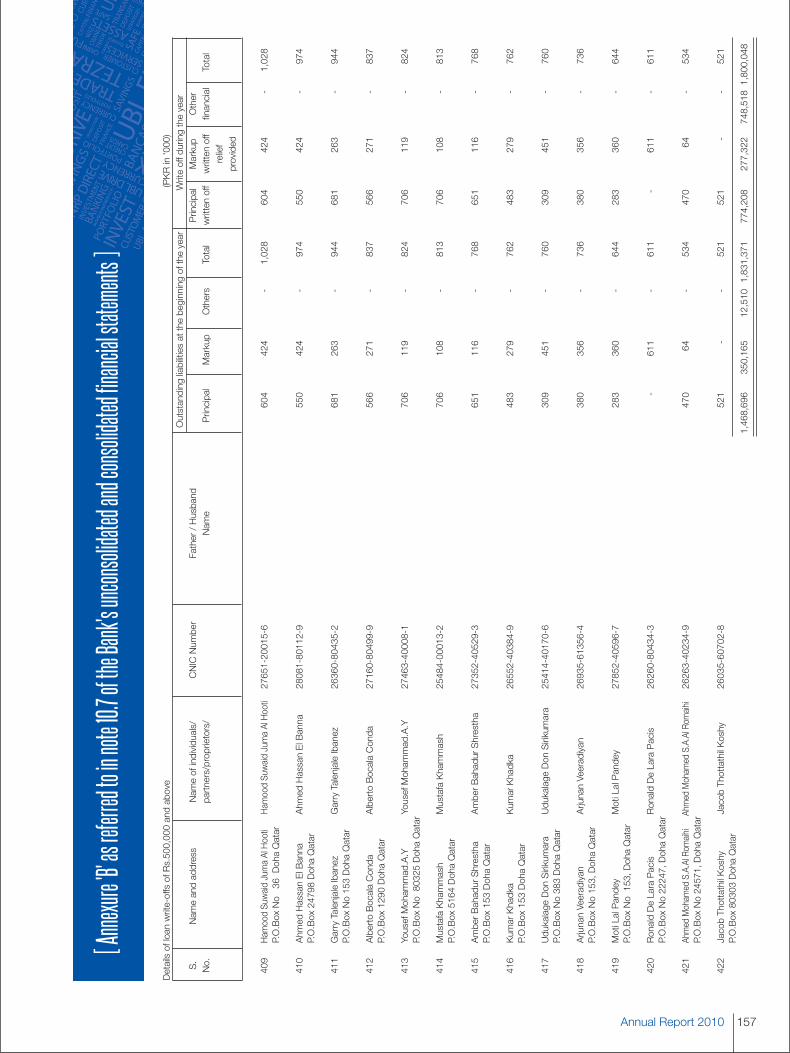
157Annual Report 2010
[Annexu
re'B'
asref
erred
toinn
ote10.
7ofth
eBank's
uncon
solida
tedandc
onsol
idated
financia
lstate
ments
]
409
HamoodSuwaidJumaAlHooti
HamoodSuwaidJumaAlHooti
27651-20015-6
604
424
-1,028
604
424
-1,028
P.O.BoxNo36
DohaQatar
410
AhmedHassanElBanna
AhmedHassanElBanna
28081-80112-9
550
424
-974
550
424
-974
P.O.Box24798DohaQatar
411
GarryTalenjaleIbanez
GarryTalenjaleIbanez
26360-80435-2
681
263
-944
681
263
-944
P.O.BoxNo153DohaQatar
412
AlbertoBocalaConda
AlbertoBocalaConda
27160-80499-9
566
271
-837
566
271
-837
P.O.Box1290DohaQatar
413
YousefMohammad.A.Y
YousefMohammad.A.Y
27463-40008-1
706
119
-824
706
119
-824
P.O.BoxNo80325DohaQatar
414
MustafaKhammash
MustafaKhammash
25484-00013-2
706
108
-813
706
108
-813
P.O.Box5164DohaQatar
415
AmberBahadurShrestha
AmberBahadurShrestha
27352-40529-3
651
116
-768
651
116
-768
P.O.Box153DohaQatar
416
KumarKhadka
KumarKhadka
26552-40384-9
483
279
-762
483
279
-762
P.O.Box153DohaQatar
417
UdukalageDonSirikumara
UdukalageDonSirikumara
25414-40170-6
309
451
-760
309
451
-760
P.O.BoxNo383DohaQatar
418
ArjunanVeeradiyan
ArjunanVeeradiyan
26935-61356-4
380
356
-736
380
356
-736
P.O.BoxNo153,DohaQatar
419
MotiLalPandey
MotiLalPandey
27852-40596-7
283
360
-644
283
360
-644
P.O.BoxNo153,DohaQatar
420
RonaldDeLaraPacis
RonaldDeLaraPacis
26260-80434-3
-611
-611
-611
-611
P.O.BoxNo22247,DohaQatar
421
AhmedMohamedS.A.AlRomaihi
AhmedMohamedS.A.AlRomaihi
26263-40234-9
470
64-
534
470
64-
534
P.O.BoxNo24571,DohaQatar
422
JacobThottathilKoshy
JacobThottathilKoshy
26035-60702-8
521
--
521
521
--
521
P.O.Box80303DohaQatar
1,468,696
350,165
12,510
1,831,371
774,208
277,322
748,5181,800,048
Detailsofloanwrite-offsofRs.500,000andabove
(PKRin'000)
Outstandingliabilitiesatthebeginningoftheyear
Writeoffduringtheyear
S.
Nameandaddress
Nameofindividuals/
CNICNumber
Father/Husband
Principal
Markup
Other
No.
partners/proprietors/
Name
Principal
Markup
Others
Total
writtenoff
writtenoff
financial
Total
relief
provided
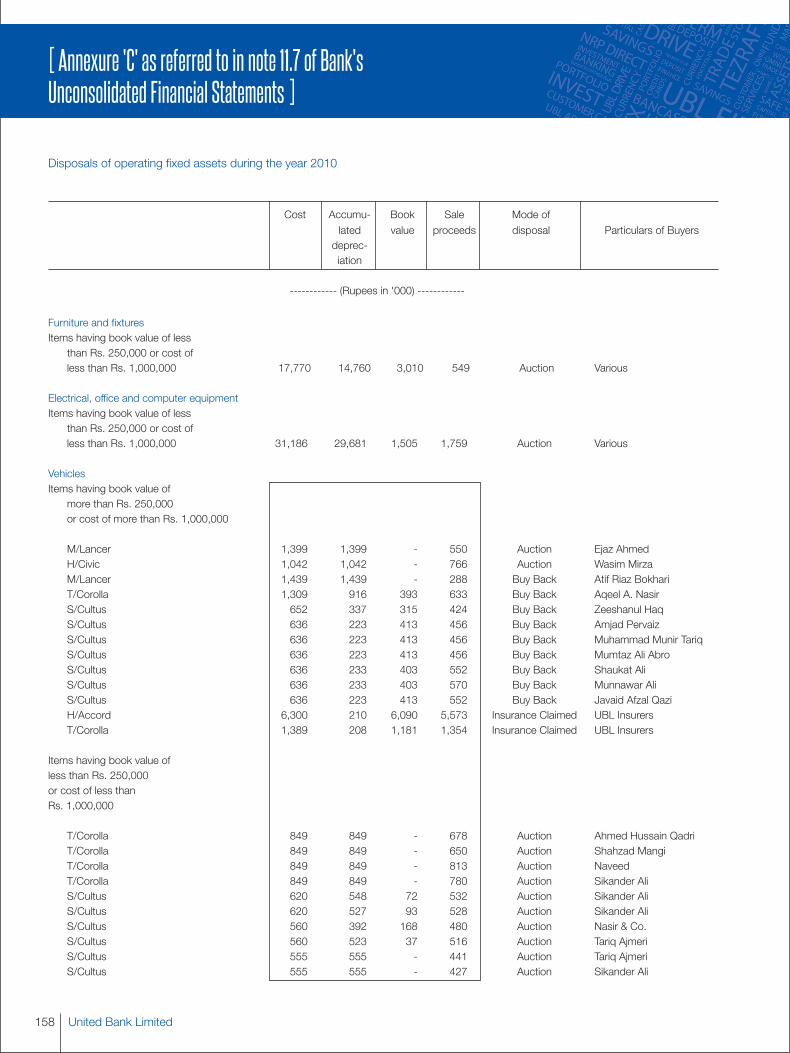
United Bank Limited158
[ Annexure 'C' as referred to in note 11.7 of Bank'sUnconsolidated Financial Statements ]
Disposals of operating fixed assets during the year 2010
Cost Accumu- Book Sale Mode oflated value proceeds disposal Particulars of Buyersdeprec-iation
------------ (Rupees in '000) ------------
Furniture and fixturesItems having book value of less
than Rs. 250,000 or cost ofless than Rs. 1,000,000 17,770 14,760 3,010 549 Auction Various
Electrical, office and computer equipmentItems having book value of less
than Rs. 250,000 or cost ofless than Rs. 1,000,000 31,186 29,681 1,505 1,759 Auction Various
VehiclesItems having book value of
more than Rs. 250,000or cost of more than Rs. 1,000,000
M/Lancer 1,399 1,399 - 550 Auction Ejaz AhmedH/Civic 1,042 1,042 - 766 Auction Wasim MirzaM/Lancer 1,439 1,439 - 288 Buy Back Atif Riaz BokhariT/Corolla 1,309 916 393 633 Buy Back Aqeel A. NasirS/Cultus 652 337 315 424 Buy Back Zeeshanul HaqS/Cultus 636 223 413 456 Buy Back Amjad PervaizS/Cultus 636 223 413 456 Buy Back Muhammad Munir TariqS/Cultus 636 223 413 456 Buy Back Mumtaz Ali AbroS/Cultus 636 233 403 552 Buy Back Shaukat AliS/Cultus 636 233 403 570 Buy Back Munnawar AliS/Cultus 636 223 413 552 Buy Back Javaid Afzal QaziH/Accord 6,300 210 6,090 5,573 Insurance Claimed UBL InsurersT/Corolla 1,389 208 1,181 1,354 Insurance Claimed UBL Insurers
Items having book value ofless than Rs. 250,000or cost of less thanRs. 1,000,000
T/Corolla 849 849 - 678 Auction Ahmed Hussain QadriT/Corolla 849 849 - 650 Auction Shahzad MangiT/Corolla 849 849 - 813 Auction NaveedT/Corolla 849 849 - 780 Auction Sikander AliS/Cultus 620 548 72 532 Auction Sikander AliS/Cultus 620 527 93 528 Auction Sikander AliS/Cultus 560 392 168 480 Auction Nasir & Co.S/Cultus 560 523 37 516 Auction Tariq AjmeriS/Cultus 555 555 - 441 Auction Tariq AjmeriS/Cultus 555 555 - 427 Auction Sikander Ali
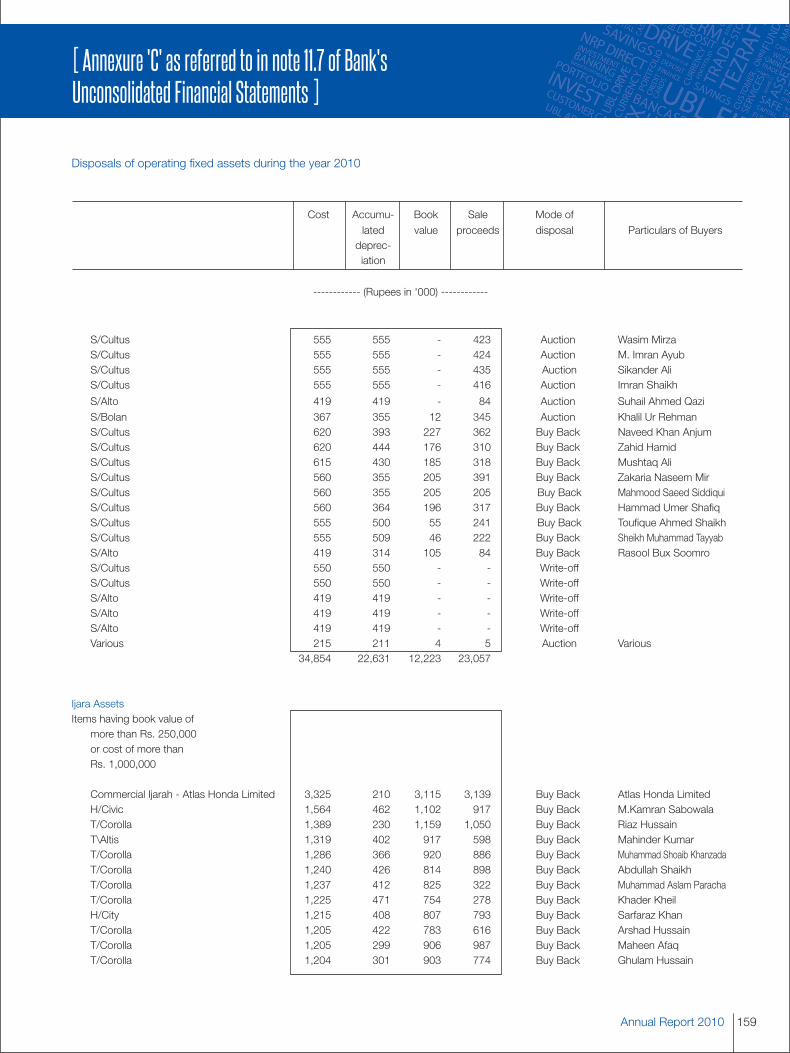
159Annual Report 2010
[ Annexure 'C' as referred to in note 11.7 of Bank'sUnconsolidated Financial Statements ]
Disposals of operating fixed assets during the year 2010
Cost Accumu- Book Sale Mode oflated value proceeds disposal Particulars of Buyersdeprec-iation
------------ (Rupees in '000) ------------
S/Cultus 555 555 - 423 Auction Wasim MirzaS/Cultus 555 555 - 424 Auction M. Imran AyubS/Cultus 555 555 - 435 Auction Sikander AliS/Cultus 555 555 - 416 Auction Imran Shaikh
S/Alto 419 419 - 84 Auction Suhail Ahmed QaziS/Bolan 367 355 12 345 Auction Khalil Ur RehmanS/Cultus 620 393 227 362 Buy Back Naveed Khan AnjumS/Cultus 620 444 176 310 Buy Back Zahid HamidS/Cultus 615 430 185 318 Buy Back Mushtaq AliS/Cultus 560 355 205 391 Buy Back Zakaria Naseem MirS/Cultus 560 355 205 205 Buy Back Mahmood Saeed SiddiquiS/Cultus 560 364 196 317 Buy Back Hammad Umer ShafiqS/Cultus 555 500 55 241 Buy Back Toufique Ahmed ShaikhS/Cultus 555 509 46 222 Buy Back Sheikh Muhammad TayyabS/Alto 419 314 105 84 Buy Back Rasool Bux SoomroS/Cultus 550 550 - - Write-offS/Cultus 550 550 - - Write-offS/Alto 419 419 - - Write-offS/Alto 419 419 - - Write-offS/Alto 419 419 - - Write-offVarious 215 211 4 5 Auction Various
34,854 22,631 12,223 23,057
Ijara AssetsItems having book value of
more than Rs. 250,000or cost of more thanRs. 1,000,000
Commercial Ijarah - Atlas Honda Limited 3,325 210 3,115 3,139 Buy Back Atlas Honda LimitedH/Civic 1,564 462 1,102 917 Buy Back M.Kamran SabowalaT/Corolla 1,389 230 1,159 1,050 Buy Back Riaz HussainT\Altis 1,319 402 917 598 Buy Back Mahinder KumarT/Corolla 1,286 366 920 886 Buy Back Muhammad Shoaib KhanzadaT/Corolla 1,240 426 814 898 Buy Back Abdullah ShaikhT/Corolla 1,237 412 825 322 Buy Back Muhammad Aslam ParachaT/Corolla 1,225 471 754 278 Buy Back Khader KheilH/City 1,215 408 807 793 Buy Back Sarfaraz KhanT/Corolla 1,205 422 783 616 Buy Back Arshad HussainT/Corolla 1,205 299 906 987 Buy Back Maheen AfaqT/Corolla 1,204 301 903 774 Buy Back Ghulam Hussain

United Bank Limited160
[ Annexure 'C' as referred to in note 11.7 of Bank'sUnconsolidated Financial Statements ]
Disposals of operating fixed assets during the year 2010
Cost Accumu- Book Sale Mode oflated value proceeds disposal Particulars of Buyersdeprec-iation
------------ (Rupees in '000) ------------
Ijara AssetsItems having book value of
more than Rs. 250,000or cost of more thanRs. 1,000,000
T/Corolla 980 391 589 426 Buy Back Dahar JunejoT/Corolla 980 564 416 256 Buy Back Mohammad Ayoob JamaliS/Liana 955 456 499 551 Buy Back Muhammad Junaid GhaffarT/Corolla 950 487 463 660 Buy Back Muhammad IrfanS/Cultus 940 308 632 442 Buy Back Talat MehmoodT/Corolla 940 486 454 620 Buy Back Mohammad Hamid Ali KhanT/Corolla 940 528 412 255 Buy Back Sharmeen ZindaniT/Corolla 925 435 490 559 Buy Back Yaar GulT/Corolla 915 511 404 492 Buy Back Muhammad KousarS/Liana 907 434 473 534 Buy Back Manohar Lal WadhwaniH/City 907 484 423 461 Buy Back Tarana ZafarT/Belta 900 460 440 241 Buy Back Muhammad NaeemT/Corolla 890 319 571 502 Buy Back Waheed Ahmed ShaikhT/Corolla 890 526 364 476 Buy Back Mohammad Asmat ParachaH/City 879 343 536 559 Buy Back Aasima KhanS/Liana 856 540 316 355 Buy Back Mohammad RehanH/City 852 235 617 674 Buy Back Syed Muhammad Hasan Qutb
H/City 846 451 395 493 Buy Back Mohammad Asim SaleemS/Liana 825 406 419 490 Buy Back Farooq Ahmed SiddiquiT/Vitz 811 560 251 151 Buy Back Saqib KhanK/Sportage 800 494 306 403 Buy Back Noor Ahmed ShahtajS/Cultus 742 448 294 435 Buy Back Ahson Iqbal RazaS/Cultus 704 286 418 424 Buy Back Muhmmad AshrafS/Cultus 694 211 483 177 Buy Back Zubair AkramS/Cultus 694 257 437 442 Buy Back Suman KhurramS/Cultus 694 292 402 379 Buy Back Muhammad HaroonS/Cultus 682 252 430 345 Buy Back Syed Javed AkhtarS/Cultus 647 163 484 536 Buy Back Tanzeel Ul RehmanS/Bolan 644 209 435 380 Buy Back Syed Fahim HasanS/Cultus 632 208 424 385 Buy Back Asif Ali AbbasiS/Cultus 632 225 407 353 Buy Back Babar Gulzar ButtS/Cultus 632 241 391 380 Buy Back Khalid Mahmood MirzaS/Cultus 632 274 358 297 Buy Back Imran IjazS/Cultus 632 288 344 417 Buy Back Syed Asim UddinS/Cultus 632 329 303 358 Buy Back Mohammad BukshS/Cultus 631 302 329 262 Buy Back SamiullahT/Vitz 600 209 391 447 Buy Back Fawad IqbalS/Cultus 600 311 289 365 Buy Back Maria Noureen
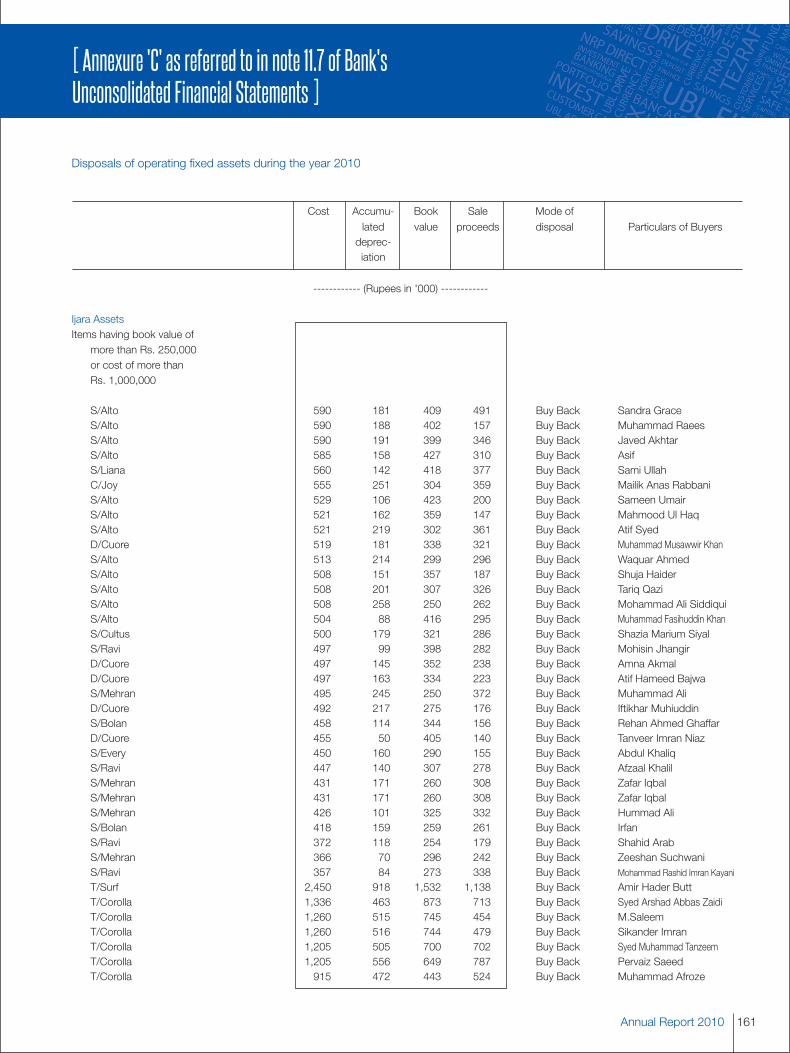
161Annual Report 2010
[ Annexure 'C' as referred to in note 11.7 of Bank'sUnconsolidated Financial Statements ]
Disposals of operating fixed assets during the year 2010
Cost Accumu- Book Sale Mode oflated value proceeds disposal Particulars of Buyersdeprec-iation
------------ (Rupees in '000) ------------
Ijara AssetsItems having book value of
more than Rs. 250,000or cost of more thanRs. 1,000,000
S/Alto 590 181 409 491 Buy Back Sandra GraceS/Alto 590 188 402 157 Buy Back Muhammad RaeesS/Alto 590 191 399 346 Buy Back Javed AkhtarS/Alto 585 158 427 310 Buy Back AsifS/Liana 560 142 418 377 Buy Back Sami UllahC/Joy 555 251 304 359 Buy Back Mailik Anas RabbaniS/Alto 529 106 423 200 Buy Back Sameen UmairS/Alto 521 162 359 147 Buy Back Mahmood Ul HaqS/Alto 521 219 302 361 Buy Back Atif SyedD/Cuore 519 181 338 321 Buy Back Muhammad Musawwir KhanS/Alto 513 214 299 296 Buy Back Waquar AhmedS/Alto 508 151 357 187 Buy Back Shuja HaiderS/Alto 508 201 307 326 Buy Back Tariq QaziS/Alto 508 258 250 262 Buy Back Mohammad Ali SiddiquiS/Alto 504 88 416 295 Buy Back Muhammad Fasihuddin KhanS/Cultus 500 179 321 286 Buy Back Shazia Marium SiyalS/Ravi 497 99 398 282 Buy Back Mohisin JhangirD/Cuore 497 145 352 238 Buy Back Amna AkmalD/Cuore 497 163 334 223 Buy Back Atif Hameed BajwaS/Mehran 495 245 250 372 Buy Back Muhammad AliD/Cuore 492 217 275 176 Buy Back Iftikhar MuhiuddinS/Bolan 458 114 344 156 Buy Back Rehan Ahmed GhaffarD/Cuore 455 50 405 140 Buy Back Tanveer Imran NiazS/Every 450 160 290 155 Buy Back Abdul KhaliqS/Ravi 447 140 307 278 Buy Back Afzaal KhalilS/Mehran 431 171 260 308 Buy Back Zafar IqbalS/Mehran 431 171 260 308 Buy Back Zafar IqbalS/Mehran 426 101 325 332 Buy Back Hummad AliS/Bolan 418 159 259 261 Buy Back IrfanS/Ravi 372 118 254 179 Buy Back Shahid ArabS/Mehran 366 70 296 242 Buy Back Zeeshan SuchwaniS/Ravi 357 84 273 338 Buy Back Mohammad Rashid Imran Kayani
T/Surf 2,450 918 1,532 1,138 Buy Back Amir Hader ButtT/Corolla 1,336 463 873 713 Buy Back Syed Arshad Abbas ZaidiT/Corolla 1,260 515 745 454 Buy Back M.SaleemT/Corolla 1,260 516 744 479 Buy Back Sikander ImranT/Corolla 1,205 505 700 702 Buy Back Syed Muhammad TanzeemT/Corolla 1,205 556 649 787 Buy Back Pervaiz SaeedT/Corolla 915 472 443 524 Buy Back Muhammad Afroze
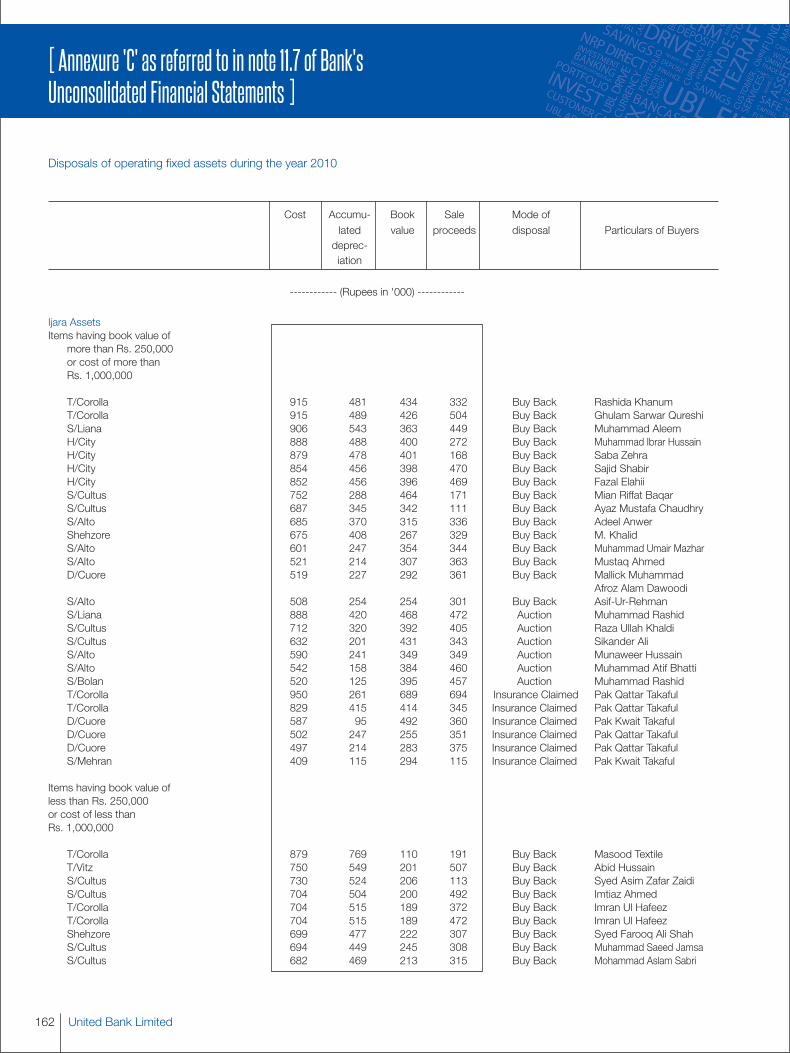
United Bank Limited162
[ Annexure 'C' as referred to in note 11.7 of Bank'sUnconsolidated Financial Statements ]
Disposals of operating fixed assets during the year 2010
Cost Accumu- Book Sale Mode oflated value proceeds disposal Particulars of Buyersdeprec-iation
------------ (Rupees in '000) ------------
Ijara AssetsItems having book value of
more than Rs. 250,000or cost of more thanRs. 1,000,000
T/Corolla 915 481 434 332 Buy Back Rashida KhanumT/Corolla 915 489 426 504 Buy Back Ghulam Sarwar QureshiS/Liana 906 543 363 449 Buy Back Muhammad AleemH/City 888 488 400 272 Buy Back Muhammad Ibrar HussainH/City 879 478 401 168 Buy Back Saba ZehraH/City 854 456 398 470 Buy Back Sajid ShabirH/City 852 456 396 469 Buy Back Fazal ElahiiS/Cultus 752 288 464 171 Buy Back Mian Riffat BaqarS/Cultus 687 345 342 111 Buy Back Ayaz Mustafa ChaudhryS/Alto 685 370 315 336 Buy Back Adeel AnwerShehzore 675 408 267 329 Buy Back M. KhalidS/Alto 601 247 354 344 Buy Back Muhammad Umair MazharS/Alto 521 214 307 363 Buy Back Mustaq AhmedD/Cuore 519 227 292 361 Buy Back Mallick Muhammad
Afroz Alam DawoodiS/Alto 508 254 254 301 Buy Back Asif-Ur-RehmanS/Liana 888 420 468 472 Auction Muhammad RashidS/Cultus 712 320 392 405 Auction Raza Ullah KhaldiS/Cultus 632 201 431 343 Auction Sikander AliS/Alto 590 241 349 349 Auction Munaweer HussainS/Alto 542 158 384 460 Auction Muhammad Atif BhattiS/Bolan 520 125 395 457 Auction Muhammad RashidT/Corolla 950 261 689 694 Insurance Claimed Pak Qattar TakafulT/Corolla 829 415 414 345 Insurance Claimed Pak Qattar TakafulD/Cuore 587 95 492 360 Insurance Claimed Pak Kwait TakafulD/Cuore 502 247 255 351 Insurance Claimed Pak Qattar TakafulD/Cuore 497 214 283 375 Insurance Claimed Pak Qattar TakafulS/Mehran 409 115 294 115 Insurance Claimed Pak Kwait Takaful
Items having book value ofless than Rs. 250,000or cost of less thanRs. 1,000,000
T/Corolla 879 769 110 191 Buy Back Masood TextileT/Vitz 750 549 201 507 Buy Back Abid HussainS/Cultus 730 524 206 113 Buy Back Syed Asim Zafar ZaidiS/Cultus 704 504 200 492 Buy Back Imtiaz AhmedT/Corolla 704 515 189 372 Buy Back Imran Ul HafeezT/Corolla 704 515 189 472 Buy Back Imran Ul HafeezShehzore 699 477 222 307 Buy Back Syed Farooq Ali ShahS/Cultus 694 449 245 308 Buy Back Muhammad Saeed JamsaS/Cultus 682 469 213 315 Buy Back Mohammad Aslam Sabri
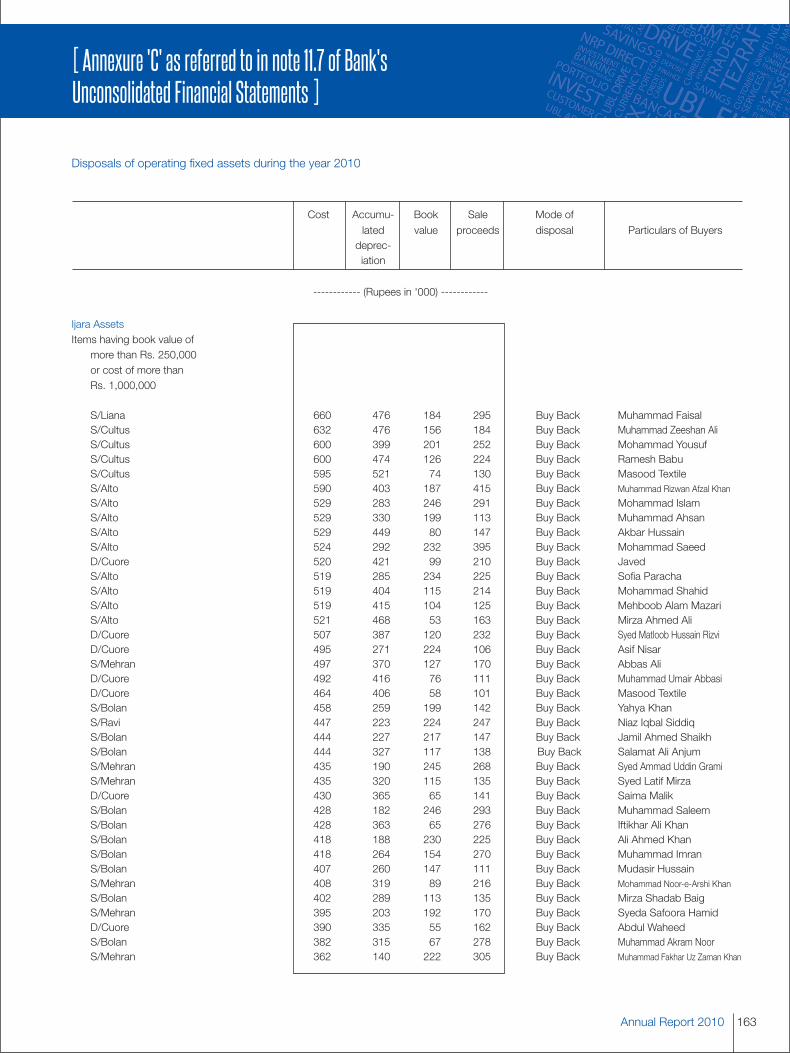
163Annual Report 2010
[ Annexure 'C' as referred to in note 11.7 of Bank'sUnconsolidated Financial Statements ]
Disposals of operating fixed assets during the year 2010
Cost Accumu- Book Sale Mode oflated value proceeds disposal Particulars of Buyersdeprec-iation
------------ (Rupees in '000) ------------
Ijara AssetsItems having book value of
more than Rs. 250,000or cost of more thanRs. 1,000,000
S/Liana 660 476 184 295 Buy Back Muhammad FaisalS/Cultus 632 476 156 184 Buy Back Muhammad Zeeshan AliS/Cultus 600 399 201 252 Buy Back Mohammad YousufS/Cultus 600 474 126 224 Buy Back Ramesh BabuS/Cultus 595 521 74 130 Buy Back Masood TextileS/Alto 590 403 187 415 Buy Back Muhammad Rizwan Afzal Khan
S/Alto 529 283 246 291 Buy Back Mohammad IslamS/Alto 529 330 199 113 Buy Back Muhammad AhsanS/Alto 529 449 80 147 Buy Back Akbar HussainS/Alto 524 292 232 395 Buy Back Mohammad SaeedD/Cuore 520 421 99 210 Buy Back JavedS/Alto 519 285 234 225 Buy Back Sofia ParachaS/Alto 519 404 115 214 Buy Back Mohammad ShahidS/Alto 519 415 104 125 Buy Back Mehboob Alam MazariS/Alto 521 468 53 163 Buy Back Mirza Ahmed AliD/Cuore 507 387 120 232 Buy Back Syed Matloob Hussain RizviD/Cuore 495 271 224 106 Buy Back Asif NisarS/Mehran 497 370 127 170 Buy Back Abbas AliD/Cuore 492 416 76 111 Buy Back Muhammad Umair AbbasiD/Cuore 464 406 58 101 Buy Back Masood TextileS/Bolan 458 259 199 142 Buy Back Yahya KhanS/Ravi 447 223 224 247 Buy Back Niaz Iqbal SiddiqS/Bolan 444 227 217 147 Buy Back Jamil Ahmed ShaikhS/Bolan 444 327 117 138 Buy Back Salamat Ali AnjumS/Mehran 435 190 245 268 Buy Back Syed Ammad Uddin GramiS/Mehran 435 320 115 135 Buy Back Syed Latif MirzaD/Cuore 430 365 65 141 Buy Back Saima MalikS/Bolan 428 182 246 293 Buy Back Muhammad SaleemS/Bolan 428 363 65 276 Buy Back Iftikhar Ali KhanS/Bolan 418 188 230 225 Buy Back Ali Ahmed KhanS/Bolan 418 264 154 270 Buy Back Muhammad ImranS/Bolan 407 260 147 111 Buy Back Mudasir HussainS/Mehran 408 319 89 216 Buy Back Mohammad Noor-e-Arshi Khan
S/Bolan 402 289 113 135 Buy Back Mirza Shadab BaigS/Mehran 395 203 192 170 Buy Back Syeda Safoora HamidD/Cuore 390 335 55 162 Buy Back Abdul WaheedS/Bolan 382 315 67 278 Buy Back Muhammad Akram NoorS/Mehran 362 140 222 305 Buy Back Muhammad Fakhar Uz Zaman Khan
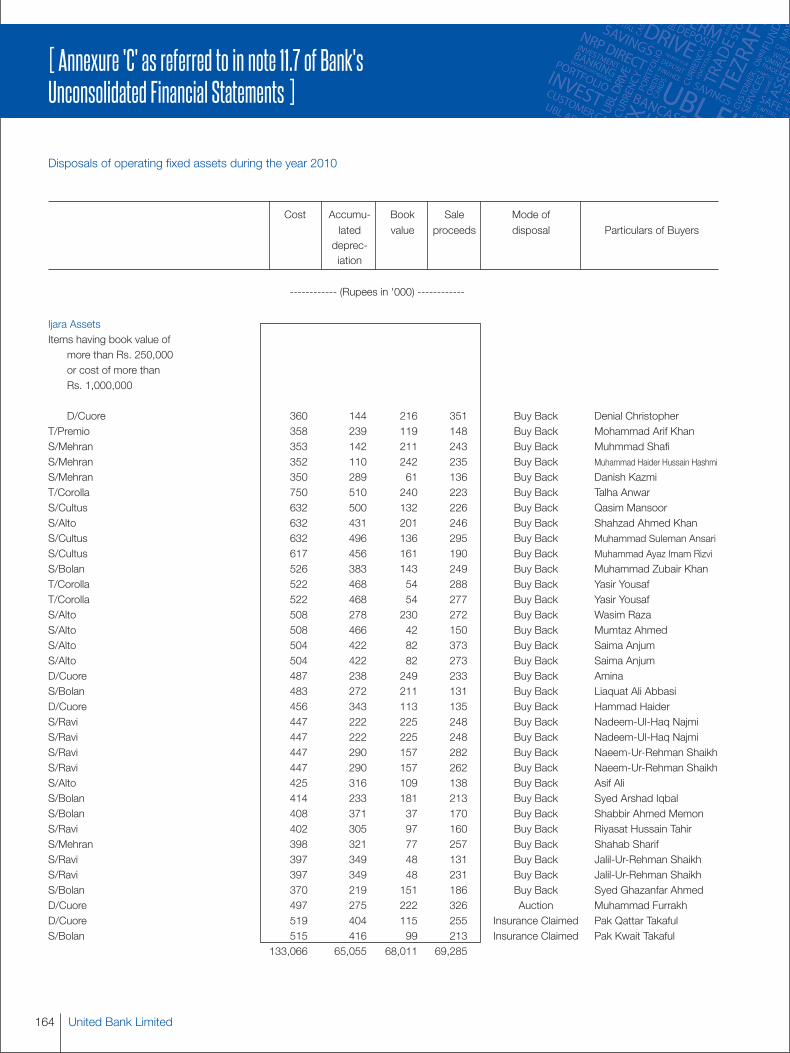
United Bank Limited164
[ Annexure 'C' as referred to in note 11.7 of Bank'sUnconsolidated Financial Statements ]
Disposals of operating fixed assets during the year 2010
Cost Accumu- Book Sale Mode oflated value proceeds disposal Particulars of Buyersdeprec-iation
------------ (Rupees in '000) ------------
Ijara AssetsItems having book value of
more than Rs. 250,000or cost of more thanRs. 1,000,000
D/Cuore 360 144 216 351 Buy Back Denial ChristopherT/Premio 358 239 119 148 Buy Back Mohammad Arif KhanS/Mehran 353 142 211 243 Buy Back Muhmmad ShafiS/Mehran 352 110 242 235 Buy Back Muhammad Haider Hussain Hashmi
S/Mehran 350 289 61 136 Buy Back Danish KazmiT/Corolla 750 510 240 223 Buy Back Talha AnwarS/Cultus 632 500 132 226 Buy Back Qasim MansoorS/Alto 632 431 201 246 Buy Back Shahzad Ahmed KhanS/Cultus 632 496 136 295 Buy Back Muhammad Suleman Ansari
S/Cultus 617 456 161 190 Buy Back Muhammad Ayaz Imam Rizvi
S/Bolan 526 383 143 249 Buy Back Muhammad Zubair KhanT/Corolla 522 468 54 288 Buy Back Yasir YousafT/Corolla 522 468 54 277 Buy Back Yasir YousafS/Alto 508 278 230 272 Buy Back Wasim RazaS/Alto 508 466 42 150 Buy Back Mumtaz AhmedS/Alto 504 422 82 373 Buy Back Saima AnjumS/Alto 504 422 82 273 Buy Back Saima AnjumD/Cuore 487 238 249 233 Buy Back AminaS/Bolan 483 272 211 131 Buy Back Liaquat Ali AbbasiD/Cuore 456 343 113 135 Buy Back Hammad HaiderS/Ravi 447 222 225 248 Buy Back Nadeem-Ul-Haq NajmiS/Ravi 447 222 225 248 Buy Back Nadeem-Ul-Haq NajmiS/Ravi 447 290 157 282 Buy Back Naeem-Ur-Rehman ShaikhS/Ravi 447 290 157 262 Buy Back Naeem-Ur-Rehman ShaikhS/Alto 425 316 109 138 Buy Back Asif AliS/Bolan 414 233 181 213 Buy Back Syed Arshad IqbalS/Bolan 408 371 37 170 Buy Back Shabbir Ahmed MemonS/Ravi 402 305 97 160 Buy Back Riyasat Hussain TahirS/Mehran 398 321 77 257 Buy Back Shahab SharifS/Ravi 397 349 48 131 Buy Back Jalil-Ur-Rehman ShaikhS/Ravi 397 349 48 231 Buy Back Jalil-Ur-Rehman ShaikhS/Bolan 370 219 151 186 Buy Back Syed Ghazanfar AhmedD/Cuore 497 275 222 326 Auction Muhammad FurrakhD/Cuore 519 404 115 255 Insurance Claimed Pak Qattar TakafulS/Bolan 515 416 99 213 Insurance Claimed Pak Kwait Takaful
133,066 65,055 68,011 69,285
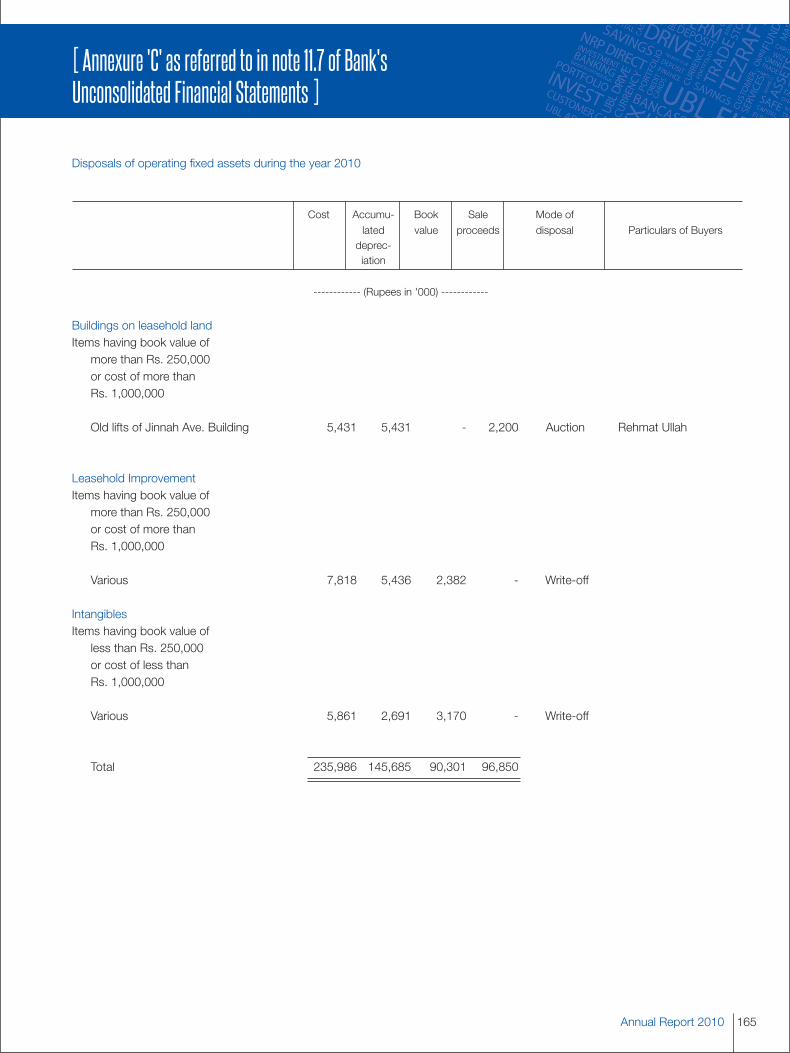
165Annual Report 2010
[ Annexure 'C' as referred to in note 11.7 of Bank'sUnconsolidated Financial Statements ]
Disposals of operating fixed assets during the year 2010
Cost Accumu- Book Sale Mode oflated value proceeds disposal Particulars of Buyersdeprec-iation
------------ (Rupees in '000) ------------
Buildings on leasehold landItems having book value of
more than Rs. 250,000or cost of more thanRs. 1,000,000
Old lifts of Jinnah Ave. Building 5,431 5,431 - 2,200 Auction Rehmat Ullah
Leasehold ImprovementItems having book value of
more than Rs. 250,000or cost of more thanRs. 1,000,000
Various 7,818 5,436 2,382 - Write-off
IntangiblesItems having book value of
less than Rs. 250,000or cost of less thanRs. 1,000,000
Various 5,861 2,691 3,170 - Write-off
Total 235,986 145,685 90,301 96,850
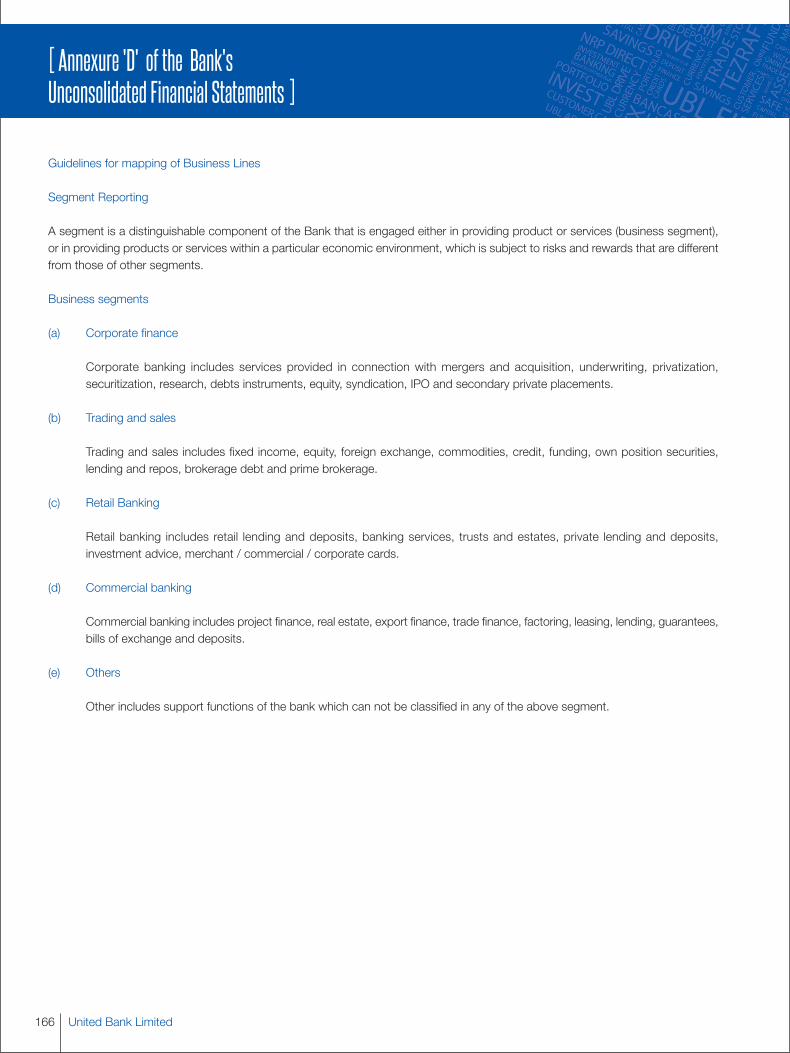
United Bank Limited166
[ Annexure 'D' of the Bank'sUnconsolidated Financial Statements ]
Guidelines for mapping of Business Lines
Segment Reporting
A segment is a distinguishable component of the Bank that is engaged either in providing product or services (business segment),or in providing products or services within a particular economic environment, which is subject to risks and rewards that are differentfrom those of other segments.
Business segments
(a) Corporate finance
Corporate banking includes services provided in connection with mergers and acquisition, underwriting, privatization,securitization, research, debts instruments, equity, syndication, IPO and secondary private placements.
(b) Trading and sales
Trading and sales includes fixed income, equity, foreign exchange, commodities, credit, funding, own position securities,lending and repos, brokerage debt and prime brokerage.
(c) Retail Banking
Retail banking includes retail lending and deposits, banking services, trusts and estates, private lending and deposits,investment advice, merchant / commercial / corporate cards.
(d) Commercial banking
Commercial banking includes project finance, real estate, export finance, trade finance, factoring, leasing, lending, guarantees,bills of exchange and deposits.
(e) Others
Other includes support functions of the bank which can not be classified in any of the above segment.
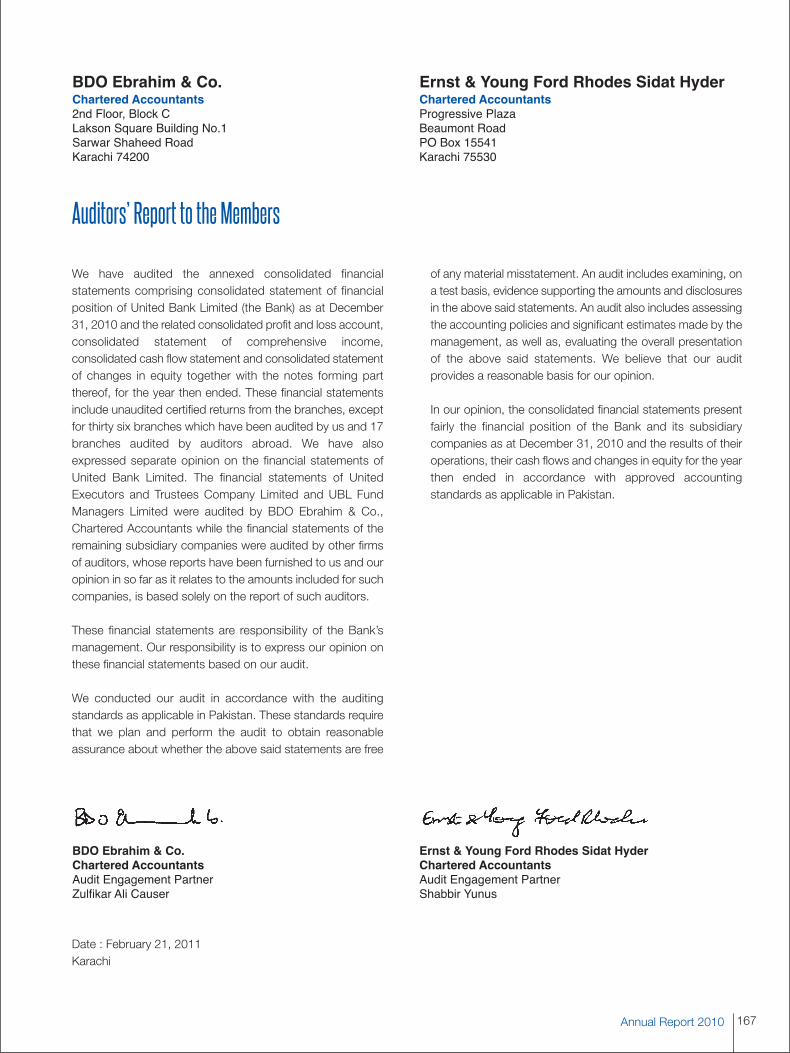
167
BDO Ebrahim & Co.Chartered Accountants2nd Floor, Block CLakson Square Building No.1Sarwar Shaheed RoadKarachi 74200
Ernst & Young Ford Rhodes Sidat HyderChartered AccountantsProgressive PlazaBeaumont RoadPO Box 15541Karachi 75530
BDO Ebrahim & Co.Chartered AccountantsAudit Engagement PartnerZulfikar Ali Causer
Ernst & Young Ford Rhodes Sidat HyderChartered AccountantsAudit Engagement PartnerShabbir Yunus
Annual Report 2010
We have audited the annexed consolidated financialstatements comprising consolidated statement of financialposition of United Bank Limited (the Bank) as at December31, 2010 and the related consolidated profit and loss account,consolidated statement of comprehensive income,consolidated cash flow statement and consolidated statementof changes in equity together with the notes forming partthereof, for the year then ended. These financial statementsinclude unaudited certified returns from the branches, exceptfor thirty six branches which have been audited by us and 17branches audited by auditors abroad. We have alsoexpressed separate opinion on the financial statements ofUnited Bank Limited. The financial statements of UnitedExecutors and Trustees Company Limited and UBL FundManagers Limited were audited by BDO Ebrahim & Co.,Chartered Accountants while the financial statements of theremaining subsidiary companies were audited by other firmsof auditors, whose reports have been furnished to us and ouropinion in so far as it relates to the amounts included for suchcompanies, is based solely on the report of such auditors.
These financial statements are responsibility of the Bank’smanagement. Our responsibility is to express our opinion onthese financial statements based on our audit.
We conducted our audit in accordance with the auditingstandards as applicable in Pakistan. These standards requirethat we plan and perform the audit to obtain reasonableassurance about whether the above said statements are free
of any material misstatement. An audit includes examining, ona test basis, evidence supporting the amounts and disclosuresin the above said statements. An audit also includes assessingthe accounting policies and significant estimates made by themanagement, as well as, evaluating the overall presentationof the above said statements. We believe that our auditprovides a reasonable basis for our opinion.
In our opinion, the consolidated financial statements presentfairly the financial position of the Bank and its subsidiarycompanies as at December 31, 2010 and the results of theiroperations, their cash flows and changes in equity for the yearthen ended in accordance with approved accountingstandards as applicable in Pakistan.
Auditors’ Report to the Members
Date : February 21, 2011Karachi
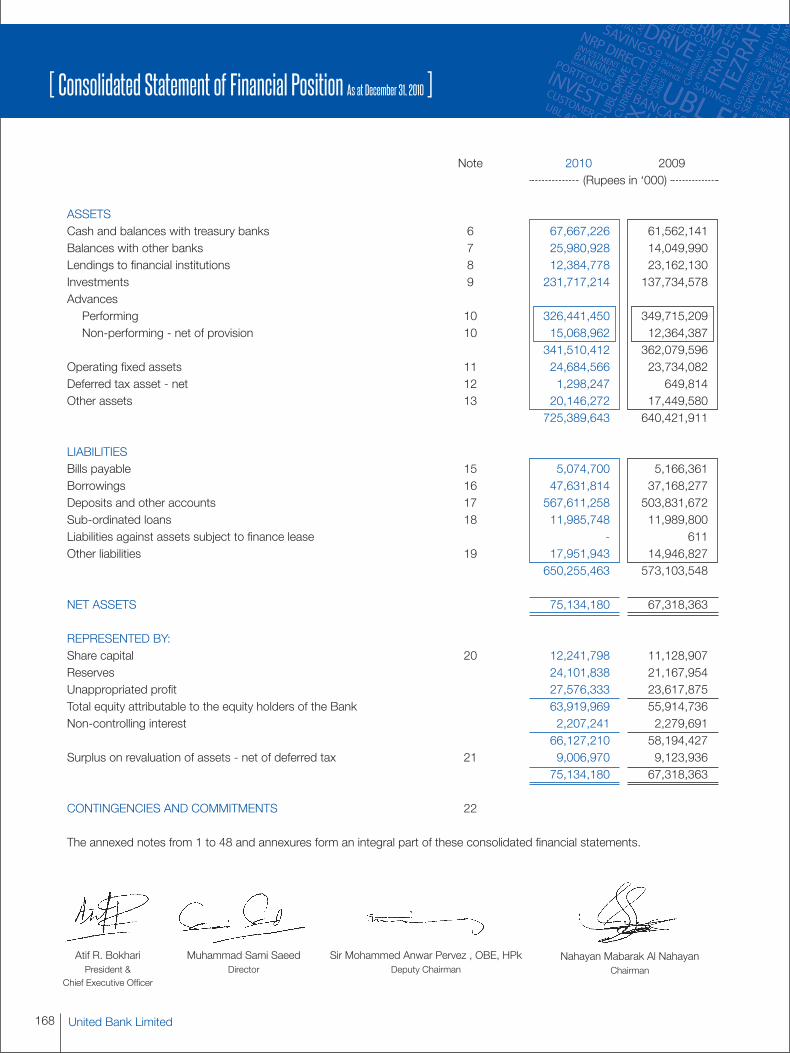
United Bank Limited168
[ Consolidated Statement of Financial Position As at December 31, 2010 ]
Note 2010 2009(Rupees in ‘000)
ASSETSCash and balances with treasury banks 6 67,667,226 61,562,141Balances with other banks 7 25,980,928 14,049,990Lendings to financial institutions 8 12,384,778 23,162,130Investments 9 231,717,214 137,734,578AdvancesPerforming 10 326,441,450 349,715,209Non-performing - net of provision 10 15,068,962 12,364,387
341,510,412 362,079,596Operating fixed assets 11 24,684,566 23,734,082Deferred tax asset - net 12 1,298,247 649,814Other assets 13 20,146,272 17,449,580
725,389,643 640,421,911
LIABILITIESBills payable 15 5,074,700 5,166,361Borrowings 16 47,631,814 37,168,277Deposits and other accounts 17 567,611,258 503,831,672Sub-ordinated loans 18 11,985,748 11,989,800Liabilities against assets subject to finance lease - 611Other liabilities 19 17,951,943 14,946,827
650,255,463 573,103,548
NET ASSETS 75,134,180 67,318,363
REPRESENTED BY:Share capital 20 12,241,798 11,128,907Reserves 24,101,838 21,167,954Unappropriated profit 27,576,333 23,617,875Total equity attributable to the equity holders of the Bank 63,919,969 55,914,736Non-controlling interest 2,207,241 2,279,691
66,127,210 58,194,427Surplus on revaluation of assets - net of deferred tax 21 9,006,970 9,123,936
75,134,180 67,318,363
CONTINGENCIES AND COMMITMENTS 22
The annexed notes from 1 to 48 and annexures form an integral part of these consolidated financial statements.
Atif R. BokhariPresident &
Chief Executive Officer
Muhammad Sami SaeedDirector
Sir Mohammed Anwar Pervez , OBE, HPkDeputy Chairman
Nahayan Mabarak Al NahayanChairman

169
[ Consolidated Profit and Loss account For the year ended December 31, 2010 ]
Annual Report 2010
Note 2010 2009(Rupees in ‘000)
Mark-up / return / interest earned 24 60,100,410 61,745,462Mark-up / return / interest expensed 25 25,433,850 28,323,272Net mark-up / interest income 34,666,560 33,422,190
Provision against loans and advances - net 10.5 6,838,336 9,644,927Provision against lending to financial institutions 8.5 - 560,852Provision for diminution in value of investments - net 9.3 304,026 1,187,460Bad debts written off directly 10.6 1,007,896 1,485,976
8,150,258 12,879,215Net mark-up / return / interest income after provisions 26,516,302 20,542,975
Non Mark-up / Interest IncomeFee, commission and brokerage income 7,021,661 6,736,356Dividend income 133,962 214,727Income from dealing in foreign currencies 1,734,651 1,275,914Gain on sale of securities - net 26 188,164 699,275Unrealized loss on revaluation of investments classified as
held for trading 9.4 (33,214) (2,582)Other income 27 1,569,731 3,146,810Total non mark-up / return / interest income 10,614,955 12,070,500
37,131,257 32,613,475Non Mark-up / Interest ExpensesAdministrative expenses 28 18,996,661 17,803,338Other provisions / write offs - net 29 68,113 642,274Workers' Welfare Fund 30 414,833 401,073Other charges 31 240,391 64,552Total non mark-up / interest expenses 19,719,998 18,911,237Share of income of associates 277,364 689,943Profit before taxation 17,688,623 14,392,181
Taxation - Current 32 6,850,854 6,996,257- Prior years 32 415,329 78,710- Deferred 32 (598,485) (2,170,738)
6,667,698 4,904,229Profit after taxation 11,020,925 9,487,952
Attributable to:Equity shareholders of the Bank 11,031,630 9,521,546Non-controlling interest (10,705) (33,594)
11,020,925 9,487,952
(Rupees)Restated
Earnings per share - basic and diluted 33 9.01 7.78
The annexed notes from 1 to 48 and annexures form an integral part of these consolidated financial statements.
Atif R. BokhariPresident &
Chief Executive Officer
Muhammad Sami SaeedDirector
Sir Mohammed Anwar Pervez , OBE, HPkDeputy Chairman
Nahayan Mabarak Al NahayanChairman
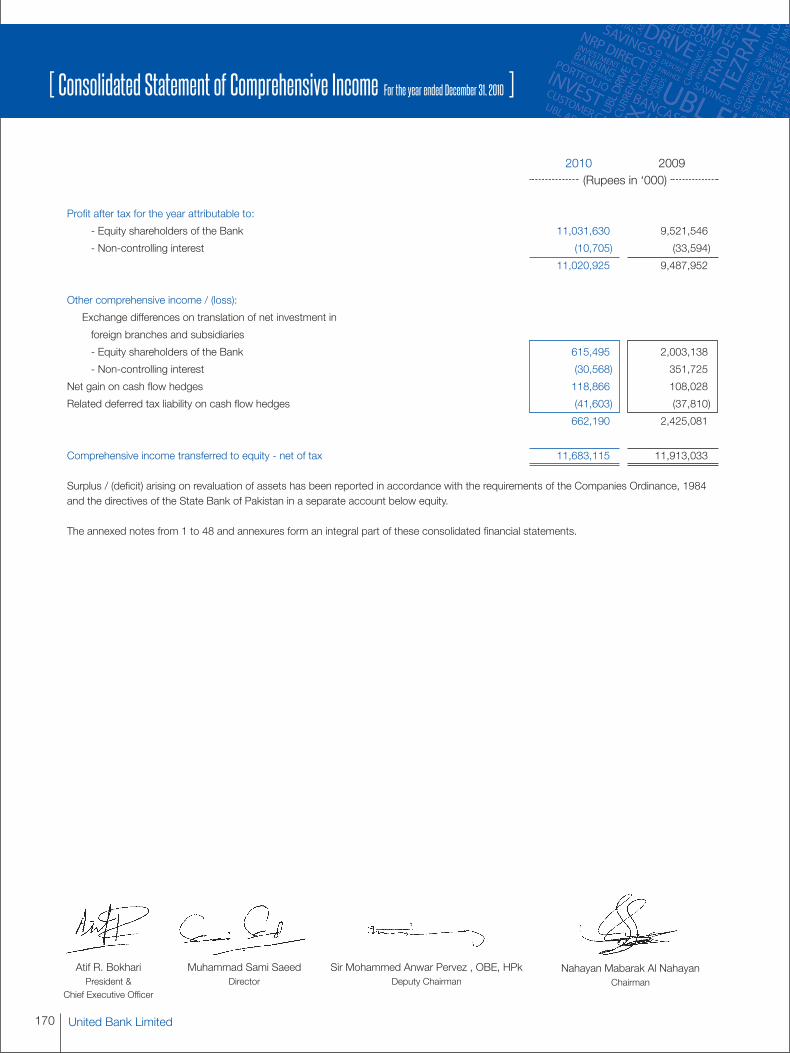
United Bank Limited170
[ Consolidated Statement of Comprehensive Income For the year ended December 31, 2010 ]
2010 2009(Rupees in ‘000)
Profit after tax for the year attributable to:
- Equity shareholders of the Bank 11,031,630 9,521,546
- Non-controlling interest (10,705) (33,594)
11,020,925 9,487,952
Other comprehensive income / (loss):
Exchange differences on translation of net investment in
foreign branches and subsidiaries
- Equity shareholders of the Bank 615,495 2,003,138
- Non-controlling interest (30,568) 351,725
Net gain on cash flow hedges 118,866 108,028
Related deferred tax liability on cash flow hedges (41,603) (37,810)
662,190 2,425,081
Comprehensive income transferred to equity - net of tax 11,683,115 11,913,033
Surplus / (deficit) arising on revaluation of assets has been reported in accordance with the requirements of the Companies Ordinance, 1984and the directives of the State Bank of Pakistan in a separate account below equity.
The annexed notes from 1 to 48 and annexures form an integral part of these consolidated financial statements.
Atif R. BokhariPresident &
Chief Executive Officer
Muhammad Sami SaeedDirector
Sir Mohammed Anwar Pervez , OBE, HPkDeputy Chairman
Nahayan Mabarak Al NahayanChairman
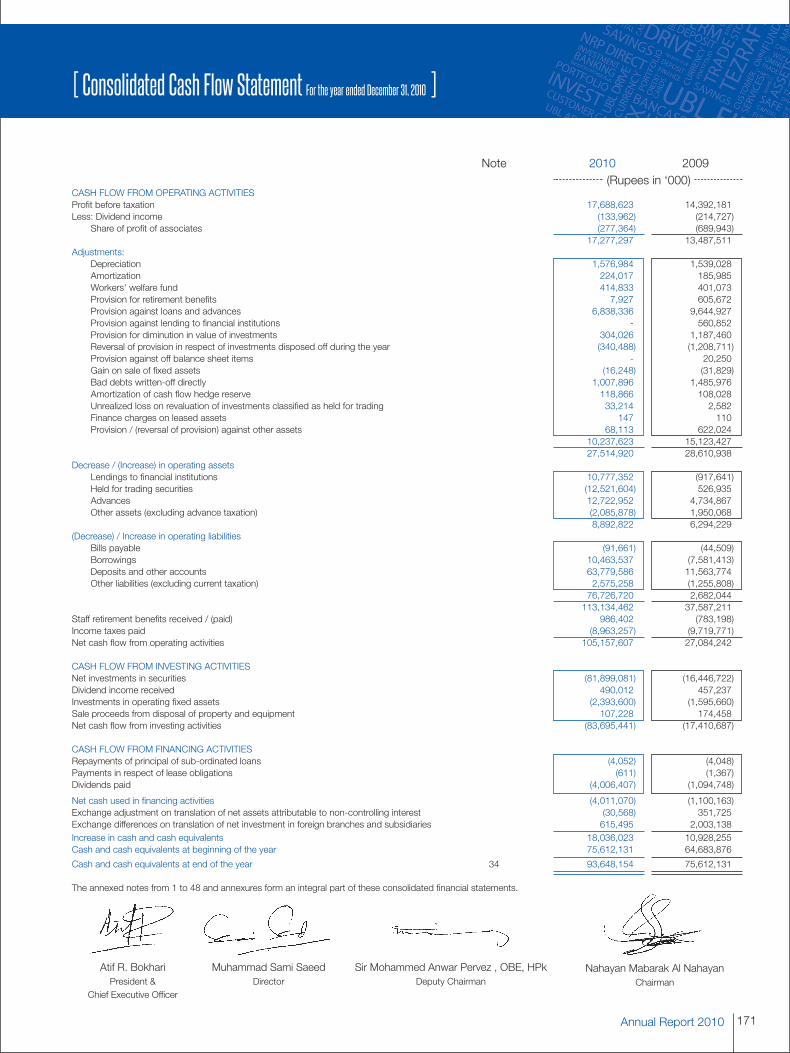
171
[ Consolidated Cash Flow Statement For the year ended December 31, 2010 ]
Annual Report 2010
Note 2010 2009(Rupees in ‘000)
CASH FLOW FROM OPERATING ACTIVITIESProfit before taxation 17,688,623 14,392,181Less: Dividend income (133,962) (214,727)
Share of profit of associates (277,364) (689,943)17,277,297 13,487,511
Adjustments:Depreciation 1,576,984 1,539,028Amortization 224,017 185,985Workers' welfare fund 414,833 401,073Provision for retirement benefits 7,927 605,672Provision against loans and advances 6,838,336 9,644,927Provision against lending to financial institutions - 560,852Provision for diminution in value of investments 304,026 1,187,460Reversal of provision in respect of investments disposed off during the year (340,488) (1,208,711)Provision against off balance sheet items - 20,250Gain on sale of fixed assets (16,248) (31,829)Bad debts written-off directly 1,007,896 1,485,976Amortization of cash flow hedge reserve 118,866 108,028Unrealized loss on revaluation of investments classified as held for trading 33,214 2,582Finance charges on leased assets 147 110Provision / (reversal of provision) against other assets 68,113 622,024
10,237,623 15,123,42727,514,920 28,610,938
Decrease / (Increase) in operating assetsLendings to financial institutions 10,777,352 (917,641)Held for trading securities (12,521,604) 526,935Advances 12,722,952 4,734,867Other assets (excluding advance taxation) (2,085,878) 1,950,068
8,892,822 6,294,229(Decrease) / Increase in operating liabilities
Bills payable (91,661) (44,509)Borrowings 10,463,537 (7,581,413)Deposits and other accounts 63,779,586 11,563,774Other liabilities (excluding current taxation) 2,575,258 (1,255,808)
76,726,720 2,682,044113,134,462 37,587,211
Staff retirement benefits received / (paid) 986,402 (783,198)Income taxes paid (8,963,257) (9,719,771)Net cash flow from operating activities 105,157,607 27,084,242
CASH FLOW FROM INVESTING ACTIVITIESNet investments in securities (81,899,081) (16,446,722)Dividend income received 490,012 457,237Investments in operating fixed assets (2,393,600) (1,595,660)Sale proceeds from disposal of property and equipment 107,228 174,458Net cash flow from investing activities (83,695,441) (17,410,687)
CASH FLOW FROM FINANCING ACTIVITIESRepayments of principal of sub-ordinated loans (4,052) (4,048)Payments in respect of lease obligations (611) (1,367)Dividends paid (4,006,407) (1,094,748)
Net cash used in financing activities (4,011,070) (1,100,163)Exchange adjustment on translation of net assets attributable to non-controlling interest (30,568) 351,725Exchange differences on translation of net investment in foreign branches and subsidiaries 615,495 2,003,138Increase in cash and cash equivalents 18,036,023 10,928,255Cash and cash equivalents at beginning of the year 75,612,131 64,683,876
Cash and cash equivalents at end of the year 34 93,648,154 75,612,131
The annexed notes from 1 to 48 and annexures form an integral part of these consolidated financial statements.
Atif R. BokhariPresident &
Chief Executive Officer
Muhammad Sami SaeedDirector
Sir Mohammed Anwar Pervez , OBE, HPkDeputy Chairman
Nahayan Mabarak Al NahayanChairman
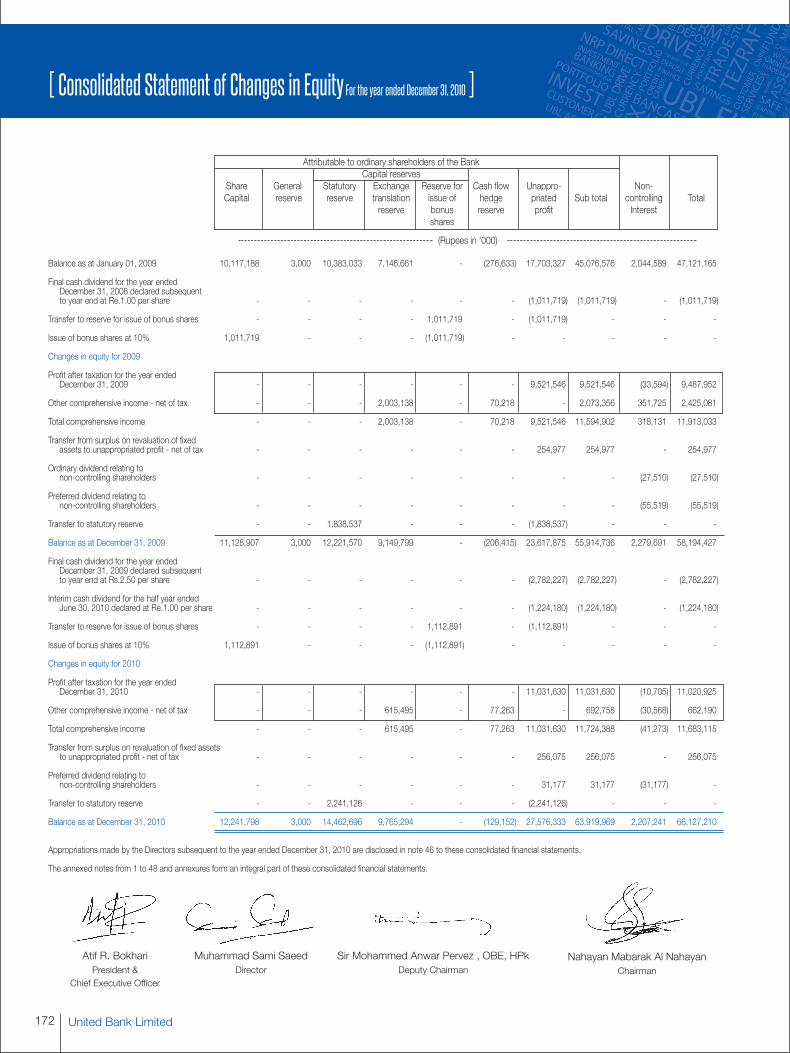
United Bank Limited172
[ Consolidated Statement of Changes in Equity For the year ended December 31, 2010 ]
Attributable to ordinary shareholders of the BankCapital reserves
Share General Statutory Exchange Reserve for Cash flow Unappro- Non-Capital reserve reserve translation issue of hedge priated Sub total controlling Total
reserve bonus reserve profit Interestshares
(Rupees in '000)
Balance as at January 01, 2009 10,117,188 3,000 10,383,033 7,146,661 - (276,633) 17,703,327 45,076,576 2,044,589 47,121,165
Final cash dividend for the year endedDecember 31, 2008 declared subsequentto year end at Re.1.00 per share - - - - - - (1,011,719) (1,011,719) - (1,011,719)
Transfer to reserve for issue of bonus shares - - - - 1,011,719 - (1,011,719) - - -
Issue of bonus shares at 10% 1,011,719 - - - (1,011,719) - - - - -
Changes in equity for 2009
Profit after taxation for the year endedDecember 31, 2009 - - - - - - 9,521,546 9,521,546 (33,594) 9,487,952
Other comprehensive income - net of tax - - - 2,003,138 - 70,218 - 2,073,356 351,725 2,425,081
Total comprehensive income - - - 2,003,138 - 70,218 9,521,546 11,594,902 318,131 11,913,033
Transfer from surplus on revaluation of fixedassets to unappropriated profit - net of tax - - - - - - 254,977 254,977 - 254,977
Ordinary dividend relating tonon-controlling shareholders - - - - - - - - (27,510) (27,510)
Preferred dividend relating tonon-controlling shareholders - - - - - - - - (55,519) (55,519)
Transfer to statutory reserve - - 1,838,537 - - - (1,838,537) - - -
Balance as at December 31, 2009 11,128,907 3,000 12,221,570 9,149,799 - (206,415) 23,617,875 55,914,736 2,279,691 58,194,427
Final cash dividend for the year endedDecember 31, 2009 declared subsequentto year end at Rs.2.50 per share - - - - - - (2,782,227) (2,782,227) - (2,782,227)
Interim cash dividend for the half year endedJune 30, 2010 declared at Re.1.00 per share - - - - - - (1,224,180) (1,224,180) - (1,224,180)
Transfer to reserve for issue of bonus shares - - - - 1,112,891 - (1,112,891) - - -
Issue of bonus shares at 10% 1,112,891 - - - (1,112,891) - - - - -
Changes in equity for 2010
Profit after taxation for the year endedDecember 31, 2010 - - - - - - 11,031,630 11,031,630 (10,705) 11,020,925
Other comprehensive income - net of tax - - - 615,495 - 77,263 - 692,758 (30,568) 662,190
Total comprehensive income - - - 615,495 - 77,263 11,031,630 11,724,388 (41,273) 11,683,115
Transfer from surplus on revaluation of fixed assetsto unappropriated profit - net of tax - - - - - - 256,075 256,075 - 256,075
Preferred dividend relating tonon-controlling shareholders - - - - - - 31,177 31,177 (31,177) -
Transfer to statutory reserve - - 2,241,126 - - - (2,241,126) - - -
Balance as at December 31, 2010 12,241,798 3,000 14,462,696 9,765,294 - (129,152) 27,576,333 63,919,969 2,207,241 66,127,210
Appropriations made by the Directors subsequent to the year ended December 31, 2010 are disclosed in note 46 to these consolidated financial statements.
The annexed notes from 1 to 48 and annexures form an integral part of these consolidated financial statements.
Atif R. BokhariPresident &
Chief Executive Officer
Muhammad Sami SaeedDirector
Sir Mohammed Anwar Pervez , OBE, HPkDeputy Chairman
Nahayan Mabarak Al NahayanChairman

173
[ Notes to and forming part of the ConsolidatedFinancial Statements For the year ended December 31, 2010 ]
Annual Report 2010
1. STATUS AND NATURE OF BUSINESS
The "Group" consists of:
- Holding Company
United Bank Limited (the Bank) is a banking company incorporated in Pakistan and is engaged in commercial bankingand related services. The Bank's registered office and principal office are situated at UBL building, Jinnah Avenue,Blue Area, Islamabad and at State Life Building No. 1, I. I. Chundrigar Road, Karachi respectively. The Bank operates1,123 (2009: 1,120) branches including 6 (2009: 5) Islamic banking branches, 1 (2009: 1) branch in Karachi ExportProcessing Zone (KEPZ) and 17 (2009: 17) branches outside Pakistan.
The Bank's Ordinary shares are listed on all three stock exchanges in Pakistan whereas its Global Depository Receipts(GDRs) are on the list of the UK Listing Authority and the London Stock Exchange Professional Securities Market. TheseGDRs are also eligible for trading on the International Order Book System of the London Stock Exchange. Further, theGDRs constitute an offering in the United States only to qualified institutional buyers in reliance on Rule 144A under theUS Securities Act of 1933 and an offering outside the United States in reliance on Regulation S.
Subsidiary Companies
The Group is engaged in carrying out the following business activities:
- United National Bank Limited (UNBL), United Kingdom - 55 percent holding
UNBL is an authorised banking institution incorporated in the United Kingdom (UK) and regulated by the FinancialServices Authority (FSA). The Bank was formed in 2001 from the merger of the UK branches of United Bank Limited andNational Bank Limited. The principal activities of UNBL are to provide retail banking products through its branch networkin major cities of the UK, wholesale banking and treasury services to financial institutions and trade finance facilities tobusinesses of all sizes.
- United Bank AG (Zurich), Switzerland - 100 percent holding
United Bank AG (Zurich) is a commercial bank owned by United Bank Limited, Karachi. Founded in 1967, its main activitiesare in credit operations and related trade financing. In doing so, it supports its international clientele in their import andexport business with Pakistan, the rest of the sub-continent and the Gulf States.
- United Executors and Trustees Company Limited, Pakistan - 100 percent holding
United Executors and Trustees Company Limited ("the Company") was incorporated in Pakistan in 1965 as an unlistedpublic limited company. The registered office of the Company is situated at State Life Insurance Building No. 1, I.I.Chundrigar Road, Karachi. Currently, the Company is engaged in the business of investments.
- UBL Fund Managers Limited, Pakistan - 100 percent holding
UBL Fund Managers Limited was incorporated as a public limited company in Pakistan under the Companies Ordinance,1984 on April 03, 2001. The Company is licensed to carry out Asset Management and Investment Advisory Servicesunder the Non-Banking Finance Companies (Establishment and Regulation) Rules, 2003 and the Non-Banking FinanceCompanies and Notified Entities Regulations, 2008 (the NBFC Regulations). The principal activities of the Company arefloating and managing mutual funds and providing investment advisory services. The registered office of the Company issituated at 8th Floor, State Life Building No. 1, I. I. Chundrigar Road, Karachi.

United Bank Limited174
[ Notes to and forming part of the ConsolidatedFinancial Statements For the year ended December 31, 2010 ]
2. BASIS OF PRESENTATION
2.1 In accordance with the directives of the Federal Government regarding the shifting of the banking system to Islamic modes,the State Bank of Pakistan (SBP) has issued various circulars from time to time. Permissible forms of trade-related modes offinancing include purchase of goods by banks from their customers and immediate resale to them at appropriate mark-up inprice on deferred payment basis. The purchases and sales arising under these arrangements are not reflected in theseconsolidated financial statements as such, but are restricted to the amount of facility actually utilized and the appropriateportion of mark-up thereon. However, the Islamic Banking branches of the Group have complied with the requirements setout under the Islamic Financial Accounting Standards issued by the Institute of Chartered Accountants of Pakistan and notifiedunder the provisions of the Companies Ordinance, 1984.
2.2 The financial results of the Islamic banking branches of the Group have been included in these consolidated financialstatements for reporting purposes, after eliminating material inter-branch transactions / balances. Key financial figures of theIslamic banking branches are disclosed in note 45 to these consolidated financial statements.
2.3 With effect from the current year, 'Balance Sheet' has been renamed as 'Statement of Financial Position' keeping in view therequirement of BSD Circular letter No.7 of 2010 dated April 20, 2010 issued by the SBP.
3. STATEMENT OF COMPLIANCE
3.1 These consolidated financial statements have been prepared in accordance with approved accounting standards as applicablein Pakistan. Approved accounting standards comprise of such International Financial Reporting Standards (IFRS) andinterpretations issued by the International Accounting Standards Board and Islamic Financial Accounting Standards (IFAS)issued by the Institute of Chartered Accountants of Pakistan, the requirements of the Companies Ordinance, 1984, BankingCompanies Ordinance, 1962 or directives issued by the Securities and Exchange Commission of Pakistan and the StateBank of Pakistan. Wherever the requirements of the Companies Ordinance, 1984, Banking Companies Ordinance, 1962 ordirectives issued by the Securities and Exchange Commission of Pakistan and the State Bank of Pakistan differ with therequirements of IFRS or IFAS, the requirements of the Companies Ordinance, 1984, Banking Companies Ordinance, 1962or said directives prevail.
3.2 The SBP vide BSD Circular letter No. 10, dated August 26, 2002 has deferred the applicability of International AccountingStandard 39, Financial Instruments: Recognition and Measurement (IAS 39) and International Accounting Standard 40,Investment Property (IAS 40) for banking companies till further instructions. Further, according to the notification of SECPissued vide SRO 411(I)/2008 dated April 28, 2008, IFRS - 7 "Financial Instruments: Disclosures" has not been made applicablefor banks. Accordingly, the requirements of these standards have not been considered in the preparation of these financialstatements. However, investments have been classified and valued in accordance with the requirements of various circularsissued by the SBP.

175
[ Notes to and forming part of the ConsolidatedFinancial Statements For the year ended December 31, 2010 ]
Annual Report 2010
3.3 Standards, interpretations and amendments to approved accounting standards that are not yet effective
The following revised standards, amendments and interpretations with respect to approved accounting standards asapplicable in Pakistan would be effective from the dates mentioned below against the respective standard or interpretation:
Standard or Interpretation Effective date(annual periods beginning
on or after)
IAS 32 - Financial Instruments: Presentation -Classification of Rights Issues (Amendment) February 01, 2010
IAS 24 - Related Party Disclosures (Revised) January 01, 2011
IAS 12 - Income Taxes: Deferred Tax Amendment –Recognition of Underlying Assets January 01, 2012
IFRIC 14 - IAS 19 – The Limit on a Defined Benefit Asset,Minimum Funding Requirements and their Interaction (Amendments) January 01, 2011
IFRIC 19 - Extinguishing Financial Liabilities with Equity Instruments July 01, 2010
The Group expects that the adoption of the above revisions, amendments and interpretations of the standards will not affectthe Group's financial statements in the period of initial application.
In addition to the above, amendments to various accounting standards have also been issued by the IASB. Suchimprovements are generally effective for accounting periods beginning on or after January 01, 2011. The Group expectsthat such improvements to the standards will not have any material impact on the Group's financial statements in theperiod of initial application.
4. BASIS OF MEASUREMENT
4.1 Accounting convention
These consolidated financial statements have been prepared under the historical cost convention except that certainoperating fixed assets have been stated at revalued amounts and certain investments and derivative financial instrumentshave been stated at fair value.
4.2 Critical accounting estimates and judgements
The preparation of these consolidated financial statements in conformity with approved accounting standards requiresmanagement to make judgments, estimates and assumptions that affect the reported amounts of assets and liabilities andincome and expenses. It also requires management to exercise judgment in application of its accounting policies. Theestimates and associated assumptions are based on historical experience and various other factors that are believed to bereasonable under the circumstances. These estimates and assumptions are reviewed on an ongoing basis. Revisions toaccounting estimates are recognized in the period in which the estimate is revised if the revision affects only that period, orin the period of revision and future periods if the revision affects both current and future periods.
United Bank Limited176
Significant accounting estimates and areas where judgments were made by the management in the application of accountingpolicies are as follows:
i) classification of investments (notes 5.5 and 9)ii) provision against investments (notes 5.5 and 9.3) and advances (notes 5.6 and 10.5)iii) income taxes (notes 5.9 and 32)iv) staff retirement benefits (note 5.11 and 36)v) fair value of derivatives (note 5.16 and 19.4)vi) operating fixed assets, depreciation and amortization (note 5.7 and 11)vii) impairment (note 5.8)
5. SUMMARY OF SIGNIFICANT ACCOUNTING POLICIES
5.1 Basis of consolidation
- The consolidated financial statements include the financial statements of UBL - Holding Company and its subsidiarycompanies - "the Group".
- Subsidiary companies are fully consolidated from the date on which more than 50% of voting rights are transferred to theGroup or the power to control the company is established and are excluded from consolidation from the date of disposalor when the control is lost.
- The financial statements of subsidiaries are prepared for same reporting period as the holding company using consistentaccounting policies except for the non-banking subsidiaries in Pakistan which follow the requirements of IAS 39 andoverseas subsidiaries which are required to comply with local regulations enforced within the respective jurisdiction.
- The assets and liabilities of subsidiary companies have been consolidated on a line by line basis and the carrying value ofinvestments in the subsidiary companies held by the Bank is eliminated against the subsidiaries' share capital and preacquisition reserves in the consolidated financial statements.
- Non-controlling interest represents that part of the net results of operations and of net assets of the subsidiary companiesthat is not owned by the Group.
- All material intra-group balances and transactions have been eliminated in full.
5.2 Significant accounting policies
The accounting policies adopted in the preparation of these financial statements are consistent with those of the previousfinancial year except as follows:
The Group has adopted the following new and amended IFRS and related interpretations which became effectiveduring the year:
IFRS 2 – Share-based Payments: Amendments relating to Group Cash-settled Share-based Payment Transactions
IFRS 3 – Business Combinations (Revised)
IAS 27 - Consolidated and Separate Financial Statements (Amendment)
IFRIC 17 - Distributions of Non-cash Assets to owners
[ Notes to and forming part of the ConsolidatedFinancial Statements For the year ended December 31, 2010 ]
177Annual Report 2010
In May 2008 and April 2009, International Accounting Standards Board issued amendments to various standards primarilywith a view to removing inconsistencies and clarifying wording. These improvements are listed below:
Issued in May 2008
IFRS 5 – Non-Current Assets Held for Sale and Discontinued Operations
Issued in April 2009
IFRS 2 – Share-based Payments (note 37.3)IFRS 5 – Non-Current Assets Held for Sale and Discontinued OperationsIFRS 8 – Operating SegmentsIAS 1 – Presentation of Financial StatementsIAS 7 – Statement of Cash FlowsIAS 17 – LeasesIAS 36 – Impairment of AssetsIAS 38 – Intangible AssetsIAS 39 – Financial Instruments: Recognition and measurementIFRIC 9 – Reassessment of Embedded DerivativesIFRIC 16 – Hedges of a Net Investment in a Foreign Operation
The adoption of the above standards, amendments / improvements and interpretations did not have a material effect on thefinancial statements.
5.3 Cash and cash equivalents
Cash and cash equivalents for the purpose of the cash flow statement represent cash and balances with treasury banks andbalances with other banks in current and deposit accounts.
5.4 Lendings to / borrowings from financial institutions
The Group enters into transactions of repos and reverse repos at contracted rates for a specified period of time. Theseare recorded as under:
5.4.1 Sale under repurchase agreements
Securities sold subject to a re-purchase agreement (repo) are retained in the consolidated financial statements as investmentsand the counter party liability is included in borrowings from financial institutions. The differential in sale and re-purchase valueis accrued over the period of the agreement and recorded as an expense.
5.4.2 Purchase under resale agreements
Securities purchased under agreement to resell (reverse repo) are included in lendings to financial institutions. The differentialbetween the purchase price and resale price is amortized over the period of the agreement and recorded as income.
Securities held as collateral are not recognized in the consolidated financial statements, unless these are sold to third parties,in which case the obligation to return them is recorded at fair value as a trading liability under borrowings from financialinstitutions.
[ Notes to and forming part of the ConsolidatedFinancial Statements For the year ended December 31, 2010 ]
United Bank Limited178
5.5 Investments
Investments of the Group, other than investments in associates are classified as held for trading, held-to-maturity andavailable for sale.
Held for trading
These are securities which are either acquired for generating a profit from short-term fluctuations in market prices, interest ratemovements, dealer's margin or are securities included in a portfolio in which a pattern of short-term profit taking exists.
Held to maturity
These are securities with fixed or determinable payments and fixed maturity in respect of which the Group has the positiveintent and ability to hold to maturity.
Available for sale
These are investments, other than those in associates, that do not fall under the held for trading or held to maturity categories.
Initial measurement
All “regular way” purchases and sales of investments are recognized on the trade date, i.e., the date that the Group commitsto purchase or sell the asset. Regular way purchases or sales are purchases or sales of investments that require delivery ofassets within the time frame generally established by regulation or convention in the market place.
Investments are initially recognized at fair value which, in the case of investments other than held-for-trading, includestransaction costs associated with the investments.
Subsequent measurement
Held-for-trading
These are measured at subsequent reporting dates at fair value. Gains and losses on re-measurement are included in the profitand loss account.
Held-to-maturity
These are measured at amortized cost using the effective interest rate method, less any impairment loss recognized to reflectirrecoverable amounts.
Available for sale
Quoted-securities classified as available-for-sale investments are measured at subsequent reporting dates at fair value. Anysurplus / deficit arising thereon is kept in a separate account shown in the balance sheet below equity and taken to the profitand loss account when actually realized upon disposal or when the investment is considered to be impaired.
Unquoted equity securities are valued at the lower of cost and break-up value. A decline in the carrying value is charged tothe profit and loss account. The break-up value of these equity securities is calculated with reference to the net assets of theinvestee company as per the latest available audited financial statements. Investments in other unquoted securities are valuedat cost less impairment losses.
[ Notes to and forming part of the ConsolidatedFinancial Statements For the year ended December 31, 2010 ]
179Annual Report 2010
Provision for diminution in the value of securities (except term finance certificates) is made for impairment, if any. Provision fordiminution in the value of term finance certificates is made as per the aging criteria prescribed by the Prudential Regulationsissued by the SBP.
Associates
Associates are all entities over which the Group has a significant influence, but control does not exist.
Investments in associates are accounted for using the equity method of accounting. Under the equity method, the investmentin the associate is initially recognised at cost and the carrying amount is increased or decreased to recognise the investor'sshare of the profit or loss of the investee subsequent to the date of acquisition. Increase / decrease in share of profit or lossof associates is accounted for in the consolidated profit and loss account. The Group applies equity accounting for UBLInsurers Limited, Oman United Exchange Company Limited and its own investment in mutual funds managed by UBL FundManagers Limited that are categorized as associates.
5.6 Advances
Advances are stated net of specific and general provisions. Specific provision against domestic advances is determined onthe basis of the Prudential Regulations and other directives issued by the SBP and is charged to the profit and loss account.General provision against consumer loans is made in accordance with the requirements of the Prudential Regulations issuedby the SBP. General and specific provisions pertaining to overseas advances are made in accordance with the requirementsof the monetary agencies and the regulatory authorities of the respective countries. The Group, from time to time, makesgeneral provision against weaknesses in its portfolio if circumstances warrant on the basis of management's estimation.Advances are written off when there is no realistic prospect of recovery. The amount so written off is a book entry withoutprejudice to the Group's right of recovery against the customer.
The Bank determines write-offs in accordance with the criteria prescribed by the SBP vide BPRD Circular No. 06 datedJune 05, 2007.
5.7 Operating fixed assets and depreciation
5.7.1 Owned
Property and equipment, other than freehold land (which is not depreciated) and capital work-in-progress, are stated at costor revalued amount less accumulated depreciation and accumulated impairment losses (if any). Freehold land is carried atrevalued amount less impairment losses while capital work-in-progress is stated at cost less impairment losses. The cost ofproperty and equipment of foreign branches and subsidiaries includes exchange difference arising on currency translation atthe year-end rates of exchange.
Depreciation is calculated so as to write off the depreciable amount of the assets over their expected economic lives at therates specified in note 11.2 to these consolidated financial statements. The depreciation charge for the year is calculatedafter taking into account residual value, if any, and using methods depending on the nature of the asset and the country ofits location. The residual values, useful lives and depreciation methods are reviewed and adjusted, if appropriate, at eachstatement of financial position date.
Depreciation on additions is charged from the month the asset is available for use. No depreciation is charged in themonth of disposal.
Land and buildings are revalued by professionally qualified valuers with sufficient regularity to ensure that their net carrying valuedoes not differ materially from their fair value.
[ Notes to and forming part of the ConsolidatedFinancial Statements For the year ended December 31, 2010 ]
United Bank Limited180
Surplus arising on revaluation is credited to the surplus on revaluation of fixed assets account. Deficit arising on subsequentrevaluation of fixed assets is adjusted against the balance in the above-mentioned surplus account as allowed under theprovisions of the Companies Ordinance, 1984. The surplus on revaluation of fixed assets, to the extent of incrementaldepreciation charged on the related assets, is transferred to unappropriated profit.
Gains and losses on sale of fixed assets are included in income currently, except that the related surplus on revaluation of fixedassets (net of deferred taxation) is transferred directly to unappropriated profit.
Major renewals and improvements are capitalized and the assets so replaced, if any, are retired. Normal repairs andmaintenance are charged to the profit and loss account as and when incurred.
5.7.2 Leased (Ijarah)
Assets leased out under Ijarah are stated at cost less accumulated depreciation and accumulated impairment losses, if any.Assets under Ijarah are depreciated over the period of the lease term.
Ijarah income is recognized on an accrual basis as and when the rental becomes due.
5.7.3 Intangible assets
Intangible assets having a finite useful life are stated at cost less accumulated amortization and accumulated impairmentlosses, if any. Intangible assets are amortized using the straight line method, from the month when these assets are availablefor use, whereby the cost of the intangible asset is amortized on the basis of the estimated useful life over which economicbenefits are expected to flow to the Group. The residual values and useful lives are reviewed and adjusted, if appropriate, ateach statement of financial position date.
5.8 Impairment
Impairment in available for sale equity investments
Available for sale equity investments are impaired when there has been a significant or prolonged decline in the fair valuebelow its cost. The determination of what is significant or prolonged requires judgment. In making this judgment, the Groupevaluates among other factors, the normal volatility in share price.
Impairment in investments in associates
The Group considers that a decline in the recoverable value of investment in associates below their cost may be evidence ofimpairment. Recoverable value is calculated as the higher of fair value less costs to sell and value in use. An impairment lossis recognized when the recoverable value falls below the carrying value and is charged to the profit and loss. Subsequentreversal of impairment loss, upto the cost of investment in associates is credited to the profit and loss account.
Impairment in non-financial assets (excluding deferred tax)
The carrying amounts of non-financial assets are reviewed at each reporting date for impairment whenever events or changesin circumstances indicate that the carrying amounts of the assets may not be recoverable. If such indication exists, and wherethe carrying value exceeds the estimated recoverable amount, assets are written down to their recoverable amount. Theresulting impairment loss is taken to the profit and loss account except for impairment loss on revalued assets, which isadjusted against the related revaluation surplus to the extent that the impairment loss does not exceed the surplus onrevaluation of the revalued assets.
[ Notes to and forming part of the ConsolidatedFinancial Statements For the year ended December 31, 2010 ]
181Annual Report 2010
5.9 Taxation
5.9.1 Current
Provision for current taxation is based on taxable income for the year determined in accordance with the prevailing laws fortaxation on income earned from local as well as foreign operations, as applicable to the respective jurisdictions. The chargefor current tax is calculated using prevailing tax rates. The charge for current tax also includes, where considered necessary,adjustments relating to prior years, arising from assessments made during the year.
5.9.2 Deferred
Deferred tax is recognized using the liability method on all major temporary differences between the amounts attributed toassets and liabilities for financial reporting purposes and the amounts used for taxation purposes. In addition, the Group alsorecords a deferred tax asset on available tax losses. Deferred tax is calculated at the rates that are expected to apply to theperiod when the differences are expected to reverse, based on tax rates that have been enacted or substantively enacted atthe statement of financial position date.
Deferred tax assets are recognized only to the extent that it is probable that future taxable profits will be available against whichthe assets can be utilized.
The carrying amount of the deferred tax asset is reviewed at each statement of financial position date and reduced to theextent that it is no longer probable that sufficient taxable profits will be available to allow all or part of the deferred tax assetto be utilized.
The Bank also recognizes a deferred tax asset / liability on deficit / surplus on revaluation of fixed assets, cash flow hedgereserve and securities which is adjusted against the related deficit / surplus in accordance with the requirements of the revisedInternational Accounting Standard (IAS) 12, Income Taxes.
5.10 Provisions
Provisions are recognized when the Group has a legal or constructive obligation as a result of past events which makesit probable that an outflow of resources will be required to settle the obligation and a reliable estimate of the amountcan be made.
Provision against identified non-funded losses is recognized when intimated and reasonable certainty exists for the Group tosettle the obligation. The loss is charged to the profit and loss account net of expected recovery and the provision is classifiedunder other liabilities.
Provisions are reviewed at each statement of financial position date and are adjusted to reflect the current best estimate.
[ Notes to and forming part of the ConsolidatedFinancial Statements For the year ended December 31, 2010 ]
United Bank Limited182
5.11 Staff retirement and other benefits
5.11.1 United Bank Limited (UBL)
The Bank operates the following staff retirement schemes for its employees:
a) For new employees and for those who opted for the new scheme introduced in 1991, the Bank operates an
- approved contributory provident fund (defined contribution scheme); and
- approved gratuity scheme (defined benefit scheme).
b) For employees who have not opted for the new scheme introduced in 1991, the Bank operates an
- approved funded pension scheme, introduced in 1986 (defined benefit scheme); and
- approved non-contributory provident fund in lieu of the contributory provident fund.
In the year 2001, the Bank modified the pension scheme and introduced a conversion option for employees covered underoption (b) above to move to option (a). This conversion option ceased on December 31, 2003.
The Bank also operates a contributory benevolent fund for all its eligible employees (defined benefit scheme).
Annual contributions towards the defined benefit schemes are made on the basis of actuarial advice using the ProjectedUnit Credit Method.
For defined contribution plans, the Bank pays contributions to the Fund on a periodic basis. The Bank has no further paymentobligation once the contributions have been paid. The contributions are recognized as an expense when they are due. Prepaidcontributions are recognized as an asset to the extent that a cash refund or a reduction of the future payments is available.
Other benefits
a) Employees' compensated absences
The Bank makes provisions for compensated vested and non-vested absences accumulated by its eligible employees onthe basis of actuarial advice under the Projected Unit Credit Method.
b) Post retirement medical benefits (defined benefit scheme)
The Bank provides post retirement medical benefits to eligible retired employees. Provision is made annually to meet thecost of such medical benefits on the basis of actuarial advice under the Projected Unit Credit Method.
c) Employee motivation and retention scheme
The Bank operates a long term motivation and retention scheme for its employees with the objective of rewarding,motivating and retaining its high performing executives and officers. The liability of the Bank is fixed and is determined eachyear based on the performance of the Bank.
[ Notes to and forming part of the ConsolidatedFinancial Statements For the year ended December 31, 2010 ]
183Annual Report 2010
Actuarial gains and losses
Actuarial gains and losses arising from experience adjustments and changes in actuarial assumptions in excess of the greaterof 10% of the value of the plan assets or 10% of the defined benefit obligation at the end of the last reporting year are chargedor credited to income over the employees' expected average remaining working lives. These limits are calculated and appliedseparately for each defined benefit plan.
Actuarial gains and losses pertaining to long term compensated absences are recognized immediately.
5.11.2 United National Bank Limited (UNBL)
Defined benefit scheme
UNBL operates a pension scheme (defined benefit scheme) for certain staff. This scheme is closed for new members and theaccrual of benefits has ceased from January 01, 2010. The amount charged to the profit and loss account are the gains andlosses on settlements and curtailments. The interest cost and the expected return on assets are included in interest payableand interest receivable. Acturial gains and losses are recognised immediately in the profit and loss account.
The defined benefit scheme is funded, with the assets of the scheme held separately from those of UNBL, in separate trusteeadministered funds. Pension scheme assets are measured at fair value and liabilites are measured on an actuarial basis usingthe Projected Unit Credit Method and discounted at a rate equivalent to the current rate of return on a high-quality corporatebond of equivalent currency and term to the scheme liabilities. The actuarial valuations are obtained at least triennially and areupdated at each balance sheet date. The resulting defined benefit asset or liability is presented separately on the face of thestatement of financial position.
Defined contribution scheme
UNBL operates a defined contributory pension scheme, the amount charged to the profit and loss account in respect ofpension costs and other post-retirement benefits is the contribution payable in the year. Differences between thecontribution payable in the year and contribution actually paid are shown as either accruals or prepayments in thestatement of financial position.
5.11.3 UBL Fund Managers Limited (UFML)
Defined benefit plan
UFML operates an approved gratuity fund for all employees. Annual contributions to the Fund are made on the basis ofactuarial advice using the Projected Unit Credit Method. The net cumulative actuarial gains / losses, in excess of thehigher of the following corridor limits are recognised over the expected remaining average working lives of employees ona straight line basis:
- 10% of the present value of the defined benefit obligation (before deducting plan assets); or
- 10 percent of the fair value of plan assets.
Defined contribution plan
UFML operates an approved contributory provident fund (Defined Contribution Scheme) for all eligible employees.
[ Notes to and forming part of the ConsolidatedFinancial Statements For the year ended December 31, 2010 ]

United Bank Limited184
5.11.4 United Bank AG (Zurich) (UBAG)
UBAGmaintains a contribution-oriented pension scheme for employees who have reached the age of 25. It bears a large shareof the costs of the occupational pension plan for all employees as well as their surviving dependants pursuant to legalrequirements. The employee benefit obligations and the assets serving as coverage are outsourced to a collective insurancefirm. Organisation, management and financing of the pension plan comply with the legal regulations, the deed of foundationand the applicable regulations of the benefit plan.
5.12 Sub-ordinated Debt
Sub-ordinated debt is initially recorded at the amount of proceeds received. Mark-up accrued on subordinated debtis recognised separately as part of other liabilities and is charged to the profit and loss account over the period onan accrual basis.
5.13 Borrowings / deposits and their cost
a) Borrowings / deposits are recorded at the proceeds received.
b) Borrowings / deposits costs are recognized as an expense in the period in which these are incurred.
5.14 Revenue recognition
Revenue is recognized to the extent that the economic benefits will flow to the Group and the revenue can be reliablymeasured. The following recognition criteria must be met before revenue is recognized.
5.14.1 Advances and investments
Mark-up / return on performing advances and investments is recognized on a time proportionate basis over the term of theadvances and investments. Where debt securities are purchased at premium or discount, such premium / discount isamortized through the profit and loss account over the remaining period of maturity.
Interest or mark-up recoverable on non-performing advances and classified investments is recognized on receipt basis.Interest / return / mark-up on rescheduled / restructured loans and advances and investments is recognized as permitted bythe regulations of the SBP or overseas regulatory authorities of the countries where the branches and subsidiaries operate,except where, in the opinion of the management, it would not be prudent to do so.
5.14.2 Dividend income
Dividend income is recognised when the right to receive the dividend is established.
5.14.3 Fee, brokerage and commission
Fee, brokerage, commission and other income is recognized on an accrual basis.
5.15 Foreign currencies
5.15.1 Functional and presentation currency
Items included in the financial statements are measured using the currency of the primary economic environment in whichthe Group operates. The financial statements are presented in Pakistani Rupees, which is the Group's functional andpresentation currency.
[ Notes to and forming part of the ConsolidatedFinancial Statements For the year ended December 31, 2010 ]
185Annual Report 2010
5.15.2 Foreign currency transactions
Transactions in foreign currencies are translated to rupees at the foreign exchange rates prevailing on the transaction date.Monetary assets and liabilities in foreign currencies are expressed in rupee terms at the rates of exchange prevailing at thestatement of financial position date. Forward foreign exchange contracts and foreign bills purchased are valued at forward ratesapplicable to their respective maturities.
5.15.3 Foreign operations and subsidiaries
The assets and liabilities of foreign operations and subsidiaries are translated to rupees at exchange rates prevailing at thestatement of financial position date. The results of foreign operations and subsidiaries are translated at the average rate ofexchange for the year.
5.15.4 Translation gains and losses
Translation gains and losses are taken to the profit and loss account, except those arising on the translation of net investmentin foreign branches and subsidiaries which are taken to capital reserve (Exchange Translation Reserve) until the disposal ofthe net investment at which time these are recognised in the profit and loss account.
5.15.5 Commitments
Commitments for outstanding forward foreign exchange contracts are disclosed in the consolidated financial statements atcontracted rates. Contingent liabilities / commitments for letters of credit and letters of guarantee denominated in foreigncurrencies are expressed in rupee terms at the rates of exchange prevailing at the date of the statement of financial position.All other commitments are disclosed in the consolidated financial statements at the committed amount.
5.16 Financial instruments
5.16.1 Financial assets and liabilities
Financial instruments carried on the statement of financial position include cash and bank balances, lendings to financialinstitutions, investments, advances, certain receivables, bills payable, borrowings from financial institutions, deposits, sub-ordinated loans and certain other payables. The particular recognition methods adopted for significant financial assets andfinancial liabilities are disclosed in the individual policy notes associated with them.
5.16.2 Derivative financial instruments
Derivative financial instruments are initially recognized at fair value on the date on which the derivative contract is entered intoand are subsequently re-measured at fair value using appropriate valuation techniques. All derivative financial instruments arecarried as assets when their fair value is positive and liabilities when their fair value is negative. Any change in the fair value ofderivative financial instruments is taken to the profit and loss account.
5.16.3 Hedge accounting
The Group makes use of derivative instruments to manage exposures to interest rate, foreign currency and credit risks,including exposures arising from forecast transactions. In order to manage particular risks, the Group applies hedge accountingfor transactions which meet the specified criteria.
At the inception of the hedge relationship, the Group formally documents the relationship between the hedged item and thehedging instrument, including the nature of the risk, the objective and strategy for undertaking the hedge and the method thatwill be used to assess the effectiveness of the hedging relationship.
[ Notes to and forming part of the ConsolidatedFinancial Statements For the year ended December 31, 2010 ]

United Bank Limited186
Also, at the inception of the hedge relationship, a formal assessment is undertaken to ensure the hedging instrument isexpected to be highly effective in offsetting the designated risk in the hedged item. Hedges are formally assessed each quarter.A hedge is regarded as highly effective if the changes in fair value or cash flows attributable to the hedged risk during the periodfor which the hedge is designated are expected to offset in a range of 80% to 125%. For situations where the hedged itemis a forecast transaction, the Group assesses whether the transaction is highly probable and presents an exposure to variationsin cash flows that could ultimately affect the profit and loss account.
(a) Fair value hedges
For designated and qualifying fair value hedges, the change in the fair value of a hedging derivative is recognised in theprofit and loss account within other income. The change in the fair value of the hedged item attributable to the riskhedged is recorded as part of the carrying value of the hedged item and is also recognised in the profit and loss accountwithin other income.
(b) Cash flow hedges
For qualifying cash flow hedges, the fair value gain or loss associated with the effective portion of the cash flow hedge isrecognised initially in the statement of changes in equity, and recycled to the profit and loss account in the periods whenthe hedged item will affect profit or loss. Any ineffective portion of the gain or loss on the hedging instrument is recognisedin the profit and loss account immediately.
When a hedging instrument expires or is sold, or when a hedge no longer meets the criteria for hedge accounting, anycumulative gain or loss existing in equity at that time remains in equity and is recognised when the hedged item is ultimatelyrecognised in the profit and loss account. When a forecast transaction occurs or is no longer expected to occur, thecumulative gain or loss that was recognised in equity is immediately transferred to the profit and loss account.
5.16.4 Off setting
Financial assets and financial liabilities are set off and the net amount is reported in the consolidated financial statementswhen there is a legally enforceable right to set off and the Group intends to either settle on a net basis, or to realize the assetsand to settle the liabilities simultaneously.
5.17 Assets acquired in satisfaction of claims
The Group occasionally acquires assets in settlement of certain advances. These are stated at the lower of the carrying valueof the related advances and the current fair value of such assets.
5.18 Segment reporting
A segment is a distinguishable component of the Group that is engaged either in providing particular products or services(business segment), or in providing products or services within a particular economic environment (geographical segment),which is subject to risks and rewards that are different from those of other segments.
5.18.1 Business segments
(a) Corporate finance
Corporate banking includes services provided in connection with mergers and acquisition, underwriting, privatization,securitization, research, debts instruments, equity, syndication, IPO and secondary private placements.
[ Notes to and forming part of the ConsolidatedFinancial Statements For the year ended December 31, 2010 ]

187Annual Report 2010
(b) Trading and sales
Trading and sales includes fixed income, equity, foreign exchange, commodities, credit, funding, own position securities,lending and repos, brokerage debt and prime brokerage.
(c) Retail banking
Retail banking includes retail lending and deposits, banking services, trusts and estates, private lending and deposits,investment advice, merchant / commercial / corporate cards.
(d) Commercial banking
Commercial banking includes project finance, real estate, export finance, trade finance, factoring, leasing, lending,guarantees, bills of exchange and deposits.
(e) Asset management
It includes discretionary and non discretionary fund management activities in the form of pooled, segregated, retail,institutional, private equity, open, close ended funds etc.
(f) Others
It includes results of support functions of the Group and subsidiary which cannot be classified in any of theabove segments.
5.18.2 Geographical segments
The Group operates in five geographical regions being:
- Pakistan- Karachi Export Processing Zone- United States of America- Middle East- Europe
5.19 Dividend and appropriation to reserves
Dividends and appropriations to reserves are recorded in the year in which these are approved, except appropriations requiredby the law which are recorded in the period to which they pertain.
5.20 Earnings per share
The Group presents basic and diluted earnings per share (EPS) for its shareholders. Basic EPS is calculated by dividingthe profit or loss attributable to ordinary shareholders of the Group by the weighted average number of ordinary sharesoutstanding during the year.
[ Notes to and forming part of the ConsolidatedFinancial Statements For the year ended December 31, 2010 ]
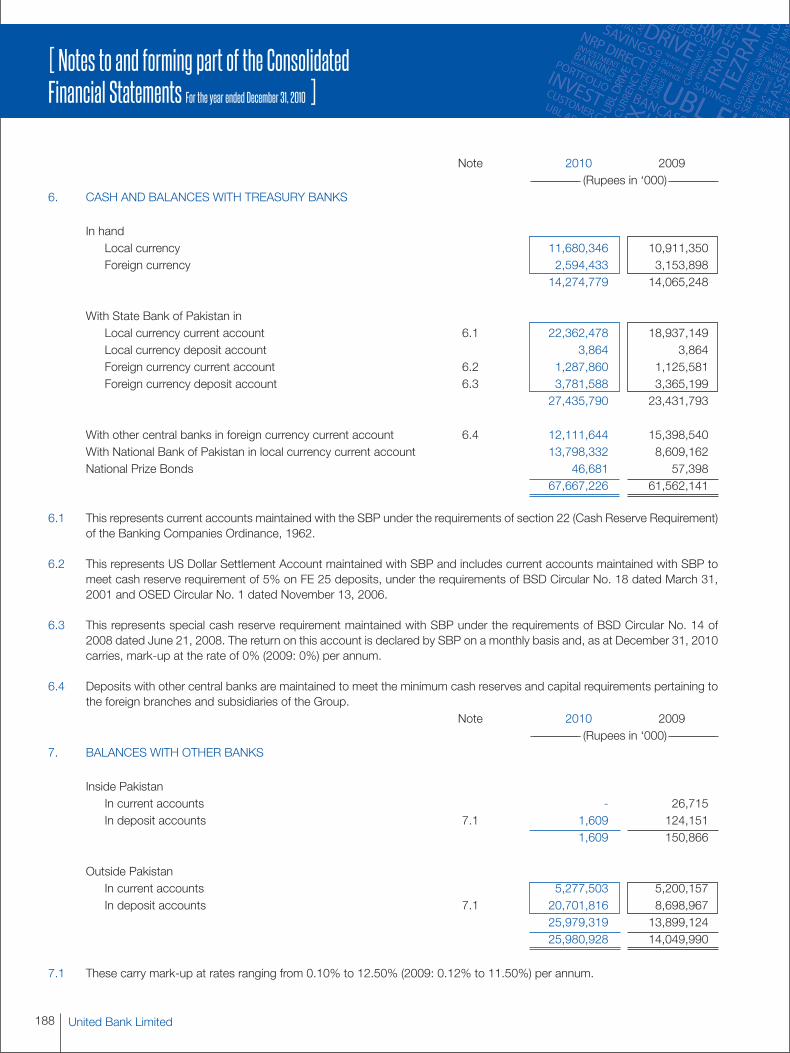
United Bank Limited188
Note 2010 2009(Rupees in ‘000)
6. CASH AND BALANCES WITH TREASURY BANKS
In handLocal currency 11,680,346 10,911,350Foreign currency 2,594,433 3,153,898
14,274,779 14,065,248
With State Bank of Pakistan inLocal currency current account 6.1 22,362,478 18,937,149Local currency deposit account 3,864 3,864Foreign currency current account 6.2 1,287,860 1,125,581Foreign currency deposit account 6.3 3,781,588 3,365,199
27,435,790 23,431,793
With other central banks in foreign currency current account 6.4 12,111,644 15,398,540With National Bank of Pakistan in local currency current account 13,798,332 8,609,162National Prize Bonds 46,681 57,398
67,667,226 61,562,141
6.1 This represents current accounts maintained with the SBP under the requirements of section 22 (Cash Reserve Requirement)of the Banking Companies Ordinance, 1962.
6.2 This represents US Dollar Settlement Account maintained with SBP and includes current accounts maintained with SBP tomeet cash reserve requirement of 5% on FE 25 deposits, under the requirements of BSD Circular No. 18 dated March 31,2001 and OSED Circular No. 1 dated November 13, 2006.
6.3 This represents special cash reserve requirement maintained with SBP under the requirements of BSD Circular No. 14 of2008 dated June 21, 2008. The return on this account is declared by SBP on a monthly basis and, as at December 31, 2010carries, mark-up at the rate of 0% (2009: 0%) per annum.
6.4 Deposits with other central banks are maintained to meet the minimum cash reserves and capital requirements pertaining tothe foreign branches and subsidiaries of the Group.
Note 2010 2009(Rupees in ‘000)
7. BALANCES WITH OTHER BANKS
Inside PakistanIn current accounts - 26,715In deposit accounts 7.1 1,609 124,151
1,609 150,866
Outside PakistanIn current accounts 5,277,503 5,200,157In deposit accounts 7.1 20,701,816 8,698,967
25,979,319 13,899,12425,980,928 14,049,990
7.1 These carry mark-up at rates ranging from 0.10% to 12.50% (2009: 0.12% to 11.50%) per annum.
[ Notes to and forming part of the ConsolidatedFinancial Statements For the year ended December 31, 2010 ]
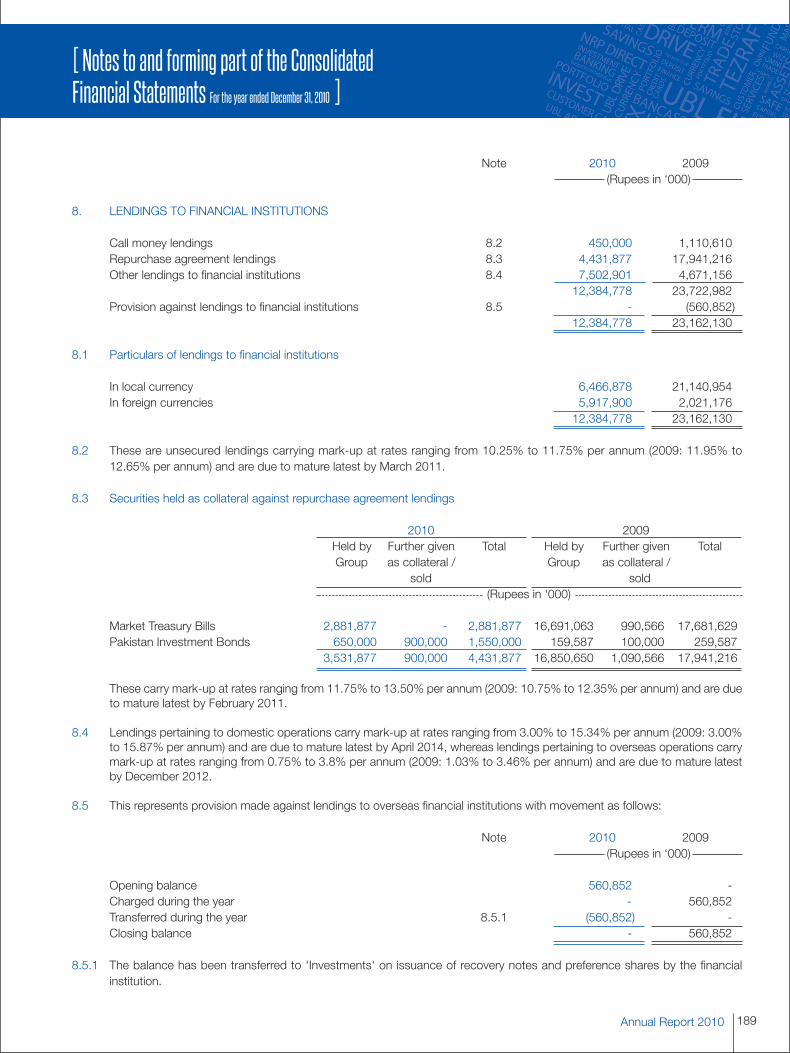
189Annual Report 2010
Note 2010 2009(Rupees in ‘000)
8. LENDINGS TO FINANCIAL INSTITUTIONS
Call money lendings 8.2 450,000 1,110,610Repurchase agreement lendings 8.3 4,431,877 17,941,216Other lendings to financial institutions 8.4 7,502,901 4,671,156
12,384,778 23,722,982Provision against lendings to financial institutions 8.5 - (560,852)
12,384,778 23,162,130
8.1 Particulars of lendings to financial institutions
In local currency 6,466,878 21,140,954In foreign currencies 5,917,900 2,021,176
12,384,778 23,162,130
8.2 These are unsecured lendings carrying mark-up at rates ranging from 10.25% to 11.75% per annum (2009: 11.95% to12.65% per annum) and are due to mature latest by March 2011.
8.3 Securities held as collateral against repurchase agreement lendings
2010 2009Held by Further given Total Held by Further given TotalGroup as collateral / Group as collateral /
sold sold(Rupees in '000)
Market Treasury Bills 2,881,877 - 2,881,877 16,691,063 990,566 17,681,629Pakistan Investment Bonds 650,000 900,000 1,550,000 159,587 100,000 259,587
3,531,877 900,000 4,431,877 16,850,650 1,090,566 17,941,216
These carry mark-up at rates ranging from 11.75% to 13.50% per annum (2009: 10.75% to 12.35% per annum) and are dueto mature latest by February 2011.
8.4 Lendings pertaining to domestic operations carry mark-up at rates ranging from 3.00% to 15.34% per annum (2009: 3.00%to 15.87% per annum) and are due to mature latest by April 2014, whereas lendings pertaining to overseas operations carrymark-up at rates ranging from 0.75% to 3.8% per annum (2009: 1.03% to 3.46% per annum) and are due to mature latestby December 2012.
8.5 This represents provision made against lendings to overseas financial institutions with movement as follows:
Note 2010 2009(Rupees in ‘000)
Opening balance 560,852 -Charged during the year - 560,852Transferred during the year 8.5.1 (560,852) -Closing balance - 560,852
8.5.1 The balance has been transferred to 'Investments' on issuance of recovery notes and preference shares by the financialinstitution.
[ Notes to and forming part of the ConsolidatedFinancial Statements For the year ended December 31, 2010 ]
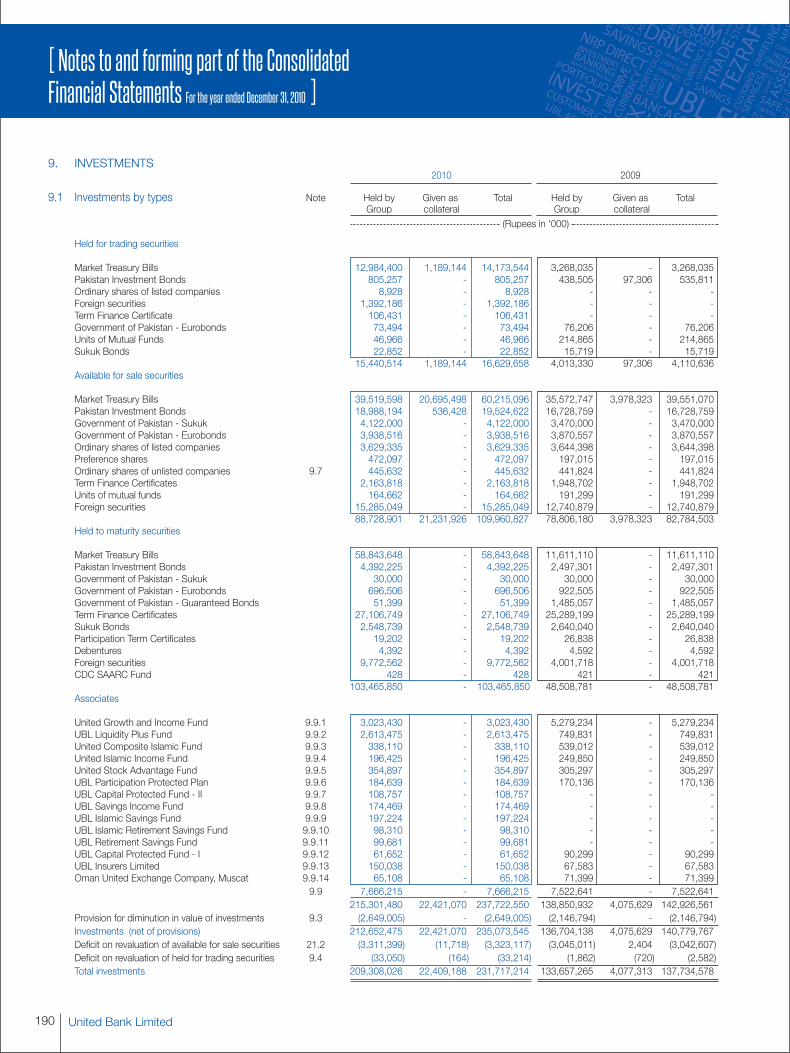
United Bank Limited190
9. INVESTMENTS2010 2009
9.1 Investments by types Note Held by Given as Total Held by Given as TotalGroup collateral Group collateral
(Rupees in '000)
Held for trading securities
Market Treasury Bills 12,984,400 1,189,144 14,173,544 3,268,035 - 3,268,035Pakistan Investment Bonds 805,257 - 805,257 438,505 97,306 535,811Ordinary shares of listed companies 8,928 - 8,928 - - -Foreign securities 1,392,186 - 1,392,186 - - -Term Finance Certificate 106,431 - 106,431 - - -Government of Pakistan - Eurobonds 73,494 - 73,494 76,206 - 76,206Units of Mutual Funds 46,966 - 46,966 214,865 - 214,865Sukuk Bonds 22,852 - 22,852 15,719 - 15,719
15,440,514 1,189,144 16,629,658 4,013,330 97,306 4,110,636Available for sale securities
Market Treasury Bills 39,519,598 20,695,498 60,215,096 35,572,747 3,978,323 39,551,070Pakistan Investment Bonds 18,988,194 536,428 19,524,622 16,728,759 - 16,728,759Government of Pakistan - Sukuk 4,122,000 - 4,122,000 3,470,000 - 3,470,000Government of Pakistan - Eurobonds 3,938,516 - 3,938,516 3,870,557 - 3,870,557Ordinary shares of listed companies 3,629,335 - 3,629,335 3,644,398 - 3,644,398Preference shares 472,097 - 472,097 197,015 - 197,015Ordinary shares of unlisted companies 9.7 445,632 - 445,632 441,824 - 441,824Term Finance Certificates 2,163,818 - 2,163,818 1,948,702 - 1,948,702Units of mutual funds 164,662 - 164,662 191,299 - 191,299Foreign securities 15,285,049 - 15,285,049 12,740,879 - 12,740,879
88,728,901 21,231,926 109,960,827 78,806,180 3,978,323 82,784,503Held to maturity securities
Market Treasury Bills 58,843,648 - 58,843,648 11,611,110 - 11,611,110Pakistan Investment Bonds 4,392,225 - 4,392,225 2,497,301 - 2,497,301Government of Pakistan - Sukuk 30,000 - 30,000 30,000 - 30,000Government of Pakistan - Eurobonds 696,506 - 696,506 922,505 - 922,505Government of Pakistan - Guaranteed Bonds 51,399 - 51,399 1,485,057 - 1,485,057Term Finance Certificates 27,106,749 - 27,106,749 25,289,199 - 25,289,199Sukuk Bonds 2,548,739 - 2,548,739 2,640,040 - 2,640,040Participation Term Certificates 19,202 - 19,202 26,838 - 26,838Debentures 4,392 - 4,392 4,592 - 4,592Foreign securities 9,772,562 - 9,772,562 4,001,718 - 4,001,718CDC SAARC Fund 428 - 428 421 - 421
103,465,850 - 103,465,850 48,508,781 - 48,508,781Associates
United Growth and Income Fund 9.9.1 3,023,430 - 3,023,430 5,279,234 - 5,279,234UBL Liquidity Plus Fund 9.9.2 2,613,475 - 2,613,475 749,831 - 749,831United Composite Islamic Fund 9.9.3 338,110 - 338,110 539,012 - 539,012United Islamic Income Fund 9.9.4 196,425 - 196,425 249,850 - 249,850United Stock Advantage Fund 9.9.5 354,897 - 354,897 305,297 - 305,297UBL Participation Protected Plan 9.9.6 184,639 - 184,639 170,136 - 170,136UBL Capital Protected Fund - II 9.9.7 108,757 - 108,757 - - -UBL Savings Income Fund 9.9.8 174,469 - 174,469 - - -UBL Islamic Savings Fund 9.9.9 197,224 - 197,224 - - -UBL Islamic Retirement Savings Fund 9.9.10 98,310 - 98,310 - - -UBL Retirement Savings Fund 9.9.11 99,681 - 99,681 - - -UBL Capital Protected Fund - I 9.9.12 61,652 - 61,652 90,299 - 90,299UBL Insurers Limited 9.9.13 150,038 - 150,038 67,583 - 67,583Oman United Exchange Company, Muscat 9.9.14 65,108 - 65,108 71,399 - 71,399
9.9 7,666,215 - 7,666,215 7,522,641 - 7,522,641215,301,480 22,421,070 237,722,550 138,850,932 4,075,629 142,926,561
Provision for diminution in value of investments 9.3 (2,649,005) - (2,649,005) (2,146,794) - (2,146,794)Investments (net of provisions) 212,652,475 22,421,070 235,073,545 136,704,138 4,075,629 140,779,767Deficit on revaluation of available for sale securities 21.2 (3,311,399) (11,718) (3,323,117) (3,045,011) 2,404 (3,042,607)Deficit on revaluation of held for trading securities 9.4 (33,050) (164) (33,214) (1,862) (720) (2,582)Total investments 209,308,026 22,409,188 231,717,214 133,657,265 4,077,313 137,734,578
[ Notes to and forming part of the ConsolidatedFinancial Statements For the year ended December 31, 2010 ]
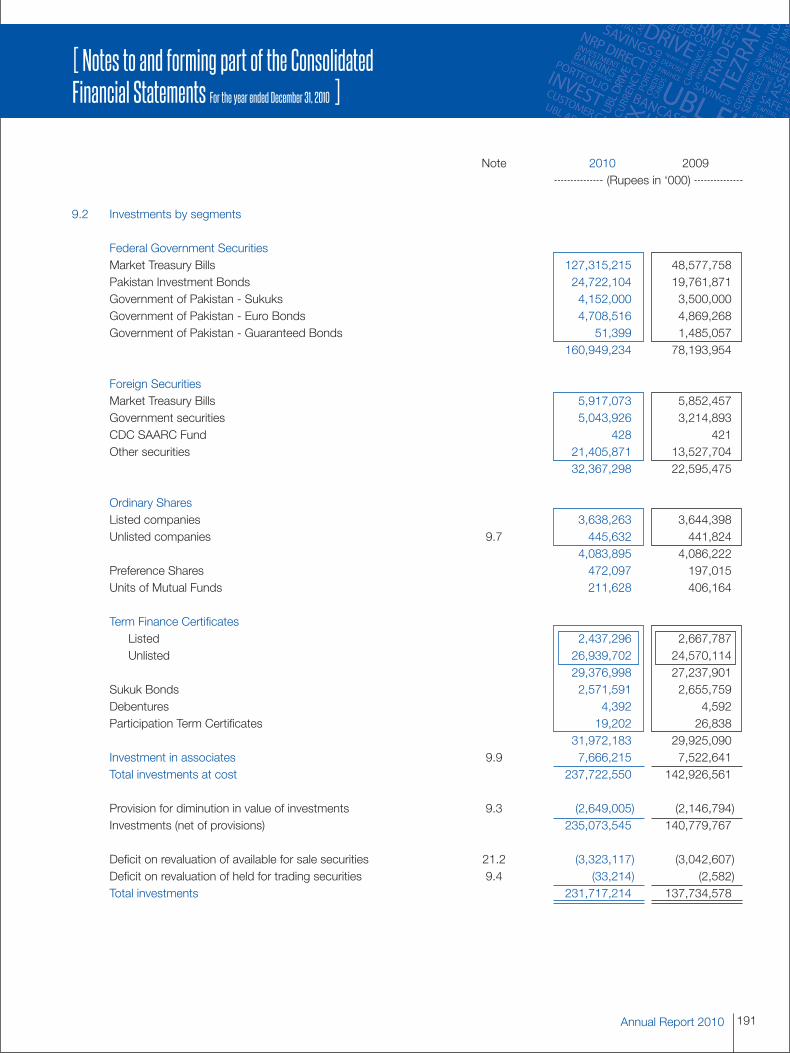
191Annual Report 2010
Note 2010 2009(Rupees in ‘000)
9.2 Investments by segments
Federal Government SecuritiesMarket Treasury Bills 127,315,215 48,577,758Pakistan Investment Bonds 24,722,104 19,761,871Government of Pakistan - Sukuks 4,152,000 3,500,000Government of Pakistan - Euro Bonds 4,708,516 4,869,268Government of Pakistan - Guaranteed Bonds 51,399 1,485,057
160,949,234 78,193,954
Foreign SecuritiesMarket Treasury Bills 5,917,073 5,852,457Government securities 5,043,926 3,214,893CDC SAARC Fund 428 421Other securities 21,405,871 13,527,704
32,367,298 22,595,475
Ordinary SharesListed companies 3,638,263 3,644,398Unlisted companies 9.7 445,632 441,824
4,083,895 4,086,222Preference Shares 472,097 197,015Units of Mutual Funds 211,628 406,164
Term Finance CertificatesListed 2,437,296 2,667,787Unlisted 26,939,702 24,570,114
29,376,998 27,237,901Sukuk Bonds 2,571,591 2,655,759Debentures 4,392 4,592Participation Term Certificates 19,202 26,838
31,972,183 29,925,090Investment in associates 9.9 7,666,215 7,522,641Total investments at cost 237,722,550 142,926,561
Provision for diminution in value of investments 9.3 (2,649,005) (2,146,794)Investments (net of provisions) 235,073,545 140,779,767
Deficit on revaluation of available for sale securities 21.2 (3,323,117) (3,042,607)Deficit on revaluation of held for trading securities 9.4 (33,214) (2,582)Total investments 231,717,214 137,734,578
[ Notes to and forming part of the ConsolidatedFinancial Statements For the year ended December 31, 2010 ]
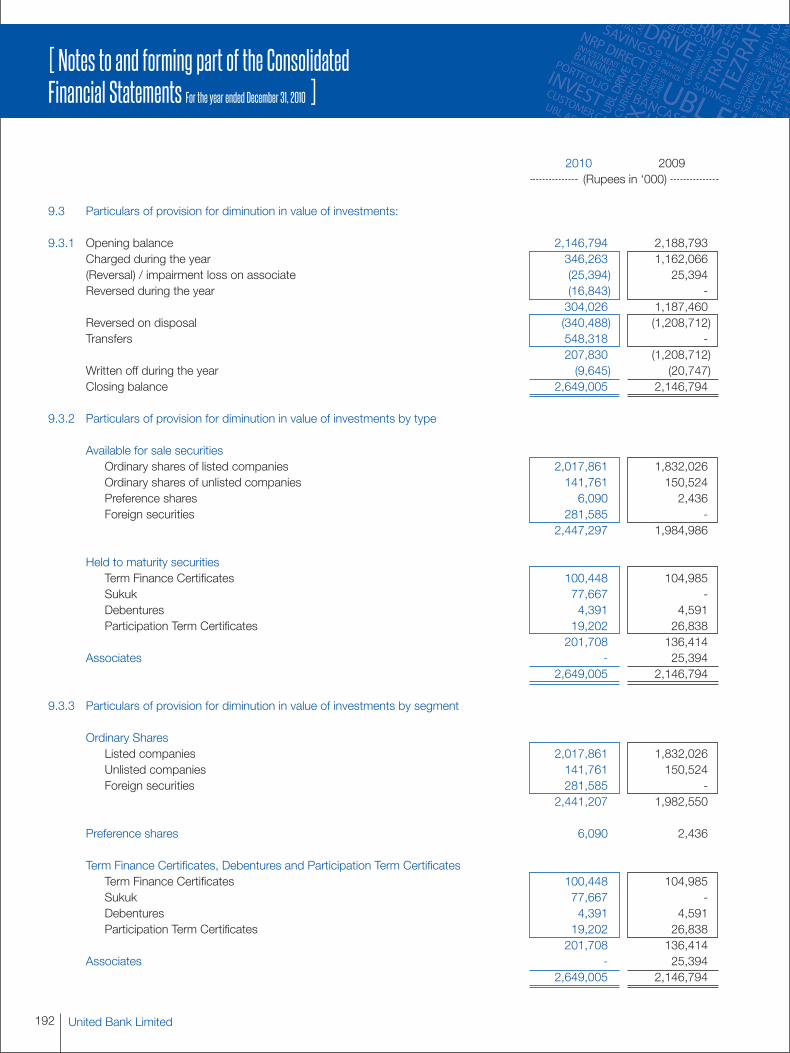
United Bank Limited192
2010 2009(Rupees in ‘000)
9.3 Particulars of provision for diminution in value of investments:
9.3.1 Opening balance 2,146,794 2,188,793Charged during the year 346,263 1,162,066(Reversal) / impairment loss on associate (25,394) 25,394Reversed during the year (16,843) -
304,026 1,187,460Reversed on disposal (340,488) (1,208,712)Transfers 548,318 -
207,830 (1,208,712)Written off during the year (9,645) (20,747)Closing balance 2,649,005 2,146,794
9.3.2 Particulars of provision for diminution in value of investments by type
Available for sale securitiesOrdinary shares of listed companies 2,017,861 1,832,026Ordinary shares of unlisted companies 141,761 150,524Preference shares 6,090 2,436Foreign securities 281,585 -
2,447,297 1,984,986
Held to maturity securitiesTerm Finance Certificates 100,448 104,985Sukuk 77,667 -Debentures 4,391 4,591Participation Term Certificates 19,202 26,838
201,708 136,414Associates - 25,394
2,649,005 2,146,794
9.3.3 Particulars of provision for diminution in value of investments by segment
Ordinary SharesListed companies 2,017,861 1,832,026Unlisted companies 141,761 150,524Foreign securities 281,585 -
2,441,207 1,982,550
Preference shares 6,090 2,436
Term Finance Certificates, Debentures and Participation Term CertificatesTerm Finance Certificates 100,448 104,985Sukuk 77,667 -Debentures 4,391 4,591Participation Term Certificates 19,202 26,838
201,708 136,414Associates - 25,394
2,649,005 2,146,794
[ Notes to and forming part of the ConsolidatedFinancial Statements For the year ended December 31, 2010 ]
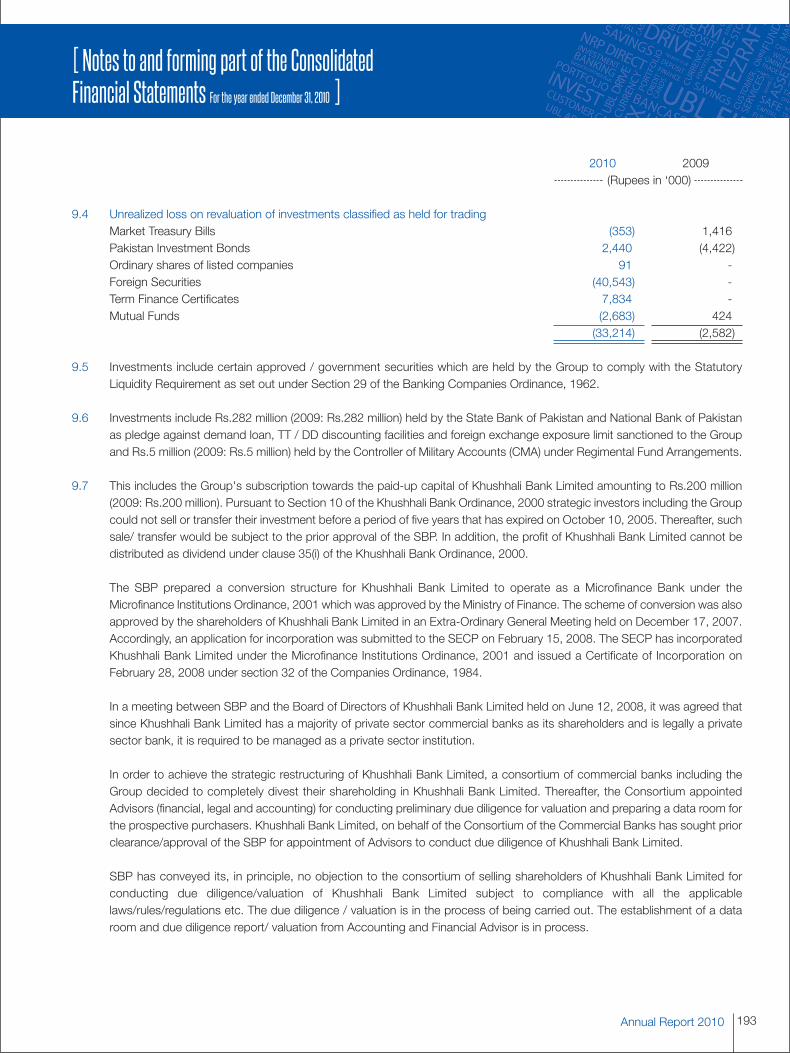
193Annual Report 2010
2010 2009(Rupees in ‘000)
9.4 Unrealized loss on revaluation of investments classified as held for tradingMarket Treasury Bills (353) 1,416Pakistan Investment Bonds 2,440 (4,422)Ordinary shares of listed companies 91 -Foreign Securities (40,543) -Term Finance Certificates 7,834 -Mutual Funds (2,683) 424
(33,214) (2,582)
9.5 Investments include certain approved / government securities which are held by the Group to comply with the StatutoryLiquidity Requirement as set out under Section 29 of the Banking Companies Ordinance, 1962.
9.6 Investments include Rs.282 million (2009: Rs.282 million) held by the State Bank of Pakistan and National Bank of Pakistanas pledge against demand loan, TT / DD discounting facilities and foreign exchange exposure limit sanctioned to the Groupand Rs.5 million (2009: Rs.5 million) held by the Controller of Military Accounts (CMA) under Regimental Fund Arrangements.
9.7 This includes the Group's subscription towards the paid-up capital of Khushhali Bank Limited amounting to Rs.200 million(2009: Rs.200 million). Pursuant to Section 10 of the Khushhali Bank Ordinance, 2000 strategic investors including the Groupcould not sell or transfer their investment before a period of five years that has expired on October 10, 2005. Thereafter, suchsale/ transfer would be subject to the prior approval of the SBP. In addition, the profit of Khushhali Bank Limited cannot bedistributed as dividend under clause 35(i) of the Khushhali Bank Ordinance, 2000.
The SBP prepared a conversion structure for Khushhali Bank Limited to operate as a Microfinance Bank under theMicrofinance Institutions Ordinance, 2001 which was approved by the Ministry of Finance. The scheme of conversion was alsoapproved by the shareholders of Khushhali Bank Limited in an Extra-Ordinary General Meeting held on December 17, 2007.Accordingly, an application for incorporation was submitted to the SECP on February 15, 2008. The SECP has incorporatedKhushhali Bank Limited under the Microfinance Institutions Ordinance, 2001 and issued a Certificate of Incorporation onFebruary 28, 2008 under section 32 of the Companies Ordinance, 1984.
In a meeting between SBP and the Board of Directors of Khushhali Bank Limited held on June 12, 2008, it was agreed thatsince Khushhali Bank Limited has a majority of private sector commercial banks as its shareholders and is legally a privatesector bank, it is required to be managed as a private sector institution.
In order to achieve the strategic restructuring of Khushhali Bank Limited, a consortium of commercial banks including theGroup decided to completely divest their shareholding in Khushhali Bank Limited. Thereafter, the Consortium appointedAdvisors (financial, legal and accounting) for conducting preliminary due diligence for valuation and preparing a data room forthe prospective purchasers. Khushhali Bank Limited, on behalf of the Consortium of the Commercial Banks has sought priorclearance/approval of the SBP for appointment of Advisors to conduct due diligence of Khushhali Bank Limited.
SBP has conveyed its, in principle, no objection to the consortium of selling shareholders of Khushhali Bank Limited forconducting due diligence/valuation of Khushhali Bank Limited subject to compliance with all the applicablelaws/rules/regulations etc. The due diligence / valuation is in the process of being carried out. The establishment of a dataroom and due diligence report/ valuation from Accounting and Financial Advisor is in process.
[ Notes to and forming part of the ConsolidatedFinancial Statements For the year ended December 31, 2010 ]
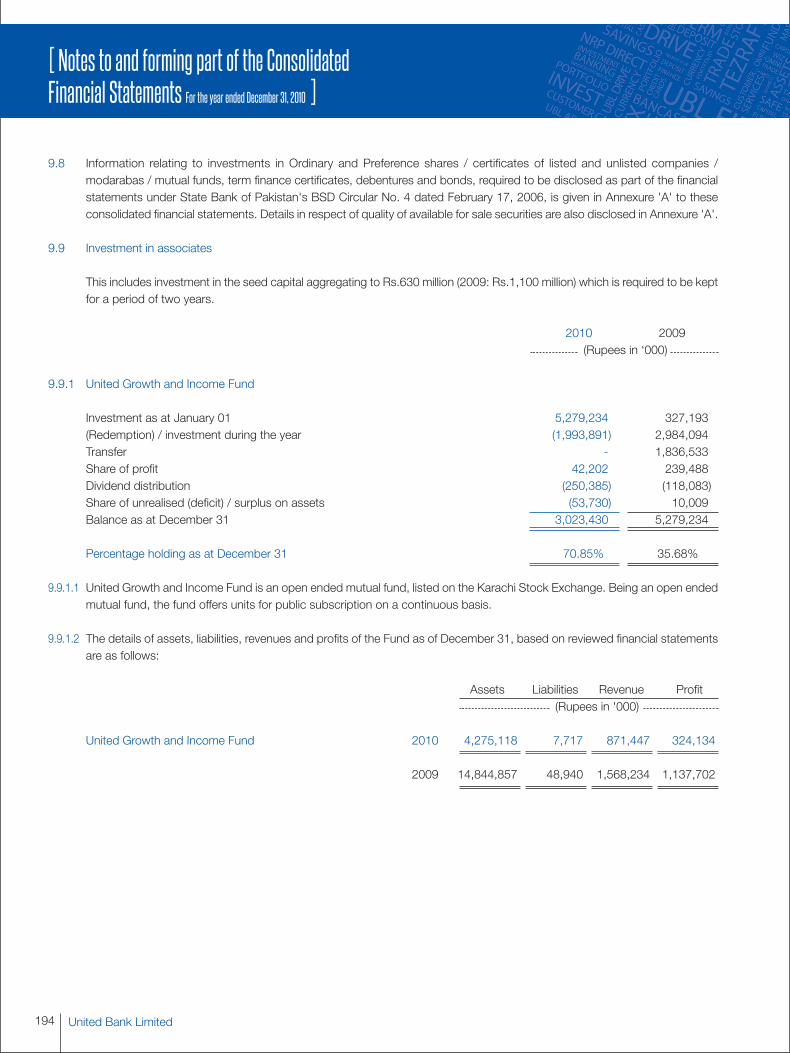
United Bank Limited194
9.8 Information relating to investments in Ordinary and Preference shares / certificates of listed and unlisted companies /modarabas / mutual funds, term finance certificates, debentures and bonds, required to be disclosed as part of the financialstatements under State Bank of Pakistan's BSD Circular No. 4 dated February 17, 2006, is given in Annexure 'A' to theseconsolidated financial statements. Details in respect of quality of available for sale securities are also disclosed in Annexure 'A'.
9.9 Investment in associates
This includes investment in the seed capital aggregating to Rs.630 million (2009: Rs.1,100 million) which is required to be keptfor a period of two years.
2010 2009(Rupees in ‘000)
9.9.1 United Growth and Income Fund
Investment as at January 01 5,279,234 327,193(Redemption) / investment during the year (1,993,891) 2,984,094Transfer - 1,836,533Share of profit 42,202 239,488Dividend distribution (250,385) (118,083)Share of unrealised (deficit) / surplus on assets (53,730) 10,009Balance as at December 31 3,023,430 5,279,234
Percentage holding as at December 31 70.85% 35.68%
9.9.1.1 United Growth and Income Fund is an open ended mutual fund, listed on the Karachi Stock Exchange. Being an open endedmutual fund, the fund offers units for public subscription on a continuous basis.
9.9.1.2 The details of assets, liabilities, revenues and profits of the Fund as of December 31, based on reviewed financial statementsare as follows:
Assets Liabilities Revenue Profit(Rupees in '000)
United Growth and Income Fund 2010 4,275,118 7,717 871,447 324,134
2009 14,844,857 48,940 1,568,234 1,137,702
[ Notes to and forming part of the ConsolidatedFinancial Statements For the year ended December 31, 2010 ]
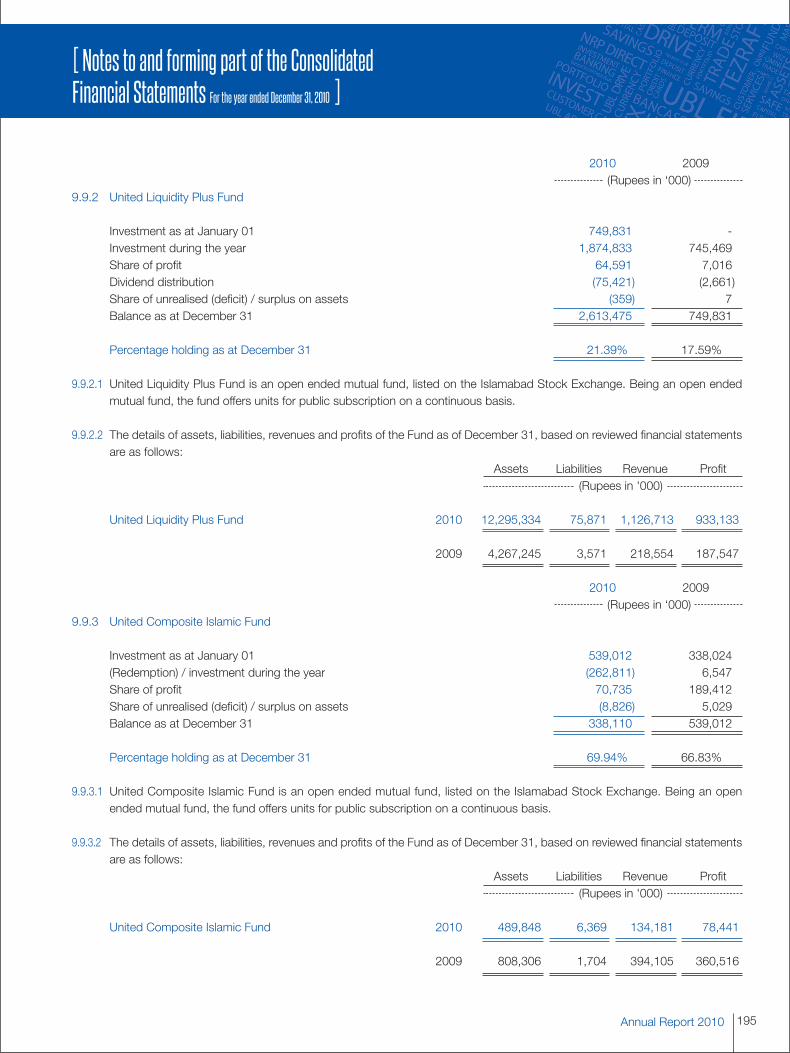
195Annual Report 2010
2010 2009(Rupees in ‘000)
9.9.2 United Liquidity Plus Fund
Investment as at January 01 749,831 -Investment during the year 1,874,833 745,469Share of profit 64,591 7,016Dividend distribution (75,421) (2,661)Share of unrealised (deficit) / surplus on assets (359) 7Balance as at December 31 2,613,475 749,831
Percentage holding as at December 31 21.39% 17.59%
9.9.2.1 United Liquidity Plus Fund is an open ended mutual fund, listed on the Islamabad Stock Exchange. Being an open endedmutual fund, the fund offers units for public subscription on a continuous basis.
9.9.2.2 The details of assets, liabilities, revenues and profits of the Fund as of December 31, based on reviewed financial statementsare as follows:
Assets Liabilities Revenue Profit(Rupees in '000)
United Liquidity Plus Fund 2010 12,295,334 75,871 1,126,713 933,133
2009 4,267,245 3,571 218,554 187,547
2010 2009(Rupees in ‘000)
9.9.3 United Composite Islamic Fund
Investment as at January 01 539,012 338,024(Redemption) / investment during the year (262,811) 6,547Share of profit 70,735 189,412Share of unrealised (deficit) / surplus on assets (8,826) 5,029Balance as at December 31 338,110 539,012
Percentage holding as at December 31 69.94% 66.83%
9.9.3.1 United Composite Islamic Fund is an open ended mutual fund, listed on the Islamabad Stock Exchange. Being an openended mutual fund, the fund offers units for public subscription on a continuous basis.
9.9.3.2 The details of assets, liabilities, revenues and profits of the Fund as of December 31, based on reviewed financial statementsare as follows:
Assets Liabilities Revenue Profit(Rupees in '000)
United Composite Islamic Fund 2010 489,848 6,369 134,181 78,441
2009 808,306 1,704 394,105 360,516
[ Notes to and forming part of the ConsolidatedFinancial Statements For the year ended December 31, 2010 ]
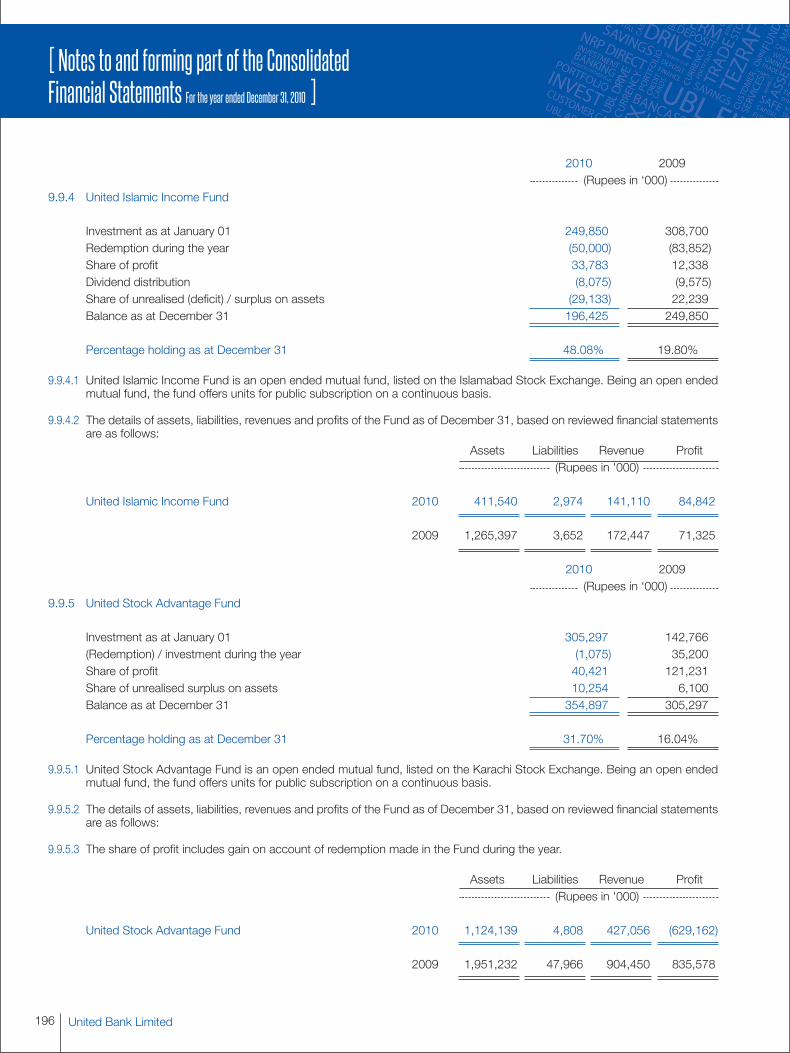
United Bank Limited196
2010 2009(Rupees in ‘000)
9.9.4 United Islamic Income Fund
Investment as at January 01 249,850 308,700Redemption during the year (50,000) (83,852)Share of profit 33,783 12,338Dividend distribution (8,075) (9,575)Share of unrealised (deficit) / surplus on assets (29,133) 22,239Balance as at December 31 196,425 249,850
Percentage holding as at December 31 48.08% 19.80%
9.9.4.1 United Islamic Income Fund is an open ended mutual fund, listed on the Islamabad Stock Exchange. Being an open endedmutual fund, the fund offers units for public subscription on a continuous basis.
9.9.4.2 The details of assets, liabilities, revenues and profits of the Fund as of December 31, based on reviewed financial statementsare as follows:
Assets Liabilities Revenue Profit(Rupees in '000)
United Islamic Income Fund 2010 411,540 2,974 141,110 84,842
2009 1,265,397 3,652 172,447 71,325
2010 2009(Rupees in ‘000)
9.9.5 United Stock Advantage Fund
Investment as at January 01 305,297 142,766(Redemption) / investment during the year (1,075) 35,200Share of profit 40,421 121,231Share of unrealised surplus on assets 10,254 6,100Balance as at December 31 354,897 305,297
Percentage holding as at December 31 31.70% 16.04%
9.9.5.1 United Stock Advantage Fund is an open ended mutual fund, listed on the Karachi Stock Exchange. Being an open endedmutual fund, the fund offers units for public subscription on a continuous basis.
9.9.5.2 The details of assets, liabilities, revenues and profits of the Fund as of December 31, based on reviewed financial statementsare as follows:
9.9.5.3 The share of profit includes gain on account of redemption made in the Fund during the year.
Assets Liabilities Revenue Profit(Rupees in '000)
United Stock Advantage Fund 2010 1,124,139 4,808 427,056 (629,162)
2009 1,951,232 47,966 904,450 835,578
[ Notes to and forming part of the ConsolidatedFinancial Statements For the year ended December 31, 2010 ]

197Annual Report 2010
2010 2009(Rupees in ‘000)
9.9.6 UBL Participation Protected Plan
Investment as at January 01 170,136 138,887Share of profit 14,503 31,249Balance as at December 31 184,639 170,136
9.9.6.1 UBL Participation Protected Plan is an open ended administrative plan with the objective of earning potentially high returnsthrough dynamic asset allocation between equity and fixed income investments. The life of the plan is 3 years.
2010 2009(Rupees in ‘000)
9.9.7 UBL Capital Protected Fund - II
Investment as at January 01 - -Investment during the year 103,459 -Share of profit 5,298 -Balance as at December 31 108,757 -
Percentage holding as at December 31 53.04% -
9.9.7.1 UBL Capital Protected Fund II is an open ended capital protected fund, listed on the Islamabad Stock Exchange. Being an openended mutual fund, the fund offers units for public subscription on a continuous basis.
9.9.7.2 The details of assets, liabilities, revenues and profits of the Fund as of December 31, based on reviewed financial statementsare as follows:
Assets Liabilities Revenue Profit(Rupees in '000)
UBL Capital Protected Fund - II 2010 206,169 1,133 14,305 10,594
2010 2009(Rupees in ‘000)
9.9.8 UBL Savings Income Fund
Investment as at January 01 - -Investment during the year 169,577 -Share of profit 4,898 -Share of unrealised deficit on assets (6) -Balance as at December 31 174,469 -
Percentage holding as at December 31 19.22% -
9.9.8.1 UBL Savings Income Fund is an open ended mutual fund, listed on the Islamabad Stock Exchange. Being an open endedmutual fund, the fund offers units for public subscription on a continuous basis.
9.9.8.2 The details of assets, liabilities, revenues and profits of the Fund as of December 31, based on reviewed financial statementsare as follows:
Assets Liabilities Revenue Profit(Rupees in '000)
UBL Savings Income Fund 2010 923,788 16,222 28,611 21,305
[ Notes to and forming part of the ConsolidatedFinancial Statements For the year ended December 31, 2010 ]
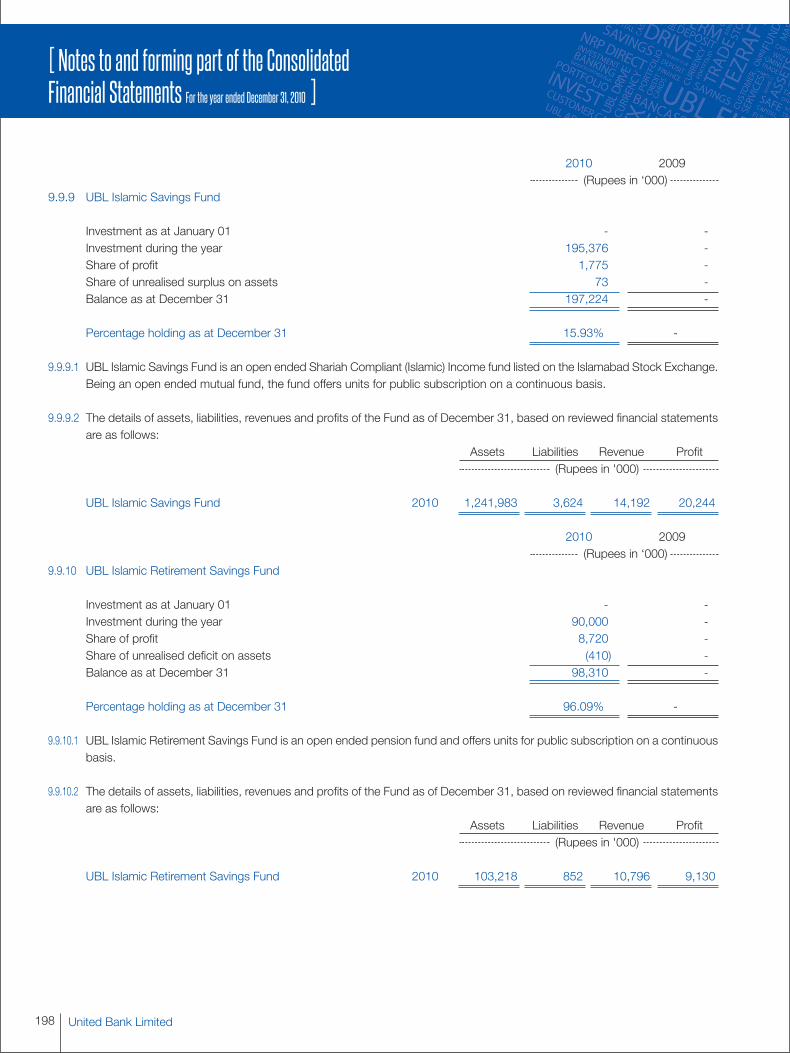
United Bank Limited198
2010 2009(Rupees in ‘000)
9.9.9 UBL Islamic Savings Fund
Investment as at January 01 - -Investment during the year 195,376 -Share of profit 1,775 -Share of unrealised surplus on assets 73 -Balance as at December 31 197,224 -
Percentage holding as at December 31 15.93% -
9.9.9.1 UBL Islamic Savings Fund is an open ended Shariah Compliant (Islamic) Income fund listed on the Islamabad Stock Exchange.Being an open ended mutual fund, the fund offers units for public subscription on a continuous basis.
9.9.9.2 The details of assets, liabilities, revenues and profits of the Fund as of December 31, based on reviewed financial statementsare as follows:
Assets Liabilities Revenue Profit(Rupees in '000)
UBL Islamic Savings Fund 2010 1,241,983 3,624 14,192 20,244
2010 2009(Rupees in ‘000)
9.9.10 UBL Islamic Retirement Savings Fund
Investment as at January 01 - -Investment during the year 90,000 -Share of profit 8,720 -Share of unrealised deficit on assets (410) -Balance as at December 31 98,310 -
Percentage holding as at December 31 96.09% -
9.9.10.1 UBL Islamic Retirement Savings Fund is an open ended pension fund and offers units for public subscription on a continuousbasis.
9.9.10.2 The details of assets, liabilities, revenues and profits of the Fund as of December 31, based on reviewed financial statementsare as follows:
Assets Liabilities Revenue Profit(Rupees in '000)
UBL Islamic Retirement Savings Fund 2010 103,218 852 10,796 9,130
[ Notes to and forming part of the ConsolidatedFinancial Statements For the year ended December 31, 2010 ]
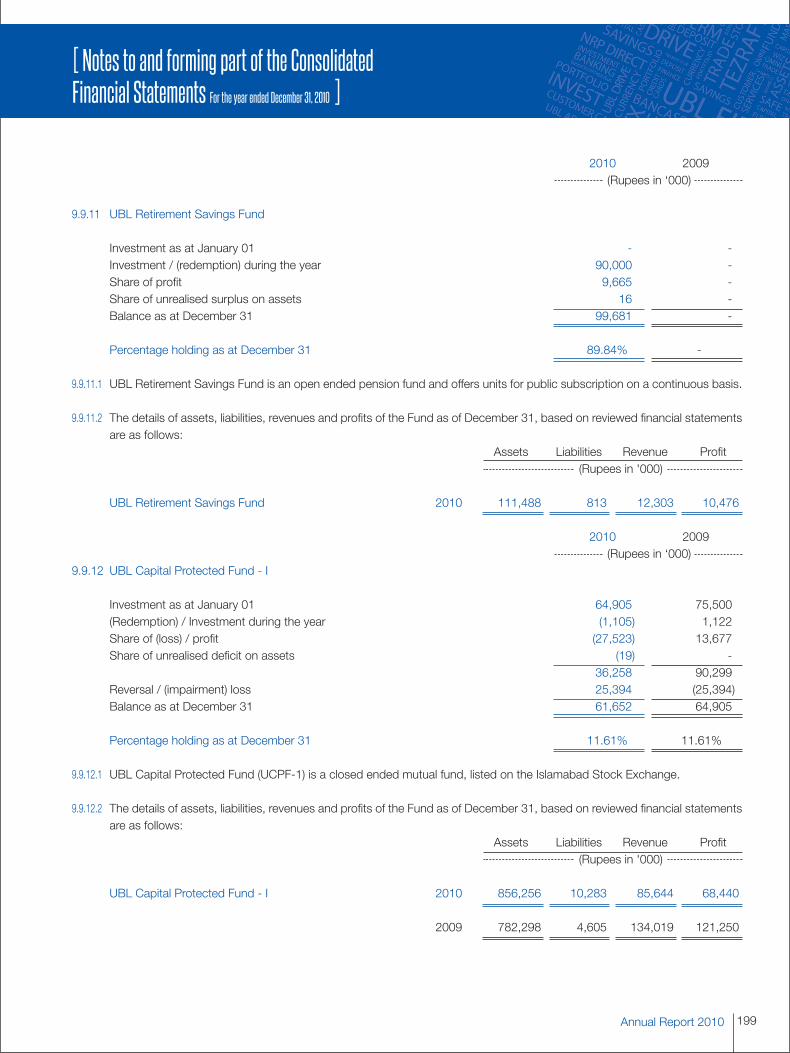
199Annual Report 2010
2010 2009(Rupees in ‘000)
9.9.11 UBL Retirement Savings Fund
Investment as at January 01 - -Investment / (redemption) during the year 90,000 -Share of profit 9,665 -Share of unrealised surplus on assets 16 -Balance as at December 31 99,681 -
Percentage holding as at December 31 89.84% -
9.9.11.1 UBL Retirement Savings Fund is an open ended pension fund and offers units for public subscription on a continuous basis.
9.9.11.2 The details of assets, liabilities, revenues and profits of the Fund as of December 31, based on reviewed financial statementsare as follows:
Assets Liabilities Revenue Profit(Rupees in '000)
UBL Retirement Savings Fund 2010 111,488 813 12,303 10,476
2010 2009(Rupees in ‘000)
9.9.12 UBL Capital Protected Fund - I
Investment as at January 01 64,905 75,500(Redemption) / Investment during the year (1,105) 1,122Share of (loss) / profit (27,523) 13,677Share of unrealised deficit on assets (19) -
36,258 90,299Reversal / (impairment) loss 25,394 (25,394)Balance as at December 31 61,652 64,905
Percentage holding as at December 31 11.61% 11.61%
9.9.12.1 UBL Capital Protected Fund (UCPF-1) is a closed ended mutual fund, listed on the Islamabad Stock Exchange.
9.9.12.2 The details of assets, liabilities, revenues and profits of the Fund as of December 31, based on reviewed financial statementsare as follows:
Assets Liabilities Revenue Profit(Rupees in '000)
UBL Capital Protected Fund - I 2010 856,256 10,283 85,644 68,440
2009 782,298 4,605 134,019 121,250
[ Notes to and forming part of the ConsolidatedFinancial Statements For the year ended December 31, 2010 ]
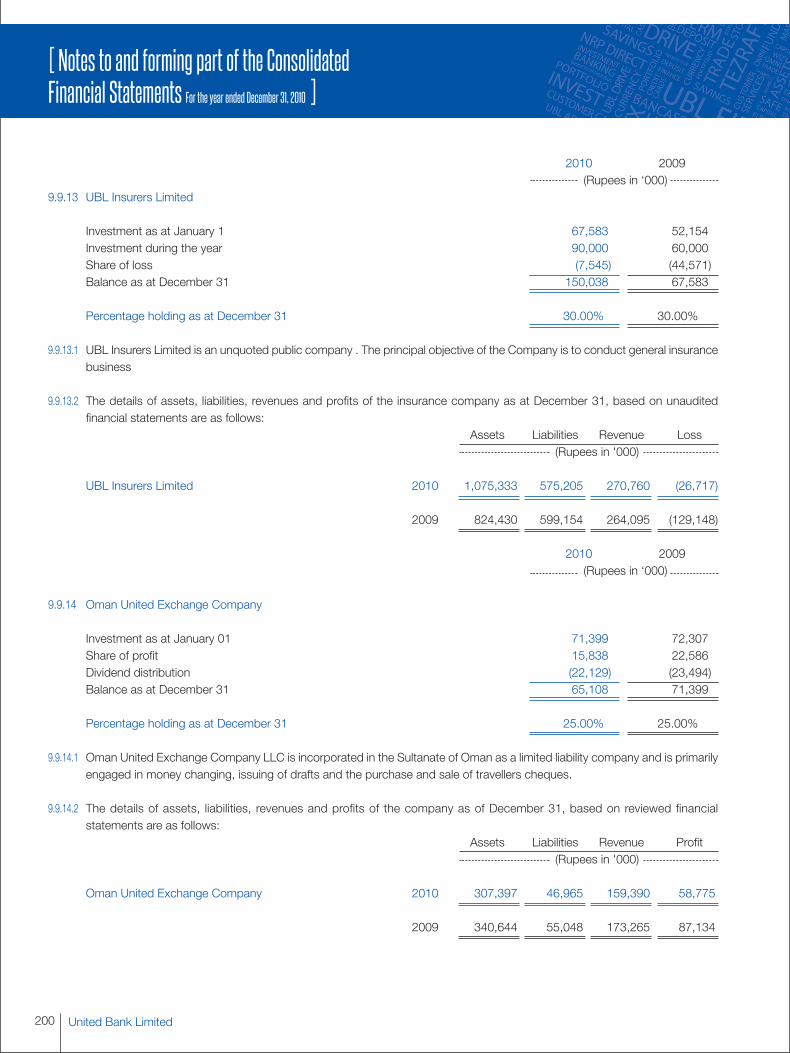
United Bank Limited200
2010 2009(Rupees in ‘000)
9.9.13 UBL Insurers Limited
Investment as at January 1 67,583 52,154Investment during the year 90,000 60,000Share of loss (7,545) (44,571)Balance as at December 31 150,038 67,583
Percentage holding as at December 31 30.00% 30.00%
9.9.13.1 UBL Insurers Limited is an unquoted public company . The principal objective of the Company is to conduct general insurancebusiness
9.9.13.2 The details of assets, liabilities, revenues and profits of the insurance company as at December 31, based on unauditedfinancial statements are as follows:
Assets Liabilities Revenue Loss(Rupees in '000)
UBL Insurers Limited 2010 1,075,333 575,205 270,760 (26,717)
2009 824,430 599,154 264,095 (129,148)
2010 2009(Rupees in ‘000)
9.9.14 Oman United Exchange Company
Investment as at January 01 71,399 72,307Share of profit 15,838 22,586Dividend distribution (22,129) (23,494)Balance as at December 31 65,108 71,399
Percentage holding as at December 31 25.00% 25.00%
9.9.14.1 Oman United Exchange Company LLC is incorporated in the Sultanate of Oman as a limited liability company and is primarilyengaged in money changing, issuing of drafts and the purchase and sale of travellers cheques.
9.9.14.2 The details of assets, liabilities, revenues and profits of the company as of December 31, based on reviewed financialstatements are as follows:
Assets Liabilities Revenue Profit(Rupees in '000)
Oman United Exchange Company 2010 307,397 46,965 159,390 58,775
2009 340,644 55,048 173,265 87,134
[ Notes to and forming part of the ConsolidatedFinancial Statements For the year ended December 31, 2010 ]
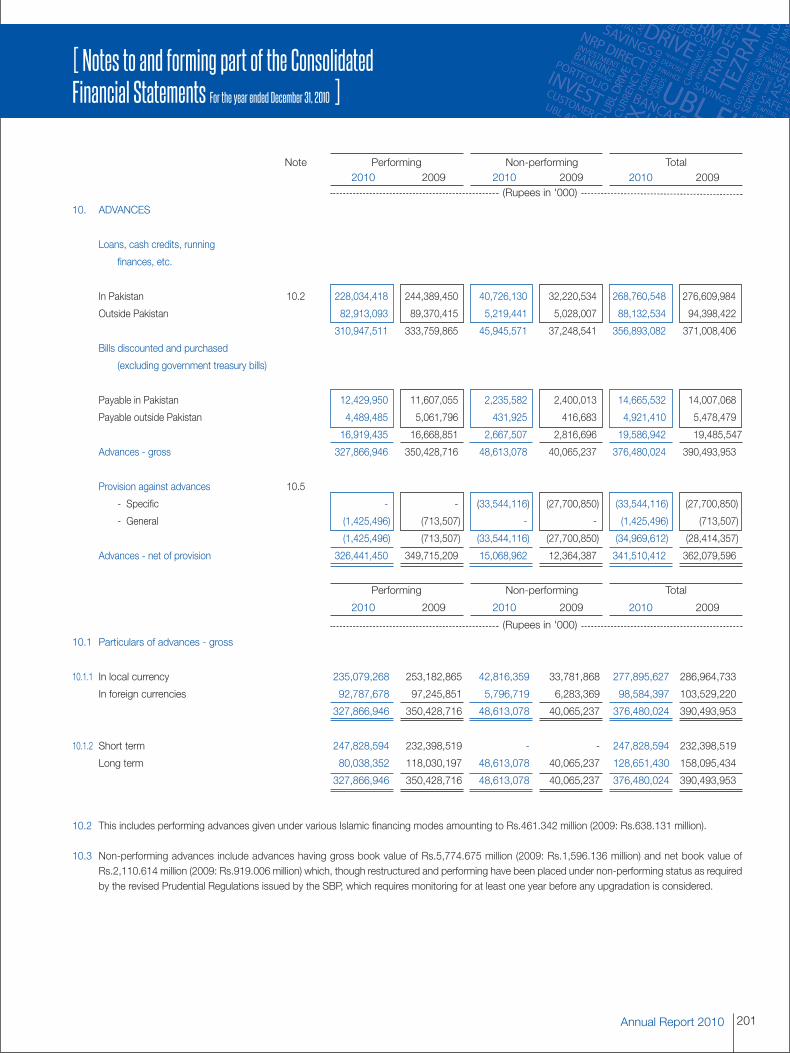
201Annual Report 2010
[ Notes to and forming part of the ConsolidatedFinancial Statements For the year ended December 31, 2010 ]
Note Performing Non-performing Total2010 2009 2010 2009 2010 2009
(Rupees in '000)
10. ADVANCES
Loans, cash credits, running
finances, etc.
In Pakistan 10.2 228,034,418 244,389,450 40,726,130 32,220,534 268,760,548 276,609,984
Outside Pakistan 82,913,093 89,370,415 5,219,441 5,028,007 88,132,534 94,398,422
310,947,511 333,759,865 45,945,571 37,248,541 356,893,082 371,008,406
Bills discounted and purchased
(excluding government treasury bills)
Payable in Pakistan 12,429,950 11,607,055 2,235,582 2,400,013 14,665,532 14,007,068
Payable outside Pakistan 4,489,485 5,061,796 431,925 416,683 4,921,410 5,478,479
16,919,435 16,668,851 2,667,507 2,816,696 19,586,942 19,485,547
Advances - gross 327,866,946 350,428,716 48,613,078 40,065,237 376,480,024 390,493,953
Provision against advances 10.5
- Specific - - (33,544,116) (27,700,850) (33,544,116) (27,700,850)
- General (1,425,496) (713,507) - - (1,425,496) (713,507)
(1,425,496) (713,507) (33,544,116) (27,700,850) (34,969,612) (28,414,357)
Advances - net of provision 326,441,450 349,715,209 15,068,962 12,364,387 341,510,412 362,079,596
Performing Non-performing Total
2010 2009 2010 2009 2010 2009
(Rupees in '000)
10.1 Particulars of advances - gross
10.1.1 In local currency 235,079,268 253,182,865 42,816,359 33,781,868 277,895,627 286,964,733
In foreign currencies 92,787,678 97,245,851 5,796,719 6,283,369 98,584,397 103,529,220
327,866,946 350,428,716 48,613,078 40,065,237 376,480,024 390,493,953
10.1.2 Short term 247,828,594 232,398,519 - - 247,828,594 232,398,519
Long term 80,038,352 118,030,197 48,613,078 40,065,237 128,651,430 158,095,434
327,866,946 350,428,716 48,613,078 40,065,237 376,480,024 390,493,953
10.2 This includes performing advances given under various Islamic financing modes amounting to Rs.461.342 million (2009: Rs.638.131 million).
10.3 Non-performing advances include advances having gross book value of Rs.5,774.675 million (2009: Rs.1,596.136 million) and net book value ofRs.2,110.614 million (2009: Rs.919.006 million) which, though restructured and performing have been placed under non-performing status as requiredby the revised Prudential Regulations issued by the SBP, which requires monitoring for at least one year before any upgradation is considered.
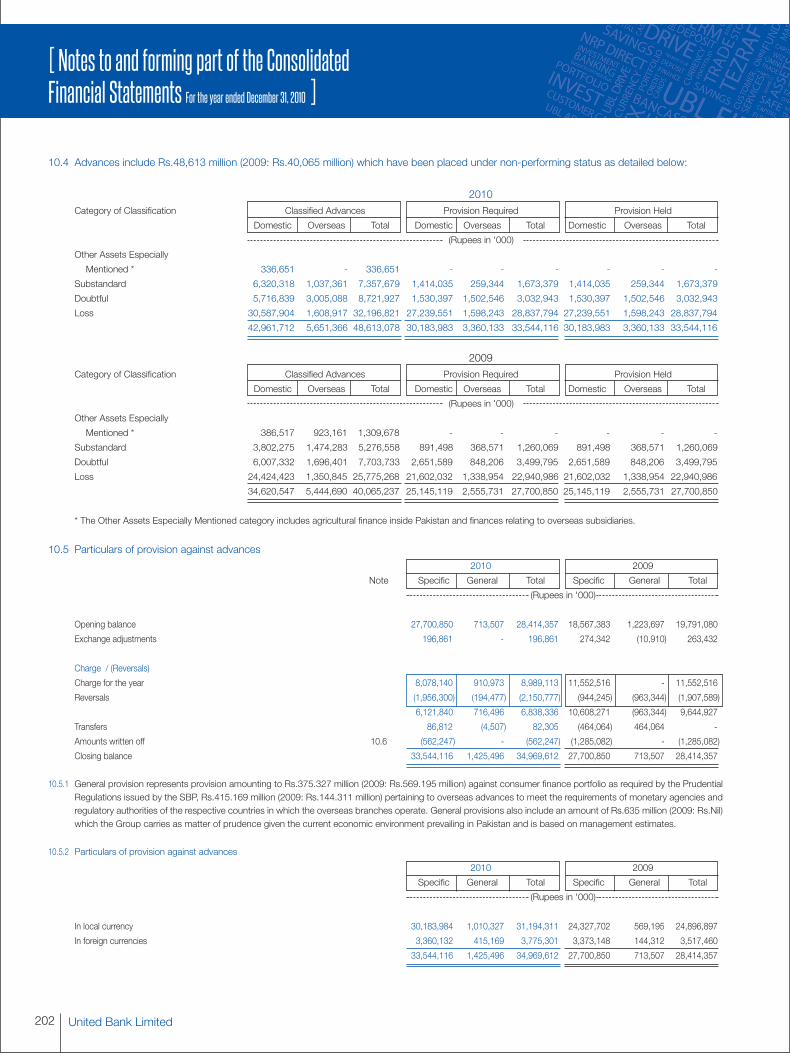
United Bank Limited202
[ Notes to and forming part of the ConsolidatedFinancial Statements For the year ended December 31, 2010 ]
10.4 Advances include Rs.48,613 million (2009: Rs.40,065 million) which have been placed under non-performing status as detailed below:
2010
Category of Classification Classified Advances Provision Required Provision Held
Domestic Overseas Total Domestic Overseas Total Domestic Overseas Total
(Rupees in '000)
Other Assets Especially
Mentioned * 336,651 - 336,651 - - - - - -
Substandard 6,320,318 1,037,361 7,357,679 1,414,035 259,344 1,673,379 1,414,035 259,344 1,673,379
Doubtful 5,716,839 3,005,088 8,721,927 1,530,397 1,502,546 3,032,943 1,530,397 1,502,546 3,032,943
Loss 30,587,904 1,608,917 32,196,821 27,239,551 1,598,243 28,837,794 27,239,551 1,598,243 28,837,794
42,961,712 5,651,366 48,613,078 30,183,983 3,360,133 33,544,116 30,183,983 3,360,133 33,544,116
2009
Category of Classification Classified Advances Provision Required Provision Held
Domestic Overseas Total Domestic Overseas Total Domestic Overseas Total
(Rupees in '000)
Other Assets Especially
Mentioned * 386,517 923,161 1,309,678 - - - - - -
Substandard 3,802,275 1,474,283 5,276,558 891,498 368,571 1,260,069 891,498 368,571 1,260,069
Doubtful 6,007,332 1,696,401 7,703,733 2,651,589 848,206 3,499,795 2,651,589 848,206 3,499,795
Loss 24,424,423 1,350,845 25,775,268 21,602,032 1,338,954 22,940,986 21,602,032 1,338,954 22,940,986
34,620,547 5,444,690 40,065,237 25,145,119 2,555,731 27,700,850 25,145,119 2,555,731 27,700,850
* The Other Assets Especially Mentioned category includes agricultural finance inside Pakistan and finances relating to overseas subsidiaries.
10.5 Particulars of provision against advances
2010 2009
Note Specific General Total Specific General Total
(Rupees in '000)
Opening balance 27,700,850 713,507 28,414,357 18,567,383 1,223,697 19,791,080
Exchange adjustments 196,861 - 196,861 274,342 (10,910) 263,432
Charge / (Reversals)
Charge for the year 8,078,140 910,973 8,989,113 11,552,516 - 11,552,516
Reversals (1,956,300) (194,477) (2,150,777) (944,245) (963,344) (1,907,589)
6,121,840 716,496 6,838,336 10,608,271 (963,344) 9,644,927
Transfers 86,812 (4,507) 82,305 (464,064) 464,064 -
Amounts written off 10.6 (562,247) - (562,247) (1,285,082) - (1,285,082)
Closing balance 33,544,116 1,425,496 34,969,612 27,700,850 713,507 28,414,357
10.5.1 General provision represents provision amounting to Rs.375.327 million (2009: Rs.569.195 million) against consumer finance portfolio as required by the PrudentialRegulations issued by the SBP, Rs.415.169 million (2009: Rs.144.311 million) pertaining to overseas advances to meet the requirements of monetary agencies andregulatory authorities of the respective countries in which the overseas branches operate. General provisions also include an amount of Rs.635 million (2009: Rs.Nil)which the Group carries as matter of prudence given the current economic environment prevailing in Pakistan and is based on management estimates.
10.5.2 Particulars of provision against advances
2010 2009
Specific General Total Specific General Total
(Rupees in '000)
In local currency 30,183,984 1,010,327 31,194,311 24,327,702 569,195 24,896,897
In foreign currencies 3,360,132 415,169 3,775,301 3,373,148 144,312 3,517,460
33,544,116 1,425,496 34,969,612 27,700,850 713,507 28,414,357
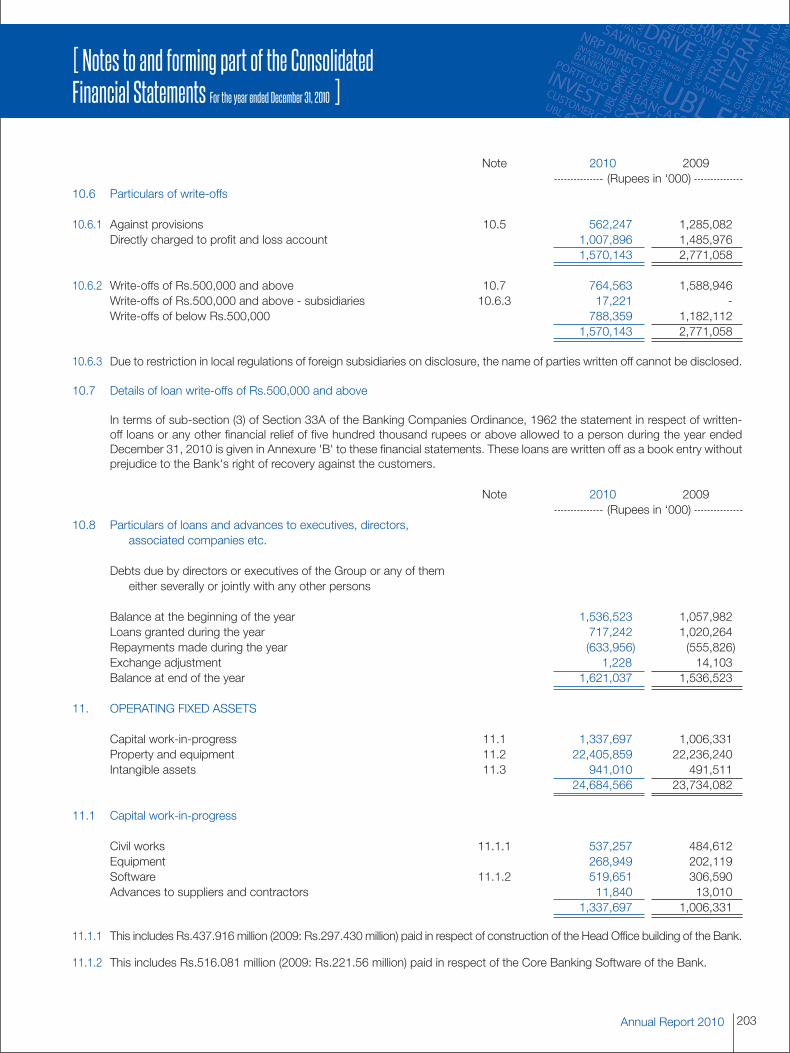
203Annual Report 2010
[ Notes to and forming part of the ConsolidatedFinancial Statements For the year ended December 31, 2010 ]
Note 2010 2009(Rupees in ‘000)
10.6 Particulars of write-offs
10.6.1 Against provisions 10.5 562,247 1,285,082Directly charged to profit and loss account 1,007,896 1,485,976
1,570,143 2,771,058
10.6.2 Write-offs of Rs.500,000 and above 10.7 764,563 1,588,946Write-offs of Rs.500,000 and above - subsidiaries 10.6.3 17,221 -Write-offs of below Rs.500,000 788,359 1,182,112
1,570,143 2,771,058
10.6.3 Due to restriction in local regulations of foreign subsidiaries on disclosure, the name of parties written off cannot be disclosed.
10.7 Details of loan write-offs of Rs.500,000 and above
In terms of sub-section (3) of Section 33A of the Banking Companies Ordinance, 1962 the statement in respect of written-off loans or any other financial relief of five hundred thousand rupees or above allowed to a person during the year endedDecember 31, 2010 is given in Annexure 'B' to these financial statements. These loans are written off as a book entry withoutprejudice to the Bank's right of recovery against the customers.
Note 2010 2009(Rupees in ‘000)
10.8 Particulars of loans and advances to executives, directors,associated companies etc.
Debts due by directors or executives of the Group or any of themeither severally or jointly with any other persons
Balance at the beginning of the year 1,536,523 1,057,982Loans granted during the year 717,242 1,020,264Repayments made during the year (633,956) (555,826)Exchange adjustment 1,228 14,103Balance at end of the year 1,621,037 1,536,523
11. OPERATING FIXED ASSETS
Capital work-in-progress 11.1 1,337,697 1,006,331Property and equipment 11.2 22,405,859 22,236,240Intangible assets 11.3 941,010 491,511
24,684,566 23,734,082
11.1 Capital work-in-progress
Civil works 11.1.1 537,257 484,612Equipment 268,949 202,119Software 11.1.2 519,651 306,590Advances to suppliers and contractors 11,840 13,010
1,337,697 1,006,331
11.1.1 This includes Rs.437.916 million (2009: Rs.297.430 million) paid in respect of construction of the Head Office building of the Bank.
11.1.2 This includes Rs.516.081 million (2009: Rs.221.56 million) paid in respect of the Core Banking Software of the Bank.
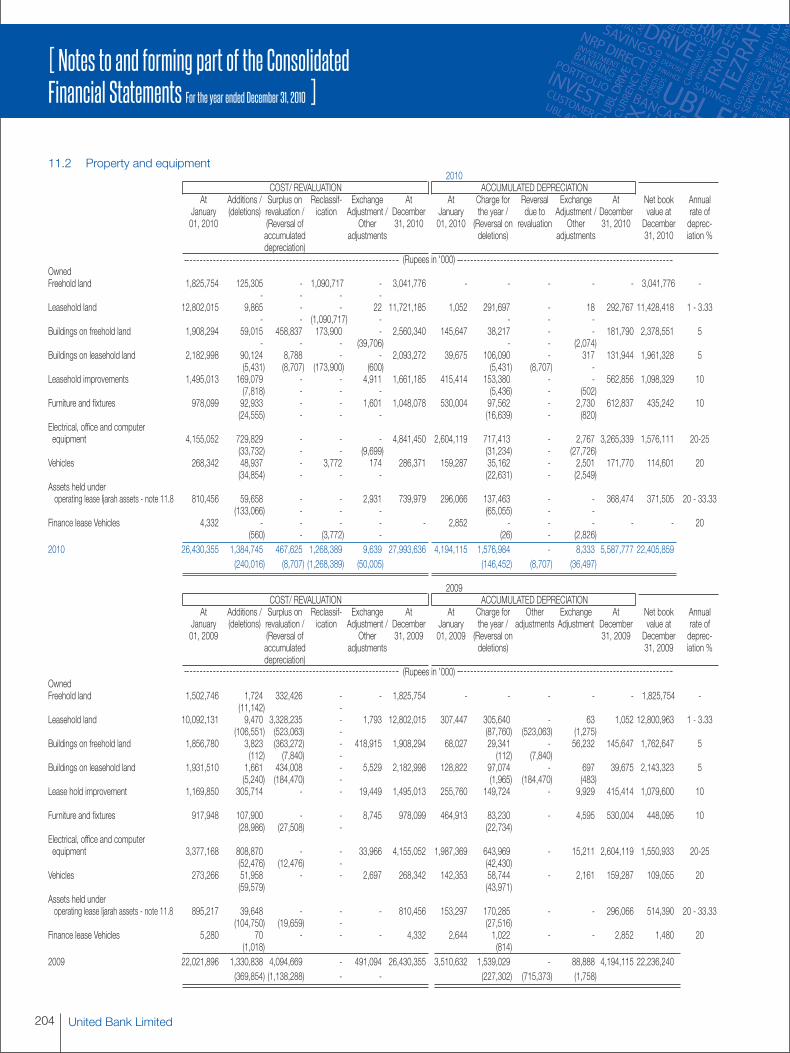
United Bank Limited204
[ Notes to and forming part of the ConsolidatedFinancial Statements For the year ended December 31, 2010 ]
11.2 Property and equipment2010
COST/ REVALUATION ACCUMULATED DEPRECIATIONAt Additions / Surplus on Reclassif- Exchange At At Charge for Reversal Exchange At Net book Annual
January (deletions) revaluation / ication Adjustment / December January the year / due to Adjustment / December value at rate of01, 2010 (Reversal of Other 31, 2010 01, 2010 (Reversal on revaluation Other 31, 2010 December deprec-
accumulated adjustments deletions) adjustments 31, 2010 iation %depreciation)
(Rupees in '000)OwnedFreehold land 1,825,754 125,305 - 1,090,717 - 3,041,776 - - - - - 3,041,776 -
- - - -Leasehold land 12,802,015 9,865 - - 22 11,721,185 1,052 291,697 - 18 292,767 11,428,418 1 - 3.33
- - (1,090,717) - - - -Buildings on freehold land 1,908,294 59,015 458,837 173,900 - 2,560,340 145,647 38,217 - - 181,790 2,378,551 5
- - - (39,706) - - (2,074)Buildings on leasehold land 2,182,998 90,124 8,788 - - 2,093,272 39,675 106,090 - 317 131,944 1,961,328 5
(5,431) (8,707) (173,900) (600) (5,431) (8,707) -Leasehold improvements 1,495,013 169,079 - - 4,911 1,661,185 415,414 153,380 - - 562,856 1,098,329 10
(7,818) - - - (5,436) - (502)Furniture and fixtures 978,099 92,933 - - 1,601 1,048,078 530,004 97,562 - 2,730 612,837 435,242 10
(24,555) - - - (16,639) - (820)Electrical, office and computerequipment 4,155,052 729,829 - - - 4,841,450 2,604,119 717,413 - 2,767 3,265,339 1,576,111 20-25
(33,732) - - (9,699) (31,234) - (27,726)Vehicles 268,342 48,937 - 3,772 174 286,371 159,287 35,162 - 2,501 171,770 114,601 20
(34,854) - - - (22,631) - (2,549)Assets held underoperating lease Ijarah assets - note 11.8 810,456 59,658 - - 2,931 739,979 296,066 137,463 - - 368,474 371,505 20 - 33.33
(133,066) - - - (65,055) - -Finance lease Vehicles 4,332 - - - - - 2,852 - - - - - 20
(560) - (3,772) - (26) - (2,826)2010 26,430,355 1,384,745 467,625 1,268,389 9,639 27,993,636 4,194,115 1,576,984 - 8,333 5,587,777 22,405,859
(240,016) (8,707) (1,268,389) (50,005) (146,452) (8,707) (36,497)
2009COST/ REVALUATION ACCUMULATED DEPRECIATION
At Additions / Surplus on Reclassif- Exchange At At Charge for Other Exchange At Net book AnnualJanuary (deletions) revaluation / ication Adjustment / December January the year / adjustments Adjustment December value at rate of01, 2009 (Reversal of Other 31, 2009 01, 2009 (Reversal on 31, 2009 December deprec-
accumulated adjustments deletions) 31, 2009 iation %depreciation)
(Rupees in '000)OwnedFreehold land 1,502,746 1,724 332,426 - - 1,825,754 - - - - - 1,825,754 -
(11,142) -Leasehold land 10,092,131 9,470 3,328,235 - 1,793 12,802,015 307,447 305,640 - 63 1,052 12,800,963 1 - 3.33
(106,551) (523,063) - (87,760) (523,063) (1,275)Buildings on freehold land 1,856,780 3,823 (363,272) - 418,915 1,908,294 68,027 29,341 - 56,232 145,647 1,762,647 5
(112) (7,840) - (112) (7,840)Buildings on leasehold land 1,931,510 1,661 434,008 - 5,529 2,182,998 128,822 97,074 - 697 39,675 2,143,323 5
(5,240) (184,470) - (1,965) (184,470) (483)Lease hold improvement 1,169,850 305,714 - - 19,449 1,495,013 255,760 149,724 - 9,929 415,414 1,079,600 10
Furniture and fixtures 917,948 107,900 - - 8,745 978,099 464,913 83,230 - 4,595 530,004 448,095 10(28,986) (27,508) - (22,734)
Electrical, office and computerequipment 3,377,168 808,870 - - 33,966 4,155,052 1,987,369 643,969 - 15,211 2,604,119 1,550,933 20-25
(52,476) (12,476) - (42,430)Vehicles 273,266 51,958 - - 2,697 268,342 142,353 58,744 - 2,161 159,287 109,055 20
(59,579) (43,971)Assets held underoperating lease Ijarah assets - note 11.8 895,217 39,648 - - - 810,456 153,297 170,285 - - 296,066 514,390 20 - 33.33
(104,750) (19,659) - (27,516)Finance lease Vehicles 5,280 70 - - - 4,332 2,644 1,022 - - 2,852 1,480 20
(1,018) (814)2009 22,021,896 1,330,838 4,094,669 - 491,094 26,430,355 3,510,632 1,539,029 - 88,888 4,194,115 22,236,240
(369,854) (1,138,288) - - (227,302) (715,373) (1,758)
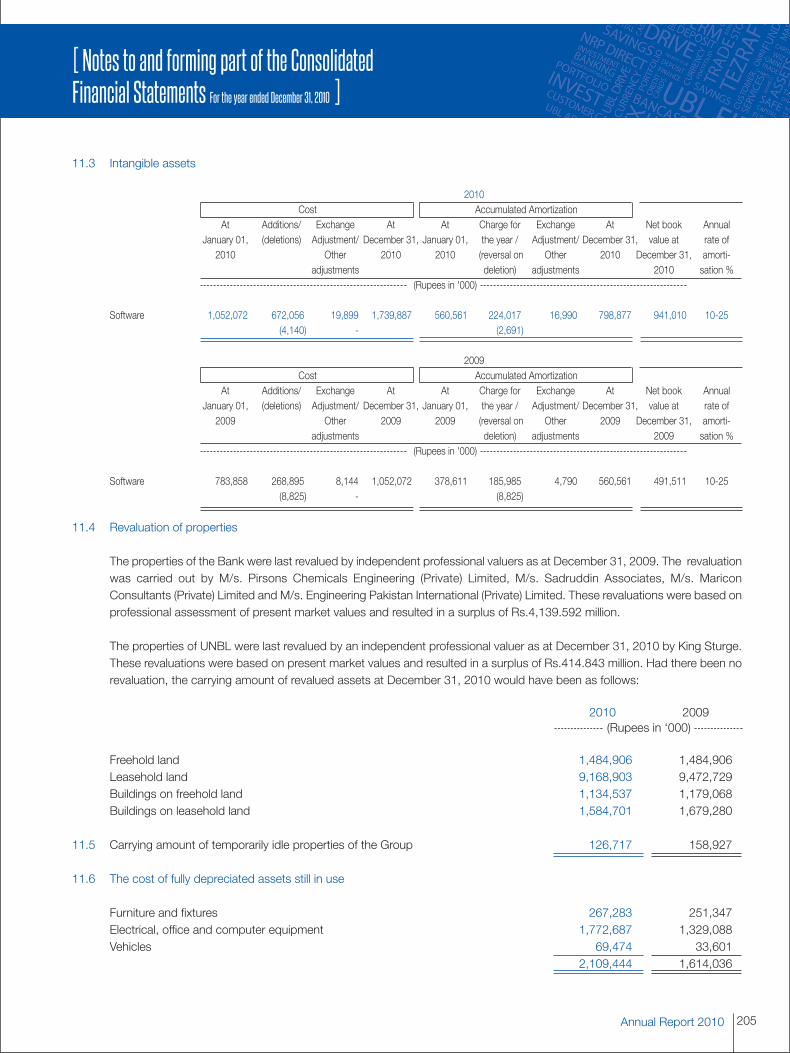
205Annual Report 2010
[ Notes to and forming part of the ConsolidatedFinancial Statements For the year ended December 31, 2010 ]
11.3 Intangible assets
2010Cost Accumulated Amortization
At Additions/ Exchange At At Charge for Exchange At Net book AnnualJanuary 01, (deletions) Adjustment/ December 31, January 01, the year / Adjustment/ December 31, value at rate of
2010 Other 2010 2010 (reversal on Other 2010 December 31, amorti-adjustments deletion) adjustments 2010 sation %
(Rupees in '000)
Software 1,052,072 672,056 19,899 1,739,887 560,561 224,017 16,990 798,877 941,010 10-25(4,140) - (2,691)
2009Cost Accumulated Amortization
At Additions/ Exchange At At Charge for Exchange At Net book AnnualJanuary 01, (deletions) Adjustment/ December 31, January 01, the year / Adjustment/ December 31, value at rate of
2009 Other 2009 2009 (reversal on Other 2009 December 31, amorti-adjustments deletion) adjustments 2009 sation %
(Rupees in '000)
Software 783,858 268,895 8,144 1,052,072 378,611 185,985 4,790 560,561 491,511 10-25(8,825) - (8,825)
11.4 Revaluation of properties
The properties of the Bank were last revalued by independent professional valuers as at December 31, 2009. The revaluationwas carried out by M/s. Pirsons Chemicals Engineering (Private) Limited, M/s. Sadruddin Associates, M/s. MariconConsultants (Private) Limited and M/s. Engineering Pakistan International (Private) Limited. These revaluations were based onprofessional assessment of present market values and resulted in a surplus of Rs.4,139.592 million.
The properties of UNBL were last revalued by an independent professional valuer as at December 31, 2010 by King Sturge.These revaluations were based on present market values and resulted in a surplus of Rs.414.843 million. Had there been norevaluation, the carrying amount of revalued assets at December 31, 2010 would have been as follows:
2010 2009(Rupees in ‘000)
Freehold land 1,484,906 1,484,906Leasehold land 9,168,903 9,472,729Buildings on freehold land 1,134,537 1,179,068Buildings on leasehold land 1,584,701 1,679,280
11.5 Carrying amount of temporarily idle properties of the Group 126,717 158,927
11.6 The cost of fully depreciated assets still in use
Furniture and fixtures 267,283 251,347Electrical, office and computer equipment 1,772,687 1,329,088Vehicles 69,474 33,601
2,109,444 1,614,036
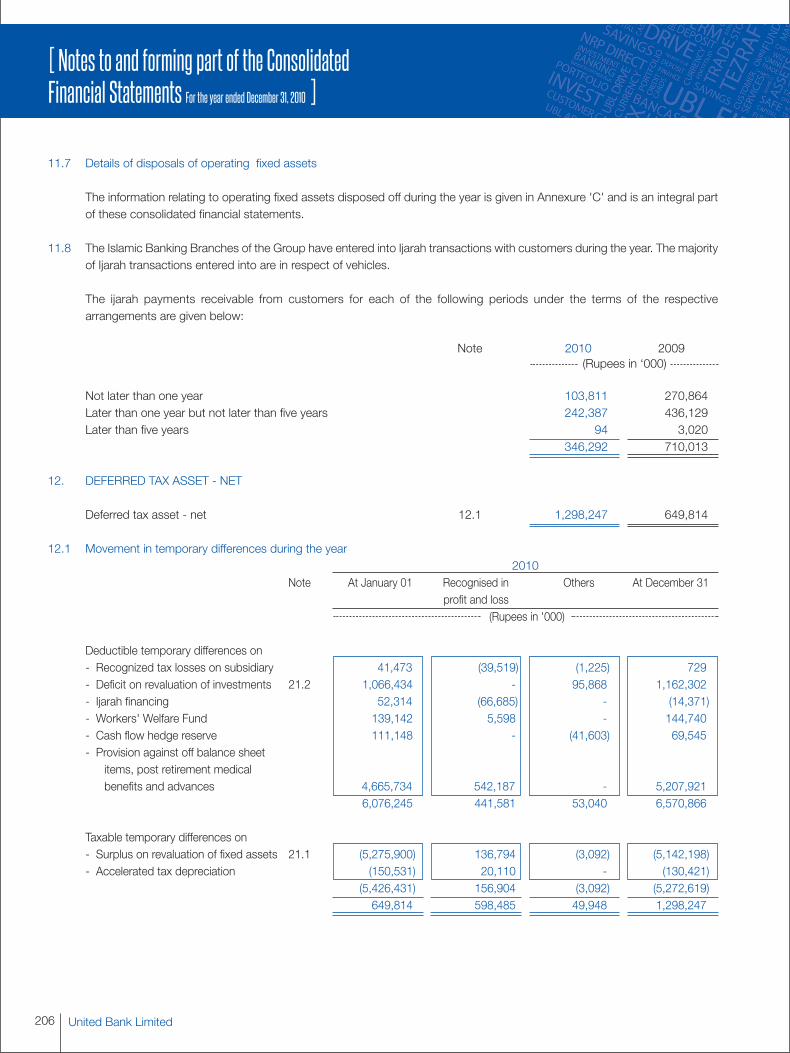
United Bank Limited206
[ Notes to and forming part of the ConsolidatedFinancial Statements For the year ended December 31, 2010 ]
11.7 Details of disposals of operating fixed assets
The information relating to operating fixed assets disposed off during the year is given in Annexure 'C' and is an integral partof these consolidated financial statements.
11.8 The Islamic Banking Branches of the Group have entered into Ijarah transactions with customers during the year. The majorityof Ijarah transactions entered into are in respect of vehicles.
The ijarah payments receivable from customers for each of the following periods under the terms of the respectivearrangements are given below:
Note 2010 2009(Rupees in ‘000)
Not later than one year 103,811 270,864Later than one year but not later than five years 242,387 436,129Later than five years 94 3,020
346,292 710,013
12. DEFERRED TAX ASSET - NET
Deferred tax asset - net 12.1 1,298,247 649,814
12.1 Movement in temporary differences during the year2010
Note At January 01 Recognised in Others At December 31profit and loss
(Rupees in '000)
Deductible temporary differences on- Recognized tax losses on subsidiary 41,473 (39,519) (1,225) 729- Deficit on revaluation of investments 21.2 1,066,434 - 95,868 1,162,302- Ijarah financing 52,314 (66,685) - (14,371)- Workers' Welfare Fund 139,142 5,598 - 144,740- Cash flow hedge reserve 111,148 - (41,603) 69,545- Provision against off balance sheet
items, post retirement medicalbenefits and advances 4,665,734 542,187 - 5,207,921
6,076,245 441,581 53,040 6,570,866
Taxable temporary differences on- Surplus on revaluation of fixed assets 21.1 (5,275,900) 136,794 (3,092) (5,142,198)- Accelerated tax depreciation (150,531) 20,110 - (130,421)
(5,426,431) 156,904 (3,092) (5,272,619)649,814 598,485 49,948 1,298,247
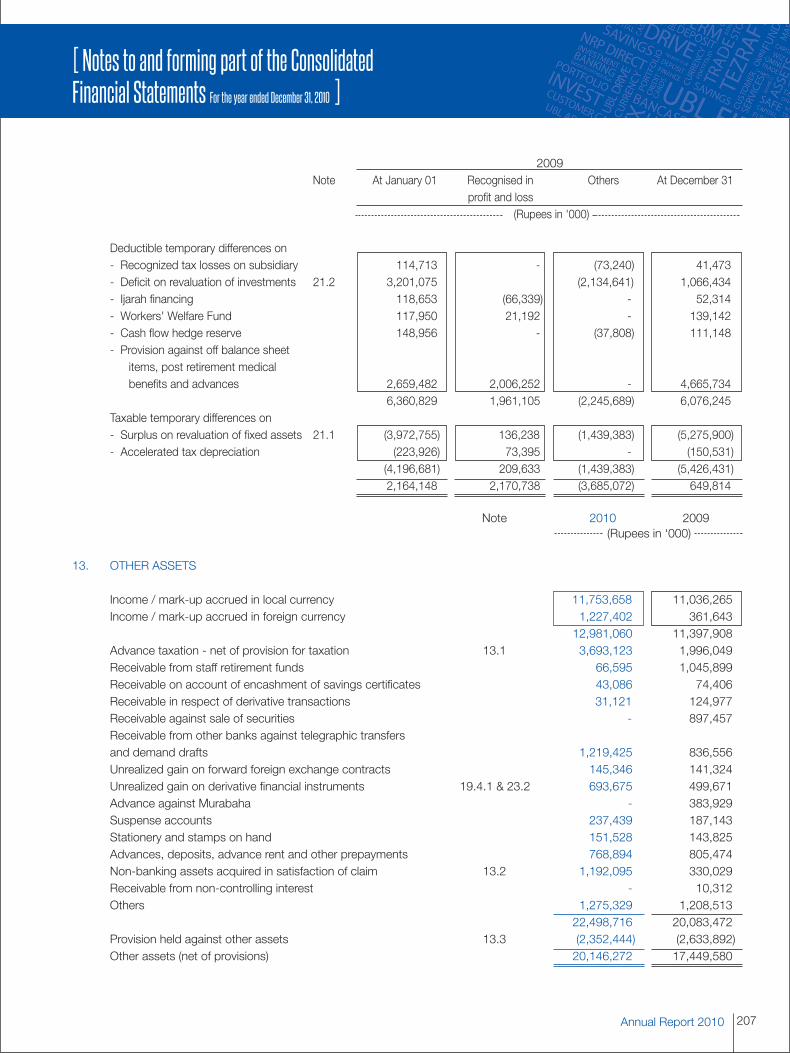
207Annual Report 2010
[ Notes to and forming part of the ConsolidatedFinancial Statements For the year ended December 31, 2010 ]
2009Note At January 01 Recognised in Others At December 31
profit and loss(Rupees in '000)
Deductible temporary differences on- Recognized tax losses on subsidiary 114,713 - (73,240) 41,473- Deficit on revaluation of investments 21.2 3,201,075 (2,134,641) 1,066,434- Ijarah financing 118,653 (66,339) - 52,314- Workers' Welfare Fund 117,950 21,192 - 139,142- Cash flow hedge reserve 148,956 - (37,808) 111,148- Provision against off balance sheet
items, post retirement medicalbenefits and advances 2,659,482 2,006,252 - 4,665,734
6,360,829 1,961,105 (2,245,689) 6,076,245Taxable temporary differences on- Surplus on revaluation of fixed assets 21.1 (3,972,755) 136,238 (1,439,383) (5,275,900)- Accelerated tax depreciation (223,926) 73,395 - (150,531)
(4,196,681) 209,633 (1,439,383) (5,426,431)2,164,148 2,170,738 (3,685,072) 649,814
Note 2010 2009(Rupees in ‘000)
13. OTHER ASSETS
Income / mark-up accrued in local currency 11,753,658 11,036,265Income / mark-up accrued in foreign currency 1,227,402 361,643
12,981,060 11,397,908Advance taxation - net of provision for taxation 13.1 3,693,123 1,996,049Receivable from staff retirement funds 66,595 1,045,899Receivable on account of encashment of savings certificates 43,086 74,406Receivable in respect of derivative transactions 31,121 124,977Receivable against sale of securities - 897,457Receivable from other banks against telegraphic transfersand demand drafts 1,219,425 836,556Unrealized gain on forward foreign exchange contracts 145,346 141,324Unrealized gain on derivative financial instruments 19.4.1 & 23.2 693,675 499,671Advance against Murabaha - 383,929Suspense accounts 237,439 187,143Stationery and stamps on hand 151,528 143,825Advances, deposits, advance rent and other prepayments 768,894 805,474Non-banking assets acquired in satisfaction of claim 13.2 1,192,095 330,029Receivable from non-controlling interest - 10,312Others 1,275,329 1,208,513
22,498,716 20,083,472Provision held against other assets 13.3 (2,352,444) (2,633,892)Other assets (net of provisions) 20,146,272 17,449,580
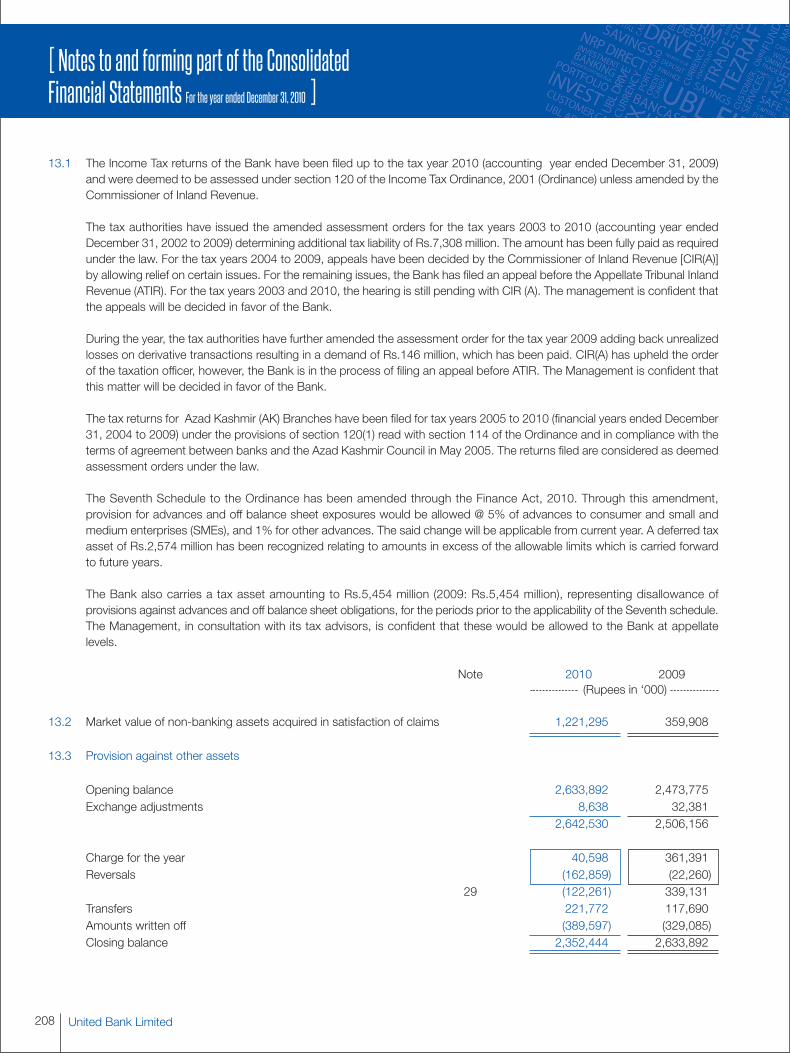
United Bank Limited208
[ Notes to and forming part of the ConsolidatedFinancial Statements For the year ended December 31, 2010 ]
13.1 The Income Tax returns of the Bank have been filed up to the tax year 2010 (accounting year ended December 31, 2009)and were deemed to be assessed under section 120 of the Income Tax Ordinance, 2001 (Ordinance) unless amended by theCommissioner of Inland Revenue.
The tax authorities have issued the amended assessment orders for the tax years 2003 to 2010 (accounting year endedDecember 31, 2002 to 2009) determining additional tax liability of Rs.7,308 million. The amount has been fully paid as requiredunder the law. For the tax years 2004 to 2009, appeals have been decided by the Commissioner of Inland Revenue [CIR(A)]by allowing relief on certain issues. For the remaining issues, the Bank has filed an appeal before the Appellate Tribunal InlandRevenue (ATIR). For the tax years 2003 and 2010, the hearing is still pending with CIR (A). The management is confident thatthe appeals will be decided in favor of the Bank.
During the year, the tax authorities have further amended the assessment order for the tax year 2009 adding back unrealizedlosses on derivative transactions resulting in a demand of Rs.146 million, which has been paid. CIR(A) has upheld the orderof the taxation officer, however, the Bank is in the process of filing an appeal before ATIR. The Management is confident thatthis matter will be decided in favor of the Bank.
The tax returns for Azad Kashmir (AK) Branches have been filed for tax years 2005 to 2010 (financial years ended December31, 2004 to 2009) under the provisions of section 120(1) read with section 114 of the Ordinance and in compliance with theterms of agreement between banks and the Azad Kashmir Council in May 2005. The returns filed are considered as deemedassessment orders under the law.
The Seventh Schedule to the Ordinance has been amended through the Finance Act, 2010. Through this amendment,provision for advances and off balance sheet exposures would be allowed @ 5% of advances to consumer and small andmedium enterprises (SMEs), and 1% for other advances. The said change will be applicable from current year. A deferred taxasset of Rs.2,574 million has been recognized relating to amounts in excess of the allowable limits which is carried forwardto future years.
The Bank also carries a tax asset amounting to Rs.5,454 million (2009: Rs.5,454 million), representing disallowance ofprovisions against advances and off balance sheet obligations, for the periods prior to the applicability of the Seventh schedule.The Management, in consultation with its tax advisors, is confident that these would be allowed to the Bank at appellatelevels.
Note 2010 2009(Rupees in ‘000)
13.2 Market value of non-banking assets acquired in satisfaction of claims 1,221,295 359,908
13.3 Provision against other assets
Opening balance 2,633,892 2,473,775Exchange adjustments 8,638 32,381
2,642,530 2,506,156
Charge for the year 40,598 361,391Reversals (162,859) (22,260)
29 (122,261) 339,131Transfers 221,772 117,690Amounts written off (389,597) (329,085)Closing balance 2,352,444 2,633,892
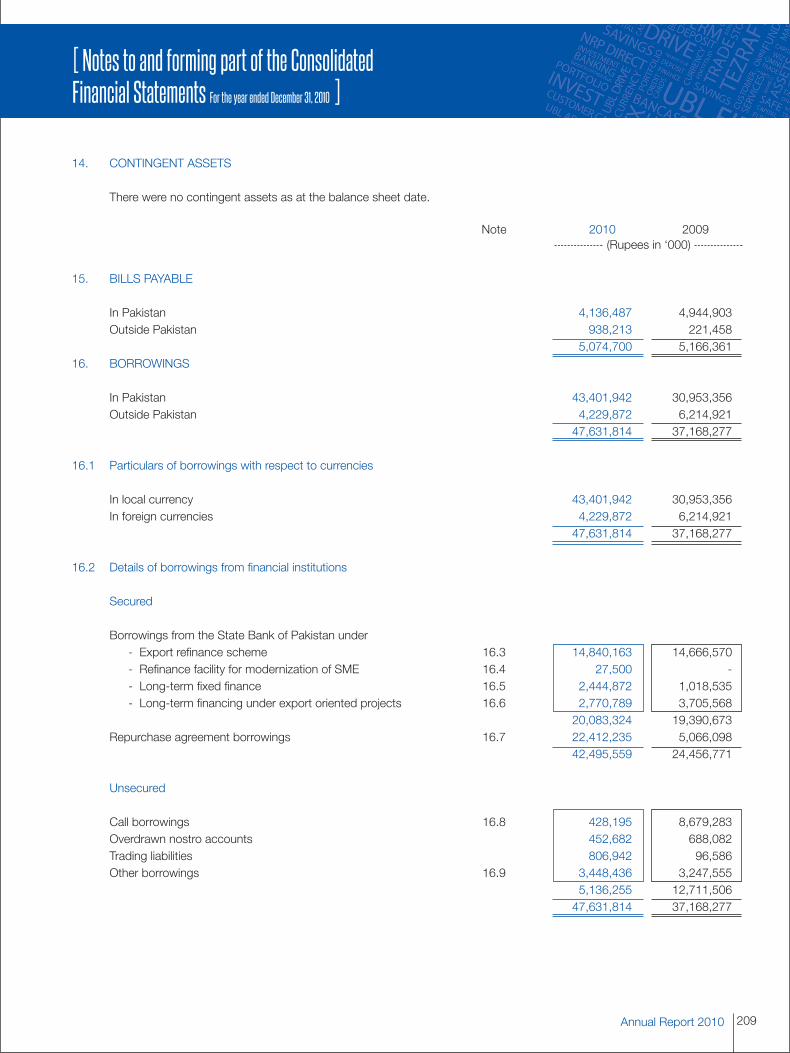
209Annual Report 2010
[ Notes to and forming part of the ConsolidatedFinancial Statements For the year ended December 31, 2010 ]
14. CONTINGENT ASSETS
There were no contingent assets as at the balance sheet date.
Note 2010 2009(Rupees in ‘000)
15. BILLS PAYABLE
In Pakistan 4,136,487 4,944,903Outside Pakistan 938,213 221,458
5,074,700 5,166,36116. BORROWINGS
In Pakistan 43,401,942 30,953,356Outside Pakistan 4,229,872 6,214,921
47,631,814 37,168,277
16.1 Particulars of borrowings with respect to currencies
In local currency 43,401,942 30,953,356In foreign currencies 4,229,872 6,214,921
47,631,814 37,168,277
16.2 Details of borrowings from financial institutions
Secured
Borrowings from the State Bank of Pakistan under- Export refinance scheme 16.3 14,840,163 14,666,570- Refinance facility for modernization of SME 16.4 27,500 -- Long-term fixed finance 16.5 2,444,872 1,018,535- Long-term financing under export oriented projects 16.6 2,770,789 3,705,568
20,083,324 19,390,673Repurchase agreement borrowings 16.7 22,412,235 5,066,098
42,495,559 24,456,771
Unsecured
Call borrowings 16.8 428,195 8,679,283Overdrawn nostro accounts 452,682 688,082Trading liabilities 806,942 96,586Other borrowings 16.9 3,448,436 3,247,555
5,136,255 12,711,50647,631,814 37,168,277
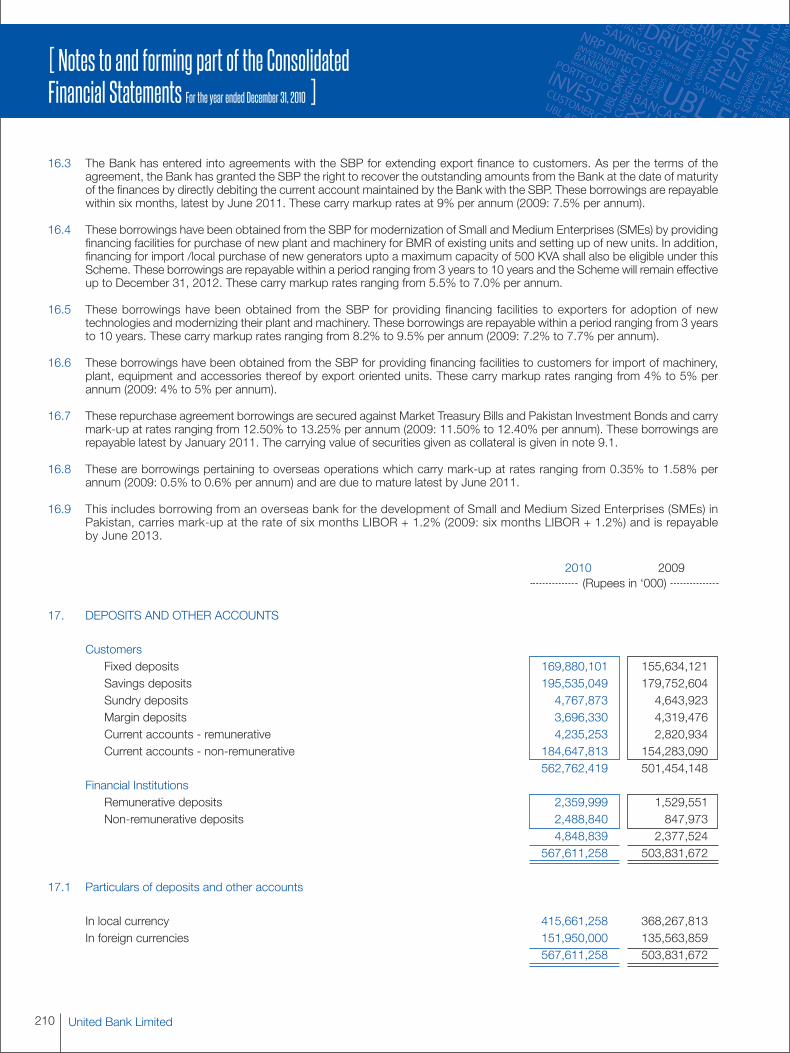
United Bank Limited210
[ Notes to and forming part of the ConsolidatedFinancial Statements For the year ended December 31, 2010 ]
16.3 The Bank has entered into agreements with the SBP for extending export finance to customers. As per the terms of theagreement, the Bank has granted the SBP the right to recover the outstanding amounts from the Bank at the date of maturityof the finances by directly debiting the current account maintained by the Bank with the SBP. These borrowings are repayablewithin six months, latest by June 2011. These carry markup rates at 9% per annum (2009: 7.5% per annum).
16.4 These borrowings have been obtained from the SBP for modernization of Small and Medium Enterprises (SMEs) by providingfinancing facilities for purchase of new plant and machinery for BMR of existing units and setting up of new units. In addition,financing for import /local purchase of new generators upto a maximum capacity of 500 KVA shall also be eligible under thisScheme. These borrowings are repayable within a period ranging from 3 years to 10 years and the Scheme will remain effectiveup to December 31, 2012. These carry markup rates ranging from 5.5% to 7.0% per annum.
16.5 These borrowings have been obtained from the SBP for providing financing facilities to exporters for adoption of newtechnologies and modernizing their plant and machinery. These borrowings are repayable within a period ranging from 3 yearsto 10 years. These carry markup rates ranging from 8.2% to 9.5% per annum (2009: 7.2% to 7.7% per annum).
16.6 These borrowings have been obtained from the SBP for providing financing facilities to customers for import of machinery,plant, equipment and accessories thereof by export oriented units. These carry markup rates ranging from 4% to 5% perannum (2009: 4% to 5% per annum).
16.7 These repurchase agreement borrowings are secured against Market Treasury Bills and Pakistan Investment Bonds and carrymark-up at rates ranging from 12.50% to 13.25% per annum (2009: 11.50% to 12.40% per annum). These borrowings arerepayable latest by January 2011. The carrying value of securities given as collateral is given in note 9.1.
16.8 These are borrowings pertaining to overseas operations which carry mark-up at rates ranging from 0.35% to 1.58% perannum (2009: 0.5% to 0.6% per annum) and are due to mature latest by June 2011.
16.9 This includes borrowing from an overseas bank for the development of Small and Medium Sized Enterprises (SMEs) inPakistan, carries mark-up at the rate of six months LIBOR + 1.2% (2009: six months LIBOR + 1.2%) and is repayableby June 2013.
2010 2009(Rupees in ‘000)
17. DEPOSITS AND OTHER ACCOUNTS
CustomersFixed deposits 169,880,101 155,634,121Savings deposits 195,535,049 179,752,604Sundry deposits 4,767,873 4,643,923Margin deposits 3,696,330 4,319,476Current accounts - remunerative 4,235,253 2,820,934Current accounts - non-remunerative 184,647,813 154,283,090
562,762,419 501,454,148Financial Institutions
Remunerative deposits 2,359,999 1,529,551Non-remunerative deposits 2,488,840 847,973
4,848,839 2,377,524567,611,258 503,831,672
17.1 Particulars of deposits and other accounts
In local currency 415,661,258 368,267,813In foreign currencies 151,950,000 135,563,859
567,611,258 503,831,672
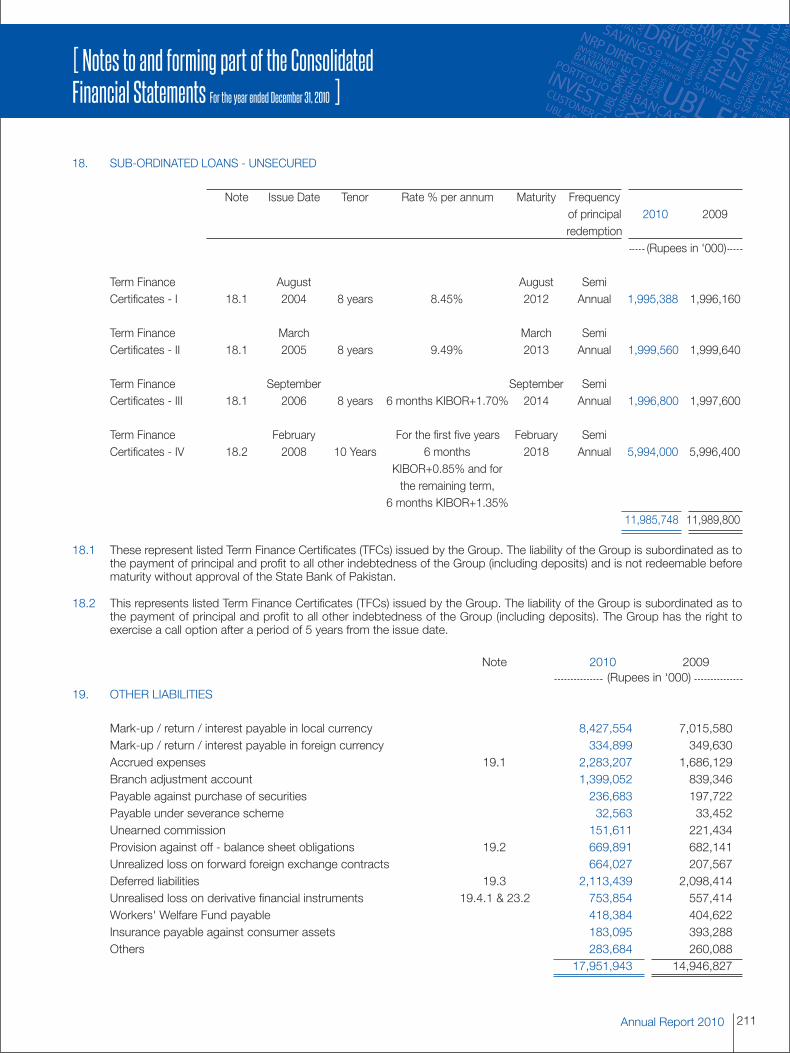
211Annual Report 2010
[ Notes to and forming part of the ConsolidatedFinancial Statements For the year ended December 31, 2010 ]
18. SUB-ORDINATED LOANS - UNSECURED
Note Issue Date Tenor Rate % per annum Maturity Frequencyof principal 2010 2009redemption
(Rupees in '000)
Term Finance August August SemiCertificates - I 18.1 2004 8 years 8.45% 2012 Annual 1,995,388 1,996,160
Term Finance March March SemiCertificates - II 18.1 2005 8 years 9.49% 2013 Annual 1,999,560 1,999,640
Term Finance September September SemiCertificates - III 18.1 2006 8 years 6 months KIBOR+1.70% 2014 Annual 1,996,800 1,997,600
Term Finance February For the first five years February SemiCertificates - IV 18.2 2008 10 Years 6 months 2018 Annual 5,994,000 5,996,400
KIBOR+0.85% and forthe remaining term,
6 months KIBOR+1.35%11,985,748 11,989,800
18.1 These represent listed Term Finance Certificates (TFCs) issued by the Group. The liability of the Group is subordinated as tothe payment of principal and profit to all other indebtedness of the Group (including deposits) and is not redeemable beforematurity without approval of the State Bank of Pakistan.
18.2 This represents listed Term Finance Certificates (TFCs) issued by the Group. The liability of the Group is subordinated as tothe payment of principal and profit to all other indebtedness of the Group (including deposits). The Group has the right toexercise a call option after a period of 5 years from the issue date.
Note 2010 2009(Rupees in ‘000)
19. OTHER LIABILITIES
Mark-up / return / interest payable in local currency 8,427,554 7,015,580Mark-up / return / interest payable in foreign currency 334,899 349,630Accrued expenses 19.1 2,283,207 1,686,129Branch adjustment account 1,399,052 839,346Payable against purchase of securities 236,683 197,722Payable under severance scheme 32,563 33,452Unearned commission 151,611 221,434Provision against off - balance sheet obligations 19.2 669,891 682,141Unrealized loss on forward foreign exchange contracts 664,027 207,567Deferred liabilities 19.3 2,113,439 2,098,414Unrealised loss on derivative financial instruments 19.4.1 & 23.2 753,854 557,414Workers' Welfare Fund payable 418,384 404,622Insurance payable against consumer assets 183,095 393,288Others 283,684 260,088
17,951,943 14,946,827
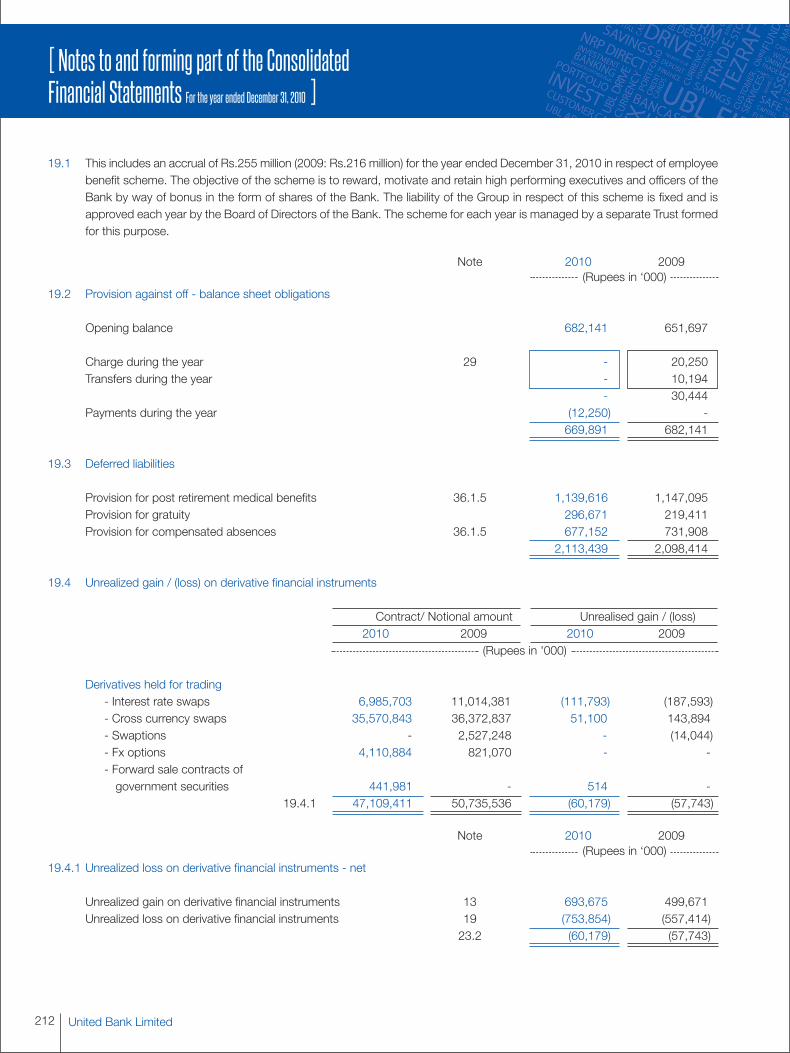
United Bank Limited212
[ Notes to and forming part of the ConsolidatedFinancial Statements For the year ended December 31, 2010 ]
19.1 This includes an accrual of Rs.255 million (2009: Rs.216 million) for the year ended December 31, 2010 in respect of employeebenefit scheme. The objective of the scheme is to reward, motivate and retain high performing executives and officers of theBank by way of bonus in the form of shares of the Bank. The liability of the Group in respect of this scheme is fixed and isapproved each year by the Board of Directors of the Bank. The scheme for each year is managed by a separate Trust formedfor this purpose.
Note 2010 2009(Rupees in ‘000)
19.2 Provision against off - balance sheet obligations
Opening balance 682,141 651,697
Charge during the year 29 - 20,250Transfers during the year - 10,194
- 30,444Payments during the year (12,250) -
669,891 682,141
19.3 Deferred liabilities
Provision for post retirement medical benefits 36.1.5 1,139,616 1,147,095Provision for gratuity 296,671 219,411Provision for compensated absences 36.1.5 677,152 731,908
2,113,439 2,098,414
19.4 Unrealized gain / (loss) on derivative financial instruments
Contract/ Notional amount Unrealised gain / (loss)2010 2009 2010 2009
(Rupees in '000)
Derivatives held for trading- Interest rate swaps 6,985,703 11,014,381 (111,793) (187,593)- Cross currency swaps 35,570,843 36,372,837 51,100 143,894- Swaptions - 2,527,248 - (14,044)- Fx options 4,110,884 821,070 - -- Forward sale contracts ofgovernment securities 441,981 - 514 -
19.4.1 47,109,411 50,735,536 (60,179) (57,743)
Note 2010 2009(Rupees in ‘000)
19.4.1 Unrealized loss on derivative financial instruments - net
Unrealized gain on derivative financial instruments 13 693,675 499,671Unrealized loss on derivative financial instruments 19 (753,854) (557,414)
23.2 (60,179) (57,743)
213Annual Report 2010
[ Notes to and forming part of the ConsolidatedFinancial Statements For the year ended December 31, 2010 ]
20. SHARE CAPITAL
20.1 Authorized Capital2010 2009 2010 2009Number of shares (Rupees in '000)
2,000,000,000 2,000,000,000 Ordinary shares of Rs.10 each 20,000,000 20,000,000
20.2 Issued, subscribed and paid-up capital
Fully paid-up ordinary shares of Rs. 10 each
2010 2009 2010 2009Number of shares (Rupees in '000)
Fully paid-up ordinary shares of Rs.10 each518,000,000 518,000,000 Issued for cash 5,180,000 5,180,000706,179,687 594,890,625 Issued as bonus shares 7,061,798 5,948,907
1,224,179,687 1,112,890,625 12,241,798 11,128,907
20.3 During the year 2007, the Bank was admitted to the official list of the UK Listing Authority and to the London Stock ExchangeProfessional Securities Market for trading of Global Depository Receipts (GDRs), each representing four ordinary equity sharesissued by the Bank. The GDRs constitute an offering in the United States only to qualified institutional buyers in reliance onRule 144A under the U.S Securities Act of 1933 and an offering outside the United States in reliance on Regulation S.
Holders of GDRs are entitled, subject to the provision of the depository agreement, to receive dividends, if any, and rank paripassu with other equity shareholders in respect of such entitlement to receive dividends. However, the holders of GDRs haveno voting rights or other direct rights of shareholders with respect to the equity shares underlying such GDRs. Subject to theterms and restrictions set out in the offering circular dated June 25, 2007, the deposited equity shares in respect of whichthe GDRs were issued may be withdrawn from the depository facility. Upon withdrawal, the holders will rank pari passu withother equity shareholders in respect of voting powers. As at December 31, 2010: 78,503,082 (2009: 92,519,435) GDR shareswere in issue.
20.4 Major shareholders (holding more than 5% of total paid-up capital)
2010 2009Number of Percentage of Number of Percentage of
Name of shareholders shares held shareholding shares held shareholding
Government of Pakistan 238,567,381 19.49% 216,879,438 19.49%Bestway (Holdings) Limited 222,775,183 18.20% 202,522,894 18.20%Bestway Cement Limited 93,649,744 7.65% 85,136,131 7.65%His HighnessShaikh Nahayan Mabarak Al Nahayan 78,942,102 6.45% 71,765,548 6.45%H.E. Dr. Mana'a Saeed Al Otaiba 67,492,392 5.51% 61,356,720 5.51%Sir Mohammed Anwar Pervez, OBE, HPk 62,433,163 5.10% 56,757,421 5.10%
As at December 31, 2010 the Abu Dhabi Group (ADG) held 30.30% (2009: 30.30%) shareholding (including GDRs) and theBestway Group (Bestway) held 31.07% (2009: 31.07%) shareholding of the Bank.
ADG and Bestway (Holdings) Limited had entered into a Share Purchase Agreement dated December 28, 2010 for the saleof 20% of the issued and outstanding ordinary shares of the Bank held by ADG to Bestway (Holdings) Limited.
Subsequent to the statement of financial position date, Bestway held 51.07% of the issued and outstanding ordinary sharesof the Bank whereas control shall continue to rest with the consortium of ADG and Bestway for which all regulatory approvalshave been obtained.
United Bank Limited214
[ Notes to and forming part of the ConsolidatedFinancial Statements For the year ended December 31, 2010 ]
Note 2010 2009(Rupees in ‘000)
21. SURPLUS / (DEFICIT) ON REVALUATION OF ASSETS -NET OF DEFERRED TAX
Surplus arising on revaluation of assets - net of tax :Fixed assets- Group's share 10,865,342 10,870,484- Non-controlling interest 386,706 185,357
21.1 11,252,048 11,055,841Securities
- Group's share (2,159,801) (1,976,173)- Non-controlling interest (1,014) -
21.2 (2,160,815) (1,976,173)
(Deficit) / Surplus arising on revaluation of assets of associates (84,263) 44,2689,006,970 9,123,936
21.1 Surplus on revaluation of fixed assets
Surplus on revaluation of fixed assets at January 01 16,331,741 12,957,920
Revaluation of fixed assets during the year / adjustments 467,625 3,646,052Exchange adjustments (12,251) 146,055Written off during the year - (27,071)Transferred to unappropriated profit in respect of incremental
depreciation charged during the year (256,075) (254,977)Related deferred tax liability on incremental depreciation charged
during the year 12.1 (136,794) (136,238)62,505 3,373,821
16,394,246 16,331,741Less: Related deferred tax liability on:
Revaluation as on January 01 5,275,900 3,972,755Revaluation of fixed assets during the year 3,092 1,448,858Written off during the year - (9,475)Incremental depreciation charged on related assets (136,794) (136,238)
12.1 5,142,198 5,275,90011,252,048 11,055,841
21.2 Surplus / (Deficit) on revaluation of available-for-sale securities
Market Treasury Bills (55,830) 20,995Pakistan Investment Bonds (1,937,605) (1,129,224)Listed shares (34,452) 95,326Mutual fund units (709) (2,302)Term Finance Certificates, Sukuk, other Bonds etc (27,242) (41,213)Overseas securities (1,267,279) (1,986,189)
(3,323,117) (3,042,607)Related deferred tax asset 12.1 1,162,302 1,066,434
(2,160,815) (1,976,173)
215Annual Report 2010
[ Notes to and forming part of the ConsolidatedFinancial Statements For the year ended December 31, 2010 ]
2010 2009(Rupees in ‘000)
22. CONTINGENCIES AND COMMITMENTS
22.1 Direct credit substitutes
Contingent liabilities in respect of guarantees given favouringGovernment 8,742,208 10,831,974Banking companies and other financial institutions 5,766,641 2,910,518Others 6,124,874 7,396,201
20,633,723 21,138,69322.2 Transaction-related contingent liabilities
Contingent liabilities in respect of performance bonds,bid bonds, warranties, etc. given favouring
Government 82,423,478 77,448,985Banking companies and other financial institutions 2,470,740 3,311,075Others 14,018,380 18,521,775
98,912,598 99,281,83522.3 Trade-related contingent liabilities
Contingent liabilities in respect of letters of credit opened favouringGovernment 58,188,686 56,186,541Banking companies and other financial institutions 760,593 -Others 69,387,773 62,787,741
128,337,052 118,974,28222.4 Other contingencies
Claims against the Group not acknowledged as debts 29,938,014 20,670,923
22.5 Commitments in respect of forward lending
The Group makes commitments to extend credit in the normal course of its business but these being revocable commitmentsdo not attract any significant penalty or expense if the facility is unilaterally withdrawn.
22.6 Commitments in respect of forward foreign exchange contracts
Sale 85,906,329 47,499,455
Purchase 131,134,706 92,086,590
22.7 Commitments in respect of derivatives
Interest rate swaps 6,985,703 11,014,381
Cross currency swaps 35,570,843 36,372,837
Swaptions - 2,527,248
FX Options - purchased 2,055,442 410,535
FX Options - sold 2,055,442 410,535
Forward sale contracts of government securities 441,981 -
22.8 Commitments in respect of capital expenditure 576,398 575,176
22.9 For contingencies relating to taxation refer note 13.1
United Bank Limited216
[ Notes to and forming part of the ConsolidatedFinancial Statements For the year ended December 31, 2010 ]
23. DERIVATIVE INSTRUMENTS
Derivatives are a type of financial contract, the value of which is determined by reference to one or more underlying assets orindices. The major categories of such contracts include forwards, futures, swaps and options. Derivatives also includestructured financial products that have one or more characteristics of forwards, futures, swaps and options.
The Bank as an Authorized Derivative Dealer (ADD) is an active participant in the Pakistan derivatives market. Although theADD license covers the below mentioned transactions only (permitted under Financial Derivatives Business Regulations issuedby the SBP), the Group offers a wide variety of derivative products to satisfy customers’ needs, specific approval for whichis sought from the SBP on a transaction by transaction basis:
(a) Foreign Currency Options(b) Forward Rate Agreements(c) Interest Rate Swaps(d) Cross Currency Swaps(e) Equity indices(f) Commodity options
These transactions cover both the aspects of market making and hedging.
The authority for approving policies lies with the Board of Directors (BoD) and Board Risk Management Committee (BRMC),who has delegated its powers to the Market Risk Committee (MRC).
With regard to derivatives, the MRC is authorized to:
- Review the derivatives business with reference to market risk exposure and assign various limits in accordance with therisk appetite of the Bank.
- Review and approve the Derivatives Business Policy- Review and sign off derivatives product programs- Authorize changes in procedures and processes regarding derivatives and structured products
Overall responsibility for derivatives trading activity lies with the Treasury and Capital Markets Group (TCM). Identifying andquantifying market risk on derivatives, coordinating approvals on temporary or permanent market risk limits, formulation ofpolicies and procedures with respect to market risk arising from derivatives, formal monitoring of market and credit riskexposure and limits and its reporting to the senior management and BoD is done by the Treasury and Market Risk (TMR)Department. Treasury Operations records derivative activity in the Group's books, and handles its reporting to the SBP.
Derivative Risk Management
There are a number of risks undertaken by the Group, which need to be monitored and assessed, which include:
217Annual Report 2010
[ Notes to and forming part of the ConsolidatedFinancial Statements For the year ended December 31, 2010 ]
Credit Risk
Credit risk refers to the risk of non-performance or default by a party (a customer, guarantor, trade counterparty, third party,etc.), resulting in an adverse impact on the Group’s profitability. Credit risk associated with derivative transactions iscategorized into settlement risk and pre-settlement risk. Credit limit proposals for derivative transactions are reviewed byHead Market and Treasury Risk who recomends the appropriate limits to the Credit Committee for approval. Credit exposureof each counterparty is estimated and monitored by Treasury Middle Office on daily basis. Settlement risk is also mitigatedby netting off the amounts receivable and payable i.e., the net amount is either received or paid.
Market Risk
The Group, as a policy, hedges back-to-back all Options transactions. The Group also does not carry any exchange risk onits Cross Currency Swaps portfolio as it hedges the exposure in the interbank market. To manage interest rate risk of InterestRate Derivatives the Group has implemented various limits which are monitored and reported by Treasury Middle Office ondaily basis.
Liquidity Risk
Derivative transactions, usually being non-funded in nature, do not involve funds therefore there is no specific risk of liquidity.
However, there is another aspect of liquidity which is the availability of certain instruments or hedges in the market. This isrelevant to the Pakistan market, as interest rate derivatives have a uni-directional demand, and no perfect hedge is available.The Group mitigates its risk, on one side, by limiting the portfolio in terms of tenor, notional and sensitivity limits, and on theother side by taking on and off balance sheet positions in the interbank market, where available.
Operational Risk
The staff involved in the process of trading, settlement and risk management of derivatives are carefully trained to deal withthe complexities involved in the process. A state-of-the-art system has been put in place which handles derivative transactions.Each transaction is processed in accordance with the product program or transaction memo, which contains detailedaccounting and operational aspects of the transaction to further mitigate operational risk. In addition, the Treasury MiddleOffice and the Compliance and Control Department are assigned the responsibility of monitoring any deviation from thepolicies and procedures. The Group’s Audit and Inspection Group also reviews this function, which covers regular review ofsystems, transactional processes, accounting practices, end-user roles and responsibilities.
The Bank has installed a state of the art derivatives system called 'Super Derivatives' which provides an end-to-end solution.Other than supporting the routine transactional process it also provides analytical tools to measure various risk exposures,stress tests and sensitivity analysis.
Treasury Middle Office produces various reports for higher management (BoD, BRMC, MRC, etc) on a periodic basis. Thesereports provide details of the derivatives business profile and various risk exposures.
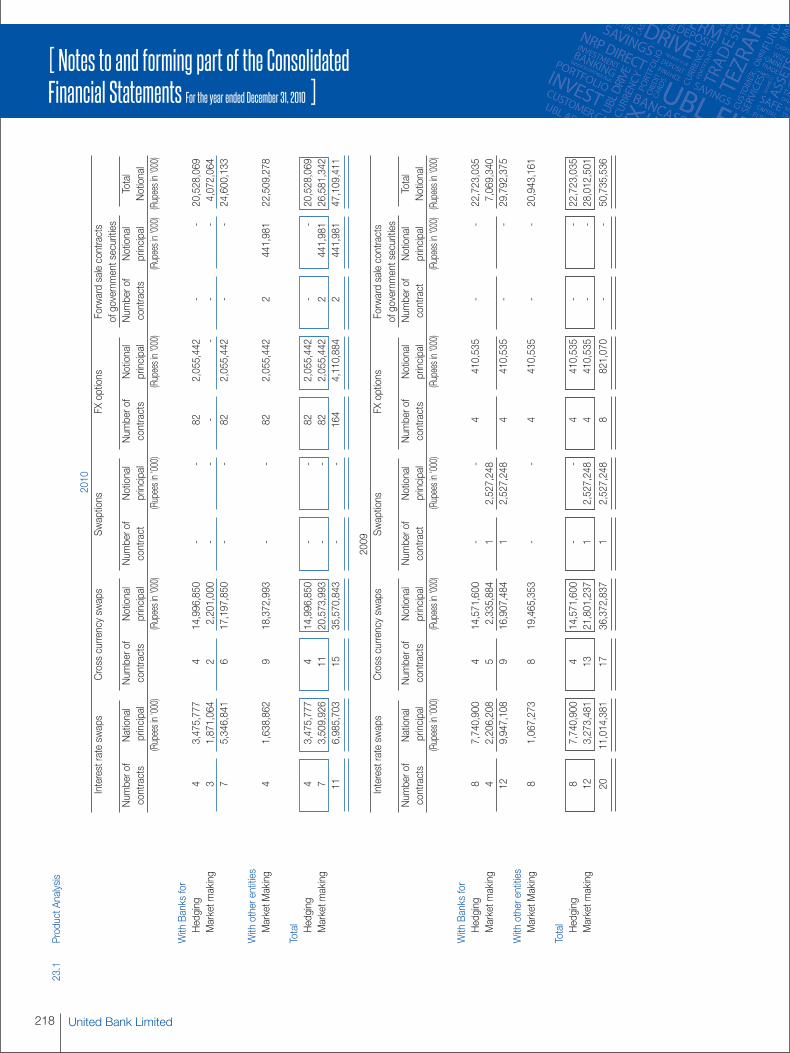
United Bank Limited218
[ Notes to and forming part of the ConsolidatedFinancial Statements For the year ended December 31, 2010 ]
23.1
ProductAnalysis
2010
Interestrateswaps
Crosscurrencyswaps
Swaptions
FXoptions
Forwardsalecontracts
ofgovernmentsecurities
Num
berof
National
Num
berof
Notional
Num
berof
Notional
Num
berof
Notional
Num
berof
Notional
Total
contracts
principal
contracts
principal
contract
principal
contracts
principal
contracts
principal
Notional
(Rupeesin'000)
(Rupeesin'000)
(Rupeesin'000)
(Rupeesin'000)
(Rupeesin'000)
(Rupeesin'000)
WithBanksfor
Hedging
43,475,777
414,996,850
--
822,055,442
--
20,528,069
Marketm
aking
31,871,064
22,201,000
--
--
--
4,072,064
75,346,841
617,197,850
--
822,055,442
--
24,600,133
Withotherentities
MarketM
aking
41,638,862
918,372,993
--
822,055,442
2441,981
22,509,278
Total
Hedging
43,475,777
414,996,850
--
822,055,442
--
20,528,069
Marketm
aking
73,509,926
1120,573,993
--
822,055,442
2441,981
26,581,342
116,985,703
1535,570,843
--
164
4,110,884
2441,981
47,109,411
2009
Interestrateswaps
Crosscurrencyswaps
Swaptions
FXoptions
Forwardsalecontracts
ofgovernmentsecurities
Num
berof
National
Num
berof
Notional
Num
berof
Notional
Num
berof
Notional
Num
berof
Notional
Total
contracts
principal
contracts
principal
contract
principal
contracts
principal
contract
principal
Notional
(Rupeesin'000)
(Rupeesin'000)
(Rupeesin'000)
(Rupeesin'000)
(Rupeesin'000)
(Rupeesin'000)
WithBanksfor
Hedging
87,740,900
414,571,600
--
4410,535
--
22,723,035
Marketm
aking
42,206,208
52,335,884
12,527,248
7,069,340
129,947,108
916,907,484
12,527,248
4410,535
--
29,792,375
Withotherentities
MarketM
aking
81,067,273
819,465,353
--
4410,535
--
20,943,161
Total
Hedging
87,740,900
414,571,600
--
4410,535
--
22,723,035
Marketm
aking
123,273,481
1321,801,237
12,527,248
4410,535
--
28,012,501
2011,014,381
1736,372,837
12,527,248
8821,070
--
50,735,536
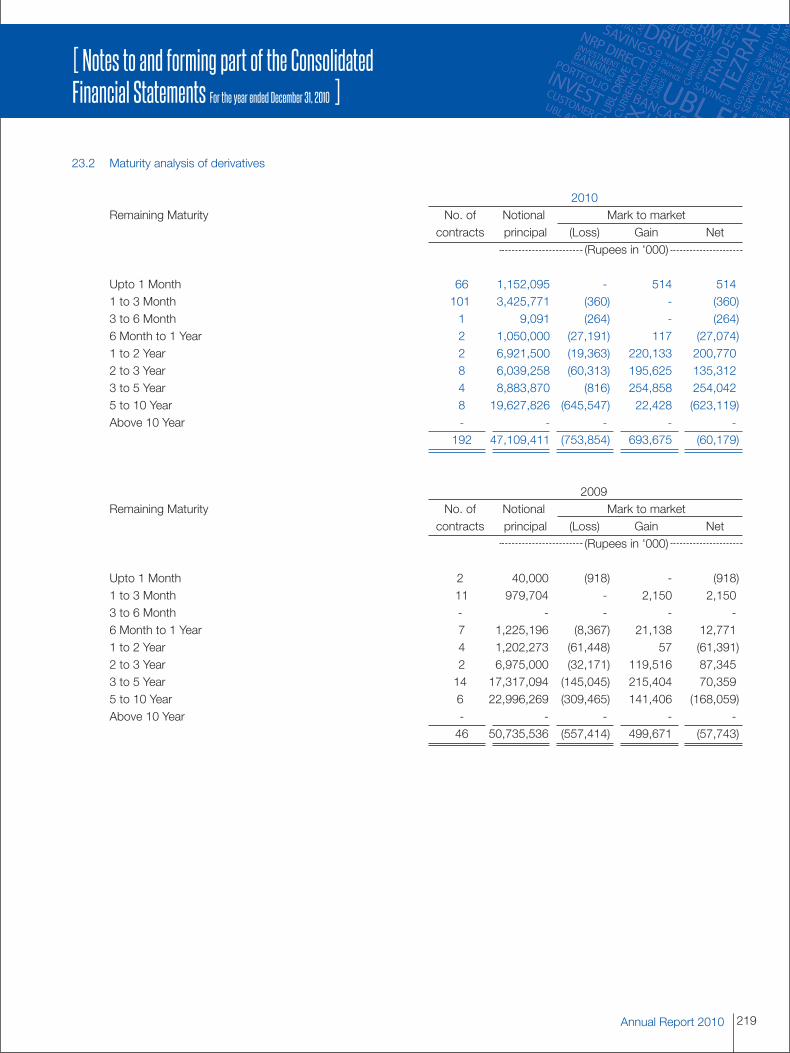
219Annual Report 2010
[ Notes to and forming part of the ConsolidatedFinancial Statements For the year ended December 31, 2010 ]
23.2 Maturity analysis of derivatives
2010Remaining Maturity No. of Notional Mark to market
contracts principal (Loss) Gain Net(Rupees in '000)
Upto 1 Month 66 1,152,095 - 514 5141 to 3 Month 101 3,425,771 (360) - (360)3 to 6 Month 1 9,091 (264) - (264)6 Month to 1 Year 2 1,050,000 (27,191) 117 (27,074)1 to 2 Year 2 6,921,500 (19,363) 220,133 200,7702 to 3 Year 8 6,039,258 (60,313) 195,625 135,3123 to 5 Year 4 8,883,870 (816) 254,858 254,0425 to 10 Year 8 19,627,826 (645,547) 22,428 (623,119)Above 10 Year - - - - -
192 47,109,411 (753,854) 693,675 (60,179)
2009Remaining Maturity No. of Notional Mark to market
contracts principal (Loss) Gain Net(Rupees in '000)
Upto 1 Month 2 40,000 (918) - (918)1 to 3 Month 11 979,704 - 2,150 2,1503 to 6 Month - - - - -6 Month to 1 Year 7 1,225,196 (8,367) 21,138 12,7711 to 2 Year 4 1,202,273 (61,448) 57 (61,391)2 to 3 Year 2 6,975,000 (32,171) 119,516 87,3453 to 5 Year 14 17,317,094 (145,045) 215,404 70,3595 to 10 Year 6 22,996,269 (309,465) 141,406 (168,059)Above 10 Year - - - - -
46 50,735,536 (557,414) 499,671 (57,743)
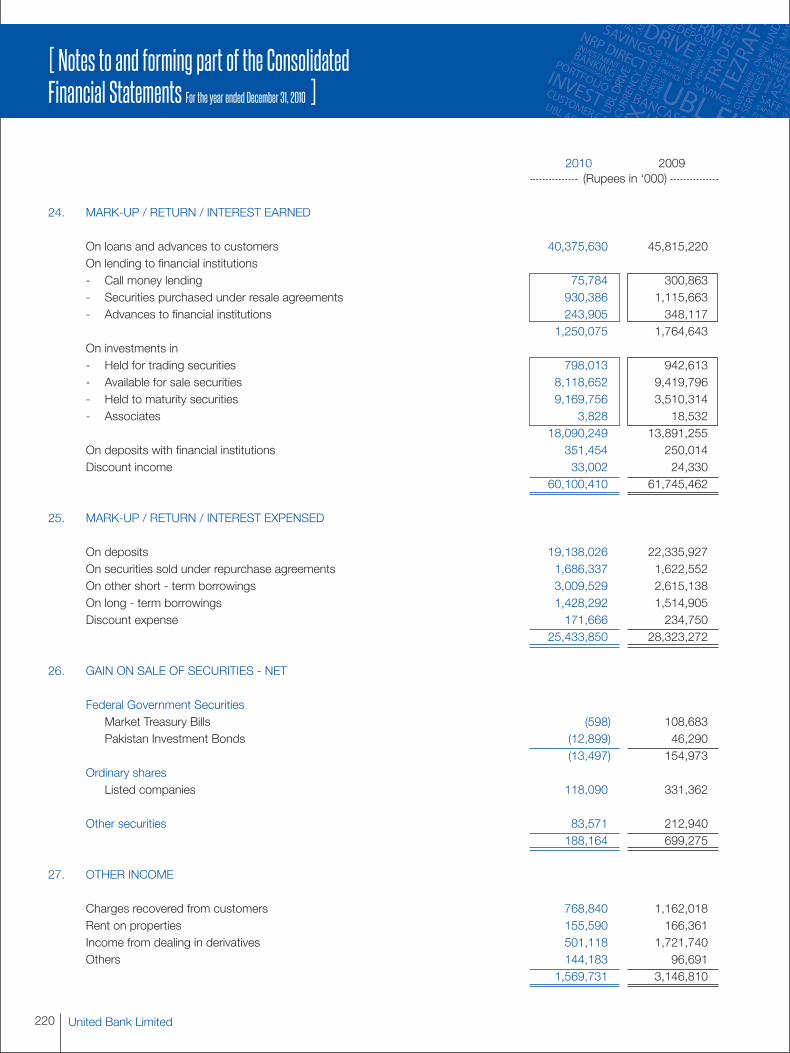
United Bank Limited220
[ Notes to and forming part of the ConsolidatedFinancial Statements For the year ended December 31, 2010 ]
2010 2009(Rupees in ‘000)
24. MARK-UP / RETURN / INTEREST EARNED
On loans and advances to customers 40,375,630 45,815,220On lending to financial institutions- Call money lending 75,784 300,863- Securities purchased under resale agreements 930,386 1,115,663- Advances to financial institutions 243,905 348,117
1,250,075 1,764,643On investments in- Held for trading securities 798,013 942,613- Available for sale securities 8,118,652 9,419,796- Held to maturity securities 9,169,756 3,510,314- Associates 3,828 18,532
18,090,249 13,891,255On deposits with financial institutions 351,454 250,014Discount income 33,002 24,330
60,100,410 61,745,462
25. MARK-UP / RETURN / INTEREST EXPENSED
On deposits 19,138,026 22,335,927On securities sold under repurchase agreements 1,686,337 1,622,552On other short - term borrowings 3,009,529 2,615,138On long - term borrowings 1,428,292 1,514,905Discount expense 171,666 234,750
25,433,850 28,323,272
26. GAIN ON SALE OF SECURITIES - NET
Federal Government SecuritiesMarket Treasury Bills (598) 108,683Pakistan Investment Bonds (12,899) 46,290
(13,497) 154,973Ordinary shares
Listed companies 118,090 331,362
Other securities 83,571 212,940188,164 699,275
27. OTHER INCOME
Charges recovered from customers 768,840 1,162,018Rent on properties 155,590 166,361Income from dealing in derivatives 501,118 1,721,740Others 144,183 96,691
1,569,731 3,146,810
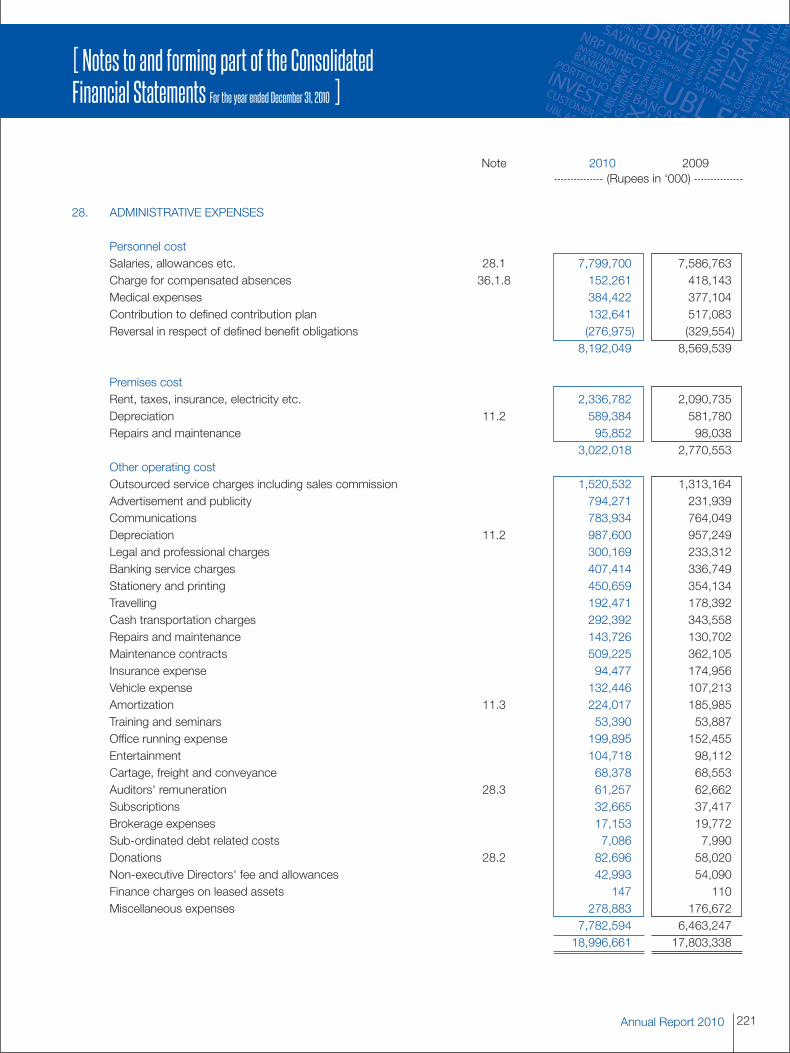
221Annual Report 2010
[ Notes to and forming part of the ConsolidatedFinancial Statements For the year ended December 31, 2010 ]
Note 2010 2009(Rupees in ‘000)
28. ADMINISTRATIVE EXPENSES
Personnel costSalaries, allowances etc. 28.1 7,799,700 7,586,763Charge for compensated absences 36.1.8 152,261 418,143Medical expenses 384,422 377,104Contribution to defined contribution plan 132,641 517,083Reversal in respect of defined benefit obligations (276,975) (329,554)
8,192,049 8,569,539
Premises costRent, taxes, insurance, electricity etc. 2,336,782 2,090,735Depreciation 11.2 589,384 581,780Repairs and maintenance 95,852 98,038
3,022,018 2,770,553Other operating costOutsourced service charges including sales commission 1,520,532 1,313,164Advertisement and publicity 794,271 231,939Communications 783,934 764,049Depreciation 11.2 987,600 957,249Legal and professional charges 300,169 233,312Banking service charges 407,414 336,749Stationery and printing 450,659 354,134Travelling 192,471 178,392Cash transportation charges 292,392 343,558Repairs and maintenance 143,726 130,702Maintenance contracts 509,225 362,105Insurance expense 94,477 174,956Vehicle expense 132,446 107,213Amortization 11.3 224,017 185,985Training and seminars 53,390 53,887Office running expense 199,895 152,455Entertainment 104,718 98,112Cartage, freight and conveyance 68,378 68,553Auditors' remuneration 28.3 61,257 62,662Subscriptions 32,665 37,417Brokerage expenses 17,153 19,772Sub-ordinated debt related costs 7,086 7,990Donations 28.2 82,696 58,020Non-executive Directors' fee and allowances 42,993 54,090Finance charges on leased assets 147 110Miscellaneous expenses 278,883 176,672
7,782,594 6,463,24718,996,661 17,803,338

United Bank Limited222
[ Notes to and forming part of the ConsolidatedFinancial Statements For the year ended December 31, 2010 ]
28.1 This includes employee benefits in the form of awards / bonus to all permanent staff including the Chief Executive Officer andis determined on the basis of employees' evaluation and the Bank's performance during the year. The aggregate benefitdetermined in respect of all permanent staff amounted to Rs.571.276 million (2009: Rs.318.812 million).
Note 2010 2009(Rupees in ‘000)
28.2 Donations exceeding Rs.0.1 million
Karachi Education Initiative 28.2.1 40,000 40,000UBL Flood Relief Campaign 28,142 -Police Hospital Fund 5,000 -The Citizens Foundation 2,200 -Hisaar Foundation 1,086 550Friends of Burns Centre 1,008 1,728Family Education Services Foundation 900 900Marie Adelaide Leprosy Centre 850 850Lahore University of Management Sciences 815 315Patient Welfare Association 800 -SOS Childrens' Villages of Sindh 581 451Edhi Foundation 550 -Glückskette - Switzerland 410 -Special Olympics Pakistan 200 -Umeed-e-Noor 150 -Karachi City Police - 9,793Shalamar Hospital - 545Sun Development Foundation - 483Institute of Business Administration - 360
82,692 55,975
28.2.1 The President is a Director on the Board of the Karachi Education Initiative, a sponsoring and fund raising entity of the KarachiSchool for Business and Leadership.
28.3 Auditors' remuneration
2010Ernst & Young BDO Overseas TotalFord Rhodes Ebrahim AuditorsSidat Hyder & Co.
(Rupees in '000)
Audit fee 5,738 5,738 45,361 56,837Fee for audit of EPZ branch 250 - - 250Fee for audit of domestic subsidiaries - 502 - 502Out of pocket expenses 1,725 1,709 234 3,668
7,713 7,949 45,595 61,257
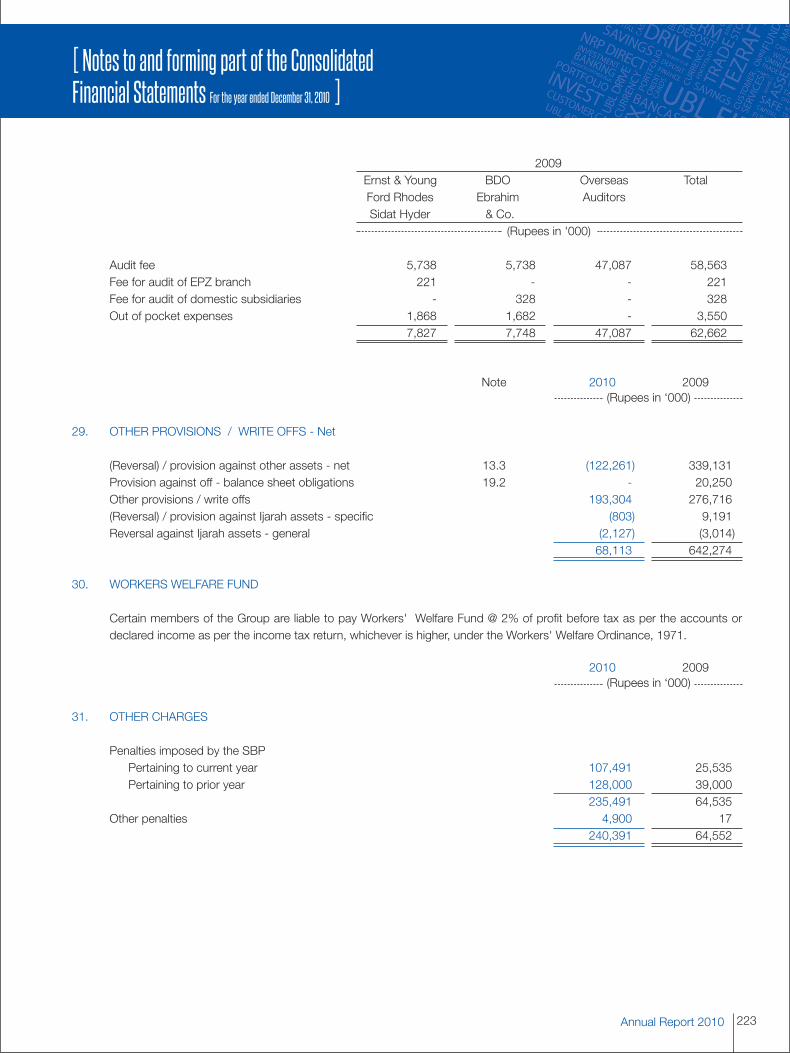
223Annual Report 2010
[ Notes to and forming part of the ConsolidatedFinancial Statements For the year ended December 31, 2010 ]
2009Ernst & Young BDO Overseas TotalFord Rhodes Ebrahim AuditorsSidat Hyder & Co.
(Rupees in '000)
Audit fee 5,738 5,738 47,087 58,563Fee for audit of EPZ branch 221 - - 221Fee for audit of domestic subsidiaries - 328 - 328Out of pocket expenses 1,868 1,682 - 3,550
7,827 7,748 47,087 62,662
Note 2010 2009(Rupees in ‘000)
29. OTHER PROVISIONS / WRITE OFFS - Net
(Reversal) / provision against other assets - net 13.3 (122,261) 339,131Provision against off - balance sheet obligations 19.2 - 20,250Other provisions / write offs 193,304 276,716(Reversal) / provision against Ijarah assets - specific (803) 9,191Reversal against Ijarah assets - general (2,127) (3,014)
68,113 642,274
30. WORKERS WELFARE FUND
Certain members of the Group are liable to pay Workers' Welfare Fund @ 2% of profit before tax as per the accounts ordeclared income as per the income tax return, whichever is higher, under the Workers' Welfare Ordinance, 1971.
2010 2009(Rupees in ‘000)
31. OTHER CHARGES
Penalties imposed by the SBPPertaining to current year 107,491 25,535Pertaining to prior year 128,000 39,000
235,491 64,535Other penalties 4,900 17
240,391 64,552
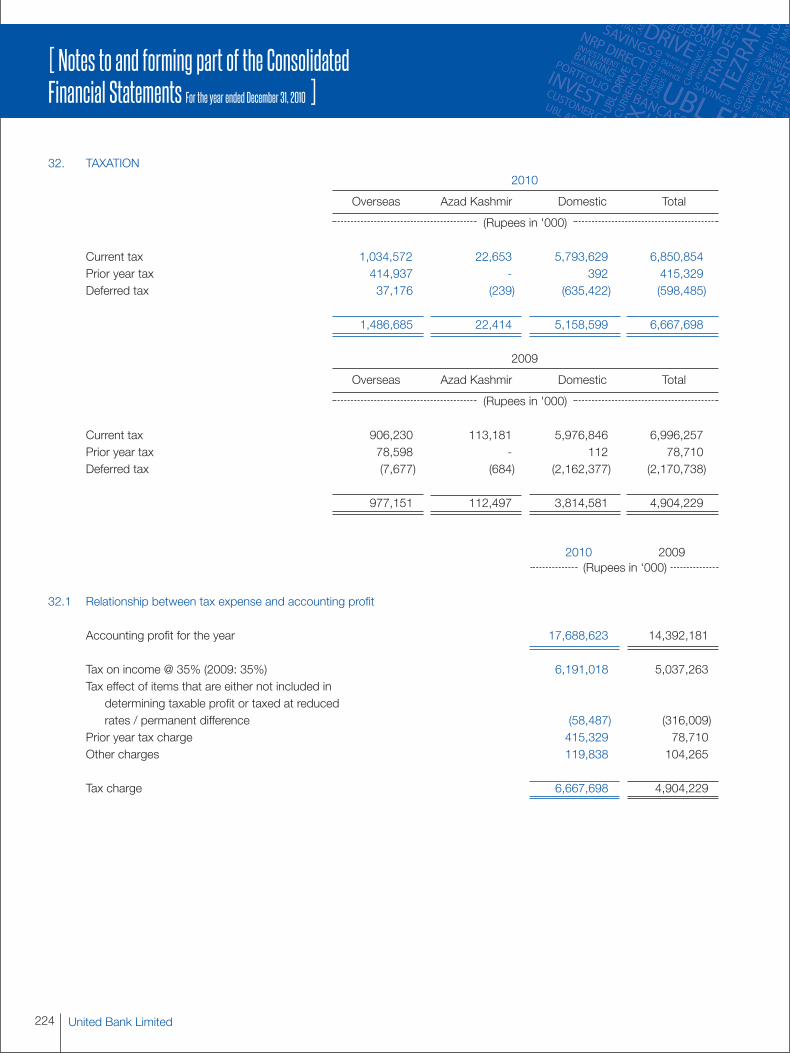
United Bank Limited224
[ Notes to and forming part of the ConsolidatedFinancial Statements For the year ended December 31, 2010 ]
32. TAXATION2010
Overseas Azad Kashmir Domestic Total
(Rupees in '000)
Current tax 1,034,572 22,653 5,793,629 6,850,854Prior year tax 414,937 - 392 415,329Deferred tax 37,176 (239) (635,422) (598,485)
1,486,685 22,414 5,158,599 6,667,698
2009
Overseas Azad Kashmir Domestic Total
(Rupees in '000)
Current tax 906,230 113,181 5,976,846 6,996,257Prior year tax 78,598 - 112 78,710Deferred tax (7,677) (684) (2,162,377) (2,170,738)
977,151 112,497 3,814,581 4,904,229
2010 2009(Rupees in ‘000)
32.1 Relationship between tax expense and accounting profit
Accounting profit for the year 17,688,623 14,392,181
Tax on income @ 35% (2009: 35%) 6,191,018 5,037,263Tax effect of items that are either not included in
determining taxable profit or taxed at reducedrates / permanent difference (58,487) (316,009)
Prior year tax charge 415,329 78,710Other charges 119,838 104,265
Tax charge 6,667,698 4,904,229
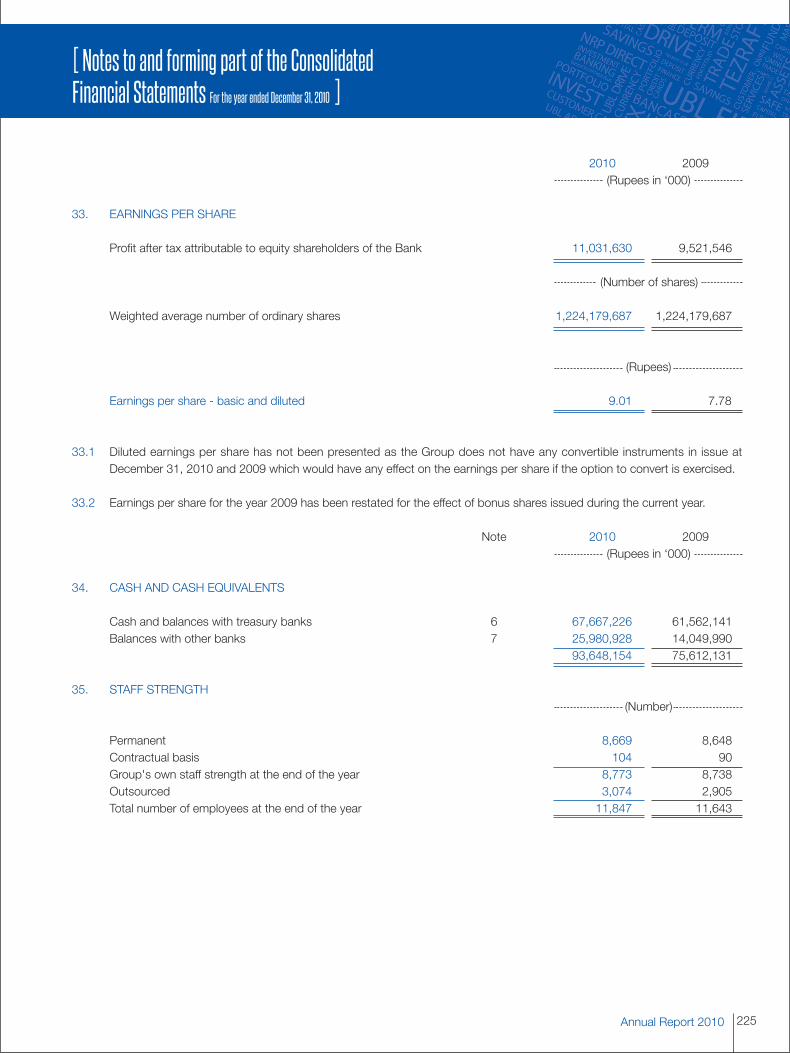
225Annual Report 2010
[ Notes to and forming part of the ConsolidatedFinancial Statements For the year ended December 31, 2010 ]
2010 2009(Rupees in ‘000)
33. EARNINGS PER SHARE
Profit after tax attributable to equity shareholders of the Bank 11,031,630 9,521,546
(Number of shares)
Weighted average number of ordinary shares 1,224,179,687 1,224,179,687
(Rupees)
Earnings per share - basic and diluted 9.01 7.78
33.1 Diluted earnings per share has not been presented as the Group does not have any convertible instruments in issue atDecember 31, 2010 and 2009 which would have any effect on the earnings per share if the option to convert is exercised.
33.2 Earnings per share for the year 2009 has been restated for the effect of bonus shares issued during the current year.
Note 2010 2009(Rupees in ‘000)
34. CASH AND CASH EQUIVALENTS
Cash and balances with treasury banks 6 67,667,226 61,562,141Balances with other banks 7 25,980,928 14,049,990
93,648,154 75,612,131
35. STAFF STRENGTH(Number)
Permanent 8,669 8,648Contractual basis 104 90Group's own staff strength at the end of the year 8,773 8,738Outsourced 3,074 2,905Total number of employees at the end of the year 11,847 11,643

United Bank Limited226
[ Notes to and forming part of the ConsolidatedFinancial Statements For the year ended December 31, 2010 ]
36. EMPLOYEE BENEFITS
36.1 United Bank Limited
36.1.1 Defined benefit plan
36.1.2 General description
The Bank operates a funded pension scheme established in 1986. The Bank also operates a funded gratuity scheme for newemployees and those employees who have not opted for the pension scheme. The Bank also operates a contributorybenevolent fund scheme and provides post retirement medical benefits to eligible retired employees. The benevolent fund planand the post-retirement medical plan cover all regular employees of the Bank who joined the Bank pre-privatisation. TheBank also maintains an employee compensated absences scheme. The liability of the Bank in respect of long-term employeecompensated absences is determined based on actuarial valuation carried out using the Projected Unit Credit Method.Actuarial valuation of the defined benefit plan scheme is carried out every year and the latest valuation was carried out as atDecember 31, 2010.
36.1.3 Number of Employees under the scheme
The number of employees covered under the following defined benefit scheme / plans are:
2010 2009(Number)
- Pension fund 7,723 7,845- Gratuity fund 5,589 5,416- Benevolent fund 7,490 7,888- Employee' compensated absences 6,708 6,942- Post retirement medical benefit scheme 4,480 4,790
The Pension fund, benevolent fund and post retirement medical benefit schemes include 5,384 (2009: 5,372), 3,010 (2009:3,098) and 2,228 (2009: 2,152) members respectively who have retired or whose widows are receiving the benefits.
36.1.4 Principal actuarial assumptions
The actuarial valuations were carried out as at December 31, 2010 based on the Projected Unit Credit Actuarial Cost Method,using the following significant assumptions:
2010 2009(Per annum)
Discount rate 14.50% 12.75%Expected rate of return on plan assets 14.50% 12.75%Expected rate of salary increase 12.50% 10.50%Expected rate of pension increase 6.75% 5.00%
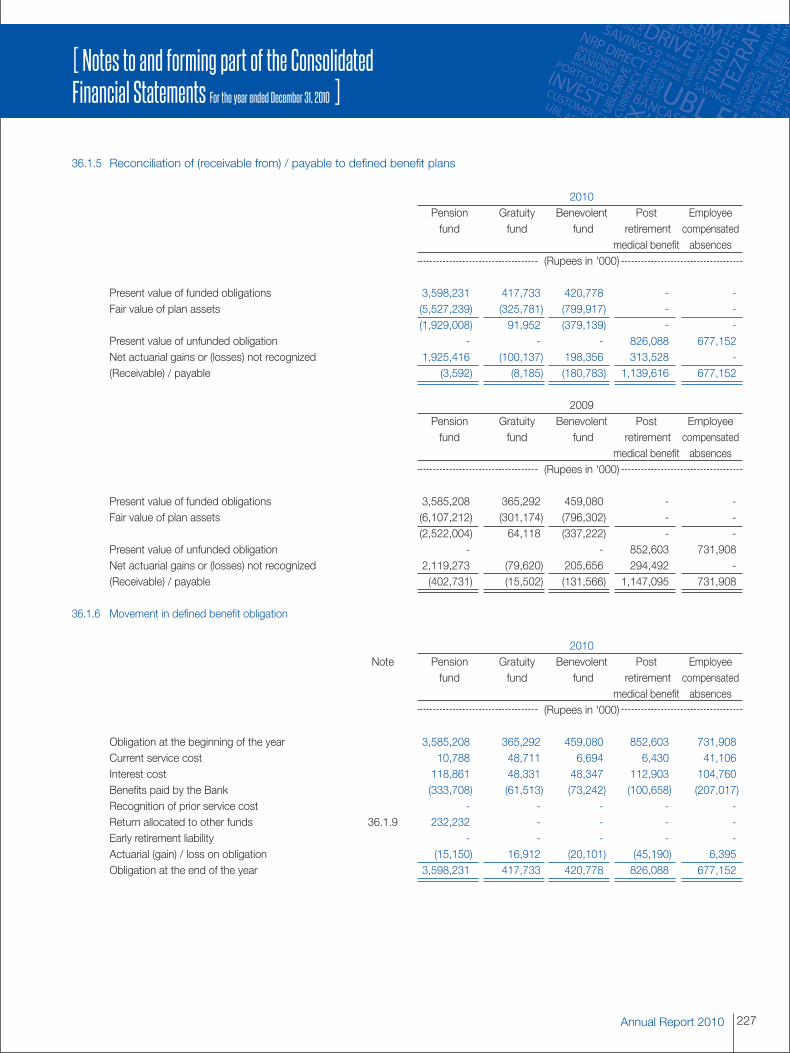
227Annual Report 2010
[ Notes to and forming part of the ConsolidatedFinancial Statements For the year ended December 31, 2010 ]
36.1.5 Reconciliation of (receivable from) / payable to defined benefit plans
2010Pension Gratuity Benevolent Post Employeefund fund fund retirement compensated
medical benefit absences(Rupees in '000)
Present value of funded obligations 3,598,231 417,733 420,778 - -Fair value of plan assets (5,527,239) (325,781) (799,917) - -
(1,929,008) 91,952 (379,139) - -Present value of unfunded obligation - - - 826,088 677,152Net actuarial gains or (losses) not recognized 1,925,416 (100,137) 198,356 313,528 -(Receivable) / payable (3,592) (8,185) (180,783) 1,139,616 677,152
2009Pension Gratuity Benevolent Post Employeefund fund fund retirement compensated
medical benefit absences(Rupees in '000)
Present value of funded obligations 3,585,208 365,292 459,080 - -Fair value of plan assets (6,107,212) (301,174) (796,302) - -
(2,522,004) 64,118 (337,222) - -Present value of unfunded obligation - - 852,603 731,908Net actuarial gains or (losses) not recognized 2,119,273 (79,620) 205,656 294,492 -(Receivable) / payable (402,731) (15,502) (131,566) 1,147,095 731,908
36.1.6 Movement in defined benefit obligation
2010Note Pension Gratuity Benevolent Post Employee
fund fund fund retirement compensatedmedical benefit absences
(Rupees in '000)
Obligation at the beginning of the year 3,585,208 365,292 459,080 852,603 731,908Current service cost 10,788 48,711 6,694 6,430 41,106Interest cost 118,861 48,331 48,347 112,903 104,760Benefits paid by the Bank (333,708) (61,513) (73,242) (100,658) (207,017)Recognition of prior service cost - - - - -Return allocated to other funds 36.1.9 232,232 - - - -Early retirement liability - - - - -Actuarial (gain) / loss on obligation (15,150) 16,912 (20,101) (45,190) 6,395Obligation at the end of the year 3,598,231 417,733 420,778 826,088 677,152
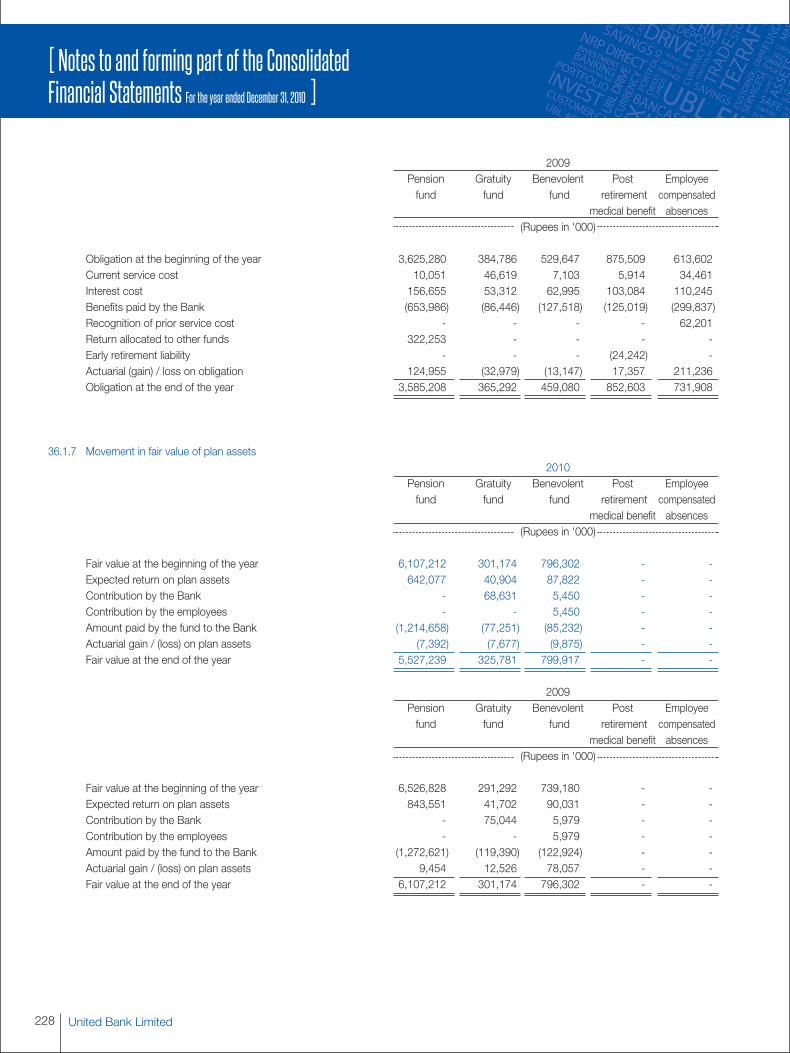
United Bank Limited228
[ Notes to and forming part of the ConsolidatedFinancial Statements For the year ended December 31, 2010 ]
2009Pension Gratuity Benevolent Post Employeefund fund fund retirement compensated
medical benefit absences(Rupees in '000)
Obligation at the beginning of the year 3,625,280 384,786 529,647 875,509 613,602Current service cost 10,051 46,619 7,103 5,914 34,461Interest cost 156,655 53,312 62,995 103,084 110,245Benefits paid by the Bank (653,986) (86,446) (127,518) (125,019) (299,837)Recognition of prior service cost - - - - 62,201Return allocated to other funds 322,253 - - - -Early retirement liability - - - (24,242) -Actuarial (gain) / loss on obligation 124,955 (32,979) (13,147) 17,357 211,236Obligation at the end of the year 3,585,208 365,292 459,080 852,603 731,908
36.1.7 Movement in fair value of plan assets2010
Pension Gratuity Benevolent Post Employeefund fund fund retirement compensated
medical benefit absences(Rupees in '000)
Fair value at the beginning of the year 6,107,212 301,174 796,302 - -Expected return on plan assets 642,077 40,904 87,822 - -Contribution by the Bank - 68,631 5,450 - -Contribution by the employees - - 5,450 - -Amount paid by the fund to the Bank (1,214,658) (77,251) (85,232) - -Actuarial gain / (loss) on plan assets (7,392) (7,677) (9,875) - -Fair value at the end of the year 5,527,239 325,781 799,917 - -
2009Pension Gratuity Benevolent Post Employeefund fund fund retirement compensated
medical benefit absences(Rupees in '000)
Fair value at the beginning of the year 6,526,828 291,292 739,180 - -Expected return on plan assets 843,551 41,702 90,031 - -Contribution by the Bank - 75,044 5,979 - -Contribution by the employees - - 5,979 - -Amount paid by the fund to the Bank (1,272,621) (119,390) (122,924) - -Actuarial gain / (loss) on plan assets 9,454 12,526 78,057 - -Fair value at the end of the year 6,107,212 301,174 796,302 - -
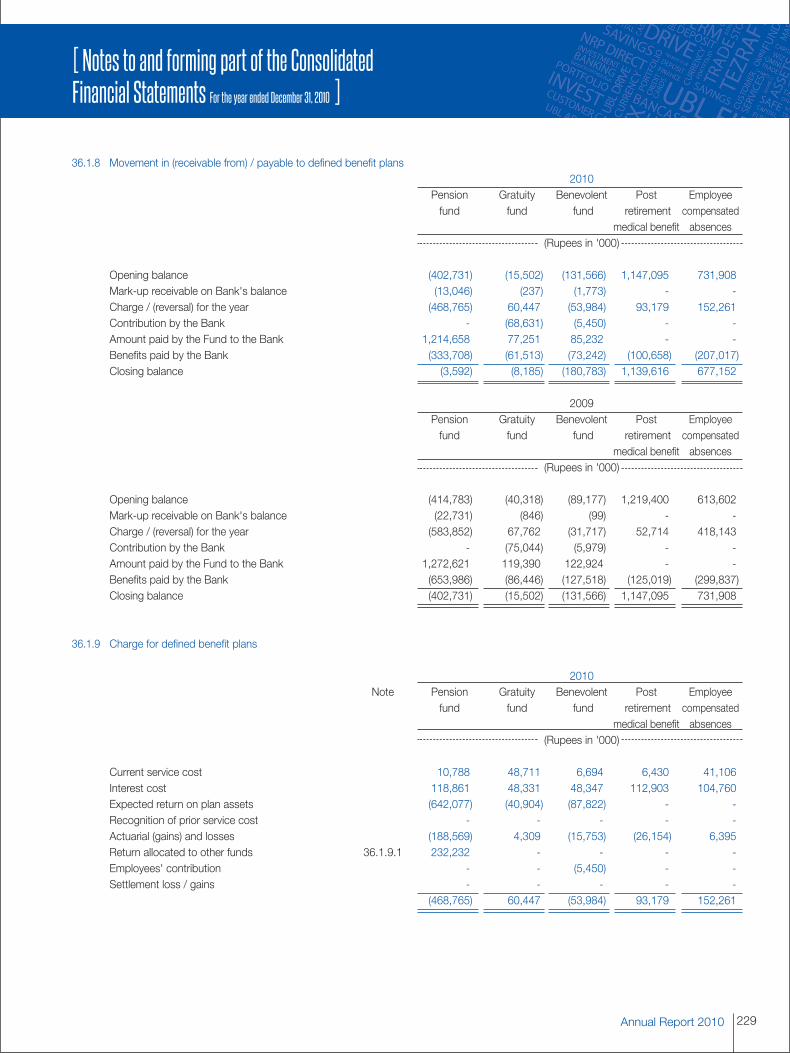
229Annual Report 2010
[ Notes to and forming part of the ConsolidatedFinancial Statements For the year ended December 31, 2010 ]
36.1.8 Movement in (receivable from) / payable to defined benefit plans2010
Pension Gratuity Benevolent Post Employeefund fund fund retirement compensated
medical benefit absences(Rupees in '000)
Opening balance (402,731) (15,502) (131,566) 1,147,095 731,908Mark-up receivable on Bank's balance (13,046) (237) (1,773) - -Charge / (reversal) for the year (468,765) 60,447 (53,984) 93,179 152,261Contribution by the Bank - (68,631) (5,450) - -Amount paid by the Fund to the Bank 1,214,658 77,251 85,232 - -Benefits paid by the Bank (333,708) (61,513) (73,242) (100,658) (207,017)Closing balance (3,592) (8,185) (180,783) 1,139,616 677,152
2009Pension Gratuity Benevolent Post Employeefund fund fund retirement compensated
medical benefit absences(Rupees in '000)
Opening balance (414,783) (40,318) (89,177) 1,219,400 613,602Mark-up receivable on Bank's balance (22,731) (846) (99) - -Charge / (reversal) for the year (583,852) 67,762 (31,717) 52,714 418,143Contribution by the Bank - (75,044) (5,979) - -Amount paid by the Fund to the Bank 1,272,621 119,390 122,924 - -Benefits paid by the Bank (653,986) (86,446) (127,518) (125,019) (299,837)Closing balance (402,731) (15,502) (131,566) 1,147,095 731,908
36.1.9 Charge for defined benefit plans
2010Note Pension Gratuity Benevolent Post Employee
fund fund fund retirement compensatedmedical benefit absences
(Rupees in '000)
Current service cost 10,788 48,711 6,694 6,430 41,106Interest cost 118,861 48,331 48,347 112,903 104,760Expected return on plan assets (642,077) (40,904) (87,822) - -Recognition of prior service cost - - - - -Actuarial (gains) and losses (188,569) 4,309 (15,753) (26,154) 6,395Return allocated to other funds 36.1.9.1 232,232 - - - -Employees' contribution - - (5,450) - -Settlement loss / gains - - - - -
(468,765) 60,447 (53,984) 93,179 152,261
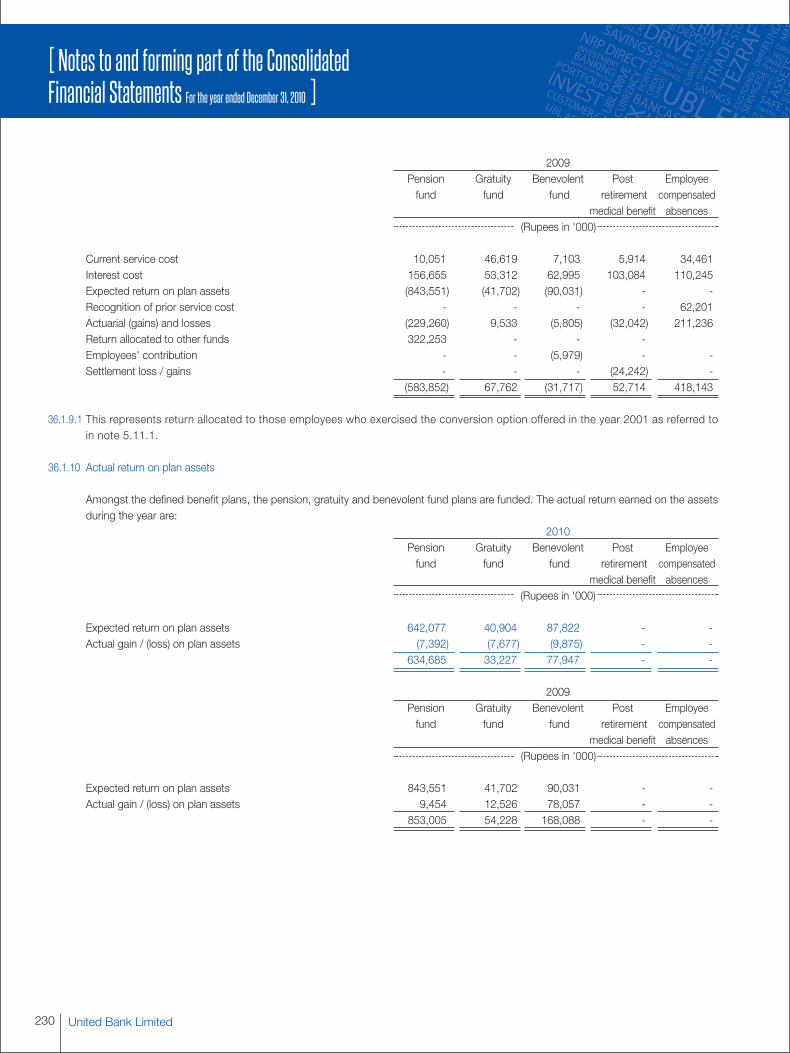
United Bank Limited230
[ Notes to and forming part of the ConsolidatedFinancial Statements For the year ended December 31, 2010 ]
2009Pension Gratuity Benevolent Post Employeefund fund fund retirement compensated
medical benefit absences(Rupees in '000)
Current service cost 10,051 46,619 7,103 5,914 34,461Interest cost 156,655 53,312 62,995 103,084 110,245Expected return on plan assets (843,551) (41,702) (90,031) - -Recognition of prior service cost - - - - 62,201Actuarial (gains) and losses (229,260) 9,533 (5,805) (32,042) 211,236Return allocated to other funds 322,253 - - -Employees' contribution - - (5,979) - -Settlement loss / gains - - - (24,242) -
(583,852) 67,762 (31,717) 52,714 418,143
36.1.9.1 This represents return allocated to those employees who exercised the conversion option offered in the year 2001 as referred toin note 5.11.1.
36.1.10 Actual return on plan assets
Amongst the defined benefit plans, the pension, gratuity and benevolent fund plans are funded. The actual return earned on the assetsduring the year are:
2010Pension Gratuity Benevolent Post Employeefund fund fund retirement compensated
medical benefit absences(Rupees in '000)
Expected return on plan assets 642,077 40,904 87,822 - -Actual gain / (loss) on plan assets (7,392) (7,677) (9,875) - -
634,685 33,227 77,947 - -
2009Pension Gratuity Benevolent Post Employeefund fund fund retirement compensated
medical benefit absences(Rupees in '000)
Expected return on plan assets 843,551 41,702 90,031 - -Actual gain / (loss) on plan assets 9,454 12,526 78,057 - -
853,005 54,228 168,088 - -
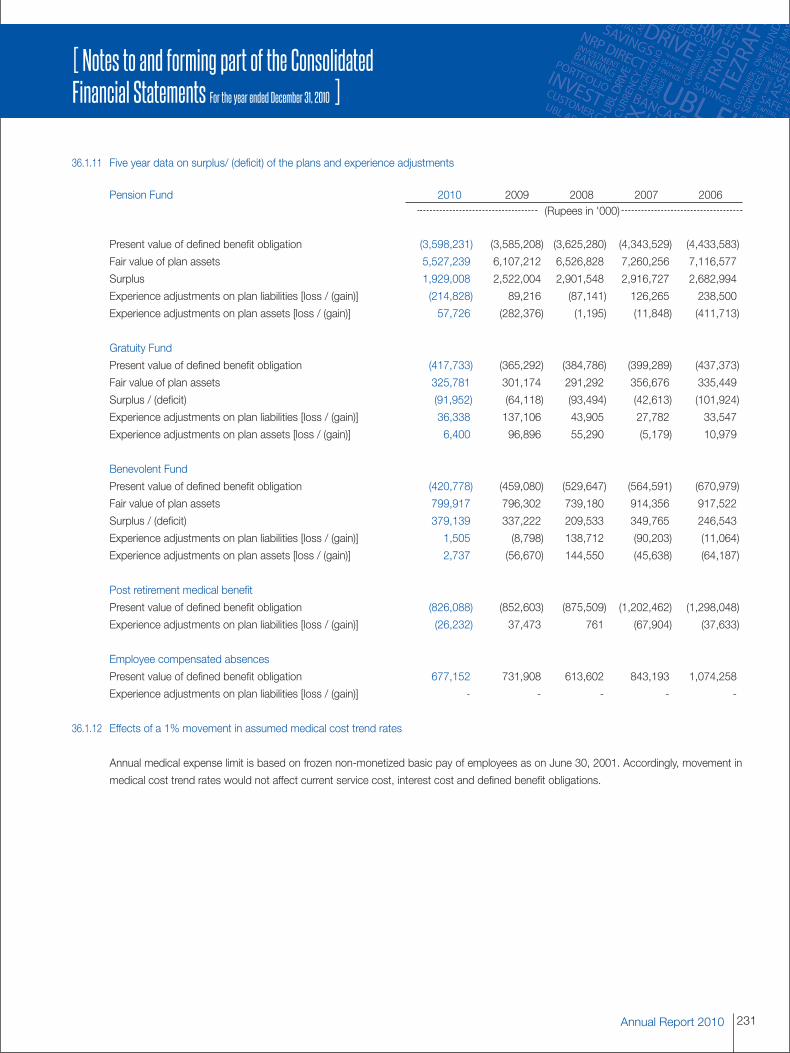
231Annual Report 2010
[ Notes to and forming part of the ConsolidatedFinancial Statements For the year ended December 31, 2010 ]
36.1.11 Five year data on surplus/ (deficit) of the plans and experience adjustments
Pension Fund 2010 2009 2008 2007 2006(Rupees in '000)
Present value of defined benefit obligation (3,598,231) (3,585,208) (3,625,280) (4,343,529) (4,433,583)
Fair value of plan assets 5,527,239 6,107,212 6,526,828 7,260,256 7,116,577
Surplus 1,929,008 2,522,004 2,901,548 2,916,727 2,682,994
Experience adjustments on plan liabilities [loss / (gain)] (214,828) 89,216 (87,141) 126,265 238,500
Experience adjustments on plan assets [loss / (gain)] 57,726 (282,376) (1,195) (11,848) (411,713)
Gratuity Fund
Present value of defined benefit obligation (417,733) (365,292) (384,786) (399,289) (437,373)
Fair value of plan assets 325,781 301,174 291,292 356,676 335,449
Surplus / (deficit) (91,952) (64,118) (93,494) (42,613) (101,924)
Experience adjustments on plan liabilities [loss / (gain)] 36,338 137,106 43,905 27,782 33,547
Experience adjustments on plan assets [loss / (gain)] 6,400 96,896 55,290 (5,179) 10,979
Benevolent Fund
Present value of defined benefit obligation (420,778) (459,080) (529,647) (564,591) (670,979)
Fair value of plan assets 799,917 796,302 739,180 914,356 917,522
Surplus / (deficit) 379,139 337,222 209,533 349,765 246,543
Experience adjustments on plan liabilities [loss / (gain)] 1,505 (8,798) 138,712 (90,203) (11,064)
Experience adjustments on plan assets [loss / (gain)] 2,737 (56,670) 144,550 (45,638) (64,187)
Post retirement medical benefit
Present value of defined benefit obligation (826,088) (852,603) (875,509) (1,202,462) (1,298,048)
Experience adjustments on plan liabilities [loss / (gain)] (26,232) 37,473 761 (67,904) (37,633)
Employee compensated absences
Present value of defined benefit obligation 677,152 731,908 613,602 843,193 1,074,258
Experience adjustments on plan liabilities [loss / (gain)] - - - - -
36.1.12 Effects of a 1% movement in assumed medical cost trend rates
Annual medical expense limit is based on frozen non-monetized basic pay of employees as on June 30, 2001. Accordingly, movement in
medical cost trend rates would not affect current service cost, interest cost and defined benefit obligations.
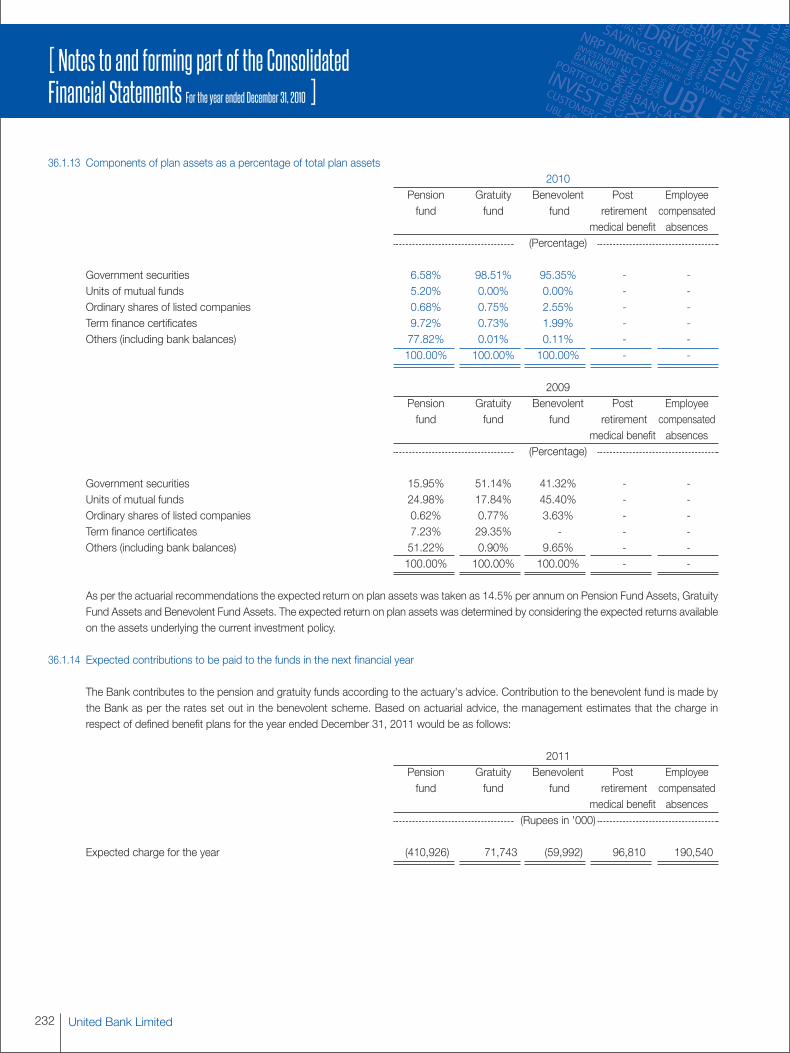
United Bank Limited232
[ Notes to and forming part of the ConsolidatedFinancial Statements For the year ended December 31, 2010 ]
36.1.13 Components of plan assets as a percentage of total plan assets2010
Pension Gratuity Benevolent Post Employeefund fund fund retirement compensated
medical benefit absences(Percentage)
Government securities 6.58% 98.51% 95.35% - -Units of mutual funds 5.20% 0.00% 0.00% - -Ordinary shares of listed companies 0.68% 0.75% 2.55% - -Term finance certificates 9.72% 0.73% 1.99% - -Others (including bank balances) 77.82% 0.01% 0.11% - -
100.00% 100.00% 100.00% - -
2009Pension Gratuity Benevolent Post Employeefund fund fund retirement compensated
medical benefit absences(Percentage)
Government securities 15.95% 51.14% 41.32% - -Units of mutual funds 24.98% 17.84% 45.40% - -Ordinary shares of listed companies 0.62% 0.77% 3.63% - -Term finance certificates 7.23% 29.35% - - -Others (including bank balances) 51.22% 0.90% 9.65% - -
100.00% 100.00% 100.00% - -
As per the actuarial recommendations the expected return on plan assets was taken as 14.5% per annum on Pension Fund Assets, GratuityFund Assets and Benevolent Fund Assets. The expected return on plan assets was determined by considering the expected returns availableon the assets underlying the current investment policy.
36.1.14 Expected contributions to be paid to the funds in the next financial year
The Bank contributes to the pension and gratuity funds according to the actuary's advice. Contribution to the benevolent fund is made bythe Bank as per the rates set out in the benevolent scheme. Based on actuarial advice, the management estimates that the charge inrespect of defined benefit plans for the year ended December 31, 2011 would be as follows:
2011Pension Gratuity Benevolent Post Employeefund fund fund retirement compensated
medical benefit absences(Rupees in '000)
Expected charge for the year (410,926) 71,743 (59,992) 96,810 190,540
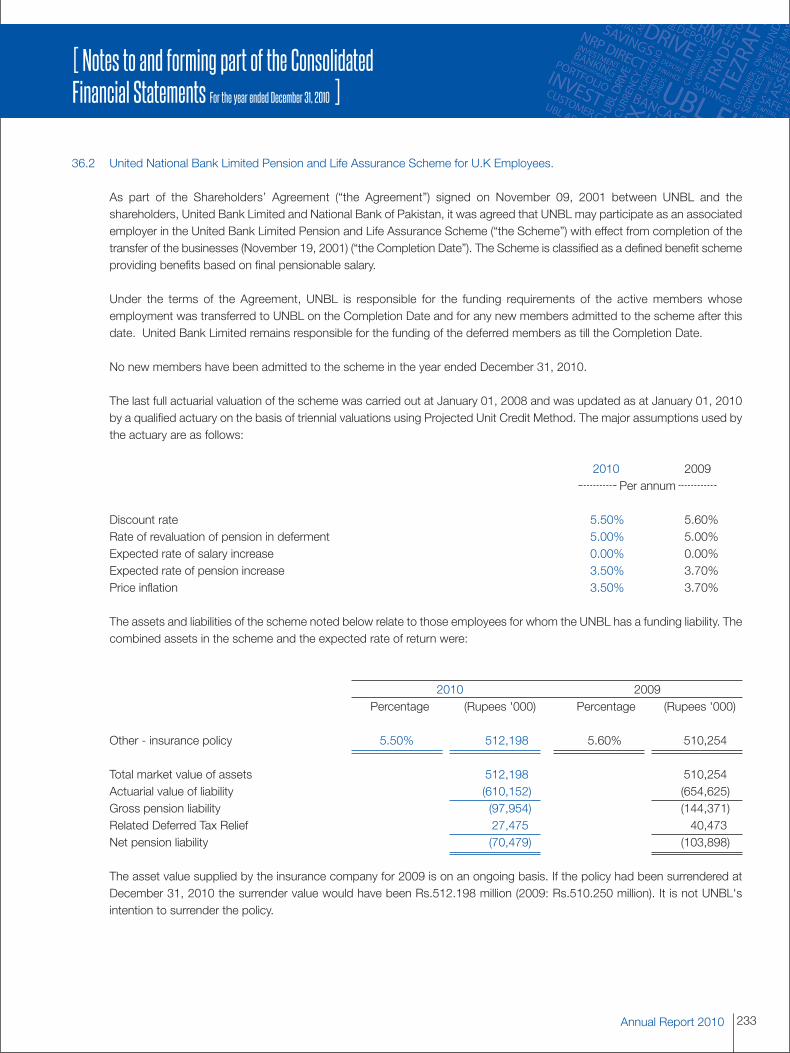
233Annual Report 2010
[ Notes to and forming part of the ConsolidatedFinancial Statements For the year ended December 31, 2010 ]
36.2 United National Bank Limited Pension and Life Assurance Scheme for U.K Employees.
As part of the Shareholders’ Agreement (“the Agreement”) signed on November 09, 2001 between UNBL and theshareholders, United Bank Limited and National Bank of Pakistan, it was agreed that UNBL may participate as an associatedemployer in the United Bank Limited Pension and Life Assurance Scheme (“the Scheme”) with effect from completion of thetransfer of the businesses (November 19, 2001) (“the Completion Date”). The Scheme is classified as a defined benefit schemeproviding benefits based on final pensionable salary.
Under the terms of the Agreement, UNBL is responsible for the funding requirements of the active members whoseemployment was transferred to UNBL on the Completion Date and for any new members admitted to the scheme after thisdate. United Bank Limited remains responsible for the funding of the deferred members as till the Completion Date.
No new members have been admitted to the scheme in the year ended December 31, 2010.
The last full actuarial valuation of the scheme was carried out at January 01, 2008 and was updated as at January 01, 2010by a qualified actuary on the basis of triennial valuations using Projected Unit Credit Method. The major assumptions used bythe actuary are as follows:
2010 2009Per annum
Discount rate 5.50% 5.60%Rate of revaluation of pension in deferment 5.00% 5.00%Expected rate of salary increase 0.00% 0.00%Expected rate of pension increase 3.50% 3.70%Price inflation 3.50% 3.70%
The assets and liabilities of the scheme noted below relate to those employees for whom the UNBL has a funding liability. Thecombined assets in the scheme and the expected rate of return were:
2010 2009Percentage (Rupees '000) Percentage (Rupees '000)
Other - insurance policy 5.50% 512,198 5.60% 510,254
Total market value of assets 512,198 510,254Actuarial value of liability (610,152) (654,625)Gross pension liability (97,954) (144,371)Related Deferred Tax Relief 27,475 40,473Net pension liability (70,479) (103,898)
The asset value supplied by the insurance company for 2009 is on an ongoing basis. If the policy had been surrendered atDecember 31, 2010 the surrender value would have been Rs.512.198 million (2009: Rs.510.250 million). It is not UNBL'sintention to surrender the policy.
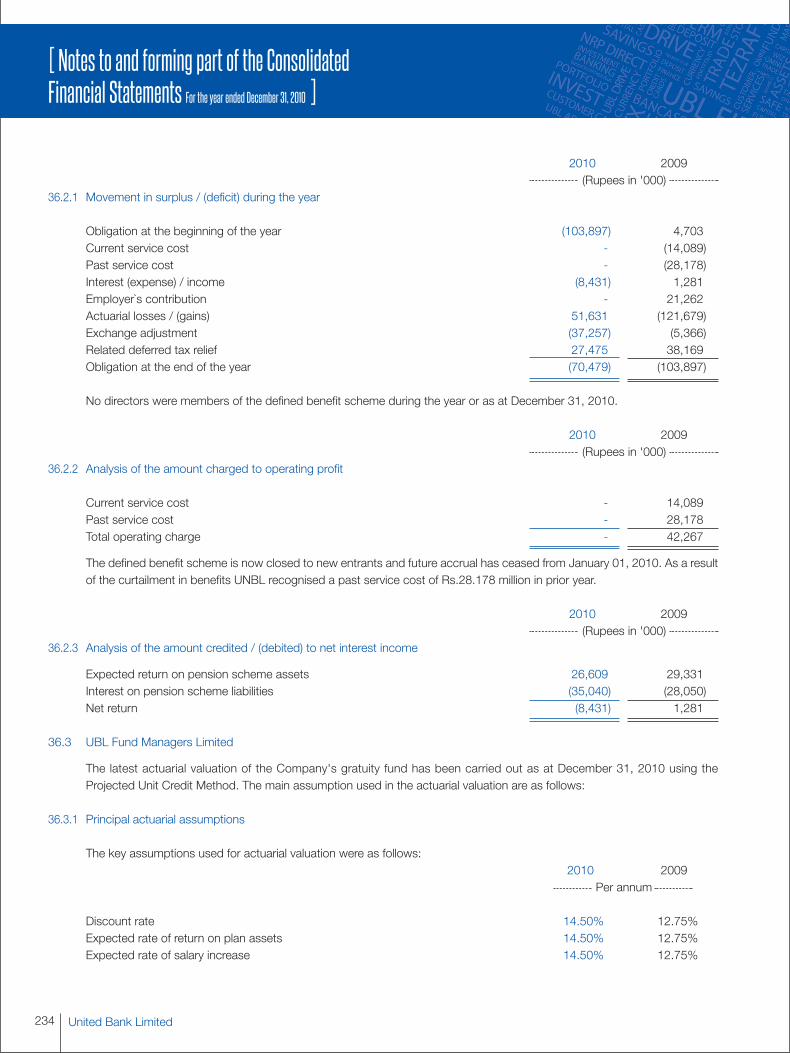
United Bank Limited234
[ Notes to and forming part of the ConsolidatedFinancial Statements For the year ended December 31, 2010 ]
2010 2009(Rupees in '000)
36.2.1 Movement in surplus / (deficit) during the year
Obligation at the beginning of the year (103,897) 4,703Current service cost - (14,089)Past service cost - (28,178)Interest (expense) / income (8,431) 1,281Employer`s contribution - 21,262Actuarial losses / (gains) 51,631 (121,679)Exchange adjustment (37,257) (5,366)Related deferred tax relief 27,475 38,169Obligation at the end of the year (70,479) (103,897)
No directors were members of the defined benefit scheme during the year or as at December 31, 2010.
2010 2009(Rupees in '000)
36.2.2 Analysis of the amount charged to operating profit
Current service cost - 14,089Past service cost - 28,178Total operating charge - 42,267
The defined benefit scheme is now closed to new entrants and future accrual has ceased from January 01, 2010. As a resultof the curtailment in benefits UNBL recognised a past service cost of Rs.28.178 million in prior year.
2010 2009(Rupees in '000)
36.2.3 Analysis of the amount credited / (debited) to net interest income
Expected return on pension scheme assets 26,609 29,331Interest on pension scheme liabilities (35,040) (28,050)Net return (8,431) 1,281
36.3 UBL Fund Managers Limited
The latest actuarial valuation of the Company's gratuity fund has been carried out as at December 31, 2010 using theProjected Unit Credit Method. The main assumption used in the actuarial valuation are as follows:
36.3.1 Principal actuarial assumptions
The key assumptions used for actuarial valuation were as follows:2010 2009
Per annum
Discount rate 14.50% 12.75%Expected rate of return on plan assets 14.50% 12.75%Expected rate of salary increase 14.50% 12.75%
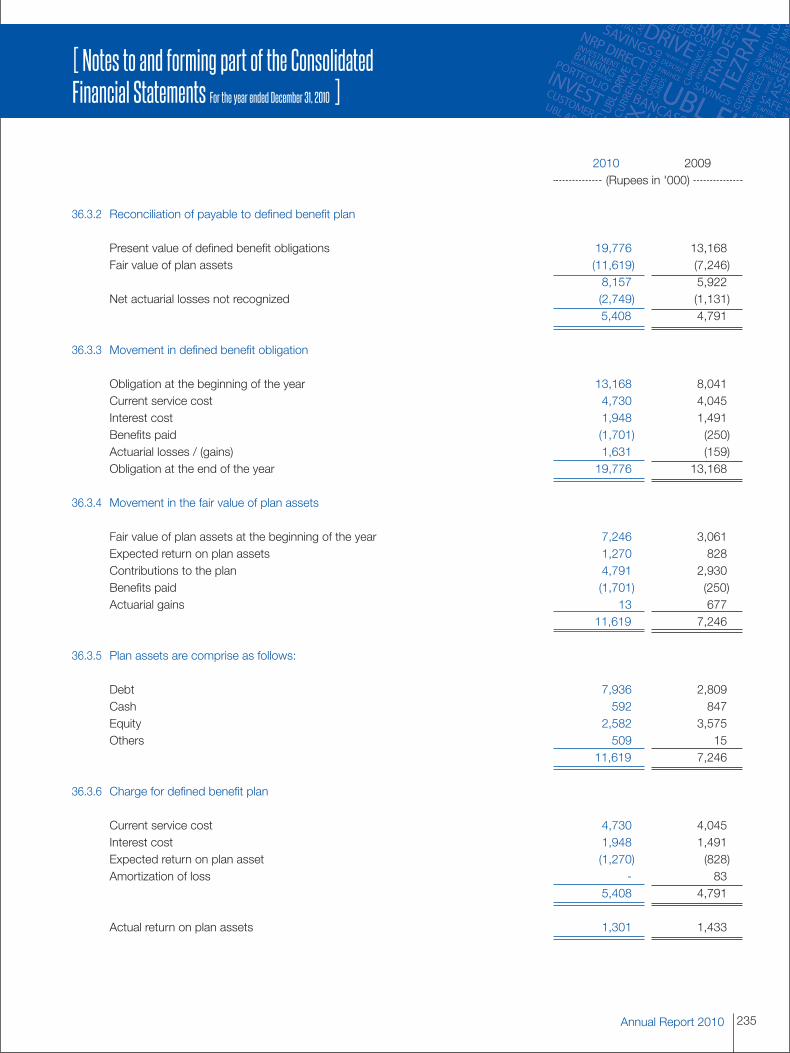
235Annual Report 2010
[ Notes to and forming part of the ConsolidatedFinancial Statements For the year ended December 31, 2010 ]
2010 2009(Rupees in '000)
36.3.2 Reconciliation of payable to defined benefit plan
Present value of defined benefit obligations 19,776 13,168Fair value of plan assets (11,619) (7,246)
8,157 5,922Net actuarial losses not recognized (2,749) (1,131)
5,408 4,791
36.3.3 Movement in defined benefit obligation
Obligation at the beginning of the year 13,168 8,041Current service cost 4,730 4,045Interest cost 1,948 1,491Benefits paid (1,701) (250)Actuarial losses / (gains) 1,631 (159)Obligation at the end of the year 19,776 13,168
36.3.4 Movement in the fair value of plan assets
Fair value of plan assets at the beginning of the year 7,246 3,061Expected return on plan assets 1,270 828Contributions to the plan 4,791 2,930Benefits paid (1,701) (250)Actuarial gains 13 677
11,619 7,246
36.3.5 Plan assets are comprise as follows:
Debt 7,936 2,809Cash 592 847Equity 2,582 3,575Others 509 15
11,619 7,246
36.3.6 Charge for defined benefit plan
Current service cost 4,730 4,045Interest cost 1,948 1,491Expected return on plan asset (1,270) (828)Amortization of loss - 83
5,408 4,791
Actual return on plan assets 1,301 1,433
United Bank Limited236
[ Notes to and forming part of the ConsolidatedFinancial Statements For the year ended December 31, 2010 ]
2010 2009(Rupees in '000)
36.3.7 Movement in net liability recognised
Opening net asset 4,791 2,930Expense recognised 5,408 4,791Contribution to the fund made during the year (4,791) (2,930)Closing net assets 5,408 4,791
37 OTHER EMPLOYEE BENEFITS
37.1 Defined contribution plan
The Bank operates a contributory provident fund scheme for 5,209 (2009: 5,356) employees who are not in the pensionscheme. The employer and employee both contribute 8.33% of the basic salary to the funded scheme every month.
37.2 Employee Motivation and Retention Scheme
The Bank operates a long term motivation and retention scheme for its employees. The objective of the scheme is to reward,motivate and retain high performing executives and officers of the Bank by way of bonus in the form of shares of the Bank.The liability of the Bank in respect of this scheme is fixed and approved each year by the Board of Directors of the Bank .Thescheme is managed by separate Trusts formed in respect of each year. During the year, Rs.206.819 million (2009: Rs.40.212million) and Rs.33.817 million (2009: Rs.6.409 million) were received by the executives and the chief executive respectivelyfrom the scheme. For further details, refer note 19.1.
37.3 Benazir Employees’ Stock Option Scheme
The Government of Pakistan (GoP), being one of the shareholders of the Bank, decided to launch the Benazir Employees’Stock Option Scheme on August 14, 2009, whereby the GoP intends to transfer free of cost 26,391,483 shares of the Bank,including 26,025,533 shares held by the SBP as at December 31, 2010, to UBL Employees Empowerment Trust [the “Trust”].
As per the Trust Deed such shares will be allocated through Unit Certificates to eligible employees in proportion to theirentitlement which will be based on length of service subject to certain restrictions. The Trust is entitled to receive dividendsdeclared, of which 50 percent will be distributed amongst employees on the basis of units held. The balance 50 percentwould be remitted to a Central Revolving Fund of the Privatization Commission of Pakistan for payment to employees at thetime of end of service settlement on fulfilment of vesting conditions, against surrendered units with the shares underlying suchsurrendered units being transferred back to the GoP.
This generalized scheme being a government policy to provide empowerment to employees of State Owned Enterprises andother entities where the GoP has a shareholding, may attract the provisions of amended IFRS-2 (Share-based Payments).However, keeping in view the nature, characteristics, exceptions and manner of operation of the generalized scheme, theapplicability of IFRS-2 to the said scheme is under consideration of the Institute of Chartered Accountants of Pakistan andthe Securities and Exchange Commission of Pakistan.
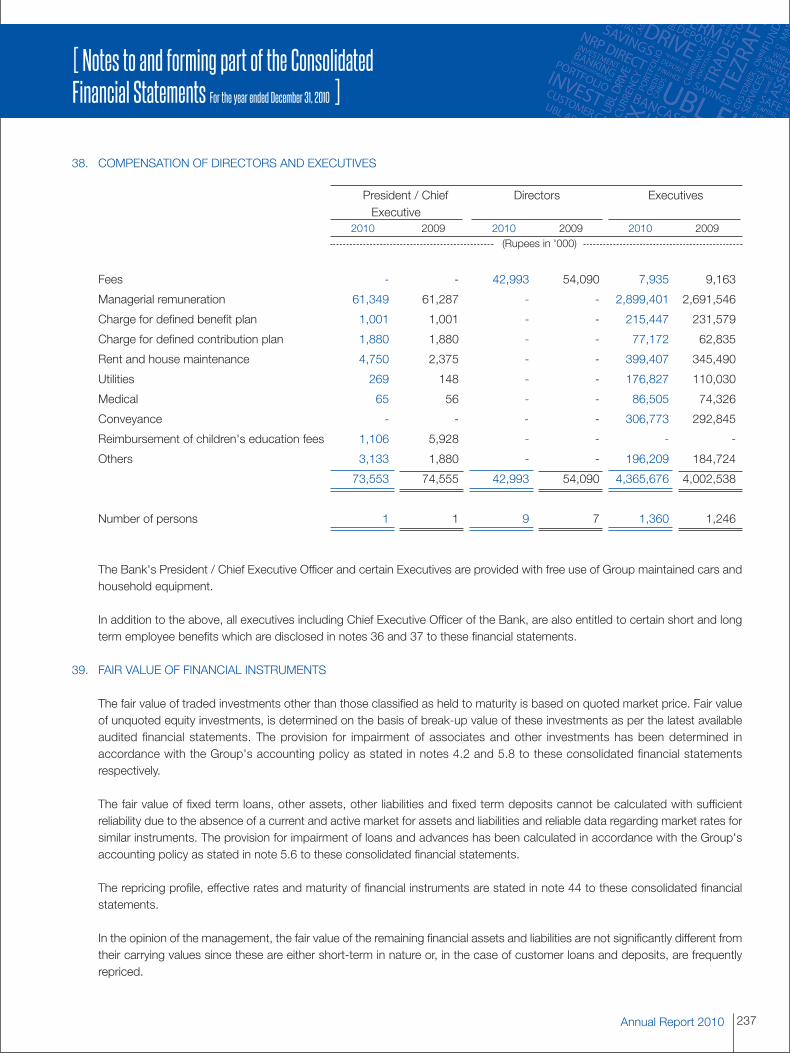
237Annual Report 2010
[ Notes to and forming part of the ConsolidatedFinancial Statements For the year ended December 31, 2010 ]
38. COMPENSATION OF DIRECTORS AND EXECUTIVES
President / Chief Directors ExecutivesExecutive
2010 2009 2010 2009 2010 2009(Rupees in '000)
Fees - - 42,993 54,090 7,935 9,163
Managerial remuneration 61,349 61,287 - - 2,899,401 2,691,546
Charge for defined benefit plan 1,001 1,001 - - 215,447 231,579
Charge for defined contribution plan 1,880 1,880 - - 77,172 62,835
Rent and house maintenance 4,750 2,375 - - 399,407 345,490
Utilities 269 148 - - 176,827 110,030
Medical 65 56 - - 86,505 74,326
Conveyance - - - - 306,773 292,845
Reimbursement of children's education fees 1,106 5,928 - - - -
Others 3,133 1,880 - - 196,209 184,724
73,553 74,555 42,993 54,090 4,365,676 4,002,538
Number of persons 1 1 9 7 1,360 1,246
The Bank's President / Chief Executive Officer and certain Executives are provided with free use of Group maintained cars andhousehold equipment.
In addition to the above, all executives including Chief Executive Officer of the Bank, are also entitled to certain short and longterm employee benefits which are disclosed in notes 36 and 37 to these financial statements.
39. FAIR VALUE OF FINANCIAL INSTRUMENTS
The fair value of traded investments other than those classified as held to maturity is based on quoted market price. Fair valueof unquoted equity investments, is determined on the basis of break-up value of these investments as per the latest availableaudited financial statements. The provision for impairment of associates and other investments has been determined inaccordance with the Group's accounting policy as stated in notes 4.2 and 5.8 to these consolidated financial statementsrespectively.
The fair value of fixed term loans, other assets, other liabilities and fixed term deposits cannot be calculated with sufficientreliability due to the absence of a current and active market for assets and liabilities and reliable data regarding market rates forsimilar instruments. The provision for impairment of loans and advances has been calculated in accordance with the Group'saccounting policy as stated in note 5.6 to these consolidated financial statements.
The repricing profile, effective rates and maturity of financial instruments are stated in note 44 to these consolidated financialstatements.
In the opinion of the management, the fair value of the remaining financial assets and liabilities are not significantly different fromtheir carrying values since these are either short-term in nature or, in the case of customer loans and deposits, are frequentlyrepriced.
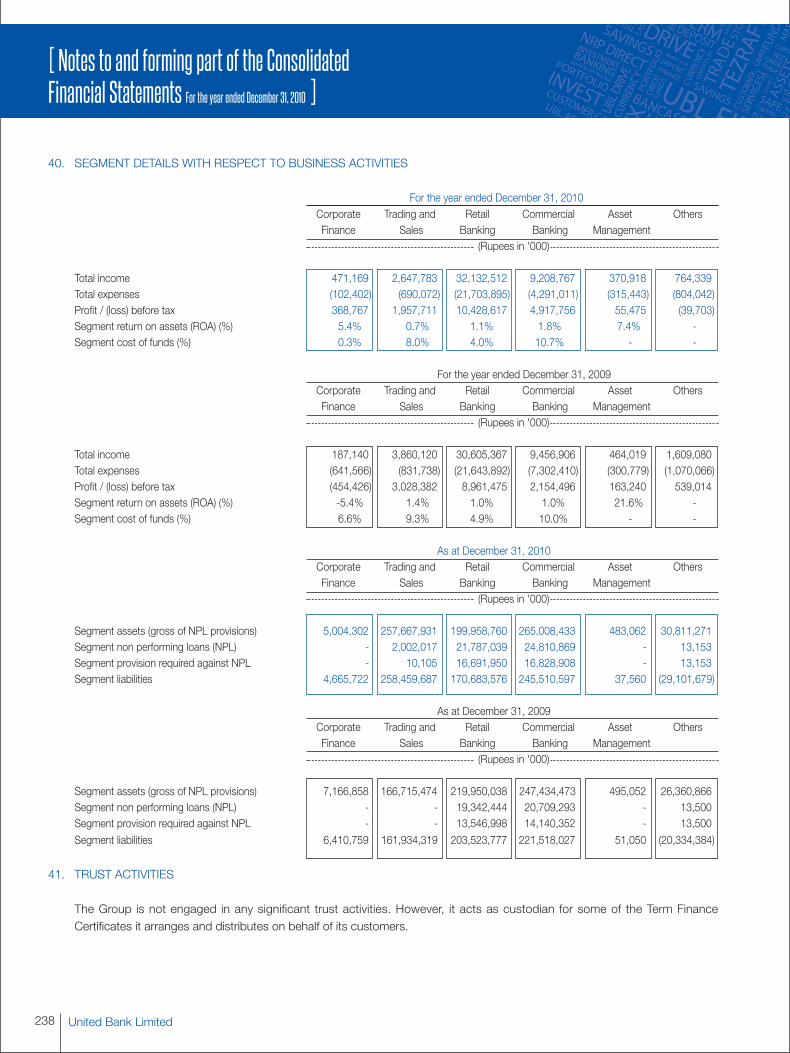
United Bank Limited238
[ Notes to and forming part of the ConsolidatedFinancial Statements For the year ended December 31, 2010 ]
40. SEGMENT DETAILS WITH RESPECT TO BUSINESS ACTIVITIES
For the year ended December 31, 2010Corporate Trading and Retail Commercial Asset OthersFinance Sales Banking Banking Management
(Rupees in '000)
Total income 471,169 2,647,783 32,132,512 9,208,767 370,918 764,339Total expenses (102,402) (690,072) (21,703,895) (4,291,011) (315,443) (804,042)Profit / (loss) before tax 368,767 1,957,711 10,428,617 4,917,756 55,475 (39,703)Segment return on assets (ROA) (%) 5.4% 0.7% 1.1% 1.8% 7.4% -Segment cost of funds (%) 0.3% 8.0% 4.0% 10.7% - -
For the year ended December 31, 2009Corporate Trading and Retail Commercial Asset OthersFinance Sales Banking Banking Management
(Rupees in '000)
Total income 187,140 3,860,120 30,605,367 9,456,906 464,019 1,609,080Total expenses (641,566) (831,738) (21,643,892) (7,302,410) (300,779) (1,070,066)Profit / (loss) before tax (454,426) 3,028,382 8,961,475 2,154,496 163,240 539,014Segment return on assets (ROA) (%) -5.4% 1.4% 1.0% 1.0% 21.6% -Segment cost of funds (%) 6.6% 9.3% 4.9% 10.0% - -
As at December 31, 2010Corporate Trading and Retail Commercial Asset OthersFinance Sales Banking Banking Management
(Rupees in '000)
Segment assets (gross of NPL provisions) 5,004,302 257,667,931 199,958,760 265,008,433 483,062 30,811,271Segment non performing loans (NPL) - 2,002,017 21,787,039 24,810,869 - 13,153Segment provision required against NPL - 10,105 16,691,950 16,828,908 - 13,153Segment liabilities 4,665,722 258,459,687 170,683,576 245,510,597 37,560 (29,101,679)
As at December 31, 2009Corporate Trading and Retail Commercial Asset OthersFinance Sales Banking Banking Management
(Rupees in '000)
Segment assets (gross of NPL provisions) 7,166,858 166,715,474 219,950,038 247,434,473 495,052 26,360,866Segment non performing loans (NPL) - - 19,342,444 20,709,293 - 13,500Segment provision required against NPL - - 13,546,998 14,140,352 - 13,500Segment liabilities 6,410,759 161,934,319 203,523,777 221,518,027 51,050 (20,334,384)
41. TRUST ACTIVITIES
The Group is not engaged in any significant trust activities. However, it acts as custodian for some of the Term FinanceCertificates it arranges and distributes on behalf of its customers.
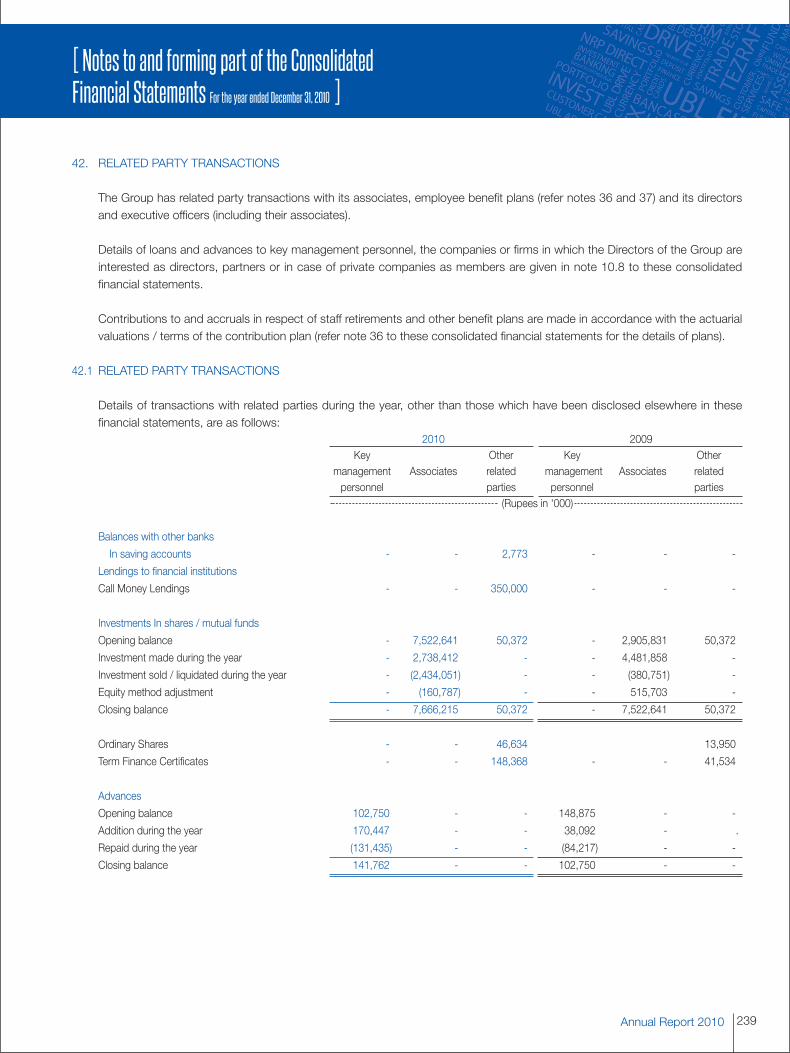
239Annual Report 2010
[ Notes to and forming part of the ConsolidatedFinancial Statements For the year ended December 31, 2010 ]
42. RELATED PARTY TRANSACTIONS
The Group has related party transactions with its associates, employee benefit plans (refer notes 36 and 37) and its directorsand executive officers (including their associates).
Details of loans and advances to key management personnel, the companies or firms in which the Directors of the Group areinterested as directors, partners or in case of private companies as members are given in note 10.8 to these consolidatedfinancial statements.
Contributions to and accruals in respect of staff retirements and other benefit plans are made in accordance with the actuarialvaluations / terms of the contribution plan (refer note 36 to these consolidated financial statements for the details of plans).
42.1 RELATED PARTY TRANSACTIONS
Details of transactions with related parties during the year, other than those which have been disclosed elsewhere in thesefinancial statements, are as follows:
2010 2009Key Other Key Other
management Associates related management Associates relatedpersonnel parties personnel parties
(Rupees in '000)
Balances with other banks
In saving accounts - - 2,773 - - -
Lendings to financial institutions
Call Money Lendings - - 350,000 - - -
Investments In shares / mutual funds
Opening balance - 7,522,641 50,372 - 2,905,831 50,372
Investment made during the year - 2,738,412 - - 4,481,858 -
Investment sold / liquidated during the year - (2,434,051) - - (380,751) -
Equity method adjustment - (160,787) - - 515,703 -
Closing balance - 7,666,215 50,372 - 7,522,641 50,372
Ordinary Shares - - 46,634 13,950
Term Finance Certificates - - 148,368 - - 41,534
Advances
Opening balance 102,750 - - 148,875 - -
Addition during the year 170,447 - - 38,092 - .
Repaid during the year (131,435) - - (84,217) - -
Closing balance 141,762 - - 102,750 - -
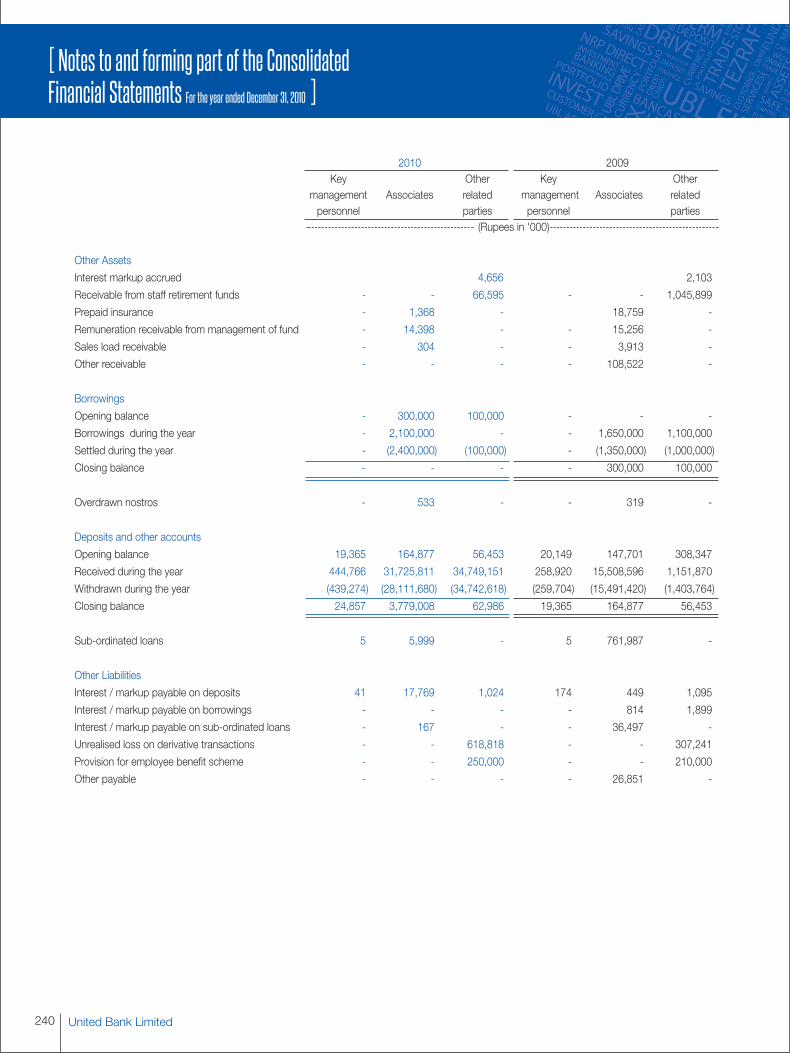
United Bank Limited240
[ Notes to and forming part of the ConsolidatedFinancial Statements For the year ended December 31, 2010 ]
2010 2009Key Other Key Other
management Associates related management Associates relatedpersonnel parties personnel parties
(Rupees in '000)
Other Assets
Interest markup accrued 4,656 2,103
Receivable from staff retirement funds - - 66,595 - - 1,045,899
Prepaid insurance - 1,368 - 18,759 -
Remuneration receivable from management of fund - 14,398 - - 15,256 -
Sales load receivable - 304 - - 3,913 -
Other receivable - - - - 108,522 -
Borrowings
Opening balance - 300,000 100,000 - - -
Borrowings during the year - 2,100,000 - - 1,650,000 1,100,000
Settled during the year - (2,400,000) (100,000) - (1,350,000) (1,000,000)
Closing balance - - - - 300,000 100,000
Overdrawn nostros - 533 - - 319 -
Deposits and other accounts
Opening balance 19,365 164,877 56,453 20,149 147,701 308,347
Received during the year 444,766 31,725,811 34,749,151 258,920 15,508,596 1,151,870
Withdrawn during the year (439,274) (28,111,680) (34,742,618) (259,704) (15,491,420) (1,403,764)
Closing balance 24,857 3,779,008 62,986 19,365 164,877 56,453
Sub-ordinated loans 5 5,999 - 5 761,987 -
Other Liabilities
Interest / markup payable on deposits 41 17,769 1,024 174 449 1,095
Interest / markup payable on borrowings - - - - 814 1,899
Interest / markup payable on sub-ordinated loans - 167 - - 36,497 -
Unrealised loss on derivative transactions - - 618,818 - - 307,241
Provision for employee benefit scheme - - 250,000 - - 210,000
Other payable - - - - 26,851 -

241Annual Report 2010
[ Notes to and forming part of the ConsolidatedFinancial Statements For the year ended December 31, 2010 ]
2010 2009Key Other Key Other
management Associates related management Associates relatedpersonnel parties personnel parties
(Rupees in '000)
Mark-up / return / interest earned 9,238 - 75,321 7,398 - 29,597
Dividend received - 356,010 1,600 - 228,516 -
Net gain on sale of investment - 2,393 - - - -
Realised gain on derivative transactions - - 2,127,895 - - 1,662,595
Remuneration received from management of fund - 319,268 - - 376,969 -
Sales load received - 9,130 - - 18,486 -
Other income 528 749 23 - 576 -
Mark-up / return / interest paid 716 242,488 8,984 389 69,402 816
Remuneration paid 336,588 - - 268,383 - -
Post employment benefits 12,224 - - 10,286 - -
Non-executive directors' fee and allowances - - 42,993 - - 54,090
Net charge for defined contribution plans - - 104,035 - - 416,114
Net reversal for the defined benefit plans - - (402,939) - - (493,415)
Payment for employee motivation and retention scheme - - 210,000 - - 50,005
Other expenses
Insurance premium paid - 204,492 - - 215,804 -
Insurance claims settled - 164,859 - - 217,907 -
43. CAPITAL ADEQUACY
43.1 The Basel II Framework is applicable to the Bank whereby the Standardized Approach for reporting Capital Adequacy is currentlyimplemented. Under the said approach, credit risk and market risk exposures are measured using the Standardized Approachand operational risk is measured using the Basic Indicator Approach.
The Group’s capital adequacy is reported using the rules and ratios provided by the State Bank of Pakistan.
The subsidiaries comply with the capital adequacy and risk management frameworks prescribed by their respective regulationsin their jurisdictions.
The capital adequacy ratio is a measure of the amount of Group's capital expressed as a percentage of its risk weighted assets.Measuring capital adequacy requires risk mitigants to be applied to the amount of assets shown on a Group's balance sheet.These assets are then applied weightages according to the degree of inherent risk. The capital adequacy ratios compares theamount of eligible capital with the total of risk-weighted assets (RWAs).
The Group has developed Internal Capital Adequacy Assessment Process (ICAAP) as per the guidelines provided by the SBP.This framework has been approved by the Group’s Board of Directors and submitted to the SBP. The Group additionally coversrisk not yet included under Pillar I, so as to carry adequate capital to cater for any future business requirements. The Group willreview the ICAAP framework on an annual basis and changes/updates will be recommended to the Basel II committee foronward submission to the Board of Directors.
The Group plans to move towards the Advanced Approach for Basel II, including the Foundation Internal Ratings Based Approachfor credit risk, Internal Models Approach for market risk and the Alternate Standardized Approach for operational risk.
United Bank Limited242
[ Notes to and forming part of the ConsolidatedFinancial Statements For the year ended December 31, 2010 ]
43.2 Capital Management
The objective of managing capital is to safeguard the Group's ability to continue as a going concern. It is the policy of the Groupto maintain a strong capital base so as to maintain investor, creditor and market confidence and to sustain future developmentof the business. The impact of the level of capital on shareholders’ return is also recognized and the Group recognizes theneed to maintain a balance between the higher returns that might be possible with greater gearing and the advantages andsecurity afforded by a sound capital position.
Statutory minimum capital and capital adequacy requirements
The SBP through its BSD Circular No. 07 dated April 15, 2009 has prescribed the minimum paid-up capital (net ofaccumulated losses) for Banks / Development Finance Institutions to be raised to Rs.10 billion by the year ending December31, 2013.
The paid-up capital of the Group for the year ended December 31, 2010 stood at Rs.12,241.798 million (2009: Rs.11,128.907million) and is in compliance with SBP requirements. In addition, banks are also required to maintain a minimum CapitalAdequacy Ratio (CAR) of 10% of the risk weighted exposure of the Banks. The Group’s CAR as at December 31, 2010 was15.04% (2009: 14.03%). The Group and its individually regulated operations have complied with all capital requirementsthroughout the year.
Tier 1 capital, includes fully paid-up capital, balance in share premium account, general reserves as per the financial statementsand net un-appropriated profits after deduction of book value of goodwill / intangibles, deficit on revaluation of available forsale investments and 50% of investments in equity and other regulatory capital of majority owned securities or other financialsubsidiaries not consolidated in the statement of financial position as per the guidelines laid under the Basel II framework.
Tier 2 capital includes general provisions for loan losses, reserves on the revaluation of fixed assets and equity investments,foreign exchange translation reserves and subordinated debts (upto maximum of 50% of total eligible tier 1 capital) afterdeduction of 50% of investments in equity and other regulatory capital of majority owned securities or other financialsubsidiaries not consolidated in the statement of financial position as per the guidelines laid under the Basel II Framework.
Tier 3 capital has also been prescribed by the SBP for managing market risk; however, the Group does not have any Tier 3capital.
Banking operations are categorized as either trading book or banking book and risk-weighted assets are determined accordingto specified requirements of the SBP that seek to reflect the varying levels of risk attached to assets and off-balance sheetexposures. The total risk-weighted exposures comprise of credit risk, market risk and operational risk.
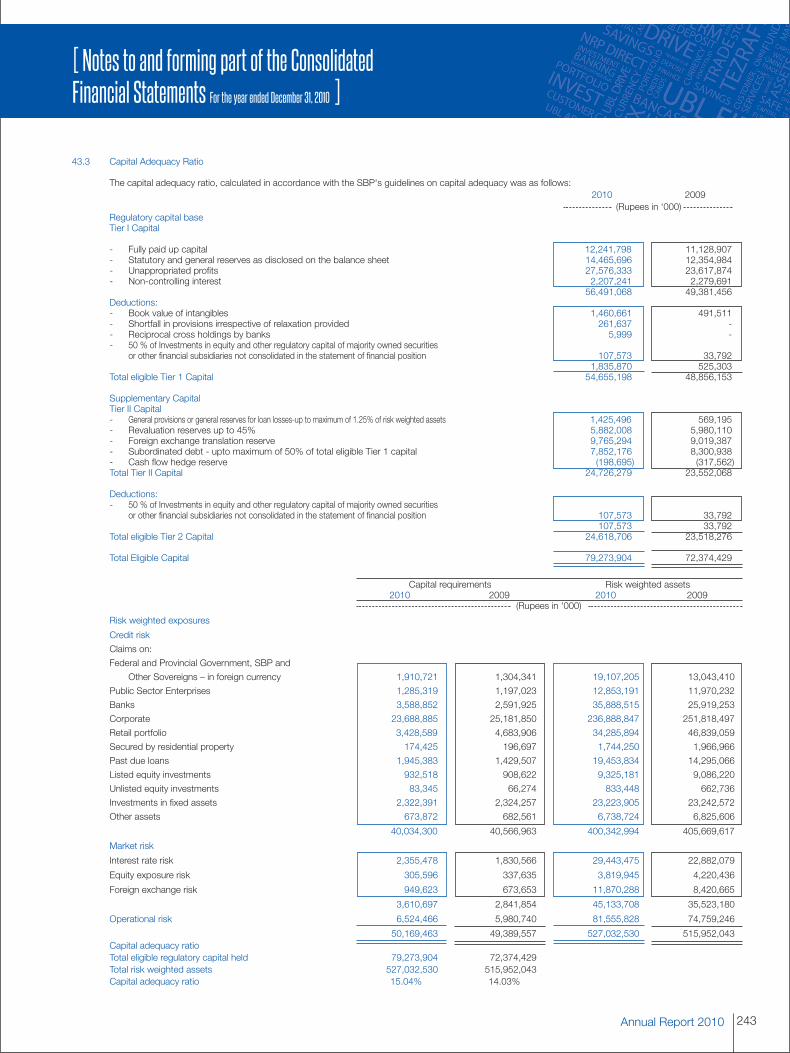
243Annual Report 2010
[ Notes to and forming part of the ConsolidatedFinancial Statements For the year ended December 31, 2010 ]
43.3 Capital Adequacy Ratio
The capital adequacy ratio, calculated in accordance with the SBP's guidelines on capital adequacy was as follows:2010 2009
(Rupees in ‘000)Regulatory capital baseTier I Capital
- Fully paid up capital 12,241,798 11,128,907- Statutory and general reserves as disclosed on the balance sheet 14,465,696 12,354,984- Unappropriated profits 27,576,333 23,617,874- Non-controlling interest 2,207,241 2,279,691
56,491,068 49,381,456Deductions:- Book value of intangibles 1,460,661 491,511- Shortfall in provisions irrespective of relaxation provided 261,637 -- Reciprocal cross holdings by banks 5,999 -- 50 % of Investments in equity and other regulatory capital of majority owned securities
or other financial subsidiaries not consolidated in the statement of financial position 107,573 33,7921,835,870 525,303
Total eligible Tier 1 Capital 54,655,198 48,856,153
Supplementary CapitalTier II Capital- General provisions or general reserves for loan losses-up to maximum of 1.25% of risk weighted assets 1,425,496 569,195- Revaluation reserves up to 45% 5,882,008 5,980,110- Foreign exchange translation reserve 9,765,294 9,019,387- Subordinated debt - upto maximum of 50% of total eligible Tier 1 capital 7,852,176 8,300,938- Cash flow hedge reserve (198,695) (317,562)Total Tier II Capital 24,726,279 23,552,068
Deductions:- 50 % of Investments in equity and other regulatory capital of majority owned securities
or other financial subsidiaries not consolidated in the statement of financial position 107,573 33,792107,573 33,792
Total eligible Tier 2 Capital 24,618,706 23,518,276
Total Eligible Capital 79,273,904 72,374,429
Capital requirements Risk weighted assets2010 2009 2010 2009
(Rupees in '000)
Risk weighted exposures
Credit risk
Claims on:
Federal and Provincial Government, SBP and
Other Sovereigns – in foreign currency 1,910,721 1,304,341 19,107,205 13,043,410
Public Sector Enterprises 1,285,319 1,197,023 12,853,191 11,970,232
Banks 3,588,852 2,591,925 35,888,515 25,919,253
Corporate 23,688,885 25,181,850 236,888,847 251,818,497
Retail portfolio 3,428,589 4,683,906 34,285,894 46,839,059
Secured by residential property 174,425 196,697 1,744,250 1,966,966
Past due loans 1,945,383 1,429,507 19,453,834 14,295,066
Listed equity investments 932,518 908,622 9,325,181 9,086,220
Unlisted equity investments 83,345 66,274 833,448 662,736
Investments in fixed assets 2,322,391 2,324,257 23,223,905 23,242,572
Other assets 673,872 682,561 6,738,724 6,825,606
40,034,300 40,566,963 400,342,994 405,669,617
Market risk
Interest rate risk 2,355,478 1,830,566 29,443,475 22,882,079
Equity exposure risk 305,596 337,635 3,819,945 4,220,436
Foreign exchange risk 949,623 673,653 11,870,288 8,420,665
3,610,697 2,841,854 45,133,708 35,523,180
Operational risk 6,524,466 5,980,740 81,555,828 74,759,246
50,169,463 49,389,557 527,032,530 515,952,043Capital adequacy ratioTotal eligible regulatory capital held 79,273,904 72,374,429Total risk weighted assets 527,032,530 515,952,043Capital adequacy ratio 15.04% 14.03%
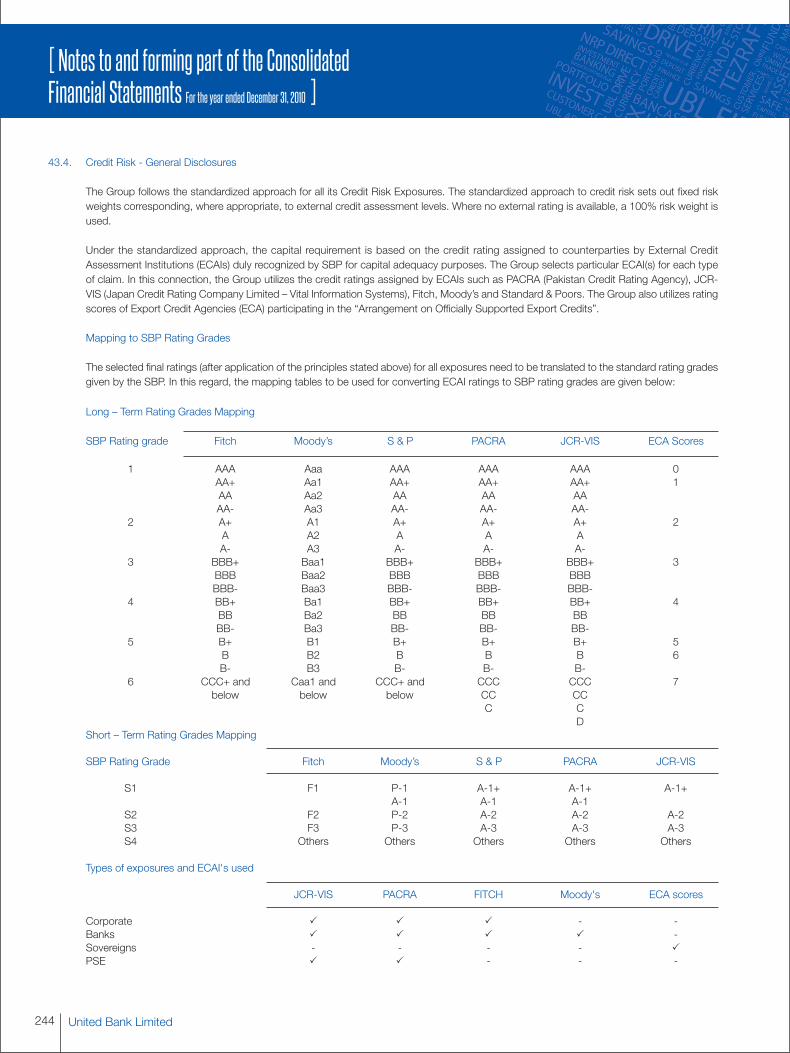
United Bank Limited244
[ Notes to and forming part of the ConsolidatedFinancial Statements For the year ended December 31, 2010 ]
43.4. Credit Risk - General Disclosures
The Group follows the standardized approach for all its Credit Risk Exposures. The standardized approach to credit risk sets out fixed riskweights corresponding, where appropriate, to external credit assessment levels. Where no external rating is available, a 100% risk weight isused.
Under the standardized approach, the capital requirement is based on the credit rating assigned to counterparties by External CreditAssessment Institutions (ECAIs) duly recognized by SBP for capital adequacy purposes. The Group selects particular ECAI(s) for each typeof claim. In this connection, the Group utilizes the credit ratings assigned by ECAIs such as PACRA (Pakistan Credit Rating Agency), JCR-VIS (Japan Credit Rating Company Limited – Vital Information Systems), Fitch, Moody’s and Standard & Poors. The Group also utilizes ratingscores of Export Credit Agencies (ECA) participating in the “Arrangement on Officially Supported Export Credits”.
Mapping to SBP Rating Grades
The selected final ratings (after application of the principles stated above) for all exposures need to be translated to the standard rating gradesgiven by the SBP. In this regard, the mapping tables to be used for converting ECAI ratings to SBP rating grades are given below:
Long – Term Rating Grades Mapping
SBP Rating grade Fitch Moody’s S & P PACRA JCR-VIS ECA Scores
1 AAA Aaa AAA AAA AAA 0AA+ Aa1 AA+ AA+ AA+ 1AA Aa2 AA AA AAAA- Aa3 AA- AA- AA-
2 A+ A1 A+ A+ A+ 2A A2 A A AA- A3 A- A- A-
3 BBB+ Baa1 BBB+ BBB+ BBB+ 3BBB Baa2 BBB BBB BBBBBB- Baa3 BBB- BBB- BBB-
4 BB+ Ba1 BB+ BB+ BB+ 4BB Ba2 BB BB BBBB- Ba3 BB- BB- BB-
5 B+ B1 B+ B+ B+ 5B B2 B B B 6B- B3 B- B- B-
6 CCC+ and Caa1 and CCC+ and CCC CCC 7below below below CC CC
C CD
Short – Term Rating Grades Mapping
SBP Rating Grade Fitch Moody’s S & P PACRA JCR-VIS
S1 F1 P-1 A-1+ A-1+ A-1+A-1 A-1 A-1
S2 F2 P-2 A-2 A-2 A-2S3 F3 P-3 A-3 A-3 A-3S4 Others Others Others Others Others
Types of exposures and ECAI's used
JCR-VIS PACRA FITCH Moody's ECA scores
Corporate � � � - -Banks � � � � -Sovereigns - - - - �PSE � � - - -
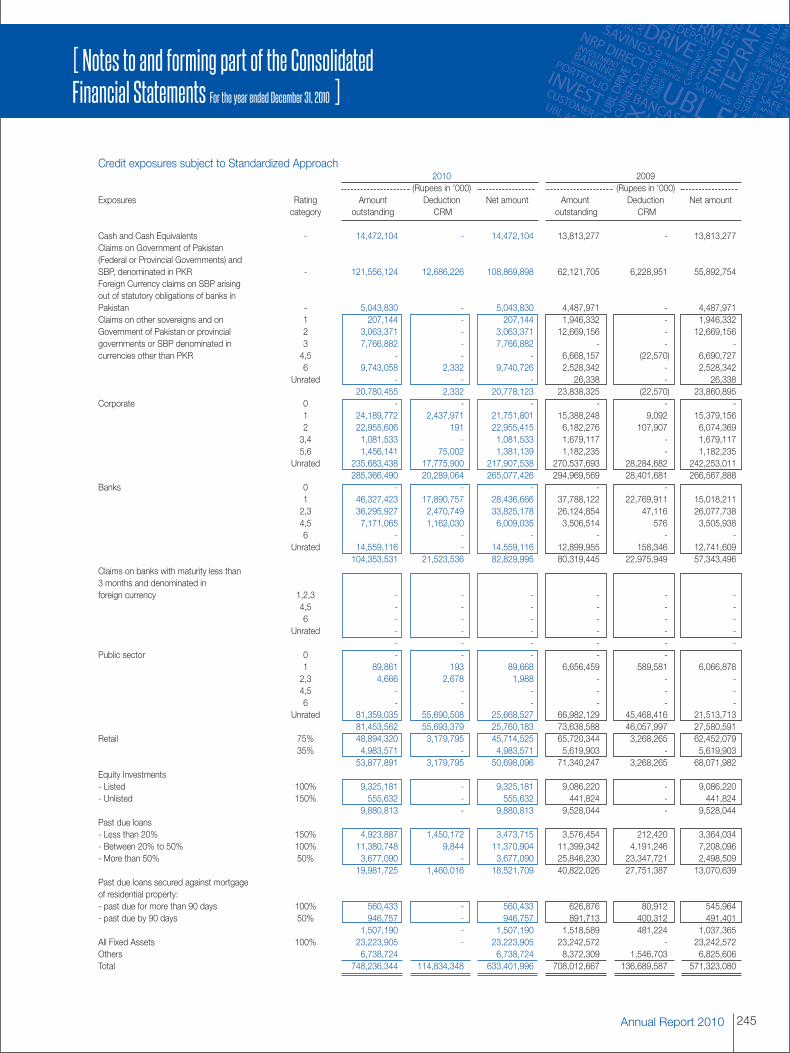
245Annual Report 2010
[ Notes to and forming part of the ConsolidatedFinancial Statements For the year ended December 31, 2010 ]
Credit exposures subject to Standardized Approach2010 2009
(Rupees in '000) (Rupees in '000)Exposures Rating Amount Deduction Net amount Amount Deduction Net amount
category outstanding CRM outstanding CRM
Cash and Cash Equivalents - 14,472,104 - 14,472,104 13,813,277 - 13,813,277Claims on Government of Pakistan(Federal or Provincial Governments) andSBP, denominated in PKR - 121,556,124 12,686,226 108,869,898 62,121,705 6,228,951 55,892,754Foreign Currency claims on SBP arisingout of statutory obligations of banks inPakistan - 5,043,830 - 5,043,830 4,487,971 - 4,487,971Claims on other sovereigns and on 1 207,144 - 207,144 1,946,332 - 1,946,332Government of Pakistan or provincial 2 3,063,371 - 3,063,371 12,669,156 - 12,669,156governments or SBP denominated in 3 7,766,882 - 7,766,882 - - -currencies other than PKR 4,5 - - - 6,668,157 (22,570) 6,690,727
6 9,743,058 2,332 9,740,726 2,528,342 - 2,528,342Unrated - - - 26,338 - 26,338
20,780,455 2,332 20,778,123 23,838,325 (22,570) 23,860,895Corporate 0 - - - - - -
1 24,189,772 2,437,971 21,751,801 15,388,248 9,092 15,379,1562 22,955,606 191 22,955,415 6,182,276 107,907 6,074,3693,4 1,081,533 - 1,081,533 1,679,117 - 1,679,1175,6 1,456,141 75,002 1,381,139 1,182,235 - 1,182,235
Unrated 235,683,438 17,775,900 217,907,538 270,537,693 28,284,682 242,253,011285,366,490 20,289,064 265,077,426 294,969,569 28,401,681 266,567,888
Banks 0 - - - - -1 46,327,423 17,890,757 28,436,666 37,788,122 22,769,911 15,018,2112,3 36,295,927 2,470,749 33,825,178 26,124,854 47,116 26,077,7384,5 7,171,065 1,162,030 6,009,035 3,506,514 576 3,505,9386 - - - - - -
Unrated 14,559,116 - 14,559,116 12,899,955 158,346 12,741,609104,353,531 21,523,536 82,829,995 80,319,445 22,975,949 57,343,496
Claims on banks with maturity less than3 months and denominated inforeign currency 1,2,3 - - - - - -
4,5 - - - - - -6 - - - - - -
Unrated - - - - - -- - - - - -
Public sector 0 - - - - -1 89,861 193 89,668 6,656,459 589,581 6,066,8782,3 4,666 2,678 1,988 - - -4,5 - - - - - -6 - - - - - -
Unrated 81,359,035 55,690,508 25,668,527 66,982,129 45,468,416 21,513,71381,453,562 55,693,379 25,760,183 73,638,588 46,057,997 27,580,591
Retail 75% 48,894,320 3,179,795 45,714,525 65,720,344 3,268,265 62,452,07935% 4,983,571 - 4,983,571 5,619,903 - 5,619,903
53,877,891 3,179,795 50,698,096 71,340,247 3,268,265 68,071,982Equity Investments- Listed 100% 9,325,181 - 9,325,181 9,086,220 - 9,086,220- Unlisted 150% 555,632 - 555,632 441,824 - 441,824
9,880,813 - 9,880,813 9,528,044 - 9,528,044Past due loans- Less than 20% 150% 4,923,887 1,450,172 3,473,715 3,576,454 212,420 3,364,034- Between 20% to 50% 100% 11,380,748 9,844 11,370,904 11,399,342 4,191,246 7,208,096- More than 50% 50% 3,677,090 - 3,677,090 25,846,230 23,347,721 2,498,509
19,981,725 1,460,016 18,521,709 40,822,026 27,751,387 13,070,639Past due loans secured against mortgageof residential property:- past due for more than 90 days 100% 560,433 - 560,433 626,876 80,912 545,964- past due by 90 days 50% 946,757 - 946,757 891,713 400,312 491,401
1,507,190 - 1,507,190 1,518,589 481,224 1,037,365All Fixed Assets 100% 23,223,905 - 23,223,905 23,242,572 - 23,242,572Others 6,738,724 6,738,724 8,372,309 1,546,703 6,825,606Total 748,236,344 114,834,348 633,401,996 708,012,667 136,689,587 571,323,080
246 United Bank Limited
Credit Risk: Disclosures with respect to Credit Risk Mitigation for Standardized Approach
The Group has adopted the Comprehensive Approach of Credit Risk Mitigation for the Banking Book. No credit risk mitigationbenefit is taken in the Trading Book. In instances where the Group’s exposure on an obligor is secured by collateral thatconforms to the eligibility criteria under the Comprehensive Approach of CRM, then the Group reduces its exposure underthat particular transaction by taking into account the risk mitigating effect of the collateral for the calculation of capitalrequirement i.e. the risk weight of the collateral instrument securing the exposure is substituted for the risk weight of thecounter party.
Cash, lien on deposits, government securities and eligible guarantees etc. are considered as eligible collateral under theComprehensive Approach of Credit Risk Mitigation. The Group has in place detailed guidelines with respect to valuation andmanagement of these types of collateral. In order to be prudent, the Group calculates the Credit Risk Mitigation benefit usingthe realizable value of eligible collateral.
44. RISK MANAGEMENT
This section presents information about the Bank’s exposure to and its management and control of risks, in particular, theprimary risks associated with its use of financial instruments:
- Credit risk is the risk of loss resulting from client or counterparty default
- Market risk is the risk of loss arising from adverse movements in market variables such as interest rates, exchange ratesand equity indices
- Liquidity risk is the risk that the Bank may be unable to meet its payment obligations when due
- Operational risk is the risk of loss resulting from inadequate or failed internal processes, people and systems or fromexternal events, and therefore includes legal risk
- Equity position risk is the risk that arises due to changes in prices of individual stocks or levels of equity indices.
Managing risk continues to present a major challenge to the entire banking industry. Success in the banking business dependson how well an institution manages its risks. The main goal is not to eliminate risk, but rather to be proactive in identifying,assessing and managing risks to the organisation’s strategic advantage at the optimum.
The Bank has an integrated risk management structure in place. The Board Risk Management Committee oversees the wholerisk management process of the Bank. The Risk & Credit Policy Group assists the Board Risk Management Committee. TheBank is organized into the functions of Credit Administration, Market and Treasury Risk, Commercial and FIRMU Credit Policy,Consumer and Retail Credit, Credit Risk Management and Operational Risk and Basel II. Each risk category is headed by asenior manager who reports directly to the Group Executive, Risk and Credit Policy. The role of the Risk and Credit PolicyGroup includes:
[ Notes to and forming part of the ConsolidatedFinancial Statements For the year ended December 31, 2010 ]

Annual Report 2010 247
- Determining guidelines relating to Bank’s appetite for risk.
- Recommending risk management policies in accordance with the Basel-II framework and international best practices.
- Reviewing policies/ manuals and ensuring that these are in accordance with the risk management policies.
- Developing systems and resources to review the key risk exposures of the Group.
- Approving credits.
- Granting approval authority to qualified and experienced individuals.
- Reviewing the adequacy of credit training across the Group.
- Organizing portfolio reviews focusing on quality assessment, risk profiles, industry concentrations, etc.
- Setting systems to identify significant portfolio indicators, problem credits and level of provisioning required.
44.1 Credit risk
Credit risk is the risk that a customer or counterparty may not settle an obligation for full value, either when due or at any time
thereafter. This risk arises from the potential that a customer or counterparty is either unwilling to perform an obligation or its
ability to perform such an obligation is impaired resulting in an economic loss to the Group.
The credit risk management process is driven by the Group's Credit Policy, which provides policies and procedures in relation
to credit initiation, approval, documentation and disbursement, credit maintenance and remedial management.
The Credit risk function is organized into Corporate, Commercial/SME and Retail credit. Corporate and Retail credit functions
are centrally organized while the Commercial credit function is organized regionally across the network. Individual credit
authorities are delegated by the Board according to seasoning/maturity of respective credit officers.
The Group manages, limits and controls concentrations of credit risk as identified, in particular, to individual counterparties
and groups, and to industries, where appropriate. Concentrations of credit risk exist if clients are engaged in similar activities,
or are located in the same geographical region or have comparable economic characteristics such that their ability to meet
contractual obligations would be similarly affected by changes in economic, political or other conditions. Limits are also applied
in a variety of forms to portfolios or sectors where the Group considers it appropriate to restrict credit risk concentrations or
areas of higher risk, or to control the rate of portfolio growth.
[ Notes to and forming part of the ConsolidatedFinancial Statements For the year ended December 31, 2010 ]
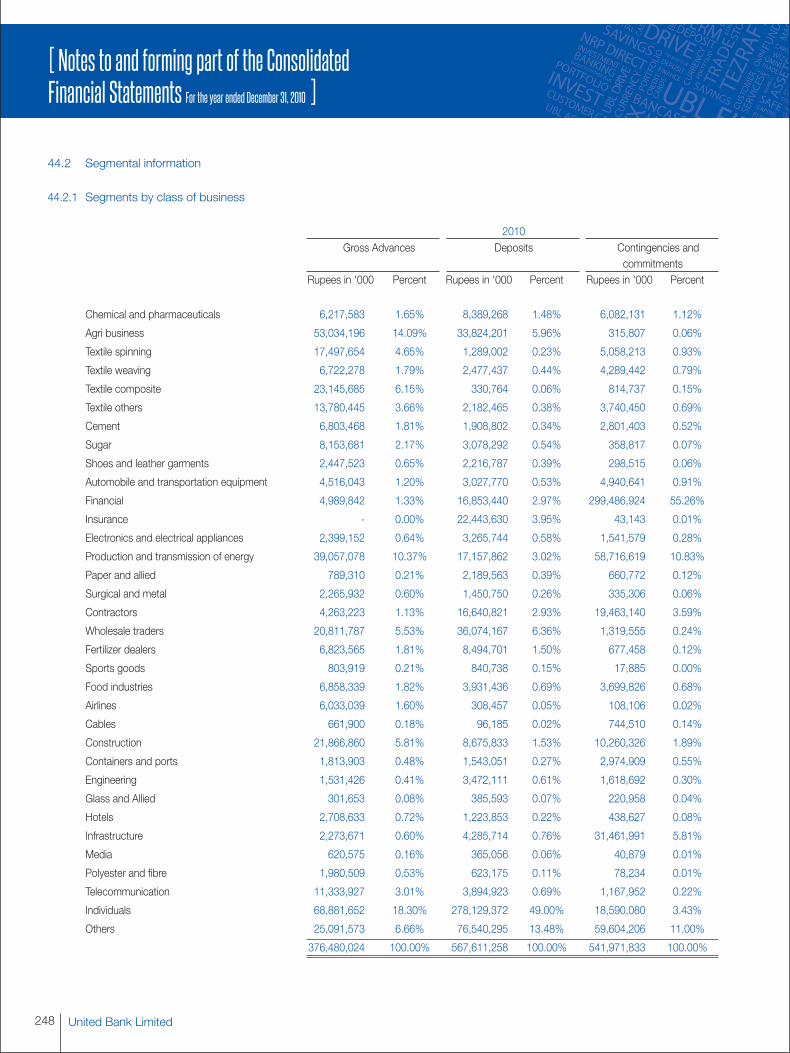
248 United Bank Limited
[ Notes to and forming part of the ConsolidatedFinancial Statements For the year ended December 31, 2010 ]
44.2 Segmental information
44.2.1 Segments by class of business
2010Gross Advances Deposits Contingencies and
commitmentsRupees in '000 Percent Rupees in '000 Percent Rupees in '000 Percent
Chemical and pharmaceuticals 6,217,583 1.65% 8,389,268 1.48% 6,082,131 1.12%
Agri business 53,034,196 14.09% 33,824,201 5.96% 315,807 0.06%
Textile spinning 17,497,654 4.65% 1,289,002 0.23% 5,058,213 0.93%
Textile weaving 6,722,278 1.79% 2,477,437 0.44% 4,289,442 0.79%
Textile composite 23,145,685 6.15% 330,764 0.06% 814,737 0.15%
Textile others 13,780,445 3.66% 2,182,465 0.38% 3,740,450 0.69%
Cement 6,803,468 1.81% 1,908,802 0.34% 2,801,403 0.52%
Sugar 8,153,681 2.17% 3,078,292 0.54% 358,817 0.07%
Shoes and leather garments 2,447,523 0.65% 2,216,787 0.39% 298,515 0.06%
Automobile and transportation equipment 4,516,043 1.20% 3,027,770 0.53% 4,940,641 0.91%
Financial 4,989,842 1.33% 16,853,440 2.97% 299,486,924 55.26%
Insurance - 0.00% 22,443,630 3.95% 43,143 0.01%
Electronics and electrical appliances 2,399,152 0.64% 3,265,744 0.58% 1,541,579 0.28%
Production and transmission of energy 39,057,078 10.37% 17,157,862 3.02% 58,716,619 10.83%
Paper and allied 789,310 0.21% 2,189,563 0.39% 660,772 0.12%
Surgical and metal 2,265,932 0.60% 1,450,750 0.26% 335,306 0.06%
Contractors 4,263,223 1.13% 16,640,821 2.93% 19,463,140 3.59%
Wholesale traders 20,811,787 5.53% 36,074,167 6.36% 1,319,555 0.24%
Fertilizer dealers 6,823,565 1.81% 8,494,701 1.50% 677,458 0.12%
Sports goods 803,919 0.21% 840,738 0.15% 17,885 0.00%
Food industries 6,858,339 1.82% 3,931,436 0.69% 3,699,826 0.68%
Airlines 6,033,039 1.60% 308,457 0.05% 108,106 0.02%
Cables 661,900 0.18% 96,185 0.02% 744,510 0.14%
Construction 21,866,860 5.81% 8,675,833 1.53% 10,260,326 1.89%
Containers and ports 1,813,903 0.48% 1,543,051 0.27% 2,974,909 0.55%
Engineering 1,531,426 0.41% 3,472,111 0.61% 1,618,692 0.30%
Glass and Allied 301,653 0.08% 385,593 0.07% 220,958 0.04%
Hotels 2,708,633 0.72% 1,223,853 0.22% 438,627 0.08%
Infrastructure 2,273,671 0.60% 4,285,714 0.76% 31,461,991 5.81%
Media 620,575 0.16% 365,056 0.06% 40,879 0.01%
Polyester and fibre 1,980,509 0.53% 623,175 0.11% 78,234 0.01%
Telecommunication 11,333,927 3.01% 3,894,923 0.69% 1,167,952 0.22%
Individuals 68,881,652 18.30% 278,129,372 49.00% 18,590,080 3.43%
Others 25,091,573 6.66% 76,540,295 13.48% 59,604,206 11.00%
376,480,024 100.00% 567,611,258 100.00% 541,971,833 100.00%
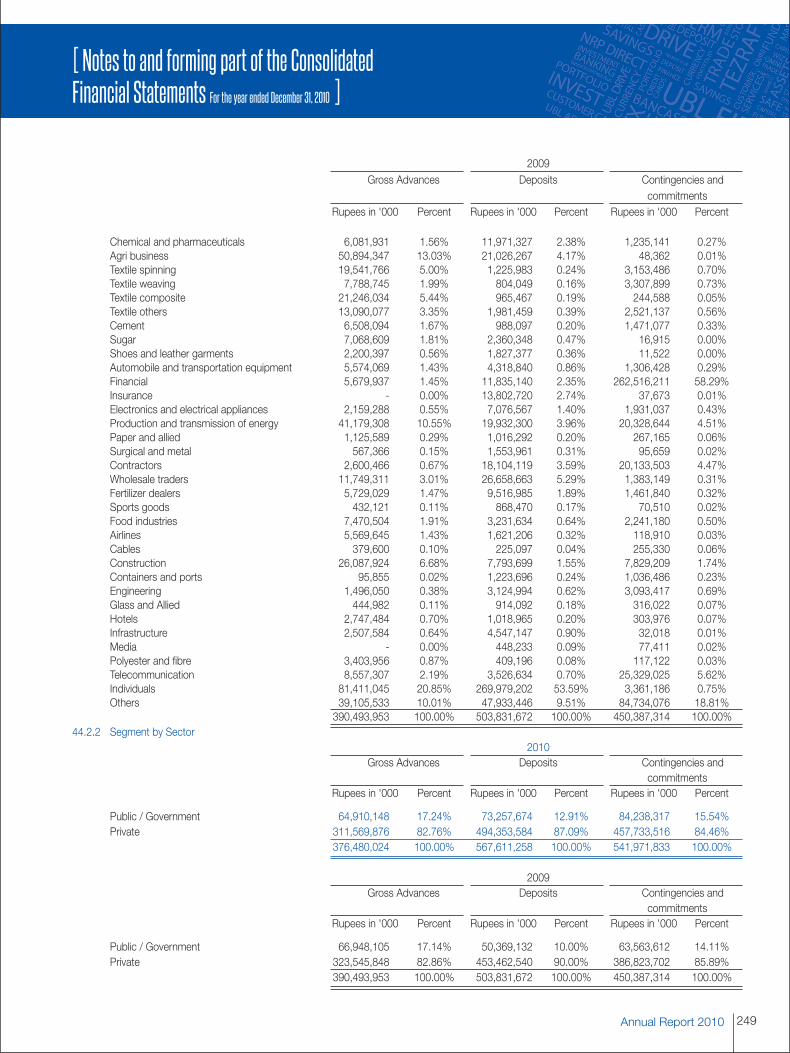
Annual Report 2010 249
2009Gross Advances Deposits Contingencies and
commitmentsRupees in '000 Percent Rupees in '000 Percent Rupees in '000 Percent
Chemical and pharmaceuticals 6,081,931 1.56% 11,971,327 2.38% 1,235,141 0.27%Agri business 50,894,347 13.03% 21,026,267 4.17% 48,362 0.01%Textile spinning 19,541,766 5.00% 1,225,983 0.24% 3,153,486 0.70%Textile weaving 7,788,745 1.99% 804,049 0.16% 3,307,899 0.73%Textile composite 21,246,034 5.44% 965,467 0.19% 244,588 0.05%Textile others 13,090,077 3.35% 1,981,459 0.39% 2,521,137 0.56%Cement 6,508,094 1.67% 988,097 0.20% 1,471,077 0.33%Sugar 7,068,609 1.81% 2,360,348 0.47% 16,915 0.00%Shoes and leather garments 2,200,397 0.56% 1,827,377 0.36% 11,522 0.00%Automobile and transportation equipment 5,574,069 1.43% 4,318,840 0.86% 1,306,428 0.29%Financial 5,679,937 1.45% 11,835,140 2.35% 262,516,211 58.29%Insurance - 0.00% 13,802,720 2.74% 37,673 0.01%Electronics and electrical appliances 2,159,288 0.55% 7,076,567 1.40% 1,931,037 0.43%Production and transmission of energy 41,179,308 10.55% 19,932,300 3.96% 20,328,644 4.51%Paper and allied 1,125,589 0.29% 1,016,292 0.20% 267,165 0.06%Surgical and metal 567,366 0.15% 1,553,961 0.31% 95,659 0.02%Contractors 2,600,466 0.67% 18,104,119 3.59% 20,133,503 4.47%Wholesale traders 11,749,311 3.01% 26,658,663 5.29% 1,383,149 0.31%Fertilizer dealers 5,729,029 1.47% 9,516,985 1.89% 1,461,840 0.32%Sports goods 432,121 0.11% 868,470 0.17% 70,510 0.02%Food industries 7,470,504 1.91% 3,231,634 0.64% 2,241,180 0.50%Airlines 5,569,645 1.43% 1,621,206 0.32% 118,910 0.03%Cables 379,600 0.10% 225,097 0.04% 255,330 0.06%Construction 26,087,924 6.68% 7,793,699 1.55% 7,829,209 1.74%Containers and ports 95,855 0.02% 1,223,696 0.24% 1,036,486 0.23%Engineering 1,496,050 0.38% 3,124,994 0.62% 3,093,417 0.69%Glass and Allied 444,982 0.11% 914,092 0.18% 316,022 0.07%Hotels 2,747,484 0.70% 1,018,965 0.20% 303,976 0.07%Infrastructure 2,507,584 0.64% 4,547,147 0.90% 32,018 0.01%Media - 0.00% 448,233 0.09% 77,411 0.02%Polyester and fibre 3,403,956 0.87% 409,196 0.08% 117,122 0.03%Telecommunication 8,557,307 2.19% 3,526,634 0.70% 25,329,025 5.62%Individuals 81,411,045 20.85% 269,979,202 53.59% 3,361,186 0.75%Others 39,105,533 10.01% 47,933,446 9.51% 84,734,076 18.81%
390,493,953 100.00% 503,831,672 100.00% 450,387,314 100.00%44.2.2 Segment by Sector
2010Gross Advances Deposits Contingencies and
commitmentsRupees in '000 Percent Rupees in '000 Percent Rupees in '000 Percent
Public / Government 64,910,148 17.24% 73,257,674 12.91% 84,238,317 15.54%Private 311,569,876 82.76% 494,353,584 87.09% 457,733,516 84.46%
376,480,024 100.00% 567,611,258 100.00% 541,971,833 100.00%
2009Gross Advances Deposits Contingencies and
commitmentsRupees in '000 Percent Rupees in '000 Percent Rupees in '000 Percent
Public / Government 66,948,105 17.14% 50,369,132 10.00% 63,563,612 14.11%Private 323,545,848 82.86% 453,462,540 90.00% 386,823,702 85.89%
390,493,953 100.00% 503,831,672 100.00% 450,387,314 100.00%
[ Notes to and forming part of the ConsolidatedFinancial Statements For the year ended December 31, 2010 ]

250 United Bank Limited
[ Notes to and forming part of the ConsolidatedFinancial Statements For the year ended December 31, 2010 ]
44.2.3 Details of non performing advances and specific provisions by class of business segment
2010 2009Classified Specific Classified SpecificAdvances Provision Held Advances Provision Held
(Rupees in '000)
Chemical and pharmaceuticals 226,502 196,114 309,349 177,596Agri business 1,430,020 903,057 1,508,525 862,526Textile spinning 5,417,208 4,479,514 5,017,860 3,927,267Textile weaving 910,470 873,022 888,722 867,460Textile composite 5,210,214 2,337,315 998,902 765,271Textile others 2,282,350 1,937,098 2,935,380 2,365,528Cement - - 4,450 4,450Sugar 33,638 33,638 33,638 33,638Shoes and leather garments 226,903 224,110 241,948 180,321Automobile and transportation equipment 726,577 650,422 1,019,508 704,676Financial 2,166,734 64,132 59,305 22,348Electronics and electrical appliances 365,354 345,164 542,892 428,957Production and transmission of energy 3,049,109 2,981,719 2,927,748 1,942,137Paper and allied 179,264 113,240 173,212 116,438Surgical and metal - - 1,775 1,775Wholesale traders 1,167,377 881,274 1,024,613 648,018Fertilizer dealers 7,490 6,878 6,182 4,364Sports goods 128,325 128,325 280,675 279,310Food industries 1,258,725 964,667 795,442 781,194Construction 3,885,120 1,134,507 4,106,175 1,249,378Engineering 440,297 410,139 353,454 353,454Glass and Allied 24,527 12,264 29,796 14,899Hotels 485,993 113,086 489,493 116,586Polyester and fibre 1,751,479 1,743,679 1,702,376 1,668,561Individuals 13,241,553 9,817,528 11,145,588 8,073,785Others 3,997,849 3,193,224 3,468,229 2,110,913
48,613,078 33,544,116 40,065,237 27,700,850
44.2.4 Details of non performing advances and specific provision by sector
2010 2009Classified Specific Classified SpecificAdvances Provision Held Advances Provision Held
(Rupees in '000)
Public / Government - - - -Private 48,613,078 33,544,116 40,065,237 27,700,850
48,613,078 33,544,116 40,065,237 27,700,850
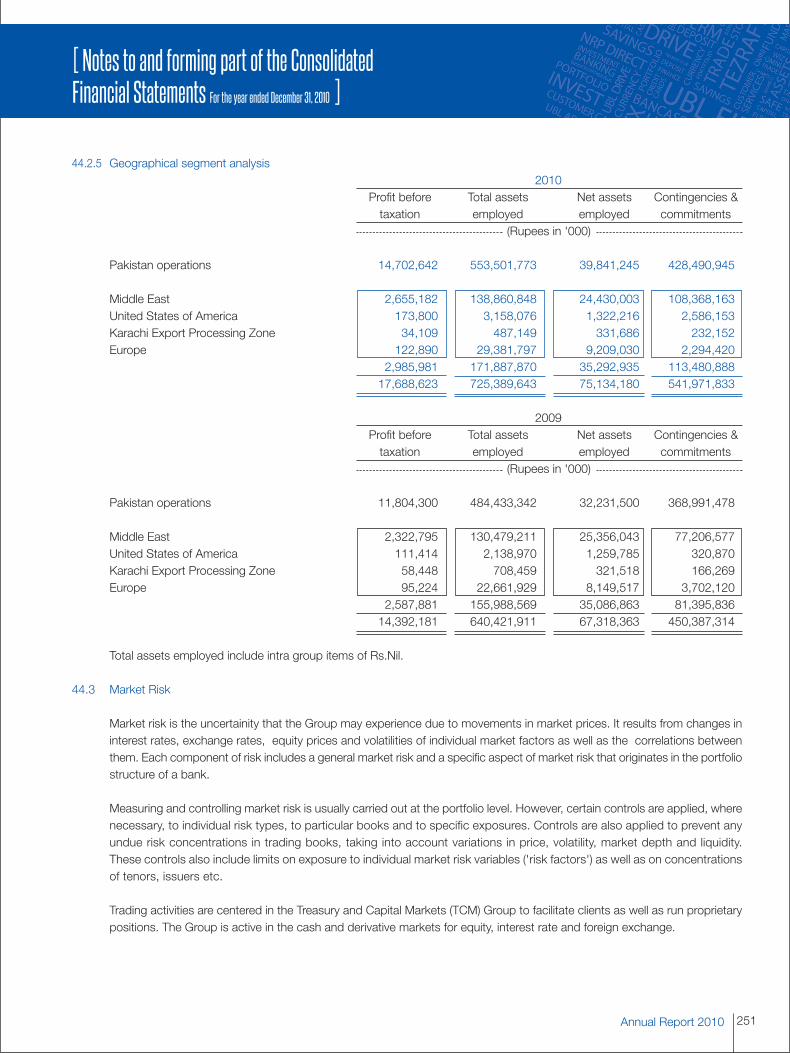
44.2.5 Geographical segment analysis2010
Profit before Total assets Net assets Contingencies &taxation employed employed commitments
(Rupees in '000)
Pakistan operations 14,702,642 553,501,773 39,841,245 428,490,945
Middle East 2,655,182 138,860,848 24,430,003 108,368,163United States of America 173,800 3,158,076 1,322,216 2,586,153Karachi Export Processing Zone 34,109 487,149 331,686 232,152Europe 122,890 29,381,797 9,209,030 2,294,420
2,985,981 171,887,870 35,292,935 113,480,88817,688,623 725,389,643 75,134,180 541,971,833
2009Profit before Total assets Net assets Contingencies &taxation employed employed commitments
(Rupees in '000)
Pakistan operations 11,804,300 484,433,342 32,231,500 368,991,478
Middle East 2,322,795 130,479,211 25,356,043 77,206,577United States of America 111,414 2,138,970 1,259,785 320,870Karachi Export Processing Zone 58,448 708,459 321,518 166,269Europe 95,224 22,661,929 8,149,517 3,702,120
2,587,881 155,988,569 35,086,863 81,395,83614,392,181 640,421,911 67,318,363 450,387,314
Total assets employed include intra group items of Rs.Nil.
44.3 Market Risk
Market risk is the uncertainity that the Group may experience due to movements in market prices. It results from changes ininterest rates, exchange rates, equity prices and volatilities of individual market factors as well as the correlations betweenthem. Each component of risk includes a general market risk and a specific aspect of market risk that originates in the portfoliostructure of a bank.
Measuring and controlling market risk is usually carried out at the portfolio level. However, certain controls are applied, wherenecessary, to individual risk types, to particular books and to specific exposures. Controls are also applied to prevent anyundue risk concentrations in trading books, taking into account variations in price, volatility, market depth and liquidity.These controls also include limits on exposure to individual market risk variables ('risk factors') as well as on concentrationsof tenors, issuers etc.
Trading activities are centered in the Treasury and Capital Markets (TCM) Group to facilitate clients as well as run proprietarypositions. The Group is active in the cash and derivative markets for equity, interest rate and foreign exchange.
Annual Report 2010 251
[ Notes to and forming part of the ConsolidatedFinancial Statements For the year ended December 31, 2010 ]
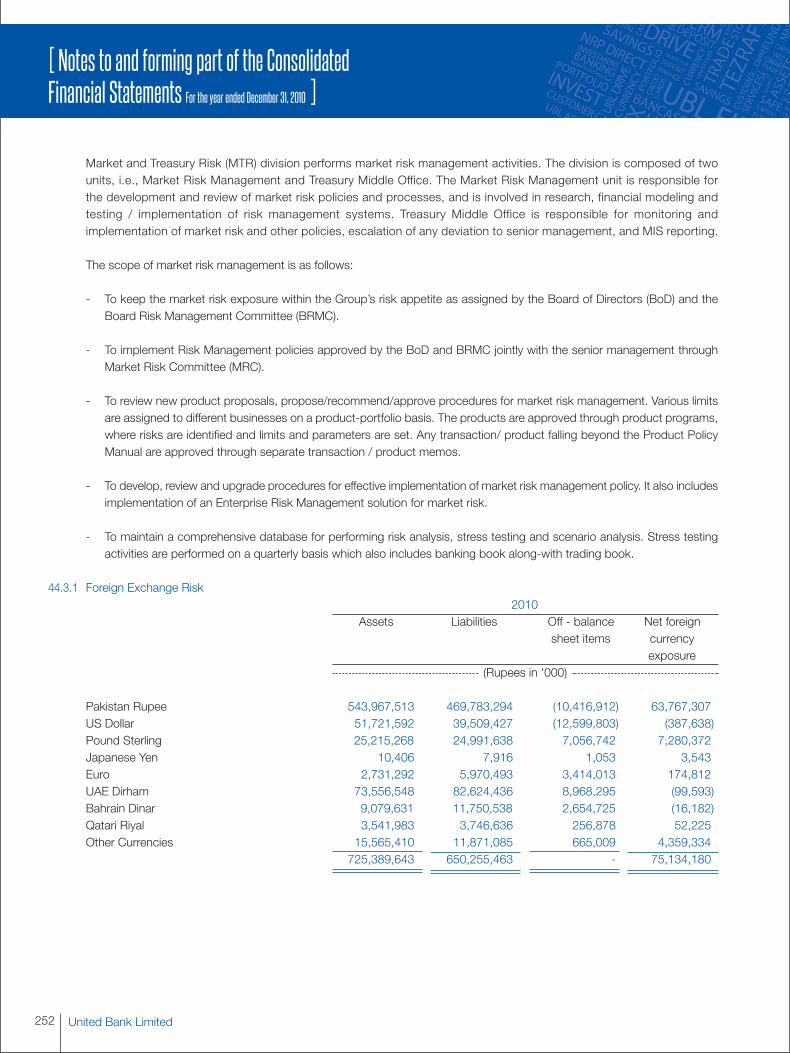
Market and Treasury Risk (MTR) division performs market risk management activities. The division is composed of twounits, i.e., Market Risk Management and Treasury Middle Office. The Market Risk Management unit is responsible forthe development and review of market risk policies and processes, and is involved in research, financial modeling andtesting / implementation of risk management systems. Treasury Middle Office is responsible for monitoring andimplementation of market risk and other policies, escalation of any deviation to senior management, and MIS reporting.
The scope of market risk management is as follows:
- To keep the market risk exposure within the Group’s risk appetite as assigned by the Board of Directors (BoD) and theBoard Risk Management Committee (BRMC).
- To implement Risk Management policies approved by the BoD and BRMC jointly with the senior management throughMarket Risk Committee (MRC).
- To review new product proposals, propose/recommend/approve procedures for market risk management. Various limitsare assigned to different businesses on a product-portfolio basis. The products are approved through product programs,where risks are identified and limits and parameters are set. Any transaction/ product falling beyond the Product PolicyManual are approved through separate transaction / product memos.
- To develop, review and upgrade procedures for effective implementation of market risk management policy. It also includesimplementation of an Enterprise Risk Management solution for market risk.
- To maintain a comprehensive database for performing risk analysis, stress testing and scenario analysis. Stress testingactivities are performed on a quarterly basis which also includes banking book along-with trading book.
44.3.1 Foreign Exchange Risk2010
Assets Liabilities Off - balance Net foreignsheet items currency
exposure(Rupees in '000)
Pakistan Rupee 543,967,513 469,783,294 (10,416,912) 63,767,307US Dollar 51,721,592 39,509,427 (12,599,803) (387,638)Pound Sterling 25,215,268 24,991,638 7,056,742 7,280,372Japanese Yen 10,406 7,916 1,053 3,543Euro 2,731,292 5,970,493 3,414,013 174,812UAE Dirham 73,556,548 82,624,436 8,968,295 (99,593)Bahrain Dinar 9,079,631 11,750,538 2,654,725 (16,182)Qatari Riyal 3,541,983 3,746,636 256,878 52,225Other Currencies 15,565,410 11,871,085 665,009 4,359,334
725,389,643 650,255,463 - 75,134,180
252 United Bank Limited
[ Notes to and forming part of the ConsolidatedFinancial Statements For the year ended December 31, 2010 ]
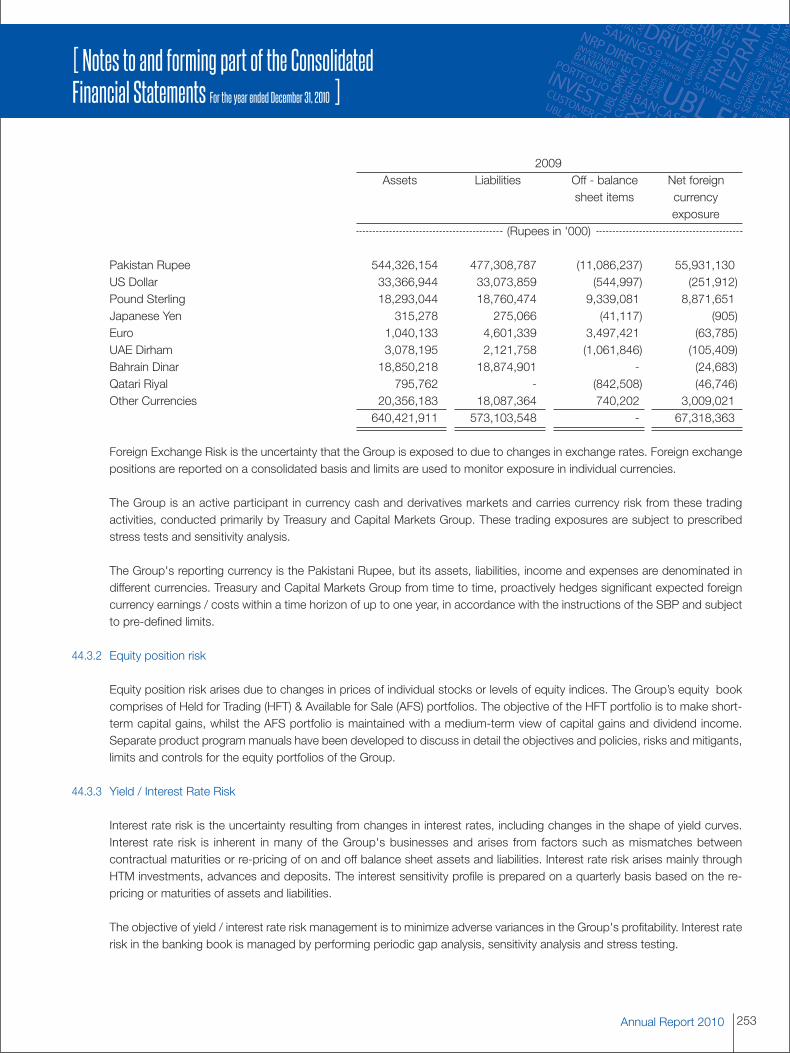
2009Assets Liabilities Off - balance Net foreign
sheet items currencyexposure
(Rupees in '000)
Pakistan Rupee 544,326,154 477,308,787 (11,086,237) 55,931,130US Dollar 33,366,944 33,073,859 (544,997) (251,912)Pound Sterling 18,293,044 18,760,474 9,339,081 8,871,651Japanese Yen 315,278 275,066 (41,117) (905)Euro 1,040,133 4,601,339 3,497,421 (63,785)UAE Dirham 3,078,195 2,121,758 (1,061,846) (105,409)Bahrain Dinar 18,850,218 18,874,901 - (24,683)Qatari Riyal 795,762 - (842,508) (46,746)Other Currencies 20,356,183 18,087,364 740,202 3,009,021
640,421,911 573,103,548 - 67,318,363
Foreign Exchange Risk is the uncertainty that the Group is exposed to due to changes in exchange rates. Foreign exchangepositions are reported on a consolidated basis and limits are used to monitor exposure in individual currencies.
The Group is an active participant in currency cash and derivatives markets and carries currency risk from these tradingactivities, conducted primarily by Treasury and Capital Markets Group. These trading exposures are subject to prescribedstress tests and sensitivity analysis.
The Group's reporting currency is the Pakistani Rupee, but its assets, liabilities, income and expenses are denominated indifferent currencies. Treasury and Capital Markets Group from time to time, proactively hedges significant expected foreigncurrency earnings / costs within a time horizon of up to one year, in accordance with the instructions of the SBP and subjectto pre-defined limits.
44.3.2 Equity position risk
Equity position risk arises due to changes in prices of individual stocks or levels of equity indices. The Group’s equity bookcomprises of Held for Trading (HFT) & Available for Sale (AFS) portfolios. The objective of the HFT portfolio is to make short-term capital gains, whilst the AFS portfolio is maintained with a medium-term view of capital gains and dividend income.Separate product program manuals have been developed to discuss in detail the objectives and policies, risks and mitigants,limits and controls for the equity portfolios of the Group.
44.3.3 Yield / Interest Rate Risk
Interest rate risk is the uncertainty resulting from changes in interest rates, including changes in the shape of yield curves.Interest rate risk is inherent in many of the Group's businesses and arises from factors such as mismatches betweencontractual maturities or re-pricing of on and off balance sheet assets and liabilities. Interest rate risk arises mainly throughHTM investments, advances and deposits. The interest sensitivity profile is prepared on a quarterly basis based on the re-pricing or maturities of assets and liabilities.
The objective of yield / interest rate risk management is to minimize adverse variances in the Group's profitability. Interest raterisk in the banking book is managed by performing periodic gap analysis, sensitivity analysis and stress testing.
Annual Report 2010 253
[ Notes to and forming part of the ConsolidatedFinancial Statements For the year ended December 31, 2010 ]
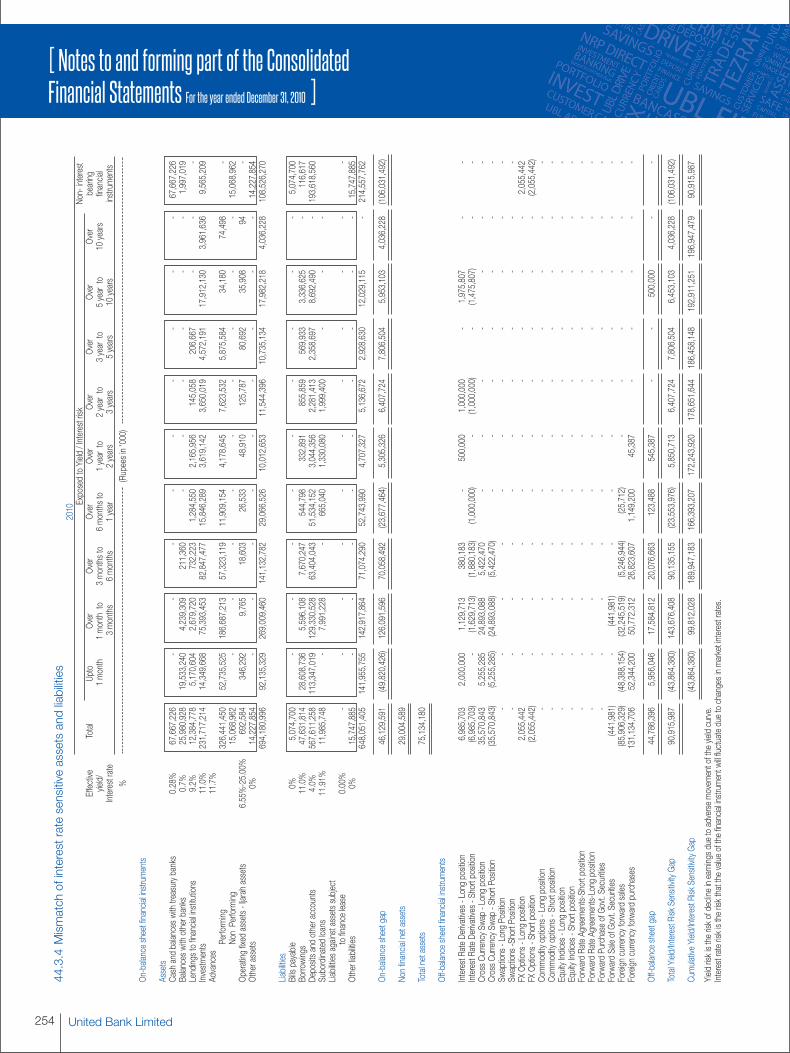
254 United Bank Limited
[ Notes to and forming part of the ConsolidatedFinancial Statements For the year ended December 31, 2010 ]
44.3.4Mismatchofinterestratesensitiveassetsandliabilities
2010ExposedtoYield
/Interestrisk
Non-interest
Effective
Total
Upto
Over
Over
Over
Over
Over
Over
Over
Over
bearing
yield/
1month
1month
to3monthsto
6monthsto
1year
to2year
to3year
to5year
to10
years
financial
Interestrate
3months
6months
1year
2years
3years
5years
10years
instruments
%(Rupeesin'000)
On-balancesheetfinancialinstruments
Assets
Cashandbalanceswithtreasurybanks
0.28%
67,667,226
--
--
--
--
-67,667,226
Balanceswithotherbanks
0.7%
25,980,928
19,533,240
4,239,309
211,360
--
--
--
1,997,019
Lendingstofinancialinstitutions
9.2%
12,384,778
5,170,604
2,679,720
732,223
1,284,550
2,165,956
145,058
206,667
--
-Investments
11.0%
231,717,214
14,349,668
75,393,453
82,847,477
15,846,289
3,619,142
3,650,019
4,572,191
17,912,130
3,961,636
9,565,209
Advances
11.7%
Performing
326,441,450
52,735,525
186,687,213
57,323,119
11,909,154
4,178,645
7,623,532
5,875,584
34,180
74,498
-NonPerforming
15,068,962
--
--
--
--
-15,068,962
Operatingfixed
assets-Ijarah
assets
6.55%-25.00%
692,584
346,292
9,765
18,603
26,533
48,910
125,787
80,692
35,908
94-
Otherassets
0%14,227,854
--
--
--
--
-14,227,854
694,180,996
92,135,329
269,009,460
141,132,782
29,066,526
10,012,653
11,544,396
10,735,134
17,982,218
4,036,228
108,526,270
Liabilities
Billspayable
0%5,074,700
--
--
--
--
-5,074,700
Borrowings
11.0%
47,631,814
28,608,736
5,596,108
7,670,247
544,798
332,891
855,859
569,933
3,336,625
-116,617
Depositsandotheraccounts
4.0%
567,611,258
113,347,019
129,330,528
63,404,043
51,534,152
3,044,356
2,281,413
2,358,697
8,692,490
-193,618,560
Subordinatedloans
11.91%
11,985,748
-7,991,228
-665,040
1,330,080
1,999,400
--
-Liabilitiesagainstassetssubject
tofinancelease
0.00%
--
--
--
--
--
-Otherliabilities
0%15,747,885
--
--
--
--
-15,747,885
648,051,405
141,955,755
142,917,864
71,074,290
52,743,990
4,707,327
5,136,672
2,928,630
12,029,115
-214,557,762
On-balancesheetgap
46,129,591
(49,820,426)
126,091,596
70,058,492
(23,677,464)
5,305,326
6,407,724
7,806,504
5,953,103
4,036,228
(106,031,492)
Nonfinancialnetassets
29,004,589
Totalnetassets
75,134,180
Off-balancesheetfinancialinstruments
InterestRateDerivatives-Longposition
6,985,703
2,000,000
1,129,713
380,183
-500,000
1,000,000
-1,975,807
--
InterestRateDerivatives-Shortposition
(6,985,703)
-(1,629,713)
(1,880,183)
(1,000,000)
-(1,000,000)
-(1,475,807)
--
CrossCurrencySw
ap-Longposition
35,570,843
5,255,285
24,893,088
5,422,470
--
--
--
-CrossCurrencySw
ap-ShortPosition
(35,570,843)
(5,255,285)
(24,893,088)
(5,422,470)
--
--
--
-Sw
aptions-LongPosition
--
--
--
--
--
-Sw
aptions-ShortPosition
--
--
--
--
--
-FX
Options-Longposition
2,055,442
--
--
--
--
-2,055,442
FXOptions-Shortposition
(2,055,442)
--
--
--
--
-(2,055,442)
Commodityoptions-Longposition
--
--
--
--
--
-Commodityoptions-Shortposition
--
--
--
--
--
-EquityIndices-Longposition
--
--
--
--
--
-EquityIndices-Shortposition
--
--
--
--
--
-ForwardRateAgreem
ents-Shortposition
--
--
--
--
--
-ForwardRateAgreem
ents-Longposition
--
--
--
--
--
-ForwardPurchaseofGovt.Securities
--
--
--
--
--
-ForwardSaleofGovt.Securities
(441,981)
-(441,981)
--
--
--
--
Foreigncurrencyforwardsales
(85,906,329)
(48,388,154)
(32,245,519)
(5,246,944)
(25,712)
--
--
--
Foreigncurrencyforwardpurchases
131,134,706
52,344,200
50,772,312
26,823,607
1,149,200
45,387
--
--
-
Off-balancesheetgap
44,786,396
5,956,046
17,584,812
20,076,663
123,488
545,387
--
500,000
--
TotalYield/InterestRiskSensitivityGap
90,915,987
(43,864,380)
143,676,408
90,135,155
(23,553,976)
5,850,713
6,407,724
7,806,504
6,453,103
4,036,228
(106,031,492)
CumulativeYield/InterestRiskSensitivityGap
(43,864,380)
99,812,028
189,947,183
166,393,207
172,243,920
178,651,644
186,458,148
192,911,251
196,947,479
90,915,987
Yield
riskistheriskofdecline
inearningsduetoadversemovem
entofthe
yieldcurve.
Interestrateriskistheriskthatthevalue
ofthefinancialinstrumentwillfluctuateduetochangesinmarketinterestrates.
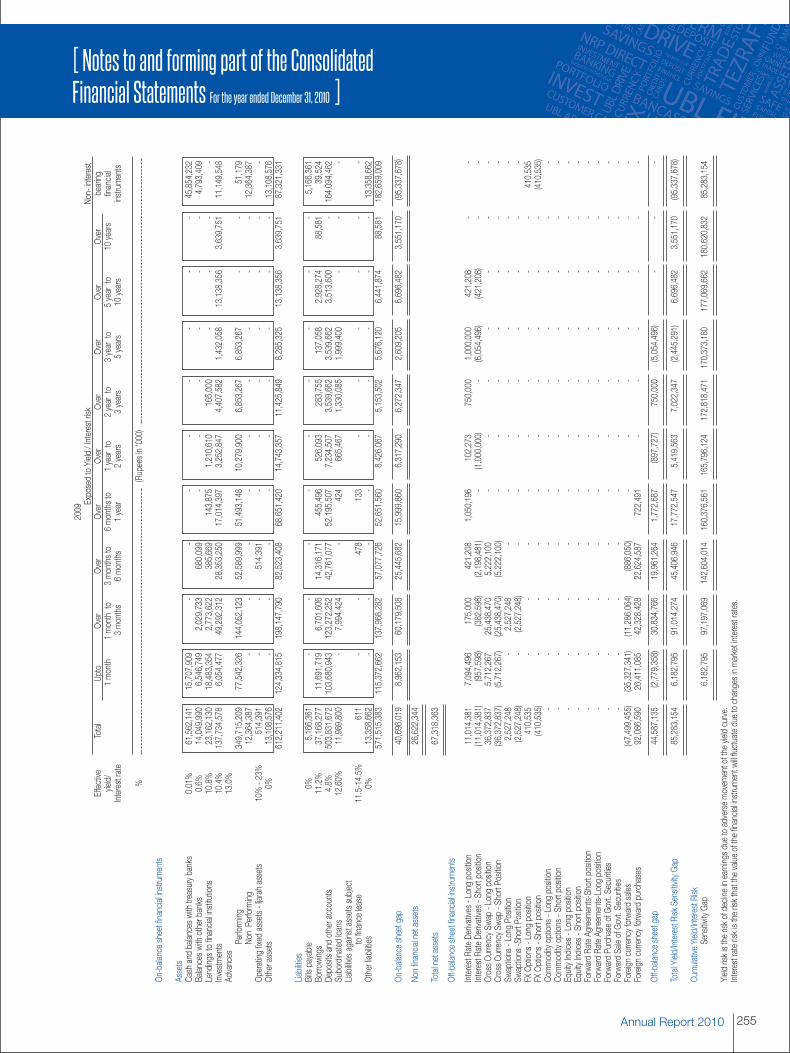
Annual Report 2010 255
[ Notes to and forming part of the ConsolidatedFinancial Statements For the year ended December 31, 2010 ]
2009ExposedtoYield
/Interestrisk
Non-interest
Effective
Total
Upto
Over
Over
Over
Over
Over
Over
Over
Over
bearing
yield/
1month
1month
to3monthsto
6monthsto
1year
to2year
to3year
to5year
to10
years
financial
Interestrate
3months
6months
1year
2years
3years
5years
10years
instruments
%(Rupeesin'000)
On-balancesheetfinancialinstruments
Assets
Cashandbalanceswithtreasurybanks
0.01%
61,562,141
15,707,909
--
--
--
--
45,854,232
Balanceswithotherbanks
0.6%
14,049,990
6,546,749
2,029,733
680,099
--
--
--
4,793,409
Lendingstofinancialinstitutions
10.8%
23,162,130
18,483,354
2,773,622
385,669
143,875
1,210,610
165,000
--
--
Investments
10.4%
137,734,578
6,054,477
49,292,312
28,353,250
17,014,397
3,252,847
4,407,582
1,432,058
13,138,356
3,639,751
11,149,548
Advances
13.0%
Performing
349,715,209
77,542,326
144,052,123
52,589,999
51,493,148
10,279,900
6,853,267
6,853,267
--
51,179
NonPerforming
12,364,387
--
--
--
--
-12,364,387
Operatingfixed
assets-Ijarah
assets
10%-23%
514,391
--
514,391
--
--
--
-Otherassets
0%13,108,576
--
--
--
--
-13,108,576
612,211,402
124,334,815
198,147,790
82,523,408
68,651,420
14,743,357
11,425,849
8,285,325
13,138,356
3,639,751
87,321,331
Liabilities
Billspayable
0%5,166,361
--
--
--
--
-5,166,361
Borrowings
11.2%
37,168,277
11,691,719
6,701,606
14,316,171
455,496
526,093
283,755
137,058
2,928,274
88,581
39,524
Depositsandotheraccounts
4.8%
503,831,672
103,680,943
123,272,252
42,761,077
52,195,507
7,234,507
3,539,662
3,539,662
3,513,600
-164,094,462
Subordinatedloans
12.60%
11,989,800
-7,994,424
-424
665,467
1,330,085
1,999,400
--
-Liabilitiesagainstassetssubject
tofinancelease
11.5-14.5%
611
--
478
133
--
--
--
Otherliabilities
0%13,358,662
--
--
--
--
-13,358,662
571,515,383
115,372,662
137,968,282
57,077,726
52,651,560
8,426,067
5,153,502
5,676,120
6,441,874
88,581
182,659,009
On-balancesheetgap
40,696,019
8,962,153
60,179,508
25,445,682
15,999,860
6,317,290
6,272,347
2,609,205
6,696,482
3,551,170
(95,337,678)
Nonfinancialnetassets
26,622,344
Totalnetassets
67,318,363
Off-balancesheetfinancialinstruments
InterestRateDerivatives-Longposition
11,014,381
7,094,496
175,000
421,208
1,050,196
102,273
750,000
1,000,000
421,208
--
InterestRateDerivatives-Shortposition
(11,014,381)
(957,598)
(382,598)
(2,198,481)
-(1,000,000)
-(6,054,496)
(421,208)
--
CrossCurrencySw
ap-Longposition
36,372,837
5,712,267
25,438,470
5,222,100
--
--
--
-CrossCurrencySw
ap-ShortPosition
(36,372,837)
(5,712,267)
(25,438,470)
(5,222,100)
--
--
--
-Sw
aptions-LongPosition
2,527,248
-2,527,248
--
--
--
--
Swaptions-ShortPosition
(2,527,248)
-(2,527,248)
--
--
--
--
FXOptions-Longposition
410,535
--
--
--
--
-410,535
FXOptions-Shortposition
(410,535)
--
--
--
--
-(410,535)
Commodityoptions-Longposition
--
--
--
--
--
-Commodityoptions-Shortposition
--
--
--
--
--
-EquityIndices-Longposition
--
--
--
--
--
-EquityIndices-Shortposition
--
--
--
--
--
-ForwardRateAgreem
ents-Shortposition
--
--
--
--
--
-ForwardRateAgreem
ents-Longposition
--
--
--
--
--
-ForwardPurchaseofGovt.Securities
--
--
--
--
--
-ForwardSaleofGovt.Securities
--
--
--
--
--
-Foreigncurrencyforwardsales
(47,499,455)
(35,327,341)
(11,286,064)
(886,050)
--
--
--
-Foreigncurrencyforwardpurchases
92,086,590
26,411,085
42,328,428
22,624,587
722,491
--
--
--
Off-balancesheetgap
44,587,135
(2,779,358)
30,834,766
19,961,264
1,772,687
(897,727)
750,000
(5,054,496)
--
-
TotalYield/InterestRiskSensitivityGap
85,283,154
6,182,795
91,014,274
45,406,946
17,772,547
5,419,563
7,022,347
(2,445,291)
6,696,482
3,551,170
(95,337,678)
CumulativeYield/InterestRisk
SensitivityGap
6,182,795
97,197,069
142,604,014
160,376,561
165,796,124
172,818,471
170,373,180
177,069,662
180,620,832
85,283,154
Yield
riskistheriskofdecline
inearningsduetoadversemovem
entofthe
yieldcurve.
Interestrateriskistheriskthatthevalue
ofthefinancialinstrumentwillfluctuateduetochangesinmarketinterestrates.
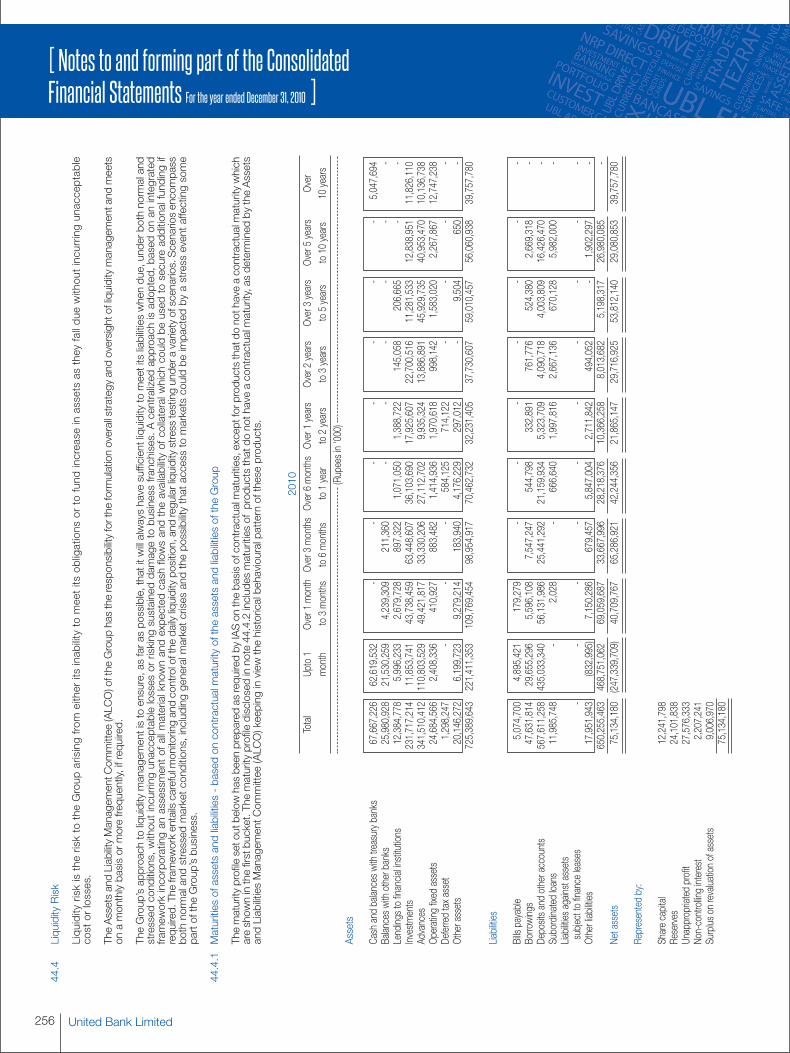
256 United Bank Limited
[ Notes to and forming part of the ConsolidatedFinancial Statements For the year ended December 31, 2010 ]
44.4
LiquidityRisk
LiquidityriskistherisktotheGroup
arisingfrom
eitheritsinabilitytomeetitsobligations
ortofund
increase
inassetsas
theyfalldue
withoutincurringunacceptable
costorlosses.
TheAssetsandLiabilityManagem
entCom
mittee(ALCO)oftheGroup
hastheresponsibilityfortheformulationoverallstrategyandoversightofliquiditymanagem
entand
meets
onamonthlybasisormorefrequently,ifrequired.
TheGroup’sapproachtoliquiditymanagem
entistoensure,asfaraspossible,thatitwillalwayshavesufficientliquiditytomeetitsliabilitieswhendue,underbothnormaland
stressed
conditions,withoutincurringunacceptablelossesorrisking
sustaineddamagetobusinessfranchises.Acentralized
approach
isadopted,basedon
anintegrated
frameworkincorporatingan
assessmentofallm
aterialknownandexpected
cash
flowsandtheavailabilityofcollateralwhich
couldbe
used
tosecureadditionalfunding
ifrequired.Theframeworkentailscarefulmonitoringandcontrolofthedailyliquidityposition,andregularliquiditystresstestingunderavarietyofscenarios.Scenariosencompass
bothnormalandstressed
marketconditions,includinggeneralmarketcrisesandthepossibilitythataccesstomarketscouldbe
impacted
byastresseventaffectingsome
partoftheGroup’sbusiness.
44.4.1
Maturitiesofassetsandliabilities-basedon
contractualmaturityoftheassetsandliabilitiesoftheGroup
ThematurityprofilesetoutbelowhasbeenpreparedasrequiredbyIASonthebasisofcontractualmaturities,exceptforproductsthatdo
nothaveacontractualmaturitywhich
areshowninthefirstbucket.Thematurityprofiledisclosedinnote44.4.2includesmaturitiesofproductsthatdo
nothaveacontractualmaturity,asdetermined
bytheAssets
andLiabilitiesManagem
entCom
mittee(ALCO)keeping
inview
thehistoricalbehaviouralpatternoftheseproducts.
2010
Total
Upto1
Over1
month
Over3
monthsOver6
months
Over1
years
Over2
years
Over3
years
Over5
years
Over
month
to3months
to6months
to1year
to2years
to3years
to5years
to10
years
10years
(Rupeesin'000)
Assets
Cashandbalanceswithtreasurybanks
67,667,226
62,619,532
--
--
--
-5,047,694
Balanceswithotherbanks
25,980,928
21,530,259
4,239,309
211,360
--
--
--
Lendingstofinancialinstitutions
12,384,778
5,996,233
2,679,728
897,322
1,071,050
1,388,722
145,058
206,665
--
Investments
231,717,214
11,853,741
43,738,459
63,448,607
36,103,690
17,925,607
22,700,516
11,281,533
12,838,951
11,826,110
Advances
341,510,412
110,803,529
49,421,817
33,330,206
27,112,702
9,935,324
13,886,891
45,929,735
40,953,470
10,136,738
Operatingfixed
assets
24,684,566
2,408,336
410,927
883,482
1,414,936
1,970,618
998,142
1,583,020
2,267,867
12,747,238
Deferredtaxasset
1,298,247
--
-584,125
714,122
--
--
Otherassets
20,146,272
6,199,723
9,279,214
183,940
4,176,229
297,012
-9,504
650
-725,389,643
221,411,353
109,769,454
98,954,917
70,462,732
32,231,405
37,730,607
59,010,457
56,060,938
39,757,780
Liabilities
Billspayable
5,074,700
4,895,421
179,279
--
--
--
-Borrowings
47,631,814
29,655,296
5,596,108
7,547,247
544,798
332,891
761,776
524,380
2,669,318
-Depositsandotheraccounts
567,611,258
435,033,340
56,131,986
25,441,292
21,159,934
5,323,709
4,090,718
4,003,809
16,426,470
-Subordinatedloans
11,985,748
-2,028
-666,640
1,997,816
2,667,136
670,128
5,982,000
-Liabilitiesagainstassets
subjecttofinanceleases
--
--
--
--
--
Otherliabilities
17,951,943
(832,995)
7,150,286
679,457
5,847,004
2,711,842
494,052
-1,902,297
-650,255,463
468,751,062
69,059,687
33,667,996
28,218,376
10,366,258
8,013,682
5,198,317
26,980,085
-Netassets
75,134,180
(247,339,709)
40,709,767
65,286,921
42,244,356
21,865,147
29,716,925
53,812,140
29,080,853
39,757,780
Representedby:
Sharecapital
12,241,798
Reserves
24,101,838
Unappropriatedprofit
27,576,333
Non-controllinginterest
2,207,241
Surplus
onrevaluationofassets
9,006,970
75,134,180
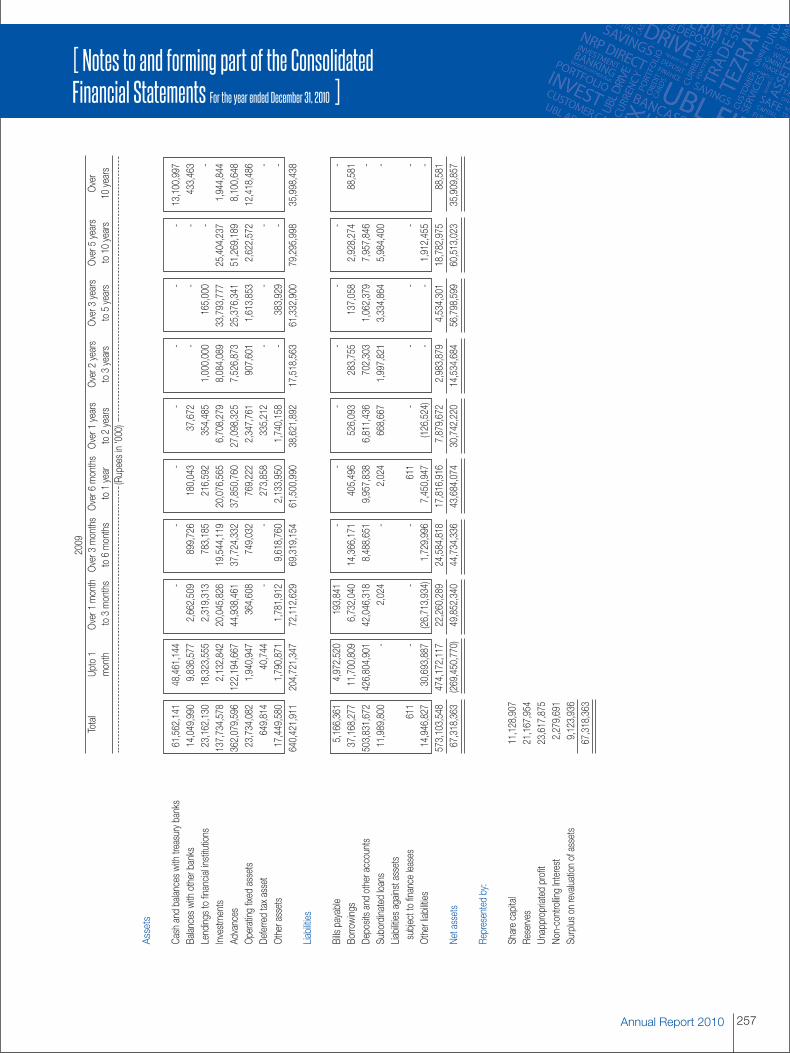
Annual Report 2010 257
[ Notes to and forming part of the ConsolidatedFinancial Statements For the year ended December 31, 2010 ]
2009
Total
Upto1
Over1
month
Over3
monthsOver6
months
Over1
years
Over2
years
Over3
years
Over5
years
Over
month
to3months
to6months
to1year
to2years
to3years
to5years
to10
years
10years
(Rupeesin'000)
Assets
Cashandbalanceswithtreasurybanks
61,562,141
48,461,144
--
--
--
-13,100,997
Balanceswithotherbanks
14,049,990
9,836,577
2,662,509
899,726
180,043
37,672
--
-433,463
Lendingstofinancialinstitutions
23,162,130
18,323,555
2,319,313
783,185
216,592
354,485
1,000,000
165,000
--
Investments
137,734,578
2,132,842
20,045,826
19,544,119
20,076,565
6,708,279
8,084,089
33,793,777
25,404,237
1,944,844
Advances
362,079,596
122,194,667
44,938,461
37,724,332
37,850,760
27,098,325
7,526,873
25,376,341
51,269,189
8,100,648
Operatingfixed
assets
23,734,082
1,940,947
364,608
749,032
769,222
2,347,761
907,601
1,613,853
2,622,572
12,418,486
Deferredtaxasset
649,814
40,744
--
273,858
335,212
--
--
Otherassets
17,449,580
1,790,871
1,781,912
9,618,760
2,133,950
1,740,158
-383,929
--
640,421,911
204,721,347
72,112,629
69,319,154
61,500,990
38,621,892
17,518,563
61,332,900
79,295,998
35,998,438
Liabilities
Billspayable
5,166,361
4,972,520
193,841
--
--
--
-Borrowings
37,168,277
11,700,809
6,732,040
14,366,171
405,496
526,093
283,755
137,058
2,928,274
88,581
Depositsandotheraccounts
503,831,672
426,804,901
42,046,318
8,488,651
9,957,838
6,811,436
702,303
1,062,379
7,957,846
-Subordinatedloans
11,989,800
-2,024
-2,024
668,667
1,997,821
3,334,864
5,984,400
-Liabilitiesagainstassets
subjecttofinanceleases
611
--
-611
--
--
-Otherliabilities
14,946,827
30,693,887
(26,713,934)
1,729,996
7,450,947
(126,524)
--
1,912,455
-573,103,548
474,172,117
22,260,289
24,584,818
17,816,916
7,879,672
2,983,879
4,534,301
18,782,975
88,581
Netassets
67,318,363
(269,450,770)
49,852,340
44,734,336
43,684,074
30,742,220
14,534,684
56,798,599
60,513,023
35,909,857
Representedby:
Sharecapital
11,128,907
Reserves
21,167,954
Unappropriatedprofit
23,617,875
Non-controllingInterest
2,279,691
Surplus
onrevaluationofassets
9,123,936
67,318,363
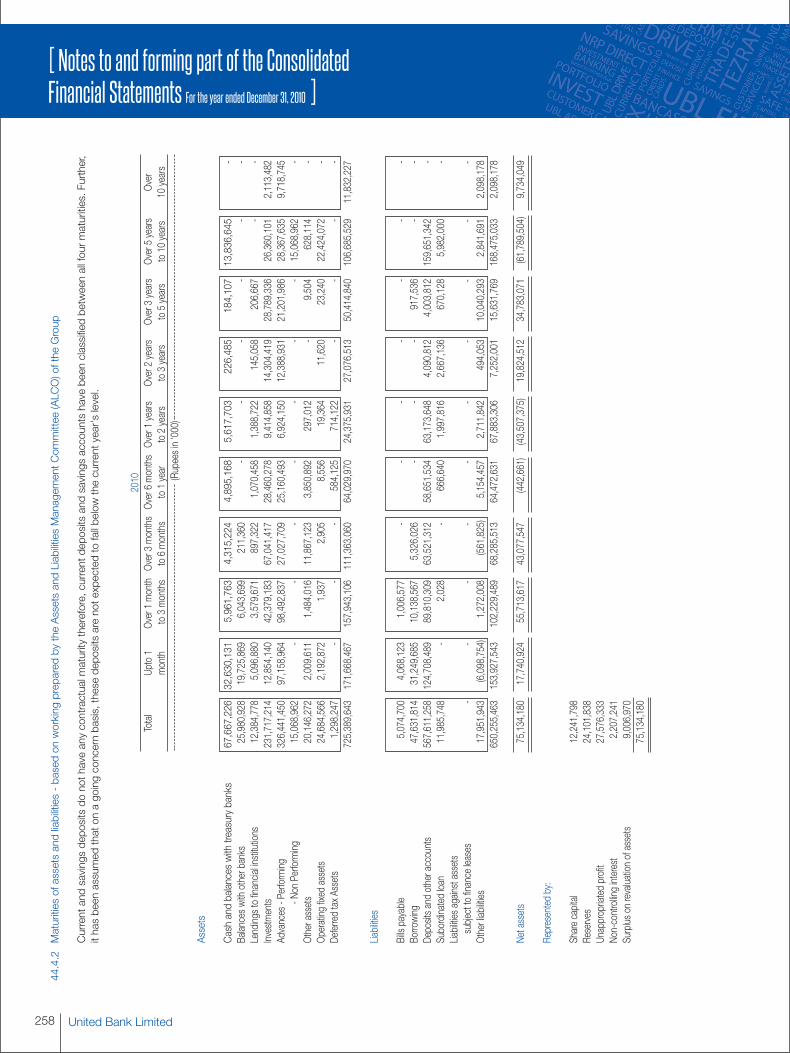
258 United Bank Limited
[ Notes to and forming part of the ConsolidatedFinancial Statements For the year ended December 31, 2010 ]
44.4.2
Maturitiesofassetsandliabilities-basedon
working
prepared
bytheAssetsandLiabilitiesManagem
entCom
mittee(ALCO)oftheGroup
Currentandsavingsdepositsdo
nothaveanycontractualmaturitytherefore,currentdepositsandsavingsaccountshavebeenclassifiedbetweenallfourmaturities.Further,
ithasbeenassumed
thaton
agoingconcernbasis,thesedepositsarenotexpectedtofallbelowthecurrentyear'slevel.
2010
Total
Upto1
Over1
month
Over3
monthsOver6
months
Over1
years
Over2
years
Over3
years
Over5
years
Over
month
to3months
to6months
to1year
to2years
to3years
to5years
to10
years
10years
(Rupeesin'000)
Assets
Cashandbalanceswithtreasurybanks
67,667,226
32,630,131
5,961,763
4,315,224
4,895,168
5,617,703
226,485
184,107
13,836,645
-Balanceswithotherbanks
25,980,928
19,725,869
6,043,699
211,360
--
--
--
Lendingstofinancialinstitutions
12,384,778
5,096,880
3,579,671
897,322
1,070,458
1,388,722
145,058
206,667
--
Investments
231,717,214
12,854,140
42,379,183
67,041,417
28,460,278
9,414,858
14,304,419
28,789,336
26,360,101
2,113,482
Advances-Performing
326,441,450
97,158,964
98,492,837
27,027,709
25,160,493
6,924,150
12,388,931
21,201,986
28,367,635
9,718,745
-Non
Performing
15,068,962
--
--
--
-15,068,962
-Otherassets
20,146,272
2,009,611
1,484,016
11,867,123
3,850,892
297,012
-9,504
628,114
-Operatingfixed
assets
24,684,566
2,192,872
1,937
2,905
8,556
19,364
11,620
23,240
22,424,072
-DeferredtaxAssets
1,298,247
--
-584,125
714,122
--
--
725,389,643
171,668,467
157,943,106
111,363,060
64,029,970
24,375,931
27,076,513
50,414,840
106,685,529
11,832,227
Liabilities
Billspayable
5,074,700
4,068,123
1,006,577
--
--
--
-Borrowing
47,631,814
31,249,685
10,138,567
5,326,026
--
-917,536
--
Depositsandotheraccounts
567,611,258
124,708,489
89,810,309
63,521,312
58,651,534
63,173,648
4,090,812
4,003,812
159,651,342
-Subordinatedloan
11,985,748
-2,028
-666,640
1,997,816
2,667,136
670,128
5,982,000
-Liabilitiesagainstassets
subjecttofinanceleases
--
--
--
--
--
Otherliabilities
17,951,943
(6,098,754)
1,272,008
(561,825)
5,154,457
2,711,842
494,053
10,040,293
2,841,691
2,098,178
650,255,463
153,927,543
102,229,489
68,285,513
64,472,631
67,883,306
7,252,001
15,631,769
168,475,033
2,098,178
Netassets
75,134,180
17,740,924
55,713,617
43,077,547
(442,661)
(43,507,375)
19,824,512
34,783,071
(61,789,504)
9,734,049
Representedby:
Sharecapital
12,241,798
Reserves
24,101,838
Unappropriatedprofit
27,576,333
Non-controllinginterest
2,207,241
Surplus
onrevaluationofassets
9,006,970
75,134,180
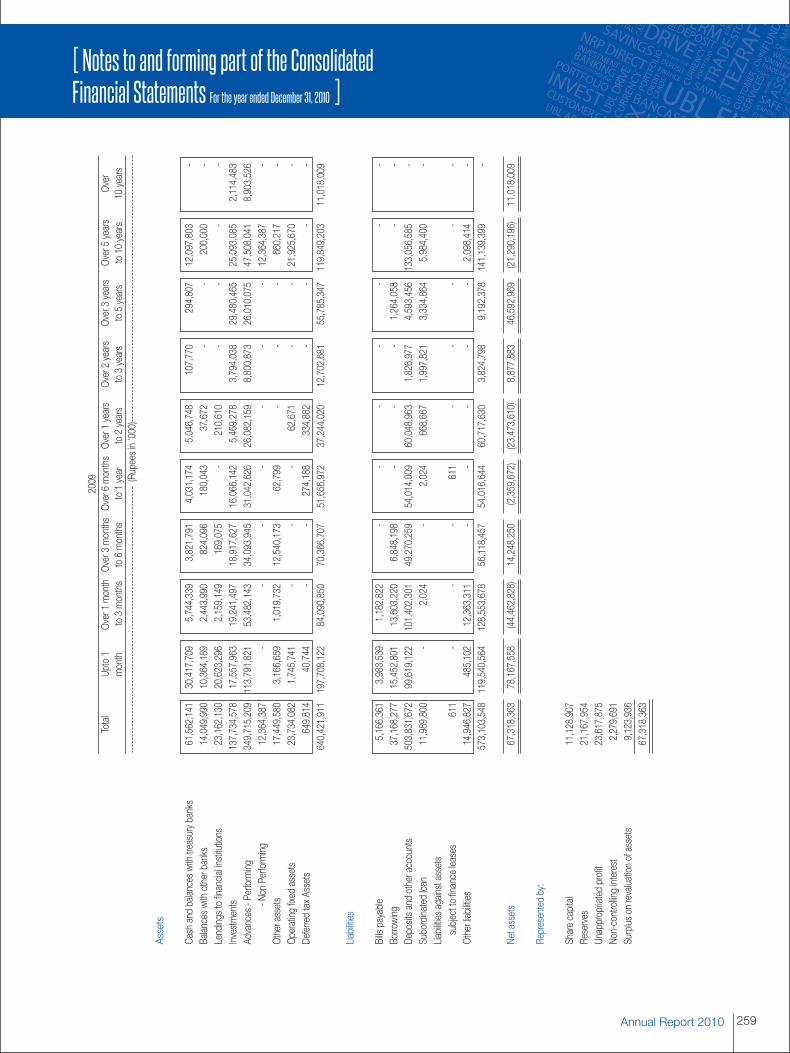
Annual Report 2010 259
[ Notes to and forming part of the ConsolidatedFinancial Statements For the year ended December 31, 2010 ]
2009
Total
Upto1
Over1
month
Over3
monthsOver6
months
Over1
years
Over2
years
Over3
years
Over5
years
Over
month
to3months
to6months
to1year
to2years
to3years
to5years
to10
years
10years
(Rupeesin'000)
Assets
Cashandbalanceswithtreasurybanks
61,562,141
30,417,709
5,744,339
3,821,791
4,031,174
5,046,748
107,770
294,807
12,097,803
-Balanceswithotherbanks
14,049,990
10,364,189
2,443,990
824,096
180,043
37,672
--
200,000
-Lendingstofinancialinstitutions
23,162,130
20,623,296
2,159,149
169,075
-210,610
--
--
Investments
137,734,578
17,557,963
19,241,497
18,917,627
16,066,142
5,469,278
3,794,038
29,480,465
25,093,085
2,114,483
Advances-Performing
349,715,209
113,791,821
53,482,143
34,093,945
31,042,626
26,082,159
8,800,873
26,010,075
47,508,041
8,903,526
-Non
Performing
12,364,387
--
--
--
-12,364,387
-Otherassets
17,449,580
3,166,659
1,019,732
12,540,173
62,799
--
-660,217
-Operatingfixed
assets
23,734,082
1,745,741
--
-62,671
--
21,925,670
-DeferredtaxAssets
649,814
40,744
--
274,188
334,882
--
--
640,421,911
197,708,122
84,090,850
70,366,707
51,656,972
37,244,020
12,702,681
55,785,347
119,849,203
11,018,009
Liabilities
Billspayable
5,166,361
3,983,539
1,182,822
--
--
--
-Borrowing
37,168,277
15,452,801
13,603,220
6,848,198
--
-1,264,058
--
Depositsandotheraccounts
503,831,672
99,619,122
101,402,301
49,270,259
54,014,009
60,048,963
1,826,977
4,593,456
133,056,585
-Subordinatedloan
11,989,800
-2,024
-2,024
668,667
1,997,821
3,334,864
5,984,400
-Liabilitiesagainstassets
subjecttofinanceleases
611
--
-611
--
--
-Otherliabilities
14,946,827
485,102
12,363,311
--
--
-2,098,414
-573,103,548
119,540,564
128,553,678
56,118,457
54,016,644
60,717,630
3,824,798
9,192,378
141,139,399
-
Netassets
67,318,363
78,167,558
(44,462,828)
14,248,250
(2,359,672)
(23,473,610)
8,877,883
46,592,969
(21,290,196)
11,018,009
Representedby:
Sharecapital
11,128,907
Reserves
21,167,954
Unappropriatedprofit
23,617,875
Non-controllinginterest
2,279,691
Surplus
onrevaluationofassets
9,123,936
67,318,363
44.5 Operational Risk
Operational risk is the risk of loss resulting from inadequate or failed internal processes, people and systems or from externalevents.
The Group’s Operational Risk Management implementation framework is based on the advanced risk managementarchitecture. The framework is flexible enough to implement in stages, and permits the overall risk management approach toevolve in response to organizational learning and the future needs of the organization.
Following are the high-level strategic initiatives that the Group has undertaken for the effective implementation of OperationalRisk Management:
- Recruiting skilled resources for Operational Risk Management.
- Developing an operational risk management infrastructure.
- Determining the current state of key risks and their controls residing in each business unit.
- Developing policies, procedures and defining end-to-end information flow to establish a vigorous governance infrastructure.
- Implementing systems for data collection, migration, validation and retention for current and historical reference andcalculation.
A consolidated Business Continuity Plan is being augmented for the Group which encompasses roles and responsibilities,recovery strategy, IT and structural backups, scenario and impact analyses and testing directives.
There are several IT developments underway in the credit, market and operational risk areas. Specifically for operational riskmitigation and control, an IT infrastructure is being developed along with the other high-level initiatives, including process re-engineering and creating an inventory of risks and controls within the Group. A methodology for Risk and Control SelfAssessment has been implemented at all core units of the Group.
260 United Bank Limited
[ Notes to and forming part of the ConsolidatedFinancial Statements For the year ended December 31, 2010 ]

45. ISLAMIC BANKING BUSINESS
The Group operates 6 (2009: 5) Islamic banking branches and 17 (2009: 15) Islamic banking windows. The statement offinancial position of the Group's Islamic Banking Branches at December 31, 2010 is as follows:
2010 2009(Rupees in ‘000)
ASSETSCash and balances with treasury banks 389,582 208,180Balances with other banks 46,654 93,410Lendings to financial institutions 450,000 100,000Investments 2,884,260 1,563,953Financing and receivables
- Murabaha 203,787 154,650- Musharaka 166,667 222,222- Diminishing Musharaka 90,888 261,259
461,342 638,131
Operating fixed assets including assets given on Ijarah 426,052 598,452Due from head office 83,725 -Other assets 297,649 548,396Total Assets 5,039,264 3,750,522
LIABILITIES
Bills payable 970 4,522Deposits and other accounts
- Current accounts 724,750 429,412- Saving accounts 933,100 209,676- Term deposits 1,456,596 459,878- Deposits from financial institutions - remunerative 1,344,775 1,109,452
4,459,221 2,208,418
Due to head office - 948,744Other liabilities 101,782 84,544
4,561,973 3,246,228NET ASSETS 477,291 504,294
REPRESENTED BYIslamic Banking Fund 681,000 681,000Accumulated losses (203,000) (174,404)
478,000 506,596Deficit on revaluation of assets (709) (2,302)
477,291 504,294
Annual Report 2010 261
[ Notes to and forming part of the ConsolidatedFinancial Statements For the year ended December 31, 2010 ]
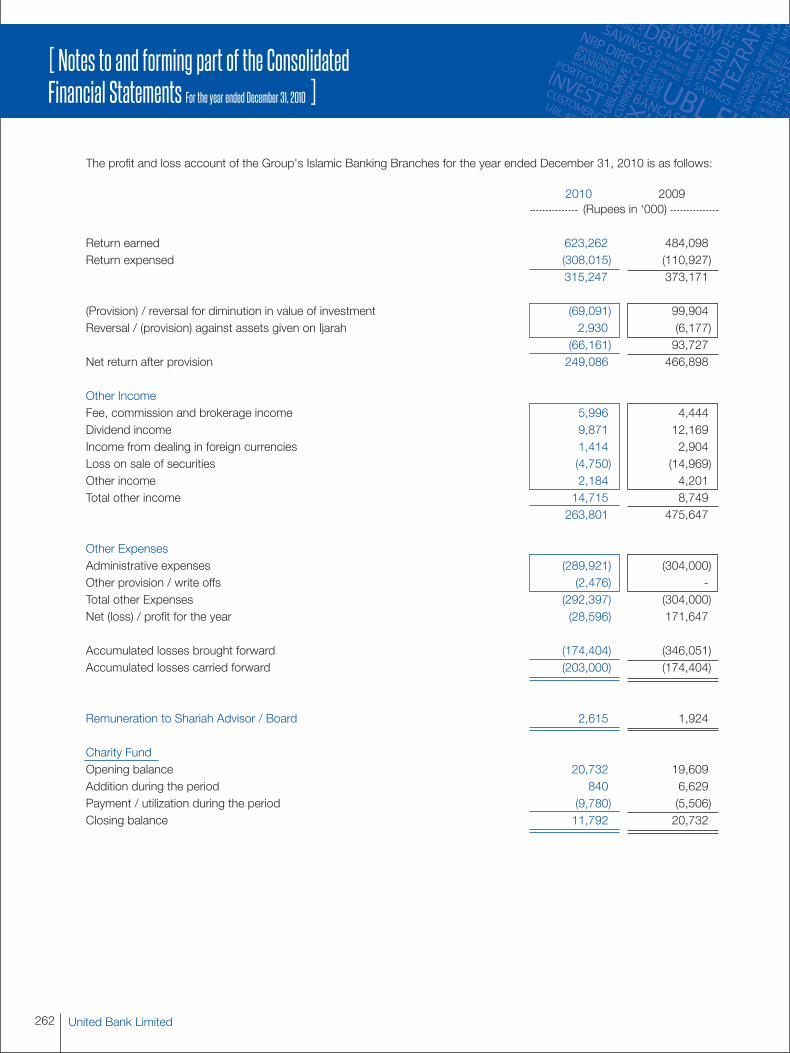
The profit and loss account of the Group's Islamic Banking Branches for the year ended December 31, 2010 is as follows:
2010 2009(Rupees in ‘000)
Return earned 623,262 484,098Return expensed (308,015) (110,927)
315,247 373,171
(Provision) / reversal for diminution in value of investment (69,091) 99,904Reversal / (provision) against assets given on Ijarah 2,930 (6,177)
(66,161) 93,727Net return after provision 249,086 466,898
Other IncomeFee, commission and brokerage income 5,996 4,444Dividend income 9,871 12,169Income from dealing in foreign currencies 1,414 2,904Loss on sale of securities (4,750) (14,969)Other income 2,184 4,201Total other income 14,715 8,749
263,801 475,647
Other ExpensesAdministrative expenses (289,921) (304,000)Other provision / write offs (2,476) -Total other Expenses (292,397) (304,000)Net (loss) / profit for the year (28,596) 171,647
Accumulated losses brought forward (174,404) (346,051)Accumulated losses carried forward (203,000) (174,404)
Remuneration to Shariah Advisor / Board 2,615 1,924
Charity FundOpening balance 20,732 19,609Addition during the period 840 6,629Payment / utilization during the period (9,780) (5,506)Closing balance 11,792 20,732
262 United Bank Limited
[ Notes to and forming part of the ConsolidatedFinancial Statements For the year ended December 31, 2010 ]
46. NON-ADJUSTING EVENT AFTER THE BALANCE SHEET DATE
The Board of Directors in its meeting held on February 21, 2011 has proposed a cash dividend in respect of 2010 ofRs. 4.00 per share (2009: cash dividend Re.2.50 per share). In addition, the directors have also announced a bonus issueof Nil (2009: 10%). These appropriations will be approved in the forthcoming Annual General Meeting. The consolidatedfinancial statements for the year ended December 31, 2010 do not include the effect of these appropriations which willbe accounted for in the consolidated financial statements for the year ending December 31, 2011.
47. DATE OF AUTHORIZATION
These financial statements were authorized for issue on February 21, 2011, by the Board of Directors of the Group.
48. GENERAL
48.1 Comparatives
Comparative information has been re-classified, re-arranged or additionally incorporated in these consolidated financialstatements for the purposes of better presentation. Major reclassifications made are as follows:
- Rs.249.990 million has been reclassified from other income - others to mark-up/interest earned on advances to customers(income on ijarah financing).
- Rs.1,122.772 million has been reclassified from balance with SBP in foreign currency deposit account to balance with SBPin foreign currency current account.
- Rs.1,650.896 million has been reclassified from borrowing in Pakistan to borrowing outside Pakistan.
- Unrealized mark-up held in suspense account amounting to Rs.1,087.189 million has been merged with provision againstother assets.
48.2 Figures have been rounded off to the nearest thousand rupees unless otherwise stated.
Annual Report 2010 263
[ Notes to and forming part of the ConsolidatedFinancial Statements For the year ended December 31, 2010 ]
Atif R. BokhariPresident &
Chief Executive Officer
Muhammad Sami SaeedDirector
Sir Mohammed Anwar Pervez , OBE, HPkDeputy Chairman
Nahayan Mabarak Al NahayanChairman
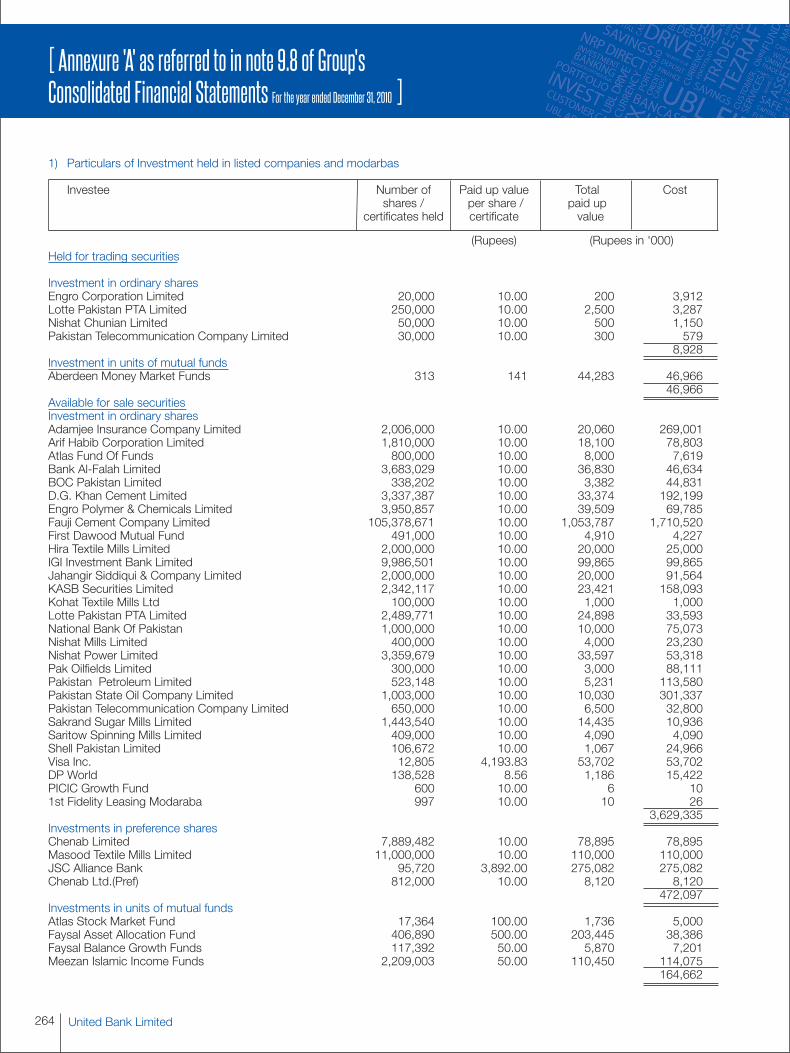
1) Particulars of Investment held in listed companies and modarbas
Investee Number of Paid up value Total Costshares / per share / paid up
certificates held certificate value
(Rupees) (Rupees in '000)Held for trading securities
Investment in ordinary sharesEngro Corporation Limited 20,000 10.00 200 3,912Lotte Pakistan PTA Limited 250,000 10.00 2,500 3,287Nishat Chunian Limited 50,000 10.00 500 1,150Pakistan Telecommunication Company Limited 30,000 10.00 300 579
8,928Investment in units of mutual fundsAberdeen Money Market Funds 313 141 44,283 46,966
46,966Available for sale securitiesInvestment in ordinary sharesAdamjee Insurance Company Limited 2,006,000 10.00 20,060 269,001Arif Habib Corporation Limited 1,810,000 10.00 18,100 78,803Atlas Fund Of Funds 800,000 10.00 8,000 7,619Bank Al-Falah Limited 3,683,029 10.00 36,830 46,634BOC Pakistan Limited 338,202 10.00 3,382 44,831D.G. Khan Cement Limited 3,337,387 10.00 33,374 192,199Engro Polymer & Chemicals Limited 3,950,857 10.00 39,509 69,785Fauji Cement Company Limited 105,378,671 10.00 1,053,787 1,710,520First Dawood Mutual Fund 491,000 10.00 4,910 4,227Hira Textile Mills Limited 2,000,000 10.00 20,000 25,000IGI Investment Bank Limited 9,986,501 10.00 99,865 99,865Jahangir Siddiqui & Company Limited 2,000,000 10.00 20,000 91,564KASB Securities Limited 2,342,117 10.00 23,421 158,093Kohat Textile Mills Ltd 100,000 10.00 1,000 1,000Lotte Pakistan PTA Limited 2,489,771 10.00 24,898 33,593National Bank Of Pakistan 1,000,000 10.00 10,000 75,073Nishat Mills Limited 400,000 10.00 4,000 23,230Nishat Power Limited 3,359,679 10.00 33,597 53,318Pak Oilfields Limited 300,000 10.00 3,000 88,111Pakistan Petroleum Limited 523,148 10.00 5,231 113,580Pakistan State Oil Company Limited 1,003,000 10.00 10,030 301,337Pakistan Telecommunication Company Limited 650,000 10.00 6,500 32,800Sakrand Sugar Mills Limited 1,443,540 10.00 14,435 10,936Saritow Spinning Mills Limited 409,000 10.00 4,090 4,090Shell Pakistan Limited 106,672 10.00 1,067 24,966Visa Inc. 12,805 4,193.83 53,702 53,702DP World 138,528 8.56 1,186 15,422PICIC Growth Fund 600 10.00 6 101st Fidelity Leasing Modaraba 997 10.00 10 26
3,629,335Investments in preference sharesChenab Limited 7,889,482 10.00 78,895 78,895Masood Textile Mills Limited 11,000,000 10.00 110,000 110,000JSC Alliance Bank 95,720 3,892.00 275,082 275,082Chenab Ltd.(Pref) 812,000 10.00 8,120 8,120
472,097Investments in units of mutual fundsAtlas Stock Market Fund 17,364 100.00 1,736 5,000Faysal Asset Allocation Fund 406,890 500.00 203,445 38,386Faysal Balance Growth Funds 117,392 50.00 5,870 7,201Meezan Islamic Income Funds 2,209,003 50.00 110,450 114,075
164,662
264 United Bank Limited
[ Annexure 'A' as referred to in note 9.8 of Group'sConsolidated Financial Statements For the year ended December 31, 2010 ]
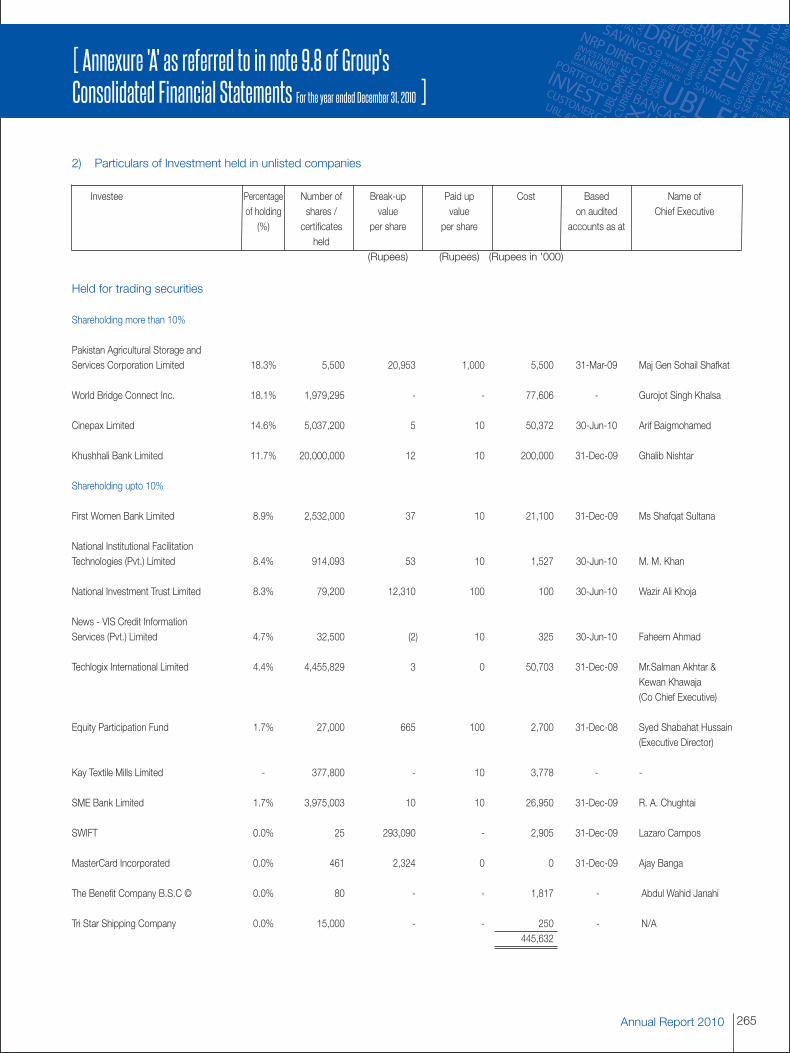
2) Particulars of Investment held in unlisted companies
Investee Percentage Number of Break-up Paid up Cost Based Name ofof holding shares / value value on audited Chief Executive(%) certificates per share per share accounts as at
held(Rupees) (Rupees) (Rupees in '000)
Held for trading securities
Shareholding more than 10%
Pakistan Agricultural Storage andServices Corporation Limited 18.3% 5,500 20,953 1,000 5,500 31-Mar-09 Maj Gen Sohail Shafkat
World Bridge Connect Inc. 18.1% 1,979,295 - - 77,606 - Gurojot Singh Khalsa
Cinepax Limited 14.6% 5,037,200 5 10 50,372 30-Jun-10 Arif Baigmohamed
Khushhali Bank Limited 11.7% 20,000,000 12 10 200,000 31-Dec-09 Ghalib Nishtar
Shareholding upto 10%
First Women Bank Limited 8.9% 2,532,000 37 10 21,100 31-Dec-09 Ms Shafqat Sultana
National Institutional FacilitationTechnologies (Pvt.) Limited 8.4% 914,093 53 10 1,527 30-Jun-10 M. M. Khan
National Investment Trust Limited 8.3% 79,200 12,310 100 100 30-Jun-10 Wazir Ali Khoja
News - VIS Credit InformationServices (Pvt.) Limited 4.7% 32,500 (2) 10 325 30-Jun-10 Faheem Ahmad
Techlogix International Limited 4.4% 4,455,829 3 0 50,703 31-Dec-09 Mr.Salman Akhtar &Kewan Khawaja(Co Chief Executive)
Equity Participation Fund 1.7% 27,000 665 100 2,700 31-Dec-08 Syed Shabahat Hussain(Executive Director)
Kay Textile Mills Limited - 377,800 - 10 3,778 - -
SME Bank Limited 1.7% 3,975,003 10 10 26,950 31-Dec-09 R. A. Chughtai
SWIFT 0.0% 25 293,090 - 2,905 31-Dec-09 Lazaro Campos
MasterCard Incorporated 0.0% 461 2,324 0 0 31-Dec-09 Ajay Banga
The Benefit Company B.S.C © 0.0% 80 - - 1,817 - Abdul Wahid Janahi
Tri Star Shipping Company 0.0% 15,000 - - 250 - N/A445,632
Annual Report 2010 265
[ Annexure 'A' as referred to in note 9.8 of Group'sConsolidated Financial Statements For the year ended December 31, 2010 ]
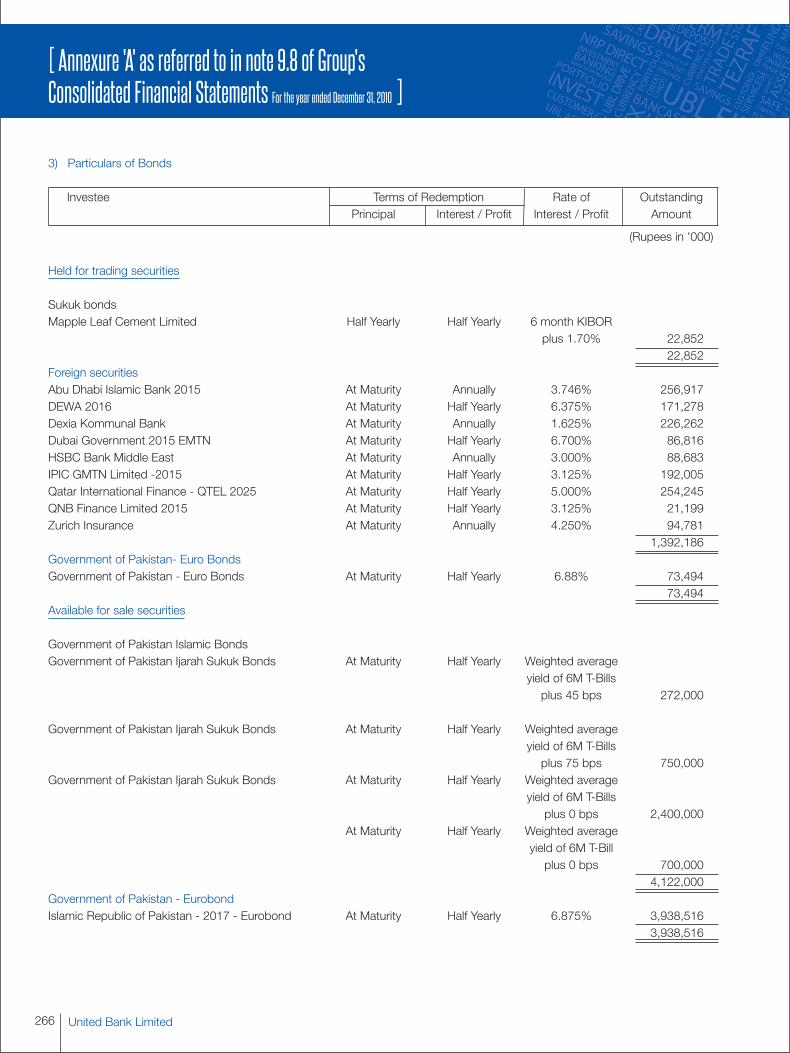
3) Particulars of Bonds
Investee Terms of Redemption Rate of OutstandingPrincipal Interest / Profit Interest / Profit Amount
(Rupees in '000)
Held for trading securities
Sukuk bondsMapple Leaf Cement Limited Half Yearly Half Yearly 6 month KIBOR
plus 1.70% 22,85222,852
Foreign securitiesAbu Dhabi Islamic Bank 2015 At Maturity Annually 3.746% 256,917DEWA 2016 At Maturity Half Yearly 6.375% 171,278Dexia Kommunal Bank At Maturity Annually 1.625% 226,262Dubai Government 2015 EMTN At Maturity Half Yearly 6.700% 86,816HSBC Bank Middle East At Maturity Annually 3.000% 88,683IPIC GMTN Limited -2015 At Maturity Half Yearly 3.125% 192,005Qatar International Finance - QTEL 2025 At Maturity Half Yearly 5.000% 254,245QNB Finance Limited 2015 At Maturity Half Yearly 3.125% 21,199Zurich Insurance At Maturity Annually 4.250% 94,781
1,392,186Government of Pakistan- Euro BondsGovernment of Pakistan - Euro Bonds At Maturity Half Yearly 6.88% 73,494
73,494Available for sale securities
Government of Pakistan Islamic BondsGovernment of Pakistan Ijarah Sukuk Bonds At Maturity Half Yearly Weighted average
yield of 6M T-Billsplus 45 bps 272,000
Government of Pakistan Ijarah Sukuk Bonds At Maturity Half Yearly Weighted averageyield of 6M T-Billsplus 75 bps 750,000
Government of Pakistan Ijarah Sukuk Bonds At Maturity Half Yearly Weighted averageyield of 6M T-Bills
plus 0 bps 2,400,000At Maturity Half Yearly Weighted average
yield of 6M T-Billplus 0 bps 700,000
4,122,000Government of Pakistan - EurobondIslamic Republic of Pakistan - 2017 - Eurobond At Maturity Half Yearly 6.875% 3,938,516
3,938,516
266 United Bank Limited
[ Annexure 'A' as referred to in note 9.8 of Group'sConsolidated Financial Statements For the year ended December 31, 2010 ]
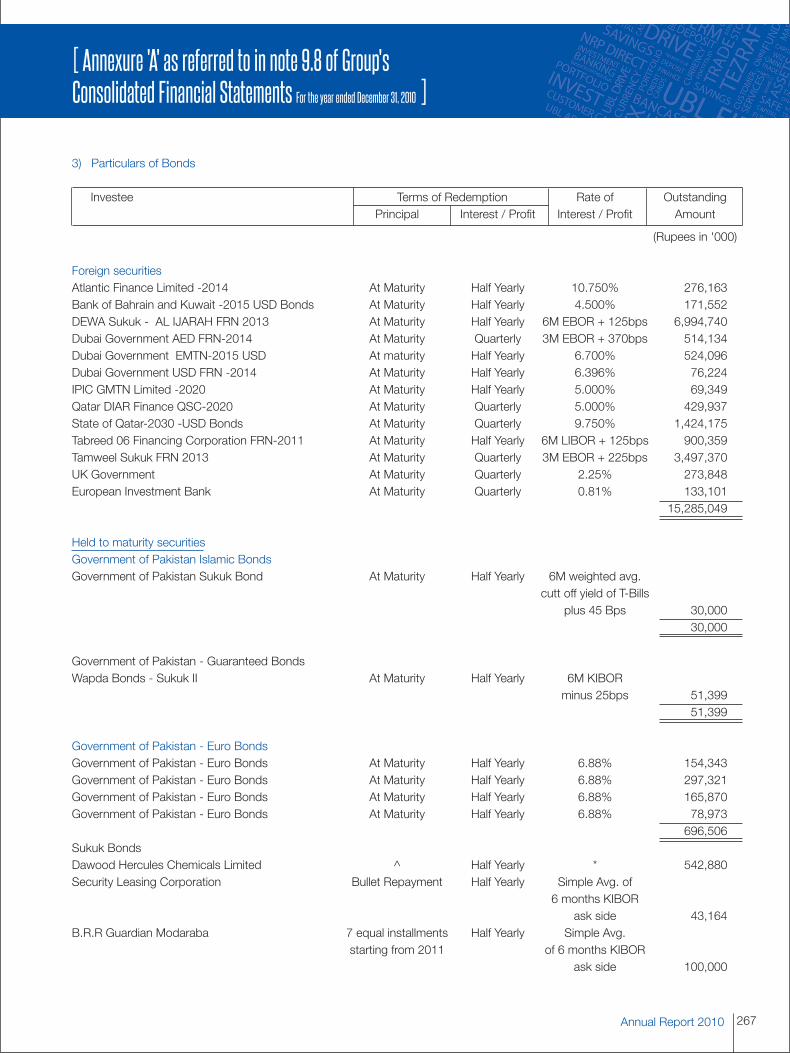
3) Particulars of Bonds
Investee Terms of Redemption Rate of OutstandingPrincipal Interest / Profit Interest / Profit Amount
(Rupees in '000)
Foreign securitiesAtlantic Finance Limited -2014 At Maturity Half Yearly 10.750% 276,163Bank of Bahrain and Kuwait -2015 USD Bonds At Maturity Half Yearly 4.500% 171,552DEWA Sukuk - AL IJARAH FRN 2013 At Maturity Half Yearly 6M EBOR + 125bps 6,994,740Dubai Government AED FRN-2014 At Maturity Quarterly 3M EBOR + 370bps 514,134Dubai Government EMTN-2015 USD At maturity Half Yearly 6.700% 524,096Dubai Government USD FRN -2014 At Maturity Half Yearly 6.396% 76,224IPIC GMTN Limited -2020 At Maturity Half Yearly 5.000% 69,349Qatar DIAR Finance QSC-2020 At Maturity Quarterly 5.000% 429,937State of Qatar-2030 -USD Bonds At Maturity Quarterly 9.750% 1,424,175Tabreed 06 Financing Corporation FRN-2011 At Maturity Half Yearly 6M LIBOR + 125bps 900,359Tamweel Sukuk FRN 2013 At Maturity Quarterly 3M EBOR + 225bps 3,497,370UK Government At Maturity Quarterly 2.25% 273,848European Investment Bank At Maturity Quarterly 0.81% 133,101
15,285,049
Held to maturity securitiesGovernment of Pakistan Islamic BondsGovernment of Pakistan Sukuk Bond At Maturity Half Yearly 6M weighted avg.
cutt off yield of T-Billsplus 45 Bps 30,000
30,000
Government of Pakistan - Guaranteed BondsWapda Bonds - Sukuk II At Maturity Half Yearly 6M KIBOR
minus 25bps 51,39951,399
Government of Pakistan - Euro BondsGovernment of Pakistan - Euro Bonds At Maturity Half Yearly 6.88% 154,343Government of Pakistan - Euro Bonds At Maturity Half Yearly 6.88% 297,321Government of Pakistan - Euro Bonds At Maturity Half Yearly 6.88% 165,870Government of Pakistan - Euro Bonds At Maturity Half Yearly 6.88% 78,973
696,506Sukuk BondsDawood Hercules Chemicals Limited ^ Half Yearly * 542,880Security Leasing Corporation Bullet Repayment Half Yearly Simple Avg. of
6 months KIBORask side 43,164
B.R.R Guardian Modaraba 7 equal installments Half Yearly Simple Avg.starting from 2011 of 6 months KIBOR
ask side 100,000
Annual Report 2010 267
[ Annexure 'A' as referred to in note 9.8 of Group'sConsolidated Financial Statements For the year ended December 31, 2010 ]
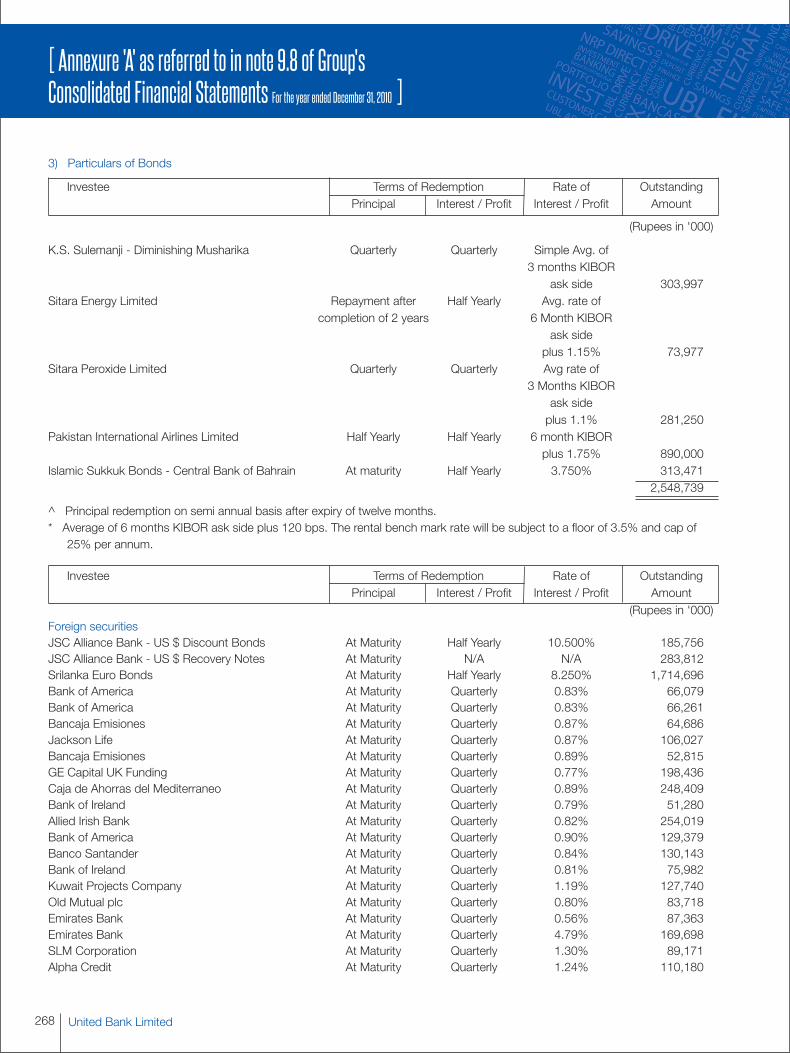
3) Particulars of Bonds
Investee Terms of Redemption Rate of OutstandingPrincipal Interest / Profit Interest / Profit Amount
(Rupees in '000)
K.S. Sulemanji - Diminishing Musharika Quarterly Quarterly Simple Avg. of3 months KIBOR
ask side 303,997Sitara Energy Limited Repayment after Half Yearly Avg. rate of
completion of 2 years 6 Month KIBORask side
plus 1.15% 73,977Sitara Peroxide Limited Quarterly Quarterly Avg rate of
3 Months KIBORask sideplus 1.1% 281,250
Pakistan International Airlines Limited Half Yearly Half Yearly 6 month KIBORplus 1.75% 890,000
Islamic Sukkuk Bonds - Central Bank of Bahrain At maturity Half Yearly 3.750% 313,4712,548,739
^ Principal redemption on semi annual basis after expiry of twelve months.* Average of 6 months KIBOR ask side plus 120 bps. The rental bench mark rate will be subject to a floor of 3.5% and cap of
25% per annum.
Investee Terms of Redemption Rate of OutstandingPrincipal Interest / Profit Interest / Profit Amount
(Rupees in '000)Foreign securitiesJSC Alliance Bank - US $ Discount Bonds At Maturity Half Yearly 10.500% 185,756JSC Alliance Bank - US $ Recovery Notes At Maturity N/A N/A 283,812Srilanka Euro Bonds At Maturity Half Yearly 8.250% 1,714,696Bank of America At Maturity Quarterly 0.83% 66,079Bank of America At Maturity Quarterly 0.83% 66,261Bancaja Emisiones At Maturity Quarterly 0.87% 64,686Jackson Life At Maturity Quarterly 0.87% 106,027Bancaja Emisiones At Maturity Quarterly 0.89% 52,815GE Capital UK Funding At Maturity Quarterly 0.77% 198,436Caja de Ahorras del Mediterraneo At Maturity Quarterly 0.89% 248,409Bank of Ireland At Maturity Quarterly 0.79% 51,280Allied Irish Bank At Maturity Quarterly 0.82% 254,019Bank of America At Maturity Quarterly 0.90% 129,379Banco Santander At Maturity Quarterly 0.84% 130,143Bank of Ireland At Maturity Quarterly 0.81% 75,982Kuwait Projects Company At Maturity Quarterly 1.19% 127,740Old Mutual plc At Maturity Quarterly 0.80% 83,718Emirates Bank At Maturity Quarterly 0.56% 87,363Emirates Bank At Maturity Quarterly 4.79% 169,698SLM Corporation At Maturity Quarterly 1.30% 89,171Alpha Credit At Maturity Quarterly 1.24% 110,180
268 United Bank Limited
[ Annexure 'A' as referred to in note 9.8 of Group'sConsolidated Financial Statements For the year ended December 31, 2010 ]
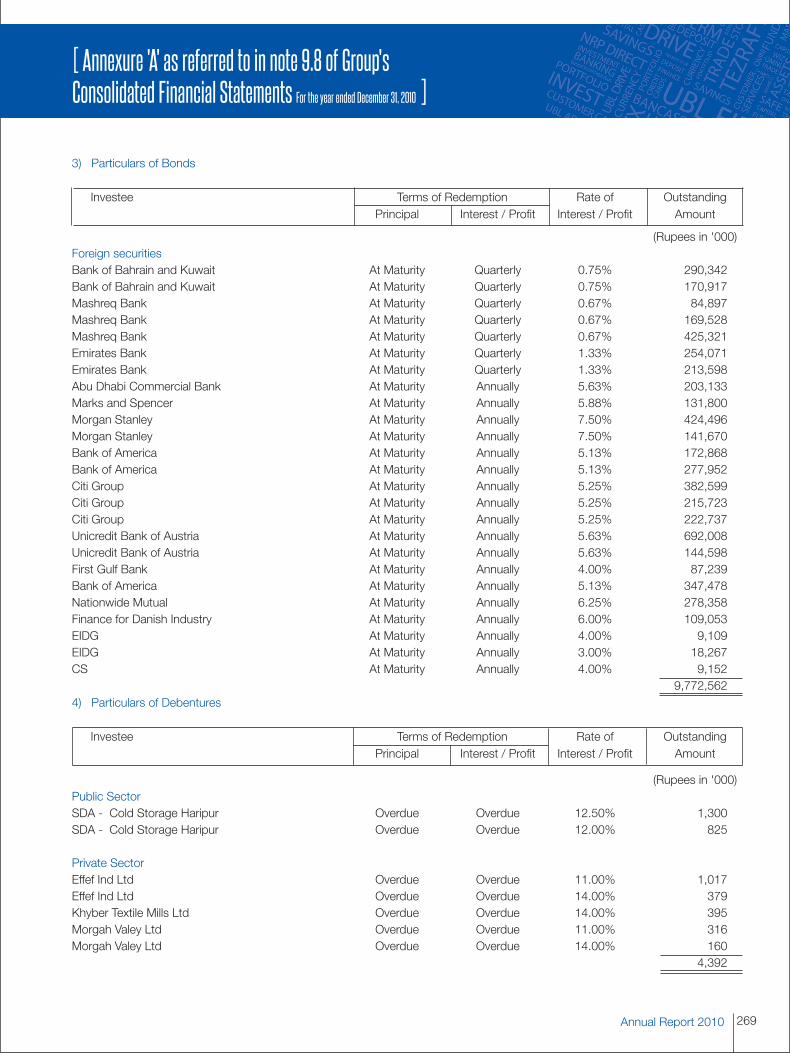
3) Particulars of Bonds
Investee Terms of Redemption Rate of OutstandingPrincipal Interest / Profit Interest / Profit Amount
(Rupees in '000)Foreign securitiesBank of Bahrain and Kuwait At Maturity Quarterly 0.75% 290,342Bank of Bahrain and Kuwait At Maturity Quarterly 0.75% 170,917Mashreq Bank At Maturity Quarterly 0.67% 84,897Mashreq Bank At Maturity Quarterly 0.67% 169,528Mashreq Bank At Maturity Quarterly 0.67% 425,321Emirates Bank At Maturity Quarterly 1.33% 254,071Emirates Bank At Maturity Quarterly 1.33% 213,598Abu Dhabi Commercial Bank At Maturity Annually 5.63% 203,133Marks and Spencer At Maturity Annually 5.88% 131,800Morgan Stanley At Maturity Annually 7.50% 424,496Morgan Stanley At Maturity Annually 7.50% 141,670Bank of America At Maturity Annually 5.13% 172,868Bank of America At Maturity Annually 5.13% 277,952Citi Group At Maturity Annually 5.25% 382,599Citi Group At Maturity Annually 5.25% 215,723Citi Group At Maturity Annually 5.25% 222,737Unicredit Bank of Austria At Maturity Annually 5.63% 692,008Unicredit Bank of Austria At Maturity Annually 5.63% 144,598First Gulf Bank At Maturity Annually 4.00% 87,239Bank of America At Maturity Annually 5.13% 347,478Nationwide Mutual At Maturity Annually 6.25% 278,358Finance for Danish Industry At Maturity Annually 6.00% 109,053EIDG At Maturity Annually 4.00% 9,109EIDG At Maturity Annually 3.00% 18,267CS At Maturity Annually 4.00% 9,152
9,772,5624) Particulars of Debentures
Investee Terms of Redemption Rate of OutstandingPrincipal Interest / Profit Interest / Profit Amount
(Rupees in '000)Public SectorSDA - Cold Storage Haripur Overdue Overdue 12.50% 1,300SDA - Cold Storage Haripur Overdue Overdue 12.00% 825
Private SectorEffef Ind Ltd Overdue Overdue 11.00% 1,017Effef Ind Ltd Overdue Overdue 14.00% 379Khyber Textile Mills Ltd Overdue Overdue 14.00% 395Morgah Valey Ltd Overdue Overdue 11.00% 316Morgah Valey Ltd Overdue Overdue 14.00% 160
4,392
Annual Report 2010 269
[ Annexure 'A' as referred to in note 9.8 of Group'sConsolidated Financial Statements For the year ended December 31, 2010 ]
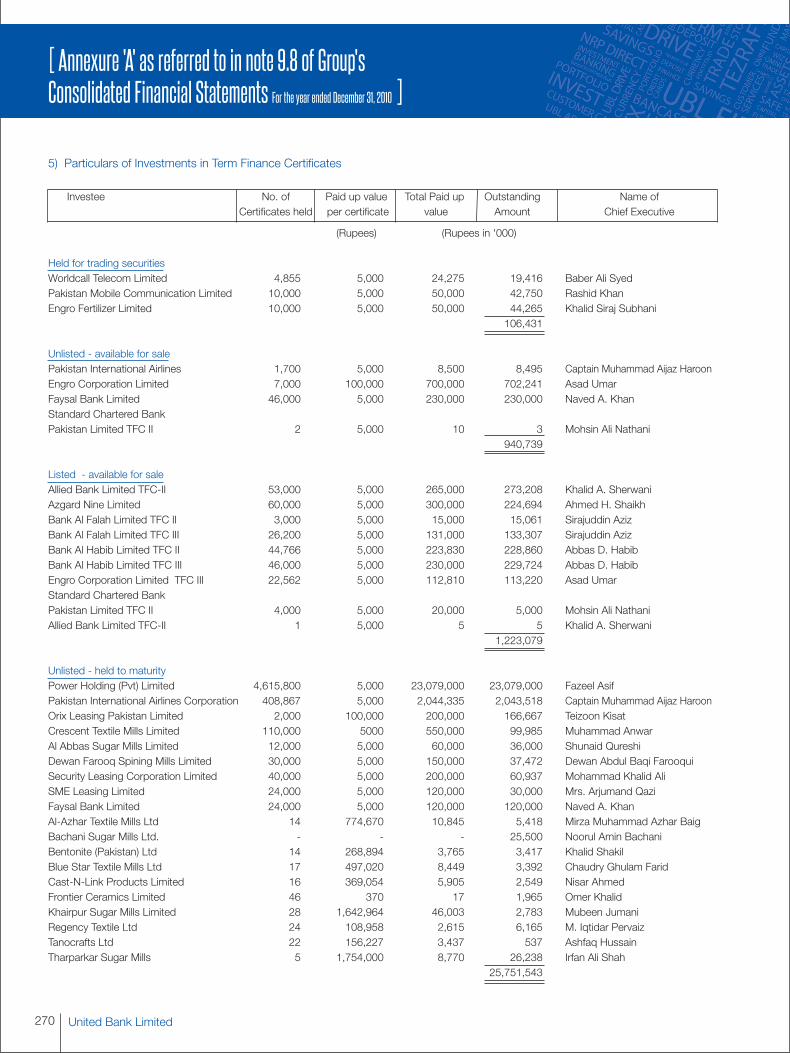
5) Particulars of Investments in Term Finance Certificates
Investee No. of Paid up value Total Paid up Outstanding Name ofCertificates held per certificate value Amount Chief Executive
(Rupees) (Rupees in '000)
Held for trading securitiesWorldcall Telecom Limited 4,855 5,000 24,275 19,416 Baber Ali SyedPakistan Mobile Communication Limited 10,000 5,000 50,000 42,750 Rashid KhanEngro Fertilizer Limited 10,000 5,000 50,000 44,265 Khalid Siraj Subhani
106,431
Unlisted - available for salePakistan International Airlines 1,700 5,000 8,500 8,495 Captain Muhammad Aijaz HaroonEngro Corporation Limited 7,000 100,000 700,000 702,241 Asad UmarFaysal Bank Limited 46,000 5,000 230,000 230,000 Naved A. KhanStandard Chartered BankPakistan Limited TFC II 2 5,000 10 3 Mohsin Ali Nathani
940,739
Listed - available for saleAllied Bank Limited TFC-II 53,000 5,000 265,000 273,208 Khalid A. SherwaniAzgard Nine Limited 60,000 5,000 300,000 224,694 Ahmed H. ShaikhBank Al Falah Limited TFC II 3,000 5,000 15,000 15,061 Sirajuddin AzizBank Al Falah Limited TFC III 26,200 5,000 131,000 133,307 Sirajuddin AzizBank Al Habib Limited TFC II 44,766 5,000 223,830 228,860 Abbas D. HabibBank Al Habib Limited TFC III 46,000 5,000 230,000 229,724 Abbas D. HabibEngro Corporation Limited TFC III 22,562 5,000 112,810 113,220 Asad UmarStandard Chartered BankPakistan Limited TFC II 4,000 5,000 20,000 5,000 Mohsin Ali NathaniAllied Bank Limited TFC-II 1 5,000 5 5 Khalid A. Sherwani
1,223,079
Unlisted - held to maturityPower Holding (Pvt) Limited 4,615,800 5,000 23,079,000 23,079,000 Fazeel AsifPakistan International Airlines Corporation 408,867 5,000 2,044,335 2,043,518 Captain Muhammad Aijaz HaroonOrix Leasing Pakistan Limited 2,000 100,000 200,000 166,667 Teizoon KisatCrescent Textile Mills Limited 110,000 5000 550,000 99,985 Muhammad AnwarAl Abbas Sugar Mills Limited 12,000 5,000 60,000 36,000 Shunaid QureshiDewan Farooq Spining Mills Limited 30,000 5,000 150,000 37,472 Dewan Abdul Baqi FarooquiSecurity Leasing Corporation Limited 40,000 5,000 200,000 60,937 Mohammad Khalid AliSME Leasing Limited 24,000 5,000 120,000 30,000 Mrs. Arjumand QaziFaysal Bank Limited 24,000 5,000 120,000 120,000 Naved A. KhanAl-Azhar Textile Mills Ltd 14 774,670 10,845 5,418 Mirza Muhammad Azhar BaigBachani Sugar Mills Ltd. - - - 25,500 Noorul Amin BachaniBentonite (Pakistan) Ltd 14 268,894 3,765 3,417 Khalid ShakilBlue Star Textile Mills Ltd 17 497,020 8,449 3,392 Chaudry Ghulam FaridCast-N-Link Products Limited 16 369,054 5,905 2,549 Nisar AhmedFrontier Ceramics Limited 46 370 17 1,965 Omer KhalidKhairpur Sugar Mills Limited 28 1,642,964 46,003 2,783 Mubeen JumaniRegency Textile Ltd 24 108,958 2,615 6,165 M. Iqtidar PervaizTanocrafts Ltd 22 156,227 3,437 537 Ashfaq HussainTharparkar Sugar Mills 5 1,754,000 8,770 26,238 Irfan Ali Shah
25,751,543
270 United Bank Limited
[ Annexure 'A' as referred to in note 9.8 of Group'sConsolidated Financial Statements For the year ended December 31, 2010 ]
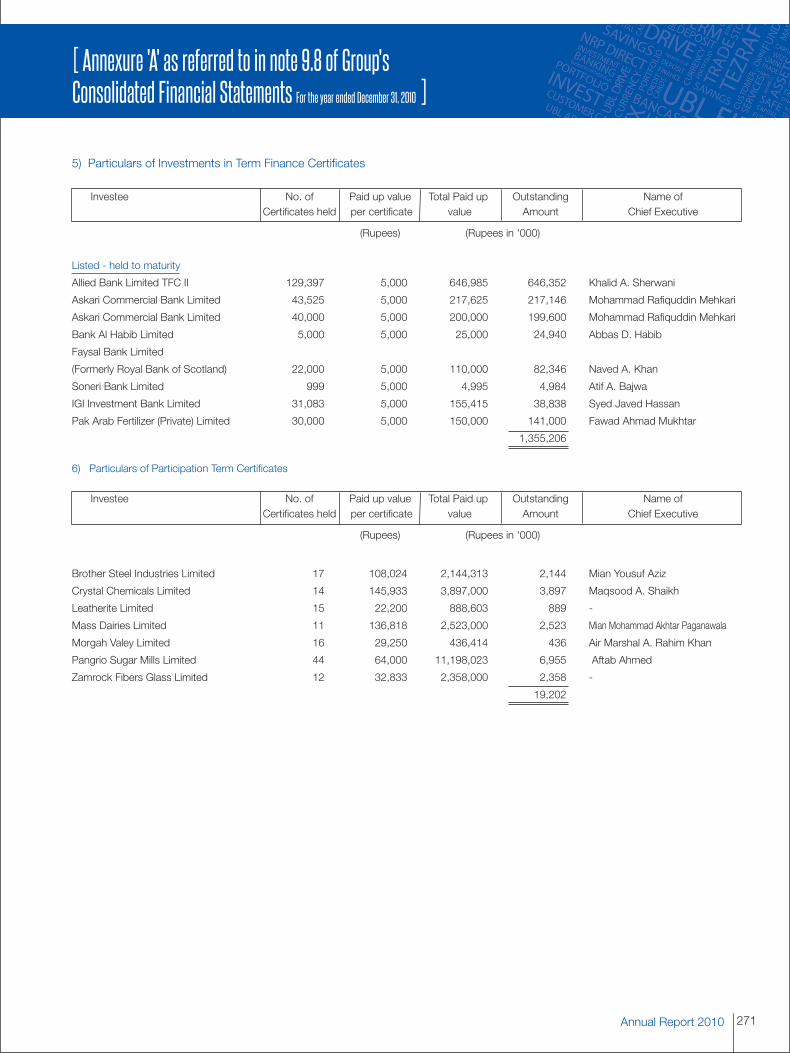
5) Particulars of Investments in Term Finance Certificates
Investee No. of Paid up value Total Paid up Outstanding Name ofCertificates held per certificate value Amount Chief Executive
(Rupees) (Rupees in '000)
Listed - held to maturity
Allied Bank Limited TFC II 129,397 5,000 646,985 646,352 Khalid A. Sherwani
Askari Commercial Bank Limited 43,525 5,000 217,625 217,146 Mohammad Rafiquddin Mehkari
Askari Commercial Bank Limited 40,000 5,000 200,000 199,600 Mohammad Rafiquddin Mehkari
Bank Al Habib Limited 5,000 5,000 25,000 24,940 Abbas D. Habib
Faysal Bank Limited
(Formerly Royal Bank of Scotland) 22,000 5,000 110,000 82,346 Naved A. Khan
Soneri Bank Limited 999 5,000 4,995 4,984 Atif A. Bajwa
IGI Investment Bank Limited 31,083 5,000 155,415 38,838 Syed Javed Hassan
Pak Arab Fertilizer (Private) Limited 30,000 5,000 150,000 141,000 Fawad Ahmad Mukhtar
1,355,206
6) Particulars of Participation Term Certificates
Investee No. of Paid up value Total Paid up Outstanding Name ofCertificates held per certificate value Amount Chief Executive
(Rupees) (Rupees in '000)
Brother Steel Industries Limited 17 108,024 2,144,313 2,144 Mian Yousuf Aziz
Crystal Chemicals Limited 14 145,933 3,897,000 3,897 Maqsood A. Shaikh
Leatherite Limited 15 22,200 888,603 889 -
Mass Dairies Limited 11 136,818 2,523,000 2,523 Mian Mohammad Akhtar Paganawala
Morgah Valey Limited 16 29,250 436,414 436 Air Marshal A. Rahim Khan
Pangrio Sugar Mills Limited 44 64,000 11,198,023 6,955 Aftab Ahmed
Zamrock Fibers Glass Limited 12 32,833 2,358,000 2,358 -
19,202
Annual Report 2010 271
[ Annexure 'A' as referred to in note 9.8 of Group'sConsolidated Financial Statements For the year ended December 31, 2010 ]
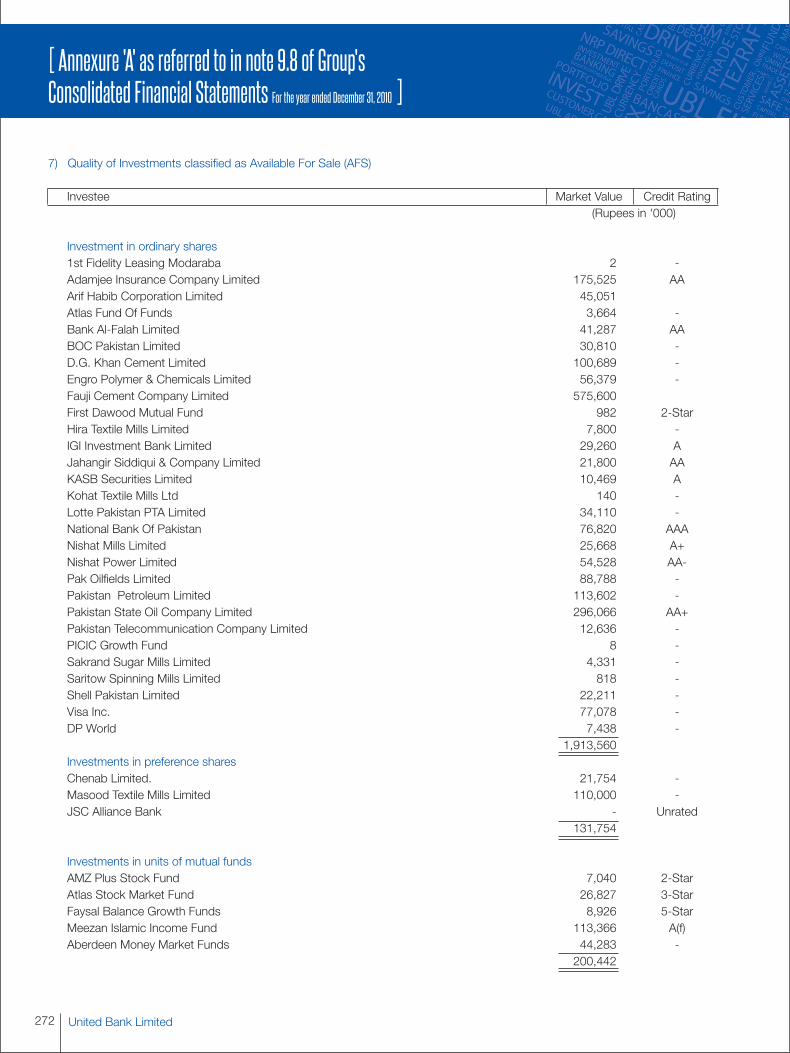
7) Quality of Investments classified as Available For Sale (AFS)
Investee Market Value Credit Rating(Rupees in '000)
Investment in ordinary shares1st Fidelity Leasing Modaraba 2 -Adamjee Insurance Company Limited 175,525 AAArif Habib Corporation Limited 45,051Atlas Fund Of Funds 3,664 -Bank Al-Falah Limited 41,287 AABOC Pakistan Limited 30,810 -D.G. Khan Cement Limited 100,689 -Engro Polymer & Chemicals Limited 56,379 -Fauji Cement Company Limited 575,600First Dawood Mutual Fund 982 2-StarHira Textile Mills Limited 7,800 -IGI Investment Bank Limited 29,260 AJahangir Siddiqui & Company Limited 21,800 AAKASB Securities Limited 10,469 AKohat Textile Mills Ltd 140 -Lotte Pakistan PTA Limited 34,110 -National Bank Of Pakistan 76,820 AAANishat Mills Limited 25,668 A+Nishat Power Limited 54,528 AA-Pak Oilfields Limited 88,788 -Pakistan Petroleum Limited 113,602 -Pakistan State Oil Company Limited 296,066 AA+Pakistan Telecommunication Company Limited 12,636 -PICIC Growth Fund 8 -Sakrand Sugar Mills Limited 4,331 -Saritow Spinning Mills Limited 818 -Shell Pakistan Limited 22,211 -Visa Inc. 77,078 -DP World 7,438 -
1,913,560Investments in preference sharesChenab Limited. 21,754 -Masood Textile Mills Limited 110,000 -JSC Alliance Bank - Unrated
131,754
Investments in units of mutual fundsAMZ Plus Stock Fund 7,040 2-StarAtlas Stock Market Fund 26,827 3-StarFaysal Balance Growth Funds 8,926 5-StarMeezan Islamic Income Fund 113,366 A(f)Aberdeen Money Market Funds 44,283 -
200,442
272 United Bank Limited
[ Annexure 'A' as referred to in note 9.8 of Group'sConsolidated Financial Statements For the year ended December 31, 2010 ]
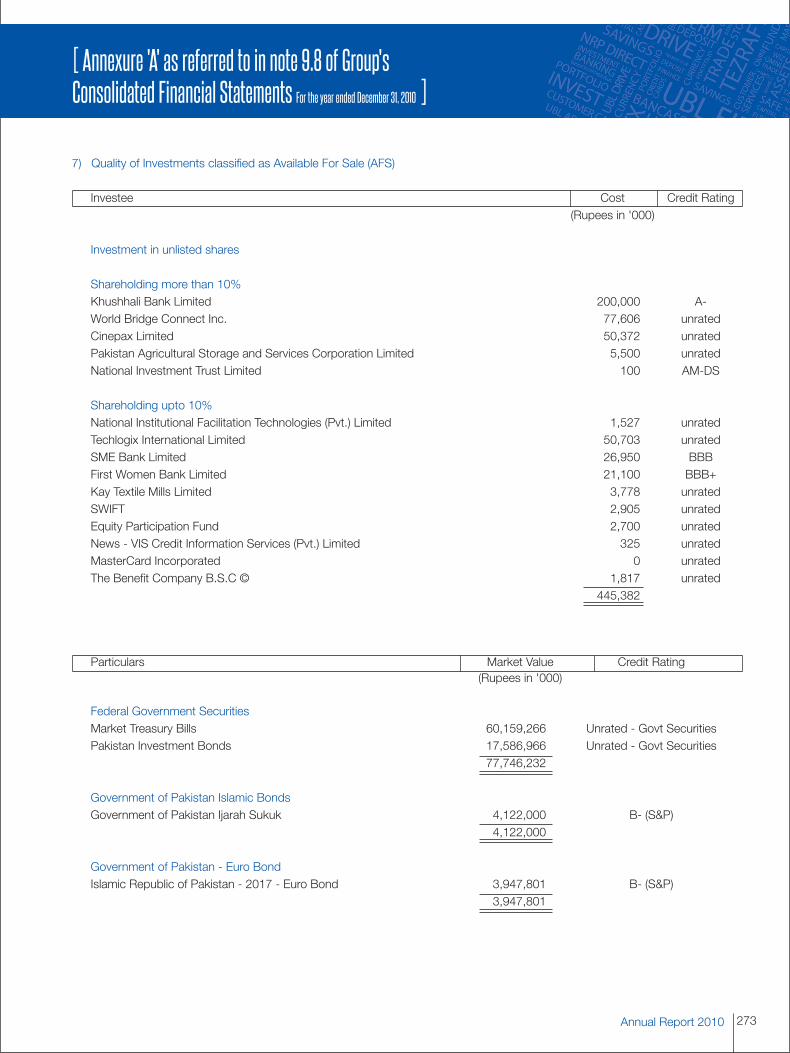
7) Quality of Investments classified as Available For Sale (AFS)
Investee Cost Credit Rating(Rupees in '000)
Investment in unlisted shares
Shareholding more than 10%Khushhali Bank Limited 200,000 A-World Bridge Connect Inc. 77,606 unratedCinepax Limited 50,372 unratedPakistan Agricultural Storage and Services Corporation Limited 5,500 unratedNational Investment Trust Limited 100 AM-DS
Shareholding upto 10%National Institutional Facilitation Technologies (Pvt.) Limited 1,527 unratedTechlogix International Limited 50,703 unratedSME Bank Limited 26,950 BBBFirst Women Bank Limited 21,100 BBB+Kay Textile Mills Limited 3,778 unratedSWIFT 2,905 unratedEquity Participation Fund 2,700 unratedNews - VIS Credit Information Services (Pvt.) Limited 325 unratedMasterCard Incorporated 0 unratedThe Benefit Company B.S.C © 1,817 unrated
445,382
Particulars Market Value Credit Rating(Rupees in '000)
Federal Government SecuritiesMarket Treasury Bills 60,159,266 Unrated - Govt SecuritiesPakistan Investment Bonds 17,586,966 Unrated - Govt Securities
77,746,232
Government of Pakistan Islamic BondsGovernment of Pakistan Ijarah Sukuk 4,122,000 B- (S&P)
4,122,000
Government of Pakistan - Euro BondIslamic Republic of Pakistan - 2017 - Euro Bond 3,947,801 B- (S&P)
3,947,801
Annual Report 2010 273
[ Annexure 'A' as referred to in note 9.8 of Group'sConsolidated Financial Statements For the year ended December 31, 2010 ]
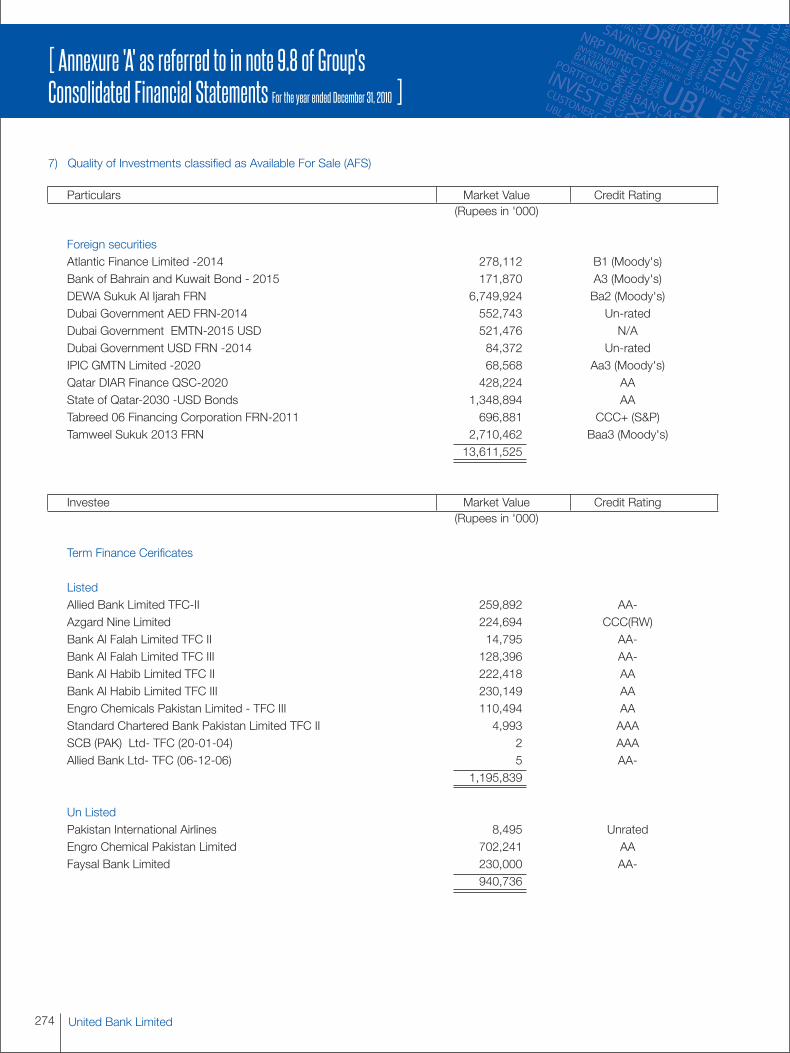
7) Quality of Investments classified as Available For Sale (AFS)
Particulars Market Value Credit Rating(Rupees in '000)
Foreign securitiesAtlantic Finance Limited -2014 278,112 B1 (Moody's)Bank of Bahrain and Kuwait Bond - 2015 171,870 A3 (Moody's)DEWA Sukuk Al Ijarah FRN 6,749,924 Ba2 (Moody's)Dubai Government AED FRN-2014 552,743 Un-ratedDubai Government EMTN-2015 USD 521,476 N/ADubai Government USD FRN -2014 84,372 Un-ratedIPIC GMTN Limited -2020 68,568 Aa3 (Moody's)Qatar DIAR Finance QSC-2020 428,224 AAState of Qatar-2030 -USD Bonds 1,348,894 AATabreed 06 Financing Corporation FRN-2011 696,881 CCC+ (S&P)Tamweel Sukuk 2013 FRN 2,710,462 Baa3 (Moody's)
13,611,525
Investee Market Value Credit Rating(Rupees in '000)
Term Finance Cerificates
ListedAllied Bank Limited TFC-II 259,892 AA-Azgard Nine Limited 224,694 CCC(RW)Bank Al Falah Limited TFC II 14,795 AA-Bank Al Falah Limited TFC III 128,396 AA-Bank Al Habib Limited TFC II 222,418 AABank Al Habib Limited TFC III 230,149 AAEngro Chemicals Pakistan Limited - TFC III 110,494 AAStandard Chartered Bank Pakistan Limited TFC II 4,993 AAASCB (PAK) Ltd- TFC (20-01-04) 2 AAAAllied Bank Ltd- TFC (06-12-06) 5 AA-
1,195,839
Un ListedPakistan International Airlines 8,495 UnratedEngro Chemical Pakistan Limited 702,241 AAFaysal Bank Limited 230,000 AA-
940,736
274 United Bank Limited
[ Annexure 'A' as referred to in note 9.8 of Group'sConsolidated Financial Statements For the year ended December 31, 2010 ]
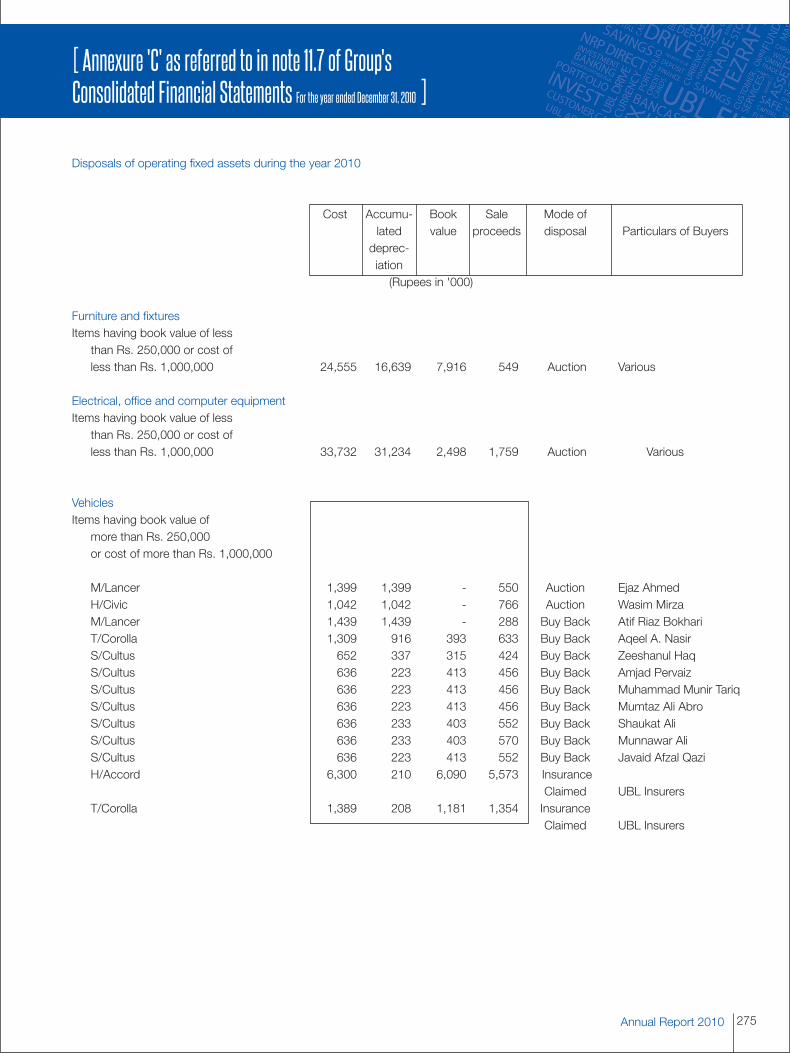
Disposals of operating fixed assets during the year 2010
Cost Accumu- Book Sale Mode oflated value proceeds disposal Particulars of Buyersdeprec-iation(Rupees in '000)
Furniture and fixturesItems having book value of less
than Rs. 250,000 or cost ofless than Rs. 1,000,000 24,555 16,639 7,916 549 Auction Various
Electrical, office and computer equipmentItems having book value of less
than Rs. 250,000 or cost ofless than Rs. 1,000,000 33,732 31,234 2,498 1,759 Auction Various
VehiclesItems having book value of
more than Rs. 250,000or cost of more than Rs. 1,000,000
M/Lancer 1,399 1,399 - 550 Auction Ejaz AhmedH/Civic 1,042 1,042 - 766 Auction Wasim MirzaM/Lancer 1,439 1,439 - 288 Buy Back Atif Riaz BokhariT/Corolla 1,309 916 393 633 Buy Back Aqeel A. NasirS/Cultus 652 337 315 424 Buy Back Zeeshanul HaqS/Cultus 636 223 413 456 Buy Back Amjad PervaizS/Cultus 636 223 413 456 Buy Back Muhammad Munir TariqS/Cultus 636 223 413 456 Buy Back Mumtaz Ali AbroS/Cultus 636 233 403 552 Buy Back Shaukat AliS/Cultus 636 233 403 570 Buy Back Munnawar AliS/Cultus 636 223 413 552 Buy Back Javaid Afzal QaziH/Accord 6,300 210 6,090 5,573 Insurance
Claimed UBL InsurersT/Corolla 1,389 208 1,181 1,354 Insurance
Claimed UBL Insurers
Annual Report 2010 275
[ Annexure 'C' as referred to in note 11.7 of Group'sConsolidated Financial Statements For the year ended December 31, 2010 ]
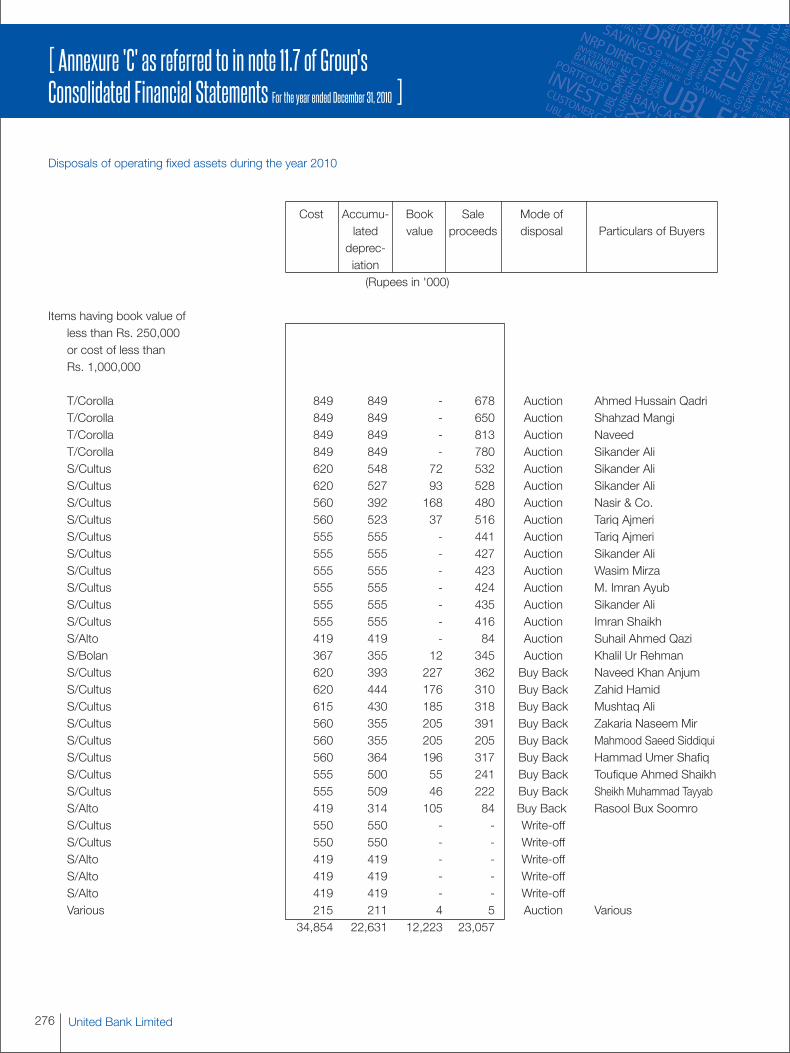
Disposals of operating fixed assets during the year 2010
Cost Accumu- Book Sale Mode oflated value proceeds disposal Particulars of Buyersdeprec-iation(Rupees in '000)
Items having book value ofless than Rs. 250,000or cost of less thanRs. 1,000,000
T/Corolla 849 849 - 678 Auction Ahmed Hussain QadriT/Corolla 849 849 - 650 Auction Shahzad MangiT/Corolla 849 849 - 813 Auction NaveedT/Corolla 849 849 - 780 Auction Sikander AliS/Cultus 620 548 72 532 Auction Sikander AliS/Cultus 620 527 93 528 Auction Sikander AliS/Cultus 560 392 168 480 Auction Nasir & Co.S/Cultus 560 523 37 516 Auction Tariq AjmeriS/Cultus 555 555 - 441 Auction Tariq AjmeriS/Cultus 555 555 - 427 Auction Sikander AliS/Cultus 555 555 - 423 Auction Wasim MirzaS/Cultus 555 555 - 424 Auction M. Imran AyubS/Cultus 555 555 - 435 Auction Sikander AliS/Cultus 555 555 - 416 Auction Imran ShaikhS/Alto 419 419 - 84 Auction Suhail Ahmed QaziS/Bolan 367 355 12 345 Auction Khalil Ur RehmanS/Cultus 620 393 227 362 Buy Back Naveed Khan AnjumS/Cultus 620 444 176 310 Buy Back Zahid HamidS/Cultus 615 430 185 318 Buy Back Mushtaq AliS/Cultus 560 355 205 391 Buy Back Zakaria Naseem MirS/Cultus 560 355 205 205 Buy Back Mahmood Saeed SiddiquiS/Cultus 560 364 196 317 Buy Back Hammad Umer ShafiqS/Cultus 555 500 55 241 Buy Back Toufique Ahmed ShaikhS/Cultus 555 509 46 222 Buy Back Sheikh Muhammad TayyabS/Alto 419 314 105 84 Buy Back Rasool Bux SoomroS/Cultus 550 550 - - Write-offS/Cultus 550 550 - - Write-offS/Alto 419 419 - - Write-offS/Alto 419 419 - - Write-offS/Alto 419 419 - - Write-offVarious 215 211 4 5 Auction Various
34,854 22,631 12,223 23,057
276 United Bank Limited
[ Annexure 'C' as referred to in note 11.7 of Group'sConsolidated Financial Statements For the year ended December 31, 2010 ]

Disposals of operating fixed assets during the year 2010
Cost Accumu- Book Sale Mode oflated value proceeds disposal Particulars of Buyersdeprec-iation(Rupees in '000)
Ijarah AssetsItems having book value of
more than Rs. 250,000or cost of more thanRs. 1,000,000
Commercial Ijarah - Atlas Honda Limited 3,325 210 3,115 3,139 Buy Back Atlas Honda LimitedH/Civic 1,564 462 1,102 917 Buy Back M.Kamran SabowalaT/Corolla 1,389 230 1,159 1,050 Buy Back Riaz HussainT\Altis 1,319 402 917 598 Buy Back Mahinder KumarT/Corolla 1,286 366 920 886 Buy Back Muhammad Shoaib KhanzadaT/Corolla 1,240 426 814 898 Buy Back Abdullah ShaikhT/Corolla 1,237 412 825 322 Buy Back Muhammad Aslam ParachaT/Corolla 1,225 471 754 278 Buy Back Khader KheilH/City 1,215 408 807 793 Buy Back Sarfaraz KhanT/Corolla 1,205 422 783 616 Buy Back Arshad HussainT/Corolla 1,205 299 906 987 Buy Back Maheen AfaqT/Corolla 1,204 301 903 774 Buy Back Ghulam HussainT/Corolla 980 391 589 426 Buy Back Dahar JunejoT/Corolla 980 564 416 256 Buy Back Mohammad Ayoob JamaliS/Liana 955 456 499 551 Buy Back Muhammad Junaid GhaffarT/Corolla 950 487 463 660 Buy Back Muhammad IrfanS/Cultus 940 308 632 442 Buy Back Talat MehmoodT/Corolla 940 486 454 620 Buy Back Mohammad Hamid Ali KhanT/Corolla 940 528 412 255 Buy Back Sharmeen ZindaniT/Corolla 925 435 490 559 Buy Back Yaar GulT/Corolla 915 511 404 492 Buy Back Muhammad KousarS/Liana 907 434 473 534 Buy Back Manohar Lal WadhwaniH/City 907 484 423 461 Buy Back Tarana ZafarT/Belta 900 460 440 241 Buy Back Muhammad NaeemT/Corolla 890 319 571 502 Buy Back Waheed Ahmed ShaikhT/Corolla 890 526 364 476 Buy Back Mohammad Asmat ParachaH/City 879 343 536 559 Buy Back Aasima KhanS/Liana 856 540 316 355 Buy Back Mohammad RehanH/City 852 235 617 674 Buy Back Syed Muhammad
Hasan QutbH/City 846 451 395 493 Buy Back Mohammad Asim SaleemS/Liana 825 406 419 490 Buy Back Farooq Ahmed SiddiquiT/Vitz 811 560 251 151 Buy Back Saqib Khan
Annual Report 2010 277
[ Annexure 'C' as referred to in note 11.7 of Group'sConsolidated Financial Statements For the year ended December 31, 2010 ]
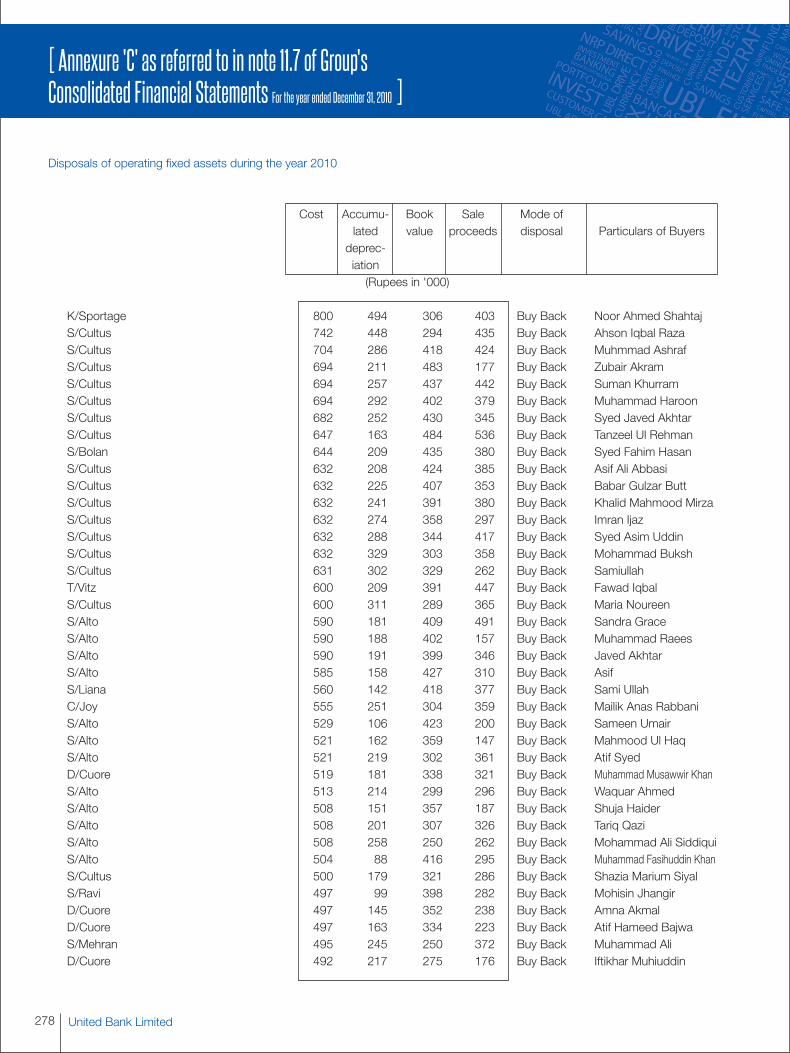
Disposals of operating fixed assets during the year 2010
Cost Accumu- Book Sale Mode oflated value proceeds disposal Particulars of Buyersdeprec-iation(Rupees in '000)
K/Sportage 800 494 306 403 Buy Back Noor Ahmed ShahtajS/Cultus 742 448 294 435 Buy Back Ahson Iqbal RazaS/Cultus 704 286 418 424 Buy Back Muhmmad AshrafS/Cultus 694 211 483 177 Buy Back Zubair AkramS/Cultus 694 257 437 442 Buy Back Suman KhurramS/Cultus 694 292 402 379 Buy Back Muhammad HaroonS/Cultus 682 252 430 345 Buy Back Syed Javed AkhtarS/Cultus 647 163 484 536 Buy Back Tanzeel Ul RehmanS/Bolan 644 209 435 380 Buy Back Syed Fahim HasanS/Cultus 632 208 424 385 Buy Back Asif Ali AbbasiS/Cultus 632 225 407 353 Buy Back Babar Gulzar ButtS/Cultus 632 241 391 380 Buy Back Khalid Mahmood MirzaS/Cultus 632 274 358 297 Buy Back Imran IjazS/Cultus 632 288 344 417 Buy Back Syed Asim UddinS/Cultus 632 329 303 358 Buy Back Mohammad BukshS/Cultus 631 302 329 262 Buy Back SamiullahT/Vitz 600 209 391 447 Buy Back Fawad IqbalS/Cultus 600 311 289 365 Buy Back Maria NoureenS/Alto 590 181 409 491 Buy Back Sandra GraceS/Alto 590 188 402 157 Buy Back Muhammad RaeesS/Alto 590 191 399 346 Buy Back Javed AkhtarS/Alto 585 158 427 310 Buy Back AsifS/Liana 560 142 418 377 Buy Back Sami UllahC/Joy 555 251 304 359 Buy Back Mailik Anas RabbaniS/Alto 529 106 423 200 Buy Back Sameen UmairS/Alto 521 162 359 147 Buy Back Mahmood Ul HaqS/Alto 521 219 302 361 Buy Back Atif SyedD/Cuore 519 181 338 321 Buy Back Muhammad Musawwir KhanS/Alto 513 214 299 296 Buy Back Waquar AhmedS/Alto 508 151 357 187 Buy Back Shuja HaiderS/Alto 508 201 307 326 Buy Back Tariq QaziS/Alto 508 258 250 262 Buy Back Mohammad Ali SiddiquiS/Alto 504 88 416 295 Buy Back Muhammad Fasihuddin KhanS/Cultus 500 179 321 286 Buy Back Shazia Marium SiyalS/Ravi 497 99 398 282 Buy Back Mohisin JhangirD/Cuore 497 145 352 238 Buy Back Amna AkmalD/Cuore 497 163 334 223 Buy Back Atif Hameed BajwaS/Mehran 495 245 250 372 Buy Back Muhammad AliD/Cuore 492 217 275 176 Buy Back Iftikhar Muhiuddin
278 United Bank Limited
[ Annexure 'C' as referred to in note 11.7 of Group'sConsolidated Financial Statements For the year ended December 31, 2010 ]
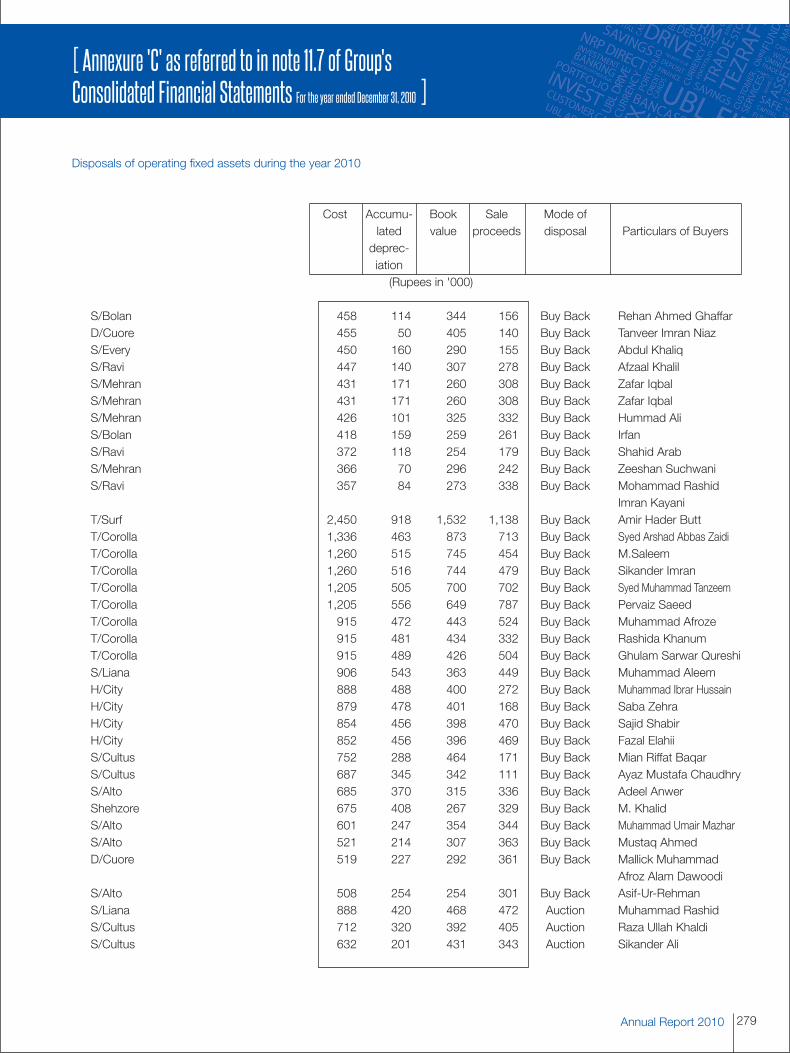
Disposals of operating fixed assets during the year 2010
Cost Accumu- Book Sale Mode oflated value proceeds disposal Particulars of Buyersdeprec-iation(Rupees in '000)
S/Bolan 458 114 344 156 Buy Back Rehan Ahmed GhaffarD/Cuore 455 50 405 140 Buy Back Tanveer Imran NiazS/Every 450 160 290 155 Buy Back Abdul KhaliqS/Ravi 447 140 307 278 Buy Back Afzaal KhalilS/Mehran 431 171 260 308 Buy Back Zafar IqbalS/Mehran 431 171 260 308 Buy Back Zafar IqbalS/Mehran 426 101 325 332 Buy Back Hummad AliS/Bolan 418 159 259 261 Buy Back IrfanS/Ravi 372 118 254 179 Buy Back Shahid ArabS/Mehran 366 70 296 242 Buy Back Zeeshan SuchwaniS/Ravi 357 84 273 338 Buy Back Mohammad Rashid
Imran KayaniT/Surf 2,450 918 1,532 1,138 Buy Back Amir Hader ButtT/Corolla 1,336 463 873 713 Buy Back Syed Arshad Abbas ZaidiT/Corolla 1,260 515 745 454 Buy Back M.SaleemT/Corolla 1,260 516 744 479 Buy Back Sikander ImranT/Corolla 1,205 505 700 702 Buy Back Syed Muhammad TanzeemT/Corolla 1,205 556 649 787 Buy Back Pervaiz SaeedT/Corolla 915 472 443 524 Buy Back Muhammad AfrozeT/Corolla 915 481 434 332 Buy Back Rashida KhanumT/Corolla 915 489 426 504 Buy Back Ghulam Sarwar QureshiS/Liana 906 543 363 449 Buy Back Muhammad AleemH/City 888 488 400 272 Buy Back Muhammad Ibrar HussainH/City 879 478 401 168 Buy Back Saba ZehraH/City 854 456 398 470 Buy Back Sajid ShabirH/City 852 456 396 469 Buy Back Fazal ElahiiS/Cultus 752 288 464 171 Buy Back Mian Riffat BaqarS/Cultus 687 345 342 111 Buy Back Ayaz Mustafa ChaudhryS/Alto 685 370 315 336 Buy Back Adeel AnwerShehzore 675 408 267 329 Buy Back M. KhalidS/Alto 601 247 354 344 Buy Back Muhammad Umair MazharS/Alto 521 214 307 363 Buy Back Mustaq AhmedD/Cuore 519 227 292 361 Buy Back Mallick Muhammad
Afroz Alam DawoodiS/Alto 508 254 254 301 Buy Back Asif-Ur-RehmanS/Liana 888 420 468 472 Auction Muhammad RashidS/Cultus 712 320 392 405 Auction Raza Ullah KhaldiS/Cultus 632 201 431 343 Auction Sikander Ali
Annual Report 2010 279
[ Annexure 'C' as referred to in note 11.7 of Group'sConsolidated Financial Statements For the year ended December 31, 2010 ]

Disposals of operating fixed assets during the year 2010
Cost Accumu- Book Sale Mode oflated value proceeds disposal Particulars of Buyersdeprec-iation(Rupees in '000)
S/Alto 590 241 349 349 Auction Munaweer HussainS/Alto 542 158 384 460 Auction Muhammad Atif BhattiS/Bolan 520 125 395 457 Auction Muhammad RashidT/Corolla 950 261 689 694 Insurance Pak Qattar
Claimed TakafulT/Corolla 829 415 414 345 Insurance Pak Qattar
Claimed TakafulD/Cuore 587 95 492 360 Insurance Pak Kwait
Claimed TakafulD/Cuore 502 247 255 351 Insurance Pak Qattar
Claimed TakafulD/Cuore 497 214 283 375 Insurance Pak Qattar
Claimed TakafulS/Mehran 409 115 294 115 Insurance Pak Kwait
Claimed Takaful
Items having book value ofless than Rs. 250,000or cost of less thanRs. 1,000,000
T/Corolla 879 769 110 191 Buy Back Masood TextileT/Vitz 750 549 201 507 Buy Back Abid Hussain
S/Cultus 730 524 206 113 Buy Back Syed Asim Zafar ZaidiS/Cultus 704 504 200 492 Buy Back Imtiaz AhmedT/Corolla 704 515 189 372 Buy Back Imran Ul HafeezT/Corolla 704 515 189 472 Buy Back Imran Ul HafeezShehzore 699 477 222 307 Buy Back Syed Farooq Ali ShahS/Cultus 694 449 245 308 Buy Back Muhammad Saeed JamsaS/Cultus 682 469 213 315 Buy Back Mohammad Aslam SabriS/Liana 660 476 184 295 Buy Back Muhammad FaisalS/Cultus 632 476 156 184 Buy Back Muhammad Zeeshan AliS/Cultus 600 399 201 252 Buy Back Mohammad YousufS/Cultus 600 474 126 224 Buy Back Ramesh BabuS/Cultus 595 521 74 130 Buy Back Masood TextileS/Alto 590 403 187 415 Buy Back Muhammad Rizwan
Afzal KhanS/Alto 529 283 246 291 Buy Back Mohammad Islam
280 United Bank Limited
[ Annexure 'C' as referred to in note 11.7 of Group'sConsolidated Financial Statements For the year ended December 31, 2010 ]
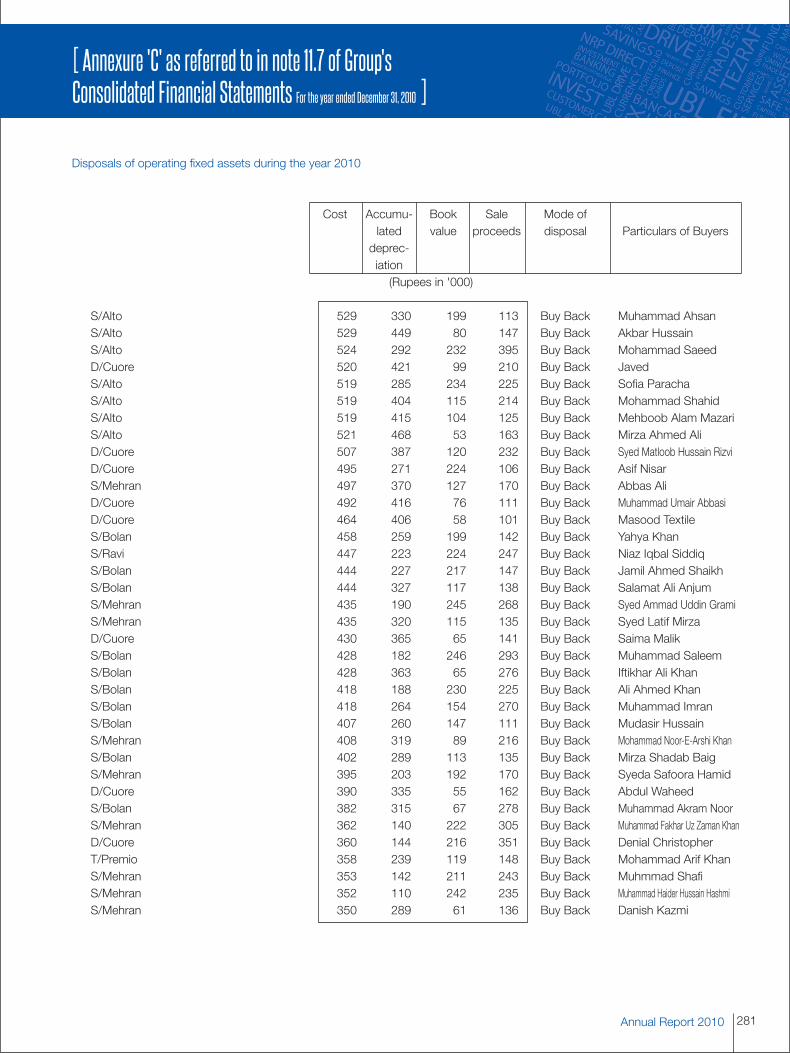
Disposals of operating fixed assets during the year 2010
Cost Accumu- Book Sale Mode oflated value proceeds disposal Particulars of Buyersdeprec-iation(Rupees in '000)
S/Alto 529 330 199 113 Buy Back Muhammad AhsanS/Alto 529 449 80 147 Buy Back Akbar HussainS/Alto 524 292 232 395 Buy Back Mohammad SaeedD/Cuore 520 421 99 210 Buy Back JavedS/Alto 519 285 234 225 Buy Back Sofia ParachaS/Alto 519 404 115 214 Buy Back Mohammad ShahidS/Alto 519 415 104 125 Buy Back Mehboob Alam MazariS/Alto 521 468 53 163 Buy Back Mirza Ahmed AliD/Cuore 507 387 120 232 Buy Back Syed Matloob Hussain RizviD/Cuore 495 271 224 106 Buy Back Asif NisarS/Mehran 497 370 127 170 Buy Back Abbas AliD/Cuore 492 416 76 111 Buy Back Muhammad Umair AbbasiD/Cuore 464 406 58 101 Buy Back Masood TextileS/Bolan 458 259 199 142 Buy Back Yahya KhanS/Ravi 447 223 224 247 Buy Back Niaz Iqbal SiddiqS/Bolan 444 227 217 147 Buy Back Jamil Ahmed ShaikhS/Bolan 444 327 117 138 Buy Back Salamat Ali AnjumS/Mehran 435 190 245 268 Buy Back Syed Ammad Uddin GramiS/Mehran 435 320 115 135 Buy Back Syed Latif MirzaD/Cuore 430 365 65 141 Buy Back Saima MalikS/Bolan 428 182 246 293 Buy Back Muhammad SaleemS/Bolan 428 363 65 276 Buy Back Iftikhar Ali KhanS/Bolan 418 188 230 225 Buy Back Ali Ahmed KhanS/Bolan 418 264 154 270 Buy Back Muhammad ImranS/Bolan 407 260 147 111 Buy Back Mudasir HussainS/Mehran 408 319 89 216 Buy Back Mohammad Noor-E-Arshi KhanS/Bolan 402 289 113 135 Buy Back Mirza Shadab BaigS/Mehran 395 203 192 170 Buy Back Syeda Safoora HamidD/Cuore 390 335 55 162 Buy Back Abdul WaheedS/Bolan 382 315 67 278 Buy Back Muhammad Akram NoorS/Mehran 362 140 222 305 Buy Back Muhammad Fakhar Uz Zaman KhanD/Cuore 360 144 216 351 Buy Back Denial ChristopherT/Premio 358 239 119 148 Buy Back Mohammad Arif KhanS/Mehran 353 142 211 243 Buy Back Muhmmad ShafiS/Mehran 352 110 242 235 Buy Back Muhammad Haider Hussain HashmiS/Mehran 350 289 61 136 Buy Back Danish Kazmi
Annual Report 2010 281
[ Annexure 'C' as referred to in note 11.7 of Group'sConsolidated Financial Statements For the year ended December 31, 2010 ]

Disposals of operating fixed assets during the year 2010
Cost Accumu- Book Sale Mode oflated value proceeds disposal Particulars of Buyersdeprec-iation(Rupees in '000)
T/Corolla 750 510 240 223 Buy Back Talha AnwarS/Cultus 632 500 132 226 Buy Back Qasim MansoorS/Alto 632 431 201 246 Buy Back Shahzad Ahmed KhanS/Cultus 632 496 136 295 Buy Back Muhammad Suleman AnsariS/Cultus 617 456 161 190 Buy Back Muhammad Ayaz Imam RizviS/Bolan 526 383 143 249 Buy Back Muhammad Zubair KhanT/Corolla 522 468 54 288 Buy Back Yasir YousafT/Corolla 522 468 54 277 Buy Back Yasir YousafS/Alto 508 278 230 272 Buy Back Wasim RazaS/Alto 508 466 42 150 Buy Back Mumtaz AhmedS/Alto 504 422 82 373 Buy Back Saima AnjumS/Alto 504 422 82 273 Buy Back Saima AnjumD/Cuore 487 238 249 233 Buy Back AminaS/Bolan 483 272 211 131 Buy Back Liaquat Ali AbbasiD/Cuore 456 343 113 135 Buy Back Hammad HaiderS/Ravi 447 222 225 248 Buy Back Nadeem-Ul-Haq NajmiS/Ravi 447 222 225 248 Buy Back Nadeem-Ul-Haq NajmiS/Ravi 447 290 157 282 Buy Back Naeem-Ur-Rehman ShaikhS/Ravi 447 290 157 262 Buy Back Naeem-Ur-Rehman ShaikhS/Alto 425 316 109 138 Buy Back Asif AliS/Bolan 414 233 181 213 Buy Back Syed Arshad IqbalS/Bolan 408 371 37 170 Buy Back Shabbir Ahmed MemonS/Ravi 402 305 97 160 Buy Back Riyasat Hussain TahirS/Mehran 398 321 77 257 Buy Back Shahab SharifS/Ravi 397 349 48 131 Buy Back Jalil-Ur-Rehman ShaikhS/Ravi 397 349 48 231 Buy Back Jalil-Ur-Rehman ShaikhS/Bolan 370 219 151 186 Buy Back Syed Ghazanfar AhmedD/Cuore 497 275 222 326 Auction Muhammad FurrakhD/Cuore 519 404 115 255 Insurance Pak Qattar
Claimed TakafulS/Bolan 515 416 99 213 Insurance Pak Kwait
Claimed Takaful133,066 65,055 68,011 69,285
282 United Bank Limited
[ Annexure 'C' as referred to in note 11.7 of Group'sConsolidated Financial Statements For the year ended December 31, 2010 ]
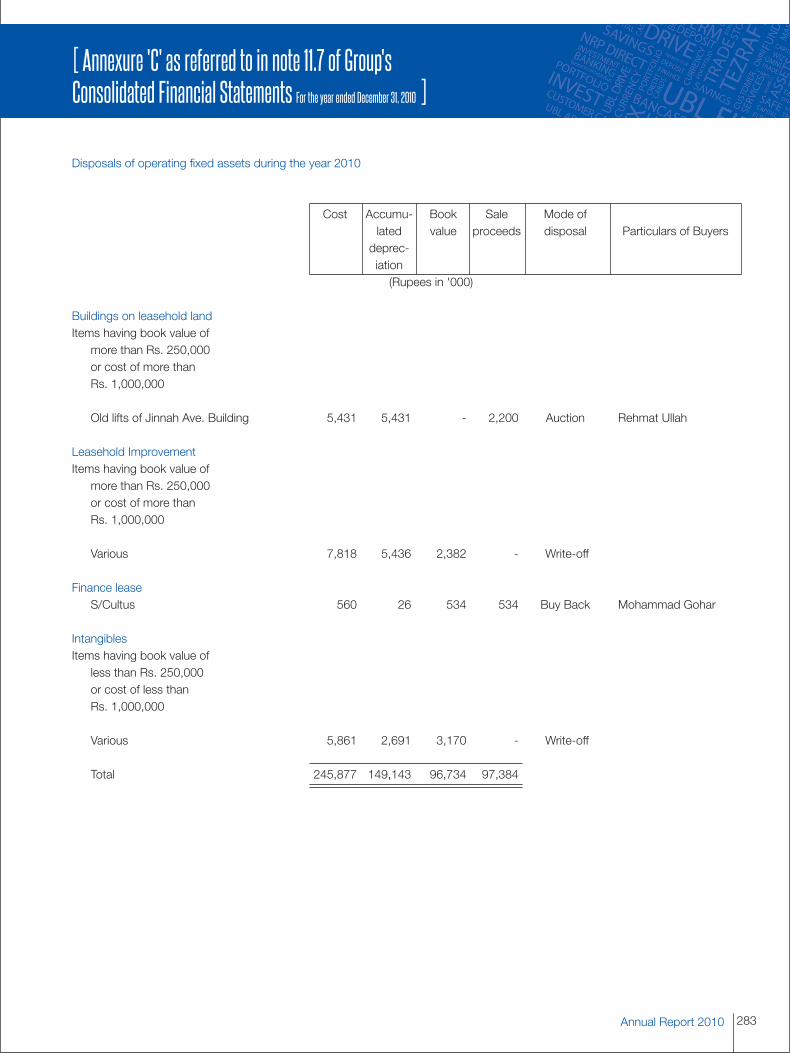
Disposals of operating fixed assets during the year 2010
Cost Accumu- Book Sale Mode oflated value proceeds disposal Particulars of Buyersdeprec-iation(Rupees in '000)
Buildings on leasehold landItems having book value of
more than Rs. 250,000or cost of more thanRs. 1,000,000
Old lifts of Jinnah Ave. Building 5,431 5,431 - 2,200 Auction Rehmat Ullah
Leasehold ImprovementItems having book value of
more than Rs. 250,000or cost of more thanRs. 1,000,000
Various 7,818 5,436 2,382 - Write-off
Finance leaseS/Cultus 560 26 534 534 Buy Back Mohammad Gohar
IntangiblesItems having book value of
less than Rs. 250,000or cost of less thanRs. 1,000,000
Various 5,861 2,691 3,170 - Write-off
Total 245,877 149,143 96,734 97,384
Annual Report 2010 283
[ Annexure 'C' as referred to in note 11.7 of Group'sConsolidated Financial Statements For the year ended December 31, 2010 ]
Guidelines for mapping of Business Lines
Segment Reporting
A segment is a distinguishable component of the Group that is engaged either in providing particular products or services (businesssegment), or in providing products or services within a particular economic environment (geographical segment), which is subject torisks and rewards that are different from those of other segments.
Business segments
(a) Corporate finance
Corporate banking includes services provided in connection with mergers and acquisition, underwriting, privatization,securitization, research, debts instruments, equity, syndication, IPO and secondary private placements.
(b) Trading and sales
Trading and sales includes fixed income, equity, foreign exchange, commodities, credit, funding, own position securities,lending and repos, brokerage debt and prime brokerage.
(c) Retail Banking
Retail banking includes retail lending and deposits, banking services, trusts and estates, private lending and deposits,investment advice, merchant / commercial / corporate cards.
(d) Commercial banking
Commercial banking includes project finance, real estate, export finance, trade finance, factoring, leasing, lending, guarantees,bills of exchange and deposits.
(e) Asset management
It includes discretionary and non discretionary fund management activities in the form of pooled, segregated, retail, institutional,private equity, open, close ended funds etc
(f) Others
It includes results of support functions of the Group and subsidiary which cannot be classified in any of the above segments.
284 United Bank Limited
[ Annexure 'D' of Group's ConsolidatedFinancial Statements For the year ended December 31, 2010 ]
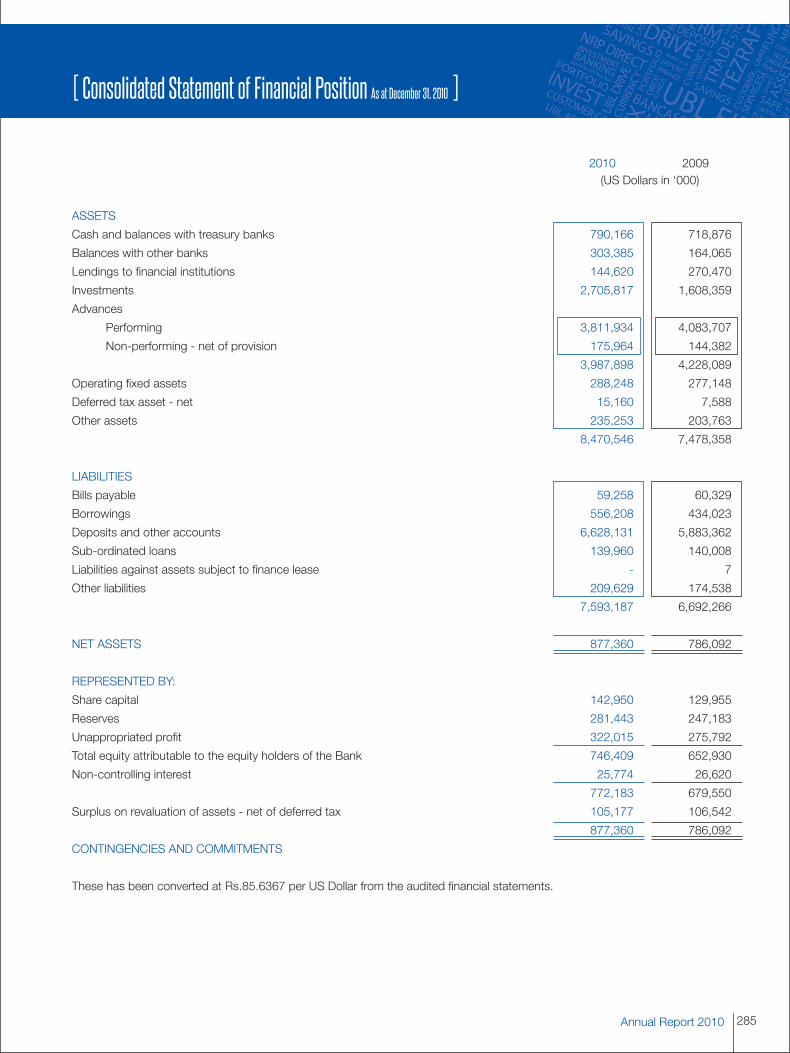
2010 2009(US Dollars in ‘000)
ASSETS
Cash and balances with treasury banks 790,166 718,876
Balances with other banks 303,385 164,065
Lendings to financial institutions 144,620 270,470
Investments 2,705,817 1,608,359
Advances
Performing 3,811,934 4,083,707
Non-performing - net of provision 175,964 144,382
3,987,898 4,228,089
Operating fixed assets 288,248 277,148
Deferred tax asset - net 15,160 7,588
Other assets 235,253 203,763
8,470,546 7,478,358
LIABILITIES
Bills payable 59,258 60,329
Borrowings 556,208 434,023
Deposits and other accounts 6,628,131 5,883,362
Sub-ordinated loans 139,960 140,008
Liabilities against assets subject to finance lease - 7
Other liabilities 209,629 174,538
7,593,187 6,692,266
NET ASSETS 877,360 786,092
REPRESENTED BY:
Share capital 142,950 129,955
Reserves 281,443 247,183
Unappropriated profit 322,015 275,792
Total equity attributable to the equity holders of the Bank 746,409 652,930
Non-controlling interest 25,774 26,620
772,183 679,550
Surplus on revaluation of assets - net of deferred tax 105,177 106,542
877,360 786,092
CONTINGENCIES AND COMMITMENTS
These has been converted at Rs.85.6367 per US Dollar from the audited financial statements.
Annual Report 2010 285
[ Consolidated Statement of Financial Position As at December 31, 2010 ]

2010 2009(US Dollars in ‘000)
Mark-up / return / interest earned 701,807 721,016Mark-up / return / interest expensed 296,997 330,738Net mark-up / interest income 404,810 390,279
Provision against loans and advances - net 79,853 112,626Provision against lending to financial institutions - 6,549Provision for diminution in value of investments - net 3,550 13,866Bad debts written off directly 11,769 17,352
95,172 150,394Net mark-up / return / interest income after provisions 309,637 239,885
Non Mark-up / Interest IncomeFee, commission and brokerage income 81,994 78,662Dividend income 1,564 2,507Income from dealing in foreign currencies 20,256 14,899Gain on sale of securities - net 2,197 8,166Unrealized loss on revaluation of investments classified as - -
held for trading (388) (30)Other income 18,330 36,746Total non mark-up / return / interest income 123,953 140,950
433,590 380,835
Non Mark-up / Interest ExpensesAdministrative expenses 221,829 207,894Other provisions / write offs - net 795 7,500Workers' Welfare Fund 4,844 4,683Other charges 2,807 754Total non mark-up / interest expenses 230,275 220,831Share of income of associates 3,239 8,057Profit before taxation 206,554 168,061Taxation - Current 79,999 81,697
- Prior years 4,850 919- Deferred (6,989) (25,348)
77,860 57,268Profit after taxation 128,694 110,793
Attributable to:Equity shareholders of the Bank 128,819 111,185Non-controlling interest (125) (392)
128,694 110,793
(US Dollars)
Earnings per share - basic and diluted 0.11 0.09
These has been converted at Rs.85.6367 per US Dollar from the audited financial statements.
286 United Bank Limited
[ Consolidated Profit and Loss Account For the year ended December 31, 2010 ]
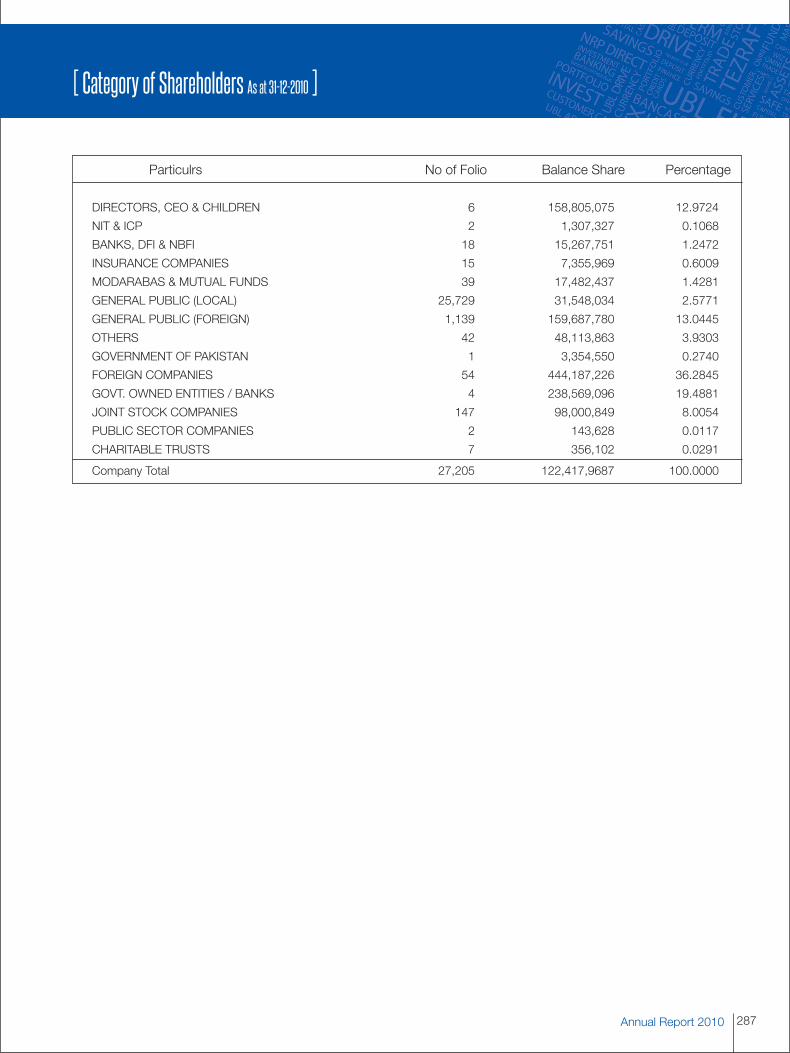
Annual Report 2010 287
[ Category of Shareholders As at 31-12-2010 ]
Particulrs No of Folio Balance Share Percentage
DIRECTORS, CEO & CHILDREN 6 158,805,075 12.9724
NIT & ICP 2 1,307,327 0.1068
BANKS, DFI & NBFI 18 15,267,751 1.2472
INSURANCE COMPANIES 15 7,355,969 0.6009
MODARABAS & MUTUAL FUNDS 39 17,482,437 1.4281
GENERAL PUBLIC (LOCAL) 25,729 31,548,034 2.5771
GENERAL PUBLIC (FOREIGN) 1,139 159,687,780 13.0445
OTHERS 42 48,113,863 3.9303
GOVERNMENT OF PAKISTAN 1 3,354,550 0.2740
FOREIGN COMPANIES 54 444,187,226 36.2845
GOVT. OWNED ENTITIES / BANKS 4 238,569,096 19.4881
JOINT STOCK COMPANIES 147 98,000,849 8.0054
PUBLIC SECTOR COMPANIES 2 143,628 0.0117
CHARITABLE TRUSTS 7 356,102 0.0291
Company Total 27,205 122,417,9687 100.0000
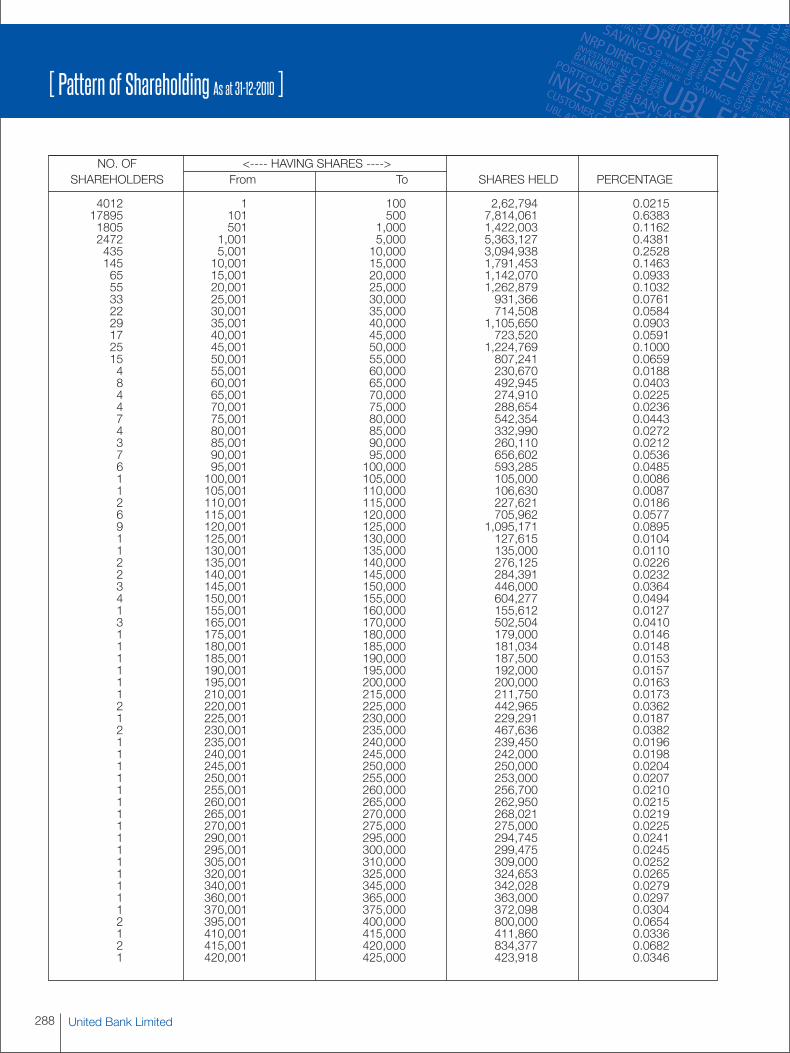
United Bank Limited288
[ Pattern of Shareholding As at 31-12-2010 ]
NO. OF <---- HAVING SHARES ---->SHAREHOLDERS From To SHARES HELD PERCENTAGE
4012 1 100 2,62,794 0.021517895 101 500 7,814,061 0.63831805 501 1,000 1,422,003 0.11622472 1,001 5,000 5,363,127 0.4381435 5,001 10,000 3,094,938 0.2528145 10,001 15,000 1,791,453 0.146365 15,001 20,000 1,142,070 0.093355 20,001 25,000 1,262,879 0.103233 25,001 30,000 931,366 0.076122 30,001 35,000 714,508 0.058429 35,001 40,000 1,105,650 0.090317 40,001 45,000 723,520 0.059125 45,001 50,000 1,224,769 0.100015 50,001 55,000 807,241 0.06594 55,001 60,000 230,670 0.01888 60,001 65,000 492,945 0.04034 65,001 70,000 274,910 0.02254 70,001 75,000 288,654 0.02367 75,001 80,000 542,354 0.04434 80,001 85,000 332,990 0.02723 85,001 90,000 260,110 0.02127 90,001 95,000 656,602 0.05366 95,001 100,000 593,285 0.04851 100,001 105,000 105,000 0.00861 105,001 110,000 106,630 0.00872 110,001 115,000 227,621 0.01866 115,001 120,000 705,962 0.05779 120,001 125,000 1,095,171 0.08951 125,001 130,000 127,615 0.01041 130,001 135,000 135,000 0.01102 135,001 140,000 276,125 0.02262 140,001 145,000 284,391 0.02323 145,001 150,000 446,000 0.03644 150,001 155,000 604,277 0.04941 155,001 160,000 155,612 0.01273 165,001 170,000 502,504 0.04101 175,001 180,000 179,000 0.01461 180,001 185,000 181,034 0.01481 185,001 190,000 187,500 0.01531 190,001 195,000 192,000 0.01571 195,001 200,000 200,000 0.01631 210,001 215,000 211,750 0.01732 220,001 225,000 442,965 0.03621 225,001 230,000 229,291 0.01872 230,001 235,000 467,636 0.03821 235,001 240,000 239,450 0.01961 240,001 245,000 242,000 0.01981 245,001 250,000 250,000 0.02041 250,001 255,000 253,000 0.02071 255,001 260,000 256,700 0.02101 260,001 265,000 262,950 0.02151 265,001 270,000 268,021 0.02191 270,001 275,000 275,000 0.02251 290,001 295,000 294,745 0.02411 295,001 300,000 299,475 0.02451 305,001 310,000 309,000 0.02521 320,001 325,000 324,653 0.02651 340,001 345,000 342,028 0.02791 360,001 365,000 363,000 0.02971 370,001 375,000 372,098 0.03042 395,001 400,000 800,000 0.06541 410,001 415,000 411,860 0.03362 415,001 420,000 834,377 0.06821 420,001 425,000 423,918 0.0346
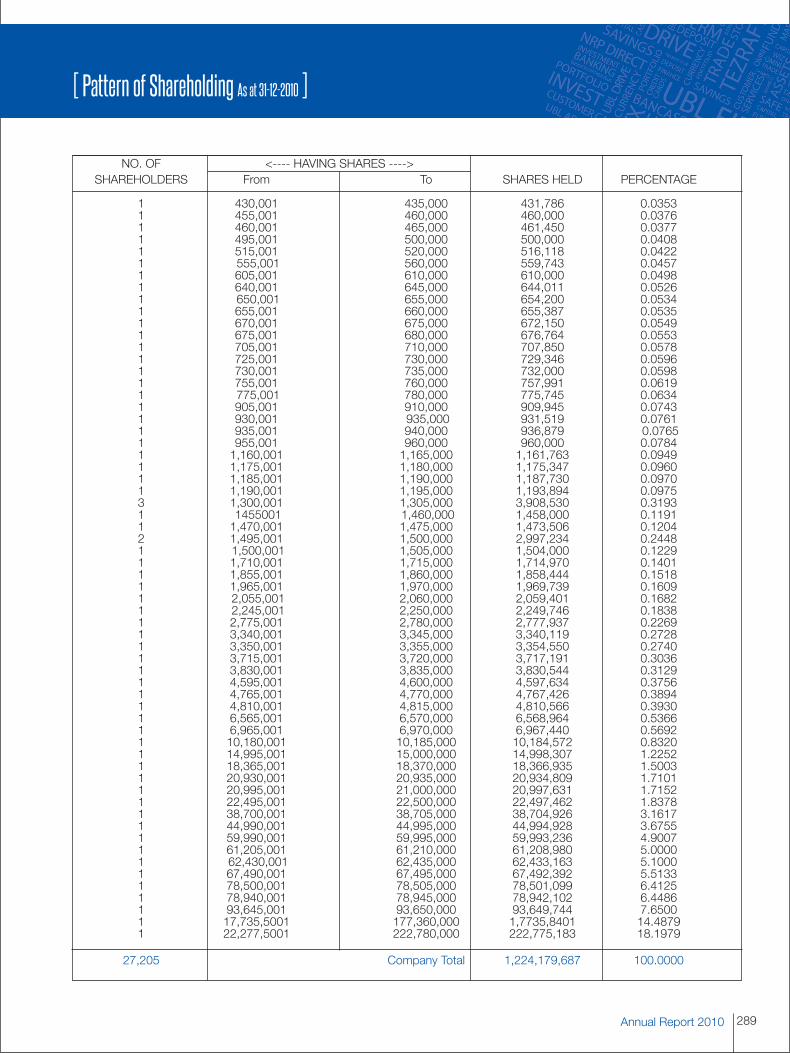
289Annual Report 2010
[ Pattern of Shareholding As at 31-12-2010 ]
NO. OF <---- HAVING SHARES ---->SHAREHOLDERS From To SHARES HELD PERCENTAGE
1 430,001 435,000 431,786 0.03531 455,001 460,000 460,000 0.03761 460,001 465,000 461,450 0.03771 495,001 500,000 500,000 0.04081 515,001 520,000 516,118 0.04221 555,001 560,000 559,743 0.04571 605,001 610,000 610,000 0.04981 640,001 645,000 644,011 0.05261 650,001 655,000 654,200 0.05341 655,001 660,000 655,387 0.05351 670,001 675,000 672,150 0.05491 675,001 680,000 676,764 0.05531 705,001 710,000 707,850 0.05781 725,001 730,000 729,346 0.05961 730,001 735,000 732,000 0.05981 755,001 760,000 757,991 0.06191 775,001 780,000 775,745 0.06341 905,001 910,000 909,945 0.07431 930,001 935,000 931,519 0.07611 935,001 940,000 936,879 0.07651 955,001 960,000 960,000 0.07841 1,160,001 1,165,000 1,161,763 0.09491 1,175,001 1,180,000 1,175,347 0.09601 1,185,001 1,190,000 1,187,730 0.09701 1,190,001 1,195,000 1,193,894 0.09753 1,300,001 1,305,000 3,908,530 0.31931 1455001 1,460,000 1,458,000 0.11911 1,470,001 1,475,000 1,473,506 0.12042 1,495,001 1,500,000 2,997,234 0.24481 1,500,001 1,505,000 1,504,000 0.12291 1,710,001 1,715,000 1,714,970 0.14011 1,855,001 1,860,000 1,858,444 0.15181 1,965,001 1,970,000 1,969,739 0.16091 2,055,001 2,060,000 2,059,401 0.16821 2,245,001 2,250,000 2,249,746 0.18381 2,775,001 2,780,000 2,777,937 0.22691 3,340,001 3,345,000 3,340,119 0.27281 3,350,001 3,355,000 3,354,550 0.27401 3,715,001 3,720,000 3,717,191 0.30361 3,830,001 3,835,000 3,830,544 0.31291 4,595,001 4,600,000 4,597,634 0.37561 4,765,001 4,770,000 4,767,426 0.38941 4,810,001 4,815,000 4,810,566 0.39301 6,565,001 6,570,000 6,568,964 0.53661 6,965,001 6,970,000 6,967,440 0.56921 10,180,001 10,185,000 10,184,572 0.83201 14,995,001 15,000,000 14,998,307 1.22521 18,365,001 18,370,000 18,366,935 1.50031 20,930,001 20,935,000 20,934,809 1.71011 20,995,001 21,000,000 20,997,631 1.71521 22,495,001 22,500,000 22,497,462 1.83781 38,700,001 38,705,000 38,704,926 3.16171 44,990,001 44,995,000 44,994,928 3.67551 59,990,001 59,995,000 59,993,236 4.90071 61,205,001 61,210,000 61,208,980 5.00001 62,430,001 62,435,000 62,433,163 5.10001 67,490,001 67,495,000 67,492,392 5.51331 78,500,001 78,505,000 78,501,099 6.41251 78,940,001 78,945,000 78,942,102 6.44861 93,645,001 93,650,000 93,649,744 7.65001 17,735,5001 177,360,000 1,7735,8401 14.48791 22,277,5001 222,780,000 222,775,183 18.1979
27,205 Company Total 1,224,179,687 100.0000
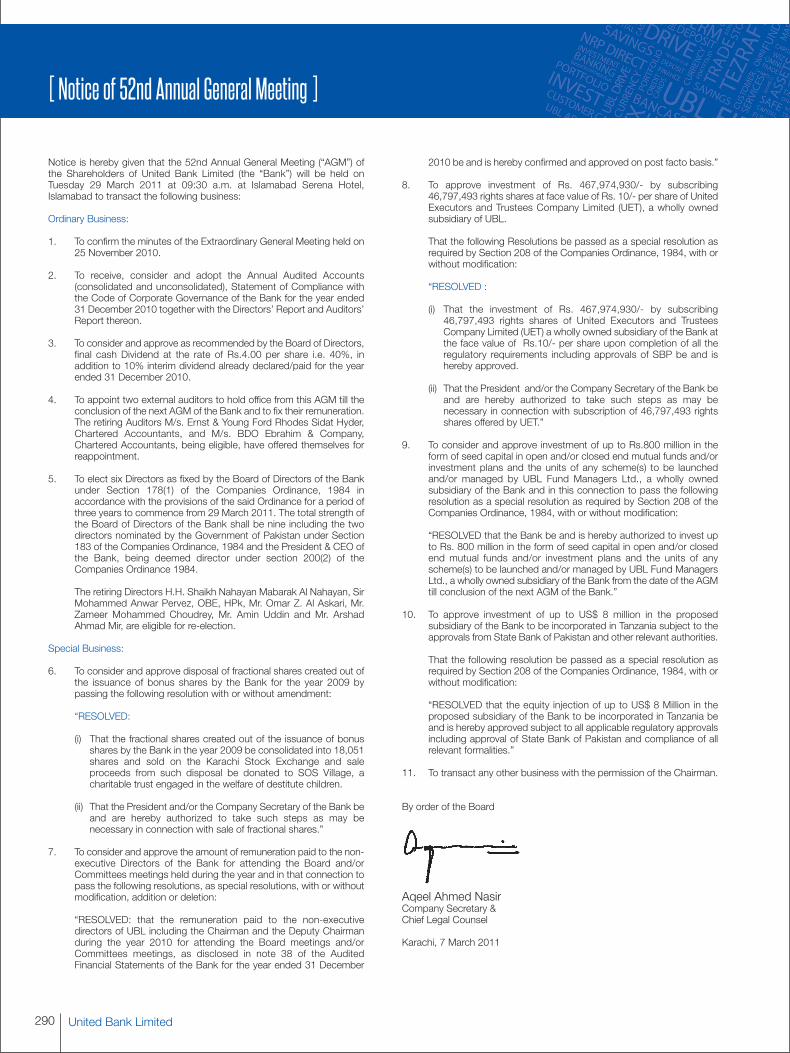
United Bank Limited290
[ Notice of 52nd Annual General Meeting ]
Notice is hereby given that the 52nd Annual General Meeting (“AGM”) ofthe Shareholders of United Bank Limited (the “Bank”) will be held onTuesday 29 March 2011 at 09:30 a.m. at Islamabad Serena Hotel,Islamabad to transact the following business:
Ordinary Business:
1. To confirm the minutes of the Extraordinary General Meeting held on25 November 2010.
2. To receive, consider and adopt the Annual Audited Accounts(consolidated and unconsolidated), Statement of Compliance withthe Code of Corporate Governance of the Bank for the year ended31 December 2010 together with the Directors’ Report and Auditors’Report thereon.
3. To consider and approve as recommended by the Board of Directors,final cash Dividend at the rate of Rs.4.00 per share i.e. 40%, inaddition to 10% interim dividend already declared/paid for the yearended 31 December 2010.
4. To appoint two external auditors to hold office from this AGM till theconclusion of the next AGM of the Bank and to fix their remuneration.The retiring Auditors M/s. Ernst & Young Ford Rhodes Sidat Hyder,Chartered Accountants, and M/s. BDO Ebrahim & Company,Chartered Accountants, being eligible, have offered themselves forreappointment.
5. To elect six Directors as fixed by the Board of Directors of the Bankunder Section 178(1) of the Companies Ordinance, 1984 inaccordance with the provisions of the said Ordinance for a period ofthree years to commence from 29 March 2011. The total strength ofthe Board of Directors of the Bank shall be nine including the twodirectors nominated by the Government of Pakistan under Section183 of the Companies Ordinance, 1984 and the President & CEO ofthe Bank, being deemed director under section 200(2) of theCompanies Ordinance 1984.
The retiring Directors H.H. Shaikh Nahayan Mabarak Al Nahayan, SirMohammed Anwar Pervez, OBE, HPk, Mr. Omar Z. Al Askari, Mr.Zameer Mohammed Choudrey, Mr. Amin Uddin and Mr. ArshadAhmad Mir, are eligible for re-election.
Special Business:
6. To consider and approve disposal of fractional shares created out ofthe issuance of bonus shares by the Bank for the year 2009 bypassing the following resolution with or without amendment:
“RESOLVED:
(i) That the fractional shares created out of the issuance of bonusshares by the Bank in the year 2009 be consolidated into 18,051shares and sold on the Karachi Stock Exchange and saleproceeds from such disposal be donated to SOS Village, acharitable trust engaged in the welfare of destitute children.
(ii) That the President and/or the Company Secretary of the Bank beand are hereby authorized to take such steps as may benecessary in connection with sale of fractional shares.”
7. To consider and approve the amount of remuneration paid to the non-executive Directors of the Bank for attending the Board and/orCommittees meetings held during the year and in that connection topass the following resolutions, as special resolutions, with or withoutmodification, addition or deletion:
“RESOLVED: that the remuneration paid to the non-executivedirectors of UBL including the Chairman and the Deputy Chairmanduring the year 2010 for attending the Board meetings and/orCommittees meetings, as disclosed in note 38 of the AuditedFinancial Statements of the Bank for the year ended 31 December
2010 be and is hereby confirmed and approved on post facto basis.”
8. To approve investment of Rs. 467,974,930/- by subscribing46,797,493 rights shares at face value of Rs. 10/- per share of UnitedExecutors and Trustees Company Limited (UET), a wholly ownedsubsidiary of UBL.
That the following Resolutions be passed as a special resolution asrequired by Section 208 of the Companies Ordinance, 1984, with orwithout modification:
“RESOLVED :
(i) That the investment of Rs. 467,974,930/- by subscribing46,797,493 rights shares of United Executors and TrusteesCompany Limited (UET) a wholly owned subsidiary of the Bank atthe face value of Rs.10/- per share upon completion of all theregulatory requirements including approvals of SBP be and ishereby approved.
(ii) That the President and/or the Company Secretary of the Bank beand are hereby authorized to take such steps as may benecessary in connection with subscription of 46,797,493 rightsshares offered by UET.”
9. To consider and approve investment of up to Rs.800 million in theform of seed capital in open and/or closed end mutual funds and/orinvestment plans and the units of any scheme(s) to be launchedand/or managed by UBL Fund Managers Ltd., a wholly ownedsubsidiary of the Bank and in this connection to pass the followingresolution as a special resolution as required by Section 208 of theCompanies Ordinance, 1984, with or without modification:
“RESOLVED that the Bank be and is hereby authorized to invest upto Rs. 800 million in the form of seed capital in open and/or closedend mutual funds and/or investment plans and the units of anyscheme(s) to be launched and/or managed by UBL Fund ManagersLtd., a wholly owned subsidiary of the Bank from the date of the AGMtill conclusion of the next AGM of the Bank.”
10. To approve investment of up to US$ 8 million in the proposedsubsidiary of the Bank to be incorporated in Tanzania subject to theapprovals from State Bank of Pakistan and other relevant authorities.
That the following resolution be passed as a special resolution asrequired by Section 208 of the Companies Ordinance, 1984, with orwithout modification:
“RESOLVED that the equity injection of up to US$ 8 Million in theproposed subsidiary of the Bank to be incorporated in Tanzania beand is hereby approved subject to all applicable regulatory approvalsincluding approval of State Bank of Pakistan and compliance of allrelevant formalities.”
11. To transact any other business with the permission of the Chairman.
By order of the Board
Aqeel Ahmed NasirCompany Secretary &Chief Legal Counsel
Karachi, 7 March 2011
291Annual Report 2010
[ Notice of 52nd Annual General Meeting ]
Notes:
1. The Share Transfer Books of the Bank shall remain closed from 16March 2011 to 29 March 2011 (both days inclusive). Transfersreceived at M/s. THK Associates (Pvt.) Limited, Ground Floor, StateLife Building No.3, Dr. Ziauddin Ahmed Road, Karachi, the Registrarand Share Transfer Agent of the Bank, by the close of the businesson 15 March 2011 will be treated in time for the purposes of theentitlement of cash dividend and bonus shares.
2. A member entitled to attend and vote at the above Annual GeneralMeeting is entitled to appoint another member as a proxy to attendand vote on his/her behalf, save that a corporation being a membermay appoint as its proxy an officer of such corporation whether amember of the company or not. The instrument appointing a proxyand the power of attorney or other authority (if any) under which it issigned or a notarized certified copy of the power or authority shall bedeposited at the offices of M/s. THK Associates (Pvt.) Limited,Ground Floor, State Life Building No.3, Dr. Ziauddin Ahmed Road,Karachi, the Registrar and Share Transfer Agent of the Bank not laterthan 48 hours before the time of holding the meeting, and must beduly stamped, signed and witnessed.
3. The CDC Account Holders and Sub-Account Holders, whoseregistration details are available in the Share Book Details Report shallbe required to produce their respective original ComputerizedNational Identity Card (CNIC) or original Passport at the time toattending the Annual General Meeting to facilitate identification. SuchAccount Holders and Sub-Account Holders should also bring / knowtheir respective participation I.D. No. and the CDC Account No. incase of proxy, he/she must enclose an attested copy of his/her CNICor Passport. Representative(s) of corporate member(s) should bringusual documents required for such purpose.
4. Members are requested to timely notify any change in their addressesto Bank’s Registrar / Share Transfer Agent M/s. THK Associates (Pvt)Limited, Ground Floor, State Life Building No. 3, Dr. Ziauddin AhmedRoad, Karachi.
5. The election provisions will not apply to the two Government nomineeDirectors who have been nominated on the Board of Directors of UBLby the Government of Pakistan under Section 183 of the CompaniesOrdinance 1984.
6. Any person who seeks to contest the election to the office of aDirector, whether he is retiring director or otherwise, shall file thefollowing with the Company Secretary of the Bank at 2nd Floor, StateLife Building No.1, I.I.Chundrigar Road, Karachi, not later thanfourteen days before the date of the meeting:
(i) His intention to offer himself for the election of directors in termsof Section 178(3) of the Companies Ordinance 1984 togetherwith: (a) consent in Form 28 of the Companies Ordinance 1984,(b) a Declaration with consent to act as Director under clause (ii)of the Code of Corporate Governance of the Securities andExchange Commission of Pakistan to the effect that he is awareof the duties and powers of directors under the CompaniesOrdinance 1984, and the listing regulations of the Karachi Stock
Exchange, Lahore Stock Exchange and Islamabad StockExchange and the Memorandum and Articles of Association ofthe Bank, (c) a Declaration in terms of clauses (iii), (iv) and (v) of theCode of Corporate Governance of the Securities and ExchangeCommission of Pakistan, and (d) a Declaration that he is notineligible to become a director of UBL under any circulars /directives of the State Bank of Pakistan.
(ii) A questionnaire duly completed, recent photograph, copy ofCNIC / Passport and an Affidavit to, inter-alia, meet therequirement of State Bank of Pakistan’s Prudential RegulationsG-I and the Fit and Proper Test for Appointment of Directors ascontained in Annexures VI-A, VI-B and VII-A.
7. In terms of the criteria prescribed by the State Bank of Pakistan,association of the following person as director is undesirable andagainst public interest:
a) A person who is / has been associated with any illegal activity,especially relating to banking business.
b) A person who is in his individual capacity or a proprietary concernof any partnership firm or any private limited company or anyunlisted public company or any listed public company (of whichhe has been a proprietor, partner, director or shareholder), hasbeen in default of payment of dues owed to any financialinstitution and / or in default of payment of any taxes.
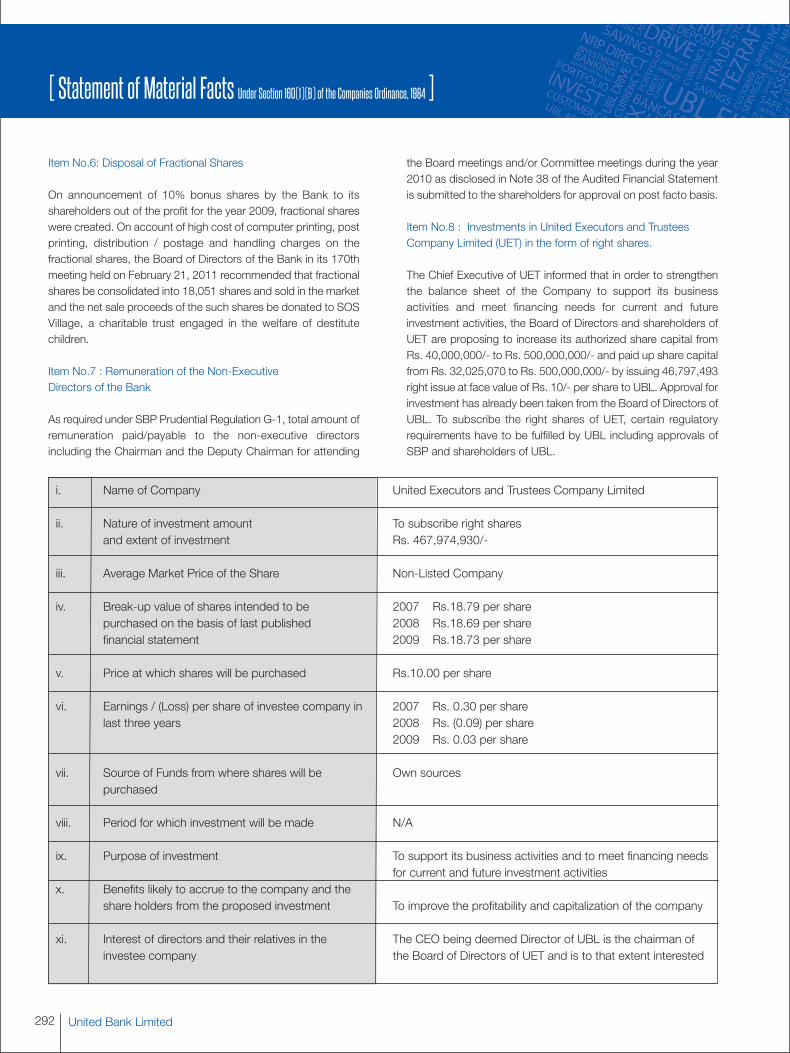
United Bank Limited292
Item No.6: Disposal of Fractional Shares
On announcement of 10% bonus shares by the Bank to itsshareholders out of the profit for the year 2009, fractional shareswere created. On account of high cost of computer printing, postprinting, distribution / postage and handling charges on thefractional shares, the Board of Directors of the Bank in its 170thmeeting held on February 21, 2011 recommended that fractionalshares be consolidated into 18,051 shares and sold in the marketand the net sale proceeds of the such shares be donated to SOSVillage, a charitable trust engaged in the welfare of destitutechildren.
Item No.7 : Remuneration of the Non-ExecutiveDirectors of the Bank
As required under SBP Prudential Regulation G-1, total amount ofremuneration paid/payable to the non-executive directorsincluding the Chairman and the Deputy Chairman for attending
the Board meetings and/or Committee meetings during the year2010 as disclosed in Note 38 of the Audited Financial Statementis submitted to the shareholders for approval on post facto basis.
Item No.8 : Investments in United Executors and TrusteesCompany Limited (UET) in the form of right shares.
The Chief Executive of UET informed that in order to strengthenthe balance sheet of the Company to support its businessactivities and meet financing needs for current and futureinvestment activities, the Board of Directors and shareholders ofUET are proposing to increase its authorized share capital fromRs. 40,000,000/- to Rs. 500,000,000/- and paid up share capitalfrom Rs. 32,025,070 to Rs. 500,000,000/- by issuing 46,797,493right issue at face value of Rs. 10/- per share to UBL. Approval forinvestment has already been taken from the Board of Directors ofUBL. To subscribe the right shares of UET, certain regulatoryrequirements have to be fulfilled by UBL including approvals ofSBP and shareholders of UBL.
[ Statement of Material Facts Under Section 160(1)(B) of the Companies Ordinance, 1984 ]
United Executors and Trustees Company Limited
To subscribe right sharesRs. 467,974,930/-
Non-Listed Company
2007 Rs.18.79 per share2008 Rs.18.69 per share2009 Rs.18.73 per share
Rs.10.00 per share
2007 Rs. 0.30 per share2008 Rs. (0.09) per share2009 Rs. 0.03 per share
Own sources
N/A
To support its business activities and to meet financing needsfor current and future investment activities
To improve the profitability and capitalization of the company
The CEO being deemed Director of UBL is the chairman ofthe Board of Directors of UET and is to that extent interested
i. Name of Company
ii. Nature of investment amountand extent of investment
iii. Average Market Price of the Share
iv. Break-up value of shares intended to bepurchased on the basis of last publishedfinancial statement
v. Price at which shares will be purchased
vi. Earnings / (Loss) per share of investee company inlast three years
vii. Source of Funds from where shares will bepurchased
viii. Period for which investment will be made
ix. Purpose of investment
x. Benefits likely to accrue to the company and theshare holders from the proposed investment
xi. Interest of directors and their relatives in theinvestee company
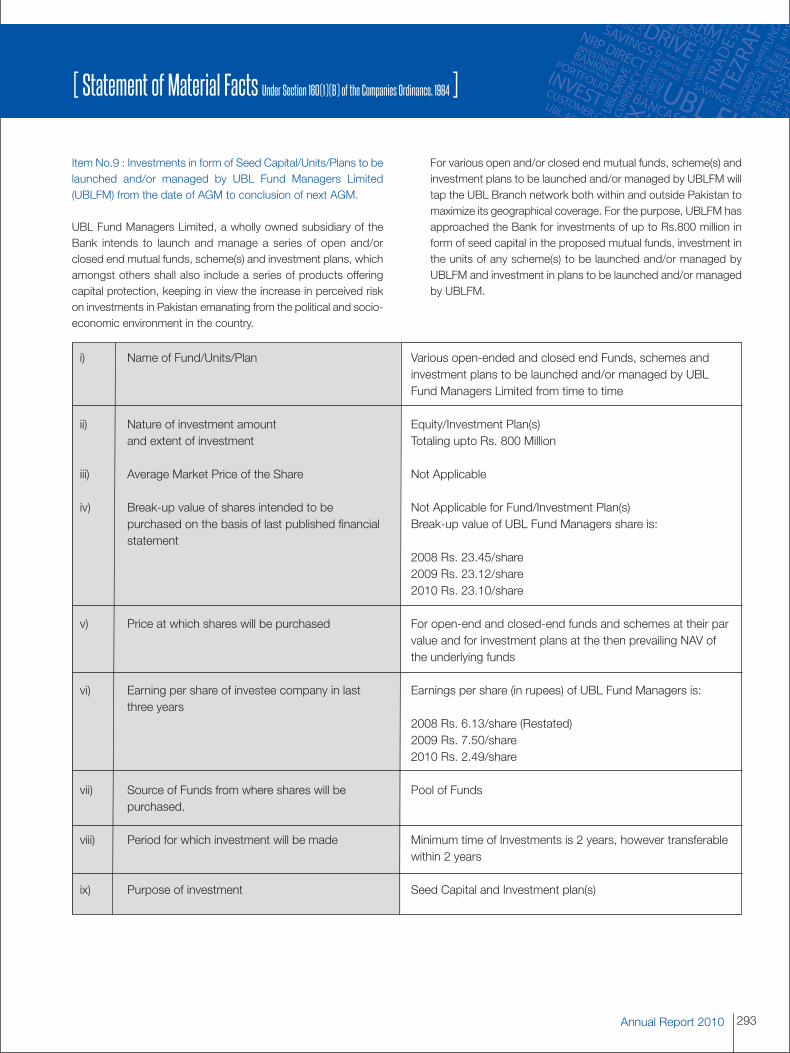
293Annual Report 2010
[ Statement of Material Facts Under Section 160(1)(B) of the Companies Ordinance, 1984 ]
Item No.9 : Investments in form of Seed Capital/Units/Plans to belaunched and/or managed by UBL Fund Managers Limited(UBLFM) from the date of AGM to conclusion of next AGM.
UBL Fund Managers Limited, a wholly owned subsidiary of theBank intends to launch and manage a series of open and/orclosed end mutual funds, scheme(s) and investment plans, whichamongst others shall also include a series of products offeringcapital protection, keeping in view the increase in perceived riskon investments in Pakistan emanating from the political and socio-economic environment in the country.
For various open and/or closed end mutual funds, scheme(s) andinvestment plans to be launched and/or managed by UBLFM willtap the UBL Branch network both within and outside Pakistan tomaximize its geographical coverage. For the purpose, UBLFM hasapproached the Bank for investments of up to Rs.800 million inform of seed capital in the proposed mutual funds, investment inthe units of any scheme(s) to be launched and/or managed byUBLFM and investment in plans to be launched and/or managedby UBLFM.
i) Name of Fund/Units/Plan
ii) Nature of investment amountand extent of investment
iii) Average Market Price of the Share
iv) Break-up value of shares intended to bepurchased on the basis of last published financialstatement
v) Price at which shares will be purchased
vi) Earning per share of investee company in lastthree years
vii) Source of Funds from where shares will bepurchased.
viii) Period for which investment will be made
ix) Purpose of investment
Various open-ended and closed end Funds, schemes andinvestment plans to be launched and/or managed by UBLFund Managers Limited from time to time
Equity/Investment Plan(s)Totaling upto Rs. 800 Million
Not Applicable
Not Applicable for Fund/Investment Plan(s)Break-up value of UBL Fund Managers share is:
2008 Rs. 23.45/share2009 Rs. 23.12/share2010 Rs. 23.10/share
For open-end and closed-end funds and schemes at their parvalue and for investment plans at the then prevailing NAV ofthe underlying funds
Earnings per share (in rupees) of UBL Fund Managers is:
2008 Rs. 6.13/share (Restated)2009 Rs. 7.50/share2010 Rs. 2.49/share
Pool of Funds
Minimum time of Investments is 2 years, however transferablewithin 2 years
Seed Capital and Investment plan(s)
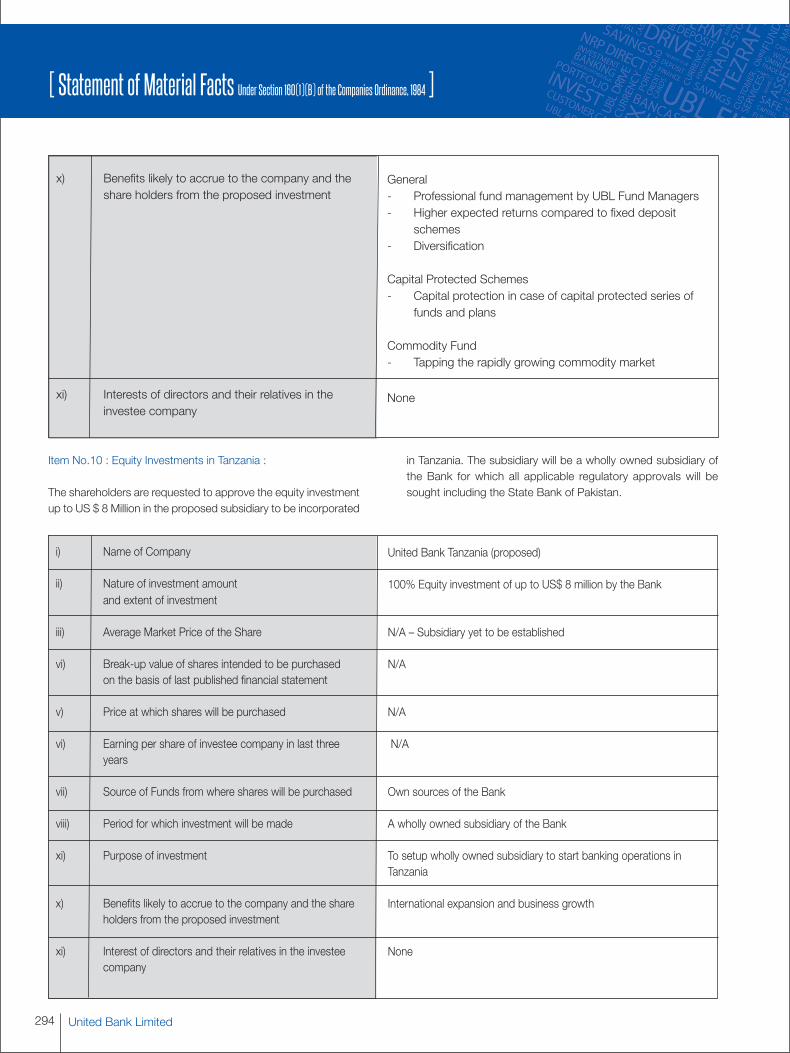
United Bank Limited294
[ Statement of Material Facts Under Section 160(1)(B) of the Companies Ordinance, 1984 ]
x) Benefits likely to accrue to the company and theshare holders from the proposed investment
xi) Interests of directors and their relatives in theinvestee company
General- Professional fund management by UBL Fund Managers- Higher expected returns compared to fixed deposit
schemes- Diversification
Capital Protected Schemes- Capital protection in case of capital protected series of
funds and plans
Commodity Fund- Tapping the rapidly growing commodity market
None
Item No.10 : Equity Investments in Tanzania :
The shareholders are requested to approve the equity investmentup to US $ 8 Million in the proposed subsidiary to be incorporated
in Tanzania. The subsidiary will be a wholly owned subsidiary ofthe Bank for which all applicable regulatory approvals will besought including the State Bank of Pakistan.
United Bank Tanzania (proposed)
100% Equity investment of up to US$ 8 million by the Bank
N/A – Subsidiary yet to be established
N/A
N/A
N/A
Own sources of the Bank
A wholly owned subsidiary of the Bank
To setup wholly owned subsidiary to start banking operations inTanzania
International expansion and business growth
None
i) Name of Company
ii) Nature of investment amountand extent of investment
iii) Average Market Price of the Share
vi) Break-up value of shares intended to be purchasedon the basis of last published financial statement
v) Price at which shares will be purchased
vi) Earning per share of investee company in last threeyears
vii) Source of Funds from where shares will be purchased
viii) Period for which investment will be made
xi) Purpose of investment
x) Benefits likely to accrue to the company and the shareholders from the proposed investment
xi) Interest of directors and their relatives in the investeecompany
Annual Report 2010
I/We, of being a
member of United Bank Limited (“UBL”) and holder of ordinary shares as per Share Register
Folio No. and / or CDC Participation I.D. No. and
Account No. hereby appoint of
or failing him of as
my/our proxy to vote for me/our and on my/our behalf at the 52nd Annual General Meeting of UBL scheduled to be held on Tuesday,
March 29, 2011 at 09:30 a.m. at Islamabad Serena Hotel, Islamabad and at any adjournment thereof.
Signed this day of 2011.
Witness 1:
Signature:
Name:
CNIC No. or Passport No:
Address:
Witness 2:
Signature:
Name:
CNIC No. or Passport No:
Address:
Note:A. General:1. A member entitled to attend and vote at a General Meeting is entitled to appoint a proxy to attend and vote instead of him/her. No person shall
act as a proxy, who is not a member of UBL except that Government of Pakistan / State Bank of Pakistan / Corporation may appoint a personwho is not a member.
2. The instrument appointing a proxy should be signed by the member or his/her attorney duly authorized in writing. If the member is a corporation(other than Government of Pakistan and State Bank of Pakistan), its common seal should be affixed on the instrument.
3. The instrument appointing a proxy, together with Power of Attorney, if any, under which it is signed or a notarially certified copy thereof, shouldbe deposited, with our Registrar/Transfer Agents, M/s. THK Associates (Pvt.) Limited, Ground Floor, State Life Building No.3, Dr. ZiauddinAhmed Road, Karachi, not less than 48 hours before the time of holding the meeting.
4. If a member appoints more than one proxy, and more than one instrument of proxy are deposited by a member with the Registrar, all suchinstruments of proxy shall be rendered invalid.
B. For CDC Account Holders:1. The proxy form shall be witnessed by two persons whose names, addresses and CNIC / Passport No. shall be mentioned on the form.2. Attested copies of CNIC or the passport of the beneficial owners of the proxy shall be furnished with the proxy form.3. The proxy shall produce his/her original CNIC or original passport at the time of the meeting.
[ Form of Proxy 52nd Annual General Meeting of United Bank Limited]
Revenue Stampsof Rs. 5/-
(Signature should agree with the specimensignature registered with the Registrar)
RegistrarM/s. THK Associates (Pvt.) Limited,Ground Floor, State Life Building No.3,Dr. Ziauddin Ahmed Road,Karachi, Pakistan.
Affixcorrectpostage