two discontinuities in the deep water of the western north pacific ocean
TRANSCRIPT

Deep-Sea Research, 1973, Vol. 20, pp. 527 to 536. Pergamon Press. Printed in Great Britain.
Two discontinuities in the deep water of the western North Pacific Ocean
SHIZUO TSUNOGAI,* EIJI MATSUMOTO,~ KATSUTOSHI K~O,* YOSHIYUKI NOZAKI* and AKIHIKO HATTORI~
(Received 25 September 1972; in revised form 10 December 1972; accepted 14 December 1972)
Abstract--Vertical profiles of temperature, salinity, dissolved oxygen, alkalinity and nutrients were studied in detail at two stations in the western North Pacific Ocean near the Kurile and Bonin trenches (28.5°N, 145°E and 44°N, 154°E). The deep water column contained three distinct water masses, i.e. the upper deep water, the middle deep water and the lower deep water. The boundary between the lower deep water and the middle deep water is clearly marked by differences in preformed phosphate and alkalinity. The upper discontinuity layer is located at the depth where two straight lines in the T-S diagram cross and the mixing parameter in the one-dimensional model of MtmK (1966) changes. The lower deep water resides below about 3 km and the concentrations of dissolved constituents in this water mass were similar at the two stations. The upper deep water lies above about 2 km depth and its chemical composition is largely controlled by mixing with overlying water. The occurrence of more active biochemical processes in the middle deep water at the northern station is suggested by lower contents of oxygen at this station than at the one to the south.
INTRODUCTION
THE SIMPLE one-dimensional model of diffusion and advection was first used by WYRTI~ (1962) in a discussion of the oxygen minimum layer at 500 to 1000 m depth. MENZEL and RYTHER (1970), however, argued against the occurrence of in situ decomposition of organic matter in subsurface water during isentropi6 flow. They state that the formation of the oxygen minimum water occurs at depths shallower than 200 to 300 m in coastal areas of high production. MONK (1966), using conservative properties such as salinity and temperature, successfully applied the one-dimensional model to the deep water of the central Pacific between 1 and 4 km depth. CRAIG (1969) also used the model to evaluate the flux of particulate carbon in the deep water of the Pacific. Because rates of biological transformation of biophilic elements in deep water are low, the model is useful in estimating these biological activities (TSUNOGAL 1972a,b). To assess the extent of in situ chemical or biological reactions, however, the applicability of the model must be critically examined, because the deviation of the real ocean from the model might bring about substantial error in the estimated rates of the chemical or biochemical processes in question. TSUNOOAI (1972a) defined the region where the one-dimensional model was applicable, but the previously available data on chemical constituents and the precision of chemical analyses were too low to justify use of the model to estimate rates of chemical and biological processes.
The data collected during Cruise KH-71-3 of the R.V. Hakuh'6 Maru (HATTORI, 1972) indicate that two discontinuities exist in the deep water of the western North
*Department of Chemistry, Faculty of Fisheries, Hokkaido University, Hakodate, Japan. Geological Survey of Japan, Hisamoto-135, Itawasaki, Japan.
~Ocean Research Institute, University of Tokyo, Nakano-ku, Tokyo, Japan.
527

528 Smzuo TstrNoG~ et al.
Pacific, an upper discontinuity located at 1.7-2.0 km depth and a lower one at 2.7-3-0 km. These data are also used to discuss the validity o f using the one-dimensional model to describe the vertical water structure o f deep water.
SAMPLING AND CHEMICAL ANALYSES
Sea water samples were collected with 2-liter Teflon®-coated Nansen bottles at two stations (the south station, 28.5°N, 145°E and the nor th station, 44°N, 154°E) on Cruise KH-71-3 of the University of Tokyo operated R.V. Hakuh6 Maru. At each station, serial hydrographic casts f rom surface to bo t tom were duplicated. A serial hydrographic cast consisted o f three casts by which sea water samples were obtained f rom 45 depths (Table 1). Duplicate analyses o f salinity, dissolved oxygen, pH, alka- linity, nitrate, nitrite, ammonia, inorganic phosphate, total phosphorus, dissolved silicates and dissolved organic carbon and nitrogen were performed on each sample.
Analytical methods described by STRICKLAND and PARSONS (1968) were used for the determinations o f the above-mentioned constituents except for silicate which was determined by the method of KIDO (1970). The standardizations for oxygen,
Table 1. Samples obtained at Stas. 11 and 19 of Cruise KH-71-3 of the Hakuh5 Maru.
Notation Date, 1971 Location
Depth, m
Sta. 11 Sta. 19 SN-I SN-2 NN-1 NN-2
June 23-24 June 28 July 18 July 22 28°28'N 28°28'N 44°09'N 44°04'N
145°00'E 145°02'E 154°01'E 154°04'E 5870 5850 5200 5170
(No. of samples) (Depths covered by individual casts) I 16 0--438 m 0-419 m 0--416 m 0-412 m
Casts II 14 474-1831 464-1828 430-1626 449-1713 III 15 2034-5548 1 9 6 7 - 5 4 1 5 1830-4474 1810-4811
Table2. Analytical errors in determinations of chemical constituents during the KH-71-3 Cruise for four sets consisting of 45 values.
Salinity 02 pH Alk P EP Si NH, NOa (%°) (mill.) (meq/1.) (~M) (~M) (/~M) (/~M) &M)
Systematic error Maximum (absolute value) 0.003 0.008 0.016 0.016 0.1 0.06 0-2 0.09 1.3 Frequency of systematic error observed with 99 % confidence level 3 1 3 2 3 0 0 0 0
Random error* Maximum including systematic error 0-005 0.035 0.022 0.018 0.12 0.18 5.4t 0.24 3.3 Mean excluding systematic error ~: 0.004 0"025 0"015 0"01 0.05 0"14 3 '0 0.15 2'9 Relative mean error (~o) 0.01 0.6 - - 0.4 2 6 2 20 8
*One sigma value of the standard deviation. tThe value obtained from the first cast (SN-1). The random error gradually decreased. ~:Obtained by adjusting the mean difference to zero.

Two discontinuities in the deep water of the western North Pacific Ocean 529
phosphate, silicate and nitrite were made against the standard solutions provided by the courtesy of Dr. K. Sugawara, Sagami Chemical Research Center.
After the analysis of a component had been completed, using one set of samples (from the surface to the bottom), another set of samples were analyzed for the same component. The numerical data are presented in the cruise report for the Hakuh'6 Maru KH-71-3 Cruise (HATTORI, 1972). On the basis of these data, we can distinguish the difference between random error and systematic error of analysis (Table 2). Strictly speaking, the latter which is the mean of the difference between two sets of deter- minations is not the true systematic error, but a part of the systematic error. Systematic error was considerable in the determination of salinity, pH, alkalinity and phosphate. Random error which is the square mean of the difference is large in the determination of nutrients.
In the following discussion, we use the data on salinity, oxygen, pH, alkalinity, phosphate, silicate and water temperature to delineate deep water discontinuities. The precision of deep water temperature determination was within 4- 0.01 °C, determined by using double protected thermometers (HATa'ORI, 1972).
U P P E R D I S C O N T I N U I T Y I N D E E P W A T E R O F T H E W E S T E R N N O R T H P A C I F I C
The 0 (potential temperature)-S relations in deep water are well described by straight lines, but the lines break at about 1 "7 km depth at the south station and at about 2.0 km depth at the north station (Figs. 1 and 2). The O-S curves coincide well with each other for water deeper than 2 km, but above 2 km the lines separate gradually with decrease in depth. This may be due to mixing with water of the thermo- dine layer where a salinity minimum exists.
In the one-dimensional model, the vertical distribution of a conservative property is assumed to be in a steady state and to be governed by a balance between vertical
Fig . I .
*C
%*
3 4 5 0 34 .60 34.70
oo = - - ? . ' 5
S N I =
S N 2 .
6 -- - - 2.0
'%, O ' S 5
1"5
2 ,
, v , I T I ' ~ ~ i . o ~,,,-o ~4.z ~4.4 3 4 6
%o
O-S diagram at the south station (Sta. 11). Numerical figures refer to the depths in km.

530 S m z u o TSUNOGAI et al.
Fig. 2.
°C
25 .
2C
m
utJ muu
N N I : I
NN 2 • i
w ,
54 45 5/+ 50 34 55 34 60 34 65 54 70 %o
O-S diagram at the north station (Sta. 19). Numerical figures refer to the depths in kin.
diffusion and vertical advection (upwelling), independently of horizontal flow. It is required that the O-S diagram gives a straight line in the region to be considered. Therefore, in the present case, the one-dimensional model must be applied separately to the two deep water masses.
The model can be represented for a conservative property by the equation,
~S/~t D(~2S/OZ 2) -- W(~S/~Z) :.- O, (1)
where S is the concentration of the conservative component, D is the vertical eddy diffusivity, W is the advection velocity taken as positive downwards and Z is the water depth. The solution of equation (I) is given by
S ca ~ c,exp[(W/D)Z], (2)
where ca and c2 are constants. Since ca is the converging value of the component at sufficiently great depth, the ca value can be estimated by the approximation method or the trial and error method. The equation (2) becomes
In(IS ..... cl l) '=ln[c2[ i (W/D)Z. (3)
Therefore, a logarithmic plot of (I S -- Cl]) versus depth must give a straight line if the model is valid. The gradient of the line in the plot gives the value of W/D, a mixing parameter. Two straight lines having different values of W/D were obtained which intersect each other at the depth of the transition layer of the O-S diagram (Fig. 3). This suggests that we cannot apply the one-dimensional model to all the deep water of the western North Pacific as was done by MUNK (1966) and CRAIG (1969), although the model is still applicable to the water above or below the discontinuity. For reference, we call the water above the upper discontinuity the upper deep water, and the water below the discontinuity the middle deep water.
There are two explanations for the origin of the upper discontinuity. One is the presence of an advective core which is centered at 2 kin depth. In the earlier literature

Two discontinuities in the deep water of the western Nor th Pacific Ocean 531
I tt)
o ~
Fig. 3.
-05
-I.C
-I.5
' e '~ 'e~W=~ =- 1"51 km -1
• -
-- W/D =-1.13 k m " ~ . ~ e . ~
-2o , I , t 2 5
krn
Log (IS - c l l ) versus depth for the cast, SN-1 at the south station (Sta. 11).
(MASUZAWA, 1962; MORIYASU, 1972) describing the physical oceanography of deep water in the western North Pacific, however, there is no evidence to suggest the presence of this advective core. Another explanation is the presence of a boundary between water masses at 2 km depth. The boundary surface must always be renewed owing to the supply of the slowly rising water. The boundary surface, if it exists, may be formed by the difference in direction and/or speed of the horizontal advection between the two water masses. The water, as was observed between 1.7 and 2-0 km depth at the south station, could not be found in the O-S diagram of the north station; the top 300 m layer of the middle deep water appears to be cut off at the north station. The active vertical mixing in the cold region or during the horizontal flow from south to north may be the reason.
L O W E R D I S C O N T I N U I T Y IN DEEP W A T E R OF THE W E S T E R N N O R T H P A C I F I C
The alkalinity abruptly increases by about 0.03 meq/1, at 3.0 km depth at the south station and at 2.7 km depth at the north station (Figs. 4 and 5). Alkalinity is a measure of the difference between the concentration of total cations and total anions of strong electrolytes. In the ocean, the in situ alkalinity change is mainly due to forma- tion or dissolution of calcium carbonates and it is often small as compared with alka- linity change caused by mixing of different water masses. The alkalinity/chlorinity ratio is useful as a tracer of awater mass, and as a clock of the deep water movement because it slowly increases with-the dissolution of calcium carbonates.
Two possibilities can be considered for the cause of the observed discontinuity. One is that the discontinuity layer is the boundary between supersaturated and under- saturated zones with respect to calcium carbonate. LI, TAKAHASHI and BROECKER (1969) showed that the Pacific water becomes undersaturated with respect to calcite at depths below about 3 km, although BERNER (1965) reported that the depth is about 500 m. Another explanation is that the discontinuity layer is the boundary between different water masses.

532 S H I Z U O T S U N O G A I et al.
km
I --
2 --
3 --
4 -
5 --
5 A I k / C L x l O meq/I , per % 0
1 2 6 ~28 ~ 3 O
L ' 1 ~ I o A D
A o
* o A a
o ~ a
~ o ~
D , ~ o e
=%
r~ •
II S N 2 I
1I
1 3 2
%.
zx o •
~ o o A
o
4 Dco
A Q
o
Fig. 4. The vertical distribution of the ratio of alkalinity to chiorinity at the south station (Sta. 11).
km
A I k / C L x IO-?meq/L per O/o.
125 126 127 t28 129 [30 151 i 3 2 133
I n ] ~ i l I l
g%.
o e um
o 0
- TT N N 2 1
C4
13& • 0
A ~ o
~ C 3 0 0
O ~
4, ~l' 0
• 0 euL
F i g . 5 . T h e v e r t i c a l d i s t r i b u t i o n o f t h e r a t i o o f a i k a l i n i t y t o c h l o r i n i t y a t t h e n o r t h s t a t i o n ( S t a . 19) .

Two discontinuities in the deep water of the western North Pacific Ocean 533
In Figs. 6 and 7, the phosphate contents are plotted against AOU (apparent oxygen utilization) which represents the difference between the dissolved oxygen content equilibrated with the atmosphere at the in situ temperature and salinity and the observed one. I f deep water is of a single origin and in situ increase of phosphate is due to the decomposition of organic matter accompanied by the consumption of oxygen as inferred by REDFIELD, KETCHUM and RICHARDS (1963), the relationship between phosphate and AOU must give a single straight line. As seen in these figures, however, there exists a discontinuity at about 3 km depth which coincides with the depth of the alkalinity discontinuity. A similar discontinuity was found in the distribution of silicate (Fig. 8). Closer inspection of the T-S diagram (Figs. 1 and 2) also reveals that the deviation from the straight line is significant for the waters deeper than 3 km.
Fig. 6.
=E =L
~ ' 5 d
3"0- -
2"5- -
S N ' 2 Z o l i e
2'82 • g
o= i"55
9 ws g.a e g 5.42
. : ~,o6
I I I I 4.0 4.5 5"0 5"5 6"0
AOU, milL.
Phosphate versus AOU for the cast, SN-2 at the south station (Sta. 11). Numerical figures refer to the depths in km.
3'5
=E 3"0 ::L
2'5
N N - I Z •
4.77' A A A A ' ~ " ~ "
A S 2.5"r • • 12.36
" A,2.72
&
Q
.:: .o2 " n = =
I I I I. t 4.2 4.5 5-0 5'5 6"0 6'5
AOU, mL/L.
Fig. 7. Phospha te versus A O U for the cast, NN-2 at the no r th s ta t ion (Sta. 19). Numerical figures refer to the depths in kin.
534 Smzuo TSUNOGAI et al.
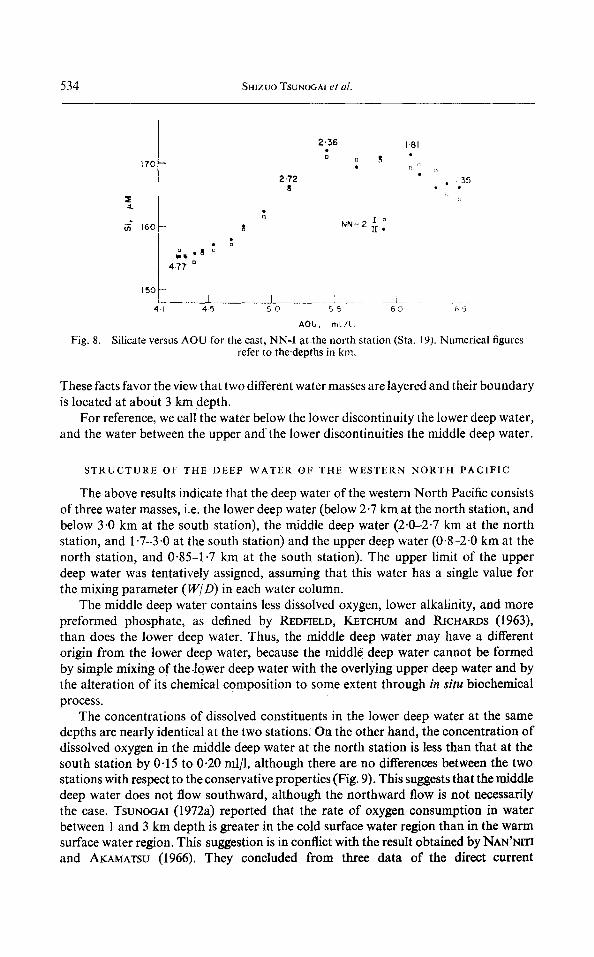
Fig. 8.
a .
b5
1 7 0 - -
160
1 5 0
4
t l
[] 4.77
2'36 1"81
u
e 2:72 . I 35
:J
NN-2 I[ ~
n
1 ..... 1 i J .~__ 45 50 55 6.0 65
AOU, mLIL.
Silicate versus A O U for the cast, N N - I at . the no r th s tat ion (Sta. 19). Numerica l figures refer to the-depths in kin.
These facts favor the view that two different water masses are layered and their boundary is located at about 3 km depth.
For reference, we call the water below the lower discontinuity the lower deep water, and the water between the upper and the lower discontinuities the middle deep water.
S T R U C T U R E OF THE DEEP W A T E R OF THE W E S T E R N N O R T H P A C I F I C
The above results indicate that the deep water of the western North Pacific consists of three water masses, i.e. the lower deep water (below 2.7 km at the north station, and below 3.0 km at the south station), the middle deep water (2.0-2.7 km at the north station, and 1.7-3-0 at the south station) and the upper deep water (0.8-2-0 kin at the north station, and 0.85-1.7 km at the south station). The upper limit of the upper deep water was tentatively assigned, assuming that this water has a single value for the mixing parameter (IV/D) in each water column.
The middle deep water contains less dissolved oxygen, lower alkalinity, and more preformed phosphate, as defined by REDFIELD, KETCHUM and R~CHARDS (1963), than does the lower deep water. Thus, the middle deep water may have a different origin from the lower deep water, because the middle deep water cannot be formed by simple mixing of thelower deep water with the overlying upper deep water and by the alteration of its chemical composition to some extent through in situ biochemical process.
The concentrations of dissolved constituents in the lower deep water at the same depths are nearly identical at the two stations; On the other hand, the concentration of dissolved oxygen in the middle deep water at the north station is less than that at the south station by 0.15 to 0.20 ml/l, although there are no differences between the two stations with respect to the conservative properties (Fig. 9). This suggests that the middle deep water does not flow southward, although the northward flow is not necessarily the case. TSUNOGAI (1972a) reported that the rate of oxygen consumption in water between 1 and 3 km depth is greater in the cold surface water region than in the warm surface water region. This suggestion is in conflict with the result obtained by NAN'NITI and AKAMATSU (1966). They concluded from three data of the direct current

Two discontinuities in the deep water o f the western Nor th Pacific Ocean 535
Fig. 9.
km
I
mill.
I 2 3
%99 ~ I . o l
~ n A S N - I * S ' N - 2 o
%0 N N - I ~, o
N N - 2 = . d '
\ o
o
* I
The vertical distributions of dissolved oxygen at Stas. 11 and 19 of the Hakuh~ Maru KI-1-71-3 Cruise.
measurements that the deep water between 2 and 3 km depth in the North Pacific flows southward. The vertical profiles of chemical constituents in the upper deep water vary from place to place, probably owing to the mixing with water of the thermo- cline layer where large variations in the concentration of dissolved constituents are commonly observed.
C O N C L U D I N G R E M A R K S
The discontinuities observed in the chemical composition are not clearly observed in the density gradients. This may be the reason why the discrete structure of the deep water has not been noted by physical oceanographers (cf. MORIYASO, 1972). Our hydrographic stations are located in or near the region of the western boundary abyssal current as predicted by Stommel (STOMMEL, 1958; STOMMEL and ARONS, 1960). From a theoretical point of view of water circulation, the structure of the deep water in the sea area in question will not be greatly altered from place to place, and, thus, the local variation in chemical composition is probably not so large, if it occurs. Un- fortunately, however, we failed to demonstrate the three-layered structure of the deep water by using data previously obtained on other expeditions near our present stations, such as JEDS expeditions, because of the limited amount of data at each station and thelack of precision and accuracy of analyses.
The deep water of the western North Pacific is too complicated to apply the simple one-dimensional model. On the basis of future detailed observations, the development of a more suitable model is needed to estimate the extent of in situ biochemical processes.

536 SH~zuo TSUNOGAI et al.
Acknowledgements--We wish to express our gratitude to the scientists aboard the KH-73-3 Cruise and the staff members of the R.V. Hakuh- Maru for their kind cooperation. Thanks are also due to Prof. M. NISl-aMURA, Hokkaido University, and Prof. J. J. GOEmNG, University of Alaska, for their valuable suggestions and comments in the preparation of this paper. This work was partly supported by a grant (JIBP, No. 99125) from the Ministry of Education, Japan.
REFERENCES
BERNER R. A. (1965) Activity coefficients of bicarbonate, carbonate, and calcium ions in sea water. Geochim. cosmochim. Acta, 29, 947-965.
CRAIG H. (1969) Abyssal carbon and radiocarbon in the Pacitic. J. geophys. Res., 74, 5491-5506. HATTORI A., editor (1972) Preliminary Report of the Hakuh6 Maru Cruise, KH-71-3, June 18-
July 29, 1971. Ocean Research Institute, University of Tokyo. KIDO K. (1970) Determination of silicate and the state of silicate in sea water. Thesis for the
degree of Master of Fisheries, Hokkaido University, 94 pp. LI Y.-H., T. TAKAHASHI and W. S. BROECKER (1969) Degree of saturation of CaCOs in the
oceans. J. geophys. Res., 74, 5507-5525. MASUZAWA J. (1962) The deep water in the western boundary of the North Pacific. J. oceanogr.
Soc. Japan, 20th Ann. Vol., 279-285. MENZEL D. W. and J. H. RYTnER (1970) Distribution and cycling of organic matter in the
oceans. In: Organic matter in natural waters, D. W. HOOD, editor, Occ. Publ. Mar. Sci., 1, 31-54.
Moarvasu S. (1972) Deep waters in the western North Pacific. In: Kuroshio--its physical aspects, H. STOMMEL and K. YOSnrOA, editors, Univ. Tokyo Press, 387-408.
MUNK W. H. (1966) Abyssal recipes. Deep-Sea Res., 13, 707-730. NAN'NITI T. and H. AKAMATSU (1966) Deep current observations in the Pacific Ocean near the
Japan Trench. J. oceanogr. Soc. Japan, 22, 154-160. REDFIELD A. C., B. H. KETCHUM and F. A. RICHARDS (1963) The influence of organisms
on the composition of sea water. In: The sea, M. N. HILL, editor, Interscience, 2, 26-77. STOM~L H. (1958) The abyssal circulation. Deep-Sea Res., 5, 80-82. STOMMEL H. and A. B. ARONS (1960) On the abyssal circulation of the world ocean--I .
Stationary planetary flow patterns on a sphere. Deep-Sea Res., 6, 140-154. STRICKLAND J. D. H. and T. R. PARSONS (1968) A practical handbook of seawater analysis.
Bull. Fish. Res. Bd Can., 167, 311 pp. TSUNOOAI S. (1972a) An estimate of the rate of decomposition of organic matter in the deep
water of the Pacific Ocean. In: Biological oceanography of the northern North Pacific Ocean, A. Y. TAKENOUXI, editor, Idemitsu Shoten, 517-533.
TSUNOGAI S. (1972b) An estimate of the vertical diffusivity of the deep water. J. oceanogr. Soc. Japan, 28(4), 145-152.
WYRTKI K. (1962) The oxygen minima in relation to ocean circulation. Deep-Sea Res., 9, 11-23.