two alert flood early warning system method … · two alert flood early warning system method...
TRANSCRIPT

http://www.iaeme.com/IJCIET/index.asp 1032 [email protected]
International Journal of Civil Engineering and Technology (IJCIET) Volume 8, Issue 12, December 2017, pp. 1032–1044, Article ID: IJCIET_08_12_112
Available online at http://http://www.iaeme.com/ijciet/issues.asp?JType=IJCIET&VType=8&IType=12
ISSN Print: 0976-6308 and ISSN Online: 0976-6316
© IAEME Publication Scopus Indexed
TWO ALERT FLOOD EARLY WARNING
SYSTEM METHOD BASED ON RAINFALL
RUNOFF MODEL
Ariani Budi Safarina
Civil Engineering Department, Universitas Jenderal Achmad Yani, Cimahi - 40532, West
Java, Indonesia
Ramli
Civil Engineering Department, Universitas Jenderal Achmad Yani, Cimahi – 40532, West
Java, Indonesia
Muhammad Shiddiq Sayyid Hashuro
School of Electrical Engineering and Informatics, Institut Teknologi Bandung, Bandung -
40132, West Java, Indonesia
ABSTRACT
Some residential areas and the main road of Cimahi city that connect Cimahi with
other city are often flooded. Based on rainfall runoff model, this research have
prepared two alert flood early warning system method with the threshold of river
water level and total rainfall. These two alerts indicate that the system is supported by
complete flood process and meanwhile rainfall alert still works even though the water
level sensor in trouble by sedimentation. Cimahi river cross section in the upstream,
midstream and downstream have maximum discharge and water level respectively
730.3 m3 / s and 2.28 m, 95.2 m
3 / s and 1.8 m, 59.4 m
3 / s and 2.53 m. Cimahi River
unit hydrograph generated threshold of total rainfall and time to peak in the upstream,
midstream and downstream respectively, 915 mm and 2 hours, 80 mm and 3 hours, 50
mm and 3 hours with 0.57 runoff coefficient. Based on this calculation, the threshold
used is the smallest threshold that is in the downstream area and applied as a
benchmarking parameter in the upstream. The water level threshold in the upstream is
1.48 m and total rainfall threshold is 50 mm with the time for warning preparation is
3 hours. Bed river elevation is a part of threshold for sedimentation control, that
repectively in the upstream, midstream and downstream are 1481.39 m msl, 755.68 m
msl and 677.55 m msl. The two alert flood early warning system method as the result
of the research is completed with The Information Map of Total Rainfall Threshold
and Unit Hydrograph for Cimahi Flood Early Warning System and publish in the
public area.
Ariani Budi Safarina, Ramli and Muhammad Shiddiq Sayyid Hashuro
http://www.iaeme.com/IJCIET/index.asp 1033 [email protected]
Keywords: Alert, Flood Early Warning System, Maximum Water Level, Runoff
Coefficient, Total Rainfall
Cite this Article: Ariani Budi Safarina, Ramli and Muhammad Shiddiq Sayyid
Hashuro, Two Alert Flood Early Warning System Method Based on Rainfall Runoff
Model, International Journal of Civil Engineering and Technology, 8(12), 2017,
pp. 1032–1044
http://www.iaeme.com/IJCIET/issues.asp?JType=IJCIET&VType=8&IType=12
1. INTRODUCTION
Flood early warning system with many sensor and information technology device is a system
used for nonstructural flood control. Fakhruddin et al., (2015), make an early warning as a key
element of disaster risk reduction [1]. Castro et al., (2013), Patra et al., (2015) and Hoedjes et
al., (2014) used water level as the input parameters in the flood early warning system [2, 3, 4].
Philippines decision supporting system develop a Flash Flood Warning System using SMS
with advanced warning information of increasing water level and water speed because these
two factors considered as a triggers of flashflood [2]. Priya et al., (2017), placed pressure
sensors at the bottom of the river or surroundings, which requires high maintenance cost since
they can be easily destroyed or buried by floods and sedimentation [5].
Aliakbar et al., (2009) integrated hydrologic and hydraulic model in the flood eary
warning system. Fluctuations in river water levels can be measured hydrologically based on
several parameters namely rainfall, topography, and hydraulic [6]. Alfieri et al., (2013)
simulated hydrological model for forecasting streamflow in Nanjing China. The first input of
river water change is rainfall, therefore the change of river water level can be known from
rainfall information through hydrological model calculation. An accurate simulation of initial
model conditions and an improved parameterization of the hydrological model are key
components to reproduce accurately the streamflow variability in the many different runoff
regimes of the earth [7].
In some studies, rainfall becomes the parameter in flood prediction. Rodriguez et al.,
(2015) used extreme rainfall alert to predicting surface water flooding in England. The
research relating to three case study area and the existing extreme rainfall thresholds do not
relate directly to surface water flooding in all areas [8]. Patel et al., (2015) used fuzzy logic
for analized rainfall runoff model. Rainfall is an input of rainfall runoff model which produces
surcafe runoff that increased river water level [9]. The model represents the whole parameter
of flood process.
The flood of urban areas is a unity in the flood watershed. Urban flooding can come from
overflowing rivers or overflowing drainage before entering the river. Identifying urban flood
areas particularly vulnerable to the effects of heavy rains can be achieved by adapting
hydrological models, but they require an appropriate adjustment and highly accurate input
data such as land cover, soil type, humidity, wind speed, growing season, roughness and
porosity of the cover, soil moisture, land-use and environmental planning strategies for
disaster resilience [10, 11]. Taimeng et al., (2015) designed decision supportiny system for
urban flood. Design and implementation of an urban flood defense decision support system is
required big data. The system connects real-time sensor to collect streaming data, and uses a
data-driven method that considers temporal and spatial factors to forecast water level in the
next 6 hours. Thus, it can provide enough time for the authorities to take pertinent flood
protection measures such as evacuation [12]. Kaoje (2016) used technical of GIS for urban
flood risk assessment. GIS as a modern technology has several techniques and tools that can
be used for effective urban flood modelling and mapping. The development of GIS
functionalities for hydraulic and hydrological models made it possible to identify areas that
Two Alert Flood Early Warning System Method Based on Rainfall Runoff Model
http://www.iaeme.com/IJCIET/index.asp 1034 [email protected]
are at risk of flooding in a particular earth’s surface area. The purpose of flood risk mapping
is to steer strategies towards protection, prevention and preparedness, in attempts to minimize
future costs from flooding [13].
The purpose of this study is to create a new basic hydrology model of flood early warning
system in Cimahi city that complete the system with total rainfall input beside the water level
input. In the model, total rainfall threshold is converted into effective rainfall based on the
runoff coefficient calculated from the land use map and the maximum discharge based on the
existing cross section. Change of landuse and river cross section causing the model to be
invalid, so these two parameters control the model. The model also complete with a GIS
information map that contains Cimahi river cross section in the upstream, midstream and
downstream, completed by its maximum discharge, unit hydrograph, total rainfall threshold,
and time to peak that the printed map publish in public area. In the GIS layer is also added
with ten puddle location in Cimahi city which can be used for research development by
adding a threshold of the drainage system load parameter.
2. DATA AND METHOD
Flow of methodology in the research consist of three steps. First step is survey and
generate Cimahi River unit hydrogaph, the second is river cross section and maximum
discharge threshold, and the last is landuse threshold, effective rainfall threshold and total
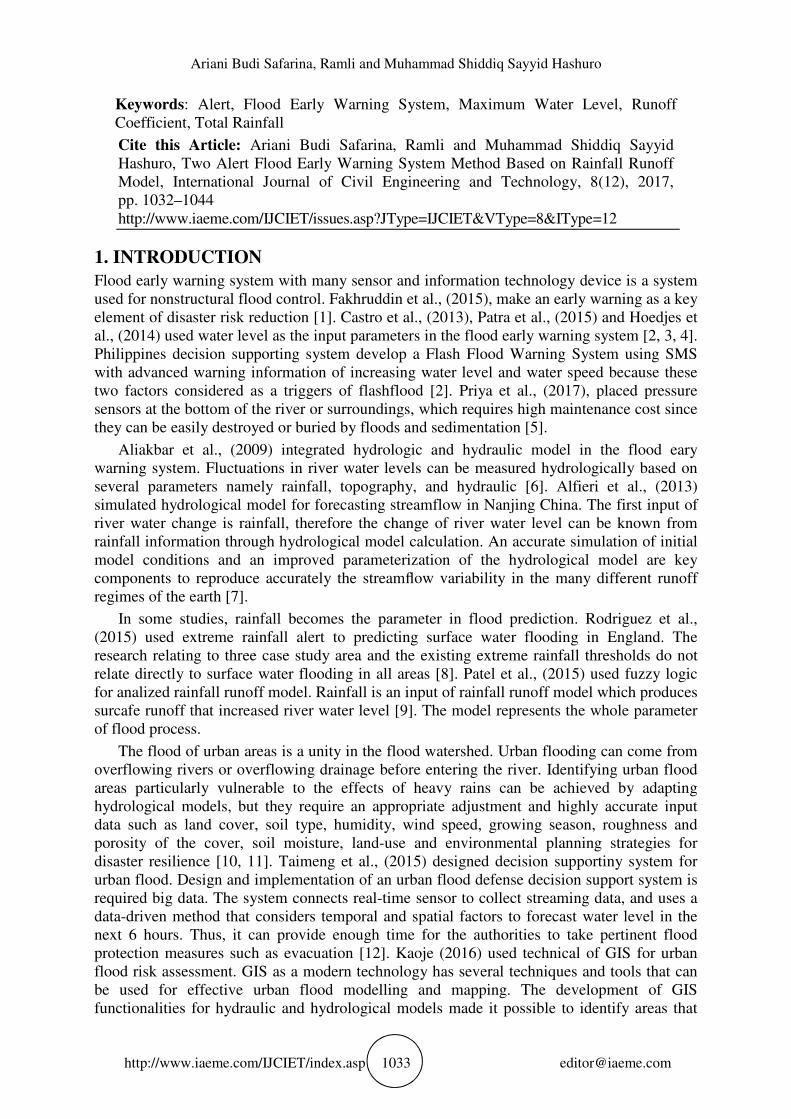
rainfall threshold. The area of this study is located in Cimahi river watershed, with the area of
72.2 km2, including three regency cities namely Cimahi city, Bandung regency and west
Bandung regency. Cimahi river is the largest river in cimahi city with the main river is 30.6
km length. Cimahi city consists of three subdistricts of North Cimahi, Central Cimahi, and
South Cimahi with an total area of 40.25 km2. Intersection map of Cimahi watershed and
Cimahi city is shown in Figure 1.
Figure 1 Intersection Map of Cimahi Watershed and Cimahi City
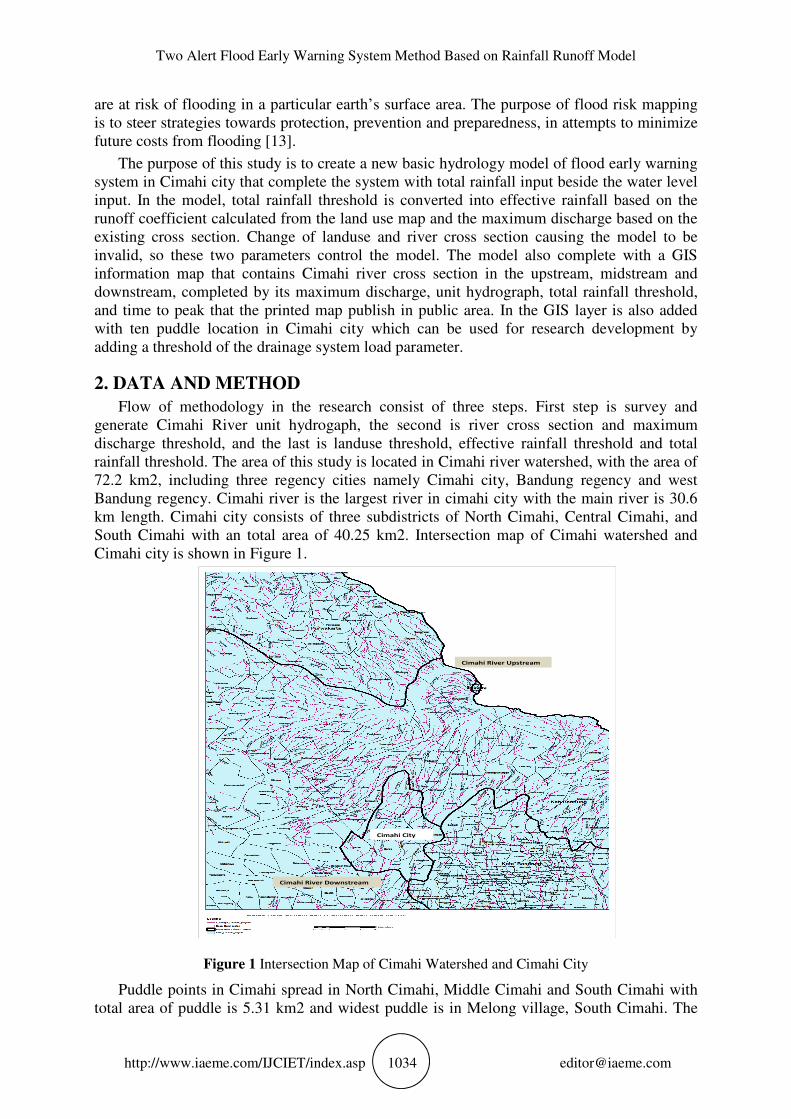
Puddle points in Cimahi spread in North Cimahi, Middle Cimahi and South Cimahi with
total area of puddle is 5.31 km2 and widest puddle is in Melong village, South Cimahi. The
Cimahi City
Cimahi River Upstream
Cimahi River Downstream
Ariani Budi Safarina, Ramli and Muhammad Shiddiq Sayyid Hashuro
http://www.iaeme.com/IJCIET/index.asp 1035 [email protected]
average puddle occurred for 2 hours with an average puddle height of 0.8 m, so that the total
inundation volume that cannot be accommodated by the drainage channel is 4.3 million cubic
meters. Map of subdistrict Cimahi and many puddle points is shown in Figure 2.
Figure 2 Subdistrict of Cimahi and Puddle Location
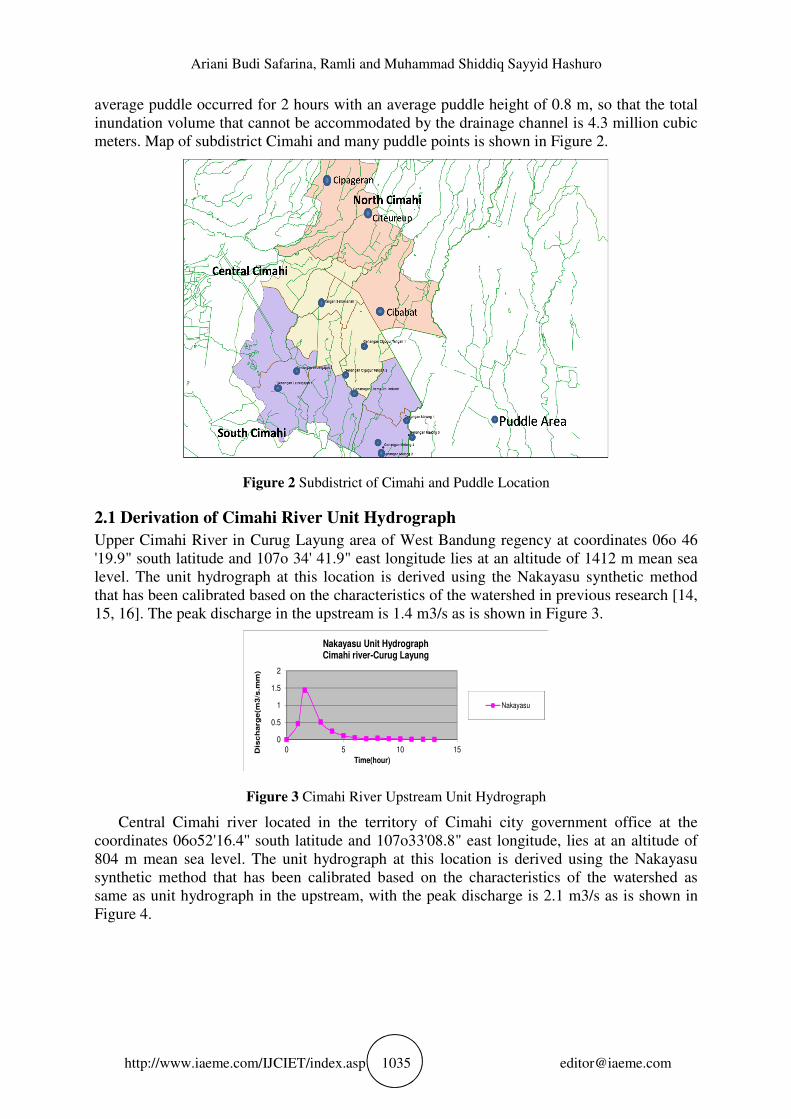
2.1 Derivation of Cimahi River Unit Hydrograph
Upper Cimahi River in Curug Layung area of West Bandung regency at coordinates 06o 46
'19.9" south latitude and 107o 34' 41.9" east longitude lies at an altitude of 1412 m mean sea
level. The unit hydrograph at this location is derived using the Nakayasu synthetic method
that has been calibrated based on the characteristics of the watershed in previous research [14,
15, 16]. The peak discharge in the upstream is 1.4 m3/s as is shown in Figure 3.
Figure 3 Cimahi River Upstream Unit Hydrograph
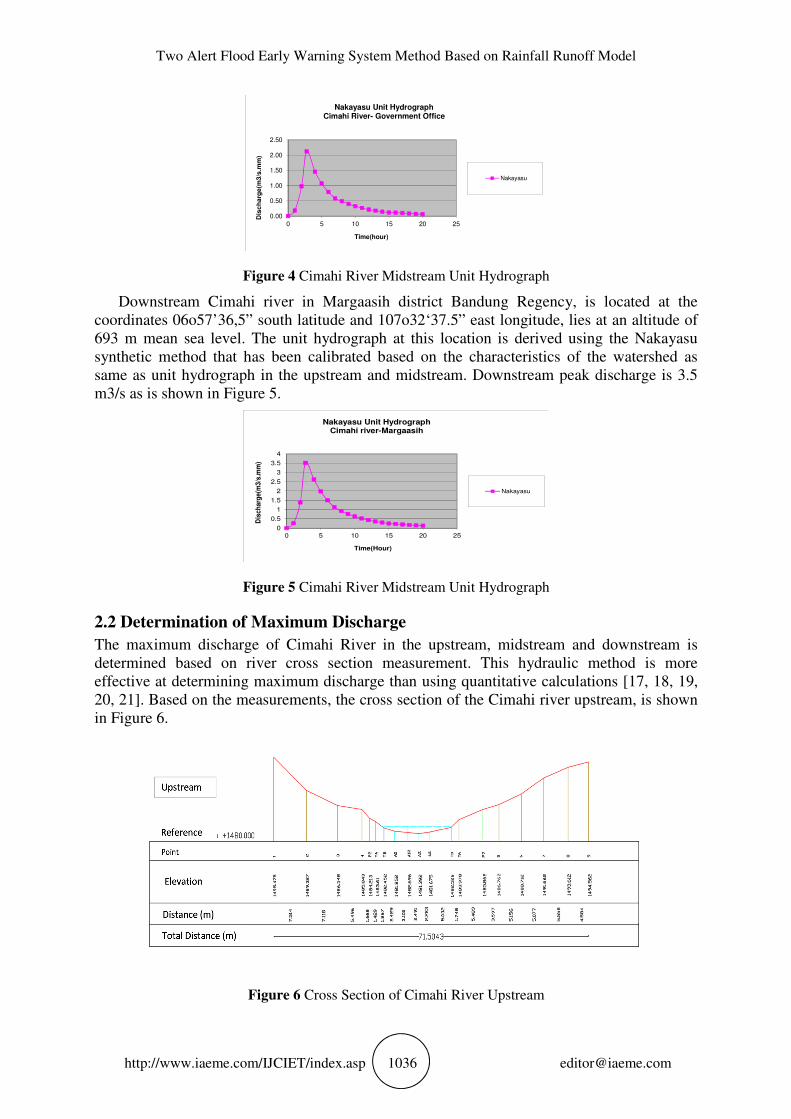
Central Cimahi river located in the territory of Cimahi city government office at the
coordinates 06o52'16.4'' south latitude and 107o33'08.8" east longitude, lies at an altitude of
804 m mean sea level. The unit hydrograph at this location is derived using the Nakayasu
synthetic method that has been calibrated based on the characteristics of the watershed as
same as unit hydrograph in the upstream, with the peak discharge is 2.1 m3/s as is shown in
Figure 4.
0
0.5
1
1.5
2
0 5 10 15Dis
ch
arg
e(m
3/s
.mm
)
Time(hour)
Nakayasu Unit HydrographCimahi river-Curug Layung
Nakayasu
Two Alert Flood Early Warning System Method Based on Rainfall Runoff Model
http://www.iaeme.com/IJCIET/index.asp 1036 [email protected]
Figure 4 Cimahi River Midstream Unit Hydrograph
Downstream Cimahi river in Margaasih district Bandung Regency, is located at the
coordinates 06o57’36,5” south latitude and 107o32‘37.5” east longitude, lies at an altitude of
693 m mean sea level. The unit hydrograph at this location is derived using the Nakayasu
synthetic method that has been calibrated based on the characteristics of the watershed as
same as unit hydrograph in the upstream and midstream. Downstream peak discharge is 3.5
m3/s as is shown in Figure 5.
Figure 5 Cimahi River Midstream Unit Hydrograph
2.2 Determination of Maximum Discharge
The maximum discharge of Cimahi River in the upstream, midstream and downstream is
determined based on river cross section measurement. This hydraulic method is more
effective at determining maximum discharge than using quantitative calculations [17, 18, 19,
20, 21]. Based on the measurements, the cross section of the Cimahi river upstream, is shown
in Figure 6.
Figure 6 Cross Section of Cimahi River Upstream
0.00
0.50
1.00
1.50
2.00
2.50
0 5 10 15 20 25
Dis
ch
arg
e(m
3/s
.mm
)
Time(hour)
Nakayasu Unit HydrographCimahi River- Government Office
Nakayasu
0
0.5
1
1.5
2
2.5
3
3.5
4
0 5 10 15 20 25
Dis
ch
arg
e(m
3/s
.mm
)
Time(Hour)
Nakayasu Unit HydrographCimahi river-Margaasih
Nakayasu
Ariani Budi Safarina, Ramli and Muhammad Shiddiq Sayyid Hashuro
http://www.iaeme.com/IJCIET/index.asp 1037 [email protected]
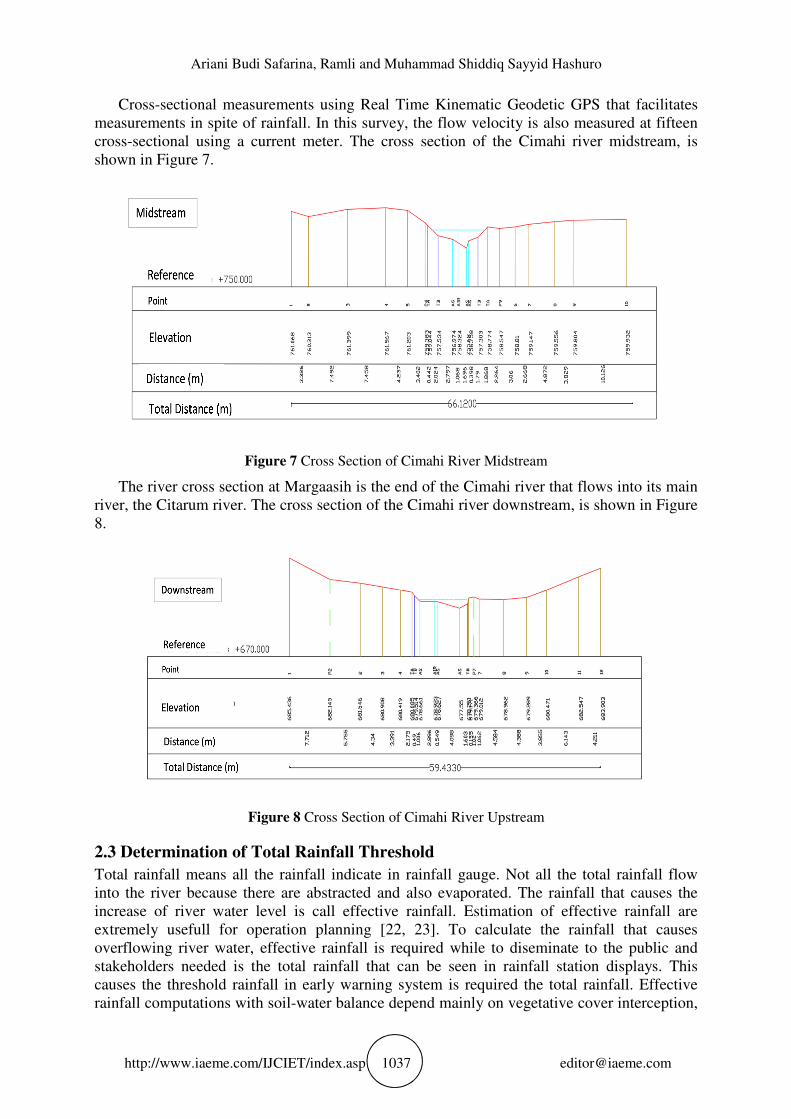
Cross-sectional measurements using Real Time Kinematic Geodetic GPS that facilitates
measurements in spite of rainfall. In this survey, the flow velocity is also measured at fifteen
cross-sectional using a current meter. The cross section of the Cimahi river midstream, is
shown in Figure 7.
Figure 7 Cross Section of Cimahi River Midstream
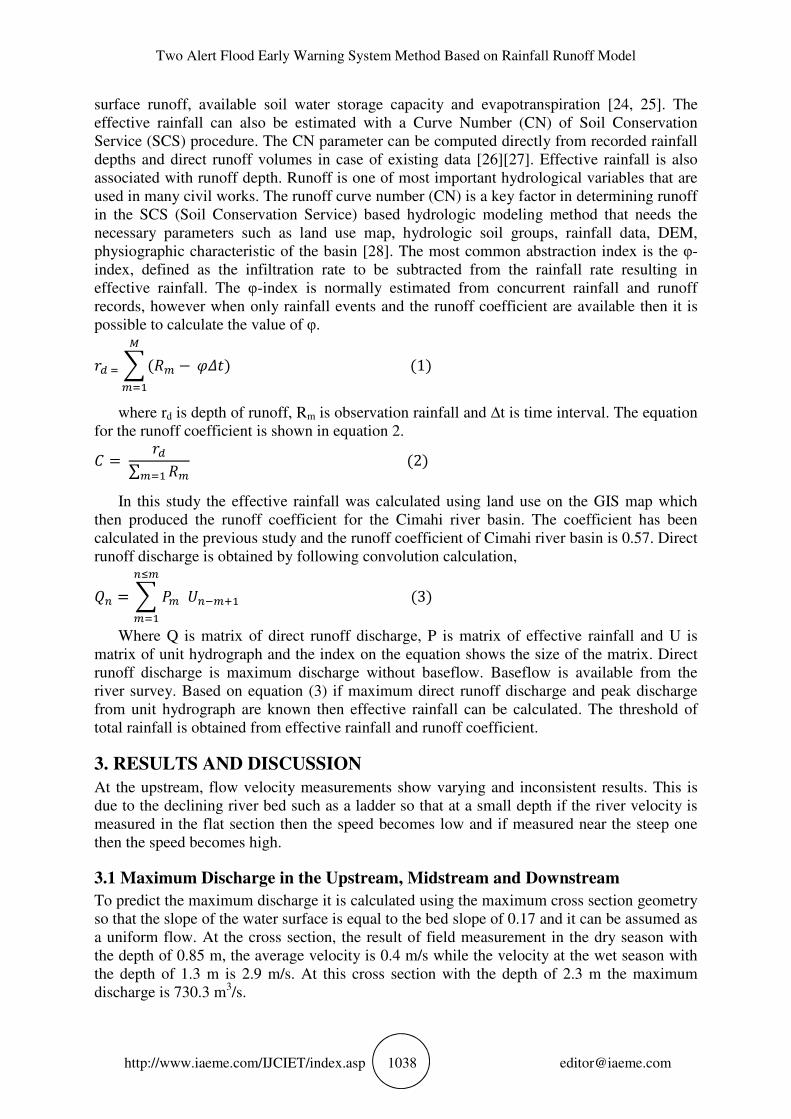
The river cross section at Margaasih is the end of the Cimahi river that flows into its main
river, the Citarum river. The cross section of the Cimahi river downstream, is shown in Figure
8.
Figure 8 Cross Section of Cimahi River Upstream
2.3 Determination of Total Rainfall Threshold
Total rainfall means all the rainfall indicate in rainfall gauge. Not all the total rainfall flow
into the river because there are abstracted and also evaporated. The rainfall that causes the
increase of river water level is call effective rainfall. Estimation of effective rainfall are
extremely usefull for operation planning [22, 23]. To calculate the rainfall that causes
overflowing river water, effective rainfall is required while to diseminate to the public and
stakeholders needed is the total rainfall that can be seen in rainfall station displays. This
causes the threshold rainfall in early warning system is required the total rainfall. Effective
rainfall computations with soil-water balance depend mainly on vegetative cover interception,
Two Alert Flood Early Warning System Method Based on Rainfall Runoff Model
http://www.iaeme.com/IJCIET/index.asp 1038 [email protected]
surface runoff, available soil water storage capacity and evapotranspiration [24, 25]. The
effective rainfall can also be estimated with a Curve Number (CN) of Soil Conservation
Service (SCS) procedure. The CN parameter can be computed directly from recorded rainfall
depths and direct runoff volumes in case of existing data [26][27]. Effective rainfall is also
associated with runoff depth. Runoff is one of most important hydrological variables that are
used in many civil works. The runoff curve number (CN) is a key factor in determining runoff
in the SCS (Soil Conservation Service) based hydrologic modeling method that needs the
necessary parameters such as land use map, hydrologic soil groups, rainfall data, DEM,
physiographic characteristic of the basin [28]. The most common abstraction index is the φ-
index, defined as the infiltration rate to be subtracted from the rainfall rate resulting in
effective rainfall. The φ-index is normally estimated from concurrent rainfall and runoff
records, however when only rainfall events and the runoff coefficient are available then it is
possible to calculate the value of φ.
�� � � (�� −
��� � �) (1)
where rd is depth of runoff, Rm is observation rainfall and ∆t is time interval. The equation
for the runoff coefficient is shown in equation 2.
� = ��∑ �����
(2)
In this study the effective rainfall was calculated using land use on the GIS map which
then produced the runoff coefficient for the Cimahi river basin. The coefficient has been
calculated in the previous study and the runoff coefficient of Cimahi river basin is 0.57. Direct
runoff discharge is obtained by following convolution calculation,
�� = � �� ������ ���
��� (3)
Where Q is matrix of direct runoff discharge, P is matrix of effective rainfall and U is
matrix of unit hydrograph and the index on the equation shows the size of the matrix. Direct
runoff discharge is maximum discharge without baseflow. Baseflow is available from the
river survey. Based on equation (3) if maximum direct runoff discharge and peak discharge
from unit hydrograph are known then effective rainfall can be calculated. The threshold of
total rainfall is obtained from effective rainfall and runoff coefficient.
3. RESULTS AND DISCUSSION
At the upstream, flow velocity measurements show varying and inconsistent results. This is
due to the declining river bed such as a ladder so that at a small depth if the river velocity is
measured in the flat section then the speed becomes low and if measured near the steep one
then the speed becomes high.
3.1 Maximum Discharge in the Upstream, Midstream and Downstream
To predict the maximum discharge it is calculated using the maximum cross section geometry
so that the slope of the water surface is equal to the bed slope of 0.17 and it can be assumed as
a uniform flow. At the cross section, the result of field measurement in the dry season with
the depth of 0.85 m, the average velocity is 0.4 m/s while the velocity at the wet season with
the depth of 1.3 m is 2.9 m/s. At this cross section with the depth of 2.3 m the maximum
discharge is 730.3 m3/s.
Ariani Budi Safarina, Ramli and Muhammad Shiddiq Sayyid Hashuro
http://www.iaeme.com/IJCIET/index.asp 1039 [email protected]
The river cross section at Cimahi office Government, is not as steep as in the upstream.
Field measurement in the dry season with the depth of 0.4 m, the average velocity is 0.3 m / s
while the velocity at the wet season with the depth of 1.03 m is 2.9 m/s. At this cross section
predicted maximum discharge at the depth of 1.8 m is 95.2 m3/s. The discharge is calculated
using the maximum cross section geometry so that the slope of the water surface is equal to
the bed slope of 0.101 and it can be assumed as a uniform flow.
The river cross section at Margaasih has a bed slope of 0.09. Field measurement in the dry
season with the depth of 0.52 m, the average velocity is 1.1 m/s. Velocity at the wet season
with the depth of 1.3 m is 2.9 m/s. At this cross section with the maximum depth of 2.53 m
the maximum discharge is 59.4 m3/s. The discharge is calculated using the maximum cross
section geometry so that the slope of the water surface is equal to the bed slope and it can be
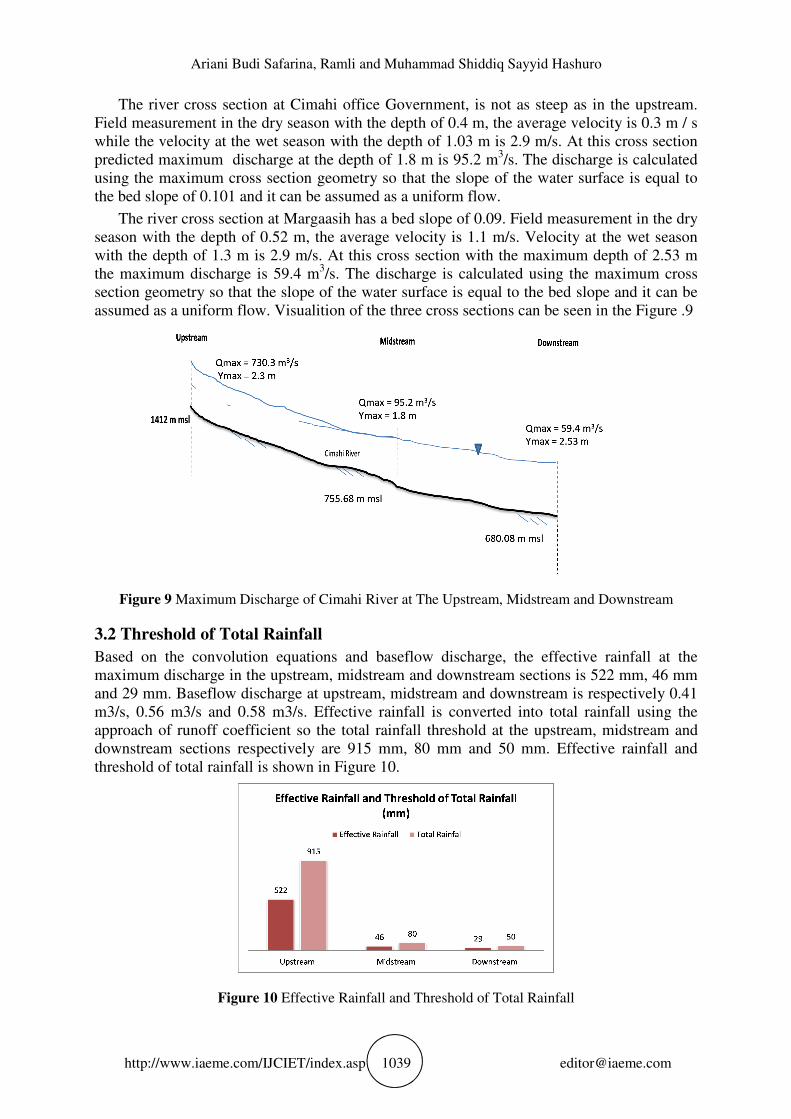
assumed as a uniform flow. Visualition of the three cross sections can be seen in the Figure .9
Figure 9 Maximum Discharge of Cimahi River at The Upstream, Midstream and Downstream
3.2 Threshold of Total Rainfall
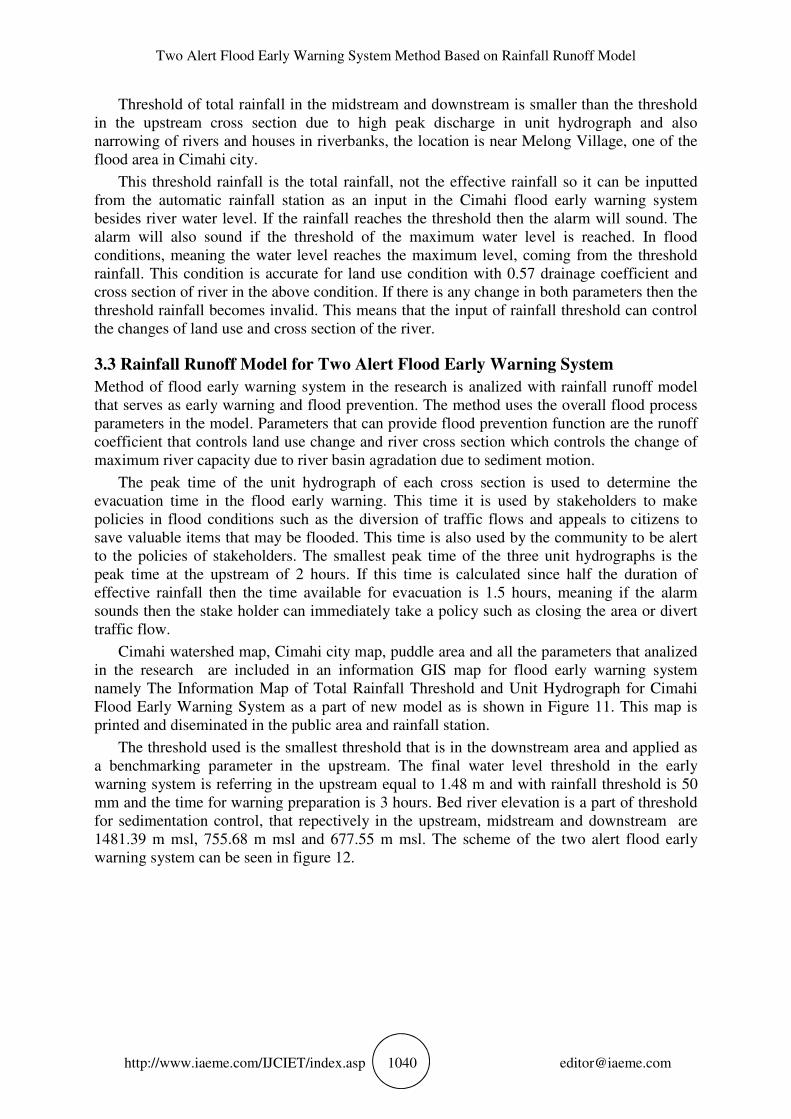
Based on the convolution equations and baseflow discharge, the effective rainfall at the
maximum discharge in the upstream, midstream and downstream sections is 522 mm, 46 mm
and 29 mm. Baseflow discharge at upstream, midstream and downstream is respectively 0.41
m3/s, 0.56 m3/s and 0.58 m3/s. Effective rainfall is converted into total rainfall using the
approach of runoff coefficient so the total rainfall threshold at the upstream, midstream and
downstream sections respectively are 915 mm, 80 mm and 50 mm. Effective rainfall and
threshold of total rainfall is shown in Figure 10.
Figure 10 Effective Rainfall and Threshold of Total Rainfall
Two Alert Flood Early Warning System Method Based on Rainfall Runoff Model
http://www.iaeme.com/IJCIET/index.asp 1040 [email protected]
Threshold of total rainfall in the midstream and downstream is smaller than the threshold
in the upstream cross section due to high peak discharge in unit hydrograph and also
narrowing of rivers and houses in riverbanks, the location is near Melong Village, one of the
flood area in Cimahi city.
This threshold rainfall is the total rainfall, not the effective rainfall so it can be inputted
from the automatic rainfall station as an input in the Cimahi flood early warning system
besides river water level. If the rainfall reaches the threshold then the alarm will sound. The
alarm will also sound if the threshold of the maximum water level is reached. In flood
conditions, meaning the water level reaches the maximum level, coming from the threshold
rainfall. This condition is accurate for land use condition with 0.57 drainage coefficient and
cross section of river in the above condition. If there is any change in both parameters then the
threshold rainfall becomes invalid. This means that the input of rainfall threshold can control
the changes of land use and cross section of the river.
3.3 Rainfall Runoff Model for Two Alert Flood Early Warning System
Method of flood early warning system in the research is analized with rainfall runoff model
that serves as early warning and flood prevention. The method uses the overall flood process
parameters in the model. Parameters that can provide flood prevention function are the runoff
coefficient that controls land use change and river cross section which controls the change of
maximum river capacity due to river basin agradation due to sediment motion.
The peak time of the unit hydrograph of each cross section is used to determine the
evacuation time in the flood early warning. This time it is used by stakeholders to make
policies in flood conditions such as the diversion of traffic flows and appeals to citizens to
save valuable items that may be flooded. This time is also used by the community to be alert
to the policies of stakeholders. The smallest peak time of the three unit hydrographs is the
peak time at the upstream of 2 hours. If this time is calculated since half the duration of
effective rainfall then the time available for evacuation is 1.5 hours, meaning if the alarm
sounds then the stake holder can immediately take a policy such as closing the area or divert
traffic flow.
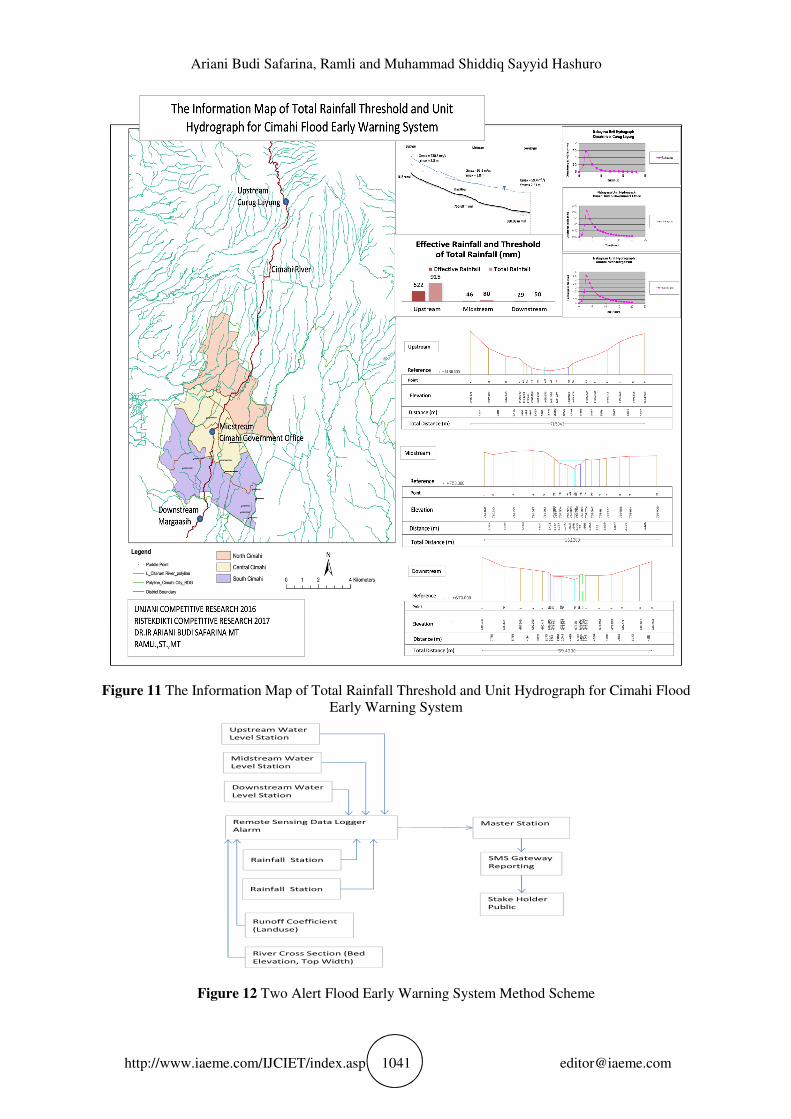
Cimahi watershed map, Cimahi city map, puddle area and all the parameters that analized
in the research are included in an information GIS map for flood early warning system
namely The Information Map of Total Rainfall Threshold and Unit Hydrograph for Cimahi
Flood Early Warning System as a part of new model as is shown in Figure 11. This map is
printed and diseminated in the public area and rainfall station.
The threshold used is the smallest threshold that is in the downstream area and applied as
a benchmarking parameter in the upstream. The final water level threshold in the early
warning system is referring in the upstream equal to 1.48 m and with rainfall threshold is 50
mm and the time for warning preparation is 3 hours. Bed river elevation is a part of threshold
for sedimentation control, that repectively in the upstream, midstream and downstream are
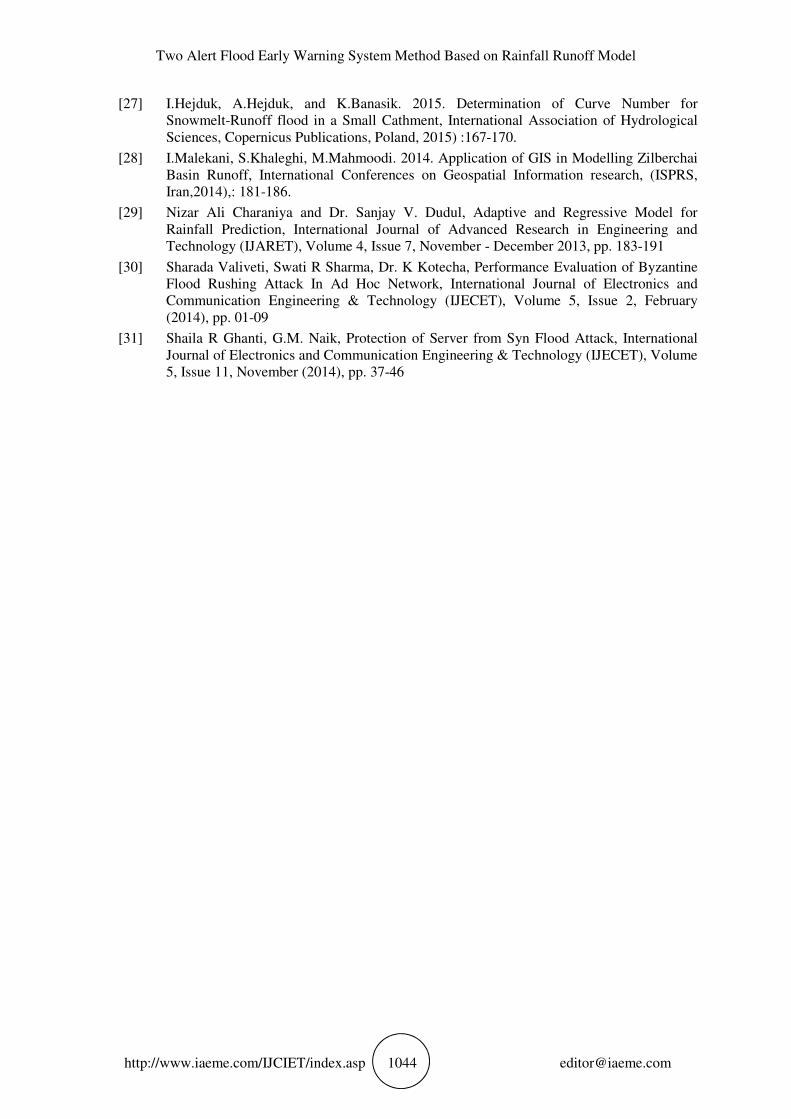
1481.39 m msl, 755.68 m msl and 677.55 m msl. The scheme of the two alert flood early
warning system can be seen in figure 12.
Ariani Budi Safarina, Ramli and Muhammad Shiddiq Sayyid Hashuro
http://www.iaeme.com/IJCIET/index.asp 1041 [email protected]
Figure 11 The Information Map of Total Rainfall Threshold and Unit Hydrograph for Cimahi Flood
Early Warning System
Figure 12 Two Alert Flood Early Warning System Method Scheme
Upstream Water
Level Station
Midstream Water
Level Station
Downstream Water
Level Station
Rainfall Station
Rainfall Station
Remote Sensing Data Logger
AlarmMaster Station
SMS Gateway
Reporting
Stake Holder
Public
Runoff Coefficient
(Landuse)
River Cross Section (Bed
Elevation, Top Width)

Two Alert Flood Early Warning System Method Based on Rainfall Runoff Model
http://www.iaeme.com/IJCIET/index.asp 1042 [email protected]
4. CONCLUSION
Two alert flood early warning system have been developed in order to provide a system that is
resistant to sedimentation and has a preventive function against flood by adding threshold
parameters ie threshold rainfall. Threshold rainfall is controlled by land use conditions
through runoff coefficient and cross section of river through maximum discharge.
Contribution of these parameters would improve the system to be more accurate because the
rainfall is initial process in rising river water level so the system is controlled by the whole
flood process in a rainfall runoff model.
ACKNOWLEDGEMENTS
This research is fully supported by Ristekdikti Competitive Research, SP DIPA-
042.06.1.401516/2017 and UNJANI Competitive Research SKEP/133/UNJANI/VII/2017.
The authors fully acknowledged Ministry of Research Technology Higher Education
(Ristekdikti) and Jenderal Achmad Yani University for the approved fund which makes this
important research viable and effective.
REFERENCES
[1] S.H.M. Fakhruddin Akiyuki Kawasaki and Mukand S.Babel. 2015. Community
Responsisto Flood Early Warning System: Case Study in Kaijuri Union, Bangladesh,
International Journal of Risk Reduction. 14(4): 1-9.
[2] Joel T de Castro, Gabriel M Salistre, Jr.Young-Cheol Byun and Bobby D Gerardo. 2013.
Flash Flood Prediction Model Based on Multiple Regression Analysis for Decision
Support Sstem. Word Congress on Engineering and Computer Science Proceedings Vol II
2013. San Fransisco, USA March 2013. 23-25
[3] Jagadish Prasad Patra, Rakesh Kumar, Pankaj Mani. 2015, Combined Flufial and Plufial
Flood Inundation Modelling for a Project Site. International Conference ICETEST 2015.
India December 2015. 93-100
[4] Joost C.B Hoedjes, AndreKooiman, Ben H.P.Maathuis, Mohammed.Y.Said,, Robert
Becht, Agnes Limo, Mark Mumo, Joseph Nduhiu-Mathenge, Ayub Shaka and Bob Su.
2014: A Conceptual Flash Flood Early Warning System for Africa, Based on Terrestrial
Microwave Links and Flash Flood Guidance. International Journal of Geo-Information
3(2): 584-598.
[5] Priya Menon K, Kala L. 2017. A Review of Flood Monitoring: Design, Implementation
and Computational Modules. International Jornal of Innovative Research in Computer and
Communication Engineering. 5(2): 254-2359.
[6] Aliakbar Matkan, Alireza Shakiba, Hossain Pourali and Hamid Azari. 2009. Food Early
Warning With Integration of Hydrologic and Hydraulic Models, RS and GIS (Case study:
Madarsoo basin, Iran). World Applied Sciences Journal. 6(12) : 1698-1704.
[7] L.Alfieri, P.Burek, E.DutraB.Krzeminski, D.MuraroJ.Thielen and F.Pappenberger. 2013,
GIoFAS-Global Ensemble Streamflow Forecasting and Flood Early Warning. Journal
Hydrology and Earth System Sciences. 17: 1161-1175.
[8] S.Ochoa-Rodriguez, LP Wang, L Thraves, A. Johson and C.Onof 2015. Surface Water
Flood Warnings in England: overview, assessment and recommendations based on Survey
Responses and Workshps. Jornal of Flood Risk Management. 1:1-11.
[9] N.H Patel, T.M.V Suryanarayana. 2015. An Use of Fuzzy Logic for Development and
Analysis of Rainfall-Runoff Model International Journal of Modern Engineering
Research,. 4 (2): 1-8.

Ariani Budi Safarina, Ramli and Muhammad Shiddiq Sayyid Hashuro
http://www.iaeme.com/IJCIET/index.asp 1043 [email protected]
[10] Marzena Wicht and Katarzyna Osinska-Skotak. 2016. Identifying Urban Areas Prone to
Flash Floods Using GIS – Preliminary Results International Journal Hydrology and Earth
System Sciences. 1-22.
[11] Yu, Shou Su. 2016, Discourse, Strategy, and Practice of Urban Resilience Against
Flooding. Business and Management Studies. 2 (1): 73-8.
[12] Taimeng Yang, Guanlin Chen and Xinxin Sun. 2015. A Big Data-Based Urban Flood
DefenseDecision Support System. International Journal of Smart Home.9 (12) : 81-90.
[13] Ismail Usman Kaoje. 2016. Application of Geographical Information System Techniques
in Urban Flood Risk Assessment and Vulnerability Mapping, International Journal of
Scientific and Research Publications. 6 (6): 136-149
[14] Ariani Budi Safarina, Hang Tuah Salim, Iwan K Hadihardaja, M.Syahril.BK. 2011.
Clusterization of Synthetic Unit Hydrograph Methods Based on Watershed Characteristic.
International Journal of Civil and Environmental Engineering. 11(6): 76-85.
[15] Ariani Budi Safarina. 2012. Modified of Nakayasu Synthetic Unit Hydrograph Method for
Meso Scale Ungauge Watershed. International Journal of Engineering Research and
Application. 4(2): 649-654.
[16] Safarina Ariani Budi and Ramli. 2015, Cimahi River Benchmarking Flood Analysis Based
on Threshold of Total Rainfall. International Journal of Research in Engineering and
Technology. 4(4): 659-663.
[17] Ebrahim Nohani. 2015. Simulation and Estimation of Effective Discharge of Annual
Flood (Case Study: Jarahi River Khuzestan, Iran). International Journal of Technology
Enhancements and Emerging Engineering Research. 3(03): 48-51.
[18] Peter Lamovec, Kristof Ostir, Matijaz Mikos. 2012. Flash Floods and Peak Discharge
Estimation The Selska Sora RiverFlash Flood in September 2007, W Slovenia,.
Proceedings of Congress Interpraevent France, 201-210.
[19] G. Di Baldassarre and A.Mountanari. 2009. Uncertainty in River Discgarge Observations :
A Quantitative Analysis. International Journal Hydrology and Earth System Sciences. 3
:913-921.
[20] C.Comina, M.Lasagna, D.A.De Luca, and L.Sambuelli, Discharge 2013. Measurement
With Salt Dilution Method in Irrigation Canals: directsampling and geophysical controls,
International Journal Hydrology and Earth System Sciences (Authors Creative Common
Attribution 3.0 License, Italy, 2013):10036-10060.
[21] Giuliano Di Baldassarre and Pierluigi Claps, 2011. A Hydraulic Study on the
Applicability of Flood Rating Curve. Hydrology Research 42.1:10-19.
[22] S.S.Wane and M.B. Nagdeve. 2014 Estimation of Evapotranspiration and Effective
Rainfall Using CROPWAT. International Journal of Agricultural Engineering. 7(1): 23-
26.
[23] Shahzada Adnan, Azmat Hayat Khan,. 2011. Effective Rainfall for Irrigated
AgriculturePlains of Pakistan. Pakistan Journal of Meteorology. 6(11): 61-72.
[24] A.Vallet, Bertrand and J.Mudry, Effective 2013. Rainfall: A significant Parameter to
Improve Understanding of Deep-Seated rainfall triggering landslide- a simple
Computation Temperature Based Method Applied to Sechilience Unstable Slope (French
Alps), International Journal Hydrology and Earth System Sciences, (Authors Creative
Common Attribution 3.0 License, Italy, 2013), 8945-8991.
[25] Iman Meer and SheikhSaeed Ahmad. 2014. Determining Rainfall Variations and The
Effecton Vegetation Coverage (in rain fed/irrigated) Areas of Punjab Province, Pakistan.
Journal of Agriculture and Environmental Sciences. 3(1): 103-122.
[26] Sapountzis M, Stathis D. 2014. Relationship Between Rainfall and Runoff in The Stratoni
Region (N.Greece) After The Storm of 10th February 2010. Global Nest Journal. 16(2):
420-431.
Two Alert Flood Early Warning System Method Based on Rainfall Runoff Model
http://www.iaeme.com/IJCIET/index.asp 1044 [email protected]
[27] I.Hejduk, A.Hejduk, and K.Banasik. 2015. Determination of Curve Number for
Snowmelt-Runoff flood in a Small Cathment, International Association of Hydrological
Sciences, Copernicus Publications, Poland, 2015) :167-170.
[28] I.Malekani, S.Khaleghi, M.Mahmoodi. 2014. Application of GIS in Modelling Zilberchai
Basin Runoff, International Conferences on Geospatial Information research, (ISPRS,
Iran,2014),: 181-186.
[29] Nizar Ali Charaniya and Dr. Sanjay V. Dudul, Adaptive and Regressive Model for
Rainfall Prediction, International Journal of Advanced Research in Engineering and
Technology (IJARET), Volume 4, Issue 7, November - December 2013, pp. 183-191
[30] Sharada Valiveti, Swati R Sharma, Dr. K Kotecha, Performance Evaluation of Byzantine
Flood Rushing Attack In Ad Hoc Network, International Journal of Electronics and
Communication Engineering & Technology (IJECET), Volume 5, Issue 2, February
(2014), pp. 01-09
[31] Shaila R Ghanti, G.M. Naik, Protection of Server from Syn Flood Attack, International
Journal of Electronics and Communication Engineering & Technology (IJECET), Volume
5, Issue 11, November (2014), pp. 37-46