turning point training - newcastle university · web viewfor turningpoint 2008 and office 2007...
TRANSCRIPT

TurningPoint Student Response System User Manual
For TurningPoint 2008 and Office 2007
Carol Summerside
Quality in Learning and Teaching
Student and Academic Services
Newcastle University
SRS Training Manual
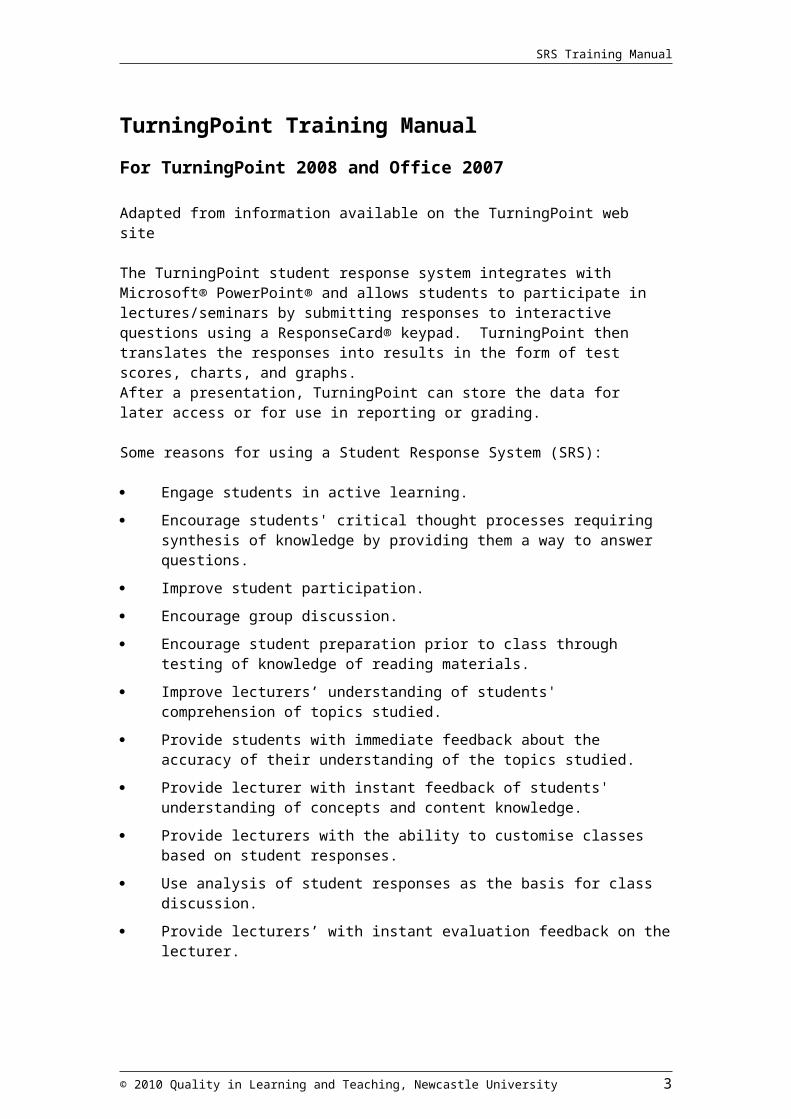
TurningPoint Training ManualFor TurningPoint 2008 and Office 2007
Adapted from information available on the TurningPoint web site
The TurningPoint student response system integrates with Microsoft® PowerPoint® and allows students to participate in lectures/seminars by submitting responses to interactive questions using a ResponseCard® keypad. TurningPoint then translates the responses into results in the form of test scores, charts, and graphs.After a presentation, TurningPoint can store the data for later access or for use in reporting or grading.
Some reasons for using a Student Response System (SRS):
Engage students in active learning.
Encourage students' critical thought processes requiring synthesis of knowledge by providing them a way to answer questions.
Improve student participation.
Encourage group discussion.
Encourage student preparation prior to class through testing of knowledge of reading materials.
Improve lecturers’ understanding of students' comprehension of topics studied.
Provide students with immediate feedback about the accuracy of their understanding of the topics studied.
Provide lecturer with instant feedback of students' understanding of concepts and content knowledge.
Provide lecturers with the ability to customise classes based on student responses.
Use analysis of student responses as the basis for class discussion.
Provide lecturers’ with instant evaluation feedback on the lecturer.
Important things to remember: Always open TurningPoint and not PowerPoint.
Test your session using the simulated data option.
Reset your session before each use.
Check the hardware - receiver and handsets.
Use the TurningPoint “Save” icon to save session results before you leave the teaching room to somewhere you can access e.g. memory stick or personal drive space.
© 2010 Quality in Learning and Teaching, Newcastle University 2
SRS Training Manual
Activities
Activity 1 – Opening TurningPoint.........................................................................4
Activity 2 – Create an Interactive TurningPoint Slide............................................6
Activity 3 – Adding a response counter or response table....................................8
Activity 4 – Assigning a correct answer(s) to a question.....................................11
Activity 5 – Allowing multiple answers to a question...........................................15
Activity 6 – Adding a countdown indicator...........................................................17
Activity 7 – Creating a demographic slide...........................................................19
Activity 8 – Testing the Session..........................................................................21
Activity 9 – Resetting Slides................................................................................22
Activity 10 - Setting up the receiver.....................................................................23
Activity 11 - Running the interactive presentation...............................................25
Activity 12 - Adding slides during a presentation session:..................................27
Activity 13 – Saving session results....................................................................29
Activity 14 – Creating reports..............................................................................30
Further Information and Contacts.........................................................................33
© 2010 Quality in Learning and Teaching, Newcastle University 3
SRS Training Manual
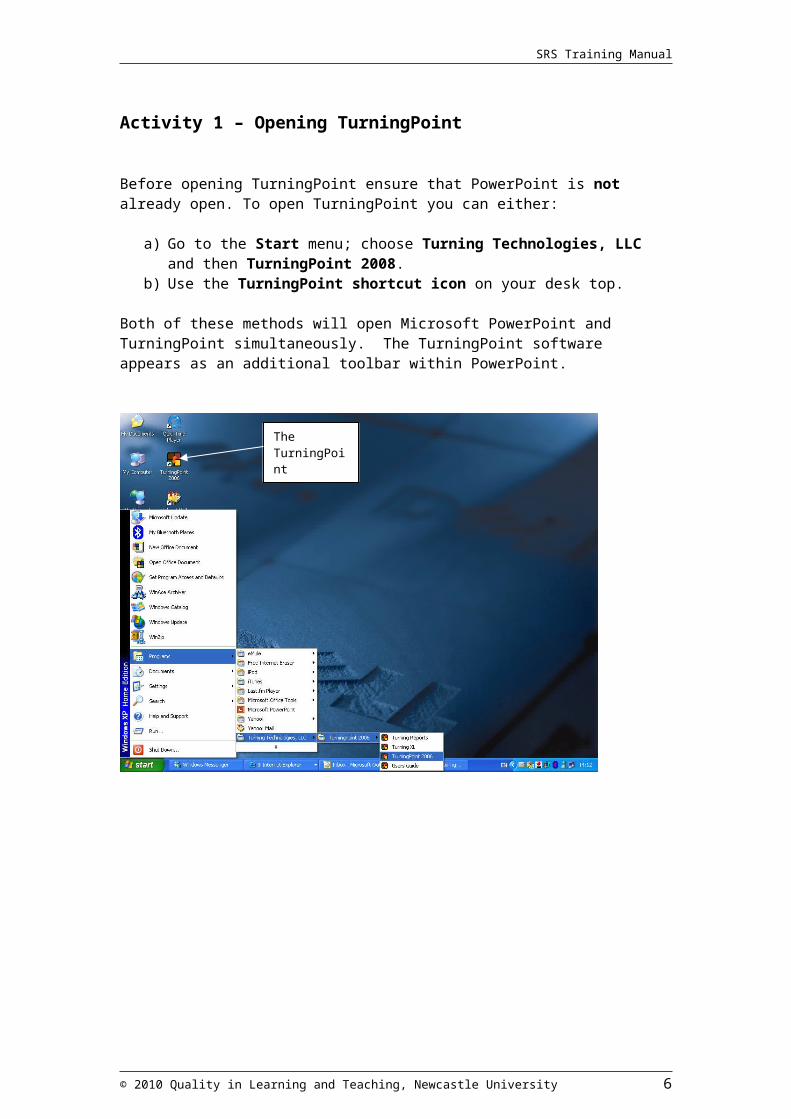
Activity 1 – Opening TurningPoint
Before opening TurningPoint ensure that PowerPoint is not already open. To open TurningPoint you can either:
a) Go to the Start menu; choose Turning Technologies, LLC and then TurningPoint 2008.
b) Use the TurningPoint shortcut icon on your desk top.
Both of these methods will open Microsoft PowerPoint and TurningPoint simultaneously. The TurningPoint software appears as an additional toolbar within PowerPoint.
© 2010 Quality in Learning and Teaching, Newcastle University 4
The TurningPoint shortcut icon
SRS Training Manual
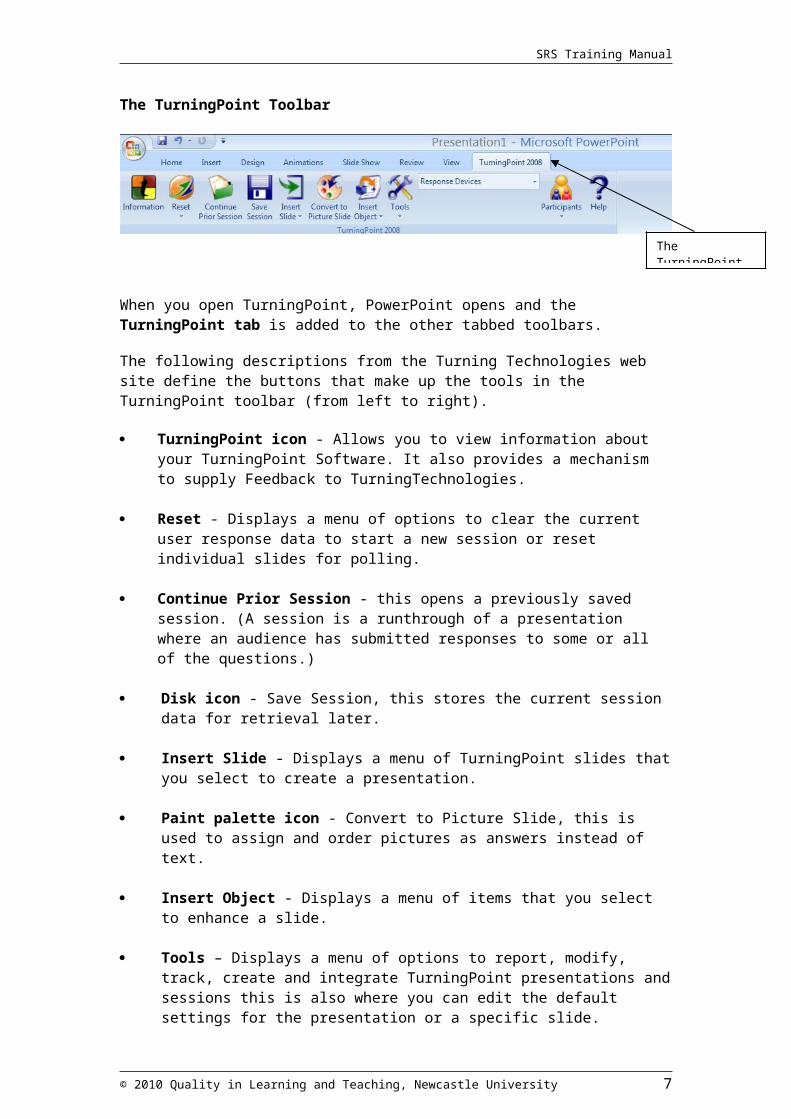
The TurningPoint Toolbar
When you open TurningPoint, PowerPoint opens and the TurningPoint tab is added to the other tabbed toolbars.
The following descriptions from the Turning Technologies web site define the buttons that make up the tools in the TurningPoint toolbar (from left to right).
TurningPoint icon - Allows you to view information about your TurningPoint Software. It also provides a mechanism to supply Feedback to TurningTechnologies.
Reset - Displays a menu of options to clear the current user response data to start a new session or reset individual slides for polling.
Continue Prior Session - this opens a previously saved session. (A session is a runthrough of a presentation where an audience has submitted responses to some or all of the questions.)
Disk icon - Save Session, this stores the current session data for retrieval later.
Insert Slide - Displays a menu of TurningPoint slides that you select to create a presentation.
Paint palette icon - Convert to Picture Slide, this is used to assign and order pictures as answers instead of text.
Insert Object - Displays a menu of items that you select to enhance a slide.
Tools – Displays a menu of options to report, modify, track, create and integrate TurningPoint presentations and sessions this is also where you can edit the default settings for the presentation or a specific slide.
Select Input Source – This drop down menu allows you to selects the type of response devices to be used with the presentation and defaults to Response Devices.
Participants - Provides options to be create, edit and delete Participant Lists.
Question mark icon - Opens the online help file.
© 2010 Quality in Learning and Teaching, Newcastle University 5
The TurningPoint toolbar
SRS Training Manual
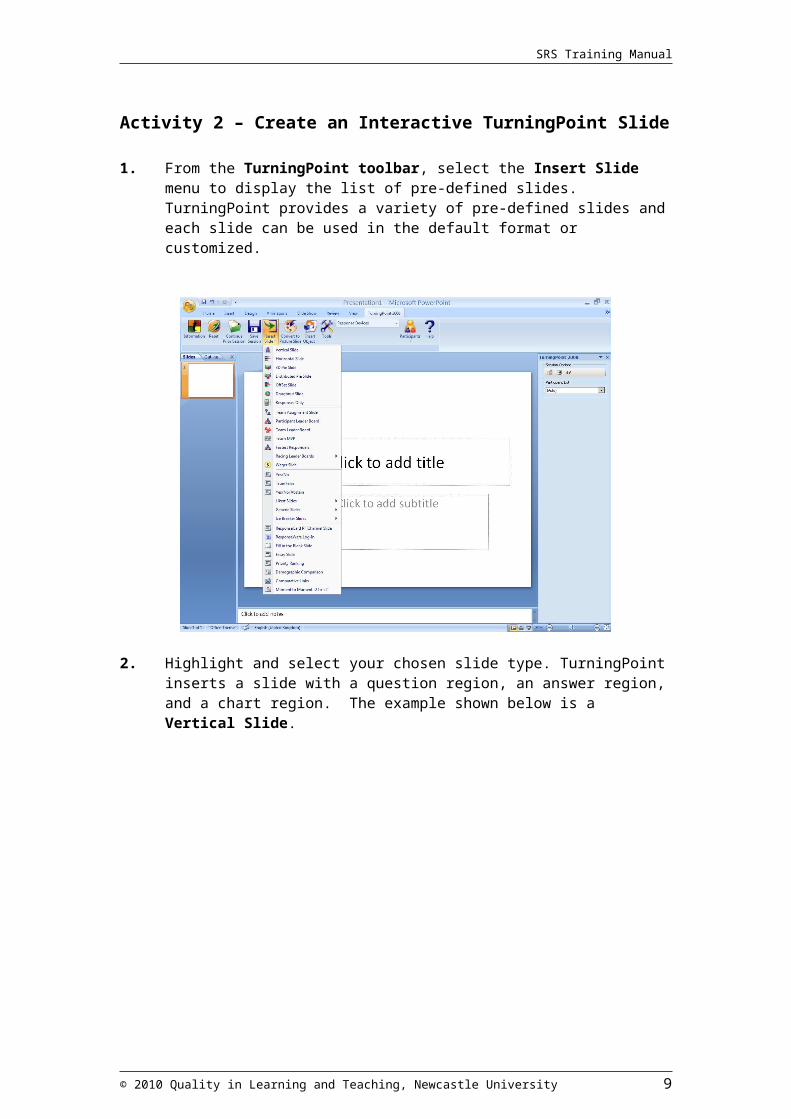
Activity 2 – Create an Interactive TurningPoint Slide
1. From the TurningPoint toolbar, select the Insert Slide menu to display the list of pre-defined slides. TurningPoint provides a variety of pre-defined slides and each slide can be used in the default format or customized.
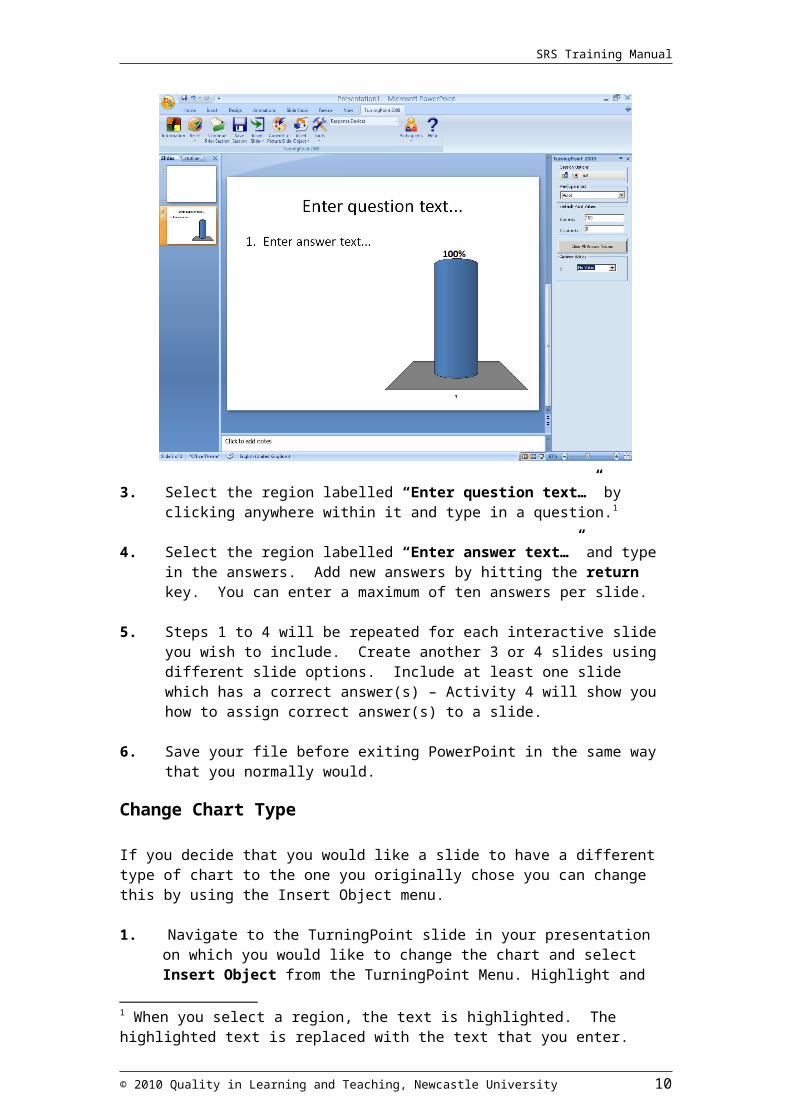
2. Highlight and select your chosen slide type. TurningPoint inserts a slide with a question region, an answer region, and a chart region. The example shown below is a Vertical Slide.
© 2010 Quality in Learning and Teaching, Newcastle University 6
SRS Training Manual
3. Select the region labelled “Enter question text…” by clicking anywhere within it and type in a question.1
4. Select the region labelled “Enter answer text…” and type in the answers. Add new answers by hitting the return key. You can enter a maximum of ten answers per slide.
5. Steps 1 to 4 will be repeated for each interactive slide you wish to include. Create another 3 or 4 slides using different slide options. Include at least one slide which has a correct answer(s) – Activity 4 will show you how to assign correct answer(s) to a slide.
6. Save your file before exiting PowerPoint in the same way that you normally would.
Change Chart Type
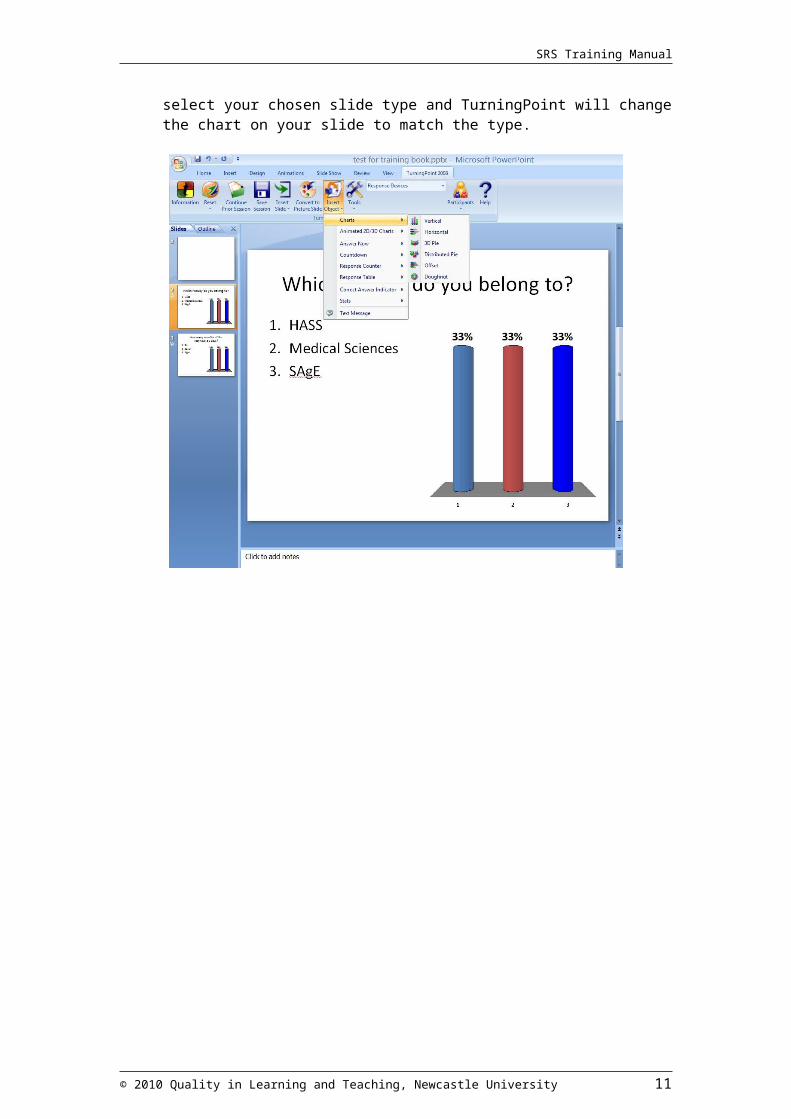
If you decide that you would like a slide to have a different type of chart to the one you originally chose you can change this by using the Insert Object menu.
1. Navigate to the TurningPoint slide in your presentation on which you would like to change the chart and select Insert Object from the TurningPoint Menu. Highlight and select your chosen slide type and TurningPoint will change the chart on your slide to match the type.
1 When you select a region, the text is highlighted. The highlighted text is replaced with the text that you enter.
© 2010 Quality in Learning and Teaching, Newcastle University 7
SRS Training Manual
Activity 3 – Adding a response counter or response table
A Response Counter is an object you can add to your slides which will keep a track of how many participants have submitted a response out of the total number of participants. A Response Counter appears during a presentation when polling opens and disappears when polling is closed.
To add a Response Counter:
1. Navigate to the slide in your presentation to which you would like to add a Response Counter.
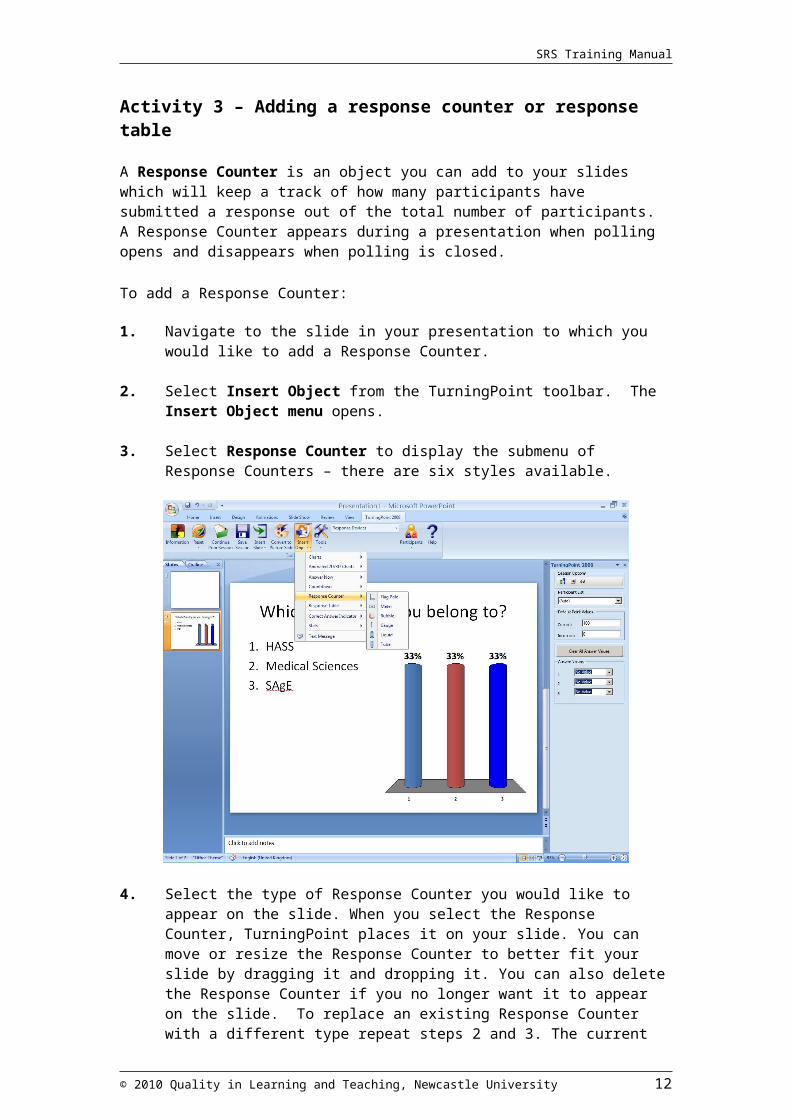
2. Select Insert Object from the TurningPoint toolbar. The Insert Object menu opens.
3. Select Response Counter to display the submenu of Response Counters – there are six styles available.
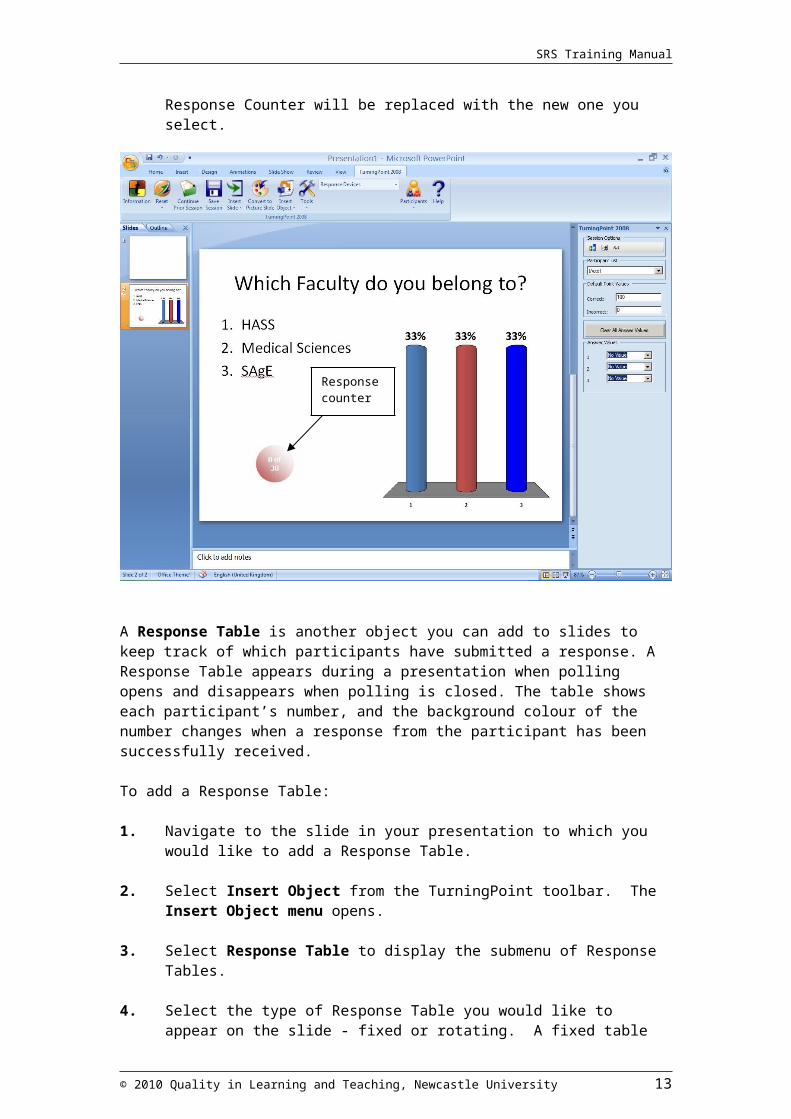
4. Select the type of Response Counter you would like to appear on the slide. When you select the Response Counter, TurningPoint places it on your slide. You can move or resize the Response Counter to better fit your slide by dragging it and dropping it. You can also delete the Response Counter if you no longer want it to appear on the slide. To replace an existing Response Counter with a different type repeat steps 2 and 3. The current Response Counter will be replaced with the new one you select.
© 2010 Quality in Learning and Teaching, Newcastle University 8
SRS Training Manual
A Response Table is another object you can add to slides to keep track of which participants have submitted a response. A Response Table appears during a presentation when polling opens and disappears when polling is closed. The table shows each participant’s number, and the background colour of the number changes when a response from the participant has been successfully received.
To add a Response Table:
1. Navigate to the slide in your presentation to which you would like to add a Response Table.
2. Select Insert Object from the TurningPoint toolbar. The Insert Object menu opens.
3. Select Response Table to display the submenu of Response Tables.
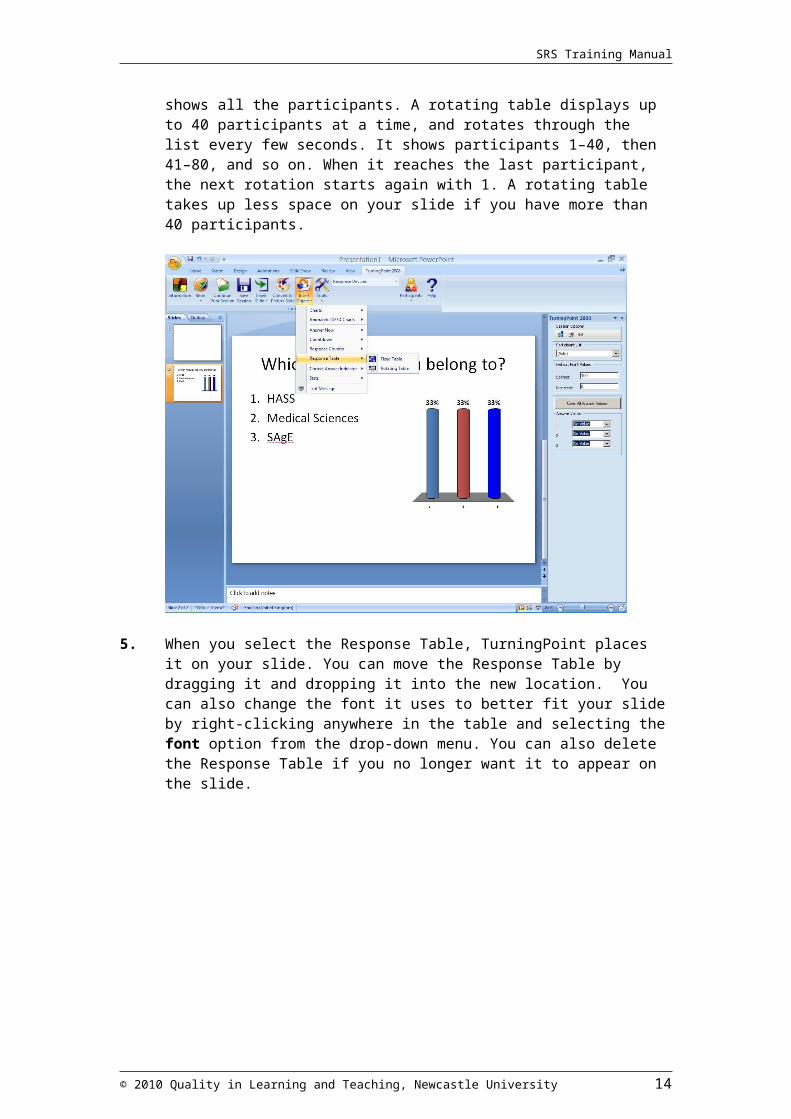
4. Select the type of Response Table you would like to appear on the slide - fixed or rotating. A fixed table shows all the participants. A rotating table displays up to 40 participants at a time, and rotates through the list every few seconds. It shows participants 1–40, then 41–80, and so on. When it reaches the last participant, the next rotation starts again with 1. A rotating table takes up less space on your slide if you have more than 40 participants.
© 2010 Quality in Learning and Teaching, Newcastle University 9
Response counter
SRS Training Manual
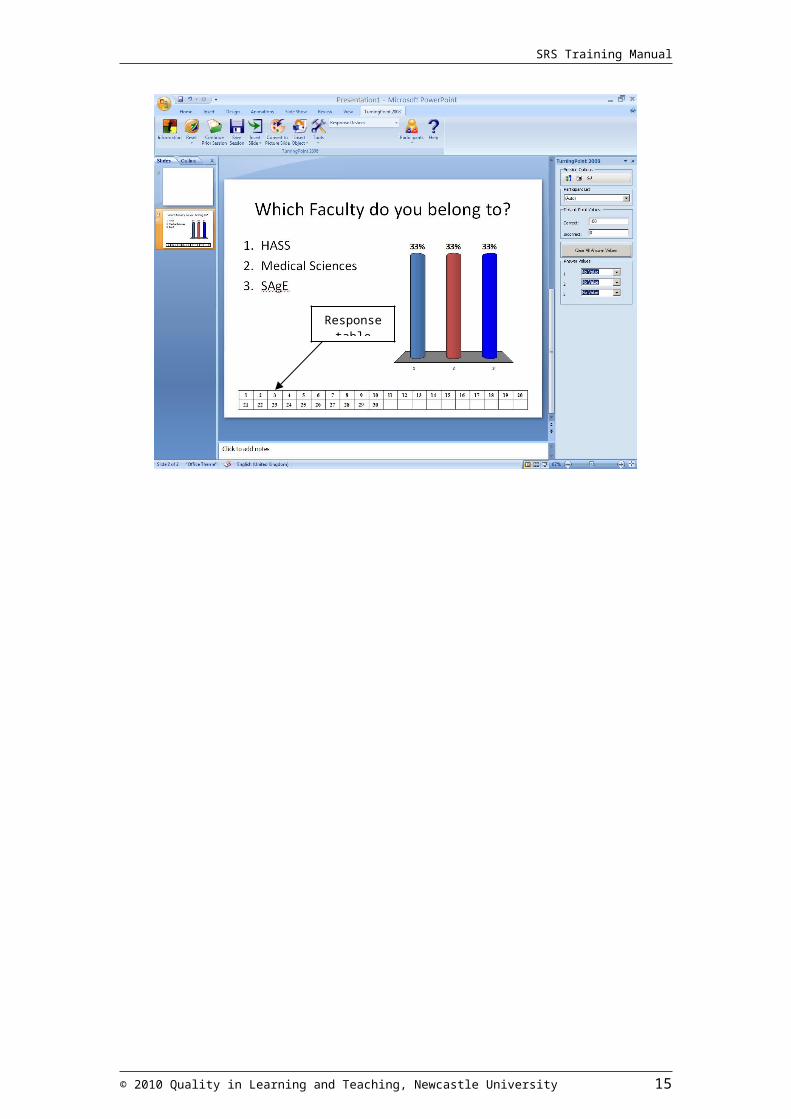
5. When you select the Response Table, TurningPoint places it on your slide. You can move the Response Table by dragging it and dropping it into the new location. You can also change the font it uses to better fit your slide by right-clicking anywhere in the table and selecting the font option from the drop-down menu. You can also delete the Response Table if you no longer want it to appear on the slide.
© 2010 Quality in Learning and Teaching, Newcastle University 10
Response table
SRS Training Manual
Activity 4 – Assigning a correct answer(s) to a question
You can specify whether answers in your TurningPoint slides should be considered correct or incorrect. By setting answer values, you can show the correct answer after polling with a Correct Answer indicator.There are two ways to assign correct answers to a question – either using the Settings Window or using the TurningPoint Task Pane.
Assigning a correct answer using the Settings Window:
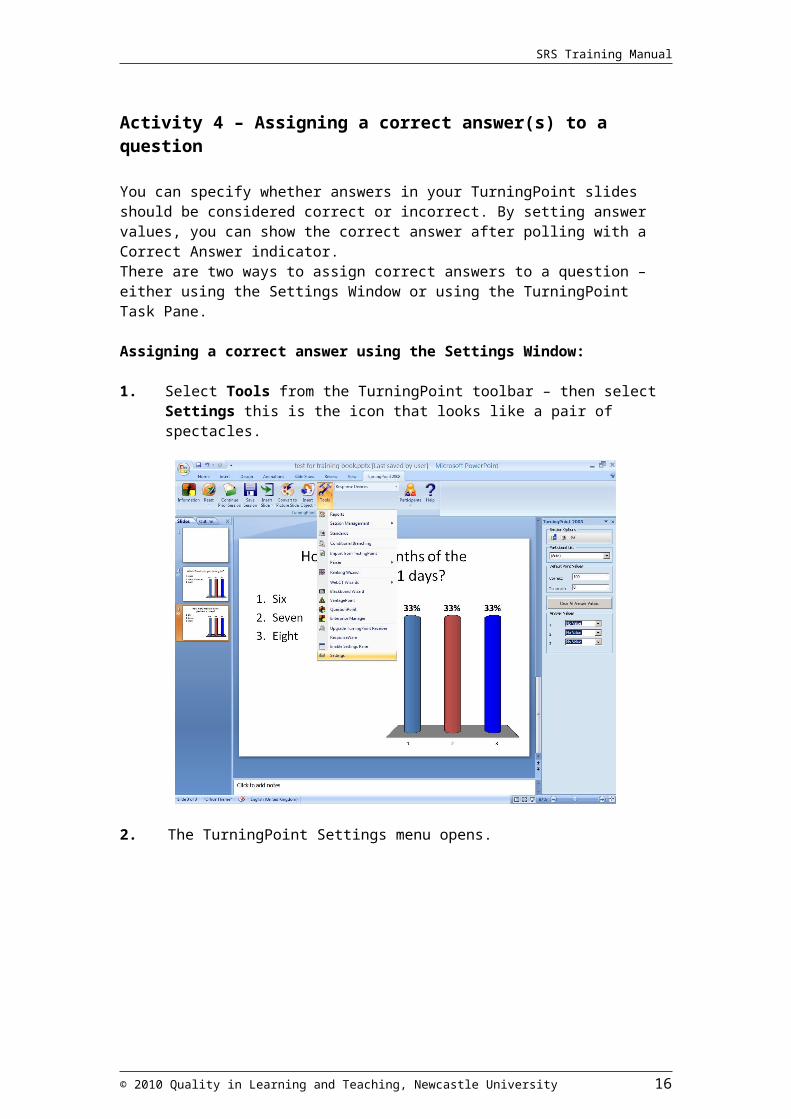
1. Select Tools from the TurningPoint toolbar – then select Settings this is the icon that looks like a pair of spectacles.
2. The TurningPoint Settings menu opens.
© 2010 Quality in Learning and Teaching, Newcastle University 11
SRS Training Manual
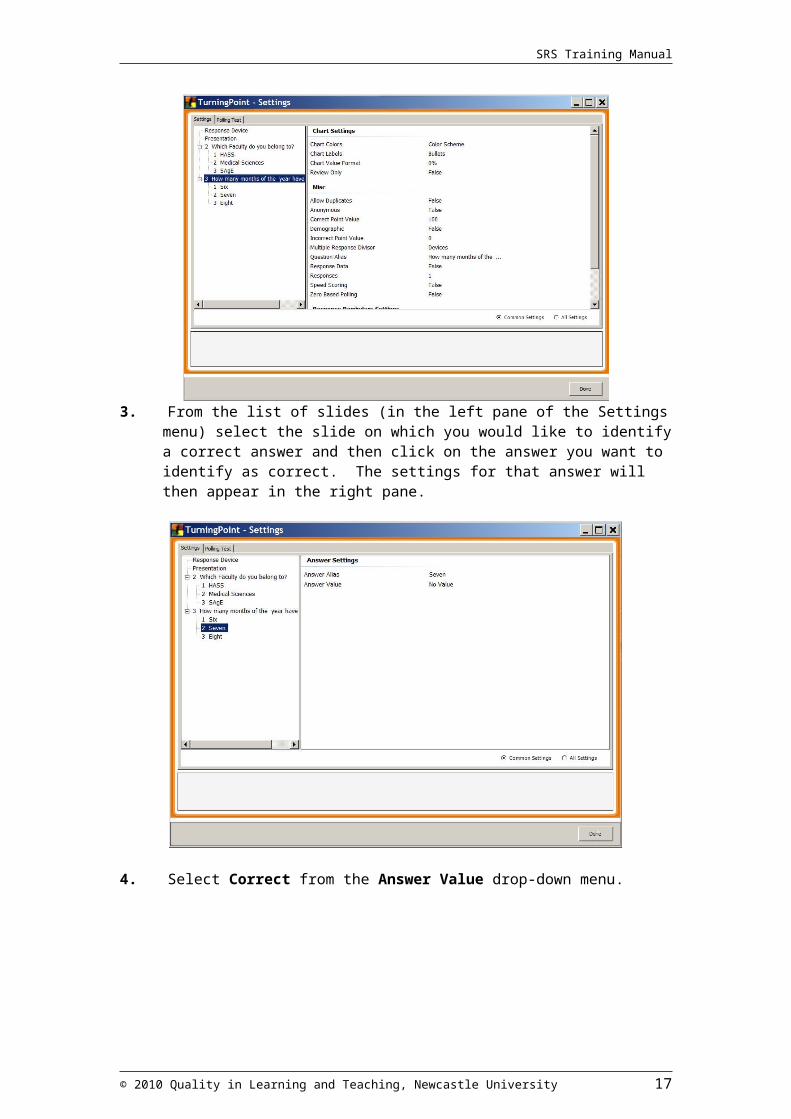
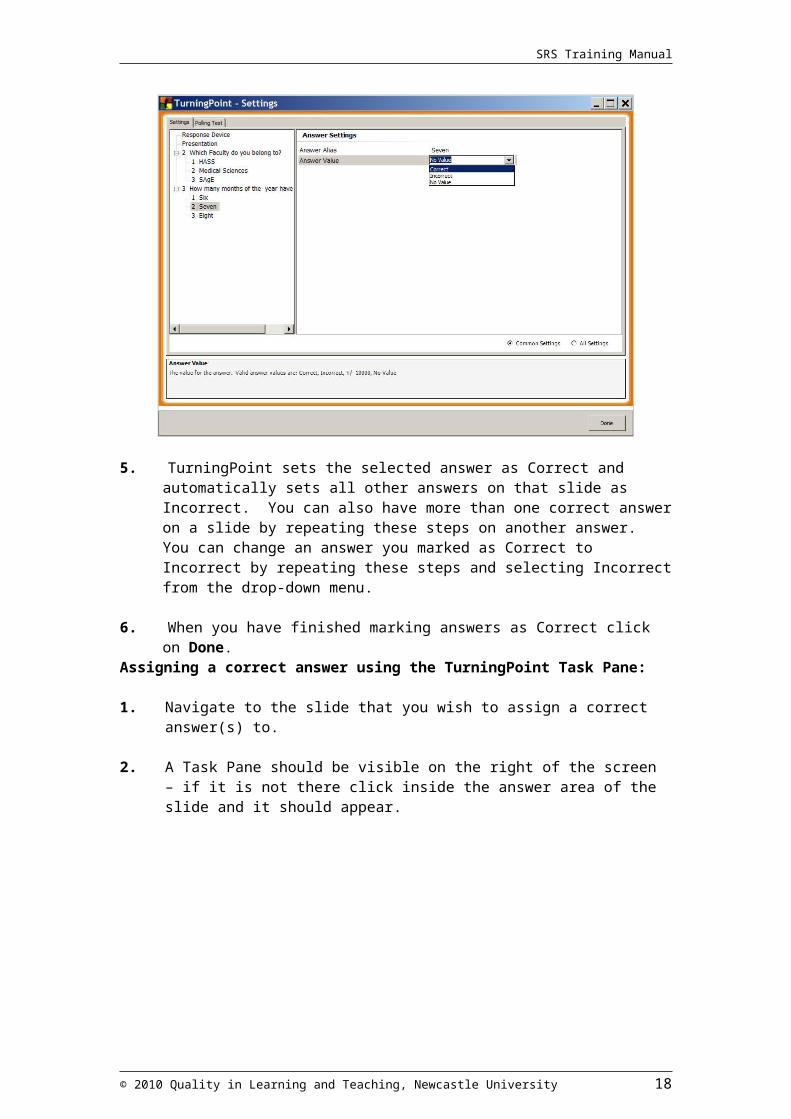
3. From the list of slides (in the left pane of the Settings menu) select the slide on which you would like to identify a correct answer and then click on the answer you want to identify as correct. The settings for that answer will then appear in the right pane.
4. Select Correct from the Answer Value drop-down menu.
5. TurningPoint sets the selected answer as Correct and automatically sets all other answers on that slide as Incorrect. You can also have more than one correct answer on a slide by repeating these steps on another answer. You can change an answer you marked as Correct to Incorrect by repeating these steps and selecting Incorrect from the drop-down menu.
6. When you have finished marking answers as Correct click on Done.
© 2010 Quality in Learning and Teaching, Newcastle University 12
SRS Training Manual
Assigning a correct answer using the TurningPoint Task Pane:
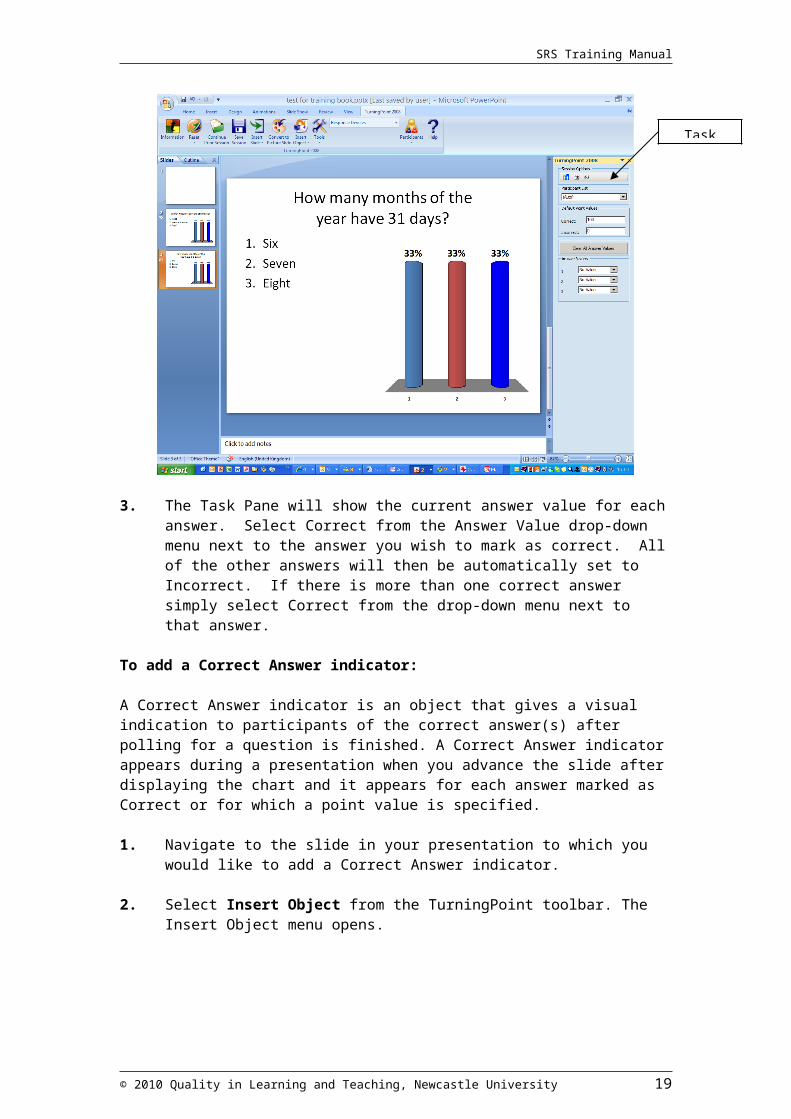
1. Navigate to the slide that you wish to assign a correct answer(s) to.
2. A Task Pane should be visible on the right of the screen – if it is not there click inside the answer area of the slide and it should appear.
3. The Task Pane will show the current answer value for each answer. Select Correct from the Answer Value drop-down menu next to the answer you wish to mark as correct. All of the other answers will then be automatically set to Incorrect. If there is more than one correct answer simply select Correct from the drop-down menu next to that answer.
To add a Correct Answer indicator:
A Correct Answer indicator is an object that gives a visual indication to participants of the correct answer(s) after polling for a question is finished. A Correct Answer indicator appears during a presentation when you advance the slide after displaying the chart and it appears for each answer marked as Correct or for which a point value is specified.
1. Navigate to the slide in your presentation to which you would like to add a Correct Answer indicator.
2. Select Insert Object from the TurningPoint toolbar. The Insert Object menu opens.
© 2010 Quality in Learning and Teaching, Newcastle University 13
Task Pane
SRS Training Manual
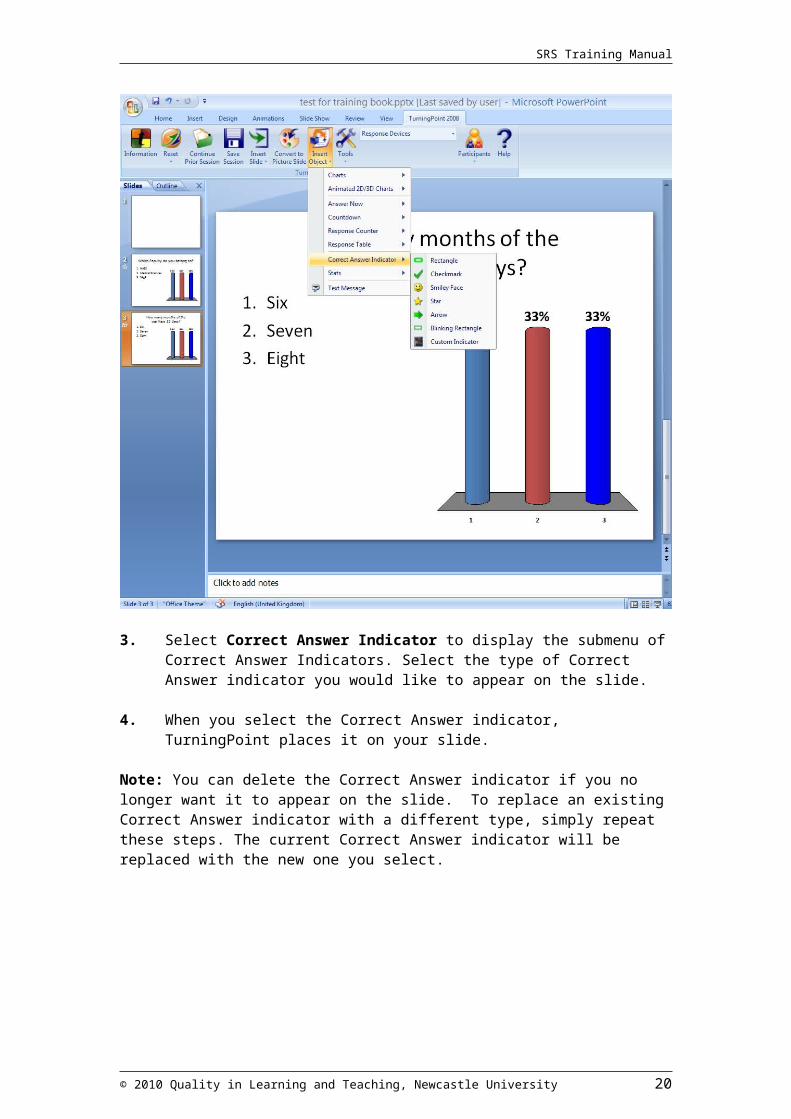
3. Select Correct Answer Indicator to display the submenu of Correct Answer Indicators. Select the type of Correct Answer indicator you would like to appear on the slide.
4. When you select the Correct Answer indicator, TurningPoint places it on your slide.
Note: You can delete the Correct Answer indicator if you no longer want it to appear on the slide. To replace an existing Correct Answer indicator with a different type, simply repeat these steps. The current Correct Answer indicator will be replaced with the new one you select.
© 2010 Quality in Learning and Teaching, Newcastle University 14
SRS Training Manual
Activity 5 – Allowing multiple answers to a question
Activity 4 demonstrated how to set answers as correct or incorrect for a particular question, however the standard settings in TurningPoint only allow each participant to submit one answer for each question. This setting may be appropriate if you require participants to select only one correct answer from the number available, however if you wish them to submit multiple responses to one question then the Responses setting must be changed.
To change the number of responses recorded for each handset:
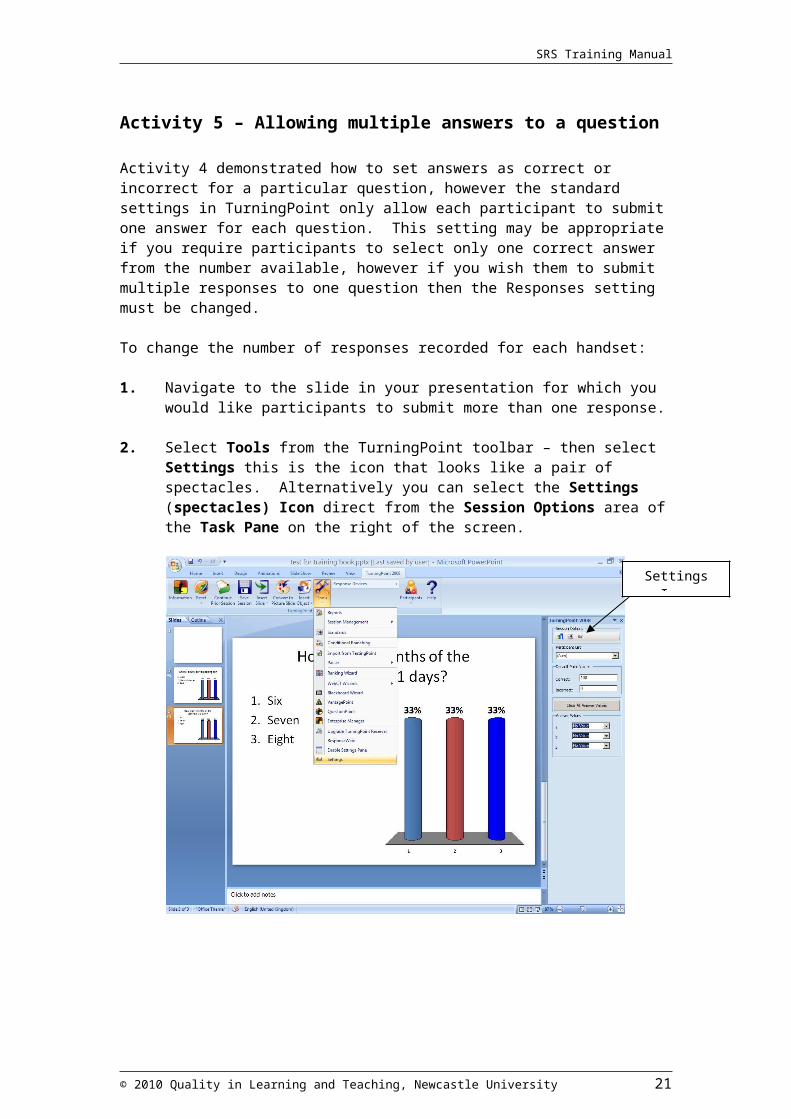
1. Navigate to the slide in your presentation for which you would like participants to submit more than one response.
2. Select Tools from the TurningPoint toolbar – then select Settings this is the icon that looks like a pair of spectacles. Alternatively you can select the Settings (spectacles) Icon direct from the Session Options area of the Task Pane on the right of the screen.
© 2010 Quality in Learning and Teaching, Newcastle University 15
Settings Icon
SRS Training Manual
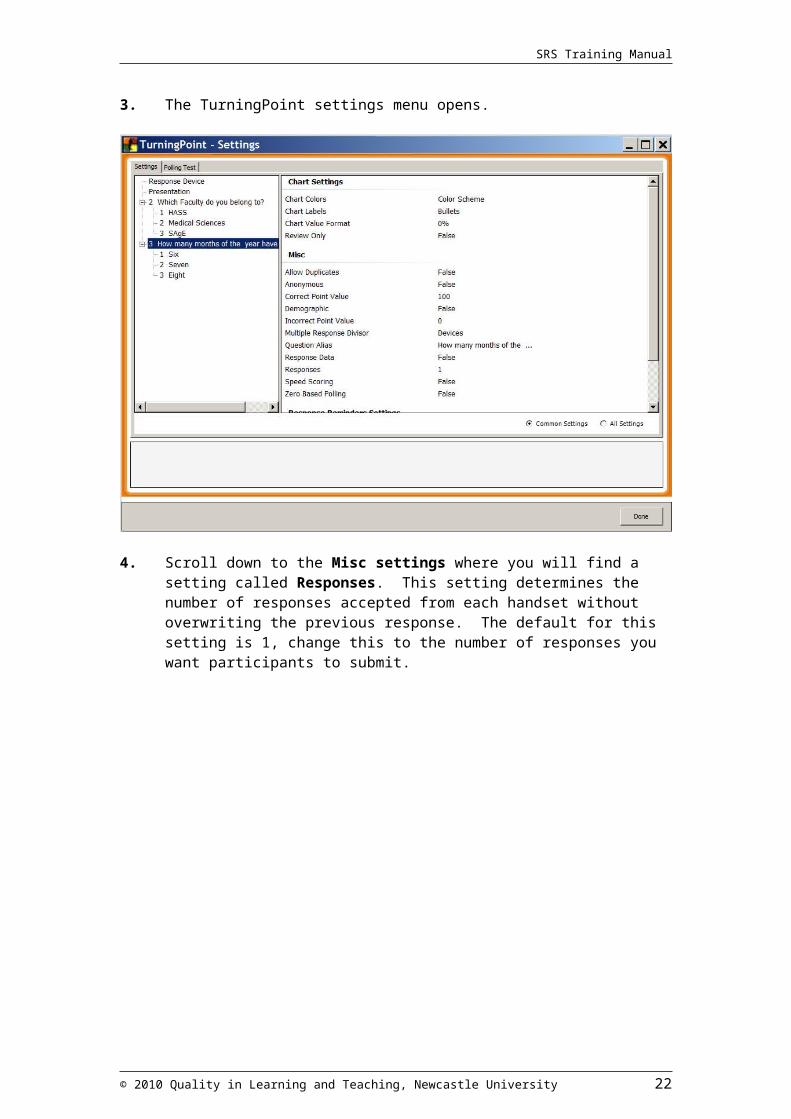
3. The TurningPoint settings menu opens.
4. Scroll down to the Misc settings where you will find a setting called Responses. This setting determines the number of responses accepted from each handset without overwriting the previous response. The default for this setting is 1, change this to the number of responses you want participants to submit.
© 2010 Quality in Learning and Teaching, Newcastle University 16
SRS Training Manual
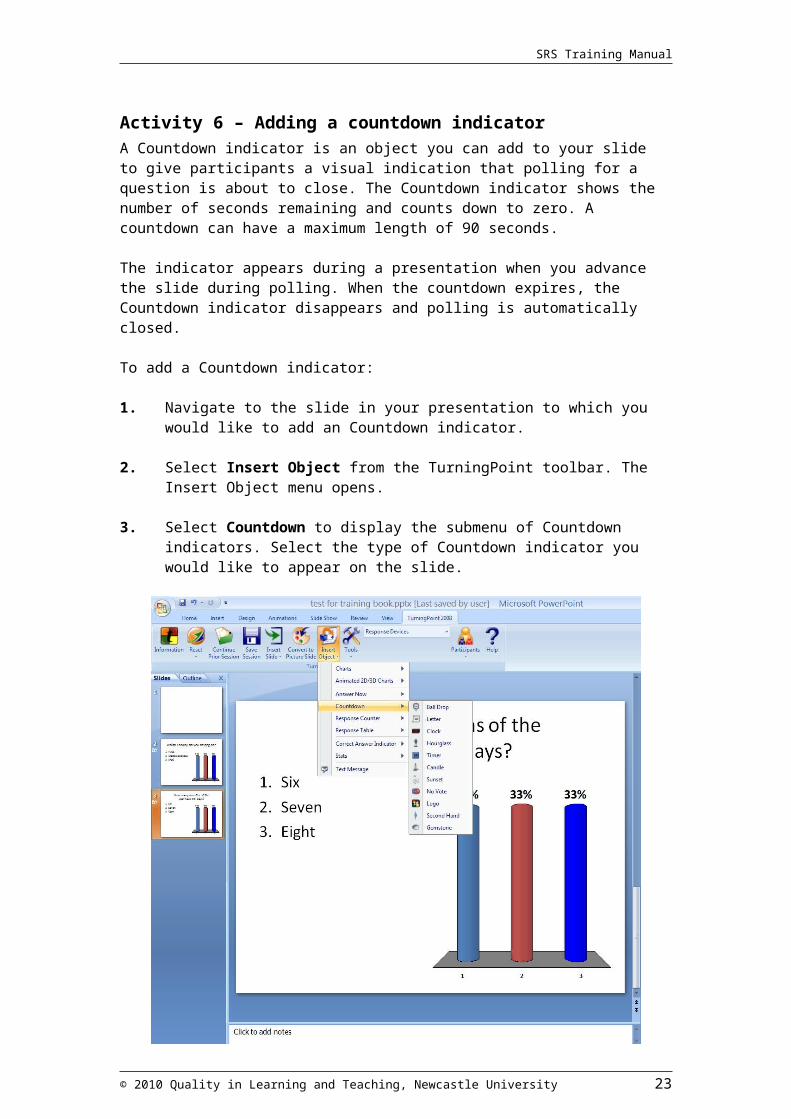
Activity 6 – Adding a countdown indicatorA Countdown indicator is an object you can add to your slide to give participants a visual indication that polling for a question is about to close. The Countdown indicator shows the number of seconds remaining and counts down to zero. A countdown can have a maximum length of 90 seconds.
The indicator appears during a presentation when you advance the slide during polling. When the countdown expires, the Countdown indicator disappears and polling is automatically closed.
To add a Countdown indicator:
1. Navigate to the slide in your presentation to which you would like to add an Countdown indicator.
2. Select Insert Object from the TurningPoint toolbar. The Insert Object menu opens.
3. Select Countdown to display the submenu of Countdown indicators. Select the type of Countdown indicator you would like to appear on the slide.
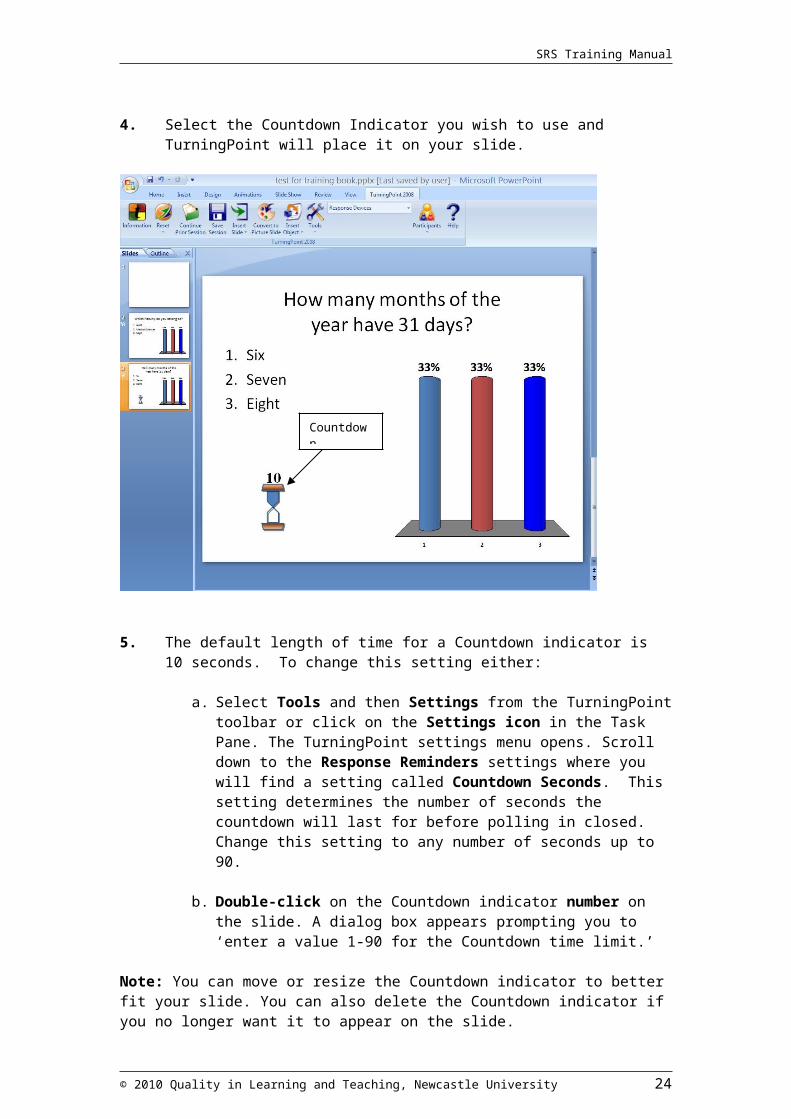
4. Select the Countdown Indicator you wish to use and TurningPoint will place it on your slide.
© 2010 Quality in Learning and Teaching, Newcastle University 17
SRS Training Manual
5. The default length of time for a Countdown indicator is 10 seconds. To change this setting either:
a. Select Tools and then Settings from the TurningPoint toolbar or click on the Settings icon in the Task Pane. The TurningPoint settings menu opens. Scroll down to the Response Reminders settings where you will find a setting called Countdown Seconds. This setting determines the number of seconds the countdown will last for before polling in closed. Change this setting to any number of seconds up to 90.
b. Double-click on the Countdown indicator number on the slide. A dialog box appears prompting you to ‘enter a value 1-90 for the Countdown time limit.’
Note: You can move or resize the Countdown indicator to better fit your slide. You can also delete the Countdown indicator if you no longer want it to appear on the slide.To replace an existing Countdown indicator with a different type, simply repeat these steps. The current Countdown indicator will be replaced with the new one you select.
© 2010 Quality in Learning and Teaching, Newcastle University 18
Countdown indicator
SRS Training Manual
Activity 7 – Creating a demographic slide
If you wish to be able to make comparisons between groups of students and the answers they give to questions it is necessary to create a demographic slide. Examples of groups could be male/female; home students/international students; age groups.
To create a demographic slide:
1. Create a TurningPoint slide in the normal way (Activity 2) asking the demographic question you wish to use for comparison purposes. For example: Are you male or female? N.B. You have to give Male and Female as the two possible answers.
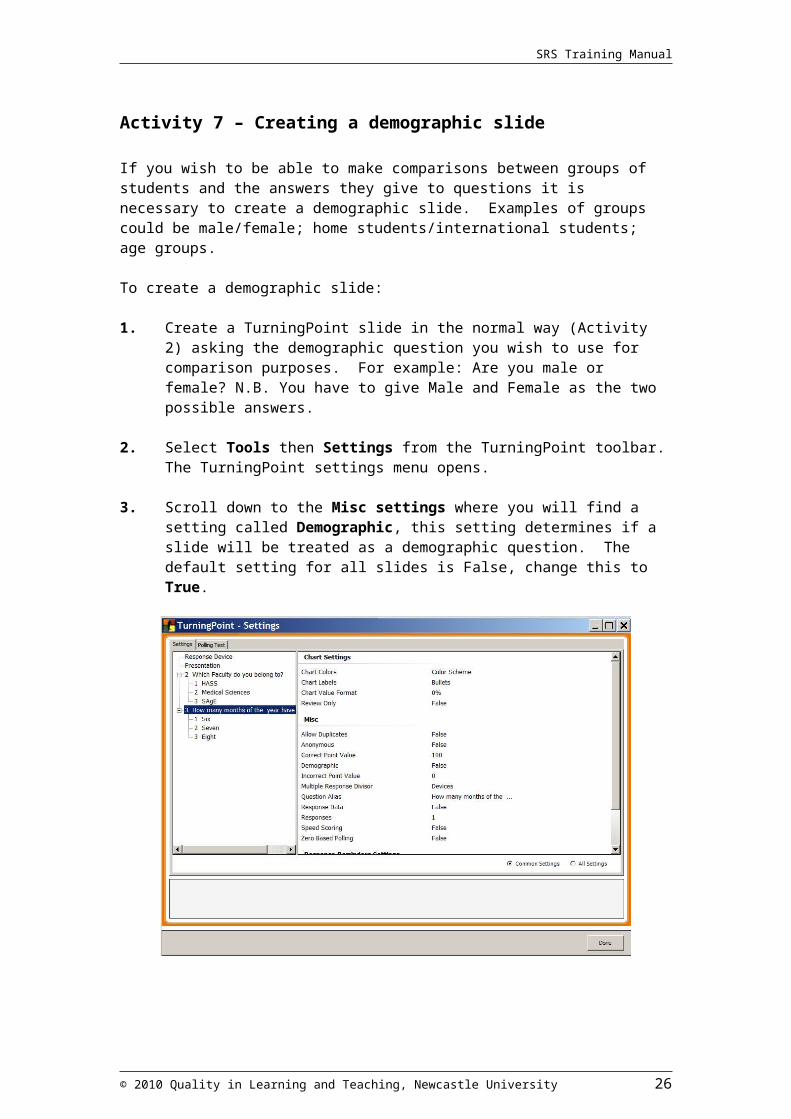
2. Select Tools then Settings from the TurningPoint toolbar. The TurningPoint settings menu opens.
3. Scroll down to the Misc settings where you will find a setting called Demographic, this setting determines if a slide will be treated as a demographic question. The default setting for all slides is False, change this to True.
© 2010 Quality in Learning and Teaching, Newcastle University 19
SRS Training Manual
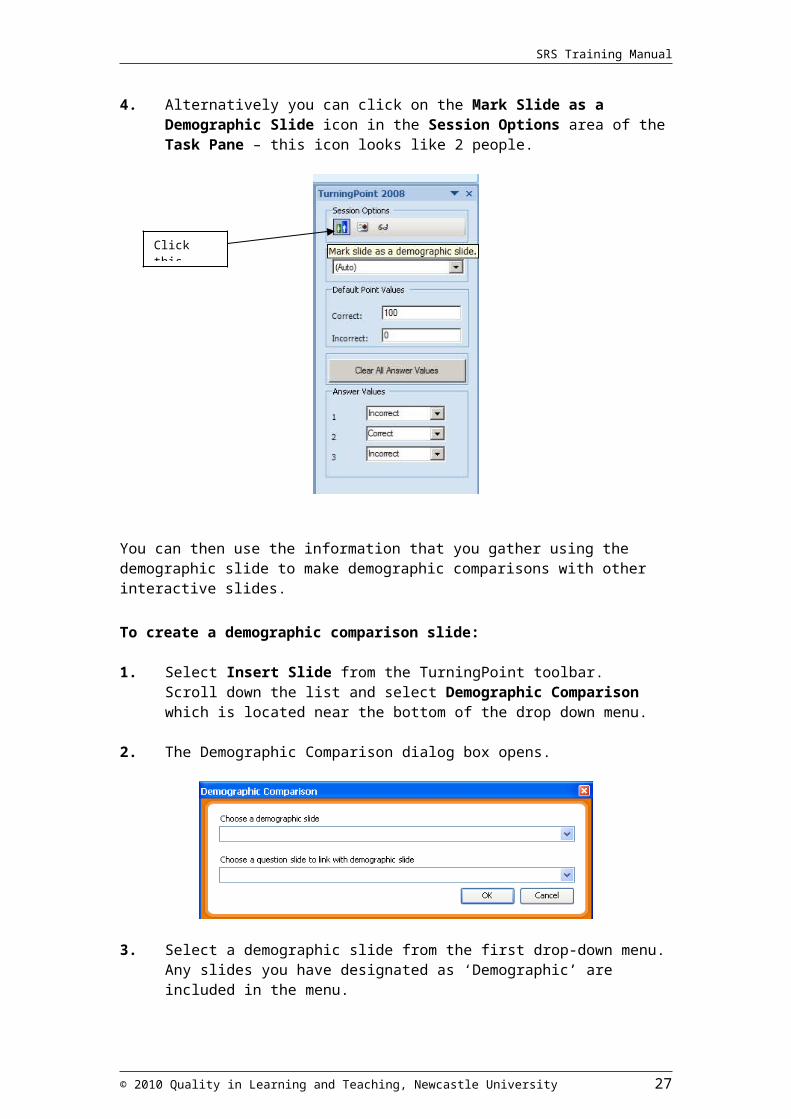
4. Alternatively you can click on the Mark Slide as a Demographic Slide icon in the Session Options area of the Task Pane – this icon looks like 2 people.
You can then use the information that you gather using the demographic slide to make demographic comparisons with other interactive slides.
To create a demographic comparison slide:
1. Select Insert Slide from the TurningPoint toolbar. Scroll down the list and select Demographic Comparison which is located near the bottom of the drop down menu.
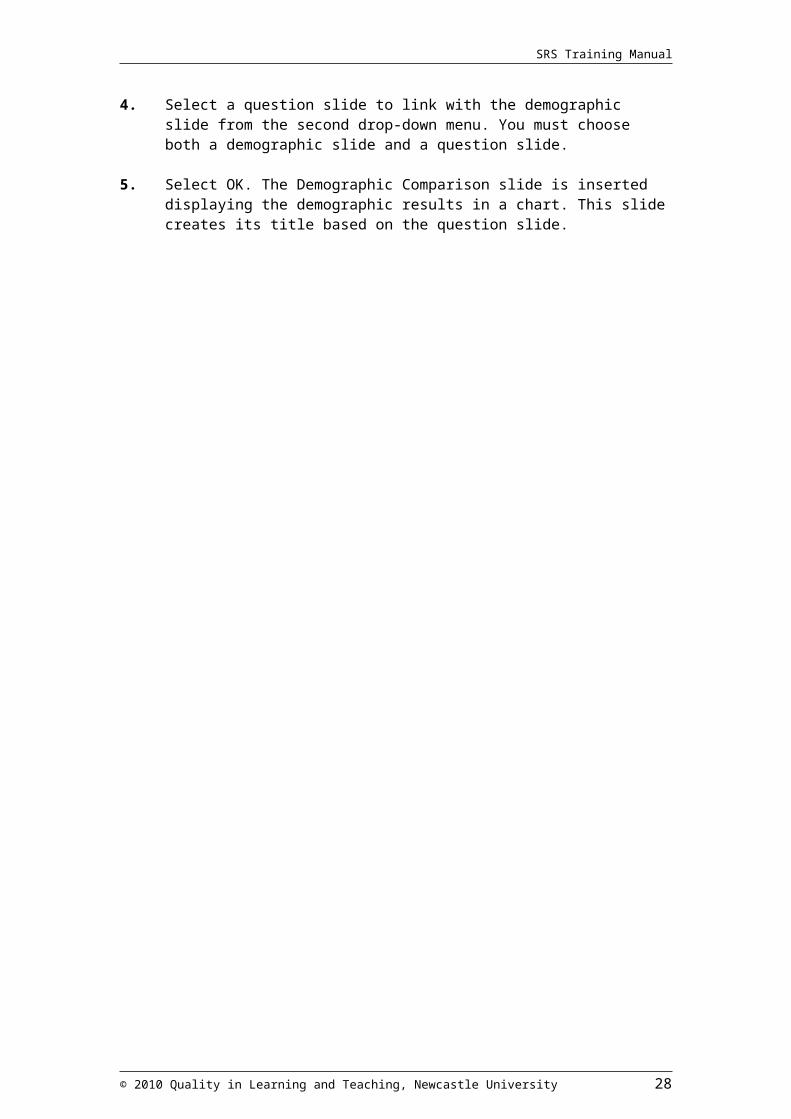
2. The Demographic Comparison dialog box opens.
3. Select a demographic slide from the first drop-down menu. Any slides you have designated as ‘Demographic’ are included in the menu.
4. Select a question slide to link with the demographic slide from the second drop-down menu. You must choose both a demographic slide and a question slide.
5. Select OK. The Demographic Comparison slide is inserted displaying the demographic results in a chart. This slide creates its title based on the question slide.
© 2010 Quality in Learning and Teaching, Newcastle University 20
Click this icon
SRS Training Manual
Activity 8 – Testing the Session
Once you have created the required interactive slides in your presentation it is possible to test the session without the receiver and handsets by using fake responses generated by TurningPoint. This enables you to check that all of the slides behave in the way that you want them to and that you are familiar with when you need to click to advance the slides.
To test the session:
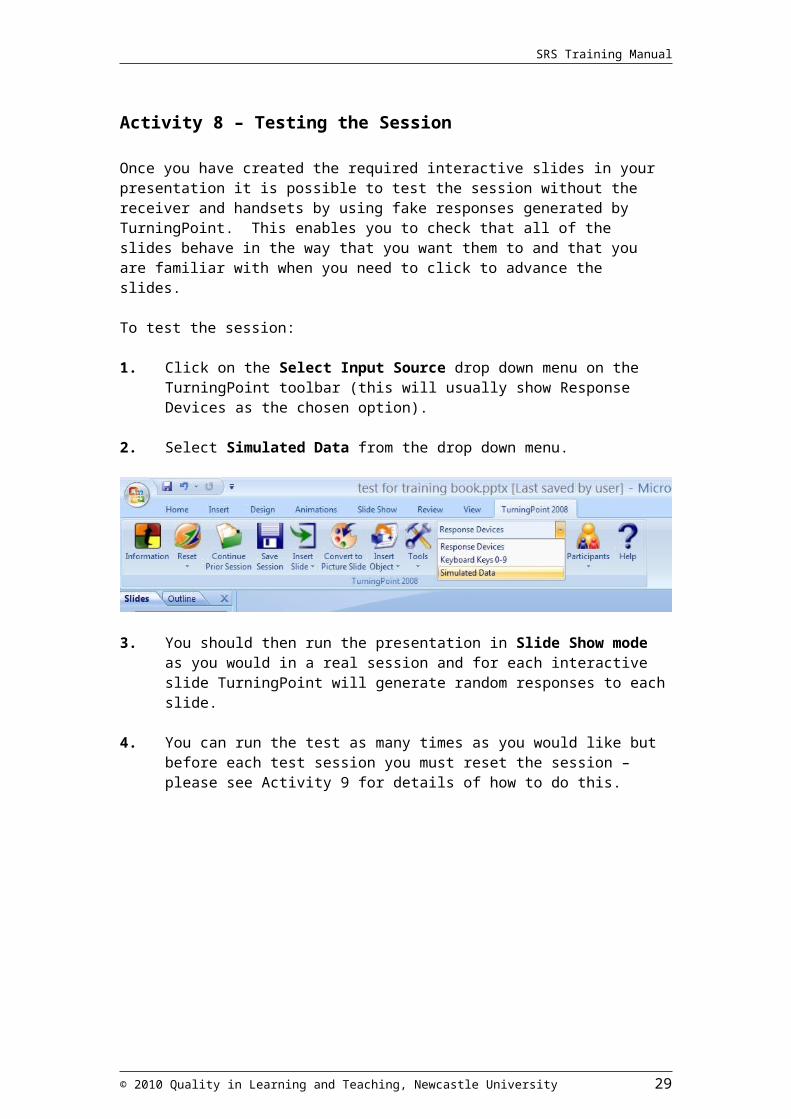
1. Click on the Select Input Source drop down menu on the TurningPoint toolbar (this will usually show Response Devices as the chosen option).
2. Select Simulated Data from the drop down menu.
3. You should then run the presentation in Slide Show mode as you would in a real session and for each interactive slide TurningPoint will generate random responses to each slide.
4. You can run the test as many times as you would like but before each test session you must reset the session – please see Activity 9 for details of how to do this.
© 2010 Quality in Learning and Teaching, Newcastle University 21
SRS Training Manual
Activity 9 – Resetting Slides
The Reset option on the TurningPoint toolbar returns the response tallies from the audience (or simulated data) to zero for all slides in the session or only the current slide.
To reset slides select the Reset drop down menu on the TurningPoint toolbar. There are three available options:
Session – this option clears TurningPoint of any existing session results and allows you to run the presentation again to capture new results.
Note: TurningPoint prompts you to save existing session results every time you reset the session and when you exit from TurningPoint.
Current Slide – this option removes all values for the current slide without removing the data from the session.
All Slides – by choosing this option new data is appended to the end of the session without resetting the entire session.
© 2010 Quality in Learning and Teaching, Newcastle University 22
SRS Training Manual
Running the Session
Activity 10 - Setting up the receiver
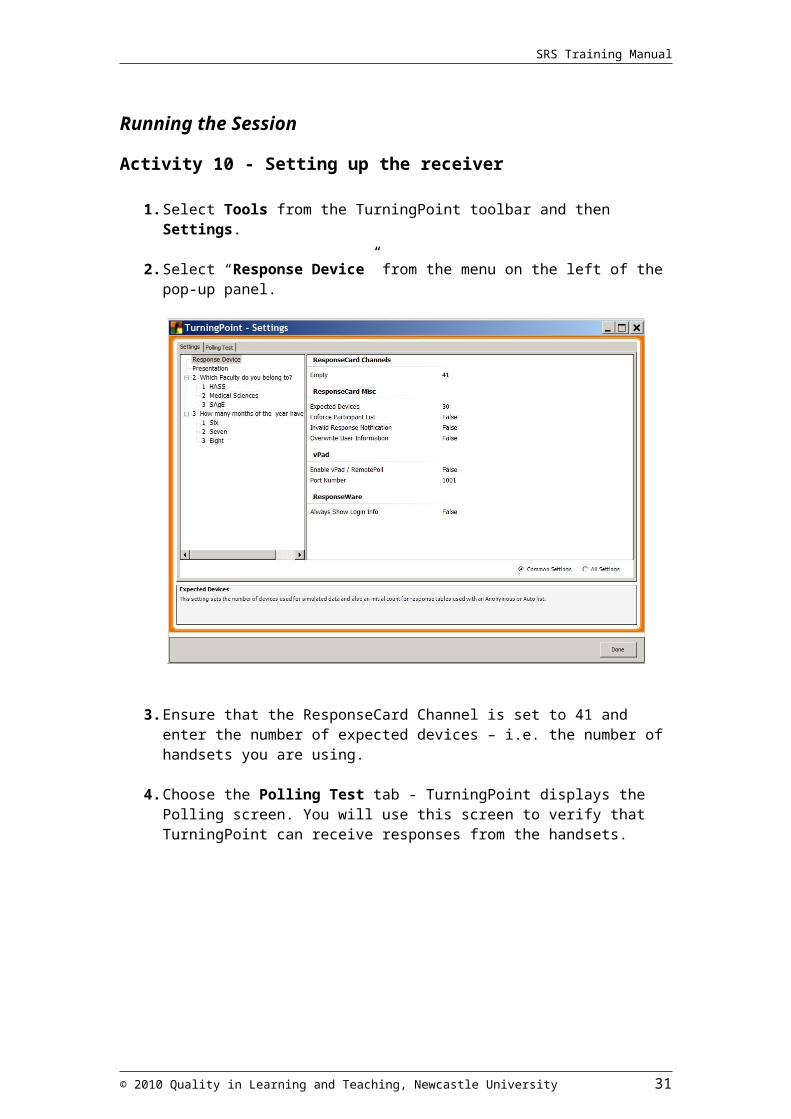
1. Select Tools from the TurningPoint toolbar and then Settings.
2. Select “Response Device” from the menu on the left of the pop-up panel.
3. Ensure that the ResponseCard Channel is set to 41 and enter the number of expected devices – i.e. the number of handsets you are using.
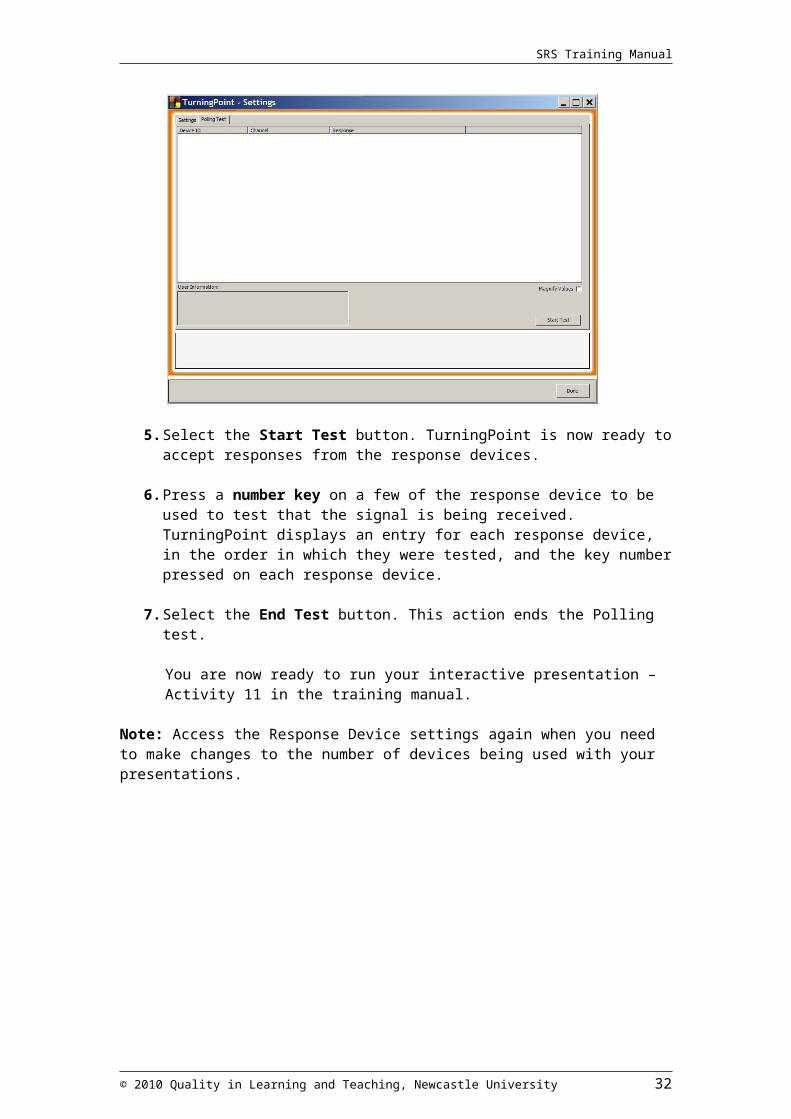
4. Choose the Polling Test tab - TurningPoint displays the Polling screen. You will use this screen to verify that TurningPoint can receive responses from the handsets.
© 2010 Quality in Learning and Teaching, Newcastle University 23
SRS Training Manual
5. Select the Start Test button. TurningPoint is now ready to accept responses
from the response devices.
6. Press a number key on a few of the response device to be used to test that the signal is being received. TurningPoint displays an entry for each response device, in the order in which they were tested, and the key number pressed on each response device.
7. Select the End Test button. This action ends the Polling test.
You are now ready to run your interactive presentation – Activity 11 in the training manual.
Note: Access the Response Device settings again when you need to make changes to the number of devices being used with your presentations.
© 2010 Quality in Learning and Teaching, Newcastle University 24

SRS Training Manual
Activity 11 - Running the interactive presentation
1. Set up the receiver as described in Activity 10.
2. Before starting the presentation you should ensure that any previous session responses are cleared using the Reset button (Activity 9).
3. Run your presentation in Slide Show mode - from the PowerPoint menu, select Slide Show > From Beginning, or click on the slide show icon at the bottom right of the PowerPoint screen or press the F5 key.
4. The first slide of the presentation is shown. A presentation session feels similar to running a typical PowerPoint slide show, but as you present, the ShowBar is available at the top of the screen during interactive slides. The ShowBar allows you to open and close polling, view polling status, add extra slides and view the response data in a variety of ways.
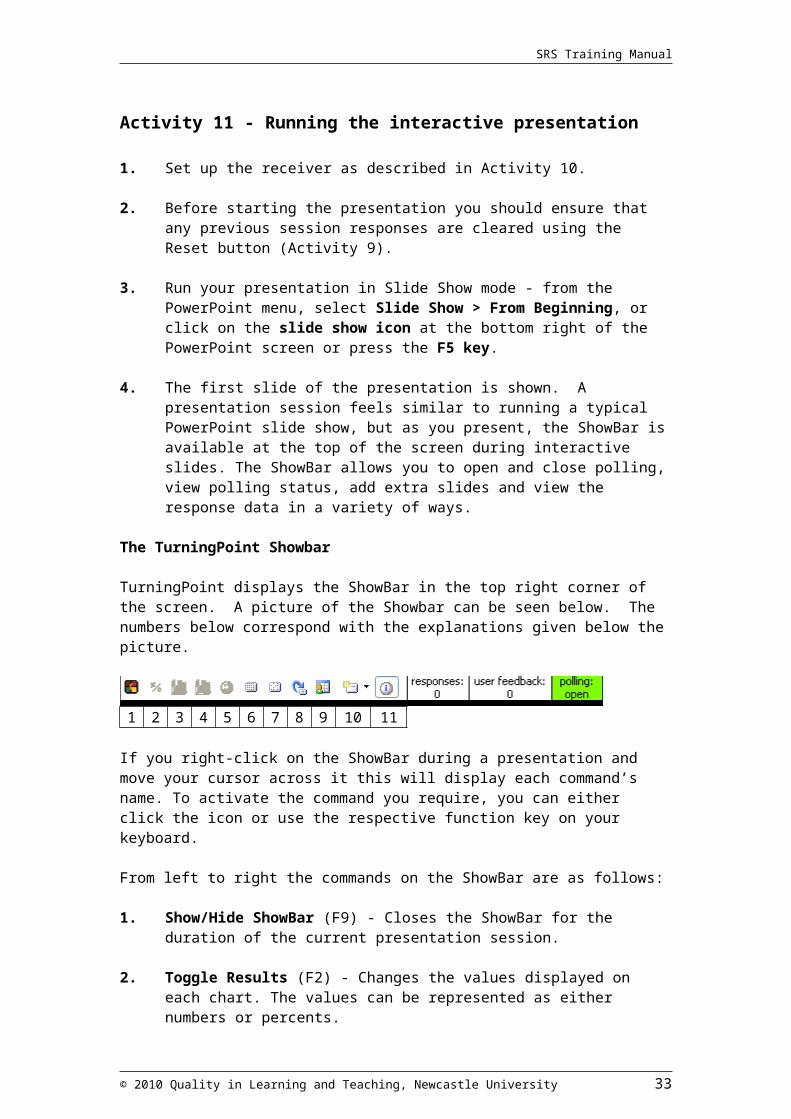
The TurningPoint Showbar
TurningPoint displays the ShowBar in the top right corner of the screen. A picture of the Showbar can be seen below. The numbers below correspond with the explanations given below the picture.
1 2 3 4 5 6 7 8 9 10 11
If you right-click on the ShowBar during a presentation and move your cursor across it this will display each command’s name. To activate the command you require, you can either click the icon or use the respective function key on your keyboard.
From left to right the commands on the ShowBar are as follows:
1. Show/Hide ShowBar (F9) - Closes the ShowBar for the duration of the current presentation session.
2. Toggle Results (F2) - Changes the values displayed on each chart. The values can be represented as either numbers or percents.
3. Data Slicing (F3) - Shows the responses on the chart for the portion of the audience who chose a certain response on another question.
4. Show the Original Chart (F6) - Use this command after using the Toggle Results or Data Slicing commands to return the chart to its appearance when it was first created.
5. Repoll Question (F4) - Clears the responses and accepts new responses from the audience for the currently displayed question. Both the original responses and the new responses are stored in the session file.
6. Show the Response Grid (F7) - Opens a Response Grid on the screen allowing you to see which participants have responded to the question.
7. Show Non-Response Grid (F8) - Opens a Response Grid on the screen. As each participant responds, their response box is removed from the grid.
© 2010 Quality in Learning and Teaching, Newcastle University 25
SRS Training Manual
8. Go to Next Slide (F10) - Advances the slide show to the next slide.
9. Display Participant Monitor (F12) - Opens the Participant Monitor.
10. Insert Slide (F5) - Opens a drop-down menu allowing you to select the slide type to be inserted into the presentation. (Activity 12 will explain this option in more detail)
11. Display interactive results - Expands the ShowBar to display the responses, user responses, and polling status. These appear by default but if they have been switched off for any reason use this button to show them.
Running the interactive presentation continued
5. Click the mouse to control the progress of the slide show. The control of each slide will vary slightly depending on the objects you choose to insert when you create the slides. In general, for each slide:
a. Open polling. Polling will automatically open when you display a slide. TurningPoint receives responses when polling is open.
b. Click a second time to close polling and display the results. No responses are accepted when polling is closed.
c. Click again to advance to the next slide.
However, if you have added a Countdown to a slide you will have click again once the slide has opened to display the Countdown. Polling will then automatically close when the countdown ends.
Note: To advance slides, you may use any method PowerPoint allows, such as clicking the mouse or pressing the space bar, arrow keys, or Enter key.
6. Click at the end of the slides to exit from the Slide Show as you would normally (or optionally, press the Esc key).
© 2010 Quality in Learning and Teaching, Newcastle University 26
SRS Training Manual
Activity 12 - Adding slides during a presentation session:
TurningPoint gives you the flexibility of adding an interactive slide while running the presentation if you encounter an issue or question that you would like to poll. Inserting a new slide is an option available through the ShowBar.
To add a slide during a presentation (this can be done in two ways):
Method 1:
1. Run your presentation in slide show mode using simulated data.
2. During the presentation click on the Insert Slide button on the ShowBar.
3. The Custom Question window opens to display the fields for typing the question and answer choices to be used on the interactive slide.
4. Type the question in the top region of the window. Type the answer choices in the lower region, separating each answer with a line break.
5. Select the Insert button. A new interactive slide appears, after the slide you had been viewing, displaying the new question.
Method 2:
5. As with Method 1 run your presentation in slide show mode using simulated data.
6. During the presentation click on the arrow next to the Insert Slide button on the Showbar.
7. A drop-down menu opens from the ShowBar allowing you to select the slide type to be inserted into the presentation.
© 2010 Quality in Learning and Teaching, Newcastle University 27
SRS Training Manual
8. A general template slide will be inserted after the slide you had been viewing. (Note: It is not possible to edit the question or responses on these template slides while in Slide Show mode and therefore if you wish to add a slide containing a specific question rather than simply a Yes/No, True/False etc. then you should use Method 1 to create a customised slide)
Note: If you would like to reuse the presentation with the newly added slide, save the file. From the PowerPoint menu, select File > Save As. If you forget to do this TurningPoint asks you if you wish to save the changes you have made before closing.
© 2010 Quality in Learning and Teaching, Newcastle University 28
SRS Training Manual
Activity 13 – Saving session results Each time you run a presentation, TurningPoint creates a unique session. A session is made up of data pertaining to the response devices, the participants in the audience, and the responses of the participants.
To save the session results:
1. Click on the Save Session icon on the TurningPoint toolbar - this is the disk icon. (Note: It is important that you click on the disk icon on the TurningPoint toolbar and not the disk icon on the normal PowerPoint toolbar as this icon is used to save the slides and not the session data.)
2. A pop-up screen will then appear which will allow you to either save the session in the default TurningPoint Sessions folder located in My Documents or you can navigate to the location that you would like to save the session data to.
Note: If you exit the program, TurningPoint prompts you to name and save the session results to a file. The default location is My Documents > TurningPoint >Sessions you will therefore need to change the location to where you would like to save the session.
© 2010 Quality in Learning and Teaching, Newcastle University 29
SRS Training Manual
Activity 14 – Creating reports
You can create reports using the Report Wizard, available in the Tools menu in the TurningPoint toolbar.
1. Create a session file by running a presentation session and saving the session data.
2. Select Tools in the TurningPoint toolbar. The Tools menu opens. Select Reports from the Tools menu.
3. The Reports window opens, displaying a list of the session files in your Sessions folder.
© 2010 Quality in Learning and Teaching, Newcastle University 30
SRS Training Manual
Note: You can toggle which files are displayed in the list by selecting My Session Files or My Backup Session Files.
4. Choose a session file in one of the following ways:a. Select the Use Current Session check box to use the session
currently open in PowerPoint. This option is available only if you have a TurningPoint presentation open and response data has been collected.
b. Select a previous session file by navigating to the folder that you have stored it in using the Folder icon on the left of the pop-up screen.
5. Once you have selected a session file select the Reports tab.
6. The Reports window displays a list of the categories of reports you can generate from your session file. To expand each category and view the types of reports that can be generated click on the + symbol.
© 2010 Quality in Learning and Teaching, Newcastle University 31
SRS Training Manual
7. Select the type of report you would like to view by ticking the box beside it – a sample of the type of report will appear on the right-hand side of the box. To create the report click the Generate Report button.
8. TurningPoint creates the report and opens it in Microsoft Excel or Word. This may take some time, especially if there are a large number of questions or participants in the session.
9. You can generate as many reports as you like. When one report is finished being created, select another type of report from the list and select the Generate Report button again.
10. When you are finished creating reports, select the Exit button to close the Report Wizard.
Note: You can use Excel or Word to edit, save, or print the reports.
© 2010 Quality in Learning and Teaching, Newcastle University 32
SRS Training Manual
Further Information and Contacts
The full training manual supplied with the TurningPoint 2008 software covers more advanced use of the system such as the use of participant lists and creating conditional branching questions. This can by found via your Start menu as shown in the picture below:
Further information about the TurningPoint software is available at http://www.turningtechnologies.co.uk/
Online tutorial explaining how to write good quality objective test questionshttp://www.caacentre.ac.uk/resources/objective_tests/index.shtml
Links to Journal articles and useful SRS related websites can be accessed at http://www.ncl.ac.uk/quilt/projects/current/srsevaluation/index.html
Contact Information
Carol SummersideEmail – [email protected] – 222 3977
© 2010 Quality in Learning and Teaching, Newcastle University 33