turkish banks - türk ekonomi bankası turkish... · turkish banks november 2010 1 sector review...
TRANSCRIPT
Turkish Banks November 2010
1
Turkish Banks Positioning for 2011 and beyond
EQUITY RESEARCH
research.ing.com SEE THE DISCLOSURES APPENDIX FOR IMPORTANT DISCLOSURES & ANALYST CERTIFICATION
Sector review 3 November 2010
ING ratings and targets (TL)
Target price Rating Price Old New
Akbank SELL 9.00 6.00 8.13Fortis HOLD 2.32 1.65 2.28Garanti BUY 8.80 7.50 10.47Halkbank HOLD 14.50 9.47 16.60Isbank BUY 6.45 4.77 7.48Sekerbank BUY 1.82 1.73 2.65TEB BUY 2.46 2.24 3.34TSKB BUY 2.64 2.37 3.11Vakifbank HOLD 4.64 3.15 4.78Yapi Kredi BUY 5.50 4.50 6.78
Priced on 28 October 2010
Source: Bloomberg
Key changes
Stock Comment
Garanti BUY reiterated, TP raised Isbank BUY reiterated, TP raised Sekerbank Hold to BUY, TP raised TSKB BUY reiterated, TP raised Yapi Kredi BUY reiterated, TP raised
Source: ING
Turkish banks multiples (x)
Ticker 2011F PER
2011F P/BV
Akbank AKBNK TI 11.0 2.00Fortis FORTS TI 11.8 1.11Garanti GARAN TI 9.6 2.09Halkbank HALKB TI 8.4 2.23Isbank ISCTR TI 9.5 1.59Sekerbank SKBNK TI 7.3 0.88TEB TEBNK TI 9.0 1.24TSKB TSKB TI 7.5 1.35Vakifbank VAKBN TI 10.7 1.29Yapi Kredi YKBNK TI 9.7 1.95
Priced on 28 October 2010 Source: ING estimates
We see a secular shift in Turkish banking. The ROEs are likely to fall next year but so is the cost of equity. Turkish banks should generate an average 19% ROE over our forecast period 2011-13, now rolled over one year. We reduce CoE by 100bp and raise our target prices. The strong rally may prompt profit taking; we would take the opportunity and buy. We reiterate BUY on Yapi Kredi, Garanti, Isbank, TEB and TSKB and upgrade Sekerbank to BUY.
Model revisions and new targets. We have revisited our revenue model and balance sheet assumptions. Our target values are higher because we have: (1) reduced cost of equity by 100bp; (2) raised our 2011F loan growth expectation to 25% (coverage average), from 17% previously; and (3) rolled over the forecast period one year, as we usually do in the December quarter. The revisions raise our target prices by an average of 48%.
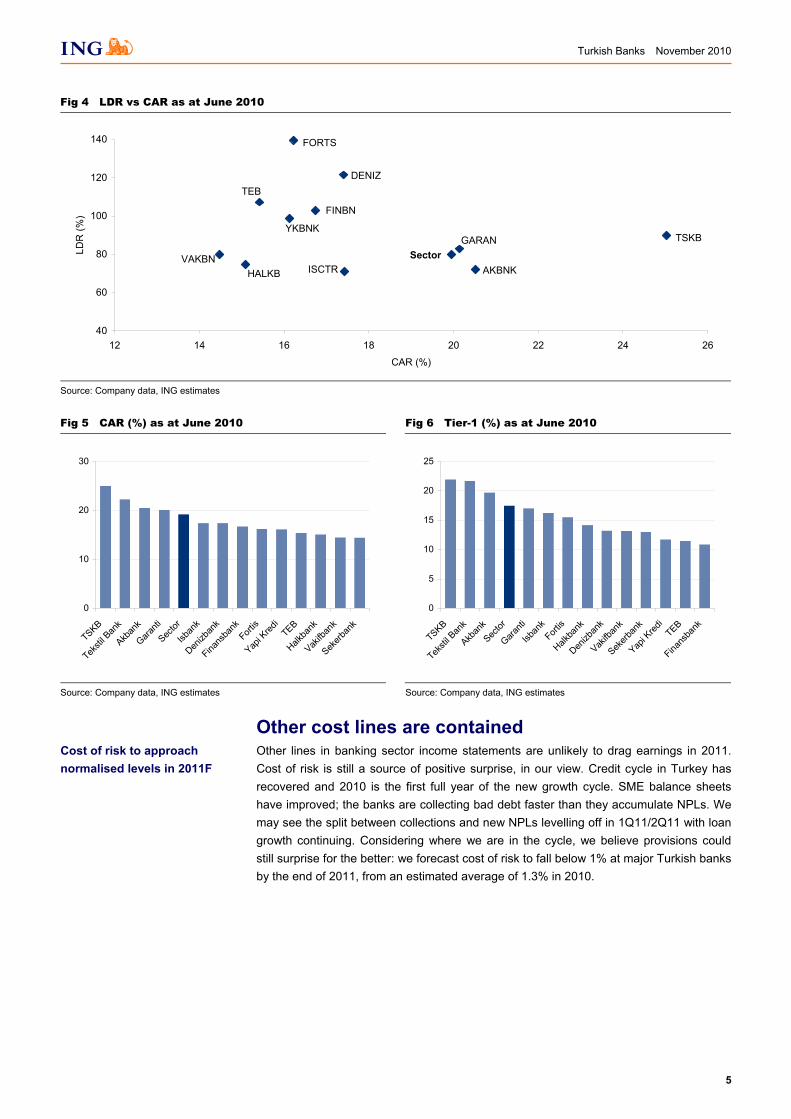
Operating outlook. The Central Bank of Turkey has taken action to tighten liquidity, but has not completely reversed monetary policy. We do not expect rate hikes before September 2011, and we see inflation remaining low until 2012. Low rates should prompt further growth in lending. We expect volume growth in 2010/11 to be large enough to offset any further decline in NIM. We expect low deposit interest rates throughout 2011. Provisions could still surprise on the upside: we expect cost of risk to fall below the 1% mark at major Turkish banks by the end of 2011, from an estimated 1.3% average in 2010. Capital levels are adequate at the banks we follow, in our view. The sector’s average CAR stands at 19% and LDR at 80% as at June 2010, giving ample room for balance sheet growth. The duration of liabilities is increasing as banks seek alternative funding vehicles, including issuing corporate bonds and new syndications. We believe the balance sheets will transform considerably in the next three years to accommodate the growth in longer dated assets, notably retail loans.
Re-rating. The ROEs are likely to fall next year, but what Turkish banks are experiencing is nothing short of a re-rating. It is because of this paradigm shift that the shares have continued to rally despite several analyst and strategist downgrades. There is no question it has been a very strong rally, but the rally alone is no reason to sell. If the shares were to fall on profit taking, we would see it as an opportunity to buy.
Turkish banking index vs EMEA banks (rebased 100)
80
100
120
140
160
10/09 12/09 2/10 4/10 6/10 8/10 10/10
ISE Banks ISE National 100 EMEA Banks
Source: Bloomberg
Haluk Akdogan London +44 20 7767 6650 [email protected]
Derya Guzel Istanbul +90 212 367 7013 [email protected]
Turkish Banks November 2010
2
Contents
Investment case 3
Recommendation 7
Valuation 10
Consensus 12
Sources of risk 14
Asset quality trends 18
Net NPLs 19
Cost of risk trends 20
Expense ratios 21
Return on assets 22
Monetary policy 23
Economic fundamentals 25
Companies 28 Akbank .............................................................................................................................31 Fortis Bank (Turkey).........................................................................................................35 Garanti Bank ....................................................................................................................39 Halkbank ..........................................................................................................................43 Isbank ..............................................................................................................................47 Sekerbank ........................................................................................................................51 Turk Ekonomi Bankasi .....................................................................................................55 TSKB................................................................................................................................59 Vakifbank .........................................................................................................................63 Yapi Kredi Bankasi...........................................................................................................67
Disclosures Appendix 70
Turkish Banks November 2010
3
Investment case
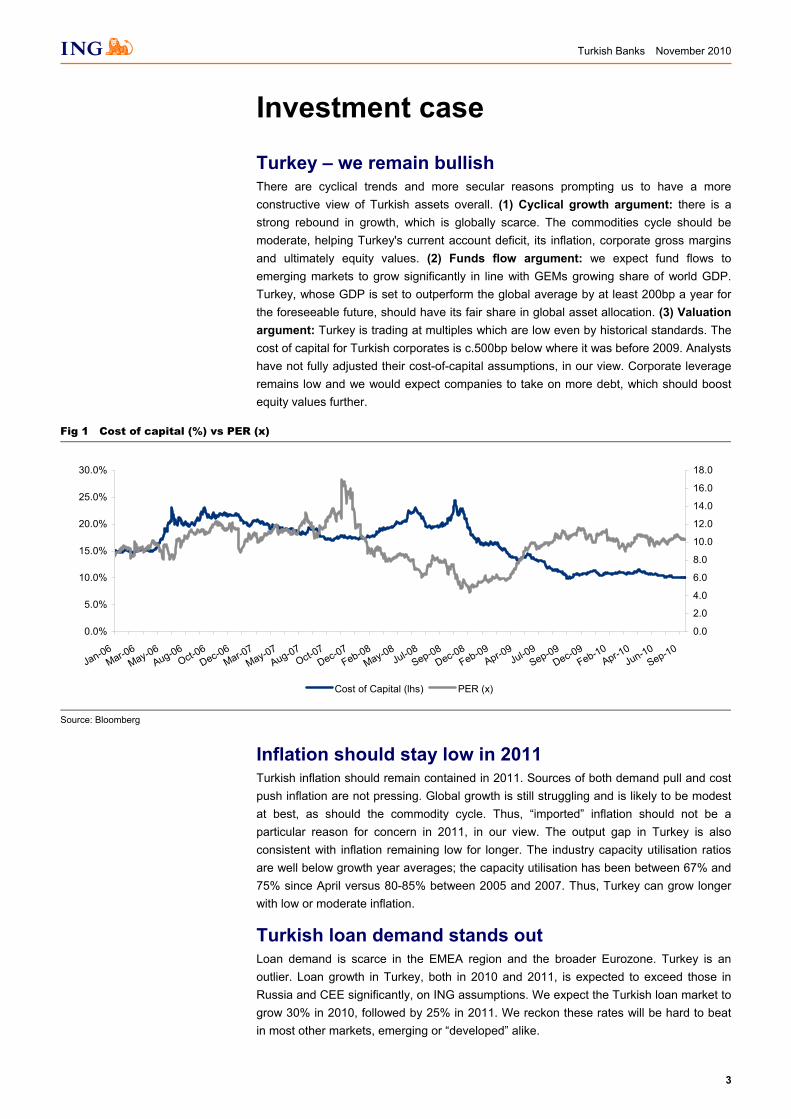
Turkey – we remain bullish There are cyclical trends and more secular reasons prompting us to have a more constructive view of Turkish assets overall. (1) Cyclical growth argument: there is a strong rebound in growth, which is globally scarce. The commodities cycle should be moderate, helping Turkey's current account deficit, its inflation, corporate gross margins and ultimately equity values. (2) Funds flow argument: we expect fund flows to emerging markets to grow significantly in line with GEMs growing share of world GDP. Turkey, whose GDP is set to outperform the global average by at least 200bp a year for the foreseeable future, should have its fair share in global asset allocation. (3) Valuation argument: Turkey is trading at multiples which are low even by historical standards. The cost of capital for Turkish corporates is c.500bp below where it was before 2009. Analysts have not fully adjusted their cost-of-capital assumptions, in our view. Corporate leverage remains low and we would expect companies to take on more debt, which should boost equity values further.
Fig 1 Cost of capital (%) vs PER (x)
0.0%
5.0%
10.0%
15.0%
20.0%
25.0%
30.0%
Jan-06Mar-06
May-06Aug-06
Oct-06Dec-06
Mar-07May-07
Aug-07Oct-07
Dec-07Feb-08
May-08Jul-08
Sep-08Dec-08
Feb-09Apr-09
Jul-09Sep-09
Dec-09Feb-10
Apr-10Jun-10
Sep-10
0.0
2.0
4.0
6.0
8.0
10.0
12.0
14.0
16.0
18.0
Cost of Capital (lhs) PER (x)
Source: Bloomberg
Inflation should stay low in 2011 Turkish inflation should remain contained in 2011. Sources of both demand pull and cost push inflation are not pressing. Global growth is still struggling and is likely to be modest at best, as should the commodity cycle. Thus, “imported” inflation should not be a particular reason for concern in 2011, in our view. The output gap in Turkey is also consistent with inflation remaining low for longer. The industry capacity utilisation ratios are well below growth year averages; the capacity utilisation has been between 67% and 75% since April versus 80-85% between 2005 and 2007. Thus, Turkey can grow longer with low or moderate inflation.
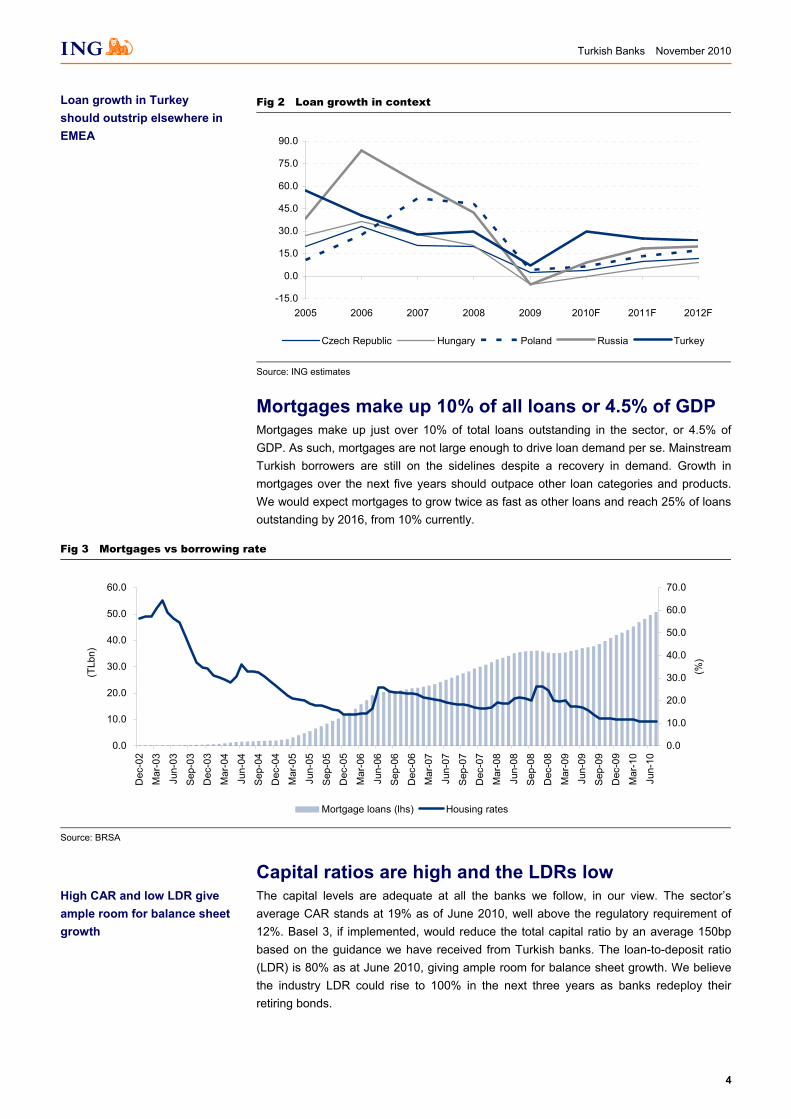
Turkish loan demand stands out Loan demand is scarce in the EMEA region and the broader Eurozone. Turkey is an outlier. Loan growth in Turkey, both in 2010 and 2011, is expected to exceed those in Russia and CEE significantly, on ING assumptions. We expect the Turkish loan market to grow 30% in 2010, followed by 25% in 2011. We reckon these rates will be hard to beat in most other markets, emerging or “developed” alike.
Turkish Banks November 2010
4
Fig 2 Loan growth in context
-15.0
0.0
15.0
30.0
45.0
60.0
75.0
90.0
2005 2006 2007 2008 2009 2010F 2011F 2012F
Czech Republic Hungary Poland Russia Turkey
Source: ING estimates
Mortgages make up 10% of all loans or 4.5% of GDP Mortgages make up just over 10% of total loans outstanding in the sector, or 4.5% of GDP. As such, mortgages are not large enough to drive loan demand per se. Mainstream Turkish borrowers are still on the sidelines despite a recovery in demand. Growth in mortgages over the next five years should outpace other loan categories and products. We would expect mortgages to grow twice as fast as other loans and reach 25% of loans outstanding by 2016, from 10% currently.
Fig 3 Mortgages vs borrowing rate
0.0
10.0
20.0
30.0
40.0
50.0
60.0
Dec
-02
Mar
-03
Jun-
03
Sep
-03
Dec
-03
Mar
-04
Jun-
04
Sep
-04
Dec
-04
Mar
-05
Jun-
05
Sep
-05
Dec
-05
Mar
-06
Jun-
06
Sep
-06
Dec
-06
Mar
-07
Jun-
07
Sep
-07
Dec
-07
Mar
-08
Jun-
08
Sep
-08
Dec
-08
Mar
-09
Jun-
09
Sep
-09
Dec
-09
Mar
-10
Jun-
10
(TLb
n)
0.0
10.0
20.0
30.0
40.0
50.0
60.0
70.0
(%)
Mortgage loans (lhs) Housing rates
Source: BRSA
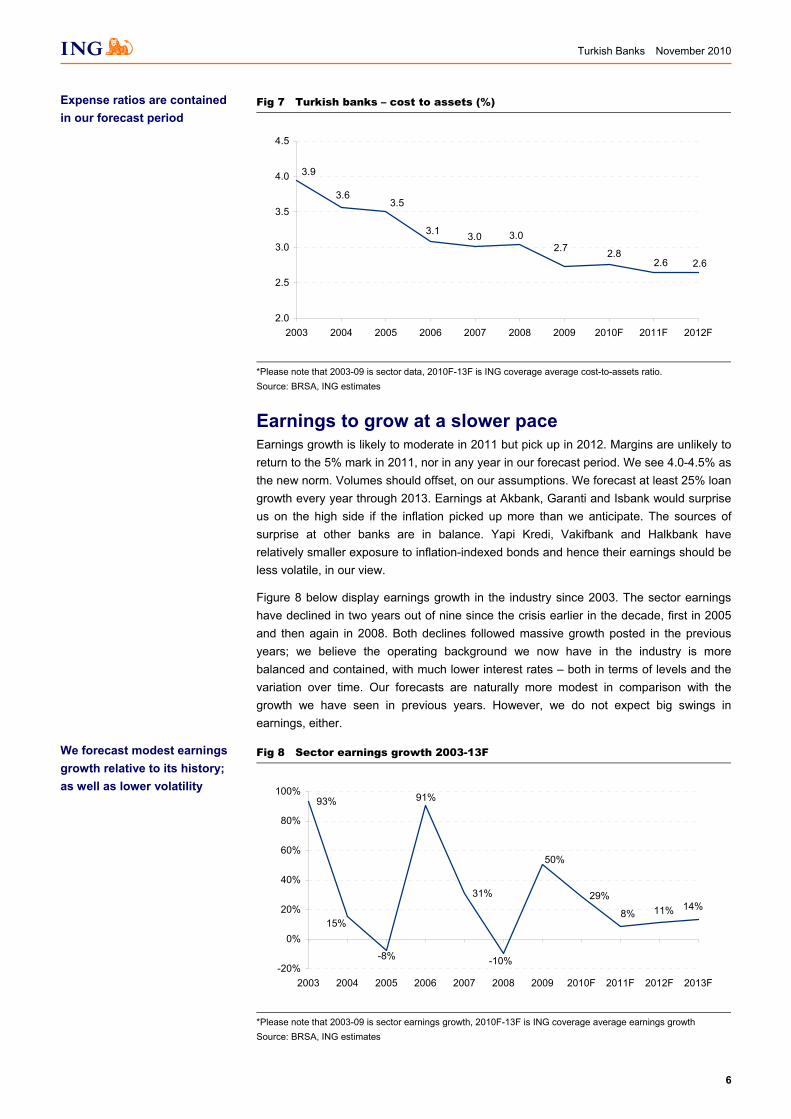
Capital ratios are high and the LDRs low The capital levels are adequate at all the banks we follow, in our view. The sector’s average CAR stands at 19% as of June 2010, well above the regulatory requirement of 12%. Basel 3, if implemented, would reduce the total capital ratio by an average 150bp based on the guidance we have received from Turkish banks. The loan-to-deposit ratio (LDR) is 80% as at June 2010, giving ample room for balance sheet growth. We believe the industry LDR could rise to 100% in the next three years as banks redeploy their retiring bonds.
Loan growth in Turkey should outstrip elsewhere in EMEA
High CAR and low LDR give ample room for balance sheet growth
Turkish Banks November 2010
5
Fig 4 LDR vs CAR as at June 2010
AKBNK
GARANSectorVAKBN
YKBNK
FINBN
DENIZ
FORTS
TEB
HALKB
TSKB
ISCTR
40
60
80
100
120
140
12 14 16 18 20 22 24 26
CAR (%)
LDR
(%)
Source: Company data, ING estimates
Fig 5 CAR (%) as at June 2010
Fig 6 Tier-1 (%) as at June 2010
0
10
20
30
TSKB
Teksti
l Ban
k
Akban
k
Garanti
Sector
Isban
k
Denizb
ank
Finans
bank
Fortis
Yapi K
redi
TEB
Halkba
nk
Vakifb
ank
Sekerb
ank
0
5
10
15
20
25
TSKB
Teksti
l Ban
k
Akban
kSec
tor
Garanti
Isban
kFort
is
Halkba
nk
Denizb
ank
Vakifb
ank
Sekerb
ank
Yapi K
redi
TEB
Finans
bank
Source: Company data, ING estimates Source: Company data, ING estimates
Other cost lines are contained Other lines in banking sector income statements are unlikely to drag earnings in 2011. Cost of risk is still a source of positive surprise, in our view. Credit cycle in Turkey has recovered and 2010 is the first full year of the new growth cycle. SME balance sheets have improved; the banks are collecting bad debt faster than they accumulate NPLs. We may see the split between collections and new NPLs levelling off in 1Q11/2Q11 with loan growth continuing. Considering where we are in the cycle, we believe provisions could still surprise for the better: we forecast cost of risk to fall below 1% at major Turkish banks by the end of 2011, from an estimated average of 1.3% in 2010.
Cost of risk to approach normalised levels in 2011F
Turkish Banks November 2010
6
Fig 7 Turkish banks – cost to assets (%)
3.6
3.9
2.73.03.03.1
3.5
2.82.6 2.6
2.0
2.5
3.0
3.5
4.0
4.5
2003 2004 2005 2006 2007 2008 2009 2010F 2011F 2012F
*Please note that 2003-09 is sector data, 2010F-13F is ING coverage average cost-to-assets ratio. Source: BRSA, ING estimates
Earnings to grow at a slower pace Earnings growth is likely to moderate in 2011 but pick up in 2012. Margins are unlikely to return to the 5% mark in 2011, nor in any year in our forecast period. We see 4.0-4.5% as the new norm. Volumes should offset, on our assumptions. We forecast at least 25% loan growth every year through 2013. Earnings at Akbank, Garanti and Isbank would surprise us on the high side if the inflation picked up more than we anticipate. The sources of surprise at other banks are in balance. Yapi Kredi, Vakifbank and Halkbank have relatively smaller exposure to inflation-indexed bonds and hence their earnings should be less volatile, in our view.
Figure 8 below display earnings growth in the industry since 2003. The sector earnings have declined in two years out of nine since the crisis earlier in the decade, first in 2005 and then again in 2008. Both declines followed massive growth posted in the previous years; we believe the operating background we now have in the industry is more balanced and contained, with much lower interest rates – both in terms of levels and the variation over time. Our forecasts are naturally more modest in comparison with the growth we have seen in previous years. However, we do not expect big swings in earnings, either.
Fig 8 Sector earnings growth 2003-13F
93%
31% 29%14%11%8%
91%
50%
-10%-8%
15%
-20%
0%
20%
40%
60%
80%
100%
2003 2004 2005 2006 2007 2008 2009 2010F 2011F 2012F 2013F
*Please note that 2003-09 is sector earnings growth, 2010F-13F is ING coverage average earnings growth Source: BRSA, ING estimates
We forecast modest earnings growth relative to its history; as well as lower volatility
Expense ratios are contained in our forecast period
Turkish Banks November 2010
7
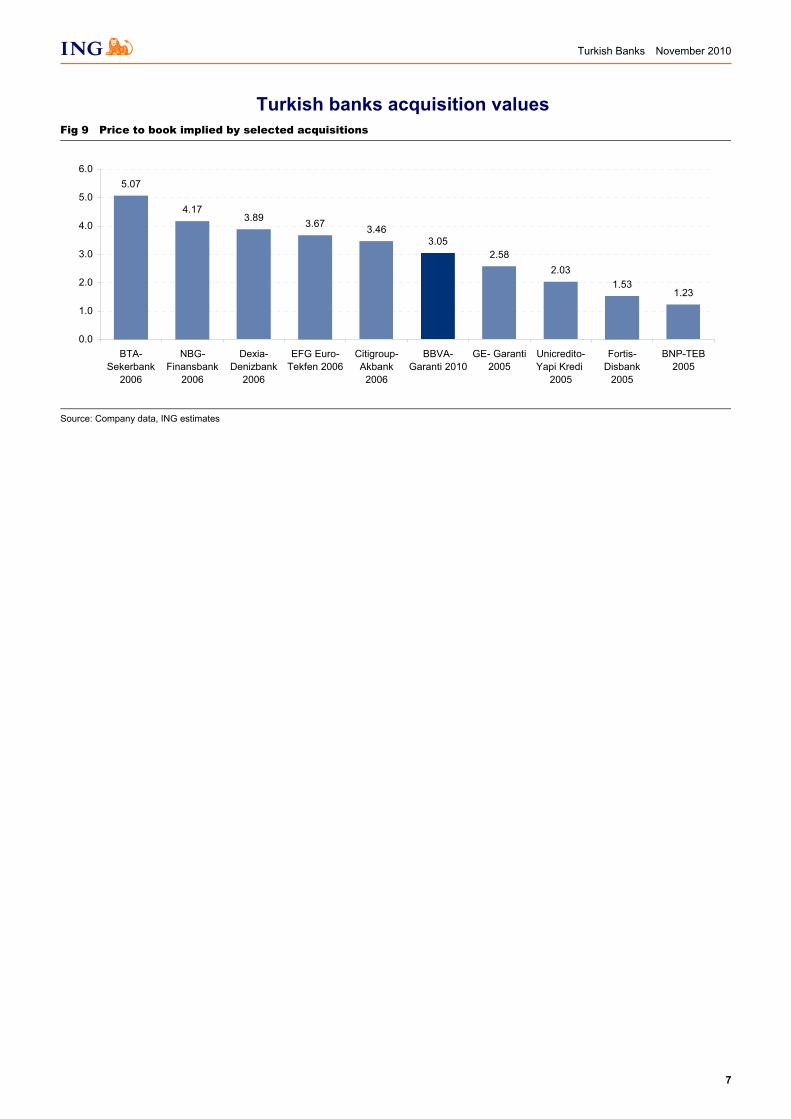
Turkish banks acquisition values Fig 9 Price to book implied by selected acquisitions
5.07
4.173.89 3.67 3.46
3.052.58
2.031.53
1.23
0.0
1.0
2.0
3.0
4.0
5.0
6.0
BTA-Sekerbank
2006
NBG-Finansbank
2006
Dexia-Denizbank
2006
EFG Euro-Tekfen 2006
Citigroup-Akbank
2006
BBVA-Garanti 2010
GE- Garanti2005
Unicredito-Yapi Kredi
2005
Fortis-Disbank
2005
BNP-TEB2005
Source: Company data, ING estimates
Turkish Banks November 2010
8
Recommendation Forecast revisions We have fine-tuned our forecasts and rolled over the forecast period. Our target values are now higher because we have: (1) reduced cost of equity by 100bp; (2) raised our 2011 loan growth expectation to 25% (coverage average) from 17% previously; and (3) rolled over the forecast period one year. A summary of revisions, old and new target prices, and our ratings are displayed in Figure 9.
Fig 10 Forecast revisions (TL)
Share price Old target New target Upside (%) Old EPS 11F New EPS 11F Old rating New rating
Akbank 9.00 6.00 8.13 -9.6 0.70 0.82 Sell SELLFortis Bank 2.32 1.65 2.28 -1.8 0.17 0.20 Hold HOLDGaranti 8.80 7.50 10.47 19.0 0.89 0.78 Buy BUYHalkbank 14.50 9.47 16.60 14.5 1.18 1.73 Hold HOLDIsbank 6.45 4.77 7.48 15.9 0.53 0.68 Buy BUYSekerbank 1.82 1.73 2.65 45.4 0.33 0.25 Hold BUYTEB 2.46 2.24 3.34 35.9 0.29 0.27 Buy BUYTSKB 2.64 2.37 3.11 17.7 0.38 0.35 Buy BUYVakifbank 4.64 3.15 4.78 3.0 0.42 0.43 Hold HOLDYapi Kredi 5.50 4.50 6.78 23.3 0.54 0.56 Buy BUY
Priced on 28 October 2010 Source: ING estimates
We remain BUYers of Isbank, Yapi Kredi and Garanti The stocks have had a good run since 2009 and the share price trajectory should be less steep while the share price gains are likely to moderate. The sources of surprise at other banks are in balance. Among the major banks, we remain BUYers of Isbank, Yapi Kredi and Garanti. Isbank should earn an average 20% ROE in our forecast period (2011-13) and we see Yapi Kredi and Garanti earning an average ROE of c.21% over the same period.
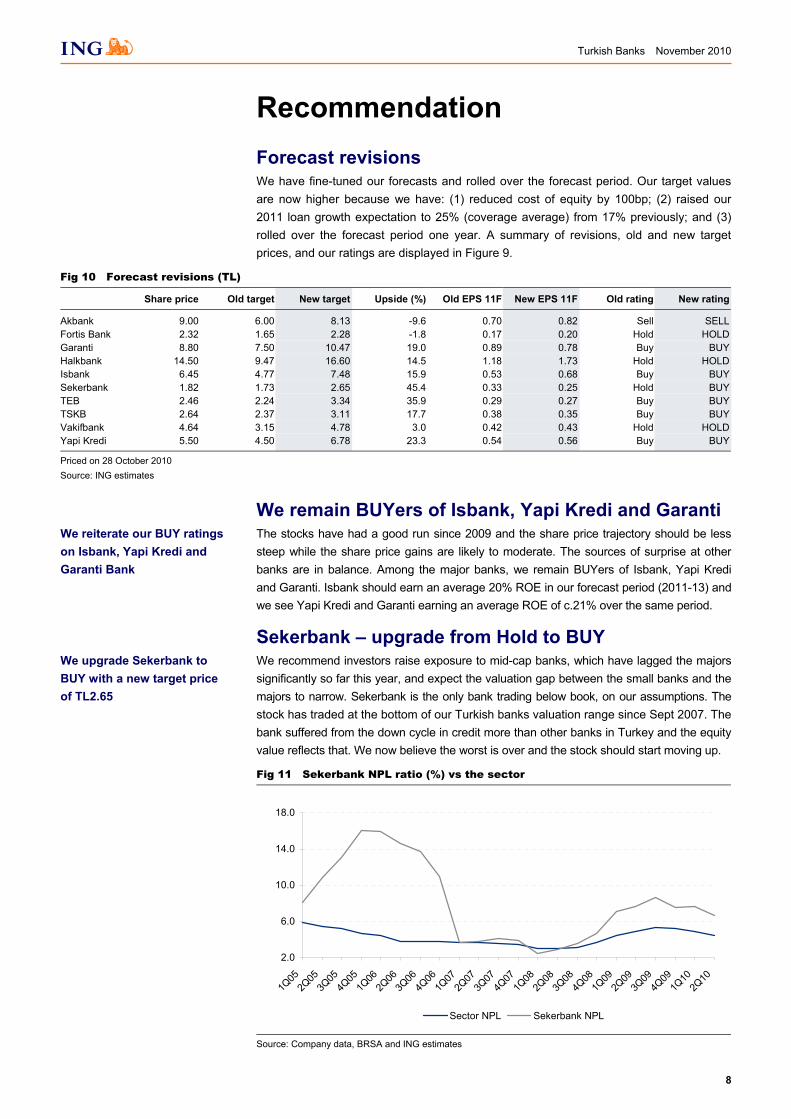
Sekerbank – upgrade from Hold to BUY We recommend investors raise exposure to mid-cap banks, which have lagged the majors significantly so far this year, and expect the valuation gap between the small banks and the majors to narrow. Sekerbank is the only bank trading below book, on our assumptions. The stock has traded at the bottom of our Turkish banks valuation range since Sept 2007. The bank suffered from the down cycle in credit more than other banks in Turkey and the equity value reflects that. We now believe the worst is over and the stock should start moving up.
Fig 11 Sekerbank NPL ratio (%) vs the sector
2.0
6.0
10.0
14.0
18.0
1Q05
2Q05
3Q05
4Q05
1Q06
2Q06
3Q06
4Q06
1Q07
2Q07
3Q07
4Q07
1Q08
2Q08
3Q08
4Q08
1Q09
2Q09
3Q09
4Q09
1Q10
2Q10
Sector NPL Sekerbank NPL
Source: Company data, BRSA and ING estimates
We upgrade Sekerbank to BUY with a new target price of TL2.65
We reiterate our BUY ratings on Isbank, Yapi Kredi and Garanti Bank

Turkish Banks November 2010
9
TEB and TSKB – BUY reiterated We reiterate our BUY ratings in TSKB and TEB with target values revised upwards. There are three factors which should make TSKB more appealing to investors this time. First, their margins are less likely to decline in 2011. Second, they have raised the payout ratio in 2010 to 20%, from 0% in 2009. We believe the pay-out may be further upgraded in 2011. Third, the stock remains cheap despite strong outperformance trading on 7.5x EPS and 1.4x book (2011F). We have revisited our model and raised estimates and the target equity value. Our new target price offers 17% upside.
Turkish Banks November 2010
10
Valuation
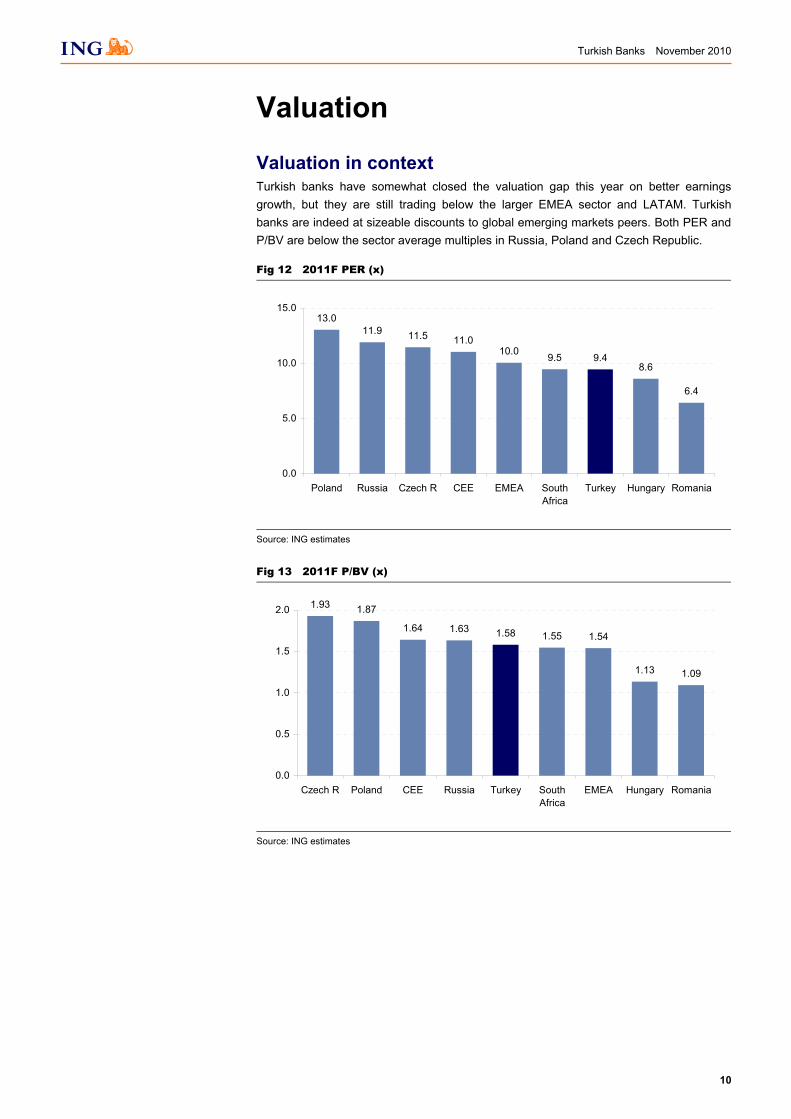
Valuation in context Turkish banks have somewhat closed the valuation gap this year on better earnings growth, but they are still trading below the larger EMEA sector and LATAM. Turkish banks are indeed at sizeable discounts to global emerging markets peers. Both PER and P/BV are below the sector average multiples in Russia, Poland and Czech Republic.
Fig 12 2011F PER (x)
13.011.9
11.010.0 9.5 9.4
6.4
8.6
11.5
0.0
5.0
10.0
15.0
Poland Russia Czech R CEE EMEA SouthAfrica
Turkey Hungary Romania
Source: ING estimates
Fig 13 2011F P/BV (x)
1.93 1.87
1.63 1.58 1.55 1.54
1.09
1.64
1.13
0.0
0.5
1.0
1.5
2.0
Czech R Poland CEE Russia Turkey SouthAfrica
EMEA Hungary Romania
Source: ING estimates
Turkish Banks November 2010
11
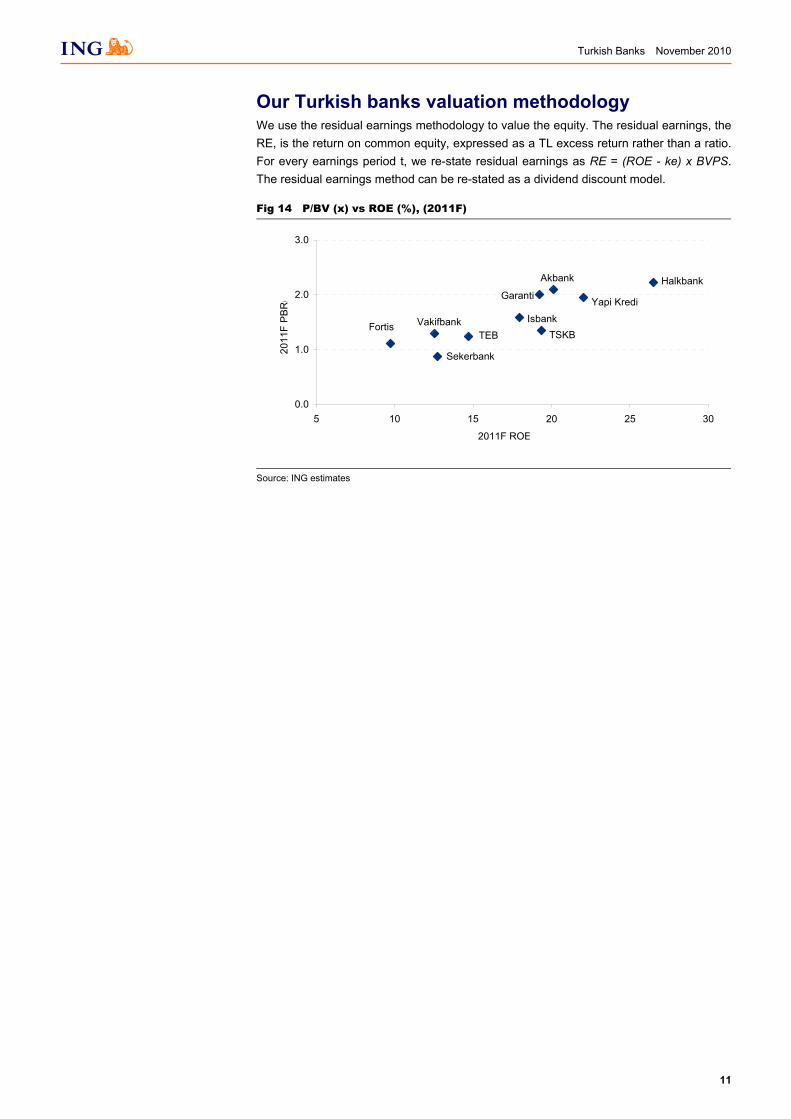
Our Turkish banks valuation methodology We use the residual earnings methodology to value the equity. The residual earnings, the RE, is the return on common equity, expressed as a TL excess return rather than a ratio. For every earnings period t, we re-state residual earnings as RE = (ROE - ke) x BVPS. The residual earnings method can be re-stated as a dividend discount model.
Fig 14 P/BV (x) vs ROE (%), (2011F)
Akbank
Garanti
IsbankVakifbank
Yapi Kredi
Sekerbank
FortisTEB
Halkbank
TSKB
0.0
1.0
2.0
3.0
5 10 15 20 25 30
2011F ROE(%)
2011
F P
BR
(x)
Source: ING estimates
Turkish Banks November 2010
12
Consensus
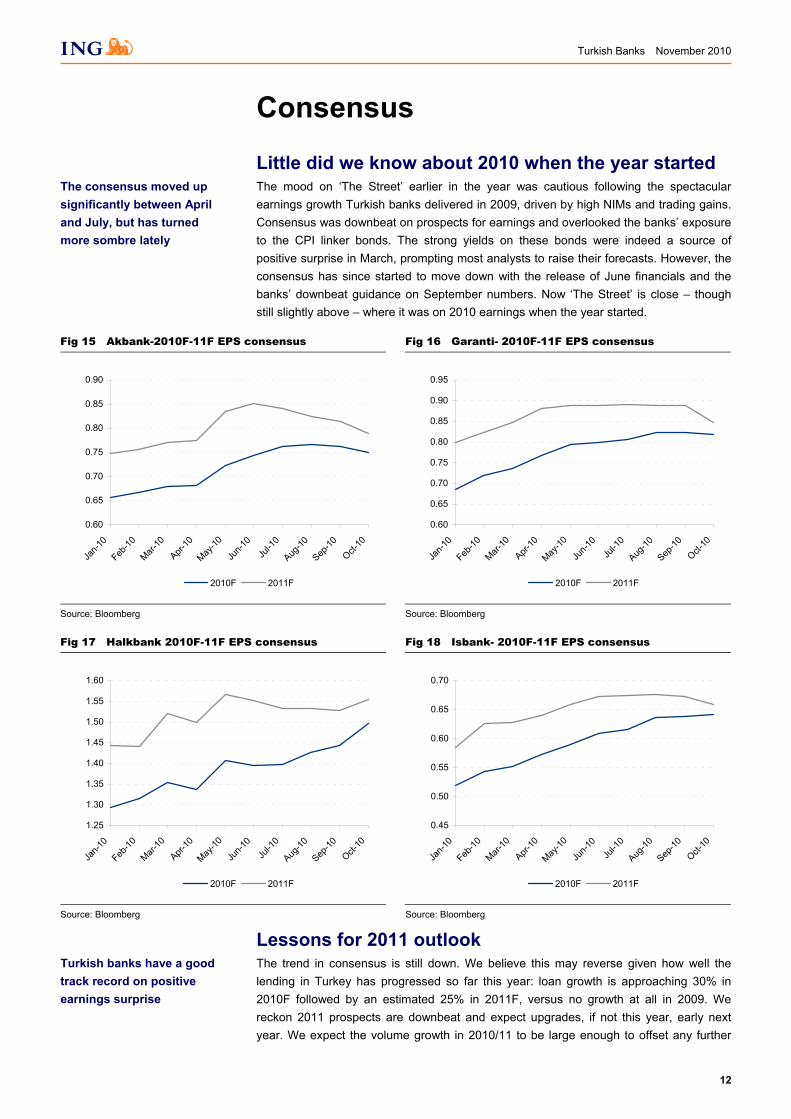
Little did we know about 2010 when the year started The mood on ‘The Street’ earlier in the year was cautious following the spectacular earnings growth Turkish banks delivered in 2009, driven by high NIMs and trading gains. Consensus was downbeat on prospects for earnings and overlooked the banks’ exposure to the CPI linker bonds. The strong yields on these bonds were indeed a source of positive surprise in March, prompting most analysts to raise their forecasts. However, the consensus has since started to move down with the release of June financials and the banks’ downbeat guidance on September numbers. Now ‘The Street’ is close – though still slightly above – where it was on 2010 earnings when the year started.
Fig 15 Akbank-2010F-11F EPS consensus
Fig 16 Garanti- 2010F-11F EPS consensus
0.60
0.65
0.70
0.75
0.80
0.85
0.90
Jan-1
0
Feb-10
Mar-10
Apr-10
May-10
Jun-1
0Ju
l-10
Aug-10
Sep-10
Oct-10
2010F 2011F
0.60
0.65
0.70
0.75
0.80
0.85
0.90
0.95
Jan-1
0
Feb-10
Mar-10
Apr-10
May-10
Jun-1
0Ju
l-10
Aug-10
Sep-10
Oct-10
2010F 2011F
Source: Bloomberg Source: Bloomberg
Fig 17 Halkbank 2010F-11F EPS consensus
Fig 18 Isbank- 2010F-11F EPS consensus
1.25
1.30
1.35
1.40
1.45
1.50
1.55
1.60
Jan-1
0
Feb-10
Mar-10
Apr-10
May-10
Jun-1
0Ju
l-10
Aug-10
Sep-10
Oct-10
2010F 2011F
0.45
0.50
0.55
0.60
0.65
0.70
Jan-1
0
Feb-10
Mar-10
Apr-10
May-10
Jun-1
0Ju
l-10
Aug-10
Sep-10
Oct-10
2010F 2011F
Source: Bloomberg Source: Bloomberg
Lessons for 2011 outlook The trend in consensus is still down. We believe this may reverse given how well the lending in Turkey has progressed so far this year: loan growth is approaching 30% in 2010F followed by an estimated 25% in 2011F, versus no growth at all in 2009. We reckon 2011 prospects are downbeat and expect upgrades, if not this year, early next year. We expect the volume growth in 2010/11 to be large enough to offset any further
The consensus moved up significantly between April and July, but has turned more sombre lately
Turkish banks have a good track record on positive earnings surprise
Turkish Banks November 2010
13
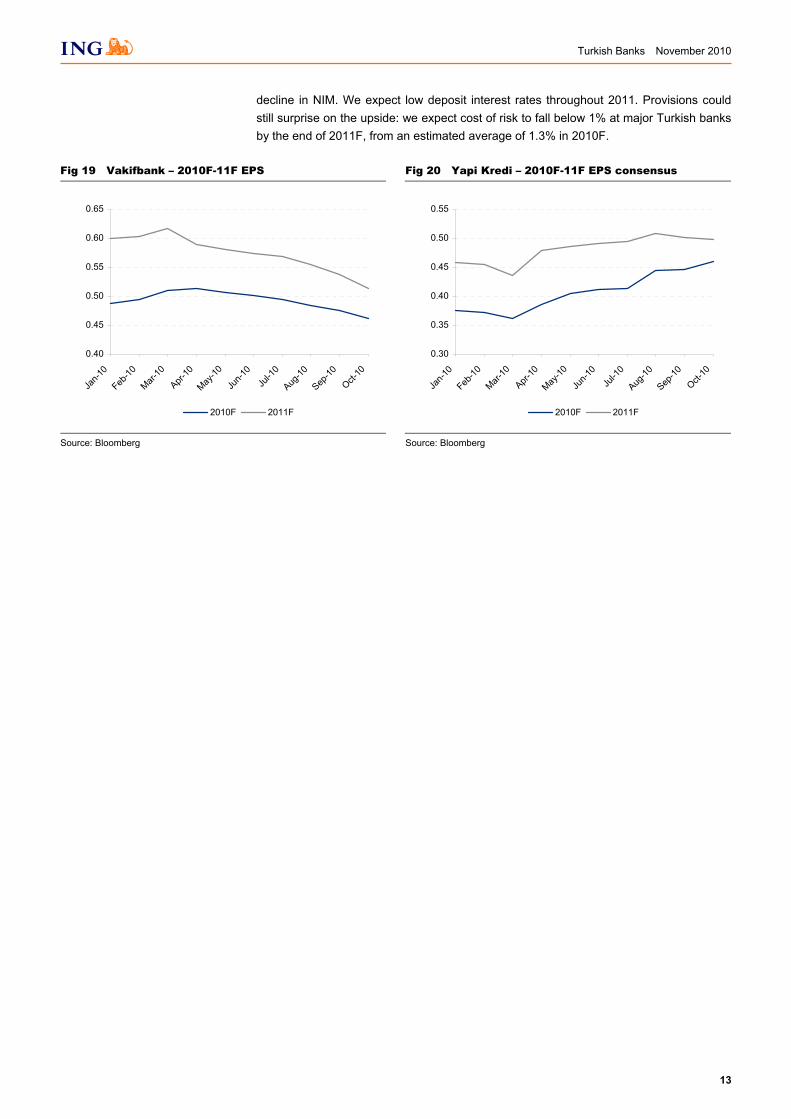
decline in NIM. We expect low deposit interest rates throughout 2011. Provisions could still surprise on the upside: we expect cost of risk to fall below 1% at major Turkish banks by the end of 2011F, from an estimated average of 1.3% in 2010F.
Fig 19 Vakifbank – 2010F-11F EPS
Fig 20 Yapi Kredi – 2010F-11F EPS consensus
0.40
0.45
0.50
0.55
0.60
0.65
Jan-1
0
Feb-10
Mar-10
Apr-10
May-10
Jun-1
0Ju
l-10
Aug-10
Sep-10
Oct-10
2010F 2011F
0.30
0.35
0.40
0.45
0.50
0.55
Jan-1
0
Feb-10
Mar-10
Apr-10
May-10
Jun-1
0Ju
l-10
Aug-10
Sep-10
Oct-10
2010F 2011F
Source: Bloomberg Source: Bloomberg
Turkish Banks November 2010
14
Sources of risk We recognise: (1) yields on CPI-linked Turkish Treasury bonds; (2) asset disposals at selected banks; (3) industry loan growth; and (4) further decline in and normalisation of cost of risk, as sources of both upside and downside risks to our estimates. We list and discuss some of these factors below.
Inflation as a source of risk – upside and downside Inflation is a risk source for banks with exposure to indexed bonds. The indexed bonds are probably the most important source of surprise given how much the banks added in 3Q10. Earnings at Akbank, Garanti and Isbank would surprise us on the high side if the inflation increased more than we anticipate. Yapi Kredi, Vakifbank and Halkbank have relatively smaller exposure to inflation indexed bonds and hence their earnings should be less volatile, in our view. A 100bp surprise in inflation would alter earnings 2-3% in either direction at selected banks, notably Akbank, Garanti and Isbank. Our view on inflation is that it will be flat or down between now and the end of 2011. We are thus less enthusiastic about banks that have accumulated inflation indexed bonds.
Asset disposals as a source of upside risk We also see divestitures as sources of upside risk. There are four banks which could benefit from assets sales in the next two years. These are, in decreasing order of importance, Garanti Bank, Isbank, Yapi Kredi, and Vakifbank.
1) Garanti Bank is likely to sell down its remaining stake in insurance. Both the put option held by Garanti and the call option on Garanti Emeklilik, the life and pensions business, held by Eureka, are now exercisable. Management expects to exercise the put option and sell its 20% share in Garanti Sigorta, the non-life business, to Eureka, possibly later this year. The call option, if exercised, would add an estimated 17-18% to Garanti Bank’s 2011 earnings and the put option would contribute 3-4%.
2) Isbank may reduce its stake in Sisecam (currently 68%), in a secondary public offering. The restructuring in the insurance division is well underway and we are now expecting the bank’s stake in Anadolu Hayat, the life insurance subsidiary, to come under Milli Re. Isbank may consider selling shares in Milli Re in an IPO. Both the Sisecam SPO and a potential Milli Re IPO should unlock value at the Isbank level. Our estimates and valuation do not factor in any asset sales or equity offerings.
3) Yapi Kredi may sell its controlling stake in Yapi Kredi Sigorta (74%). The prospects are less clear on this but if the bank did sell its insurance subsidiary in 2011, this would conservatively add an estimated 15% to earnings, on our preliminary assumptions on valuation.
4) Vakifbank also has a stake in Güneş Sigorta, part-owned by Groupama SA. Looking at the M&A activity of late in the Turkish insurance sector, we believe Vakifbank may want to sell its 34% stake in Güneş. Groupama has already declared its interest. Earlier this year NKSJ Holdings Inc. agreed to acquire Fiba Sigorta AS, an insurance business.
Inflation is a risk source for banks with exposure to indexed bonds. The indexed bonds are probably the most important source of surprise given how much the banks added in 3Q10. A 100bp surprise in inflation would alter earnings 2-3% in either direction at selected banks, notably Akbank, Garanti and Isbank.
Garanti Bank: further stake sale in insurance
Isbank and potential asset disposals: Sisecam and Milli Re
Yapi Kredi and Yapi Kredi Sigorta
Vakifbank and Güneş Sigorta
Turkish Banks November 2010
15
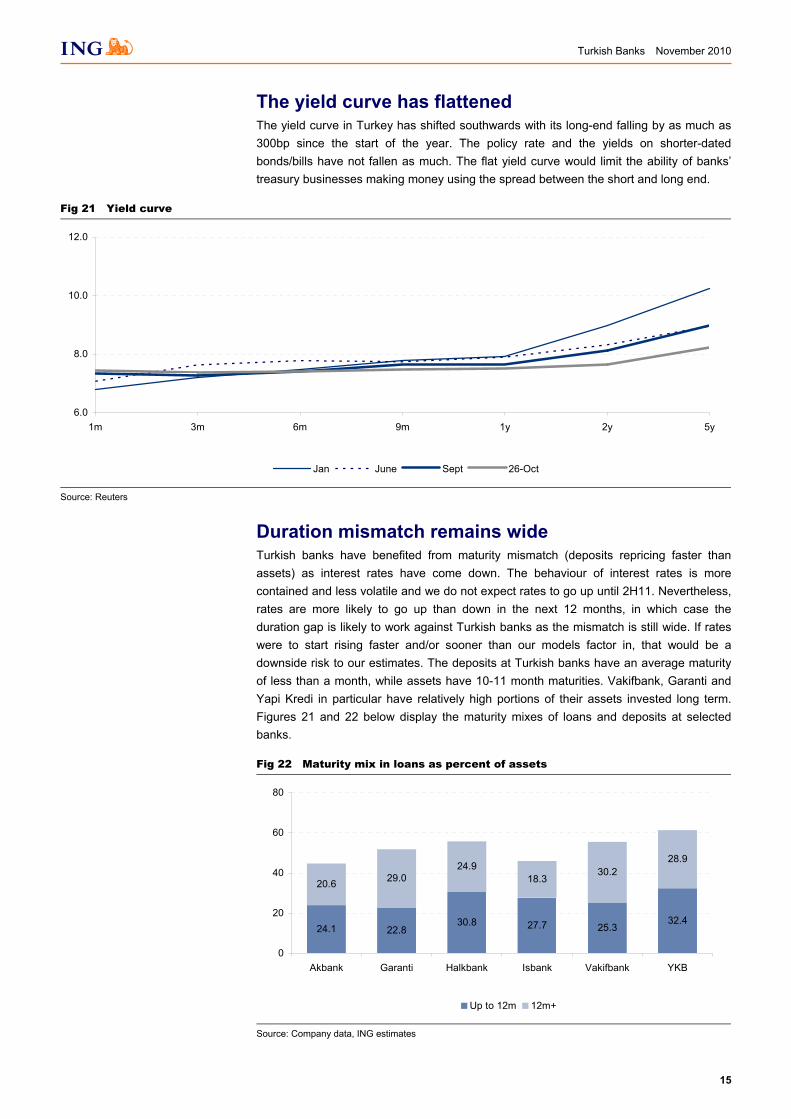
The yield curve has flattened The yield curve in Turkey has shifted southwards with its long-end falling by as much as 300bp since the start of the year. The policy rate and the yields on shorter-dated bonds/bills have not fallen as much. The flat yield curve would limit the ability of banks’ treasury businesses making money using the spread between the short and long end.
Fig 21 Yield curve
6.0
8.0
10.0
12.0
1m 3m 6m 9m 1y 2y 5y
Jan June Sept 26-Oct
Source: Reuters
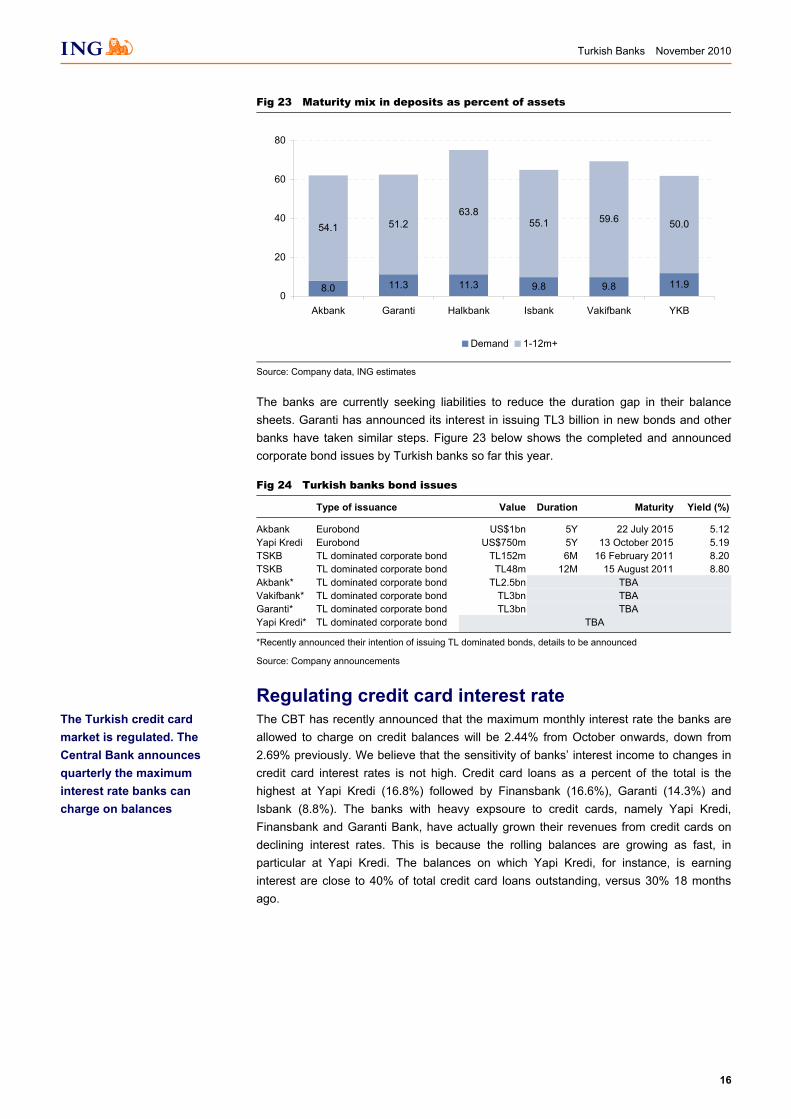
Duration mismatch remains wide Turkish banks have benefited from maturity mismatch (deposits repricing faster than assets) as interest rates have come down. The behaviour of interest rates is more contained and less volatile and we do not expect rates to go up until 2H11. Nevertheless, rates are more likely to go up than down in the next 12 months, in which case the duration gap is likely to work against Turkish banks as the mismatch is still wide. If rates were to start rising faster and/or sooner than our models factor in, that would be a downside risk to our estimates. The deposits at Turkish banks have an average maturity of less than a month, while assets have 10-11 month maturities. Vakifbank, Garanti and Yapi Kredi in particular have relatively high portions of their assets invested long term. Figures 21 and 22 below display the maturity mixes of loans and deposits at selected banks.
Fig 22 Maturity mix in loans as percent of assets
24.1 22.830.8 27.7 25.3
32.4
20.6 29.024.9
18.330.2
28.9
0
20
40
60
80
Akbank Garanti Halkbank Isbank Vakifbank YKB
Up to 12m 12m+
Source: Company data, ING estimates
Turkish Banks November 2010
16
Fig 23 Maturity mix in deposits as percent of assets
8.0 11.3 11.3 9.8 9.8 11.9
54.1 51.263.8
55.1 59.6 50.0
0
20
40
60
80
Akbank Garanti Halkbank Isbank Vakifbank YKB
Demand 1-12m+
Source: Company data, ING estimates
The banks are currently seeking liabilities to reduce the duration gap in their balance sheets. Garanti has announced its interest in issuing TL3 billion in new bonds and other banks have taken similar steps. Figure 23 below shows the completed and announced corporate bond issues by Turkish banks so far this year.
Fig 24 Turkish banks bond issues
Type of issuance Value Duration Maturity Yield (%)
Akbank Eurobond US$1bn 5Y 22 July 2015 5.12Yapi Kredi Eurobond US$750m 5Y 13 October 2015 5.19TSKB TL dominated corporate bond TL152m 6M 16 February 2011 8.20TSKB TL dominated corporate bond TL48m 12M 15 August 2011 8.80Akbank* TL dominated corporate bond TL2.5bn TBA Vakifbank* TL dominated corporate bond TL3bn TBA Garanti* TL dominated corporate bond TL3bn TBA Yapi Kredi* TL dominated corporate bond TBA
*Recently announced their intention of issuing TL dominated bonds, details to be announced
Source: Company announcements
Regulating credit card interest rate The CBT has recently announced that the maximum monthly interest rate the banks are allowed to charge on credit balances will be 2.44% from October onwards, down from 2.69% previously. We believe that the sensitivity of banks’ interest income to changes in credit card interest rates is not high. Credit card loans as a percent of the total is the highest at Yapi Kredi (16.8%) followed by Finansbank (16.6%), Garanti (14.3%) and Isbank (8.8%). The banks with heavy expsoure to credit cards, namely Yapi Kredi, Finansbank and Garanti Bank, have actually grown their revenues from credit cards on declining interest rates. This is because the rolling balances are growing as fast, in particular at Yapi Kredi. The balances on which Yapi Kredi, for instance, is earning interest are close to 40% of total credit card loans outstanding, versus 30% 18 months ago.
The Turkish credit card market is regulated. The Central Bank announces quarterly the maximum interest rate banks can charge on balances
Turkish Banks November 2010
17
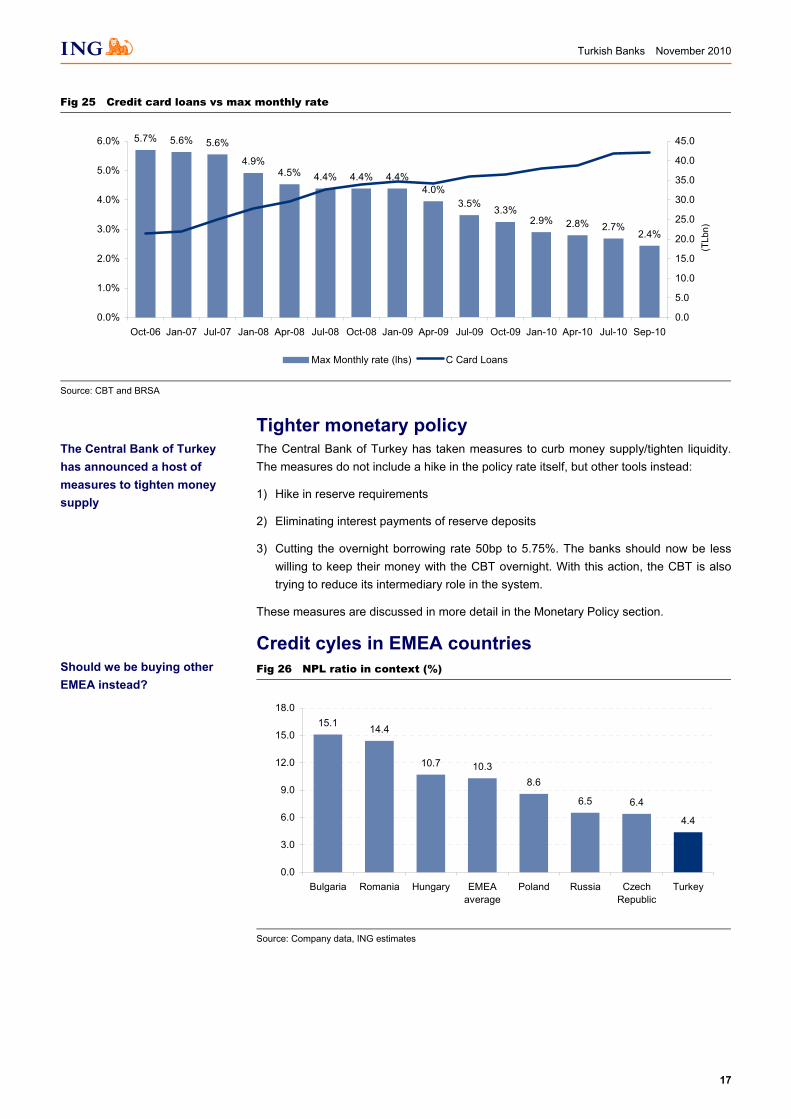
Fig 25 Credit card loans vs max monthly rate
5.7% 5.6% 5.6%
4.9%4.5% 4.4% 4.4% 4.4%
4.0%3.5%
3.3%2.9% 2.8% 2.7%
2.4%
0.0%
1.0%
2.0%
3.0%
4.0%
5.0%
6.0%
Oct-06 Jan-07 Jul-07 Jan-08 Apr-08 Jul-08 Oct-08 Jan-09 Apr-09 Jul-09 Oct-09 Jan-10 Apr-10 Jul-10 Sep-10
%
0.0
5.0
10.0
15.0
20.0
25.0
30.0
35.0
40.0
45.0
TLbn
Max Monthly rate (lhs) C Card Loans
Source: CBT and BRSA
Tighter monetary policy The Central Bank of Turkey has taken measures to curb money supply/tighten liquidity. The measures do not include a hike in the policy rate itself, but other tools instead:
1) Hike in reserve requirements
2) Eliminating interest payments of reserve deposits
3) Cutting the overnight borrowing rate 50bp to 5.75%. The banks should now be less willing to keep their money with the CBT overnight. With this action, the CBT is also trying to reduce its intermediary role in the system.
These measures are discussed in more detail in the Monetary Policy section.
Credit cyles in EMEA countries Fig 26 NPL ratio in context (%)
15.1 14.4
10.7 10.38.6
6.5 6.4
4.4
0.0
3.0
6.0
9.0
12.0
15.0
18.0
Bulgaria Romania Hungary EMEAaverage
Poland Russia CzechRepublic
Turkey
Source: Company data, ING estimates
The Central Bank of Turkey has announced a host of measures to tighten money supply
Should we be buying other EMEA instead?
(TLb
n)
Turkish Banks November 2010
18
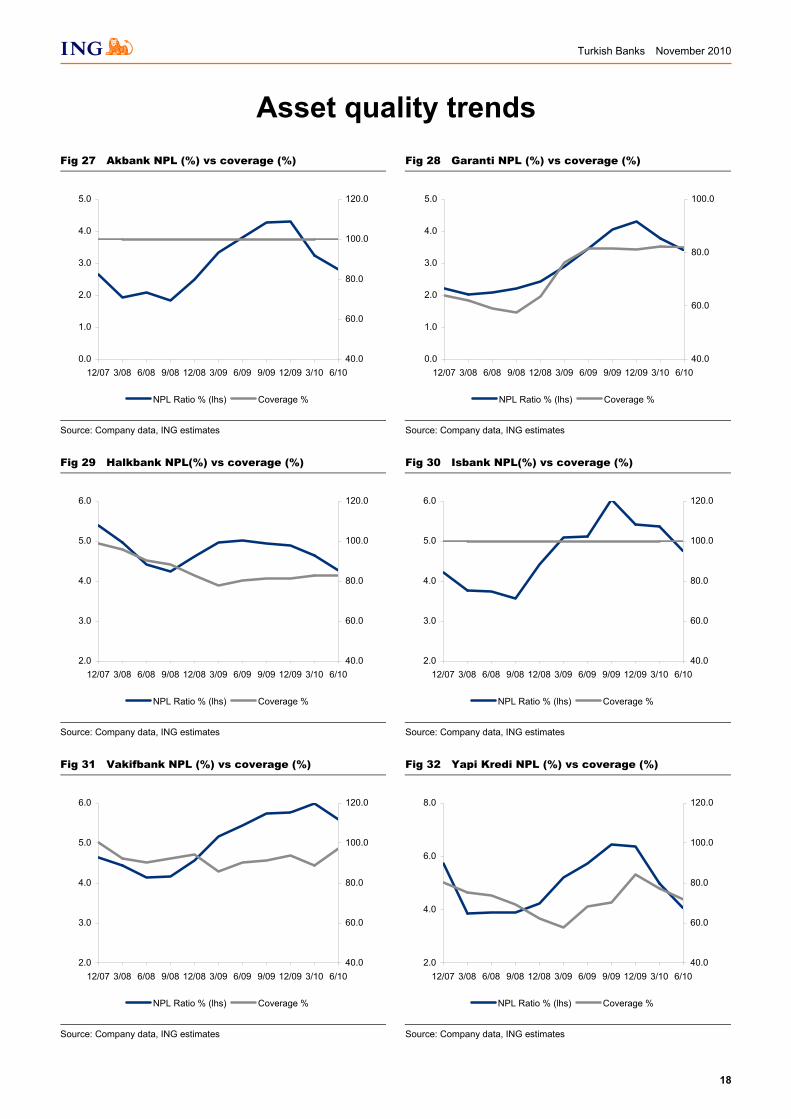
Asset quality trends Fig 27 Akbank NPL (%) vs coverage (%)
Fig 28 Garanti NPL (%) vs coverage (%)
0.0
1.0
2.0
3.0
4.0
5.0
12/07 3/08 6/08 9/08 12/08 3/09 6/09 9/09 12/09 3/10 6/1040.0
60.0
80.0
100.0
120.0
NPL Ratio % (lhs) Coverage %
0.0
1.0
2.0
3.0
4.0
5.0
12/07 3/08 6/08 9/08 12/08 3/09 6/09 9/09 12/09 3/10 6/1040.0
60.0
80.0
100.0
NPL Ratio % (lhs) Coverage %
Source: Company data, ING estimates Source: Company data, ING estimates
Fig 29 Halkbank NPL(%) vs coverage (%)
Fig 30 Isbank NPL(%) vs coverage (%)
2.0
3.0
4.0
5.0
6.0
12/07 3/08 6/08 9/08 12/08 3/09 6/09 9/09 12/09 3/10 6/1040.0
60.0
80.0
100.0
120.0
NPL Ratio % (lhs) Coverage %
2.0
3.0
4.0
5.0
6.0
12/07 3/08 6/08 9/08 12/08 3/09 6/09 9/09 12/09 3/10 6/1040.0
60.0
80.0
100.0
120.0
NPL Ratio % (lhs) Coverage %
Source: Company data, ING estimates Source: Company data, ING estimates
Fig 31 Vakifbank NPL (%) vs coverage (%)
Fig 32 Yapi Kredi NPL (%) vs coverage (%)
2.0
3.0
4.0
5.0
6.0
12/07 3/08 6/08 9/08 12/08 3/09 6/09 9/09 12/09 3/10 6/1040.0
60.0
80.0
100.0
120.0
NPL Ratio % (lhs) Coverage %
2.0
4.0
6.0
8.0
12/07 3/08 6/08 9/08 12/08 3/09 6/09 9/09 12/09 3/10 6/1040.0
60.0
80.0
100.0
120.0
NPL Ratio % (lhs) Coverage %
Source: Company data, ING estimates Source: Company data, ING estimates
Turkish Banks November 2010
19
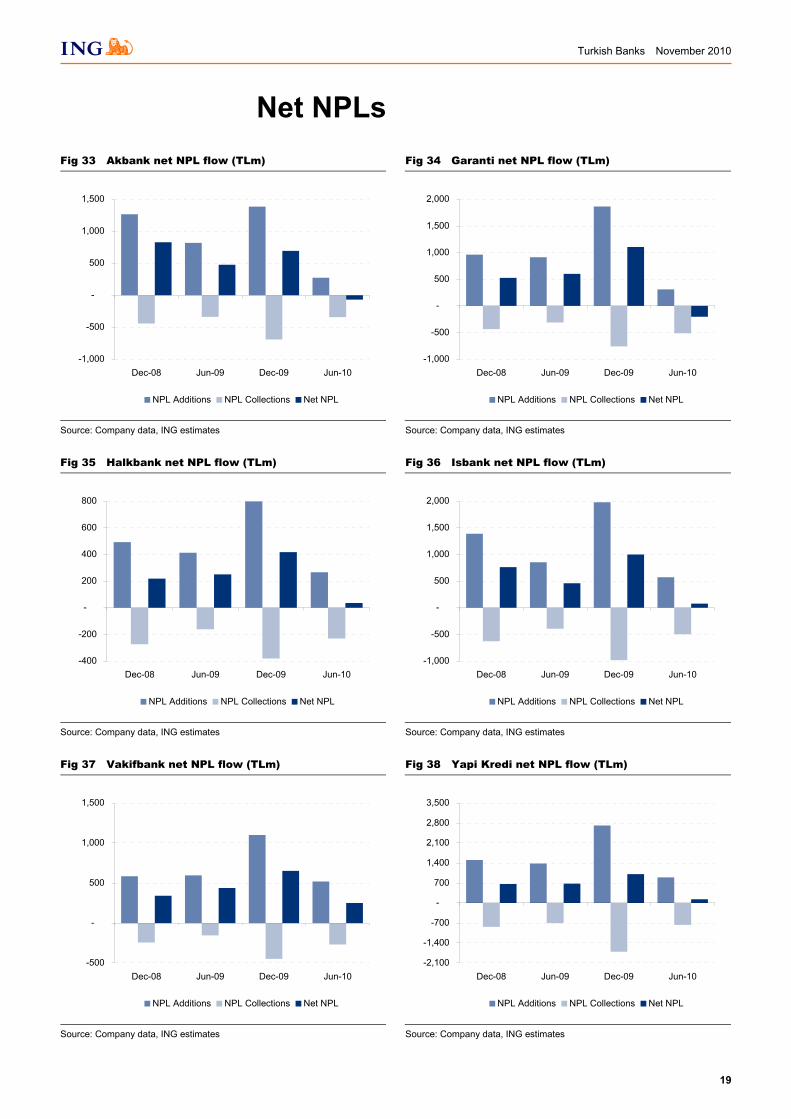
Net NPLs Fig 33 Akbank net NPL flow (TLm)
Fig 34 Garanti net NPL flow (TLm)
-1,000
-500
-
500
1,000
1,500
Dec-08 Jun-09 Dec-09 Jun-10
NPL Additions NPL Collections Net NPL
-1,000
-500
-
500
1,000
1,500
2,000
Dec-08 Jun-09 Dec-09 Jun-10
NPL Additions NPL Collections Net NPL
Source: Company data, ING estimates Source: Company data, ING estimates
Fig 35 Halkbank net NPL flow (TLm)
Fig 36 Isbank net NPL flow (TLm)
-400
-200
-
200
400
600
800
Dec-08 Jun-09 Dec-09 Jun-10
NPL Additions NPL Collections Net NPL
-1,000
-500
-
500
1,000
1,500
2,000
Dec-08 Jun-09 Dec-09 Jun-10
NPL Additions NPL Collections Net NPL
Source: Company data, ING estimates Source: Company data, ING estimates
Fig 37 Vakifbank net NPL flow (TLm)
Fig 38 Yapi Kredi net NPL flow (TLm)
-500
-
500
1,000
1,500
Dec-08 Jun-09 Dec-09 Jun-10
NPL Additions NPL Collections Net NPL
-2,100
-1,400
-700
-
700
1,400
2,100
2,800
3,500
Dec-08 Jun-09 Dec-09 Jun-10
NPL Additions NPL Collections Net NPL
Source: Company data, ING estimates Source: Company data, ING estimates
Turkish Banks November 2010
20
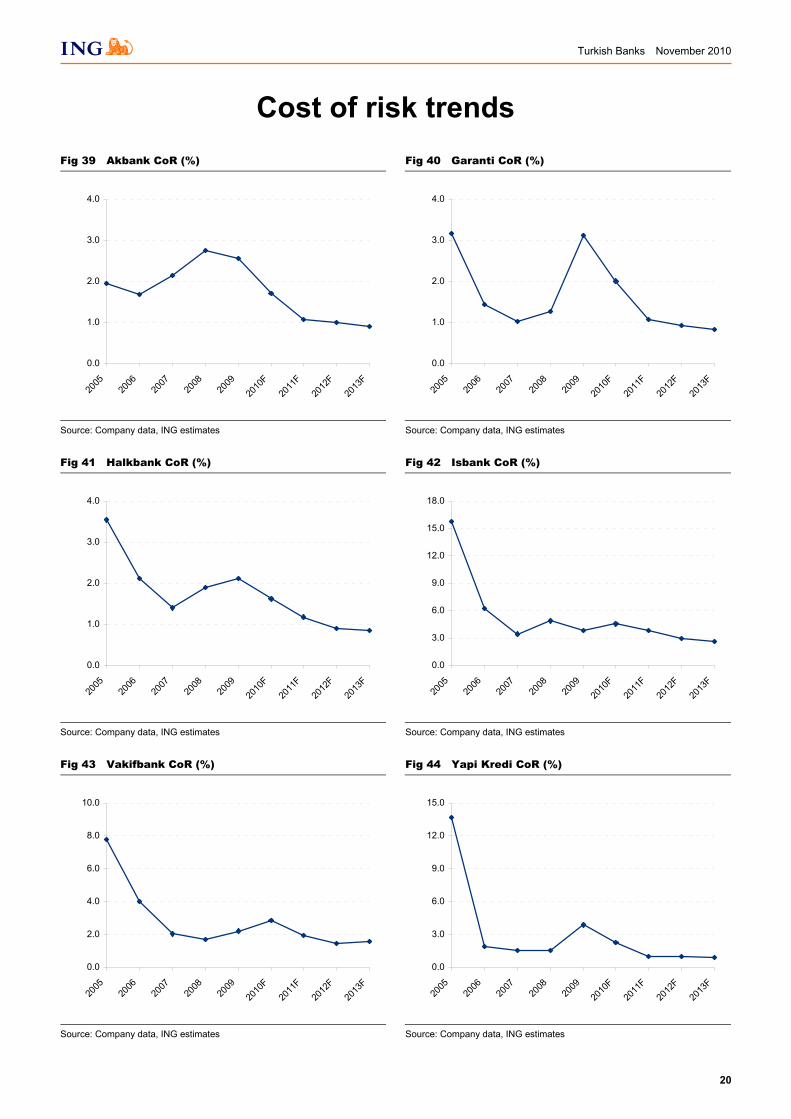
Cost of risk trends Fig 39 Akbank CoR (%)
Fig 40 Garanti CoR (%)
0.0
1.0
2.0
3.0
4.0
2005
2006
2007
2008
2009
2010
F20
11F
2012
F20
13F
0.0
1.0
2.0
3.0
4.0
2005
2006
2007
2008
2009
2010
F20
11F
2012
F20
13F
Source: Company data, ING estimates Source: Company data, ING estimates
Fig 41 Halkbank CoR (%)
Fig 42 Isbank CoR (%)
0.0
1.0
2.0
3.0
4.0
2005
2006
2007
2008
2009
2010
F20
11F
2012
F20
13F
0.0
3.0
6.0
9.0
12.0
15.0
18.0
2005
2006
2007
2008
2009
2010
F20
11F
2012
F20
13F
Source: Company data, ING estimates Source: Company data, ING estimates
Fig 43 Vakifbank CoR (%)
Fig 44 Yapi Kredi CoR (%)
0.0
2.0
4.0
6.0
8.0
10.0
2005
2006
2007
2008
2009
2010
F20
11F
2012
F20
13F
0.0
3.0
6.0
9.0
12.0
15.0
2005
2006
2007
2008
2009
2010
F20
11F
2012
F20
13F
Source: Company data, ING estimates Source: Company data, ING estimates
Turkish Banks November 2010
21
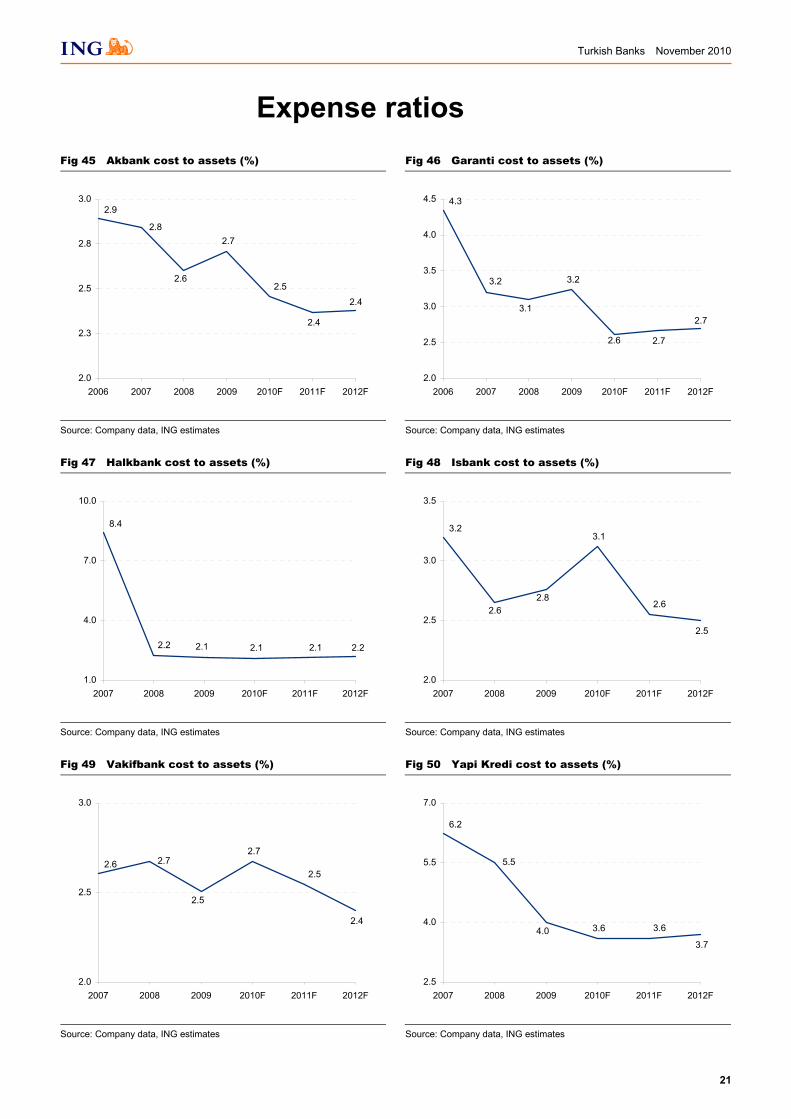
Expense ratios Fig 45 Akbank cost to assets (%)
Fig 46 Garanti cost to assets (%)
2.8
2.9
2.4
2.4
2.5
2.7
2.6
2.0
2.3
2.5
2.8
3.0
2006 2007 2008 2009 2010F 2011F 2012F
3.2
3.1
3.2
2.6 2.7
2.7
4.3
2.0
2.5
3.0
3.5
4.0
4.5
2006 2007 2008 2009 2010F 2011F 2012F
Source: Company data, ING estimates Source: Company data, ING estimates
Fig 47 Halkbank cost to assets (%)
Fig 48 Isbank cost to assets (%)
2.2
8.4
2.22.12.12.1
1.0
4.0
7.0
10.0
2007 2008 2009 2010F 2011F 2012F
2.62.8
3.1
2.6
2.5
3.2
2.0
2.5
3.0
3.5
2007 2008 2009 2010F 2011F 2012F
Source: Company data, ING estimates Source: Company data, ING estimates
Fig 49 Vakifbank cost to assets (%)
Fig 50 Yapi Kredi cost to assets (%)
2.72.6
2.4
2.5
2.7
2.5
2.0
2.5
3.0
2007 2008 2009 2010F 2011F 2012F
5.5
4.0 3.6 3.6
3.7
6.2
2.5
4.0
5.5
7.0
2007 2008 2009 2010F 2011F 2012F
Source: Company data, ING estimates Source: Company data, ING estimates
Turkish Banks November 2010
22
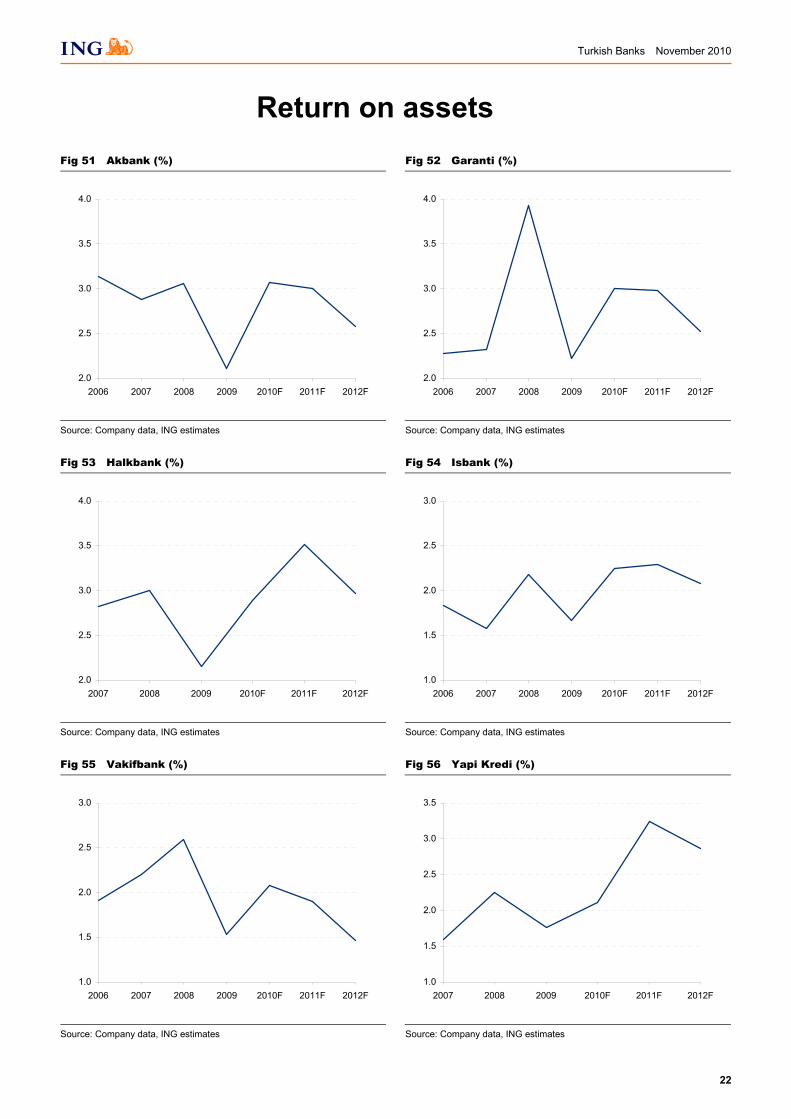
Return on assets Fig 51 Akbank (%)
Fig 52 Garanti (%)
2.0
2.5
3.0
3.5
4.0
2006 2007 2008 2009 2010F 2011F 2012F
2.0
2.5
3.0
3.5
4.0
2006 2007 2008 2009 2010F 2011F 2012F
Source: Company data, ING estimates Source: Company data, ING estimates
Fig 53 Halkbank (%)
Fig 54 Isbank (%)
2.0
2.5
3.0
3.5
4.0
2007 2008 2009 2010F 2011F 2012F
1.0
1.5
2.0
2.5
3.0
2006 2007 2008 2009 2010F 2011F 2012F
Source: Company data, ING estimates Source: Company data, ING estimates
Fig 55 Vakifbank (%)
Fig 56 Yapi Kredi (%)
1.0
1.5
2.0
2.5
3.0
2006 2007 2008 2009 2010F 2011F 2012F
1.0
1.5
2.0
2.5
3.0
3.5
2007 2008 2009 2010F 2011F 2012F
Source: Company data, ING estimates Source: Company data, ING estimates
Turkish Banks November 2010
23
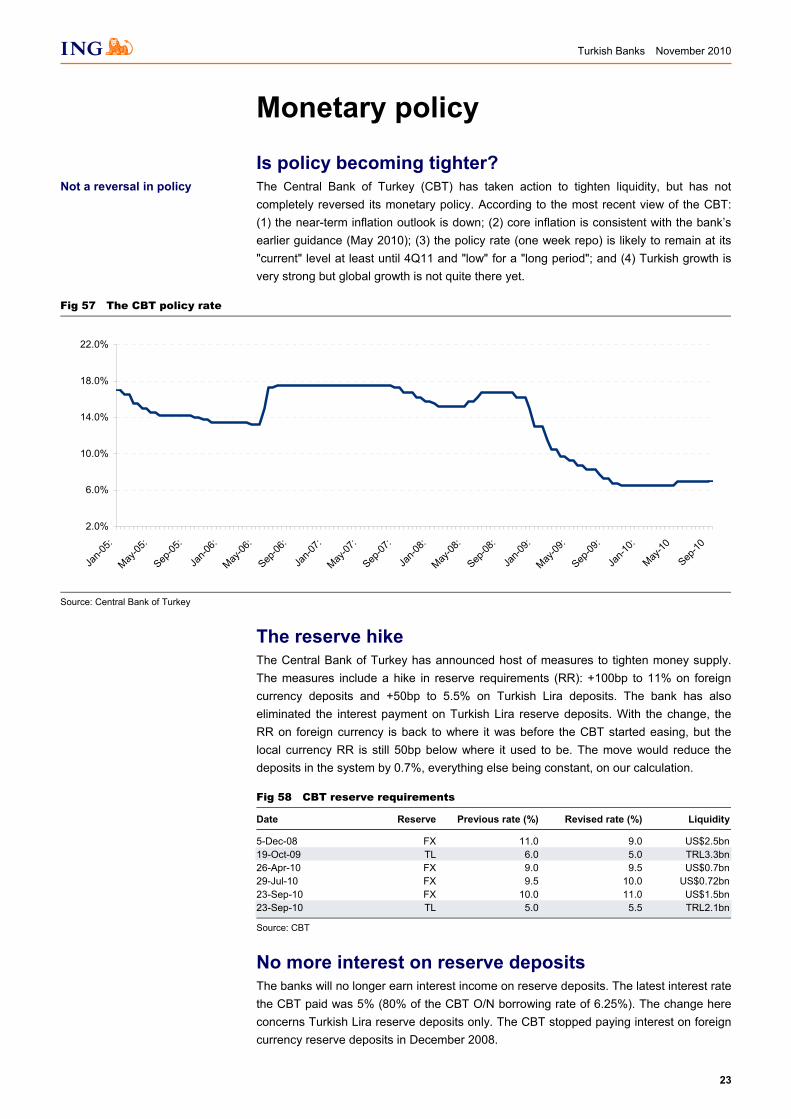
Monetary policy
Is policy becoming tighter? The Central Bank of Turkey (CBT) has taken action to tighten liquidity, but has not completely reversed its monetary policy. According to the most recent view of the CBT: (1) the near-term inflation outlook is down; (2) core inflation is consistent with the bank’s earlier guidance (May 2010); (3) the policy rate (one week repo) is likely to remain at its "current" level at least until 4Q11 and "low" for a "long period"; and (4) Turkish growth is very strong but global growth is not quite there yet.
Fig 57 The CBT policy rate
2.0%
6.0%
10.0%
14.0%
18.0%
22.0%
Jan-0
5:
May-05
:
Sep-05
:
Jan-0
6:
May-06
:
Sep-06
:
Jan-0
7:
May-07
:
Sep-07
:
Jan-0
8:
May-08
:
Sep-08
:
Jan-0
9:
May-09
:
Sep-09
:
Jan-1
0:
May-10
Sep-10
Source: Central Bank of Turkey
The reserve hike The Central Bank of Turkey has announced host of measures to tighten money supply. The measures include a hike in reserve requirements (RR): +100bp to 11% on foreign currency deposits and +50bp to 5.5% on Turkish Lira deposits. The bank has also eliminated the interest payment on Turkish Lira reserve deposits. With the change, the RR on foreign currency is back to where it was before the CBT started easing, but the local currency RR is still 50bp below where it used to be. The move would reduce the deposits in the system by 0.7%, everything else being constant, on our calculation.
Fig 58 CBT reserve requirements
Date Reserve Previous rate (%) Revised rate (%) Liquidity
5-Dec-08 FX 11.0 9.0 US$2.5bn19-Oct-09 TL 6.0 5.0 TRL3.3bn26-Apr-10 FX 9.0 9.5 US$0.7bn29-Jul-10 FX 9.5 10.0 US$0.72bn23-Sep-10 FX 10.0 11.0 US$1.5bn23-Sep-10 TL 5.0 5.5 TRL2.1bn
Source: CBT
No more interest on reserve deposits The banks will no longer earn interest income on reserve deposits. The latest interest rate the CBT paid was 5% (80% of the CBT O/N borrowing rate of 6.25%). The change here concerns Turkish Lira reserve deposits only. The CBT stopped paying interest on foreign currency reserve deposits in December 2008.
Not a reversal in policy
Turkish Banks November 2010
24
The Turkish Lira borrowing window is nearly shut In its most recent MPC meeting, the CBT kept the one-week repo rate at 7% as expected, but reduced the overnight borrowing rate 50bp to 5.75%. This is the rate banks get if they park their money with the CBT overnight. The CBT is trying to reduce its intermediary role in TL and asking banks to use interbank (lend/borrow among themselves) instead. The bank’s objective here is to decrease the end-of-day excess liquidity in the system, and they have been doing this since September.
Liquidity is tighter near term Both the reserve hike and the elimination of payments on reserve deposits are in line with the Central Bank’s “exit” strategy. The CBT has already guided the markets that it has looked to raise the RR and stop paying interest on TL reserves. Thus, there is no surprise here and the banks most likely knew when the actual announcement would come. We expect the policy rate to remain at 7% until after the elections. The CBT will find it hard to start hiking rates when the global stimuli is likely to continue in 2011 at a pace no slower than that in 2010, or before the Federal Reserve and ECB reverse their policies. We are also of the view that any negative impacts of the reserve hike and the elimination of interest payment on reserve deposits should be offset by the weekly repo rate remaining at its current level longer than the market expects.
Liquidity is tighter near-term but the policy rate should remain low for longer
Turkish Banks November 2010
25
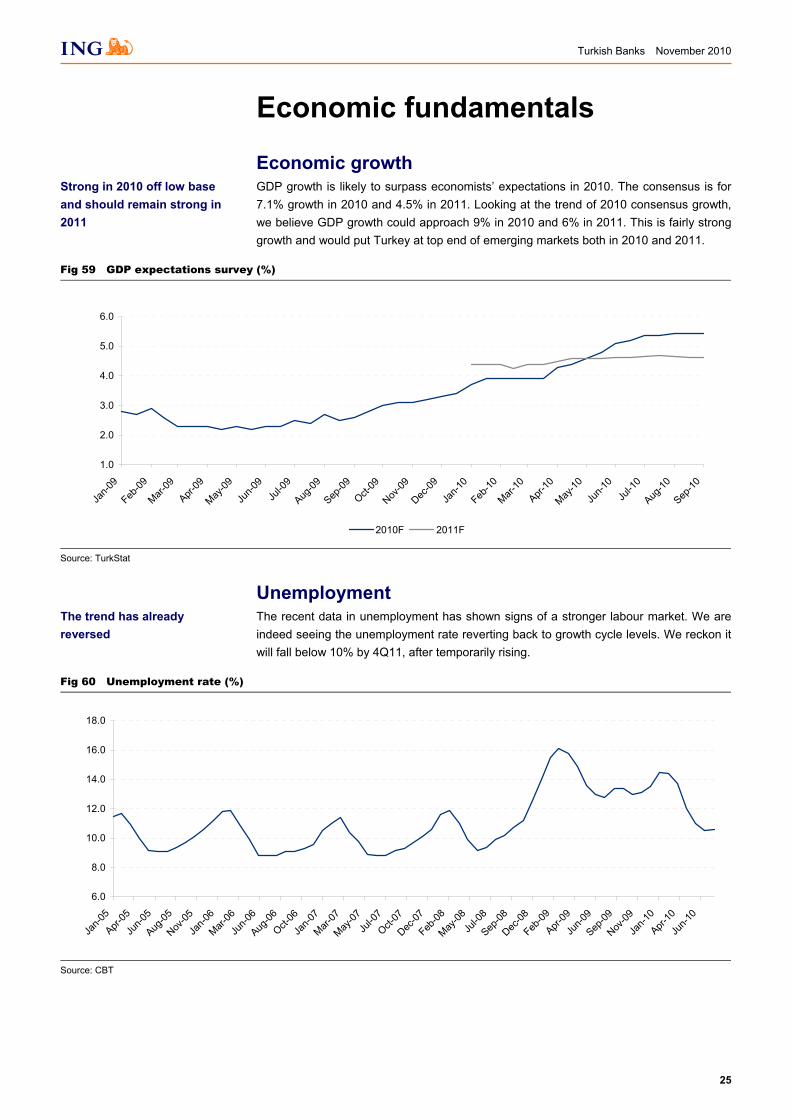
Economic fundamentals
Economic growth GDP growth is likely to surpass economists’ expectations in 2010. The consensus is for 7.1% growth in 2010 and 4.5% in 2011. Looking at the trend of 2010 consensus growth, we believe GDP growth could approach 9% in 2010 and 6% in 2011. This is fairly strong growth and would put Turkey at top end of emerging markets both in 2010 and 2011.
Fig 59 GDP expectations survey (%)
1.0
2.0
3.0
4.0
5.0
6.0
Jan-0
9
Feb-09
Mar-09
Apr-09
May-09
Jun-0
9Ju
l-09
Aug-09
Sep-09
Oct-09
Nov-09
Dec-09
Jan-1
0
Feb-10
Mar-10
Apr-10
May-10
Jun-1
0Ju
l-10
Aug-10
Sep-10
2010F 2011F
Source: TurkStat
Unemployment The recent data in unemployment has shown signs of a stronger labour market. We are indeed seeing the unemployment rate reverting back to growth cycle levels. We reckon it will fall below 10% by 4Q11, after temporarily rising.
Fig 60 Unemployment rate (%)
6.0
8.0
10.0
12.0
14.0
16.0
18.0
Jan-0
5
Apr-05
Jun-0
5
Aug-05
Nov-05
Jan-0
6
Mar-06
Jun-0
6
Aug-06
Oct-06
Jan-0
7
Mar-07
May-07
Jul-0
7
Oct-07
Dec-07
Feb-08
May-08
Jul-0
8
Sep-08
Dec-08
Feb-09
Apr-09
Jun-0
9
Sep-09
Nov-09
Jan-1
0
Apr-10
Jun-1
0
Source: CBT
Strong in 2010 off low base and should remain strong in 2011
The trend has already reversed
Turkish Banks November 2010
26
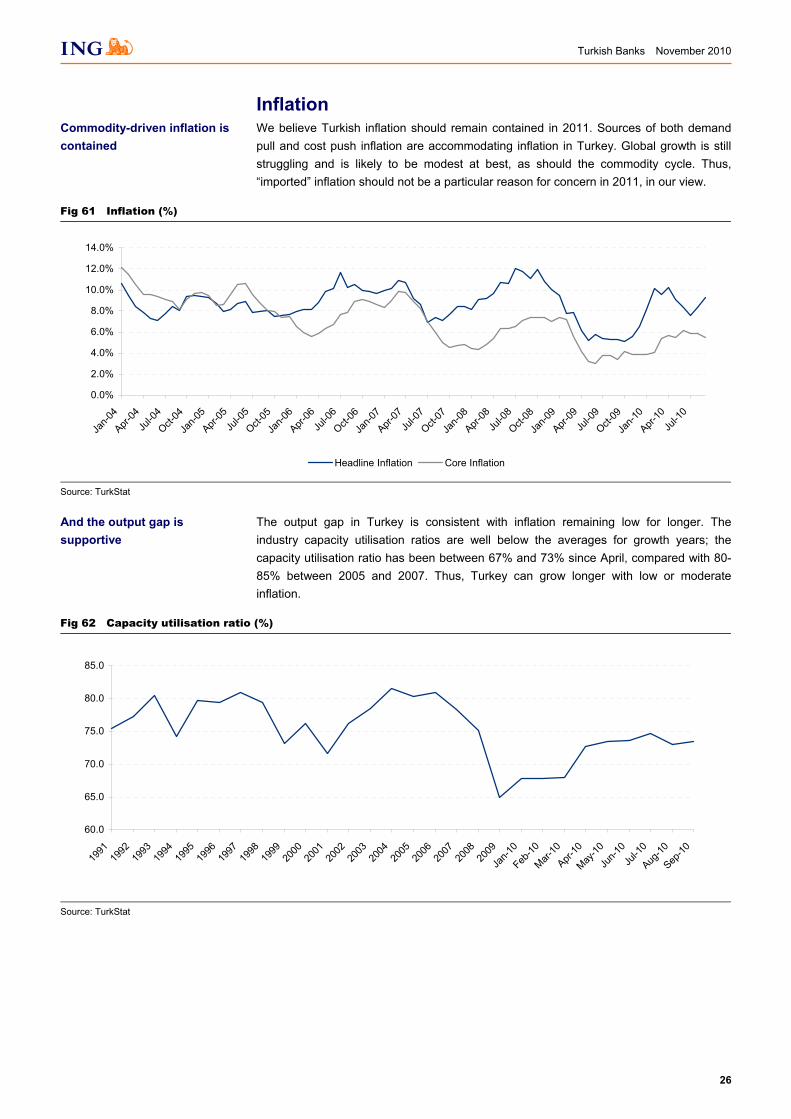
Inflation We believe Turkish inflation should remain contained in 2011. Sources of both demand pull and cost push inflation are accommodating inflation in Turkey. Global growth is still struggling and is likely to be modest at best, as should the commodity cycle. Thus, “imported” inflation should not be a particular reason for concern in 2011, in our view.
Fig 61 Inflation (%)
0.0%
2.0%
4.0%
6.0%
8.0%
10.0%
12.0%
14.0%
Jan-0
4
Apr-04
Jul-0
4
Oct-04
Jan-0
5
Apr-05
Jul-0
5
Oct-05
Jan-0
6
Apr-06
Jul-0
6
Oct-06
Jan-0
7
Apr-07
Jul-0
7
Oct-07
Jan-0
8
Apr-08
Jul-0
8
Oct-08
Jan-0
9
Apr-09
Jul-0
9
Oct-09
Jan-1
0
Apr-10
Jul-1
0
Headline Inflation Core Inflation
Source: TurkStat
The output gap in Turkey is consistent with inflation remaining low for longer. The industry capacity utilisation ratios are well below the averages for growth years; the capacity utilisation ratio has been between 67% and 73% since April, compared with 80-85% between 2005 and 2007. Thus, Turkey can grow longer with low or moderate inflation.
Fig 62 Capacity utilisation ratio (%)
60.0
65.0
70.0
75.0
80.0
85.0
1991
1992
1993
1994
1995
1996
1997
1998
1999
2000
2001
2002
2003
2004
2005
2006
2007
2008
2009
Jan-1
0
Feb-10
Mar-10
Apr-10
May-10
Jun-1
0Ju
l-10
Aug-10
Sep-10
Source: TurkStat
Commodity-driven inflation is contained
And the output gap is supportive
Turkish Banks November 2010
27
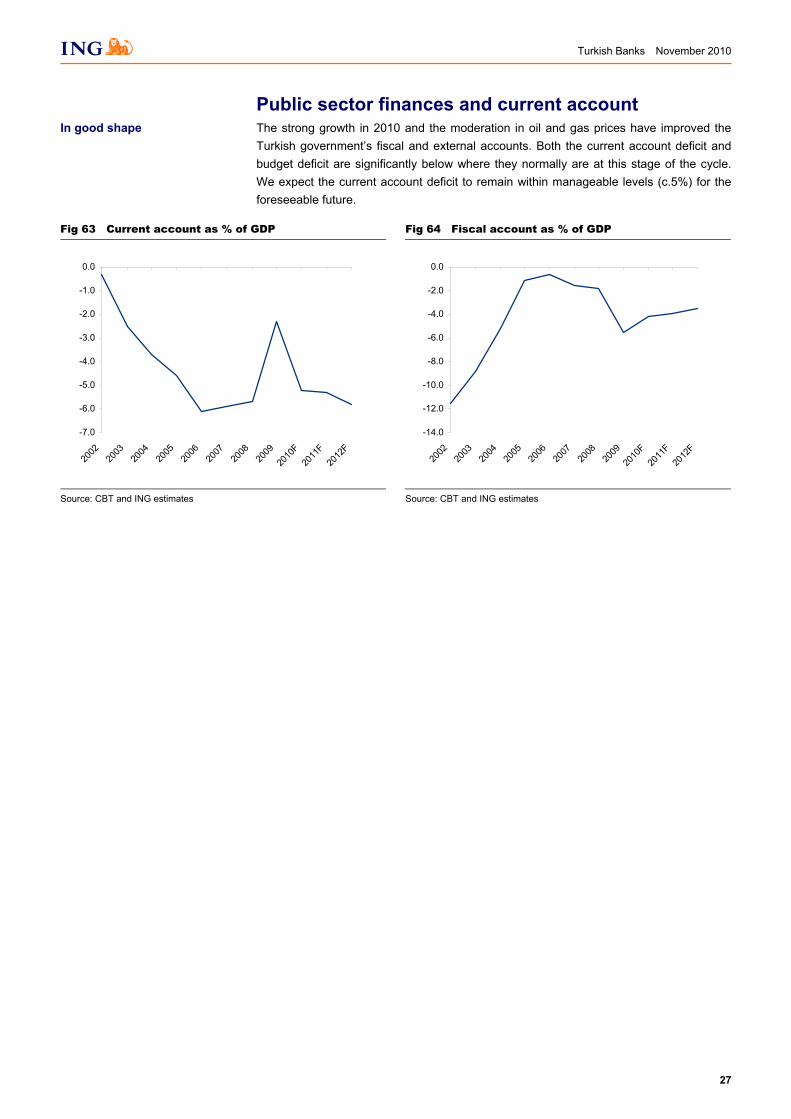
Public sector finances and current account The strong growth in 2010 and the moderation in oil and gas prices have improved the Turkish government’s fiscal and external accounts. Both the current account deficit and budget deficit are significantly below where they normally are at this stage of the cycle. We expect the current account deficit to remain within manageable levels (c.5%) for the foreseeable future.
Fig 63 Current account as % of GDP
Fig 64 Fiscal account as % of GDP
-7.0
-6.0
-5.0
-4.0
-3.0
-2.0
-1.0
0.0
2002
2003
2004
2005
2006
2007
2008
2009
2010
F20
11F
2012
F
-14.0
-12.0
-10.0
-8.0
-6.0
-4.0
-2.0
0.0
2002
2003
2004
2005
2006
2007
2008
2009
2010
F20
11F
2012
F
Source: CBT and ING estimates Source: CBT and ING estimates
In good shape

Turkish Banks November 2010
28
This page is left blank intentionally
Turkish Banks November 2010
29
Companies

Turkish Banks November 2010
30
This page is left blank intentionally
Turkish Banks November 2010
31
Akbank A play on inflation
We have modified our revenue model and balance sheet forecasts and rolled over the forecast period. We foresee 5% EPS growth in 2011 followed by 14% in 2010. The biggest source of upside risk to our forecasts is inflation, as Akbank has heavily invested in CPI-linked government bonds. Other sources of risk include a continuation of bad loan recoveries (+) and irrational deposit repricing (-).
NIM to disappoint unless inflation picks up. Akbank has 15% of its balance sheet (c.33% of bonds) invested in CPI linkers. Indeed, it is because of its exposure to inflation-indexed bonds that the bank’s earnings have surprised the market significantly sinceMarch. Growing revenues will be a bigger challenge next year, with margins unlikely to improve before 2H11. If inflation picks up sooner than expected, then Akbank’s earnings would surprise on the upside, probably significantly. If, on the other hand, inflation stays at current levels – our base case – Akbank would struggle to grow its NIM with yields on other assets declining. The bank’s exposure to CPI linkers remains the most likely source of a potential surprise: a 100bp surprise in inflation would alter 2011 earnings by as much as 3% in either direction.
Loan growth is strong, replacing bonds. The balance sheet growth has gained momentum and management also sounds more upbeat. We would expect Akbank’s exposure to marketable securities to decline gradually and its loan growth to outperform the industry in 2011. On our assumptions, the loan growth should approach 30% this year and exceed 25% in 2011. These growth rates are sufficient to grow earnings at mid-single digits next year, assuming inflation remains flat.
Valuation. The stock is trading towards the high end of our Turkish banks valuation range despite Akbank’s below average ROE. We have the stock at 2.20x on 2010F P/BV and 11x on 2011F earnings. Our target price model values the stock at TL8.13/share. We use the residual earnings methodology to value the equity. The residual earnings (the RE), is the return on common equity, expressed as a TL excess return rather than a ratio. For every earnings period t, we restate residual earnings as RE = (ROE - ke)*BVPS. The RE method can be re-stated as a dividend discount model.
Forecasts and ratios
Year end Dec (TLm) 2008 2009 2010F 2011F 2012F
Revenues 4,624 6,028 6,680 7,208 7,934Pre-provision profit 2,437 3,844 4,149 4,127 4,378Net profit 1,705 2,726 3,116 3,278 3,471Normalised EPS (TL) 0.43 0.68 0.78 0.82 0.87Dividend per share (TL) 0.10 0.09 0.09 0.11 0.11Normalised PER (x) 21.1 13.2 11.6 11.0 10.4Dividend yield (%) 1.1 0.95 1.0 1.2 1.2Price/book (x) 3.2 2.5 2.2 2.0 1.8Price/tangible book (x) 3.2 2.5 2.2 2.0 1.8Normalised ROE (%) 15.6 21.5 20.6 19.2 18.2
Source: Company data, ING estimates
Haluk Akdogan London +44 20 7767 6650 [email protected]
Derya Guzel Istanbul +44 20 7767 5379 [email protected]
Sell (maintained)
Price (28/10/10)
TL9.00
Target price (12-mth)
TL8.13 (previously TL6.00)
Forecast total return -8.6%
Banks Turkey Bloomberg: AKBNK TI Reuters: AKBNK.IS
Share data Avg daily volume (3-mth) 6,416,551Free float (%) 39.0Market cap (TLm) 36,000.0Dividend yield (1F, %) 1.0
Source: Company data, ING estimates
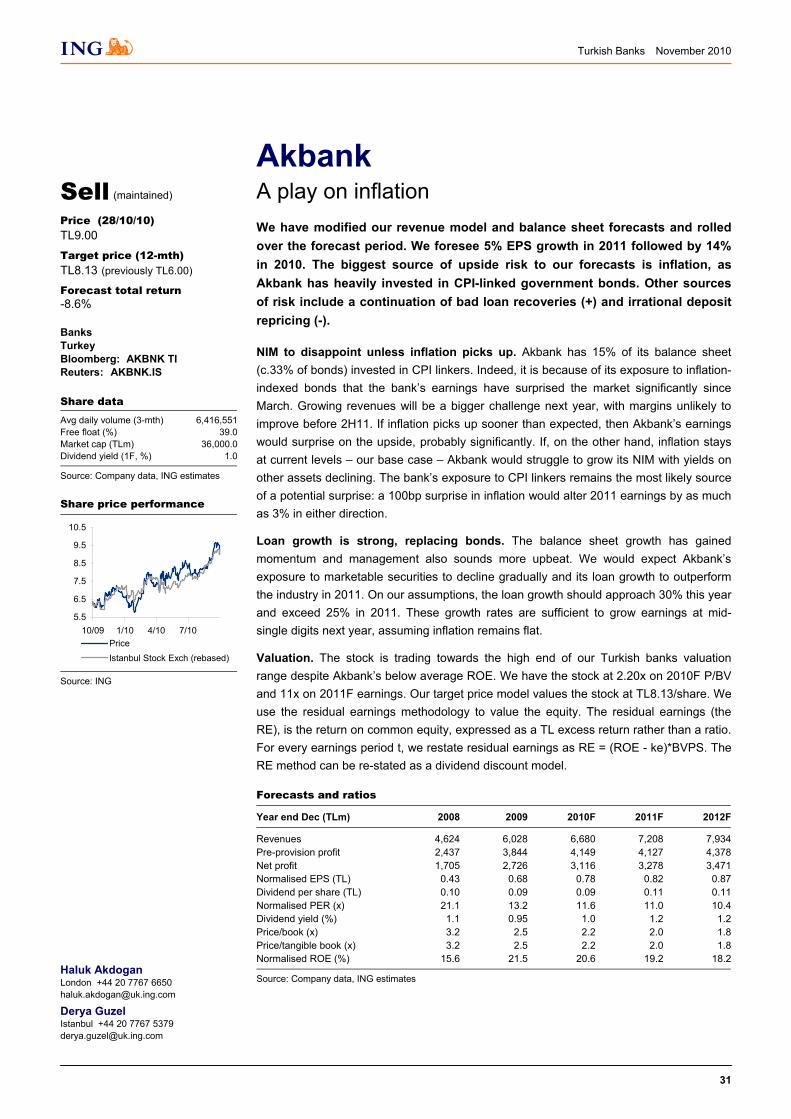
Share price performance
5.5
6.5
7.5
8.5
9.5
10.5
10/09 1/10 4/10 7/10PriceIstanbul Stock Exch (rebased)
Source: ING
Turkish Banks November 2010
32
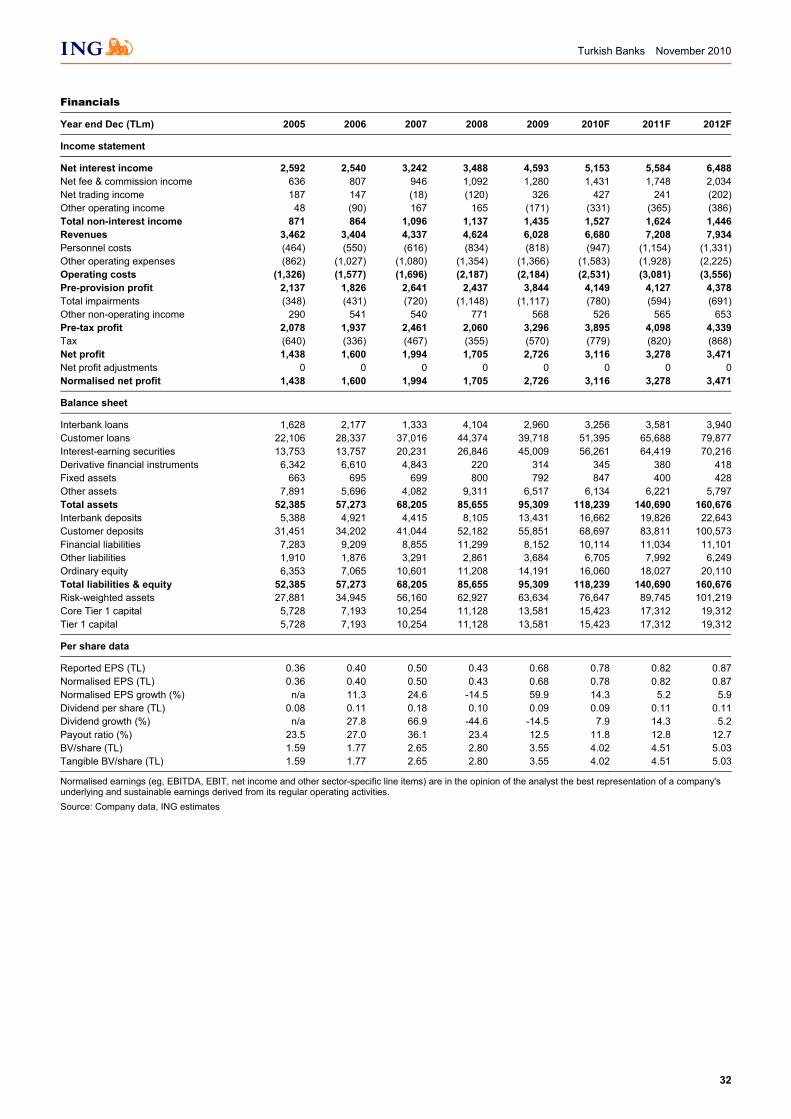
Financials
Year end Dec (TLm) 2005 2006 2007 2008 2009 2010F 2011F 2012F
Income statement
Net interest income 2,592 2,540 3,242 3,488 4,593 5,153 5,584 6,488Net fee & commission income 636 807 946 1,092 1,280 1,431 1,748 2,034Net trading income 187 147 (18) (120) 326 427 241 (202)Other operating income 48 (90) 167 165 (171) (331) (365) (386)Total non-interest income 871 864 1,096 1,137 1,435 1,527 1,624 1,446Revenues 3,462 3,404 4,337 4,624 6,028 6,680 7,208 7,934Personnel costs (464) (550) (616) (834) (818) (947) (1,154) (1,331)Other operating expenses (862) (1,027) (1,080) (1,354) (1,366) (1,583) (1,928) (2,225)Operating costs (1,326) (1,577) (1,696) (2,187) (2,184) (2,531) (3,081) (3,556)Pre-provision profit 2,137 1,826 2,641 2,437 3,844 4,149 4,127 4,378Total impairments (348) (431) (720) (1,148) (1,117) (780) (594) (691)Other non-operating income 290 541 540 771 568 526 565 653Pre-tax profit 2,078 1,937 2,461 2,060 3,296 3,895 4,098 4,339Tax (640) (336) (467) (355) (570) (779) (820) (868)Net profit 1,438 1,600 1,994 1,705 2,726 3,116 3,278 3,471Net profit adjustments 0 0 0 0 0 0 0 0Normalised net profit 1,438 1,600 1,994 1,705 2,726 3,116 3,278 3,471
Balance sheet
Interbank loans 1,628 2,177 1,333 4,104 2,960 3,256 3,581 3,940Customer loans 22,106 28,337 37,016 44,374 39,718 51,395 65,688 79,877Interest-earning securities 13,753 13,757 20,231 26,846 45,009 56,261 64,419 70,216Derivative financial instruments 6,342 6,610 4,843 220 314 345 380 418Fixed assets 663 695 699 800 792 847 400 428Other assets 7,891 5,696 4,082 9,311 6,517 6,134 6,221 5,797Total assets 52,385 57,273 68,205 85,655 95,309 118,239 140,690 160,676Interbank deposits 5,388 4,921 4,415 8,105 13,431 16,662 19,826 22,643Customer deposits 31,451 34,202 41,044 52,182 55,851 68,697 83,811 100,573Financial liabilities 7,283 9,209 8,855 11,299 8,152 10,114 11,034 11,101Other liabilities 1,910 1,876 3,291 2,861 3,684 6,705 7,992 6,249Ordinary equity 6,353 7,065 10,601 11,208 14,191 16,060 18,027 20,110Total liabilities & equity 52,385 57,273 68,205 85,655 95,309 118,239 140,690 160,676Risk-weighted assets 27,881 34,945 56,160 62,927 63,634 76,647 89,745 101,219Core Tier 1 capital 5,728 7,193 10,254 11,128 13,581 15,423 17,312 19,312Tier 1 capital 5,728 7,193 10,254 11,128 13,581 15,423 17,312 19,312
Per share data
Reported EPS (TL) 0.36 0.40 0.50 0.43 0.68 0.78 0.82 0.87Normalised EPS (TL) 0.36 0.40 0.50 0.43 0.68 0.78 0.82 0.87Normalised EPS growth (%) n/a 11.3 24.6 -14.5 59.9 14.3 5.2 5.9Dividend per share (TL) 0.08 0.11 0.18 0.10 0.09 0.09 0.11 0.11Dividend growth (%) n/a 27.8 66.9 -44.6 -14.5 7.9 14.3 5.2Payout ratio (%) 23.5 27.0 36.1 23.4 12.5 11.8 12.8 12.7BV/share (TL) 1.59 1.77 2.65 2.80 3.55 4.02 4.51 5.03Tangible BV/share (TL) 1.59 1.77 2.65 2.80 3.55 4.02 4.51 5.03
Normalised earnings (eg, EBITDA, EBIT, net income and other sector-specific line items) are in the opinion of the analyst the best representation of a company's underlying and sustainable earnings derived from its regular operating activities. Source: Company data, ING estimates
Turkish Banks November 2010
33
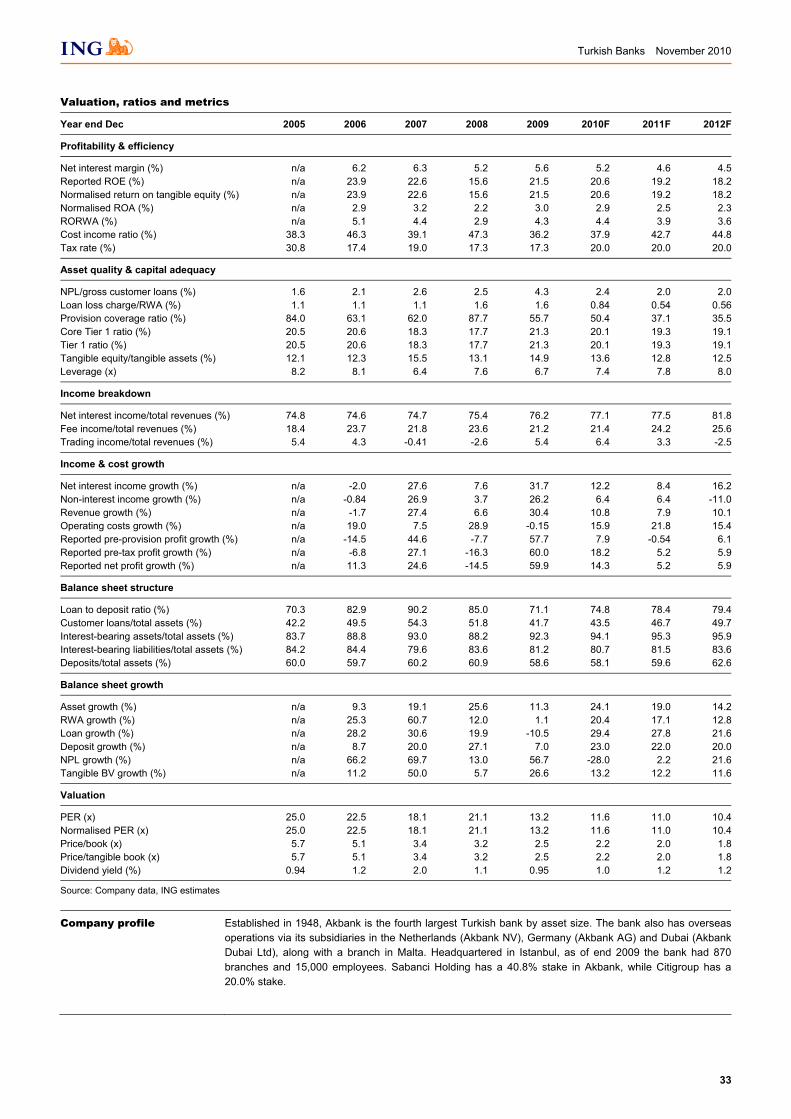
Valuation, ratios and metrics
Year end Dec 2005 2006 2007 2008 2009 2010F 2011F 2012F
Profitability & efficiency
Net interest margin (%) n/a 6.2 6.3 5.2 5.6 5.2 4.6 4.5Reported ROE (%) n/a 23.9 22.6 15.6 21.5 20.6 19.2 18.2Normalised return on tangible equity (%) n/a 23.9 22.6 15.6 21.5 20.6 19.2 18.2Normalised ROA (%) n/a 2.9 3.2 2.2 3.0 2.9 2.5 2.3RORWA (%) n/a 5.1 4.4 2.9 4.3 4.4 3.9 3.6Cost income ratio (%) 38.3 46.3 39.1 47.3 36.2 37.9 42.7 44.8Tax rate (%) 30.8 17.4 19.0 17.3 17.3 20.0 20.0 20.0
Asset quality & capital adequacy
NPL/gross customer loans (%) 1.6 2.1 2.6 2.5 4.3 2.4 2.0 2.0Loan loss charge/RWA (%) 1.1 1.1 1.1 1.6 1.6 0.84 0.54 0.56Provision coverage ratio (%) 84.0 63.1 62.0 87.7 55.7 50.4 37.1 35.5Core Tier 1 ratio (%) 20.5 20.6 18.3 17.7 21.3 20.1 19.3 19.1Tier 1 ratio (%) 20.5 20.6 18.3 17.7 21.3 20.1 19.3 19.1Tangible equity/tangible assets (%) 12.1 12.3 15.5 13.1 14.9 13.6 12.8 12.5Leverage (x) 8.2 8.1 6.4 7.6 6.7 7.4 7.8 8.0
Income breakdown
Net interest income/total revenues (%) 74.8 74.6 74.7 75.4 76.2 77.1 77.5 81.8Fee income/total revenues (%) 18.4 23.7 21.8 23.6 21.2 21.4 24.2 25.6Trading income/total revenues (%) 5.4 4.3 -0.41 -2.6 5.4 6.4 3.3 -2.5
Income & cost growth
Net interest income growth (%) n/a -2.0 27.6 7.6 31.7 12.2 8.4 16.2Non-interest income growth (%) n/a -0.84 26.9 3.7 26.2 6.4 6.4 -11.0Revenue growth (%) n/a -1.7 27.4 6.6 30.4 10.8 7.9 10.1Operating costs growth (%) n/a 19.0 7.5 28.9 -0.15 15.9 21.8 15.4Reported pre-provision profit growth (%) n/a -14.5 44.6 -7.7 57.7 7.9 -0.54 6.1Reported pre-tax profit growth (%) n/a -6.8 27.1 -16.3 60.0 18.2 5.2 5.9Reported net profit growth (%) n/a 11.3 24.6 -14.5 59.9 14.3 5.2 5.9
Balance sheet structure
Loan to deposit ratio (%) 70.3 82.9 90.2 85.0 71.1 74.8 78.4 79.4Customer loans/total assets (%) 42.2 49.5 54.3 51.8 41.7 43.5 46.7 49.7Interest-bearing assets/total assets (%) 83.7 88.8 93.0 88.2 92.3 94.1 95.3 95.9Interest-bearing liabilities/total assets (%) 84.2 84.4 79.6 83.6 81.2 80.7 81.5 83.6Deposits/total assets (%) 60.0 59.7 60.2 60.9 58.6 58.1 59.6 62.6
Balance sheet growth
Asset growth (%) n/a 9.3 19.1 25.6 11.3 24.1 19.0 14.2RWA growth (%) n/a 25.3 60.7 12.0 1.1 20.4 17.1 12.8Loan growth (%) n/a 28.2 30.6 19.9 -10.5 29.4 27.8 21.6Deposit growth (%) n/a 8.7 20.0 27.1 7.0 23.0 22.0 20.0NPL growth (%) n/a 66.2 69.7 13.0 56.7 -28.0 2.2 21.6Tangible BV growth (%) n/a 11.2 50.0 5.7 26.6 13.2 12.2 11.6
Valuation
PER (x) 25.0 22.5 18.1 21.1 13.2 11.6 11.0 10.4Normalised PER (x) 25.0 22.5 18.1 21.1 13.2 11.6 11.0 10.4Price/book (x) 5.7 5.1 3.4 3.2 2.5 2.2 2.0 1.8Price/tangible book (x) 5.7 5.1 3.4 3.2 2.5 2.2 2.0 1.8Dividend yield (%) 0.94 1.2 2.0 1.1 0.95 1.0 1.2 1.2
Source: Company data, ING estimates
Company profile Established in 1948, Akbank is the fourth largest Turkish bank by asset size. The bank also has overseasoperations via its subsidiaries in the Netherlands (Akbank NV), Germany (Akbank AG) and Dubai (AkbankDubai Ltd), along with a branch in Malta. Headquartered in Istanbul, as of end 2009 the bank had 870 branches and 15,000 employees. Sabanci Holding has a 40.8% stake in Akbank, while Citigroup has a20.0% stake.

Turkish Banks November 2010
34
This page is left blank intentionally
Turkish Banks November 2010
35
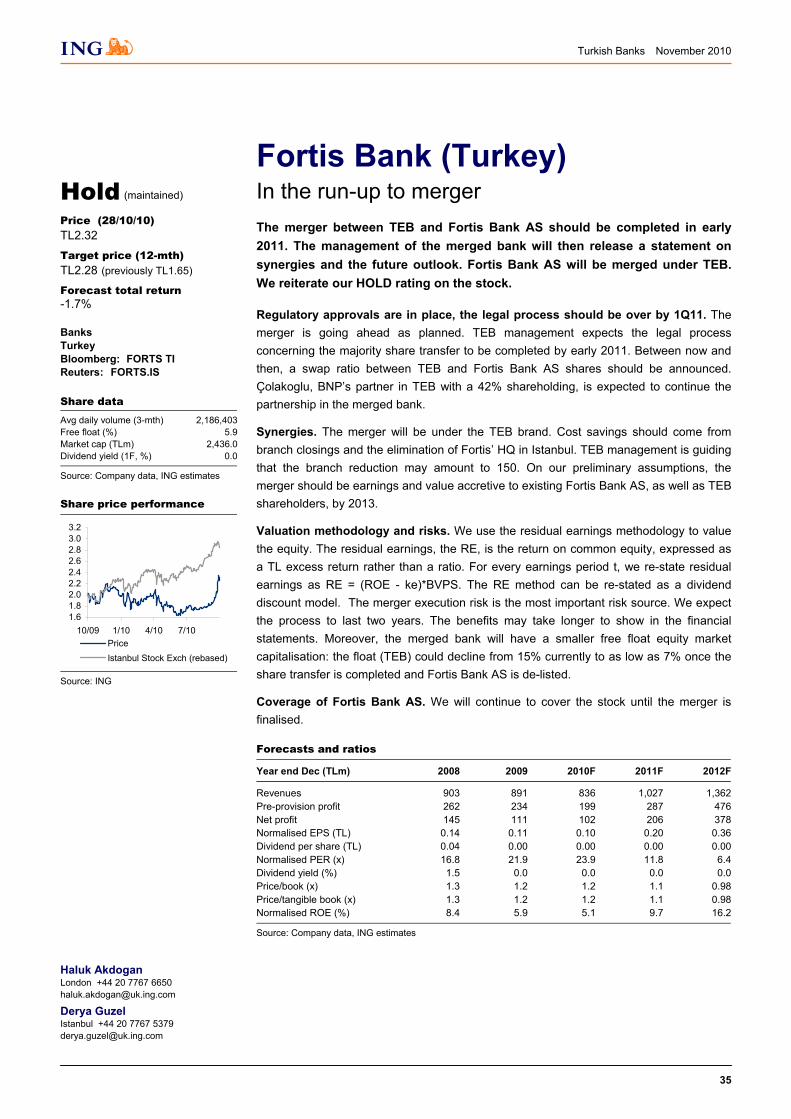
Fortis Bank (Turkey) In the run-up to merger
The merger between TEB and Fortis Bank AS should be completed in early 2011. The management of the merged bank will then release a statement on synergies and the future outlook. Fortis Bank AS will be merged under TEB. We reiterate our HOLD rating on the stock.
Regulatory approvals are in place, the legal process should be over by 1Q11. The merger is going ahead as planned. TEB management expects the legal process concerning the majority share transfer to be completed by early 2011. Between now and then, a swap ratio between TEB and Fortis Bank AS shares should be announced. Çolakoglu, BNP’s partner in TEB with a 42% shareholding, is expected to continue the partnership in the merged bank.
Synergies. The merger will be under the TEB brand. Cost savings should come from branch closings and the elimination of Fortis’ HQ in Istanbul. TEB management is guiding that the branch reduction may amount to 150. On our preliminary assumptions, the merger should be earnings and value accretive to existing Fortis Bank AS, as well as TEB shareholders, by 2013.
Valuation methodology and risks. We use the residual earnings methodology to value the equity. The residual earnings, the RE, is the return on common equity, expressed as a TL excess return rather than a ratio. For every earnings period t, we re-state residual earnings as RE = (ROE - ke)*BVPS. The RE method can be re-stated as a dividend discount model. The merger execution risk is the most important risk source. We expect the process to last two years. The benefits may take longer to show in the financial statements. Moreover, the merged bank will have a smaller free float equity market capitalisation: the float (TEB) could decline from 15% currently to as low as 7% once the share transfer is completed and Fortis Bank AS is de-listed.
Coverage of Fortis Bank AS. We will continue to cover the stock until the merger is finalised.
Forecasts and ratios
Year end Dec (TLm) 2008 2009 2010F 2011F 2012F
Revenues 903 891 836 1,027 1,362Pre-provision profit 262 234 199 287 476Net profit 145 111 102 206 378Normalised EPS (TL) 0.14 0.11 0.10 0.20 0.36Dividend per share (TL) 0.04 0.00 0.00 0.00 0.00Normalised PER (x) 16.8 21.9 23.9 11.8 6.4Dividend yield (%) 1.5 0.0 0.0 0.0 0.0Price/book (x) 1.3 1.2 1.2 1.1 0.98Price/tangible book (x) 1.3 1.2 1.2 1.1 0.98Normalised ROE (%) 8.4 5.9 5.1 9.7 16.2
Source: Company data, ING estimates
Haluk Akdogan London +44 20 7767 6650 [email protected]
Derya Guzel Istanbul +44 20 7767 5379 [email protected]
Hold (maintained)
Price (28/10/10)
TL2.32
Target price (12-mth)
TL2.28 (previously TL1.65)
Forecast total return -1.7%
Banks Turkey Bloomberg: FORTS TI Reuters: FORTS.IS
Share data Avg daily volume (3-mth) 2,186,403Free float (%) 5.9Market cap (TLm) 2,436.0Dividend yield (1F, %) 0.0
Source: Company data, ING estimates
Share price performance
1.61.82.02.22.42.62.83.03.2
10/09 1/10 4/10 7/10PriceIstanbul Stock Exch (rebased)
Source: ING
Turkish Banks November 2010
36
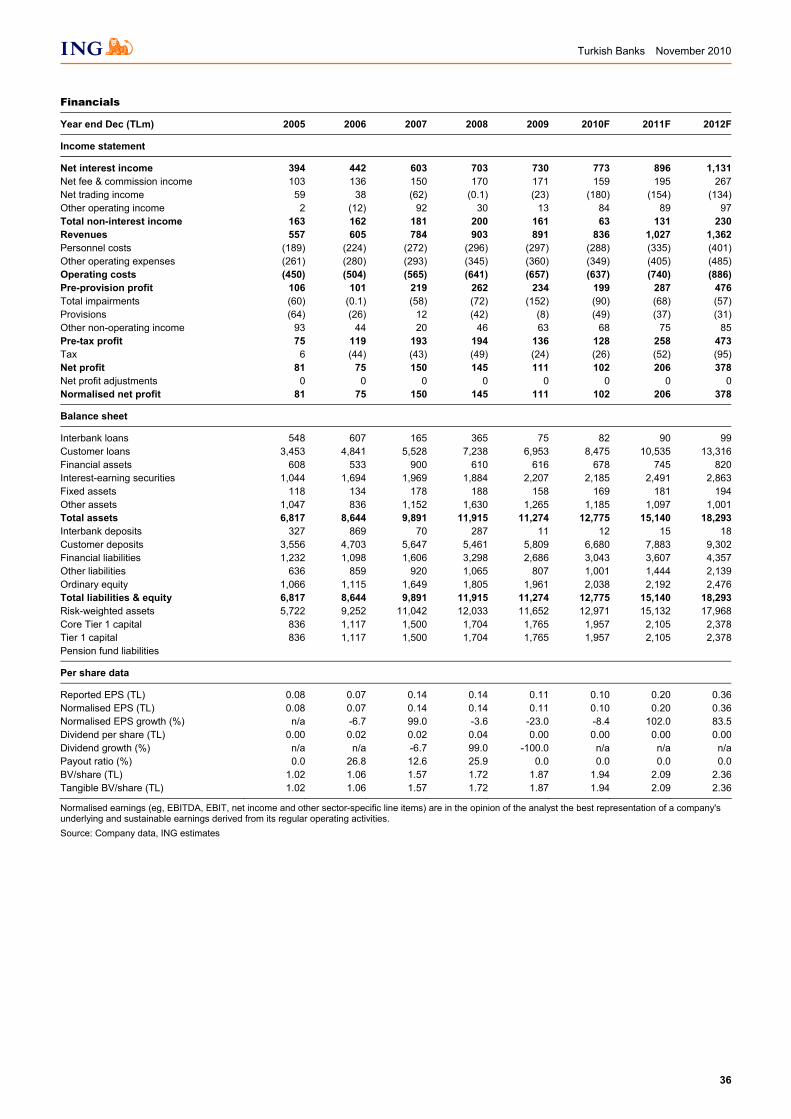
Financials
Year end Dec (TLm) 2005 2006 2007 2008 2009 2010F 2011F 2012F
Income statement
Net interest income 394 442 603 703 730 773 896 1,131Net fee & commission income 103 136 150 170 171 159 195 267Net trading income 59 38 (62) (0.1) (23) (180) (154) (134)Other operating income 2 (12) 92 30 13 84 89 97Total non-interest income 163 162 181 200 161 63 131 230Revenues 557 605 784 903 891 836 1,027 1,362Personnel costs (189) (224) (272) (296) (297) (288) (335) (401)Other operating expenses (261) (280) (293) (345) (360) (349) (405) (485)Operating costs (450) (504) (565) (641) (657) (637) (740) (886)Pre-provision profit 106 101 219 262 234 199 287 476Total impairments (60) (0.1) (58) (72) (152) (90) (68) (57)Provisions (64) (26) 12 (42) (8) (49) (37) (31)Other non-operating income 93 44 20 46 63 68 75 85Pre-tax profit 75 119 193 194 136 128 258 473Tax 6 (44) (43) (49) (24) (26) (52) (95)Net profit 81 75 150 145 111 102 206 378Net profit adjustments 0 0 0 0 0 0 0 0Normalised net profit 81 75 150 145 111 102 206 378
Balance sheet
Interbank loans 548 607 165 365 75 82 90 99Customer loans 3,453 4,841 5,528 7,238 6,953 8,475 10,535 13,316Financial assets 608 533 900 610 616 678 745 820Interest-earning securities 1,044 1,694 1,969 1,884 2,207 2,185 2,491 2,863Fixed assets 118 134 178 188 158 169 181 194Other assets 1,047 836 1,152 1,630 1,265 1,185 1,097 1,001Total assets 6,817 8,644 9,891 11,915 11,274 12,775 15,140 18,293Interbank deposits 327 869 70 287 11 12 15 18Customer deposits 3,556 4,703 5,647 5,461 5,809 6,680 7,883 9,302Financial liabilities 1,232 1,098 1,606 3,298 2,686 3,043 3,607 4,357Other liabilities 636 859 920 1,065 807 1,001 1,444 2,139Ordinary equity 1,066 1,115 1,649 1,805 1,961 2,038 2,192 2,476Total liabilities & equity 6,817 8,644 9,891 11,915 11,274 12,775 15,140 18,293Risk-weighted assets 5,722 9,252 11,042 12,033 11,652 12,971 15,132 17,968Core Tier 1 capital 836 1,117 1,500 1,704 1,765 1,957 2,105 2,378Tier 1 capital 836 1,117 1,500 1,704 1,765 1,957 2,105 2,378Pension fund liabilities
Per share data
Reported EPS (TL) 0.08 0.07 0.14 0.14 0.11 0.10 0.20 0.36Normalised EPS (TL) 0.08 0.07 0.14 0.14 0.11 0.10 0.20 0.36Normalised EPS growth (%) n/a -6.7 99.0 -3.6 -23.0 -8.4 102.0 83.5Dividend per share (TL) 0.00 0.02 0.02 0.04 0.00 0.00 0.00 0.00Dividend growth (%) n/a n/a -6.7 99.0 -100.0 n/a n/a n/aPayout ratio (%) 0.0 26.8 12.6 25.9 0.0 0.0 0.0 0.0BV/share (TL) 1.02 1.06 1.57 1.72 1.87 1.94 2.09 2.36Tangible BV/share (TL) 1.02 1.06 1.57 1.72 1.87 1.94 2.09 2.36
Normalised earnings (eg, EBITDA, EBIT, net income and other sector-specific line items) are in the opinion of the analyst the best representation of a company's underlying and sustainable earnings derived from its regular operating activities. Source: Company data, ING estimates
Turkish Banks November 2010
37
Valuation, ratios and metrics
Year end Dec 2005 2006 2007 2008 2009 2010F 2011F 2012F
Profitability & efficiency
Net interest margin (%) n/a 6.6 7.4 7.5 7.3 7.3 7.1 7.3Reported ROE (%) n/a 6.9 10.9 8.4 5.9 5.1 9.7 16.2Normalised return on tangible equity (%) n/a 6.9 10.9 8.4 5.9 5.1 9.7 16.2Normalised ROA (%) n/a 0.98 1.6 1.3 0.96 0.85 1.5 2.3RORWA (%) n/a 1.0 1.5 1.3 0.94 0.83 1.5 2.3Cost income ratio (%) 80.9 83.3 72.0 71.0 73.8 76.2 72.0 65.1Tax rate (%) n/a 36.8 22.4 25.4 17.8 20.0 20.0 20.0
Asset quality & capital adequacy
NPL/gross customer loans (%) 4.9 3.5 4.2 5.1 7.5 3.3 2.7 2.1Loan loss charge/RWA (%) 1.0 0.00 0.52 0.60 1.3 0.70 0.45 0.32Provision coverage ratio (%) 33.7 0.07 23.9 18.5 27.2 31.4 23.1 20.5Core Tier 1 ratio (%) 14.6 12.1 13.6 14.2 15.1 15.1 13.9 13.2Tier 1 ratio (%) 14.6 12.1 13.6 14.2 15.1 15.1 13.9 13.2Tangible equity/tangible assets (%) 15.6 12.9 16.7 15.1 17.4 16.0 14.5 13.5Leverage (x) 6.4 7.8 6.0 6.6 5.7 6.3 6.9 7.4
Income breakdown
Net interest income/total revenues (%) 70.7 73.2 76.9 77.9 81.9 92.5 87.3 83.1Fee income/total revenues (%) 18.4 22.5 19.2 18.8 19.1 19.0 19.0 19.6Trading income/total revenues (%) 10.5 6.3 -7.9 -0.01 -2.6 -21.6 -15.0 -9.8
Income & cost growth
Net interest income growth (%) n/a 12.3 36.3 16.6 3.8 5.9 15.9 26.2Non-interest income growth (%) n/a -0.52 11.7 10.3 -19.4 -61.1 109.0 76.3Revenue growth (%) n/a 8.5 29.7 15.1 -1.3 -6.2 22.8 32.6Operating costs growth (%) n/a 11.8 12.2 13.4 2.6 -3.1 16.1 19.8Reported pre-provision profit growth (%) n/a -5.2 117.1 19.6 -10.9 -15.0 44.5 65.7Reported pre-tax profit growth (%) n/a 58.3 62.1 0.29 -30.1 -5.9 102.0 83.5Reported net profit growth (%) n/a -6.7 99.0 -3.6 -23.0 -8.4 102.0 83.5
Balance sheet structure
Loan to deposit ratio (%) 97.1 102.9 97.9 132.5 119.7 126.9 133.6 143.2Customer loans/total assets (%) 50.7 56.0 55.9 60.7 61.7 66.3 69.6 72.8Interest-bearing assets/total assets (%) 82.9 88.8 86.6 84.7 87.4 89.4 91.6 93.5Interest-bearing liabilities/total assets (%) 75.0 77.2 74.0 75.9 75.4 76.2 76.0 74.8Deposits/total assets (%) 52.2 54.4 57.1 45.8 51.5 52.3 52.1 50.9
Balance sheet growth
Asset growth (%) n/a 26.8 14.4 20.5 -5.4 13.3 18.5 20.8RWA growth (%) n/a 61.7 19.3 9.0 -3.2 11.3 16.7 18.7Loan growth (%) n/a 40.2 14.2 30.9 -3.9 21.9 24.3 26.4Deposit growth (%) n/a 32.3 20.1 -3.3 6.4 15.0 18.0 18.0NPL growth (%) n/a -0.75 37.8 60.9 43.8 -48.5 2.4 -5.2Tangible BV growth (%) n/a 4.5 48.0 9.4 8.6 3.9 7.6 12.9
Valuation
PER (x) 30.1 32.3 16.2 16.8 21.9 23.9 11.8 6.4Normalised PER (x) 30.1 32.3 16.2 16.8 21.9 23.9 11.8 6.4Price/book (x) 2.3 2.2 1.5 1.3 1.2 1.2 1.1 0.98Price/tangible book (x) 2.3 2.2 1.5 1.3 1.2 1.2 1.1 0.98Dividend yield (%) 0.0 0.83 0.77 1.5 0.0 0.0 0.0 0.0
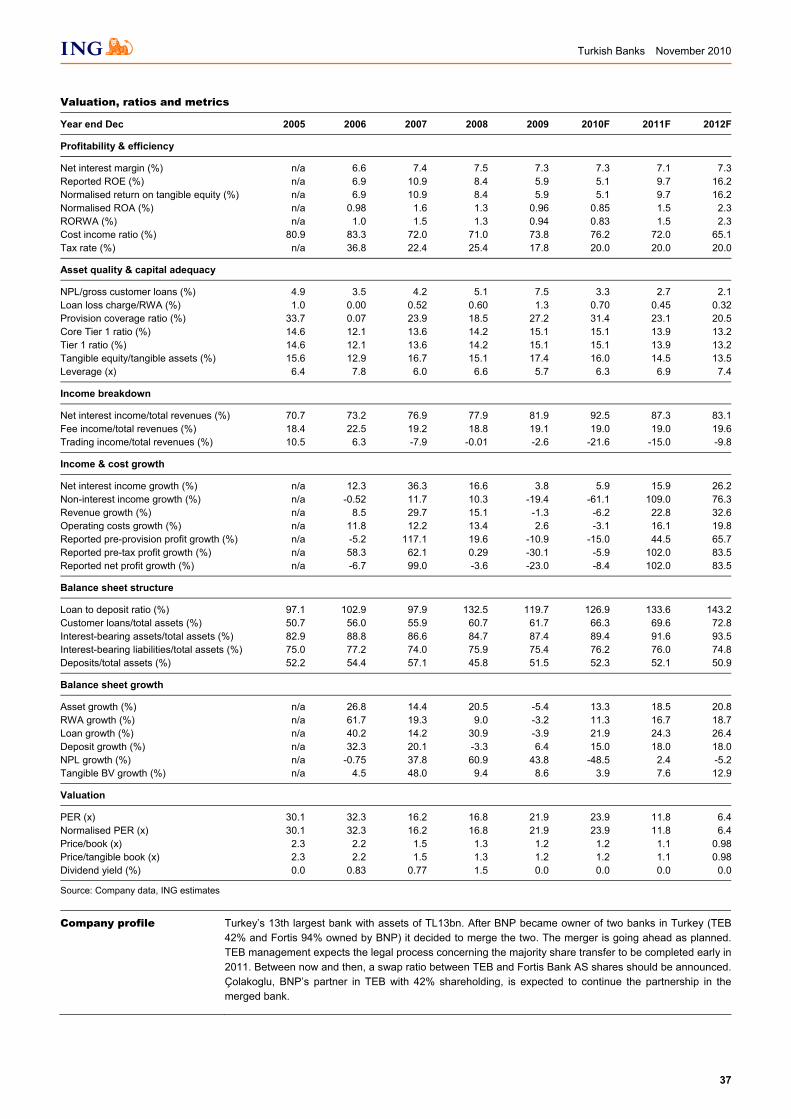
Source: Company data, ING estimates
Company profile Turkey’s 13th largest bank with assets of TL13bn. After BNP became owner of two banks in Turkey (TEB42% and Fortis 94% owned by BNP) it decided to merge the two. The merger is going ahead as planned.TEB management expects the legal process concerning the majority share transfer to be completed early in2011. Between now and then, a swap ratio between TEB and Fortis Bank AS shares should be announced.Çolakoglu, BNP’s partner in TEB with 42% shareholding, is expected to continue the partnership in themerged bank.

Turkish Banks November 2010
38
This page is left blank intentionally
Turkish Banks November 2010
39
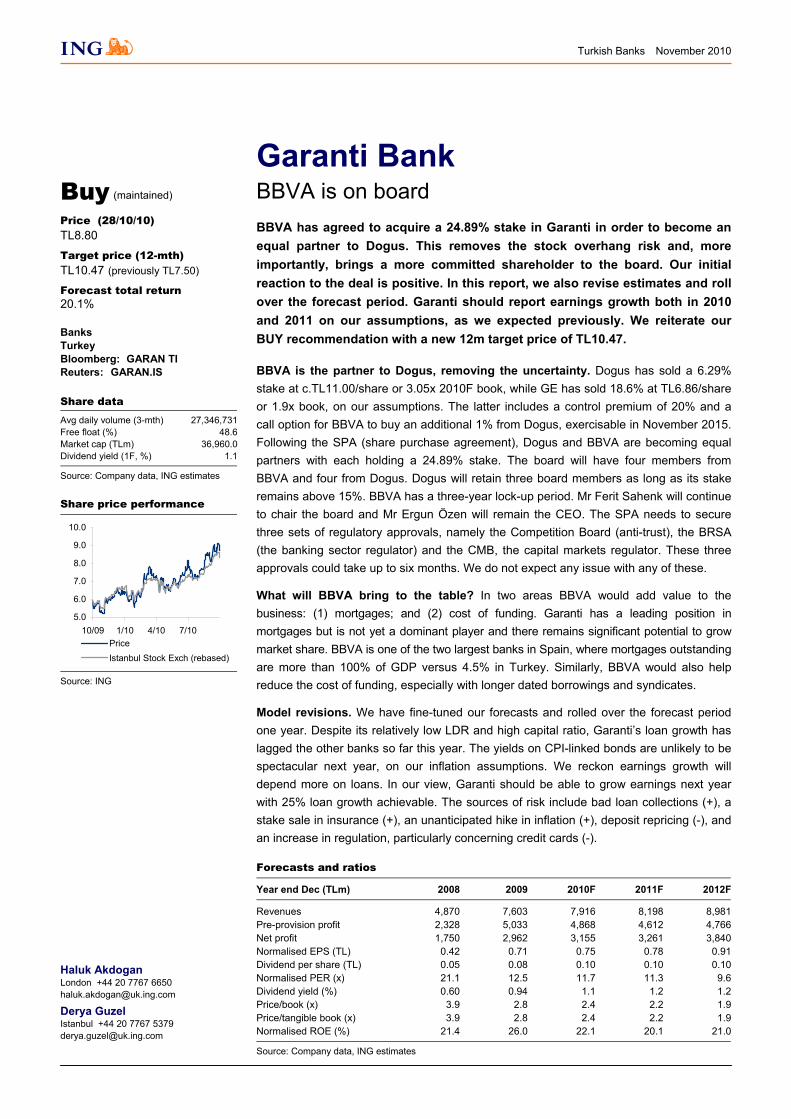
Garanti Bank BBVA is on board
BBVA has agreed to acquire a 24.89% stake in Garanti in order to become an equal partner to Dogus. This removes the stock overhang risk and, more importantly, brings a more committed shareholder to the board. Our initial reaction to the deal is positive. In this report, we also revise estimates and roll over the forecast period. Garanti should report earnings growth both in 2010 and 2011 on our assumptions, as we expected previously. We reiterate our BUY recommendation with a new 12m target price of TL10.47.
BBVA is the partner to Dogus, removing the uncertainty. Dogus has sold a 6.29% stake at c.TL11.00/share or 3.05x 2010F book, while GE has sold 18.6% at TL6.86/share or 1.9x book, on our assumptions. The latter includes a control premium of 20% and a call option for BBVA to buy an additional 1% from Dogus, exercisable in November 2015. Following the SPA (share purchase agreement), Dogus and BBVA are becoming equal partners with each holding a 24.89% stake. The board will have four members from BBVA and four from Dogus. Dogus will retain three board members as long as its stake remains above 15%. BBVA has a three-year lock-up period. Mr Ferit Sahenk will continue to chair the board and Mr Ergun Özen will remain the CEO. The SPA needs to secure three sets of regulatory approvals, namely the Competition Board (anti-trust), the BRSA (the banking sector regulator) and the CMB, the capital markets regulator. These three approvals could take up to six months. We do not expect any issue with any of these.
What will BBVA bring to the table? In two areas BBVA would add value to the business: (1) mortgages; and (2) cost of funding. Garanti has a leading position in mortgages but is not yet a dominant player and there remains significant potential to grow market share. BBVA is one of the two largest banks in Spain, where mortgages outstanding are more than 100% of GDP versus 4.5% in Turkey. Similarly, BBVA would also help reduce the cost of funding, especially with longer dated borrowings and syndicates.
Model revisions. We have fine-tuned our forecasts and rolled over the forecast period one year. Despite its relatively low LDR and high capital ratio, Garanti’s loan growth has lagged the other banks so far this year. The yields on CPI-linked bonds are unlikely to be spectacular next year, on our inflation assumptions. We reckon earnings growth will depend more on loans. In our view, Garanti should be able to grow earnings next year with 25% loan growth achievable. The sources of risk include bad loan collections (+), a stake sale in insurance (+), an unanticipated hike in inflation (+), deposit repricing (-), and an increase in regulation, particularly concerning credit cards (-).
Forecasts and ratios
Year end Dec (TLm) 2008 2009 2010F 2011F 2012F
Revenues 4,870 7,603 7,916 8,198 8,981Pre-provision profit 2,328 5,033 4,868 4,612 4,766Net profit 1,750 2,962 3,155 3,261 3,840Normalised EPS (TL) 0.42 0.71 0.75 0.78 0.91Dividend per share (TL) 0.05 0.08 0.10 0.10 0.10Normalised PER (x) 21.1 12.5 11.7 11.3 9.6Dividend yield (%) 0.60 0.94 1.1 1.2 1.2Price/book (x) 3.9 2.8 2.4 2.2 1.9Price/tangible book (x) 3.9 2.8 2.4 2.2 1.9Normalised ROE (%) 21.4 26.0 22.1 20.1 21.0
Source: Company data, ING estimates
Haluk Akdogan London +44 20 7767 6650 [email protected]
Derya Guzel Istanbul +44 20 7767 5379 [email protected]
Buy (maintained)
Price (28/10/10)
TL8.80
Target price (12-mth)
TL10.47 (previously TL7.50)
Forecast total return 20.1%
Banks Turkey Bloomberg: GARAN TI Reuters: GARAN.IS
Share data Avg daily volume (3-mth) 27,346,731Free float (%) 48.6Market cap (TLm) 36,960.0Dividend yield (1F, %) 1.1
Source: Company data, ING estimates
Share price performance
5.0
6.0
7.0
8.0
9.0
10.0
10/09 1/10 4/10 7/10PriceIstanbul Stock Exch (rebased)
Source: ING

Turkish Banks November 2010
40
Financials
Year end Dec (TLm) 2005 2006 2007 2008 2009 2010F 2011F 2012F
Income statement
Net interest income 1,675 1,902 2,804 3,178 5,080 5,610 5,505 5,827Net fee & commission income 738 1,014 1,198 1,441 1,643 1,826 2,133 2,498Net trading income (6) 25 (71) 529 502 342 400 468Other operating income 140 (81) (65) (278) 379 137 160 187Total non-interest income 871 958 1,062 1,692 2,523 2,306 2,693 3,154Revenues 2,546 2,860 3,866 4,870 7,603 7,916 8,198 8,981Personnel costs (473) (532) (700) (963) (994) (1,179) (1,387) (1,631)Other operating expenses (879) (933) (1,124) (1,579) (1,576) (1,869) (2,199) (2,585)Operating costs (1,352) (1,465) (1,823) (2,542) (2,570) (3,048) (3,586) (4,216)Pre-provision profit 1,193 1,395 2,042 2,328 5,033 4,868 4,612 4,766Total impairments (319) (166) (191) (419) (1,212) (786) (567) (628)Provisions (128) (159) (147) (148) (400) (337) (189) (209)Other non-operating income 188 260 1,067 400 358 197 220 872Pre-tax profit 934 1,329 2,772 2,162 3,779 3,943 4,077 4,801Tax (226) (266) (457) (412) (816) (789) (815) (960)Net profit 708 1,064 2,316 1,750 2,962 3,155 3,261 3,840Net profit adjustments 0 0 0 0 0 0 0 0Normalised net profit 708 1,064 2,316 1,750 2,962 3,155 3,261 3,840
Balance sheet
Interbank loans 1,024 896 3,133 4,801 8,334 9,168 10,085 11,093Customer loans 16,700 27,350 37,218 49,907 49,733 61,967 79,568 100,956Financial assets 213 148 146 666 915 1,006 1,107 1,218Interest-earning securities 10,740 14,247 17,046 24,963 35,441 40,049 43,252 46,713Fixed assets 1,408 885 940 1,085 1,143 1,223 1,308 1,400Other assets 6,383 6,759 9,096 7,519 9,815 9,502 8,399 7,188Total assets 36,468 50,287 67,578 88,941 105,381 122,914 143,719 168,567Interbank deposits 1,956 4,814 8,177 10,703 10,535 5,300 6,197 7,269Customer deposits 23,578 30,139 39,098 52,715 62,808 73,485 85,978 100,594Financial liabilities 5,513 7,890 8,559 10,843 13,007 15,172 17,740 20,807Other liabilities 1,521 2,773 4,862 5,210 5,715 13,748 16,639 20,428Ordinary equity 3,900 4,670 6,883 9,469 13,316 15,208 17,165 19,469Total liabilities & equity 36,468 50,287 67,578 88,941 105,381 122,914 143,719 168,567Risk-weighted assets 21,819 31,769 47,027 62,265 64,501 73,623 84,839 98,040Core Tier 1 capital 3,105 4,250 6,235 8,394 11,396 14,605 16,484 18,697Tier 1 capital 3,105 4,250 6,235 8,394 11,396 14,605 16,484 18,697
Per share data
Reported EPS (TL) 0.17 0.25 0.55 0.42 0.71 0.75 0.78 0.91Normalised EPS (TL) 0.17 0.25 0.55 0.42 0.71 0.75 0.78 0.91Normalised EPS growth (%) n/a 50.2 117.7 -24.4 69.2 6.5 3.4 17.8Dividend per share (TL) 0.00 0.01 0.03 0.05 0.08 0.10 0.10 0.10Dividend growth (%) n/a n/a 196.4 109.5 58.5 14.7 6.5 3.4Payout ratio (%) 0.0 3.3 4.5 12.6 11.8 12.7 13.1 11.5BV/share (TL) 0.93 1.11 1.64 2.25 3.17 3.62 4.09 4.64Tangible BV/share (TL) 0.93 1.11 1.64 2.25 3.17 3.62 4.09 4.64
Normalised earnings (eg, EBITDA, EBIT, net income and other sector-specific line items) are in the opinion of the analyst the best representation of a company's underlying and sustainable earnings derived from its regular operating activities. Source: Company data, ING estimates
Turkish Banks November 2010
41
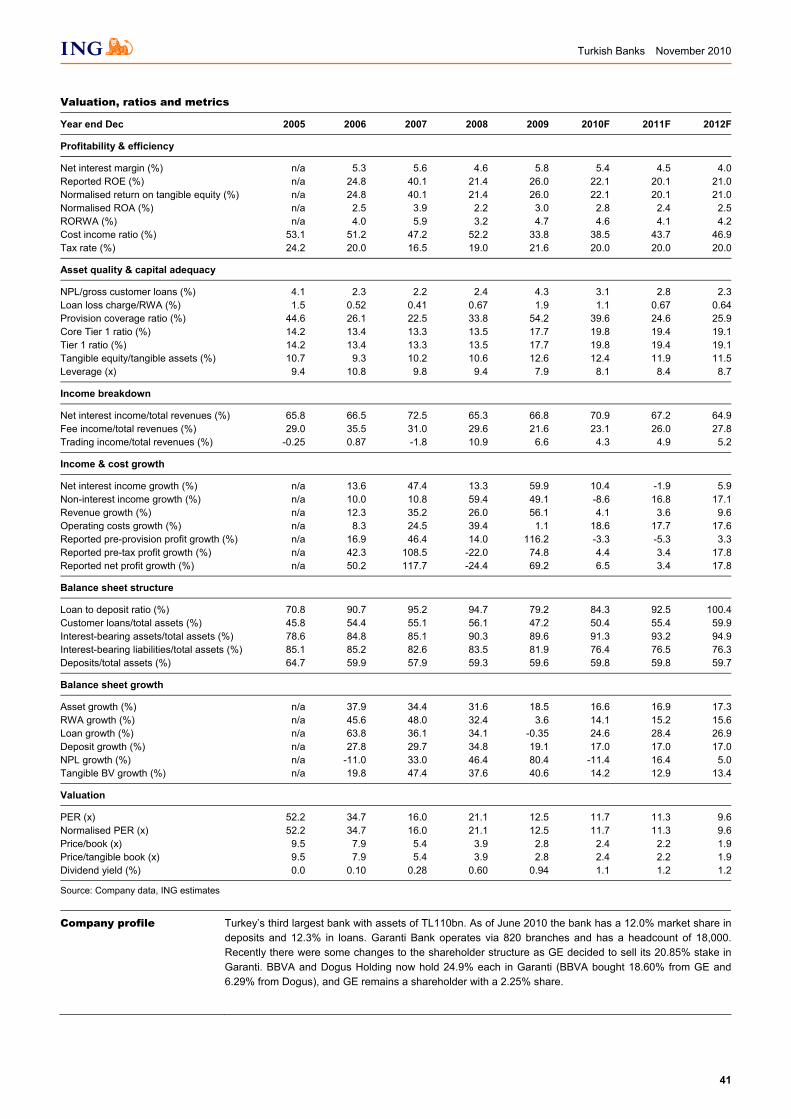
Valuation, ratios and metrics
Year end Dec 2005 2006 2007 2008 2009 2010F 2011F 2012F
Profitability & efficiency
Net interest margin (%) n/a 5.3 5.6 4.6 5.8 5.4 4.5 4.0Reported ROE (%) n/a 24.8 40.1 21.4 26.0 22.1 20.1 21.0Normalised return on tangible equity (%) n/a 24.8 40.1 21.4 26.0 22.1 20.1 21.0Normalised ROA (%) n/a 2.5 3.9 2.2 3.0 2.8 2.4 2.5RORWA (%) n/a 4.0 5.9 3.2 4.7 4.6 4.1 4.2Cost income ratio (%) 53.1 51.2 47.2 52.2 33.8 38.5 43.7 46.9Tax rate (%) 24.2 20.0 16.5 19.0 21.6 20.0 20.0 20.0
Asset quality & capital adequacy
NPL/gross customer loans (%) 4.1 2.3 2.2 2.4 4.3 3.1 2.8 2.3Loan loss charge/RWA (%) 1.5 0.52 0.41 0.67 1.9 1.1 0.67 0.64Provision coverage ratio (%) 44.6 26.1 22.5 33.8 54.2 39.6 24.6 25.9Core Tier 1 ratio (%) 14.2 13.4 13.3 13.5 17.7 19.8 19.4 19.1Tier 1 ratio (%) 14.2 13.4 13.3 13.5 17.7 19.8 19.4 19.1Tangible equity/tangible assets (%) 10.7 9.3 10.2 10.6 12.6 12.4 11.9 11.5Leverage (x) 9.4 10.8 9.8 9.4 7.9 8.1 8.4 8.7
Income breakdown
Net interest income/total revenues (%) 65.8 66.5 72.5 65.3 66.8 70.9 67.2 64.9Fee income/total revenues (%) 29.0 35.5 31.0 29.6 21.6 23.1 26.0 27.8Trading income/total revenues (%) -0.25 0.87 -1.8 10.9 6.6 4.3 4.9 5.2
Income & cost growth
Net interest income growth (%) n/a 13.6 47.4 13.3 59.9 10.4 -1.9 5.9Non-interest income growth (%) n/a 10.0 10.8 59.4 49.1 -8.6 16.8 17.1Revenue growth (%) n/a 12.3 35.2 26.0 56.1 4.1 3.6 9.6Operating costs growth (%) n/a 8.3 24.5 39.4 1.1 18.6 17.7 17.6Reported pre-provision profit growth (%) n/a 16.9 46.4 14.0 116.2 -3.3 -5.3 3.3Reported pre-tax profit growth (%) n/a 42.3 108.5 -22.0 74.8 4.4 3.4 17.8Reported net profit growth (%) n/a 50.2 117.7 -24.4 69.2 6.5 3.4 17.8
Balance sheet structure
Loan to deposit ratio (%) 70.8 90.7 95.2 94.7 79.2 84.3 92.5 100.4Customer loans/total assets (%) 45.8 54.4 55.1 56.1 47.2 50.4 55.4 59.9Interest-bearing assets/total assets (%) 78.6 84.8 85.1 90.3 89.6 91.3 93.2 94.9Interest-bearing liabilities/total assets (%) 85.1 85.2 82.6 83.5 81.9 76.4 76.5 76.3Deposits/total assets (%) 64.7 59.9 57.9 59.3 59.6 59.8 59.8 59.7
Balance sheet growth
Asset growth (%) n/a 37.9 34.4 31.6 18.5 16.6 16.9 17.3RWA growth (%) n/a 45.6 48.0 32.4 3.6 14.1 15.2 15.6Loan growth (%) n/a 63.8 36.1 34.1 -0.35 24.6 28.4 26.9Deposit growth (%) n/a 27.8 29.7 34.8 19.1 17.0 17.0 17.0NPL growth (%) n/a -11.0 33.0 46.4 80.4 -11.4 16.4 5.0Tangible BV growth (%) n/a 19.8 47.4 37.6 40.6 14.2 12.9 13.4
Valuation
PER (x) 52.2 34.7 16.0 21.1 12.5 11.7 11.3 9.6Normalised PER (x) 52.2 34.7 16.0 21.1 12.5 11.7 11.3 9.6Price/book (x) 9.5 7.9 5.4 3.9 2.8 2.4 2.2 1.9Price/tangible book (x) 9.5 7.9 5.4 3.9 2.8 2.4 2.2 1.9Dividend yield (%) 0.0 0.10 0.28 0.60 0.94 1.1 1.2 1.2
Source: Company data, ING estimates
Company profile Turkey’s third largest bank with assets of TL110bn. As of June 2010 the bank has a 12.0% market share indeposits and 12.3% in loans. Garanti Bank operates via 820 branches and has a headcount of 18,000.Recently there were some changes to the shareholder structure as GE decided to sell its 20.85% stake in Garanti. BBVA and Dogus Holding now hold 24.9% each in Garanti (BBVA bought 18.60% from GE and6.29% from Dogus), and GE remains a shareholder with a 2.25% share.

Turkish Banks November 2010
42
This page is left blank intentionally
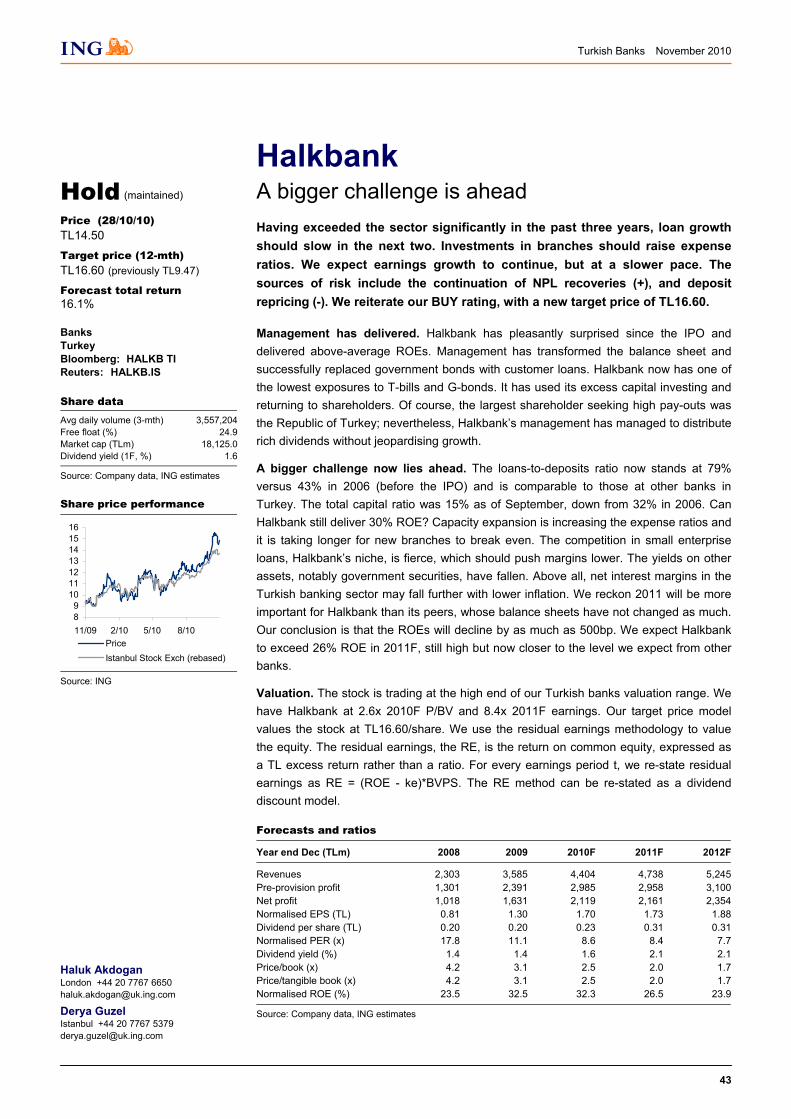
Turkish Banks November 2010
43
Halkbank A bigger challenge is ahead
Having exceeded the sector significantly in the past three years, loan growth should slow in the next two. Investments in branches should raise expense ratios. We expect earnings growth to continue, but at a slower pace. The sources of risk include the continuation of NPL recoveries (+), and deposit repricing (-). We reiterate our BUY rating, with a new target price of TL16.60.
Management has delivered. Halkbank has pleasantly surprised since the IPO and delivered above-average ROEs. Management has transformed the balance sheet and successfully replaced government bonds with customer loans. Halkbank now has one of the lowest exposures to T-bills and G-bonds. It has used its excess capital investing and returning to shareholders. Of course, the largest shareholder seeking high pay-outs was the Republic of Turkey; nevertheless, Halkbank’s management has managed to distribute rich dividends without jeopardising growth.
A bigger challenge now lies ahead. The loans-to-deposits ratio now stands at 79% versus 43% in 2006 (before the IPO) and is comparable to those at other banks in Turkey. The total capital ratio was 15% as of September, down from 32% in 2006. Can Halkbank still deliver 30% ROE? Capacity expansion is increasing the expense ratios and it is taking longer for new branches to break even. The competition in small enterprise loans, Halkbank’s niche, is fierce, which should push margins lower. The yields on other assets, notably government securities, have fallen. Above all, net interest margins in the Turkish banking sector may fall further with lower inflation. We reckon 2011 will be more important for Halkbank than its peers, whose balance sheets have not changed as much. Our conclusion is that the ROEs will decline by as much as 500bp. We expect Halkbank to exceed 26% ROE in 2011F, still high but now closer to the level we expect from other banks.
Valuation. The stock is trading at the high end of our Turkish banks valuation range. We have Halkbank at 2.6x 2010F P/BV and 8.4x 2011F earnings. Our target price model values the stock at TL16.60/share. We use the residual earnings methodology to value the equity. The residual earnings, the RE, is the return on common equity, expressed as a TL excess return rather than a ratio. For every earnings period t, we re-state residual earnings as RE = (ROE - ke)*BVPS. The RE method can be re-stated as a dividend discount model.
Forecasts and ratios
Year end Dec (TLm) 2008 2009 2010F 2011F 2012F
Revenues 2,303 3,585 4,404 4,738 5,245Pre-provision profit 1,301 2,391 2,985 2,958 3,100Net profit 1,018 1,631 2,119 2,161 2,354Normalised EPS (TL) 0.81 1.30 1.70 1.73 1.88Dividend per share (TL) 0.20 0.20 0.23 0.31 0.31Normalised PER (x) 17.8 11.1 8.6 8.4 7.7Dividend yield (%) 1.4 1.4 1.6 2.1 2.1Price/book (x) 4.2 3.1 2.5 2.0 1.7Price/tangible book (x) 4.2 3.1 2.5 2.0 1.7Normalised ROE (%) 23.5 32.5 32.3 26.5 23.9
Source: Company data, ING estimates
Haluk Akdogan London +44 20 7767 6650 [email protected]
Derya Guzel Istanbul +44 20 7767 5379 [email protected]
Hold (maintained)
Price (28/10/10)
TL14.50
Target price (12-mth)
TL16.60 (previously TL9.47)
Forecast total return 16.1%
Banks Turkey Bloomberg: HALKB TI Reuters: HALKB.IS
Share data Avg daily volume (3-mth) 3,557,204Free float (%) 24.9Market cap (TLm) 18,125.0Dividend yield (1F, %) 1.6
Source: Company data, ING estimates
Share price performance
89
10111213141516
11/09 2/10 5/10 8/10PriceIstanbul Stock Exch (rebased)
Source: ING
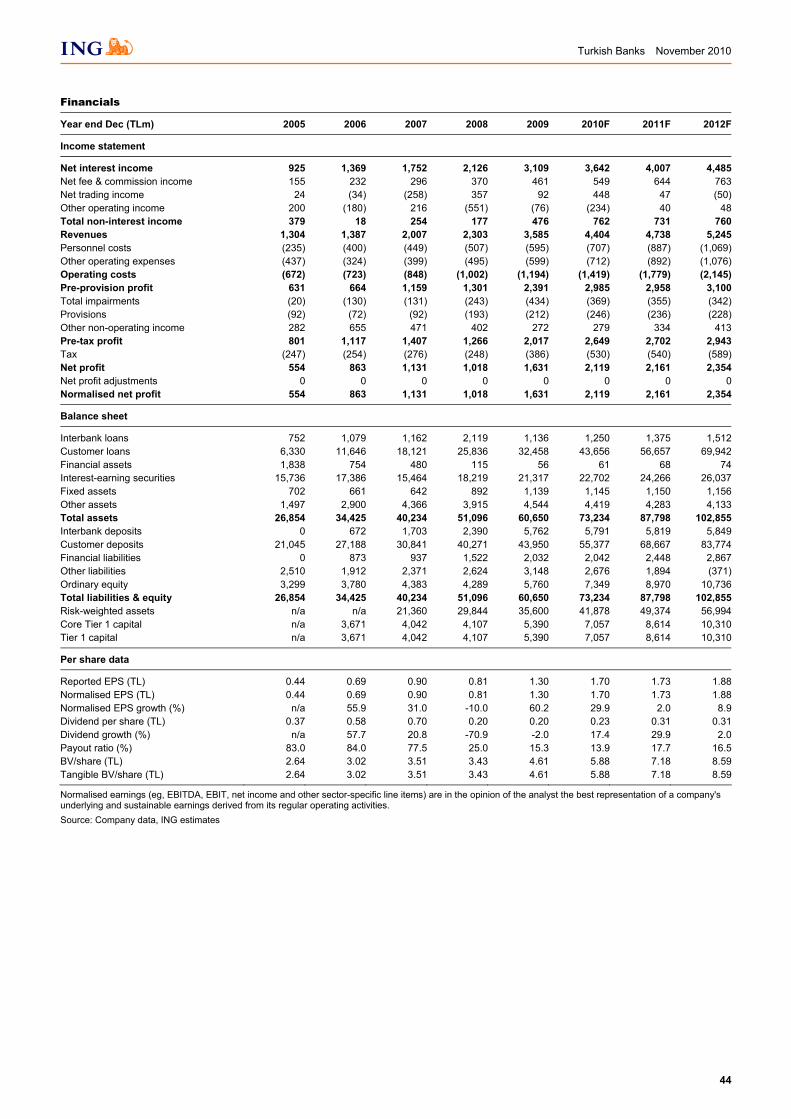
Turkish Banks November 2010
44
Financials
Year end Dec (TLm) 2005 2006 2007 2008 2009 2010F 2011F 2012F
Income statement
Net interest income 925 1,369 1,752 2,126 3,109 3,642 4,007 4,485Net fee & commission income 155 232 296 370 461 549 644 763Net trading income 24 (34) (258) 357 92 448 47 (50)Other operating income 200 (180) 216 (551) (76) (234) 40 48Total non-interest income 379 18 254 177 476 762 731 760Revenues 1,304 1,387 2,007 2,303 3,585 4,404 4,738 5,245Personnel costs (235) (400) (449) (507) (595) (707) (887) (1,069)Other operating expenses (437) (324) (399) (495) (599) (712) (892) (1,076)Operating costs (672) (723) (848) (1,002) (1,194) (1,419) (1,779) (2,145)Pre-provision profit 631 664 1,159 1,301 2,391 2,985 2,958 3,100Total impairments (20) (130) (131) (243) (434) (369) (355) (342)Provisions (92) (72) (92) (193) (212) (246) (236) (228)Other non-operating income 282 655 471 402 272 279 334 413Pre-tax profit 801 1,117 1,407 1,266 2,017 2,649 2,702 2,943Tax (247) (254) (276) (248) (386) (530) (540) (589)Net profit 554 863 1,131 1,018 1,631 2,119 2,161 2,354Net profit adjustments 0 0 0 0 0 0 0 0Normalised net profit 554 863 1,131 1,018 1,631 2,119 2,161 2,354
Balance sheet
Interbank loans 752 1,079 1,162 2,119 1,136 1,250 1,375 1,512Customer loans 6,330 11,646 18,121 25,836 32,458 43,656 56,657 69,942Financial assets 1,838 754 480 115 56 61 68 74Interest-earning securities 15,736 17,386 15,464 18,219 21,317 22,702 24,266 26,037Fixed assets 702 661 642 892 1,139 1,145 1,150 1,156Other assets 1,497 2,900 4,366 3,915 4,544 4,419 4,283 4,133Total assets 26,854 34,425 40,234 51,096 60,650 73,234 87,798 102,855Interbank deposits 0 672 1,703 2,390 5,762 5,791 5,819 5,849Customer deposits 21,045 27,188 30,841 40,271 43,950 55,377 68,667 83,774Financial liabilities 0 873 937 1,522 2,032 2,042 2,448 2,867Other liabilities 2,510 1,912 2,371 2,624 3,148 2,676 1,894 (371)Ordinary equity 3,299 3,780 4,383 4,289 5,760 7,349 8,970 10,736Total liabilities & equity 26,854 34,425 40,234 51,096 60,650 73,234 87,798 102,855Risk-weighted assets n/a n/a 21,360 29,844 35,600 41,878 49,374 56,994Core Tier 1 capital n/a 3,671 4,042 4,107 5,390 7,057 8,614 10,310Tier 1 capital n/a 3,671 4,042 4,107 5,390 7,057 8,614 10,310
Per share data
Reported EPS (TL) 0.44 0.69 0.90 0.81 1.30 1.70 1.73 1.88Normalised EPS (TL) 0.44 0.69 0.90 0.81 1.30 1.70 1.73 1.88Normalised EPS growth (%) n/a 55.9 31.0 -10.0 60.2 29.9 2.0 8.9Dividend per share (TL) 0.37 0.58 0.70 0.20 0.20 0.23 0.31 0.31Dividend growth (%) n/a 57.7 20.8 -70.9 -2.0 17.4 29.9 2.0Payout ratio (%) 83.0 84.0 77.5 25.0 15.3 13.9 17.7 16.5BV/share (TL) 2.64 3.02 3.51 3.43 4.61 5.88 7.18 8.59Tangible BV/share (TL) 2.64 3.02 3.51 3.43 4.61 5.88 7.18 8.59
Normalised earnings (eg, EBITDA, EBIT, net income and other sector-specific line items) are in the opinion of the analyst the best representation of a company's underlying and sustainable earnings derived from its regular operating activities. Source: Company data, ING estimates

Turkish Banks November 2010
45
Valuation, ratios and metrics
Year end Dec 2005 2006 2007 2008 2009 2010F 2011F 2012F
Profitability & efficiency
Net interest margin (%) n/a 4.9 5.3 5.2 6.1 5.9 5.3 5.0Reported ROE (%) n/a 24.4 27.7 23.5 32.5 32.3 26.5 23.9Normalised return on tangible equity (%) n/a 24.4 27.7 23.5 32.5 32.3 26.5 23.9Normalised ROA (%) n/a 2.8 3.0 2.2 2.9 3.2 2.7 2.5RORWA (%) n/a n/a 10.6 4.0 5.0 5.5 4.7 4.4Cost income ratio (%) 51.6 52.1 42.2 43.5 33.3 32.2 37.6 40.9Tax rate (%) 30.8 22.7 19.6 19.6 19.1 20.0 20.0 20.0
Asset quality & capital adequacy
NPL/gross customer loans (%) 0.0 8.5 5.4 4.6 4.9 3.8 3.5 3.1Loan loss charge/RWA (%) n/a n/a 0.61 0.81 1.2 0.88 0.72 0.60Provision coverage ratio (%) n/a 12.0 12.7 19.4 26.0 21.1 17.4 15.3Core Tier 1 ratio (%) n/a n/a 18.9 13.8 15.1 16.9 17.4 18.1Tier 1 ratio (%) n/a n/a 18.9 13.8 15.1 16.9 17.4 18.1Tangible equity/tangible assets (%) 12.3 11.0 10.9 8.4 9.5 10.0 10.2 10.4Leverage (x) 8.1 9.1 9.2 11.9 10.5 10.0 9.8 9.6
Income breakdown
Net interest income/total revenues (%) 70.9 98.7 87.3 92.3 86.7 82.7 84.6 85.5Fee income/total revenues (%) 11.9 16.7 14.8 16.1 12.8 12.5 13.6 14.5Trading income/total revenues (%) 1.8 -2.5 -12.9 15.5 2.6 10.2 0.99 -0.96
Income & cost growth
Net interest income growth (%) n/a 48.1 28.0 21.3 46.2 17.2 10.0 11.9Non-interest income growth (%) n/a -95.4 1,344 -30.5 169.6 60.0 -4.1 3.9Revenue growth (%) n/a 6.4 44.7 14.8 55.7 22.8 7.6 10.7Operating costs growth (%) n/a 7.5 17.2 18.2 19.1 18.9 25.4 20.5Reported pre-provision profit growth (%) n/a 5.2 74.6 12.2 83.9 24.8 -0.89 4.8Reported pre-tax profit growth (%) n/a 39.5 25.9 -10.0 59.3 31.3 2.0 8.9Reported net profit growth (%) n/a 55.9 31.0 -10.0 60.2 29.9 2.0 8.9
Balance sheet structure
Loan to deposit ratio (%) 30.1 42.8 58.8 64.2 73.9 78.8 82.5 83.5Customer loans/total assets (%) 23.6 33.8 45.0 50.6 53.5 59.6 64.5 68.0Interest-bearing assets/total assets (%) 91.8 89.7 87.6 90.6 90.6 92.4 93.8 94.9Interest-bearing liabilities/total assets (%) 78.4 83.5 83.2 86.5 85.3 86.3 87.6 89.9Deposits/total assets (%) 78.4 79.0 76.7 78.8 72.5 75.6 78.2 81.4
Balance sheet growth
Asset growth (%) n/a 28.2 16.9 27.0 18.7 20.7 19.9 17.1RWA growth (%) n/a n/a n/a 39.7 19.3 17.6 17.9 15.4Loan growth (%) n/a 84.0 55.6 42.6 25.6 34.5 29.8 23.4Deposit growth (%) n/a 29.2 13.4 30.6 9.1 26.0 24.0 22.0NPL growth (%) n/a n/a -4.8 21.2 33.3 4.7 16.8 9.7Tangible BV growth (%) n/a 14.6 16.0 -2.2 34.3 27.6 22.1 19.7
Valuation
PER (x) 32.7 21.0 16.0 17.8 11.1 8.6 8.4 7.7Normalised PER (x) 32.7 21.0 16.0 17.8 11.1 8.6 8.4 7.7Price/book (x) 5.5 4.8 4.1 4.2 3.1 2.5 2.0 1.7Price/tangible book (x) 5.5 4.8 4.1 4.2 3.1 2.5 2.0 1.7Dividend yield (%) 2.5 4.0 4.8 1.4 1.4 1.6 2.1 2.1
Source: Company data, ING estimates
Company profile Halkbank is the seventh largest bank in terms of asset size, with TL65bn. The bank has an 8% marketshare in loans and 9% in deposits. It operates via 700 branches and employs 14,000 people. The Turkish Privatization Administration agency owns 75% of the bank, with a possibility of an SPO or block sale in the medium term.

Turkish Banks November 2010
46
This page is left blank intentionally
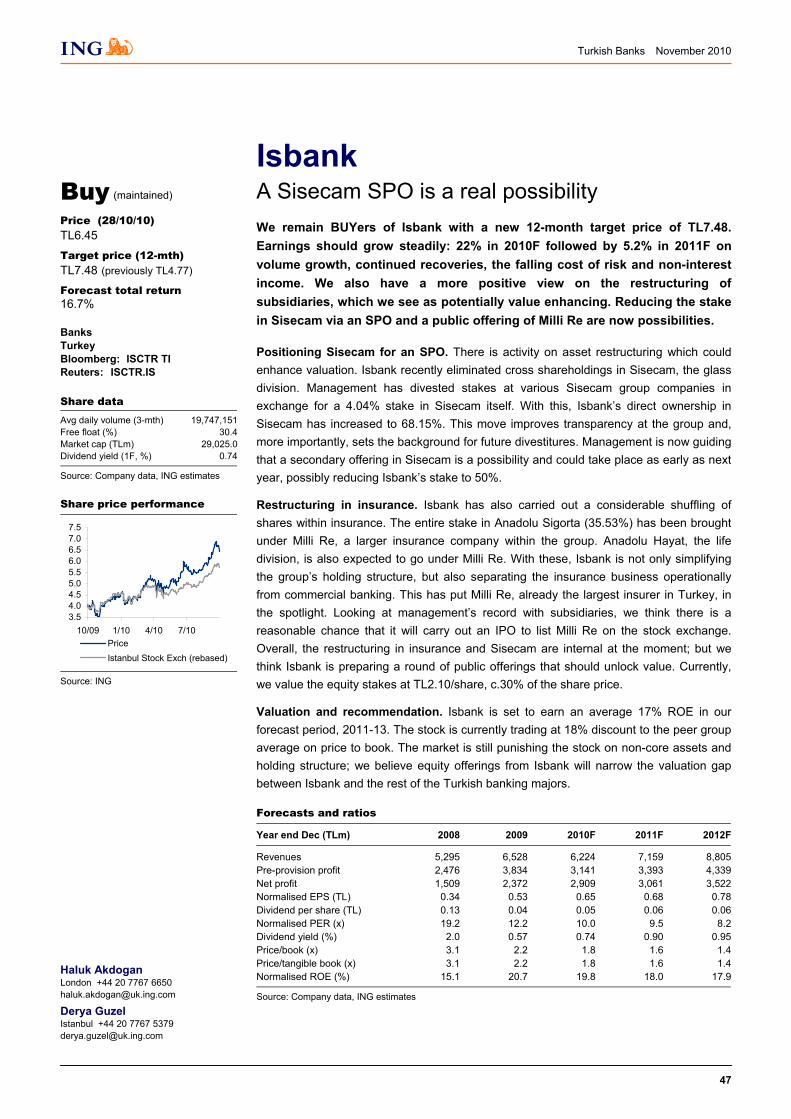
Turkish Banks November 2010
47
Isbank A Sisecam SPO is a real possibility
We remain BUYers of Isbank with a new 12-month target price of TL7.48. Earnings should grow steadily: 22% in 2010F followed by 5.2% in 2011F on volume growth, continued recoveries, the falling cost of risk and non-interest income. We also have a more positive view on the restructuring of subsidiaries, which we see as potentially value enhancing. Reducing the stake in Sisecam via an SPO and a public offering of Milli Re are now possibilities.
Positioning Sisecam for an SPO. There is activity on asset restructuring which could enhance valuation. Isbank recently eliminated cross shareholdings in Sisecam, the glass division. Management has divested stakes at various Sisecam group companies in exchange for a 4.04% stake in Sisecam itself. With this, Isbank’s direct ownership in Sisecam has increased to 68.15%. This move improves transparency at the group and, more importantly, sets the background for future divestitures. Management is now guiding that a secondary offering in Sisecam is a possibility and could take place as early as next year, possibly reducing Isbank’s stake to 50%.
Restructuring in insurance. Isbank has also carried out a considerable shuffling of shares within insurance. The entire stake in Anadolu Sigorta (35.53%) has been brought under Milli Re, a larger insurance company within the group. Anadolu Hayat, the life division, is also expected to go under Milli Re. With these, Isbank is not only simplifying the group’s holding structure, but also separating the insurance business operationally from commercial banking. This has put Milli Re, already the largest insurer in Turkey, inthe spotlight. Looking at management’s record with subsidiaries, we think there is a reasonable chance that it will carry out an IPO to list Milli Re on the stock exchange. Overall, the restructuring in insurance and Sisecam are internal at the moment; but we think Isbank is preparing a round of public offerings that should unlock value. Currently, we value the equity stakes at TL2.10/share, c.30% of the share price.
Valuation and recommendation. Isbank is set to earn an average 17% ROE in our forecast period, 2011-13. The stock is currently trading at 18% discount to the peer group average on price to book. The market is still punishing the stock on non-core assets and holding structure; we believe equity offerings from Isbank will narrow the valuation gap between Isbank and the rest of the Turkish banking majors.
Forecasts and ratios
Year end Dec (TLm) 2008 2009 2010F 2011F 2012F
Revenues 5,295 6,528 6,224 7,159 8,805Pre-provision profit 2,476 3,834 3,141 3,393 4,339Net profit 1,509 2,372 2,909 3,061 3,522Normalised EPS (TL) 0.34 0.53 0.65 0.68 0.78Dividend per share (TL) 0.13 0.04 0.05 0.06 0.06Normalised PER (x) 19.2 12.2 10.0 9.5 8.2Dividend yield (%) 2.0 0.57 0.74 0.90 0.95Price/book (x) 3.1 2.2 1.8 1.6 1.4Price/tangible book (x) 3.1 2.2 1.8 1.6 1.4Normalised ROE (%) 15.1 20.7 19.8 18.0 17.9
Source: Company data, ING estimates
Haluk Akdogan London +44 20 7767 6650 [email protected]
Derya Guzel Istanbul +44 20 7767 5379 [email protected]
Buy (maintained)
Price (28/10/10)
TL6.45
Target price (12-mth)
TL7.48 (previously TL4.77)
Forecast total return 16.7%
Banks Turkey Bloomberg: ISCTR TI Reuters: ISCTR.IS
Share data Avg daily volume (3-mth) 19,747,151Free float (%) 30.4Market cap (TLm) 29,025.0Dividend yield (1F, %) 0.74
Source: Company data, ING estimates
Share price performance
3.54.04.55.05.56.06.57.07.5
10/09 1/10 4/10 7/10PriceIstanbul Stock Exch (rebased)
Source: ING
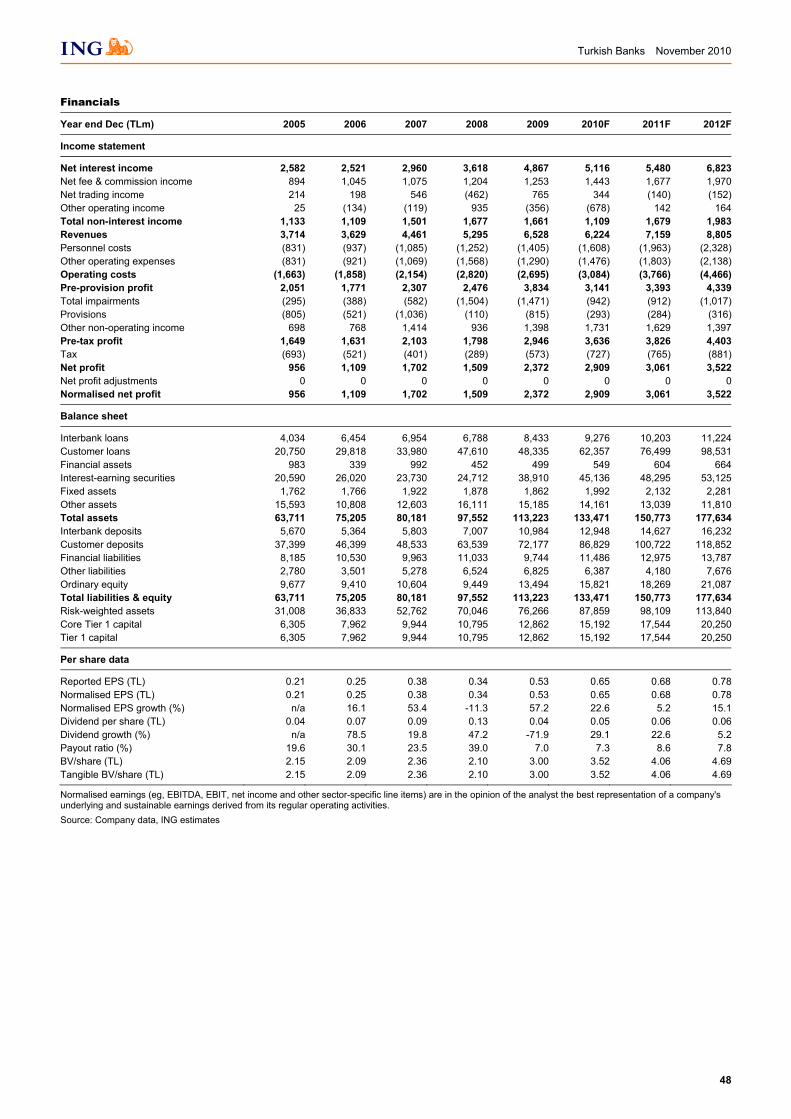
Turkish Banks November 2010
48
Financials
Year end Dec (TLm) 2005 2006 2007 2008 2009 2010F 2011F 2012F
Income statement
Net interest income 2,582 2,521 2,960 3,618 4,867 5,116 5,480 6,823Net fee & commission income 894 1,045 1,075 1,204 1,253 1,443 1,677 1,970Net trading income 214 198 546 (462) 765 344 (140) (152)Other operating income 25 (134) (119) 935 (356) (678) 142 164Total non-interest income 1,133 1,109 1,501 1,677 1,661 1,109 1,679 1,983Revenues 3,714 3,629 4,461 5,295 6,528 6,224 7,159 8,805Personnel costs (831) (937) (1,085) (1,252) (1,405) (1,608) (1,963) (2,328)Other operating expenses (831) (921) (1,069) (1,568) (1,290) (1,476) (1,803) (2,138)Operating costs (1,663) (1,858) (2,154) (2,820) (2,695) (3,084) (3,766) (4,466)Pre-provision profit 2,051 1,771 2,307 2,476 3,834 3,141 3,393 4,339Total impairments (295) (388) (582) (1,504) (1,471) (942) (912) (1,017)Provisions (805) (521) (1,036) (110) (815) (293) (284) (316)Other non-operating income 698 768 1,414 936 1,398 1,731 1,629 1,397Pre-tax profit 1,649 1,631 2,103 1,798 2,946 3,636 3,826 4,403Tax (693) (521) (401) (289) (573) (727) (765) (881)Net profit 956 1,109 1,702 1,509 2,372 2,909 3,061 3,522Net profit adjustments 0 0 0 0 0 0 0 0Normalised net profit 956 1,109 1,702 1,509 2,372 2,909 3,061 3,522
Balance sheet
Interbank loans 4,034 6,454 6,954 6,788 8,433 9,276 10,203 11,224Customer loans 20,750 29,818 33,980 47,610 48,335 62,357 76,499 98,531Financial assets 983 339 992 452 499 549 604 664Interest-earning securities 20,590 26,020 23,730 24,712 38,910 45,136 48,295 53,125Fixed assets 1,762 1,766 1,922 1,878 1,862 1,992 2,132 2,281Other assets 15,593 10,808 12,603 16,111 15,185 14,161 13,039 11,810Total assets 63,711 75,205 80,181 97,552 113,223 133,471 150,773 177,634Interbank deposits 5,670 5,364 5,803 7,007 10,984 12,948 14,627 16,232Customer deposits 37,399 46,399 48,533 63,539 72,177 86,829 100,722 118,852Financial liabilities 8,185 10,530 9,963 11,033 9,744 11,486 12,975 13,787Other liabilities 2,780 3,501 5,278 6,524 6,825 6,387 4,180 7,676Ordinary equity 9,677 9,410 10,604 9,449 13,494 15,821 18,269 21,087Total liabilities & equity 63,711 75,205 80,181 97,552 113,223 133,471 150,773 177,634Risk-weighted assets 31,008 36,833 52,762 70,046 76,266 87,859 98,109 113,840Core Tier 1 capital 6,305 7,962 9,944 10,795 12,862 15,192 17,544 20,250Tier 1 capital 6,305 7,962 9,944 10,795 12,862 15,192 17,544 20,250
Per share data
Reported EPS (TL) 0.21 0.25 0.38 0.34 0.53 0.65 0.68 0.78Normalised EPS (TL) 0.21 0.25 0.38 0.34 0.53 0.65 0.68 0.78Normalised EPS growth (%) n/a 16.1 53.4 -11.3 57.2 22.6 5.2 15.1Dividend per share (TL) 0.04 0.07 0.09 0.13 0.04 0.05 0.06 0.06Dividend growth (%) n/a 78.5 19.8 47.2 -71.9 29.1 22.6 5.2Payout ratio (%) 19.6 30.1 23.5 39.0 7.0 7.3 8.6 7.8BV/share (TL) 2.15 2.09 2.36 2.10 3.00 3.52 4.06 4.69Tangible BV/share (TL) 2.15 2.09 2.36 2.10 3.00 3.52 4.06 4.69
Normalised earnings (eg, EBITDA, EBIT, net income and other sector-specific line items) are in the opinion of the analyst the best representation of a company's underlying and sustainable earnings derived from its regular operating activities. Source: Company data, ING estimates
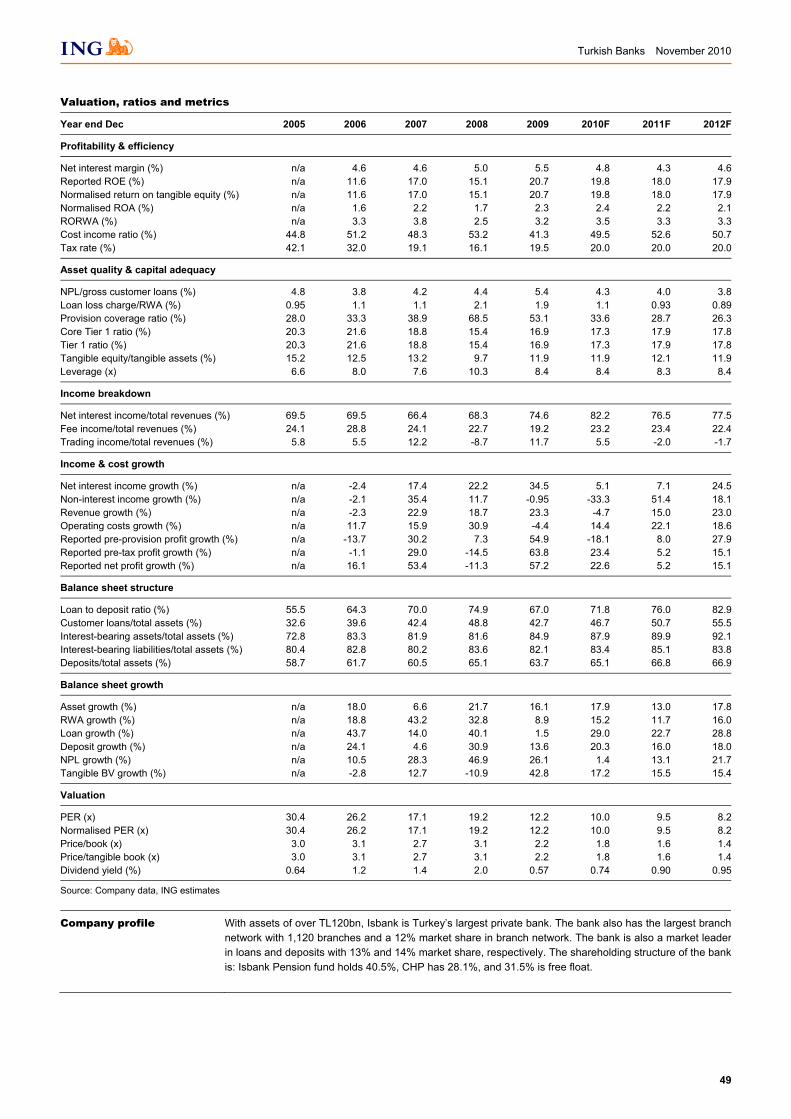
Turkish Banks November 2010
49
Valuation, ratios and metrics
Year end Dec 2005 2006 2007 2008 2009 2010F 2011F 2012F
Profitability & efficiency
Net interest margin (%) n/a 4.6 4.6 5.0 5.5 4.8 4.3 4.6Reported ROE (%) n/a 11.6 17.0 15.1 20.7 19.8 18.0 17.9Normalised return on tangible equity (%) n/a 11.6 17.0 15.1 20.7 19.8 18.0 17.9Normalised ROA (%) n/a 1.6 2.2 1.7 2.3 2.4 2.2 2.1RORWA (%) n/a 3.3 3.8 2.5 3.2 3.5 3.3 3.3Cost income ratio (%) 44.8 51.2 48.3 53.2 41.3 49.5 52.6 50.7Tax rate (%) 42.1 32.0 19.1 16.1 19.5 20.0 20.0 20.0
Asset quality & capital adequacy
NPL/gross customer loans (%) 4.8 3.8 4.2 4.4 5.4 4.3 4.0 3.8Loan loss charge/RWA (%) 0.95 1.1 1.1 2.1 1.9 1.1 0.93 0.89Provision coverage ratio (%) 28.0 33.3 38.9 68.5 53.1 33.6 28.7 26.3Core Tier 1 ratio (%) 20.3 21.6 18.8 15.4 16.9 17.3 17.9 17.8Tier 1 ratio (%) 20.3 21.6 18.8 15.4 16.9 17.3 17.9 17.8Tangible equity/tangible assets (%) 15.2 12.5 13.2 9.7 11.9 11.9 12.1 11.9Leverage (x) 6.6 8.0 7.6 10.3 8.4 8.4 8.3 8.4
Income breakdown
Net interest income/total revenues (%) 69.5 69.5 66.4 68.3 74.6 82.2 76.5 77.5Fee income/total revenues (%) 24.1 28.8 24.1 22.7 19.2 23.2 23.4 22.4Trading income/total revenues (%) 5.8 5.5 12.2 -8.7 11.7 5.5 -2.0 -1.7
Income & cost growth
Net interest income growth (%) n/a -2.4 17.4 22.2 34.5 5.1 7.1 24.5Non-interest income growth (%) n/a -2.1 35.4 11.7 -0.95 -33.3 51.4 18.1Revenue growth (%) n/a -2.3 22.9 18.7 23.3 -4.7 15.0 23.0Operating costs growth (%) n/a 11.7 15.9 30.9 -4.4 14.4 22.1 18.6Reported pre-provision profit growth (%) n/a -13.7 30.2 7.3 54.9 -18.1 8.0 27.9Reported pre-tax profit growth (%) n/a -1.1 29.0 -14.5 63.8 23.4 5.2 15.1Reported net profit growth (%) n/a 16.1 53.4 -11.3 57.2 22.6 5.2 15.1
Balance sheet structure
Loan to deposit ratio (%) 55.5 64.3 70.0 74.9 67.0 71.8 76.0 82.9Customer loans/total assets (%) 32.6 39.6 42.4 48.8 42.7 46.7 50.7 55.5Interest-bearing assets/total assets (%) 72.8 83.3 81.9 81.6 84.9 87.9 89.9 92.1Interest-bearing liabilities/total assets (%) 80.4 82.8 80.2 83.6 82.1 83.4 85.1 83.8Deposits/total assets (%) 58.7 61.7 60.5 65.1 63.7 65.1 66.8 66.9
Balance sheet growth
Asset growth (%) n/a 18.0 6.6 21.7 16.1 17.9 13.0 17.8RWA growth (%) n/a 18.8 43.2 32.8 8.9 15.2 11.7 16.0Loan growth (%) n/a 43.7 14.0 40.1 1.5 29.0 22.7 28.8Deposit growth (%) n/a 24.1 4.6 30.9 13.6 20.3 16.0 18.0NPL growth (%) n/a 10.5 28.3 46.9 26.1 1.4 13.1 21.7Tangible BV growth (%) n/a -2.8 12.7 -10.9 42.8 17.2 15.5 15.4
Valuation
PER (x) 30.4 26.2 17.1 19.2 12.2 10.0 9.5 8.2Normalised PER (x) 30.4 26.2 17.1 19.2 12.2 10.0 9.5 8.2Price/book (x) 3.0 3.1 2.7 3.1 2.2 1.8 1.6 1.4Price/tangible book (x) 3.0 3.1 2.7 3.1 2.2 1.8 1.6 1.4Dividend yield (%) 0.64 1.2 1.4 2.0 0.57 0.74 0.90 0.95
Source: Company data, ING estimates
Company profile With assets of over TL120bn, Isbank is Turkey’s largest private bank. The bank also has the largest branchnetwork with 1,120 branches and a 12% market share in branch network. The bank is also a market leader in loans and deposits with 13% and 14% market share, respectively. The shareholding structure of the bankis: Isbank Pension fund holds 40.5%, CHP has 28.1%, and 31.5% is free float.

Turkish Banks November 2010
50
This page is left blank intentionally
Turkish Banks November 2010
51
Sekerbank Disappointed and lagged, but the worst is over
Sekerbank shares have been hit by the down-cycle in credit markets. We think the bank is gradually recovering, but the shares are not yet reflecting this. We upgrade our recommendation from Hold to BUY. The upgrade follows revisions we make to our revenue model on the back of strong loan growth. The shares are currently trading at a compelling 0.88x P/BV and 7.0x PER (2011F), on our assumptions.
Loan growth has outstripped the sector. Sekerbank has managed to grow its loan book 29% in 1H10 versus the sector average of 16%. We believe Sekerbank’s unique customer base, mainly SMEs including their niche business of loans to farmers, should help the bank’s loan growth to outpace that of sector in the next three years
Expense ratios to improve. The management is implementing structural changes in branch concept, which could reduce the cost-to-income ratio by 500bp in the next three years. The cost allocation between the HQ and branches will change and management expects “sizeable” cost savings. Most of the costs will now move to branches, improving transparency both at branches and at the HQ level. Management also expects to relocate some of the inefficient braches as part of the restructuring already underway.
Consensus lacks conviction. There is no clear consensus on the stock if you look at the recent sell-side research. There are 2 Buys, 7 Holds and 1 Sell, but not much conviction as far as we can tell. Our revised 2011F earnings estimate is 12% above the market expectation. We expect consensus to move closer to our estimates.
Valuation, risk and recommendation. The stock did not participate in the rally. In the past 12 months the shares are down 2% versus a 45% gain in Turkey’s main banking index, with its peers gaining 50% on average. The stock has traded at the bottom of our Turkish banks valuation range since September 2007. Indeed, it is the only bank in our coverage universe trading below its book value. The bank has suffered from the down cycle in credit more than most other banks in Turkey, and the equity value reflects that. We now believe the worst is over and the shares should start moving up to offset. Our model projects faster loan growth in the next two years. Slow growth would make our estimates redundant.
Forecasts and ratios
Year end Dec (TLm) 2008 2009 2010F 2011F 2012F
Revenues 555 737 673 824 1,014Pre-provision profit 127 312 188 222 287Net profit 144 152 161 187 235Normalised EPS (TL) 0.19 0.20 0.21 0.25 0.31Dividend per share (TL) 0.00 0.03 0.04 0.04 0.05Normalised PER (x) 9.5 9.0 8.5 7.3 5.8Dividend yield (%) 0.0 1.7 2.2 2.4 2.7Price/book (x) 1.4 1.1 0.98 0.88 0.78Price/tangible book (x) 1.4 1.1 0.98 0.88 0.78Normalised ROE (%) 15.7 13.7 12.2 12.7 14.3
Source: Company data, ING estimates
Haluk Akdogan London +44 20 7767 6650 [email protected]
Derya Guzel Istanbul +44 20 7767 5379 [email protected]
Buy (previously Hold)
Price (28/10/10)
TL1.82
Target price (12-mth)
TL2.65 (previously TL1.73)
Forecast total return 47.8%
Banks Turkey Bloomberg: SKBNK TI Reuters: SKBNK.IS
Share data Avg daily volume (3-mth) 4,585,491Free float (%) 32.0Market cap (TLm) 1,365.0Dividend yield (1F, %) 2.2
Source: Company data, ING estimates
Share price performance
1.01.52.02.53.03.54.04.5
10/09 1/10 4/10 7/10PriceIstanbul Stock Exch (rebased)
Source: ING
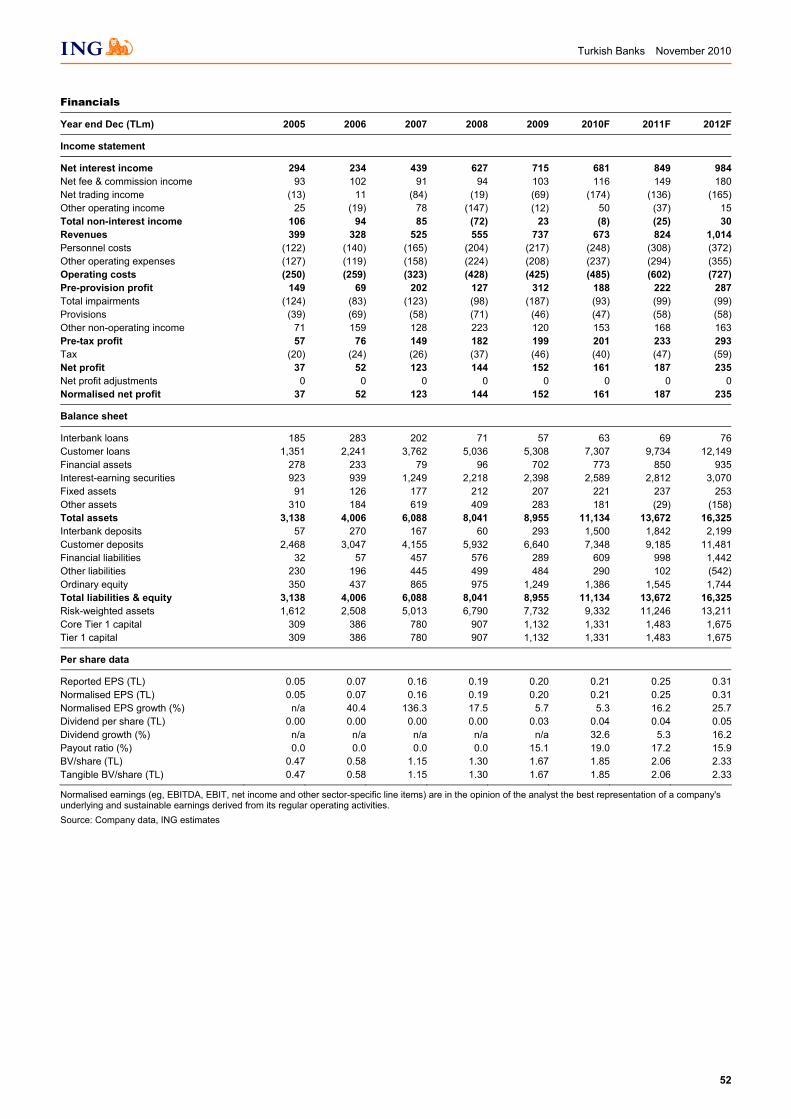
Turkish Banks November 2010
52
Financials
Year end Dec (TLm) 2005 2006 2007 2008 2009 2010F 2011F 2012F
Income statement
Net interest income 294 234 439 627 715 681 849 984Net fee & commission income 93 102 91 94 103 116 149 180Net trading income (13) 11 (84) (19) (69) (174) (136) (165)Other operating income 25 (19) 78 (147) (12) 50 (37) 15Total non-interest income 106 94 85 (72) 23 (8) (25) 30Revenues 399 328 525 555 737 673 824 1,014Personnel costs (122) (140) (165) (204) (217) (248) (308) (372)Other operating expenses (127) (119) (158) (224) (208) (237) (294) (355)Operating costs (250) (259) (323) (428) (425) (485) (602) (727)Pre-provision profit 149 69 202 127 312 188 222 287Total impairments (124) (83) (123) (98) (187) (93) (99) (99)Provisions (39) (69) (58) (71) (46) (47) (58) (58)Other non-operating income 71 159 128 223 120 153 168 163Pre-tax profit 57 76 149 182 199 201 233 293Tax (20) (24) (26) (37) (46) (40) (47) (59)Net profit 37 52 123 144 152 161 187 235Net profit adjustments 0 0 0 0 0 0 0 0Normalised net profit 37 52 123 144 152 161 187 235
Balance sheet
Interbank loans 185 283 202 71 57 63 69 76Customer loans 1,351 2,241 3,762 5,036 5,308 7,307 9,734 12,149Financial assets 278 233 79 96 702 773 850 935Interest-earning securities 923 939 1,249 2,218 2,398 2,589 2,812 3,070Fixed assets 91 126 177 212 207 221 237 253Other assets 310 184 619 409 283 181 (29) (158)Total assets 3,138 4,006 6,088 8,041 8,955 11,134 13,672 16,325Interbank deposits 57 270 167 60 293 1,500 1,842 2,199Customer deposits 2,468 3,047 4,155 5,932 6,640 7,348 9,185 11,481Financial liabilities 32 57 457 576 289 609 998 1,442Other liabilities 230 196 445 499 484 290 102 (542)Ordinary equity 350 437 865 975 1,249 1,386 1,545 1,744Total liabilities & equity 3,138 4,006 6,088 8,041 8,955 11,134 13,672 16,325Risk-weighted assets 1,612 2,508 5,013 6,790 7,732 9,332 11,246 13,211Core Tier 1 capital 309 386 780 907 1,132 1,331 1,483 1,675Tier 1 capital 309 386 780 907 1,132 1,331 1,483 1,675
Per share data
Reported EPS (TL) 0.05 0.07 0.16 0.19 0.20 0.21 0.25 0.31Normalised EPS (TL) 0.05 0.07 0.16 0.19 0.20 0.21 0.25 0.31Normalised EPS growth (%) n/a 40.4 136.3 17.5 5.7 5.3 16.2 25.7Dividend per share (TL) 0.00 0.00 0.00 0.00 0.03 0.04 0.04 0.05Dividend growth (%) n/a n/a n/a n/a n/a 32.6 5.3 16.2Payout ratio (%) 0.0 0.0 0.0 0.0 15.1 19.0 17.2 15.9BV/share (TL) 0.47 0.58 1.15 1.30 1.67 1.85 2.06 2.33Tangible BV/share (TL) 0.47 0.58 1.15 1.30 1.67 1.85 2.06 2.33
Normalised earnings (eg, EBITDA, EBIT, net income and other sector-specific line items) are in the opinion of the analyst the best representation of a company's underlying and sustainable earnings derived from its regular operating activities. Source: Company data, ING estimates

Turkish Banks November 2010
53
Valuation, ratios and metrics
Year end Dec 2005 2006 2007 2008 2009 2010F 2011F 2012F
Profitability & efficiency
Net interest margin (%) n/a 7.3 9.8 9.9 9.0 7.1 7.0 6.6Reported ROE (%) n/a 13.2 18.9 15.7 13.7 12.2 12.7 14.3Normalised return on tangible equity (%) n/a 13.2 18.9 15.7 13.7 12.2 12.7 14.3Normalised ROA (%) n/a 1.5 2.4 2.0 1.8 1.6 1.5 1.6RORWA (%) n/a 2.5 3.3 2.4 2.1 1.9 1.8 1.9Cost income ratio (%) 62.6 79.1 61.5 77.1 57.6 72.1 73.0 71.7Tax rate (%) 35.5 31.6 17.5 20.6 23.2 20.0 20.0 20.0
Asset quality & capital adequacy
NPL/gross customer loans (%) 16.0 11.0 3.9 4.7 7.6 5.7 5.4 4.5Loan loss charge/RWA (%) 7.7 3.3 2.5 1.4 2.4 1.00 0.88 0.75Provision coverage ratio (%) 57.1 33.6 83.5 41.4 46.6 22.5 18.8 18.2Core Tier 1 ratio (%) 19.2 15.4 15.6 13.4 14.6 14.3 13.2 12.7Tier 1 ratio (%) 19.2 15.4 15.6 13.4 14.6 14.3 13.2 12.7Tangible equity/tangible assets (%) 11.2 10.9 14.2 12.1 14.0 12.4 11.3 10.7Leverage (x) 9.0 9.2 7.0 8.2 7.2 8.0 8.9 9.4
Income breakdown
Net interest income/total revenues (%) 73.5 71.4 83.7 113.0 96.9 101.2 103.0 97.0Fee income/total revenues (%) 23.4 31.2 17.3 16.9 14.0 17.2 18.1 17.7Trading income/total revenues (%) -3.3 3.2 -16.0 -3.4 -9.3 -25.8 -16.6 -16.3
Income & cost growth
Net interest income growth (%) n/a -20.3 87.8 42.7 14.1 -4.7 24.6 16.0Non-interest income growth (%) n/a -11.1 -8.9 n/a n/a n/a n/a n/aRevenue growth (%) n/a -17.9 60.1 5.7 32.9 -8.7 22.4 23.1Operating costs growth (%) n/a 3.8 24.6 32.4 -0.60 14.2 24.0 20.9Reported pre-provision profit growth (%) n/a -54.1 194.1 -37.0 145.7 -39.8 18.2 29.0Reported pre-tax profit growth (%) n/a 32.5 95.8 22.0 9.3 1.1 16.2 25.7Reported net profit growth (%) n/a 40.4 136.3 17.5 5.7 5.3 16.2 25.7
Balance sheet structure
Loan to deposit ratio (%) 54.7 73.5 90.5 84.9 79.9 99.4 106.0 105.8Customer loans/total assets (%) 43.1 55.9 61.8 62.6 59.3 65.6 71.2 74.4Interest-bearing assets/total assets (%) 87.2 92.3 86.9 92.3 94.5 96.4 98.5 99.4Interest-bearing liabilities/total assets (%) 81.5 84.2 78.5 81.7 80.6 84.9 88.0 92.6Deposits/total assets (%) 78.7 76.1 68.2 73.8 74.2 66.0 67.2 70.3
Balance sheet growth
Asset growth (%) n/a 27.7 52.0 32.1 11.4 24.3 22.8 19.4RWA growth (%) n/a 55.6 99.9 35.4 13.9 20.7 20.5 17.5Loan growth (%) n/a 65.8 67.9 33.9 5.4 37.6 33.2 24.8Deposit growth (%) n/a 23.4 36.4 42.8 11.9 10.7 25.0 25.0NPL growth (%) n/a 13.4 -40.0 60.2 70.4 2.9 26.9 3.9Tangible BV growth (%) n/a 24.9 97.9 12.8 28.1 10.9 11.4 12.9
Valuation
PER (x) 36.9 26.2 11.1 9.5 9.0 8.5 7.3 5.8Normalised PER (x) 36.9 26.2 11.1 9.5 9.0 8.5 7.3 5.8Price/book (x) 3.9 3.1 1.6 1.4 1.1 0.98 0.88 0.78Price/tangible book (x) 3.9 3.1 1.6 1.4 1.1 0.98 0.88 0.78Dividend yield (%) 0.0 0.0 0.0 0.0 1.7 2.2 2.4 2.7
Source: Company data, ING estimates
Company profile Sekerbank is a medium-sized bank with 256 branches and 3,500 employees. The bank has 1.2% market share in deposits and 1.4% in loans. With asset size reaching TL10.5bn, Sekerbank is Turkey’s 14th largestbank. The bank has a unique client base of mainly SMEs, including its niche business of loans to farmers in rural areas. The Sekerbank Voluntary Pension Fund and the Kazakhstan state’s own fund, Samruk Kazyna,each hold 33.98% stakes in Sekerbank.

Turkish Banks November 2010
54
This page is left blank intentionally
Turkish Banks November 2010
55
Turk Ekonomi Bankasi In the run up to merger
The merger between TEB and Fortis should be completed in early 2011. Management will then release a statement on the future of the merged bank. We will revisit our estimates once the financials of the new company are made public. On a stand-alone basis, TEB shares are trading at 1.20x 2011F P/BV and 9.0x 2011F PER .We see upside in the stock as we expect the value enhancement to outweigh dilution risk.
Regulatory approvals are in place, the legal process should be over by 1Q11. The merger is going ahead as planned. TEB management expects the legal process concerning the majority share transfer to be completed in early 2011. Between now and then, a swap ratio between TEB and Fortis shares should be announced. Çolakoglu, BNP’s partner in TEB with a 42% shareholding, is expected to continue the partnership in the merged bank. The merger will be under the TEB brand. Cost savings should come from branch closings and the elimination of Fortis’ HQ in Istanbul. TEB management is guiding that branch reductions may amount to 150. On our preliminary assumptions, the merger should be earnings and value accretive to existing TEB shareholders by 2013.
Stand-alone valuation and recommendation. TEB is set to earn an average 20% ROE in our forecast period, 2011-13. On our assumptions, the stock is trading at a +20% discount to the peer group average on price to book. Our new target price follows the changes we have made to our revenue model, including rolling over the forecast period one year. We reiterate our BUY recommendation with a target price of TL3.34, offering 36% total upside to current share price.
Valuation methodology and risks. We use the residual earnings methodology to value the equity. The residual earnings, the RE, is the return on common equity, expressed as a TL excess return rather than a ratio. For every earnings period t, we re-state residual earnings as RE = (ROE - ke)*BVPS. The RE method can be re-stated as a dividend discount model. The merger execution risk is the most important risk source. We expect the process to last two years. The benefits may take longer to appear in financial statements. Moreover, the merged bank will have a smaller free float equity market capitalisation: the float (TEB) could decline from 15% currently to as low as 7% once the share transfer is completed and Fortis is de-listed.
Forecasts and ratios
Year end Dec (TLm) 2008 2009 2010F 2011F 2012F
Revenues 925 1,090 1,323 1,423 1,745Pre-provision profit 224 389 516 464 651Net profit 164 210 316 301 485Normalised EPS (TL) 0.15 0.19 0.29 0.27 0.44Dividend per share (TL) 0.00 0.00 0.00 0.00 0.00Normalised PER (x) 16.5 12.9 8.6 9.0 5.6Dividend yield (%) 0.0 0.0 0.0 0.0 0.0Price/book (x) 1.9 1.6 1.4 1.2 1.0Price/tangible book (x) 1.9 1.6 1.4 1.2 1.0Normalised ROE (%) 14.1 13.7 17.7 14.7 20.4
Source: Company data, ING estimates
Haluk Akdogan London +44 20 7767 6650 [email protected]
Derya Guzel Istanbul +44 20 7767 5379 [email protected]
Buy (maintained)
Price (28/10/10)
TL2.46
Target price (12-mth)
TL3.34 (previously TL2.24)
Forecast total return 35.8%
Banks Turkey Bloomberg: TEBNK TI Reuters: TEBNK.IS
Share data Avg daily volume (3-mth) 9,503,048Free float (%) 15.6Market cap (TLm) 2,706.0Dividend yield (1F, %) 0.0
Source: Company data, ING estimates
Share price performance
1.82.02.22.42.62.83.03.23.4
10/09 1/10 4/10 7/10PriceIstanbul Stock Exch (rebased)
Source: ING
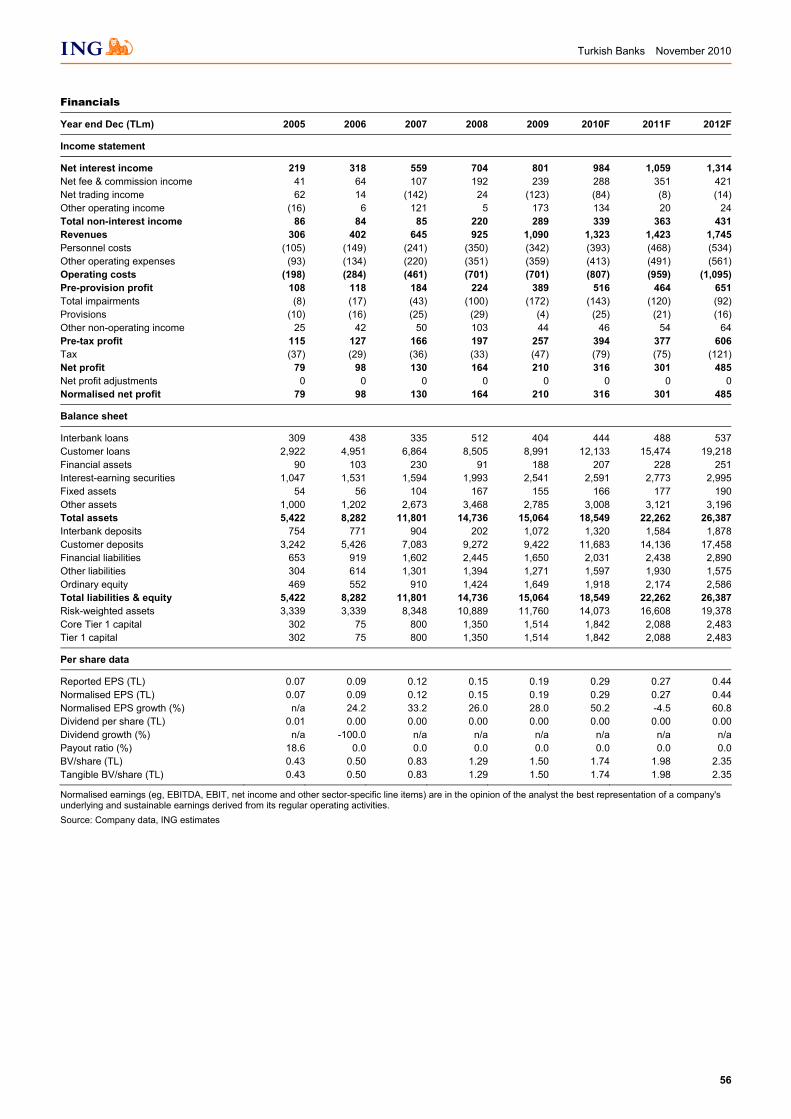
Turkish Banks November 2010
56
Financials
Year end Dec (TLm) 2005 2006 2007 2008 2009 2010F 2011F 2012F
Income statement
Net interest income 219 318 559 704 801 984 1,059 1,314Net fee & commission income 41 64 107 192 239 288 351 421Net trading income 62 14 (142) 24 (123) (84) (8) (14)Other operating income (16) 6 121 5 173 134 20 24Total non-interest income 86 84 85 220 289 339 363 431Revenues 306 402 645 925 1,090 1,323 1,423 1,745Personnel costs (105) (149) (241) (350) (342) (393) (468) (534)Other operating expenses (93) (134) (220) (351) (359) (413) (491) (561)Operating costs (198) (284) (461) (701) (701) (807) (959) (1,095)Pre-provision profit 108 118 184 224 389 516 464 651Total impairments (8) (17) (43) (100) (172) (143) (120) (92)Provisions (10) (16) (25) (29) (4) (25) (21) (16)Other non-operating income 25 42 50 103 44 46 54 64Pre-tax profit 115 127 166 197 257 394 377 606Tax (37) (29) (36) (33) (47) (79) (75) (121)Net profit 79 98 130 164 210 316 301 485Net profit adjustments 0 0 0 0 0 0 0 0Normalised net profit 79 98 130 164 210 316 301 485
Balance sheet
Interbank loans 309 438 335 512 404 444 488 537Customer loans 2,922 4,951 6,864 8,505 8,991 12,133 15,474 19,218Financial assets 90 103 230 91 188 207 228 251Interest-earning securities 1,047 1,531 1,594 1,993 2,541 2,591 2,773 2,995Fixed assets 54 56 104 167 155 166 177 190Other assets 1,000 1,202 2,673 3,468 2,785 3,008 3,121 3,196Total assets 5,422 8,282 11,801 14,736 15,064 18,549 22,262 26,387Interbank deposits 754 771 904 202 1,072 1,320 1,584 1,878Customer deposits 3,242 5,426 7,083 9,272 9,422 11,683 14,136 17,458Financial liabilities 653 919 1,602 2,445 1,650 2,031 2,438 2,890Other liabilities 304 614 1,301 1,394 1,271 1,597 1,930 1,575Ordinary equity 469 552 910 1,424 1,649 1,918 2,174 2,586Total liabilities & equity 5,422 8,282 11,801 14,736 15,064 18,549 22,262 26,387Risk-weighted assets 3,339 3,339 8,348 10,889 11,760 14,073 16,608 19,378Core Tier 1 capital 302 75 800 1,350 1,514 1,842 2,088 2,483Tier 1 capital 302 75 800 1,350 1,514 1,842 2,088 2,483
Per share data
Reported EPS (TL) 0.07 0.09 0.12 0.15 0.19 0.29 0.27 0.44Normalised EPS (TL) 0.07 0.09 0.12 0.15 0.19 0.29 0.27 0.44Normalised EPS growth (%) n/a 24.2 33.2 26.0 28.0 50.2 -4.5 60.8Dividend per share (TL) 0.01 0.00 0.00 0.00 0.00 0.00 0.00 0.00Dividend growth (%) n/a -100.0 n/a n/a n/a n/a n/a n/aPayout ratio (%) 18.6 0.0 0.0 0.0 0.0 0.0 0.0 0.0BV/share (TL) 0.43 0.50 0.83 1.29 1.50 1.74 1.98 2.35Tangible BV/share (TL) 0.43 0.50 0.83 1.29 1.50 1.74 1.98 2.35
Normalised earnings (eg, EBITDA, EBIT, net income and other sector-specific line items) are in the opinion of the analyst the best representation of a company's underlying and sustainable earnings derived from its regular operating activities. Source: Company data, ING estimates
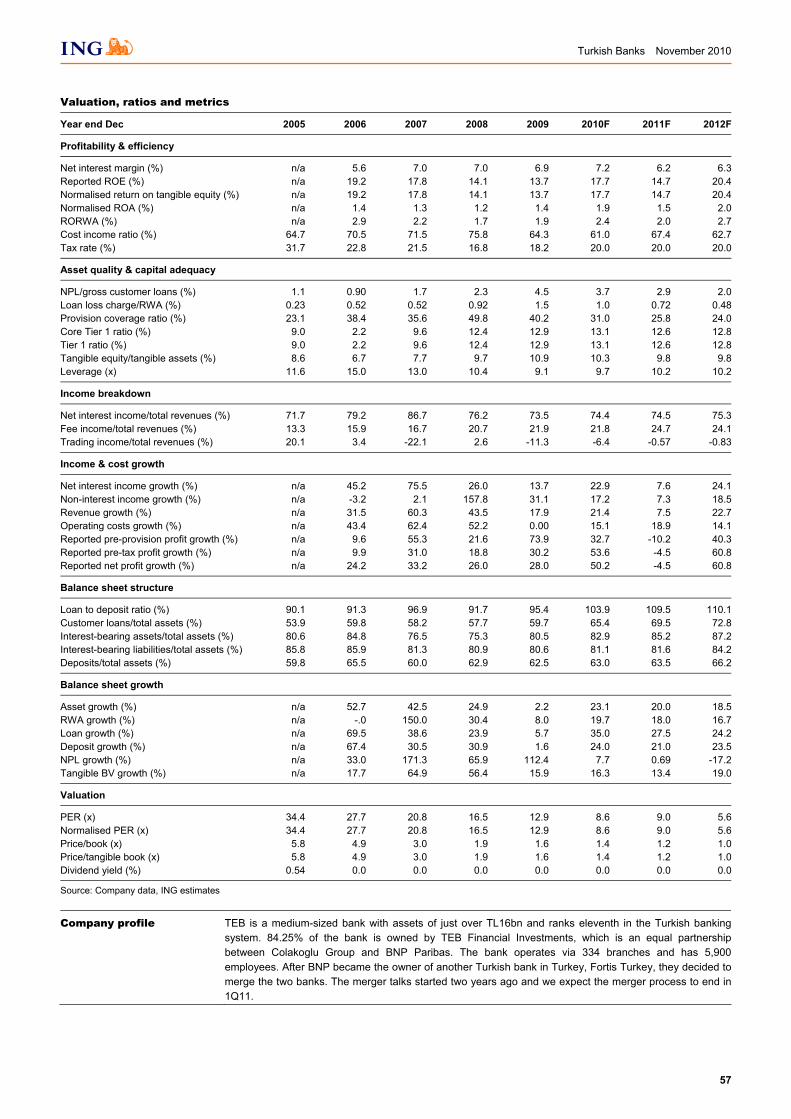
Turkish Banks November 2010
57
Valuation, ratios and metrics
Year end Dec 2005 2006 2007 2008 2009 2010F 2011F 2012F
Profitability & efficiency
Net interest margin (%) n/a 5.6 7.0 7.0 6.9 7.2 6.2 6.3Reported ROE (%) n/a 19.2 17.8 14.1 13.7 17.7 14.7 20.4Normalised return on tangible equity (%) n/a 19.2 17.8 14.1 13.7 17.7 14.7 20.4Normalised ROA (%) n/a 1.4 1.3 1.2 1.4 1.9 1.5 2.0RORWA (%) n/a 2.9 2.2 1.7 1.9 2.4 2.0 2.7Cost income ratio (%) 64.7 70.5 71.5 75.8 64.3 61.0 67.4 62.7Tax rate (%) 31.7 22.8 21.5 16.8 18.2 20.0 20.0 20.0
Asset quality & capital adequacy
NPL/gross customer loans (%) 1.1 0.90 1.7 2.3 4.5 3.7 2.9 2.0Loan loss charge/RWA (%) 0.23 0.52 0.52 0.92 1.5 1.0 0.72 0.48Provision coverage ratio (%) 23.1 38.4 35.6 49.8 40.2 31.0 25.8 24.0Core Tier 1 ratio (%) 9.0 2.2 9.6 12.4 12.9 13.1 12.6 12.8Tier 1 ratio (%) 9.0 2.2 9.6 12.4 12.9 13.1 12.6 12.8Tangible equity/tangible assets (%) 8.6 6.7 7.7 9.7 10.9 10.3 9.8 9.8Leverage (x) 11.6 15.0 13.0 10.4 9.1 9.7 10.2 10.2
Income breakdown
Net interest income/total revenues (%) 71.7 79.2 86.7 76.2 73.5 74.4 74.5 75.3Fee income/total revenues (%) 13.3 15.9 16.7 20.7 21.9 21.8 24.7 24.1Trading income/total revenues (%) 20.1 3.4 -22.1 2.6 -11.3 -6.4 -0.57 -0.83
Income & cost growth
Net interest income growth (%) n/a 45.2 75.5 26.0 13.7 22.9 7.6 24.1Non-interest income growth (%) n/a -3.2 2.1 157.8 31.1 17.2 7.3 18.5Revenue growth (%) n/a 31.5 60.3 43.5 17.9 21.4 7.5 22.7Operating costs growth (%) n/a 43.4 62.4 52.2 0.00 15.1 18.9 14.1Reported pre-provision profit growth (%) n/a 9.6 55.3 21.6 73.9 32.7 -10.2 40.3Reported pre-tax profit growth (%) n/a 9.9 31.0 18.8 30.2 53.6 -4.5 60.8Reported net profit growth (%) n/a 24.2 33.2 26.0 28.0 50.2 -4.5 60.8
Balance sheet structure
Loan to deposit ratio (%) 90.1 91.3 96.9 91.7 95.4 103.9 109.5 110.1Customer loans/total assets (%) 53.9 59.8 58.2 57.7 59.7 65.4 69.5 72.8Interest-bearing assets/total assets (%) 80.6 84.8 76.5 75.3 80.5 82.9 85.2 87.2Interest-bearing liabilities/total assets (%) 85.8 85.9 81.3 80.9 80.6 81.1 81.6 84.2Deposits/total assets (%) 59.8 65.5 60.0 62.9 62.5 63.0 63.5 66.2
Balance sheet growth
Asset growth (%) n/a 52.7 42.5 24.9 2.2 23.1 20.0 18.5RWA growth (%) n/a -.0 150.0 30.4 8.0 19.7 18.0 16.7Loan growth (%) n/a 69.5 38.6 23.9 5.7 35.0 27.5 24.2Deposit growth (%) n/a 67.4 30.5 30.9 1.6 24.0 21.0 23.5NPL growth (%) n/a 33.0 171.3 65.9 112.4 7.7 0.69 -17.2Tangible BV growth (%) n/a 17.7 64.9 56.4 15.9 16.3 13.4 19.0
Valuation
PER (x) 34.4 27.7 20.8 16.5 12.9 8.6 9.0 5.6Normalised PER (x) 34.4 27.7 20.8 16.5 12.9 8.6 9.0 5.6Price/book (x) 5.8 4.9 3.0 1.9 1.6 1.4 1.2 1.0Price/tangible book (x) 5.8 4.9 3.0 1.9 1.6 1.4 1.2 1.0Dividend yield (%) 0.54 0.0 0.0 0.0 0.0 0.0 0.0 0.0
Source: Company data, ING estimates
Company profile TEB is a medium-sized bank with assets of just over TL16bn and ranks eleventh in the Turkish bankingsystem. 84.25% of the bank is owned by TEB Financial Investments, which is an equal partnershipbetween Colakoglu Group and BNP Paribas. The bank operates via 334 branches and has 5,900employees. After BNP became the owner of another Turkish bank in Turkey, Fortis Turkey, they decided to merge the two banks. The merger talks started two years ago and we expect the merger process to end in1Q11.

Turkish Banks November 2010
58
This page is left blank intentionally
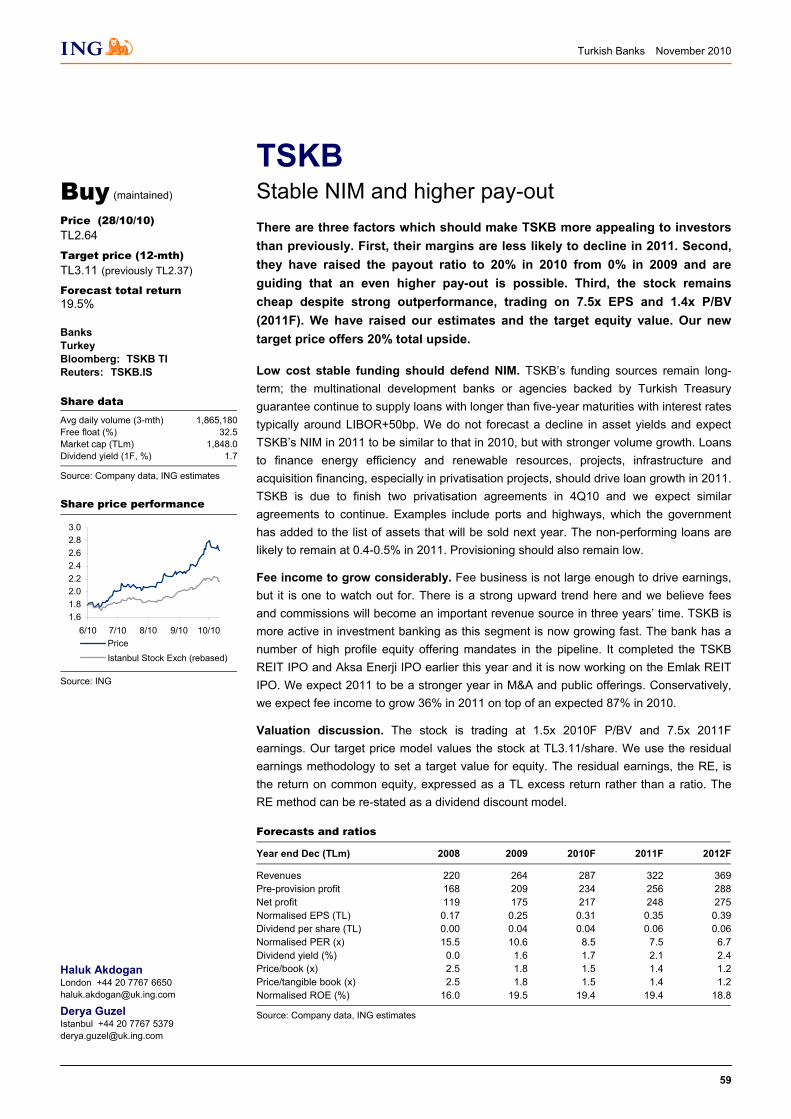
Turkish Banks November 2010
59
TSKB Stable NIM and higher pay-out
There are three factors which should make TSKB more appealing to investors than previously. First, their margins are less likely to decline in 2011. Second, they have raised the payout ratio to 20% in 2010 from 0% in 2009 and are guiding that an even higher pay-out is possible. Third, the stock remains cheap despite strong outperformance, trading on 7.5x EPS and 1.4x P/BV (2011F). We have raised our estimates and the target equity value. Our new target price offers 20% total upside.
Low cost stable funding should defend NIM. TSKB’s funding sources remain long-term; the multinational development banks or agencies backed by Turkish Treasury guarantee continue to supply loans with longer than five-year maturities with interest rates typically around LIBOR+50bp. We do not forecast a decline in asset yields and expect TSKB’s NIM in 2011 to be similar to that in 2010, but with stronger volume growth. Loans to finance energy efficiency and renewable resources, projects, infrastructure and acquisition financing, especially in privatisation projects, should drive loan growth in 2011. TSKB is due to finish two privatisation agreements in 4Q10 and we expect similar agreements to continue. Examples include ports and highways, which the government has added to the list of assets that will be sold next year. The non-performing loans are likely to remain at 0.4-0.5% in 2011. Provisioning should also remain low.
Fee income to grow considerably. Fee business is not large enough to drive earnings, but it is one to watch out for. There is a strong upward trend here and we believe fees and commissions will become an important revenue source in three years’ time. TSKB is more active in investment banking as this segment is now growing fast. The bank has a number of high profile equity offering mandates in the pipeline. It completed the TSKB REIT IPO and Aksa Enerji IPO earlier this year and it is now working on the Emlak REIT IPO. We expect 2011 to be a stronger year in M&A and public offerings. Conservatively, we expect fee income to grow 36% in 2011 on top of an expected 87% in 2010.
Valuation discussion. The stock is trading at 1.5x 2010F P/BV and 7.5x 2011F earnings. Our target price model values the stock at TL3.11/share. We use the residual earnings methodology to set a target value for equity. The residual earnings, the RE, is the return on common equity, expressed as a TL excess return rather than a ratio. The RE method can be re-stated as a dividend discount model.
Forecasts and ratios
Year end Dec (TLm) 2008 2009 2010F 2011F 2012F
Revenues 220 264 287 322 369Pre-provision profit 168 209 234 256 288Net profit 119 175 217 248 275Normalised EPS (TL) 0.17 0.25 0.31 0.35 0.39Dividend per share (TL) 0.00 0.04 0.04 0.06 0.06Normalised PER (x) 15.5 10.6 8.5 7.5 6.7Dividend yield (%) 0.0 1.6 1.7 2.1 2.4Price/book (x) 2.5 1.8 1.5 1.4 1.2Price/tangible book (x) 2.5 1.8 1.5 1.4 1.2Normalised ROE (%) 16.0 19.5 19.4 19.4 18.8
Source: Company data, ING estimates
Haluk Akdogan London +44 20 7767 6650 [email protected]
Derya Guzel Istanbul +44 20 7767 5379 [email protected]
Buy (maintained)
Price (28/10/10)
TL2.64
Target price (12-mth)
TL3.11 (previously TL2.37)
Forecast total return 19.5%
Banks Turkey Bloomberg: TSKB TI Reuters: TSKB.IS
Share data Avg daily volume (3-mth) 1,865,180Free float (%) 32.5Market cap (TLm) 1,848.0Dividend yield (1F, %) 1.7
Source: Company data, ING estimates
Share price performance
1.61.82.02.22.42.62.83.0
6/10 7/10 8/10 9/10 10/10PriceIstanbul Stock Exch (rebased)
Source: ING
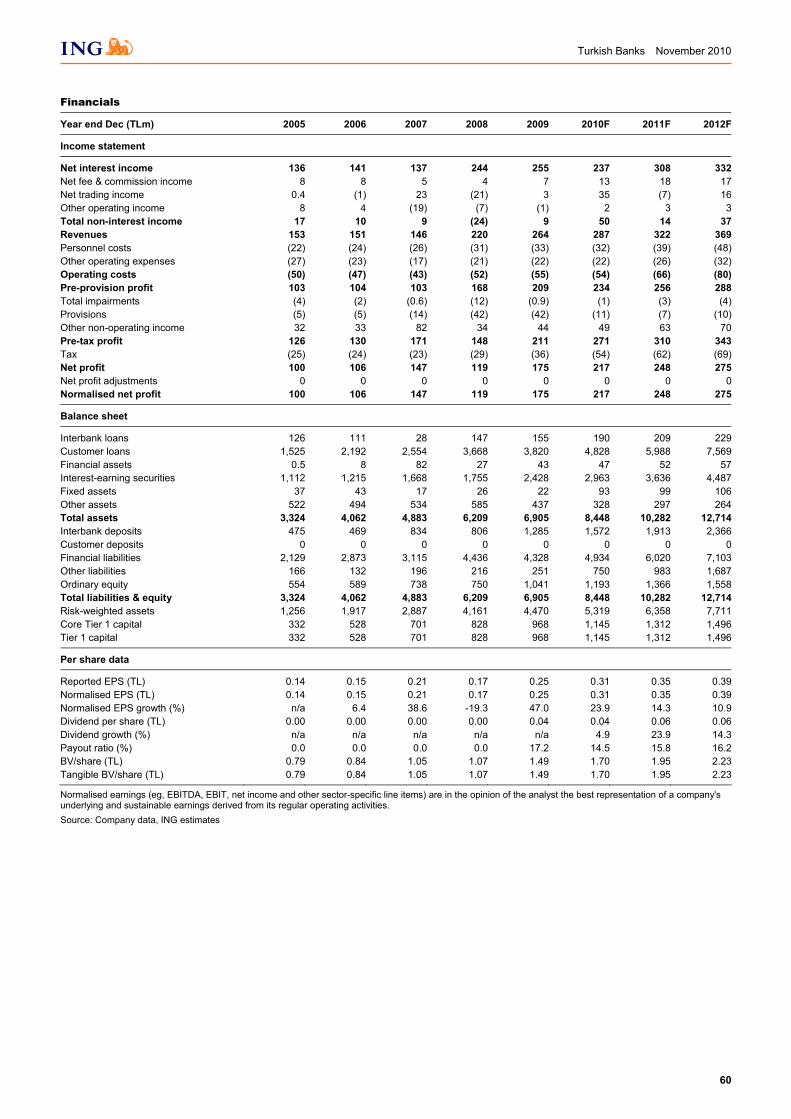
Turkish Banks November 2010
60
Financials
Year end Dec (TLm) 2005 2006 2007 2008 2009 2010F 2011F 2012F
Income statement
Net interest income 136 141 137 244 255 237 308 332Net fee & commission income 8 8 5 4 7 13 18 17Net trading income 0.4 (1) 23 (21) 3 35 (7) 16Other operating income 8 4 (19) (7) (1) 2 3 3Total non-interest income 17 10 9 (24) 9 50 14 37Revenues 153 151 146 220 264 287 322 369Personnel costs (22) (24) (26) (31) (33) (32) (39) (48)Other operating expenses (27) (23) (17) (21) (22) (22) (26) (32)Operating costs (50) (47) (43) (52) (55) (54) (66) (80)Pre-provision profit 103 104 103 168 209 234 256 288Total impairments (4) (2) (0.6) (12) (0.9) (1) (3) (4)Provisions (5) (5) (14) (42) (42) (11) (7) (10)Other non-operating income 32 33 82 34 44 49 63 70Pre-tax profit 126 130 171 148 211 271 310 343Tax (25) (24) (23) (29) (36) (54) (62) (69)Net profit 100 106 147 119 175 217 248 275Net profit adjustments 0 0 0 0 0 0 0 0Normalised net profit 100 106 147 119 175 217 248 275
Balance sheet
Interbank loans 126 111 28 147 155 190 209 229Customer loans 1,525 2,192 2,554 3,668 3,820 4,828 5,988 7,569Financial assets 0.5 8 82 27 43 47 52 57Interest-earning securities 1,112 1,215 1,668 1,755 2,428 2,963 3,636 4,487Fixed assets 37 43 17 26 22 93 99 106Other assets 522 494 534 585 437 328 297 264Total assets 3,324 4,062 4,883 6,209 6,905 8,448 10,282 12,714Interbank deposits 475 469 834 806 1,285 1,572 1,913 2,366Customer deposits 0 0 0 0 0 0 0 0Financial liabilities 2,129 2,873 3,115 4,436 4,328 4,934 6,020 7,103Other liabilities 166 132 196 216 251 750 983 1,687Ordinary equity 554 589 738 750 1,041 1,193 1,366 1,558Total liabilities & equity 3,324 4,062 4,883 6,209 6,905 8,448 10,282 12,714Risk-weighted assets 1,256 1,917 2,887 4,161 4,470 5,319 6,358 7,711Core Tier 1 capital 332 528 701 828 968 1,145 1,312 1,496Tier 1 capital 332 528 701 828 968 1,145 1,312 1,496
Per share data
Reported EPS (TL) 0.14 0.15 0.21 0.17 0.25 0.31 0.35 0.39Normalised EPS (TL) 0.14 0.15 0.21 0.17 0.25 0.31 0.35 0.39Normalised EPS growth (%) n/a 6.4 38.6 -19.3 47.0 23.9 14.3 10.9Dividend per share (TL) 0.00 0.00 0.00 0.00 0.04 0.04 0.06 0.06Dividend growth (%) n/a n/a n/a n/a n/a 4.9 23.9 14.3Payout ratio (%) 0.0 0.0 0.0 0.0 17.2 14.5 15.8 16.2BV/share (TL) 0.79 0.84 1.05 1.07 1.49 1.70 1.95 2.23Tangible BV/share (TL) 0.79 0.84 1.05 1.07 1.49 1.70 1.95 2.23
Normalised earnings (eg, EBITDA, EBIT, net income and other sector-specific line items) are in the opinion of the analyst the best representation of a company's underlying and sustainable earnings derived from its regular operating activities. Source: Company data, ING estimates
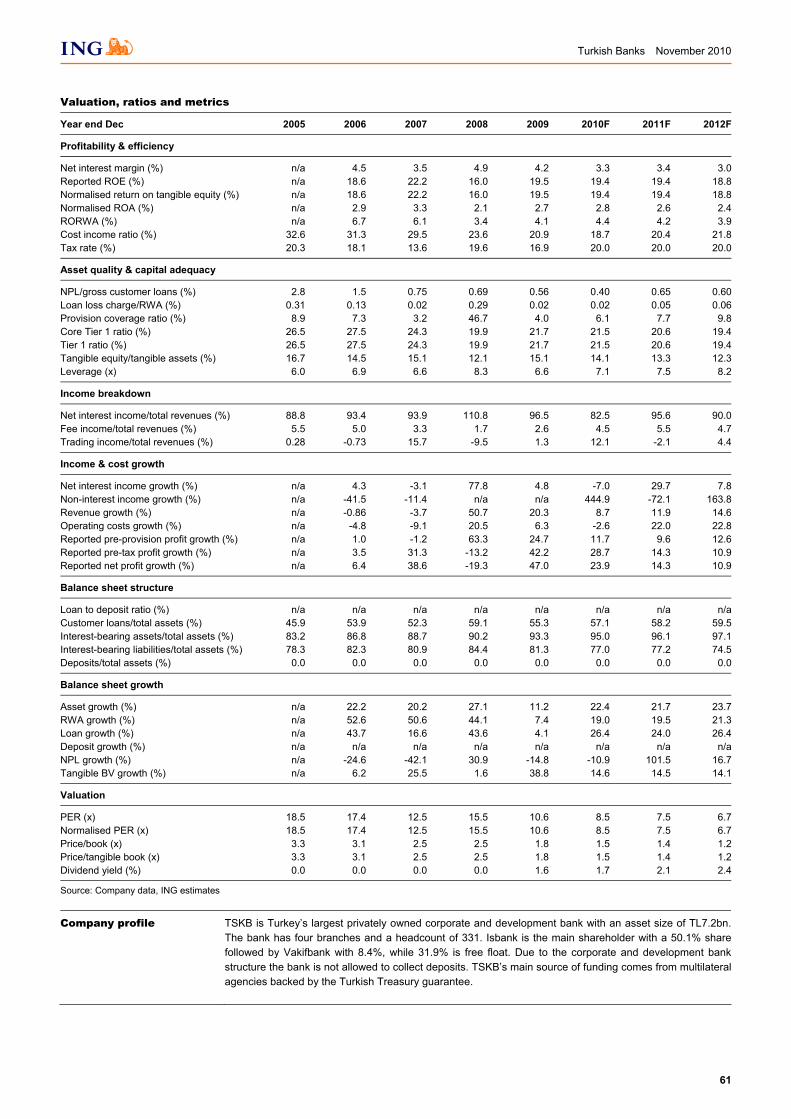
Turkish Banks November 2010
61
Valuation, ratios and metrics
Year end Dec 2005 2006 2007 2008 2009 2010F 2011F 2012F
Profitability & efficiency
Net interest margin (%) n/a 4.5 3.5 4.9 4.2 3.3 3.4 3.0Reported ROE (%) n/a 18.6 22.2 16.0 19.5 19.4 19.4 18.8Normalised return on tangible equity (%) n/a 18.6 22.2 16.0 19.5 19.4 19.4 18.8Normalised ROA (%) n/a 2.9 3.3 2.1 2.7 2.8 2.6 2.4RORWA (%) n/a 6.7 6.1 3.4 4.1 4.4 4.2 3.9Cost income ratio (%) 32.6 31.3 29.5 23.6 20.9 18.7 20.4 21.8Tax rate (%) 20.3 18.1 13.6 19.6 16.9 20.0 20.0 20.0
Asset quality & capital adequacy
NPL/gross customer loans (%) 2.8 1.5 0.75 0.69 0.56 0.40 0.65 0.60Loan loss charge/RWA (%) 0.31 0.13 0.02 0.29 0.02 0.02 0.05 0.06Provision coverage ratio (%) 8.9 7.3 3.2 46.7 4.0 6.1 7.7 9.8Core Tier 1 ratio (%) 26.5 27.5 24.3 19.9 21.7 21.5 20.6 19.4Tier 1 ratio (%) 26.5 27.5 24.3 19.9 21.7 21.5 20.6 19.4Tangible equity/tangible assets (%) 16.7 14.5 15.1 12.1 15.1 14.1 13.3 12.3Leverage (x) 6.0 6.9 6.6 8.3 6.6 7.1 7.5 8.2
Income breakdown
Net interest income/total revenues (%) 88.8 93.4 93.9 110.8 96.5 82.5 95.6 90.0Fee income/total revenues (%) 5.5 5.0 3.3 1.7 2.6 4.5 5.5 4.7Trading income/total revenues (%) 0.28 -0.73 15.7 -9.5 1.3 12.1 -2.1 4.4
Income & cost growth
Net interest income growth (%) n/a 4.3 -3.1 77.8 4.8 -7.0 29.7 7.8Non-interest income growth (%) n/a -41.5 -11.4 n/a n/a 444.9 -72.1 163.8Revenue growth (%) n/a -0.86 -3.7 50.7 20.3 8.7 11.9 14.6Operating costs growth (%) n/a -4.8 -9.1 20.5 6.3 -2.6 22.0 22.8Reported pre-provision profit growth (%) n/a 1.0 -1.2 63.3 24.7 11.7 9.6 12.6Reported pre-tax profit growth (%) n/a 3.5 31.3 -13.2 42.2 28.7 14.3 10.9Reported net profit growth (%) n/a 6.4 38.6 -19.3 47.0 23.9 14.3 10.9
Balance sheet structure
Loan to deposit ratio (%) n/a n/a n/a n/a n/a n/a n/a n/aCustomer loans/total assets (%) 45.9 53.9 52.3 59.1 55.3 57.1 58.2 59.5Interest-bearing assets/total assets (%) 83.2 86.8 88.7 90.2 93.3 95.0 96.1 97.1Interest-bearing liabilities/total assets (%) 78.3 82.3 80.9 84.4 81.3 77.0 77.2 74.5Deposits/total assets (%) 0.0 0.0 0.0 0.0 0.0 0.0 0.0 0.0
Balance sheet growth
Asset growth (%) n/a 22.2 20.2 27.1 11.2 22.4 21.7 23.7RWA growth (%) n/a 52.6 50.6 44.1 7.4 19.0 19.5 21.3Loan growth (%) n/a 43.7 16.6 43.6 4.1 26.4 24.0 26.4Deposit growth (%) n/a n/a n/a n/a n/a n/a n/a n/aNPL growth (%) n/a -24.6 -42.1 30.9 -14.8 -10.9 101.5 16.7Tangible BV growth (%) n/a 6.2 25.5 1.6 38.8 14.6 14.5 14.1
Valuation
PER (x) 18.5 17.4 12.5 15.5 10.6 8.5 7.5 6.7Normalised PER (x) 18.5 17.4 12.5 15.5 10.6 8.5 7.5 6.7Price/book (x) 3.3 3.1 2.5 2.5 1.8 1.5 1.4 1.2Price/tangible book (x) 3.3 3.1 2.5 2.5 1.8 1.5 1.4 1.2Dividend yield (%) 0.0 0.0 0.0 0.0 1.6 1.7 2.1 2.4
Source: Company data, ING estimates
Company profile TSKB is Turkey’s largest privately owned corporate and development bank with an asset size of TL7.2bn. The bank has four branches and a headcount of 331. Isbank is the main shareholder with a 50.1% sharefollowed by Vakifbank with 8.4%, while 31.9% is free float. Due to the corporate and development bankstructure the bank is not allowed to collect deposits. TSKB’s main source of funding comes from multilateralagencies backed by the Turkish Treasury guarantee.

Turkish Banks November 2010
62
This page is left blank intentionally
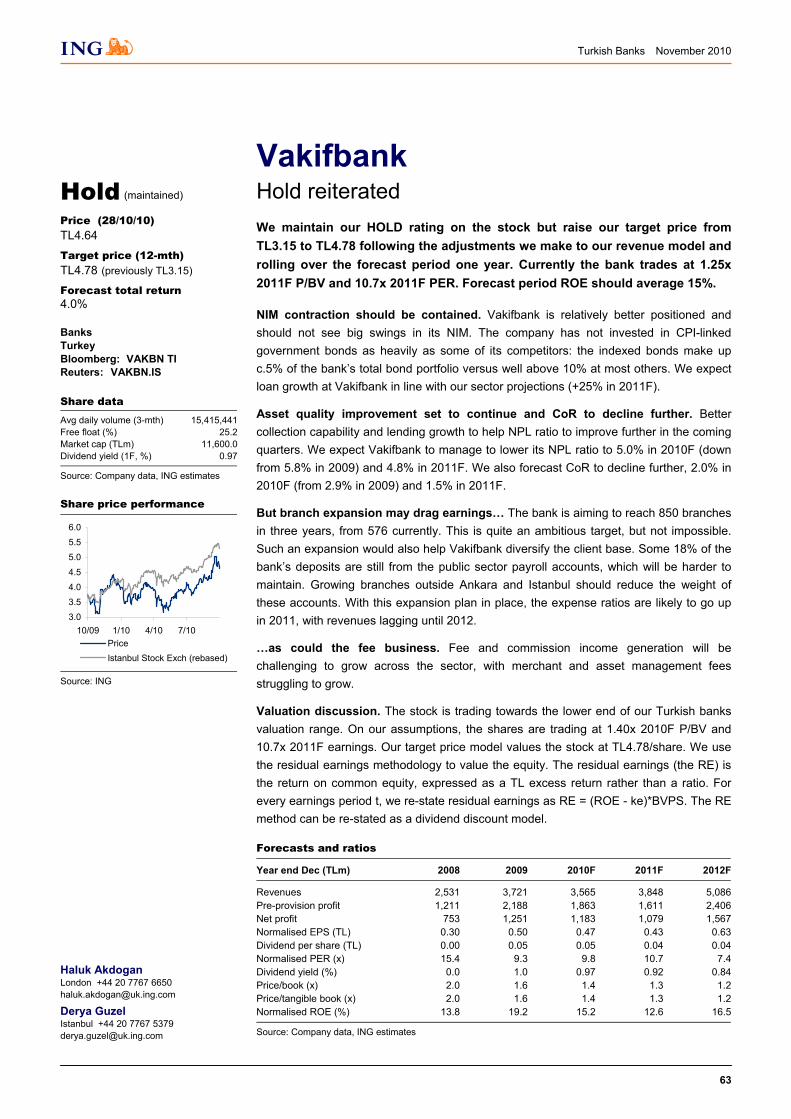
Turkish Banks November 2010
63
Vakifbank Hold reiterated
We maintain our HOLD rating on the stock but raise our target price from TL3.15 to TL4.78 following the adjustments we make to our revenue model and rolling over the forecast period one year. Currently the bank trades at 1.25x 2011F P/BV and 10.7x 2011F PER. Forecast period ROE should average 15%.
NIM contraction should be contained. Vakifbank is relatively better positioned and should not see big swings in its NIM. The company has not invested in CPI-linked government bonds as heavily as some of its competitors: the indexed bonds make up c.5% of the bank’s total bond portfolio versus well above 10% at most others. We expect loan growth at Vakifbank in line with our sector projections (+25% in 2011F).
Asset quality improvement set to continue and CoR to decline further. Better collection capability and lending growth to help NPL ratio to improve further in the coming quarters. We expect Vakifbank to manage to lower its NPL ratio to 5.0% in 2010F (down from 5.8% in 2009) and 4.8% in 2011F. We also forecast CoR to decline further, 2.0% in 2010F (from 2.9% in 2009) and 1.5% in 2011F.
But branch expansion may drag earnings… The bank is aiming to reach 850 branches in three years, from 576 currently. This is quite an ambitious target, but not impossible. Such an expansion would also help Vakifbank diversify the client base. Some 18% of the bank’s deposits are still from the public sector payroll accounts, which will be harder to maintain. Growing branches outside Ankara and Istanbul should reduce the weight of these accounts. With this expansion plan in place, the expense ratios are likely to go up in 2011, with revenues lagging until 2012.
…as could the fee business. Fee and commission income generation will be challenging to grow across the sector, with merchant and asset management fees struggling to grow.
Valuation discussion. The stock is trading towards the lower end of our Turkish banks valuation range. On our assumptions, the shares are trading at 1.40x 2010F P/BV and 10.7x 2011F earnings. Our target price model values the stock at TL4.78/share. We use the residual earnings methodology to value the equity. The residual earnings (the RE) is the return on common equity, expressed as a TL excess return rather than a ratio. For every earnings period t, we re-state residual earnings as RE = (ROE - ke)*BVPS. The RE method can be re-stated as a dividend discount model.
Forecasts and ratios
Year end Dec (TLm) 2008 2009 2010F 2011F 2012F
Revenues 2,531 3,721 3,565 3,848 5,086Pre-provision profit 1,211 2,188 1,863 1,611 2,406Net profit 753 1,251 1,183 1,079 1,567Normalised EPS (TL) 0.30 0.50 0.47 0.43 0.63Dividend per share (TL) 0.00 0.05 0.05 0.04 0.04Normalised PER (x) 15.4 9.3 9.8 10.7 7.4Dividend yield (%) 0.0 1.0 0.97 0.92 0.84Price/book (x) 2.0 1.6 1.4 1.3 1.2Price/tangible book (x) 2.0 1.6 1.4 1.3 1.2Normalised ROE (%) 13.8 19.2 15.2 12.6 16.5
Source: Company data, ING estimates
Haluk Akdogan London +44 20 7767 6650 [email protected]
Derya Guzel Istanbul +44 20 7767 5379 [email protected]
Hold (maintained)
Price (28/10/10)
TL4.64
Target price (12-mth)
TL4.78 (previously TL3.15)
Forecast total return 4.0%
Banks Turkey Bloomberg: VAKBN TI Reuters: VAKBN.IS
Share data Avg daily volume (3-mth) 15,415,441Free float (%) 25.2Market cap (TLm) 11,600.0Dividend yield (1F, %) 0.97
Source: Company data, ING estimates
Share price performance
3.03.54.04.5
5.05.56.0
10/09 1/10 4/10 7/10PriceIstanbul Stock Exch (rebased)
Source: ING
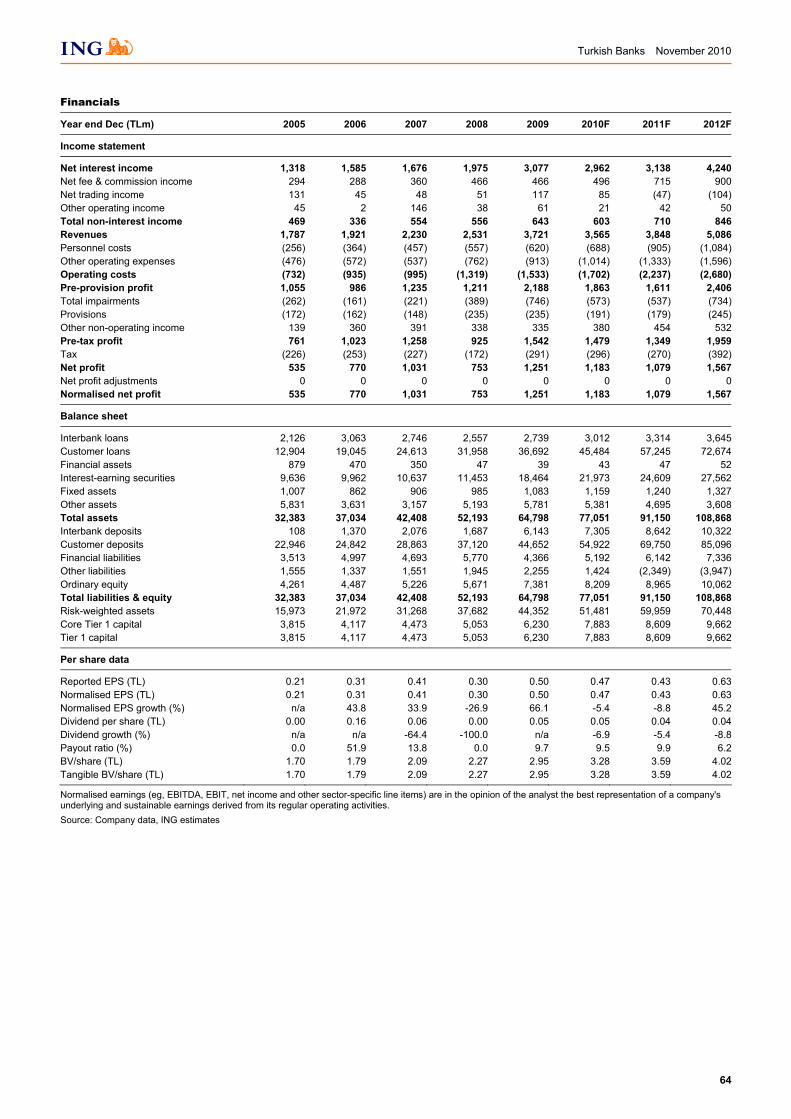
Turkish Banks November 2010
64
Financials
Year end Dec (TLm) 2005 2006 2007 2008 2009 2010F 2011F 2012F
Income statement
Net interest income 1,318 1,585 1,676 1,975 3,077 2,962 3,138 4,240Net fee & commission income 294 288 360 466 466 496 715 900Net trading income 131 45 48 51 117 85 (47) (104)Other operating income 45 2 146 38 61 21 42 50Total non-interest income 469 336 554 556 643 603 710 846Revenues 1,787 1,921 2,230 2,531 3,721 3,565 3,848 5,086Personnel costs (256) (364) (457) (557) (620) (688) (905) (1,084)Other operating expenses (476) (572) (537) (762) (913) (1,014) (1,333) (1,596)Operating costs (732) (935) (995) (1,319) (1,533) (1,702) (2,237) (2,680)Pre-provision profit 1,055 986 1,235 1,211 2,188 1,863 1,611 2,406Total impairments (262) (161) (221) (389) (746) (573) (537) (734)Provisions (172) (162) (148) (235) (235) (191) (179) (245)Other non-operating income 139 360 391 338 335 380 454 532Pre-tax profit 761 1,023 1,258 925 1,542 1,479 1,349 1,959Tax (226) (253) (227) (172) (291) (296) (270) (392)Net profit 535 770 1,031 753 1,251 1,183 1,079 1,567Net profit adjustments 0 0 0 0 0 0 0 0Normalised net profit 535 770 1,031 753 1,251 1,183 1,079 1,567
Balance sheet
Interbank loans 2,126 3,063 2,746 2,557 2,739 3,012 3,314 3,645Customer loans 12,904 19,045 24,613 31,958 36,692 45,484 57,245 72,674Financial assets 879 470 350 47 39 43 47 52Interest-earning securities 9,636 9,962 10,637 11,453 18,464 21,973 24,609 27,562Fixed assets 1,007 862 906 985 1,083 1,159 1,240 1,327Other assets 5,831 3,631 3,157 5,193 5,781 5,381 4,695 3,608Total assets 32,383 37,034 42,408 52,193 64,798 77,051 91,150 108,868Interbank deposits 108 1,370 2,076 1,687 6,143 7,305 8,642 10,322Customer deposits 22,946 24,842 28,863 37,120 44,652 54,922 69,750 85,096Financial liabilities 3,513 4,997 4,693 5,770 4,366 5,192 6,142 7,336Other liabilities 1,555 1,337 1,551 1,945 2,255 1,424 (2,349) (3,947)Ordinary equity 4,261 4,487 5,226 5,671 7,381 8,209 8,965 10,062Total liabilities & equity 32,383 37,034 42,408 52,193 64,798 77,051 91,150 108,868Risk-weighted assets 15,973 21,972 31,268 37,682 44,352 51,481 59,959 70,448Core Tier 1 capital 3,815 4,117 4,473 5,053 6,230 7,883 8,609 9,662Tier 1 capital 3,815 4,117 4,473 5,053 6,230 7,883 8,609 9,662
Per share data
Reported EPS (TL) 0.21 0.31 0.41 0.30 0.50 0.47 0.43 0.63Normalised EPS (TL) 0.21 0.31 0.41 0.30 0.50 0.47 0.43 0.63Normalised EPS growth (%) n/a 43.8 33.9 -26.9 66.1 -5.4 -8.8 45.2Dividend per share (TL) 0.00 0.16 0.06 0.00 0.05 0.05 0.04 0.04Dividend growth (%) n/a n/a -64.4 -100.0 n/a -6.9 -5.4 -8.8Payout ratio (%) 0.0 51.9 13.8 0.0 9.7 9.5 9.9 6.2BV/share (TL) 1.70 1.79 2.09 2.27 2.95 3.28 3.59 4.02Tangible BV/share (TL) 1.70 1.79 2.09 2.27 2.95 3.28 3.59 4.02
Normalised earnings (eg, EBITDA, EBIT, net income and other sector-specific line items) are in the opinion of the analyst the best representation of a company's underlying and sustainable earnings derived from its regular operating activities. Source: Company data, ING estimates

Turkish Banks November 2010
65
Valuation, ratios and metrics
Year end Dec 2005 2006 2007 2008 2009 2010F 2011F 2012F
Profitability & efficiency
Net interest margin (%) n/a 5.5 4.7 4.7 5.9 4.6 4.0 4.5Reported ROE (%) n/a 17.6 21.2 13.8 19.2 15.2 12.6 16.5Normalised return on tangible equity (%) n/a 17.6 21.2 13.8 19.2 15.2 12.6 16.5Normalised ROA (%) n/a 2.2 2.6 1.6 2.1 1.7 1.3 1.6RORWA (%) n/a 4.1 3.9 2.2 3.1 2.5 1.9 2.4Cost income ratio (%) 40.9 48.7 44.6 52.1 41.2 47.7 58.1 52.7Tax rate (%) 29.7 24.7 18.1 18.6 18.9 20.0 20.0 20.0
Asset quality & capital adequacy
NPL/gross customer loans (%) 7.7 5.3 4.6 4.6 5.8 4.8 4.3 4.3Loan loss charge/RWA (%) 1.6 0.73 0.71 1.0 1.7 1.1 0.90 1.0Provision coverage ratio (%) 26.2 16.1 19.3 26.7 35.2 26.5 21.8 23.5Core Tier 1 ratio (%) 23.9 18.7 14.3 13.4 14.0 15.3 14.4 13.7Tier 1 ratio (%) 23.9 18.7 14.3 13.4 14.0 15.3 14.4 13.7Tangible equity/tangible assets (%) 13.2 12.1 12.3 10.9 11.4 10.7 9.8 9.2Leverage (x) 7.6 8.3 8.1 9.2 8.8 9.4 10.2 10.8
Income breakdown
Net interest income/total revenues (%) 73.7 82.5 75.2 78.0 82.7 83.1 81.5 83.4Fee income/total revenues (%) 16.4 15.0 16.2 18.4 12.5 13.9 18.6 17.7Trading income/total revenues (%) 7.3 2.4 2.1 2.0 3.1 2.4 -1.2 -2.1
Income & cost growth
Net interest income growth (%) n/a 20.3 5.7 17.8 55.8 -3.7 5.9 35.1Non-interest income growth (%) n/a -28.4 64.8 0.38 15.7 -6.3 17.8 19.1Revenue growth (%) n/a 7.5 16.0 13.5 47.0 -4.2 7.9 32.2Operating costs growth (%) n/a 27.8 6.3 32.6 16.2 11.1 31.4 19.8Reported pre-provision profit growth (%) n/a -6.6 25.3 -1.9 80.6 -14.9 -13.5 49.3Reported pre-tax profit growth (%) n/a 34.4 23.0 -26.4 66.7 -4.1 -8.8 45.2Reported net profit growth (%) n/a 43.8 33.9 -26.9 66.1 -5.4 -8.8 45.2
Balance sheet structure
Loan to deposit ratio (%) 56.2 76.7 85.3 86.1 82.2 82.8 82.1 85.4Customer loans/total assets (%) 39.8 51.4 58.0 61.2 56.6 59.0 62.8 66.8Interest-bearing assets/total assets (%) 78.9 87.9 90.4 88.2 89.4 91.5 93.5 95.5Interest-bearing liabilities/total assets (%) 82.0 84.3 84.0 85.4 85.1 87.5 92.7 94.4Deposits/total assets (%) 70.9 67.1 68.1 71.1 68.9 71.3 76.5 78.2
Balance sheet growth
Asset growth (%) n/a 14.4 14.5 23.1 24.1 18.9 18.3 19.4RWA growth (%) n/a 37.6 42.3 20.5 17.7 16.1 16.5 17.5Loan growth (%) n/a 47.6 29.2 29.8 14.8 24.0 25.9 27.0Deposit growth (%) n/a 8.3 16.2 28.6 20.3 23.0 27.0 22.0NPL growth (%) n/a 0.31 14.1 27.4 45.6 2.2 13.8 27.0Tangible BV growth (%) n/a 5.3 16.5 8.5 30.2 11.2 9.2 12.2
Valuation
PER (x) 21.7 15.1 11.3 15.4 9.3 9.8 10.7 7.4Normalised PER (x) 21.7 15.1 11.3 15.4 9.3 9.8 10.7 7.4Price/book (x) 2.7 2.6 2.2 2.0 1.6 1.4 1.3 1.2Price/tangible book (x) 2.7 2.6 2.2 2.0 1.6 1.4 1.3 1.2Dividend yield (%) 0.0 3.4 1.2 0.0 1.0 0.97 0.92 0.84
Source: Company data, ING estimates
Company profile Vakifbank is Turkey’s sixth largest bank with an asset size of TL72bn. The bank is 25.2% owned by Vakifbank Pension Fund and 59% by The General Directorate of Foundations (GDF). The bank has 576 branches and a headcount of 10,400. As of June 2010 the bank has 8.7% market share in loans and 8.8% market share in deposits.

Turkish Banks November 2010
66
This page is left blank intentionally
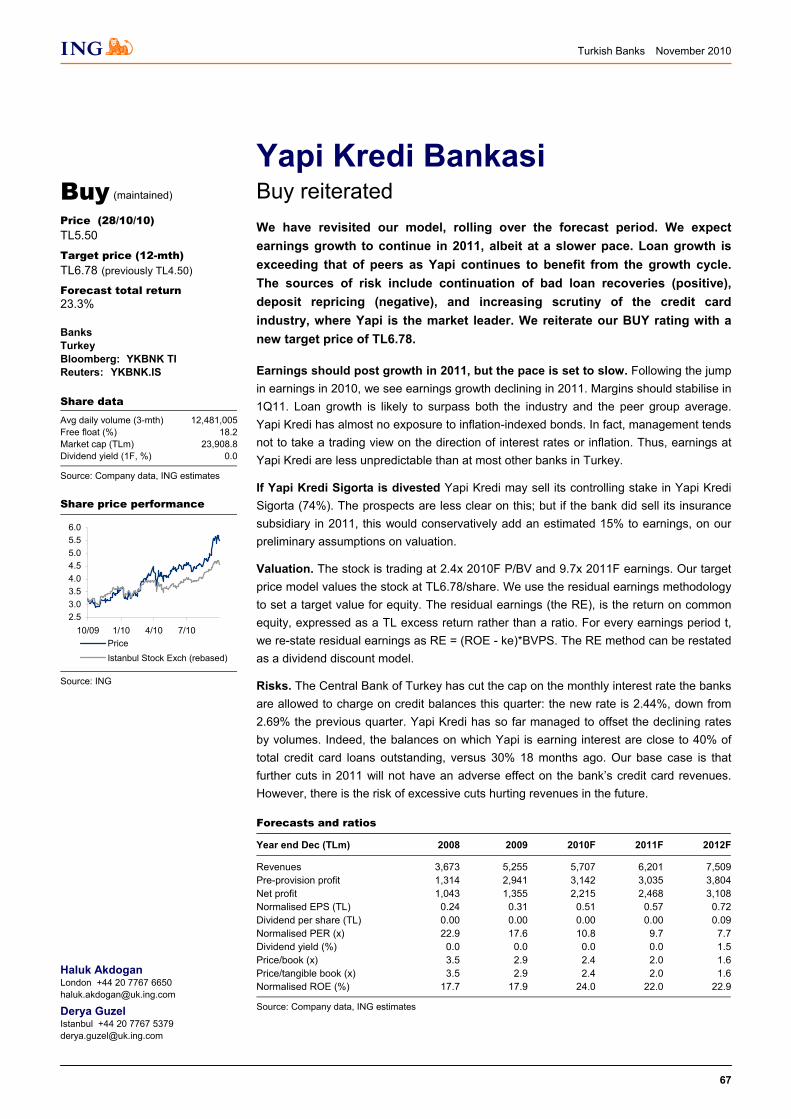
Turkish Banks November 2010
67
Yapi Kredi Bankasi Buy reiterated
We have revisited our model, rolling over the forecast period. We expect earnings growth to continue in 2011, albeit at a slower pace. Loan growth is exceeding that of peers as Yapi continues to benefit from the growth cycle. The sources of risk include continuation of bad loan recoveries (positive), deposit repricing (negative), and increasing scrutiny of the credit card industry, where Yapi is the market leader. We reiterate our BUY rating with a new target price of TL6.78.
Earnings should post growth in 2011, but the pace is set to slow. Following the jump in earnings in 2010, we see earnings growth declining in 2011. Margins should stabilise in 1Q11. Loan growth is likely to surpass both the industry and the peer group average. Yapi Kredi has almost no exposure to inflation-indexed bonds. In fact, management tends not to take a trading view on the direction of interest rates or inflation. Thus, earnings at Yapi Kredi are less unpredictable than at most other banks in Turkey.
If Yapi Kredi Sigorta is divested Yapi Kredi may sell its controlling stake in Yapi Kredi Sigorta (74%). The prospects are less clear on this; but if the bank did sell its insurance subsidiary in 2011, this would conservatively add an estimated 15% to earnings, on our preliminary assumptions on valuation.
Valuation. The stock is trading at 2.4x 2010F P/BV and 9.7x 2011F earnings. Our target price model values the stock at TL6.78/share. We use the residual earnings methodology to set a target value for equity. The residual earnings (the RE), is the return on common equity, expressed as a TL excess return rather than a ratio. For every earnings period t, we re-state residual earnings as RE = (ROE - ke)*BVPS. The RE method can be restated as a dividend discount model.
Risks. The Central Bank of Turkey has cut the cap on the monthly interest rate the banks are allowed to charge on credit balances this quarter: the new rate is 2.44%, down from 2.69% the previous quarter. Yapi Kredi has so far managed to offset the declining rates by volumes. Indeed, the balances on which Yapi is earning interest are close to 40% of total credit card loans outstanding, versus 30% 18 months ago. Our base case is that further cuts in 2011 will not have an adverse effect on the bank’s credit card revenues. However, there is the risk of excessive cuts hurting revenues in the future.
Forecasts and ratios
Year end Dec (TLm) 2008 2009 2010F 2011F 2012F
Revenues 3,673 5,255 5,707 6,201 7,509Pre-provision profit 1,314 2,941 3,142 3,035 3,804Net profit 1,043 1,355 2,215 2,468 3,108Normalised EPS (TL) 0.24 0.31 0.51 0.57 0.72Dividend per share (TL) 0.00 0.00 0.00 0.00 0.09Normalised PER (x) 22.9 17.6 10.8 9.7 7.7Dividend yield (%) 0.0 0.0 0.0 0.0 1.5Price/book (x) 3.5 2.9 2.4 2.0 1.6Price/tangible book (x) 3.5 2.9 2.4 2.0 1.6Normalised ROE (%) 17.7 17.9 24.0 22.0 22.9
Source: Company data, ING estimates
Haluk Akdogan London +44 20 7767 6650 [email protected]
Derya Guzel Istanbul +44 20 7767 5379 [email protected]
Buy (maintained)
Price (28/10/10)
TL5.50
Target price (12-mth)
TL6.78 (previously TL4.50)
Forecast total return 23.3%
Banks Turkey Bloomberg: YKBNK TI Reuters: YKBNK.IS
Share data Avg daily volume (3-mth) 12,481,005Free float (%) 18.2Market cap (TLm) 23,908.8Dividend yield (1F, %) 0.0
Source: Company data, ING estimates
Share price performance
2.53.03.54.04.55.05.56.0
10/09 1/10 4/10 7/10PriceIstanbul Stock Exch (rebased)
Source: ING
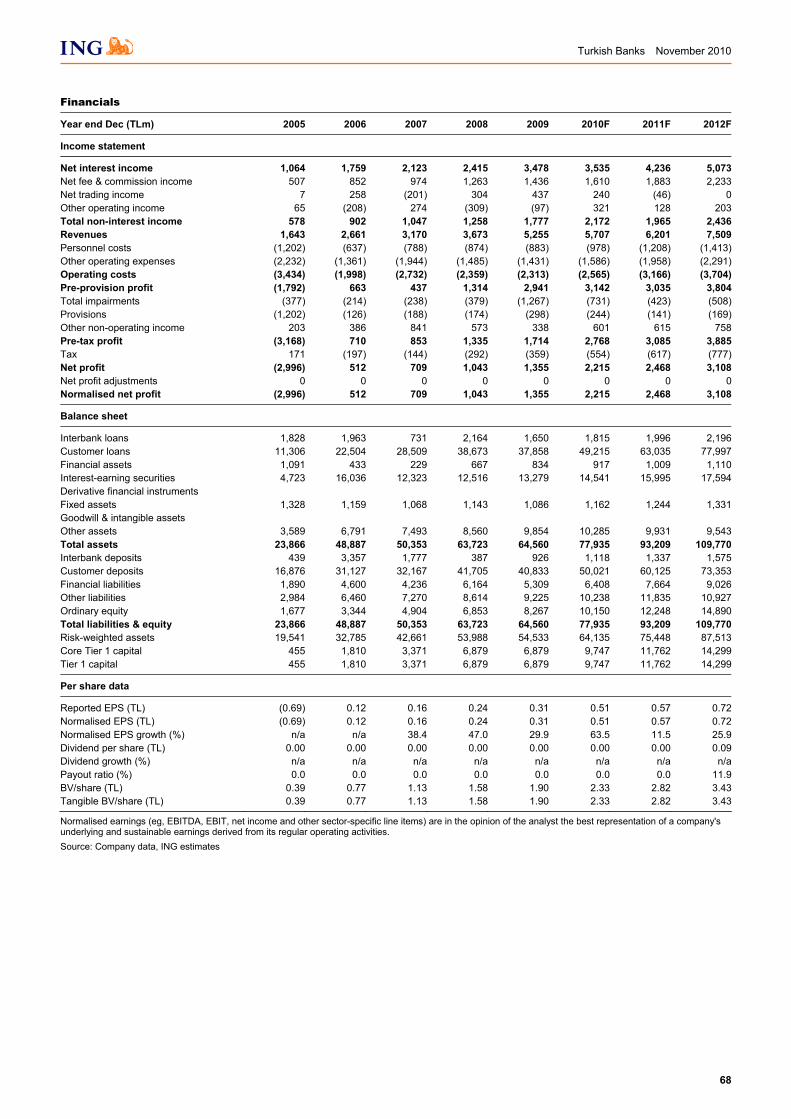
Turkish Banks November 2010
68
Financials
Year end Dec (TLm) 2005 2006 2007 2008 2009 2010F 2011F 2012F
Income statement
Net interest income 1,064 1,759 2,123 2,415 3,478 3,535 4,236 5,073Net fee & commission income 507 852 974 1,263 1,436 1,610 1,883 2,233Net trading income 7 258 (201) 304 437 240 (46) 0Other operating income 65 (208) 274 (309) (97) 321 128 203Total non-interest income 578 902 1,047 1,258 1,777 2,172 1,965 2,436Revenues 1,643 2,661 3,170 3,673 5,255 5,707 6,201 7,509Personnel costs (1,202) (637) (788) (874) (883) (978) (1,208) (1,413)Other operating expenses (2,232) (1,361) (1,944) (1,485) (1,431) (1,586) (1,958) (2,291)Operating costs (3,434) (1,998) (2,732) (2,359) (2,313) (2,565) (3,166) (3,704)Pre-provision profit (1,792) 663 437 1,314 2,941 3,142 3,035 3,804Total impairments (377) (214) (238) (379) (1,267) (731) (423) (508)Provisions (1,202) (126) (188) (174) (298) (244) (141) (169)Other non-operating income 203 386 841 573 338 601 615 758Pre-tax profit (3,168) 710 853 1,335 1,714 2,768 3,085 3,885Tax 171 (197) (144) (292) (359) (554) (617) (777)Net profit (2,996) 512 709 1,043 1,355 2,215 2,468 3,108Net profit adjustments 0 0 0 0 0 0 0 0Normalised net profit (2,996) 512 709 1,043 1,355 2,215 2,468 3,108
Balance sheet
Interbank loans 1,828 1,963 731 2,164 1,650 1,815 1,996 2,196Customer loans 11,306 22,504 28,509 38,673 37,858 49,215 63,035 77,997Financial assets 1,091 433 229 667 834 917 1,009 1,110Interest-earning securities 4,723 16,036 12,323 12,516 13,279 14,541 15,995 17,594Derivative financial instruments Fixed assets 1,328 1,159 1,068 1,143 1,086 1,162 1,244 1,331Goodwill & intangible assets Other assets 3,589 6,791 7,493 8,560 9,854 10,285 9,931 9,543Total assets 23,866 48,887 50,353 63,723 64,560 77,935 93,209 109,770Interbank deposits 439 3,357 1,777 387 926 1,118 1,337 1,575Customer deposits 16,876 31,127 32,167 41,705 40,833 50,021 60,125 73,353Financial liabilities 1,890 4,600 4,236 6,164 5,309 6,408 7,664 9,026Other liabilities 2,984 6,460 7,270 8,614 9,225 10,238 11,835 10,927Ordinary equity 1,677 3,344 4,904 6,853 8,267 10,150 12,248 14,890Total liabilities & equity 23,866 48,887 50,353 63,723 64,560 77,935 93,209 109,770Risk-weighted assets 19,541 32,785 42,661 53,988 54,533 64,135 75,448 87,513Core Tier 1 capital 455 1,810 3,371 6,879 6,879 9,747 11,762 14,299Tier 1 capital 455 1,810 3,371 6,879 6,879 9,747 11,762 14,299
Per share data
Reported EPS (TL) (0.69) 0.12 0.16 0.24 0.31 0.51 0.57 0.72Normalised EPS (TL) (0.69) 0.12 0.16 0.24 0.31 0.51 0.57 0.72Normalised EPS growth (%) n/a n/a 38.4 47.0 29.9 63.5 11.5 25.9Dividend per share (TL) 0.00 0.00 0.00 0.00 0.00 0.00 0.00 0.09Dividend growth (%) n/a n/a n/a n/a n/a n/a n/a n/aPayout ratio (%) 0.0 0.0 0.0 0.0 0.0 0.0 0.0 11.9BV/share (TL) 0.39 0.77 1.13 1.58 1.90 2.33 2.82 3.43Tangible BV/share (TL) 0.39 0.77 1.13 1.58 1.90 2.33 2.82 3.43
Normalised earnings (eg, EBITDA, EBIT, net income and other sector-specific line items) are in the opinion of the analyst the best representation of a company's underlying and sustainable earnings derived from its regular operating activities. Source: Company data, ING estimates
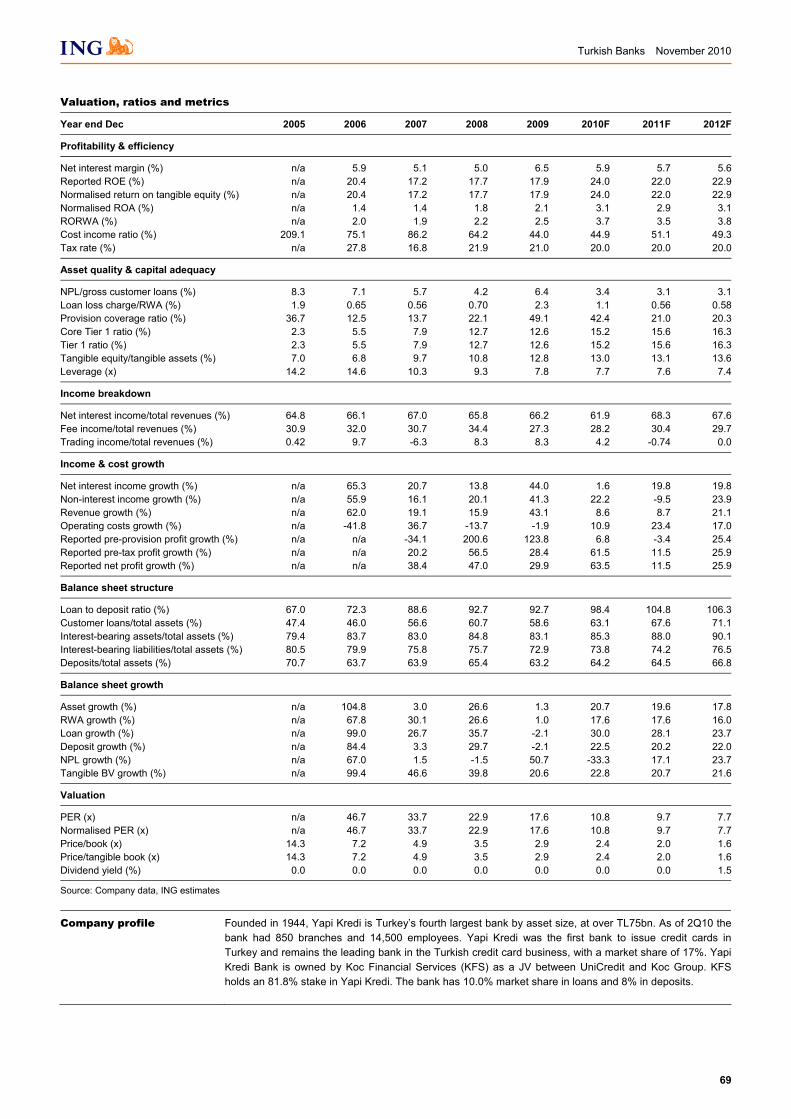
Turkish Banks November 2010
69
Valuation, ratios and metrics
Year end Dec 2005 2006 2007 2008 2009 2010F 2011F 2012F
Profitability & efficiency
Net interest margin (%) n/a 5.9 5.1 5.0 6.5 5.9 5.7 5.6Reported ROE (%) n/a 20.4 17.2 17.7 17.9 24.0 22.0 22.9Normalised return on tangible equity (%) n/a 20.4 17.2 17.7 17.9 24.0 22.0 22.9Normalised ROA (%) n/a 1.4 1.4 1.8 2.1 3.1 2.9 3.1RORWA (%) n/a 2.0 1.9 2.2 2.5 3.7 3.5 3.8Cost income ratio (%) 209.1 75.1 86.2 64.2 44.0 44.9 51.1 49.3Tax rate (%) n/a 27.8 16.8 21.9 21.0 20.0 20.0 20.0
Asset quality & capital adequacy
NPL/gross customer loans (%) 8.3 7.1 5.7 4.2 6.4 3.4 3.1 3.1Loan loss charge/RWA (%) 1.9 0.65 0.56 0.70 2.3 1.1 0.56 0.58Provision coverage ratio (%) 36.7 12.5 13.7 22.1 49.1 42.4 21.0 20.3Core Tier 1 ratio (%) 2.3 5.5 7.9 12.7 12.6 15.2 15.6 16.3Tier 1 ratio (%) 2.3 5.5 7.9 12.7 12.6 15.2 15.6 16.3Tangible equity/tangible assets (%) 7.0 6.8 9.7 10.8 12.8 13.0 13.1 13.6Leverage (x) 14.2 14.6 10.3 9.3 7.8 7.7 7.6 7.4
Income breakdown
Net interest income/total revenues (%) 64.8 66.1 67.0 65.8 66.2 61.9 68.3 67.6Fee income/total revenues (%) 30.9 32.0 30.7 34.4 27.3 28.2 30.4 29.7Trading income/total revenues (%) 0.42 9.7 -6.3 8.3 8.3 4.2 -0.74 0.0
Income & cost growth
Net interest income growth (%) n/a 65.3 20.7 13.8 44.0 1.6 19.8 19.8Non-interest income growth (%) n/a 55.9 16.1 20.1 41.3 22.2 -9.5 23.9Revenue growth (%) n/a 62.0 19.1 15.9 43.1 8.6 8.7 21.1Operating costs growth (%) n/a -41.8 36.7 -13.7 -1.9 10.9 23.4 17.0Reported pre-provision profit growth (%) n/a n/a -34.1 200.6 123.8 6.8 -3.4 25.4Reported pre-tax profit growth (%) n/a n/a 20.2 56.5 28.4 61.5 11.5 25.9Reported net profit growth (%) n/a n/a 38.4 47.0 29.9 63.5 11.5 25.9
Balance sheet structure
Loan to deposit ratio (%) 67.0 72.3 88.6 92.7 92.7 98.4 104.8 106.3Customer loans/total assets (%) 47.4 46.0 56.6 60.7 58.6 63.1 67.6 71.1Interest-bearing assets/total assets (%) 79.4 83.7 83.0 84.8 83.1 85.3 88.0 90.1Interest-bearing liabilities/total assets (%) 80.5 79.9 75.8 75.7 72.9 73.8 74.2 76.5Deposits/total assets (%) 70.7 63.7 63.9 65.4 63.2 64.2 64.5 66.8
Balance sheet growth
Asset growth (%) n/a 104.8 3.0 26.6 1.3 20.7 19.6 17.8RWA growth (%) n/a 67.8 30.1 26.6 1.0 17.6 17.6 16.0Loan growth (%) n/a 99.0 26.7 35.7 -2.1 30.0 28.1 23.7Deposit growth (%) n/a 84.4 3.3 29.7 -2.1 22.5 20.2 22.0NPL growth (%) n/a 67.0 1.5 -1.5 50.7 -33.3 17.1 23.7Tangible BV growth (%) n/a 99.4 46.6 39.8 20.6 22.8 20.7 21.6
Valuation
PER (x) n/a 46.7 33.7 22.9 17.6 10.8 9.7 7.7Normalised PER (x) n/a 46.7 33.7 22.9 17.6 10.8 9.7 7.7Price/book (x) 14.3 7.2 4.9 3.5 2.9 2.4 2.0 1.6Price/tangible book (x) 14.3 7.2 4.9 3.5 2.9 2.4 2.0 1.6Dividend yield (%) 0.0 0.0 0.0 0.0 0.0 0.0 0.0 1.5
Source: Company data, ING estimates
Company profile Founded in 1944, Yapi Kredi is Turkey’s fourth largest bank by asset size, at over TL75bn. As of 2Q10 thebank had 850 branches and 14,500 employees. Yapi Kredi was the first bank to issue credit cards inTurkey and remains the leading bank in the Turkish credit card business, with a market share of 17%. Yapi Kredi Bank is owned by Koc Financial Services (KFS) as a JV between UniCredit and Koc Group. KFSholds an 81.8% stake in Yapi Kredi. The bank has 10.0% market share in loans and 8% in deposits.
Turkish Banks November 2010
70
Disclosures Appendix ANALYST CERTIFICATION The analyst(s) who prepared this report hereby certifies that the views expressed in this report accurately reflect his/her personal views about the subject securities or issuers and no part of his/her compensation was, is, or will be directly or indirectly related to the inclusion of specific recommendations or views in this report.
IMPORTANT DISCLOSURES Company disclosures and ratings charts are available from the disclosures page on our website at http://research.ing.com or write to The Compliance Department, ING Financial Markets LLC, 1325 Avenue of the Americas, New York, USA, 10019.
Valuation and risks: For details of the valuation methodologies used to determine our price targets and risks related to the achievement of these targets refer to the main body of this report and/or the most recent company report available at http://research.ing.com.
The remuneration of research analysts is not tied to specific investment banking transactions performed by ING Group although it is based in part on overall revenues, to which investment banking contribute.
Securities prices: Prices are taken as of the previous day’s close on the home market unless otherwise stated.
Job titles. The functional job title of the person/s responsible for the recommendations contained in this report is equity research analyst unless otherwise stated. Corporate titles may differ from functional job titles.
Conflicts of interest policy. ING manages conflicts of interest arising as a result of the preparation and publication of research through its use of internal databases, notifications by the relevant employees and Chinese walls as monitored by ING Compliance. For further details see our research policies page at http://research.ing.com.
FOREIGN AFFILIATES DISCLOSURES Each ING legal entity which produces research is a subsidiary, branch or affiliate of ING Bank N.V. See back page for the addresses and primary securities regulator for each of these entities.
RATING DISTRIBUTION (as of end 3Q10) RATING DEFINITIONS
Equity coverage Investment Banking clients*
Buy 47% 54%Hold 44% 45%Sell 9% 56% 100% * Percentage of companies in each rating category that are Investment Bankingclients of ING Financial Markets LLC or an affiliate.
Buy: Forecast 12-mth absolute total return greater than +15%
Hold: Forecast 12-mth absolute total return of +15% to -5%
Sell: Forecast 12-mth absolute total return less than -5%
Total return: forecast share price appreciation to target price plus forecast annual dividend. Price volatility and our preference for not changing recommendations too frequently means forecast returns may fall outside of the above ranges at times.
Turkish Banks November 2010
71
AMSTERDAM BRUSSELS LONDON NEW YORK SINGAPORE Tel: 31 20 563 8417 Tel: 32 2 547 7534 Tel: 44 20 7767 1000 Tel: 1 646 424 6000 Tel: 65 6535 3688
Bratislava Tel: 421 2 5934 6111
Bucharest Tel: 40 21 222 1600
Budapest Tel: 36 1 235 8800
Buenos Aires Tel: 54 11 4310 4700
Dublin Tel: 353 1 638 4000
Geneva Tel: 41 22 593 8050
Hong Kong Tel: 852 2848 8488
Istanbul Tel: 90 212 367 7011
Kiev Tel: 380 44 230 3030
Madrid Tel: 34 91 789 8880
Manila Tel: 63 2 479 8888
Mexico City Tel: 52 55 5258 2000
Milan Tel: 39 02 89629 3610
Moscow Tel: 7 495 755 5400
Paris Tel: 33 1 56 39 32 84
Prague Tel: 420 2 5747 3111
Santiago Tel: 56 2 659 2700
Sao Paulo Tel: 55 11 4504 6000
Seoul Tel: 82 2 317 1800
Shanghai Tel: 86 21 6841 3355
Sofia Tel: 359 2 917 6400
Taipei Tel: 886 2 2734 7600
Tokyo Tel: 81 3 5210 0100
Warsaw Tel: 48 22 820 5018
Research offices: legal entity/address/primary securities regulator Amsterdam ING Bank N.V., Foppingadreef 7, Amsterdam, Netherlands, 1102BD. Netherlands Authority for the Financial Markets
Bratislava ING Bank N.V., pobocka zahranicnej banky, Jesenskeho 4/C, 811 02 Bratislava, Slovak Republic. National Bank of Slovakia
Brussels ING Belgium S.A./N.V., Avenue Marnix 24, Brussels, Belgium, B-1000. Banking Finance and Insurance Commission
Bucharest ING Bank N.V. Bucharest Branch, 11-13 Kiseleff Avenue, PO Box 2-208, 011342, Bucharest 1, Romania. Romanian National Securities and Exchange Commission
Budapest ING Bank N.V. Hungary Branch, Dozsa Gyorgy ut 84\B, H - 1068 Budapest, Hungary. Hungarian Financial Supervisory Authority
Hong Kong ING Bank N.V. Hong Kong Branch, 39/F, One International Finance Centre, Central Hong Kong. Hong Kong Monetary Authority
Istanbul ING Bank N.V. Istanbul Representative Office, Eski Buyukdere Caddesi Guney Plaza No: 17 / A Kat: 3 Maslak, Istanbul, Turkey, 34398. Capital Markets Board
Kiev ING Bank Ukraine JSC, 30-a, Spaska Street, Kiev, Ukraine, 04070. Ukrainian Securities and Stock Commission
London ING Bank N.V. London Branch, 60 London Wall, London EC2M 5TQ, United Kingdom. Authorised by the Dutch Central Bank
Manila ING Bank N.V. Manila Branch, 21/F Tower I, Ayala Avenue, 1226 Makati City, Philippines. Philippine Securities and Exchange Commission
Mexico City ING Bank (Mexico) SA, Bosques de Alisos 45-B, Piso 4, Bosques de Las Lomas, 05120, Mexico City, Mexico. Comisión Nacional Bancaria y de Valores
Milan ING Bank N.V. Milano, Via Paleocapa, 5, Milano, Italy, 20121. Commissione Nazionale per le Società e la Borsa
Moscow ING Bank (Eurasia) ZAO, 36, Krasnoproletarskaya ulitsa, 127473 Moscow, Russia. Federal Financial Markets Service
Mumbai ING Vysya Bank Limited, Plot C-12, Block-G, 7th Floor, Bandra Kurla Complex, Bandra (E), Mumbai-51, India. Securities and Exchange Board of India
New York ING Financial Markets LLC, 1325 Avenue of the Americas, New York, United States, 10019. Securities and Exchange Commission
Prague ING Bank N.V. Prague Branch, Nadrazni 25, 150 00 Prague 5, Czech Republic. Czech National Bank
Sao Paulo ING Bank N.V. Sao Paulo, Ave. Presidente Juscelino Kubistchek, 2nd floor, Sao Paulo, Brazil 04543-000. Securities and Exchange Commission of Brazil
Singapore ING Bank N.V. Singapore Branch, 19/F Republic Plaza, 9 Raffles Place, #19-02, Singapore, 048619. Monetary Authority of Singapore
Sofia ING Bank N.V. Sofia Branch, 49B Bulgaria Blvd, Sofia 1404 Bulgaria. Financial Supervision Commission
Warsaw ING Securities S.A., Plac Trzech Krzyzy, 10/14, Warsaw, Poland, 00-499. Polish Financial Supervision Authority
Disclaimer This report has been prepared on behalf of ING (being for this purpose the wholesale and investment banking business of ING Bank NV and certain of itssubsidiary companies) solely for the information of its clients. ING forms part of ING Group (being for this purpose ING Groep NV and its subsidiary and affiliatedcompanies). It is not investment advice or an offer or solicitation for the purchase or sale of any financial instrument. While reasonable care has been taken to ensure that the information contained herein is not untrue or misleading at the time of publication, ING makes no representation that it is accurate or complete. Theinformation contained herein is subject to change without notice. ING Group and any of its officers, employees, related and discretionary accounts may, to theextent not disclosed above and to the extent permitted by law, have long or short positions or may otherwise be interested in any transactions or investments(including derivatives) referred to in this report. In addition, ING Group may provide banking, insurance or asset management services for, or solicit such businessfrom, any company referred to in this report. Neither ING Group nor any of its officers or employees accepts any liability for any direct or consequential loss arising from any use of this report or its contents. Copyright and database rights protection exists in this report and it may not be reproduced, distributed or published byany person for any purpose without the prior express consent of ING. All rights are reserved. Any investments referred to herein may involve significant risk, arenot necessarily available in all jurisdictions, may be illiquid and may not be suitable for all investors. The value of, or income from, any investments referred to herein may fluctuate and/or be affected by changes in exchange rates. Past performance is not indicative of future results. Investors should make their owninvestigations and investment decisions without relying on this report. Only investors with sufficient knowledge and experience in financial matters to evaluate themerits and risks should consider an investment in any issuer or market discussed herein and other persons should not take any action on the basis of this report. This report is issued: 1) in the United Kingdom only to persons described in Articles 19, 47 and 49 of the Financial Services and Markets Act 2000 (FinancialPromotion) Order 2005 and is not intended to be distributed, directly or indirectly, to any other class of persons (including private investors); 2) in Italy only topersons described in Article No. 31 of Consob Regulation No. 11522/98. Clients should contact analysts at, and execute transactions through, an ING entity in theirhome jurisdiction unless governing law permits otherwise. ING Bank N.V. London Branch is authorised by the Dutch Central Bank. It is incorporated in theNetherlands and its London Branch is registered in the UK (number BR000341) at 60 London Wall, London EC2M 5TQ. ING Financial Markets LLC, which is a member of the NYSE, FINRA and SIPC and part of ING, has accepted responsibility for the distribution of this report in the United States under applicablerequirements. ING Vysya Bank Ltd is responsible for the distribution of this report in India. EQ Additional information is available on request