tuberculosis for the infection control … · management data analysis inpatient care medical...
TRANSCRIPT

TUBERCULOSIS FOR THE INFECTION
CONTROL PROFESSIONAL
Alawode Oladele, MD, MPH

Elements of our Tuberculosis Control Program
Clinical
Services
Case
Management Data analysis
Inpatient care
Medical evaluation
and follow-up
X-ray
Laboratory
Pharmacy
Social
servicesInterpreter/
translator
services
Home
evaluation
Housing
Isolation,
detention
Contact
investigation
Coordination of
medical care
DOT
Program
evaluation &
planning
Epidemiology
and Surveillance
HIV testing and
counseling
State TB Control ProgramFederal TB
Control ProgramGuidelines
Training
Funding
National surveillance
Non-TB medical
services
Data collection
State statutes,
regulations,
policies, guidelines
Consultation on
difficult cases
Outbreak
Investigation
Training
FundingInformation
for public
Technical assistance
QA, QI for case
management
Data for local, state, national
surveillance reports
Follow-up/treatment
of contacts
Patient
education
Targeted testing/
LTBI treatment
Documentation
Occupational health,
school, jail, shelter,
LTCF screening

County Health Department
District TB Program
Physician Hospital
State TB Program (DPH)
CDC Division of TB Elimination
LabLab
The Patient
State Lab


•One third of the world’s population is infected with TB.
•Nearly 9.6 million people around the world became sick with
TB disease.
•Almost 1.5 million TB-related deaths worldwide.
•TB is a leading killer of people who are HIV infected (0.4
million out of 1.2 million HIV deaths).

• TB has been known as Pthisis, King’s Evil,
Pott’s disease, consumption, and the White
Plague.
• Egyptian mummies from 3500 BCE have the
presence of Mycobacterium tuberculosis

On March 24, 1882, Dr. Robert Koch announced
the discovery of Mycobacterium tuberculosis
His discoveries ushered in a ‘golden age’ of
scientific discovery and a new era of public
health. Koch's studies inspired a generation of
scientists. In the span of just 30 years – from
1876 to 1906. – Anthrax;
– Tuberculosis;
– Cholera;
.
••Tuberculosis; •Cholera;

The New World
Infected the New World before the Europeans
After more than a century of debate, it is now firmly established that tuberculosis existed in the New World before the arrival of Columbus. What is not yet known is how or when, exactly, the infection reached the Americas.
10% deaths in the 19th century were due to TB

Development of Sanatoriums:
In 1854, Hermann Brehmer proposed the idea that tuberculosis was indeed a curable disease.

– Sanatoriums in the United States tried to simulate
that environment by providing the following:
• Fresh Air
• Large amounts of food
• Lots of milk
• Sleep
• Exercise
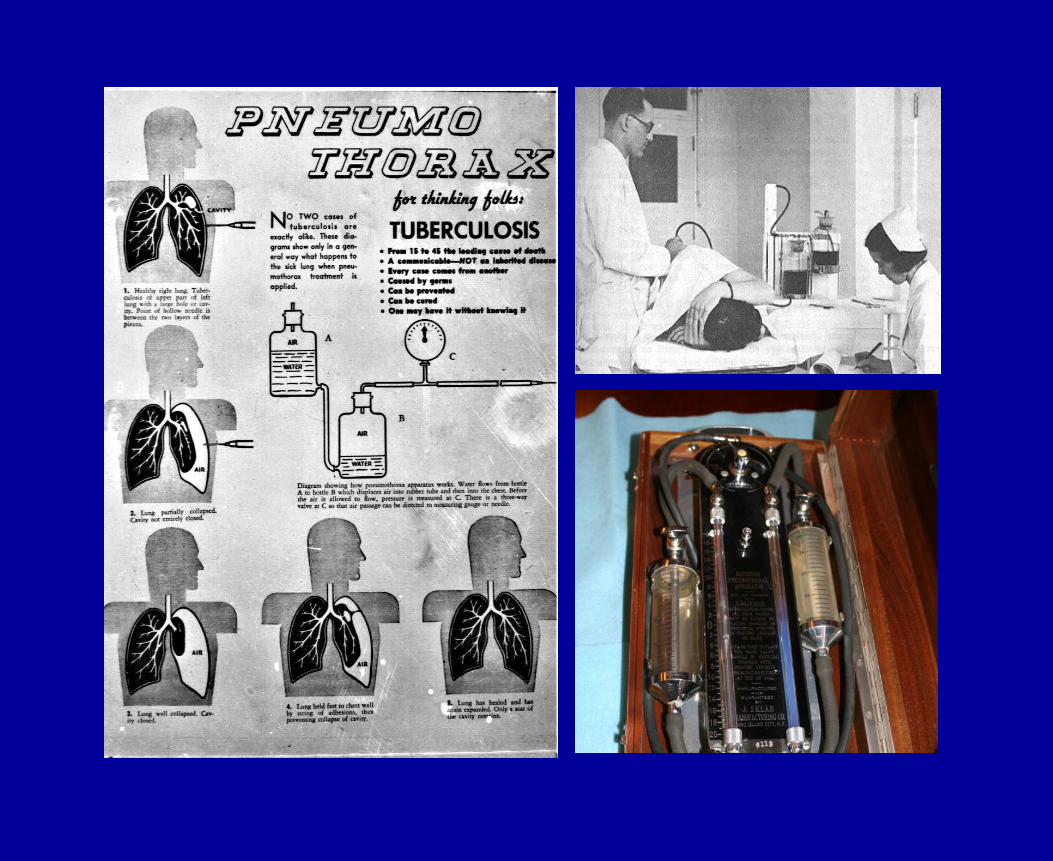
1890: Pneumothorax treatments: Artificial
pneumothorax: The infected lung was collapsed
and filled with gas or filtered air.
Treatments were daily for 3 to 4 years after the
initial treatment.
Discontinued after 1946 because it proved little
benefit.

Other surgical procedures employed included:
•phrenic nerve crush,
•thoracoplasty,
•pneumoperitoneum,
•Monaldi drainage,
•Pneumonolysis -also known as plombage
therapy. Plombage is derived from the French
word “plombe,” literally meaning lead, but it refers
to placing any inert object against the lung to
collapse the underlying cavity.

Posteroanterior chest radiograph of a 78-year-
old man with a history of benign prostatic
hypertrophy and diverticulosis.

Lucite balls for plombage therapy, used until the
1950s, on display at the former Battey State
Tuberculosis Hospital in Rome, Georgia.

“How the battle against TB was won
. . . and almost lost.”

1944- Streptomycin first administered to human
patient
1947- Mycobacterium tuberculosis shows
resistance to streptomycin.
1949- p-aminosalicylic acid (PAS)
1951- A new drug, Isoniazid (INH) is created.
1954- Pyrazinamide is created.
1955- Cycloserine is produced.
1962- Ethambutol is created.
1963- Rifampicin

1960s Combination treatment
1970s Near eradication ?
1981 HIV
1998 DNA code of Mtb genome
2005 Improved diagnostic test (FDA)
2006 XDR outbreak South Africa
2013 Sirturo, known chemically as bedaquiline
MDR treatment
Today 1/3 of the world infected
(>2 billion people)

TB Drug Development Timeline

Evolution of new TB technologies in the
last five years
Year Technology Turnaround time
Before 2007 Solid Culture DST
(Phenotyping)
(1st & 2nd line)
30-60 days
2007 Liquid Culture DST
(Phenotyping)
(1st / 2nd line)
15-30 days
2008 Line Probe Assay
(Genotyping)
(1st line, Rif & INH)
2 days
2010 Genotyping second
generation (1st line, Rif
& INH)
90 minutes

Reported Tuberculosis (TB Disease) Cases
United States, 1982–2015

Reported Tuberculosis (TB Disease) Cases
United States, 1982–2015
9,563 TB cases in 2015
(Rate 3.0/100,000)

Increase in number of TB cases in 2015
For the first time since 1992, the annual number of
reported TB cases in the US increased from the
previous year
Twenty-nine states and the District of Columbia
(DC) reported an increase in TB cases in 2015
Overall TB rate has remained at 3.0 cases per
100,000 persons for 2013, 2014, and 2015
Leveling of TB might represent the limits of what is
achievable at present, or it might represent the
beginning of another national TB resurgence

What makes a plateau?
During the past 3 years, no substantial decline occurred in
the number of TB cases in the US
For the first time since 1992, the number of TB cases in the
U.S. increased from the previous year
Two thirds of the total U.S. TB burden is associated with
foreign birth -- most likely representing reactivation of LTBI
that was acquired outside of U.S.
Among the U.S.-born, ongoing TB transmission continues
to be a problem
Possibly this is the lowest level of TB in the U.S. that can
be achieved at present

Rate of TB Cases*, By State – United States, 2014
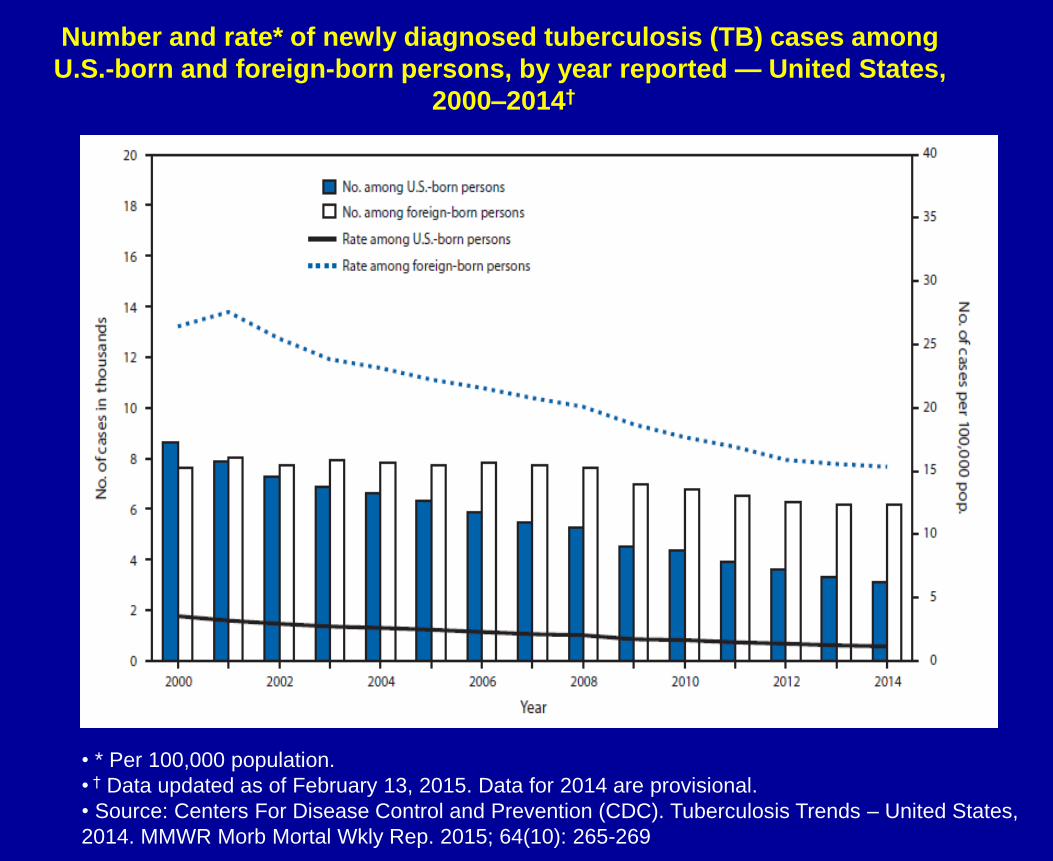
• * Per 100,000 population.
• † Data updated as of February 13, 2015. Data for 2014 are provisional.
• Source: Centers For Disease Control and Prevention (CDC). Tuberculosis Trends – United States,
2014. MMWR Morb Mortal Wkly Rep. 2015; 64(10): 265-269
Number and rate* of newly diagnosed tuberculosis (TB) cases among
U.S.-born and foreign-born persons, by year reported — United States,
2000–2014†

TB Cases and Case Rates Georgia,1984-2014
Number of Cases Rate/100,000
335
3.3
0.0
2.0
4.0
6.0
8.0
10.0
12.0
14.0
16.0
0
100
200
300
400
500
600
700
800
900
1000
Number Case Rate
Year Case Counted
*63% drop in number of cases between 1991 and 2014!
909
**322 in 2015

3.0
3.3
0.0
2.0
4.0
6.0
8.0
10.0
12.0
14.0
16.0
19
84
19
85
19
86
19
87
19
88
19
89
19
90
19
91
19
92
19
93
19
94
19
95
19
96
19
97
19
98
19
99
20
00
20
01
20
02
20
03
20
04
20
05
20
06
20
07
20
08
20
09
20
10
20
11
20
12
20
13
20
14
Cas
e R
ate
Year
US Case Rate GA Case Rate
Figure 2. TB Case Rates
Georgia and U.S., 1984-2014

185
150
0
100
200
300
400
500
600
700
800
Co
un
t
Year
US-born
Foreign-born
US-born and Foreign-born TB Cases Georgia,1994-2014


Atlanta
High TB Incidence Counties
Georgia -2015
Fulton
64
Gwinnett
34
DeKalb
57
Cobb
26
Number of TB Cases:
>= 15 cases
< 15 cases

DeKalb County Board of Health
(Community Partners)
DeKalb County Schools
Colleges & Universities
Resettlement Agencies
American Lung Association
Correctional Facilities
Nursing Homes
Substance Abuse Programs
Mental Health
Private Providers
Hospitals
Others
(Government Partners)
State
CDC
Others
Client
Partnership Collaboration

Together We Can!