tropospheric ozone variability during the east asian ... · atmospheric sounding interferometer...
TRANSCRIPT
Atmos. Chem. Phys., 16, 10489–10500, 2016www.atmos-chem-phys.net/16/10489/2016/doi:10.5194/acp-16-10489-2016© Author(s) 2016. CC Attribution 3.0 License.
Tropospheric ozone variability during the East Asian summermonsoon as observed by satellite (IASI), aircraft (MOZAIC) andground stationsSarah Safieddine1,a, Anne Boynard1, Nan Hao2, Fuxiang Huang3, Lili Wang4, Dongsheng Ji4, Brice Barret5,Sachin D. Ghude6, Pierre-François Coheur7, Daniel Hurtmans7, and Cathy Clerbaux1,7
1Sorbonne Universités, UPMC Univ. Paris 06, Université Versailles St-Quentin, CNRS/INSU, LATMOS-IPSL, Paris, France2German Aerospace Center (DLR), Remote Sensing Technology Institute (IMF), Oberpfaffenhofen, Germany3National Satellite Meteorological Center, China Meteorological Administration, Beijing, China4LAPC, Institute of Atmospheric Physics, Chinese Academy of Sciences, Beijing, China5Laboratoire d’Aérologie, Observatoire Midi-Pyrénées, Université Paul Sabatier, CNRS, Toulouse, France6Indian Institute of Tropical Meteorology, Pashan Rd., Pune-411 008, India7Spectroscopie de l’Atmosphère, Chimie Quantique et Photophysique, Université Libre de Bruxelles (U.L.B.),Brussels, Belgiumanow at: Department of Civil and Environmental Engineering, Massachusetts Institute of Technology, Cambridge, MA, USA
Correspondence to: Sarah Safieddine ([email protected])
Received: 19 August 2015 – Published in Atmos. Chem. Phys. Discuss.: 13 November 2015Revised: 24 June 2016 – Accepted: 2 August 2016 – Published: 22 August 2016
Abstract. Satellite measurements from the thermal InfraredAtmospheric Sounding Interferometer (IASI), aircraft datafrom the MOZAIC/IAGOS project, as well as observationsfrom ground-based stations, are used to assess the tropo-spheric ozone (O3) variability during the East Asian SummerMonsoon (EASM). Six years 2008–2013 of IASI data anal-ysis reveals the ability of the instrument to detect the onsetand the progression of the monsoon seen by a decrease inthe tropospheric 0–6 km O3 column due to the EASM, andto reproduce this decrease from one year to the other. Theyear-to-year variability is found to be mainly dependent onmeteorology. Focusing on the period of May-August 2011,taken as an example year, IASI data show clear inverse re-lationship between tropospheric 0–6 km O3 on one hand andmeteorological parameters such as cloud cover, relative hu-midity and wind speed, on the other hand. Aircraft data fromthe MOZAIC/IAGOS project for the EASM of 2008–2013are used to validate the IASI data and to assess the effect ofthe monsoon on the vertical distribution of the troposphericO3 at different locations. Results show good agreement witha correlation coefficient of 0.73 (12 %) between the 0–6 kmO3 column derived from IASI and aircraft data. IASI cap-
tures very well the inter-annual variation of tropospheric O3observed by the aircraft data over the studied domain. Anal-ysis of vertical profiles of the aircraft data shows a decreasein the tropospheric O3 that is more important in the free tro-posphere than in the boundary layer and at 10–20◦ N thanelsewhere. Ground station data at different locations in Indiaand China show a spatiotemporal dependence on meteorol-ogy during the monsoon, with a decrease up to 22 ppbv inHyderabad, and up to 5 ppbv in the North China Plain.
1 Introduction
Over South and East Asia, tropospheric ozone (O3) con-centrations have significantly increased over the past fewdecades as a result of rapid urbanization (Cooper et al., 2014)with important implications on regional and global air qual-ity. South and East Asian countries are experiencing increas-ing emissions of different pollutants, many of which are pre-cursors of O3 (Akimoto, 2003; Ohara et al., 2007; Richter etal., 2005). For example, China showed an increase of NO2reaching 29 % per year for the period 1996–2006 (van der
Published by Copernicus Publications on behalf of the European Geosciences Union.
10490 S. Safieddine et al.: Tropospheric ozone variability during the East Asian summer monsoon
A et al., 2008), and about 50 % over the industrial areasof China over the period 1996–2004 (Richter et al., 2005),though recent NO2 observations from space are suggestingan NO2 decrease in 2013 and 2014 (Richter et al., 2015). Anincrease in background O3 concentrations is also detected inSouthern China during the last decade (T. Wang et al., 2009).In Eastern China, a study by Xu et al. (2008), analyzing long-term trends at a background surface O3 station in Linan, sug-gests enhanced O3 variability linked to the increase in NOx
(NOx =NO2+NO) concentrations. Over most of India, in-creasing trends in tropospheric O3 are consistent with the ob-served trends in emissions from NOx and carbon monoxide(CO) as well as coal and petroleum consumption (Lal et al.,2012).
The Asian monsoon circulation dominates the regionalmeteorology of southern and East Asia. In summer, the EastAsian Summer Monsoon (EASM) is characterized by torren-tial rain, strong winds carrying clean air from the ocean overthe heated tropical land and deep convection processes form-ing cirrus clouds and further rain (Lawrence and Lelieveld,2010). Surface observations have shown that the EASM isresponsible for a decrease in surface O3 at a rural site nearBeijing (Wang et al., 2008) and a coastal site near Hong Kong(Lam et al., 2001; T. Wang et al., 2009). Yang et al. (2014)found that the largest impacts of EASM on the decrease insurface O3 are found over central and western China, whileBeijing (North East China) and Nanjing (East China) ex-perience a summertime O3 maxima during June and Julyrespectively (Ding et al., 2008, 2013). Ozonesondes mea-surements have also detected the effect of the EASM onlower tropospheric O3 (Chan et al., 1998; Zhou et al., 2013).Satellite measurements over South and East Asia have beenused to assess the daily variability of tropospheric O3, no-tably from the Infrared Atmospheric Sounding Interferom-eter (IASI) (Dufour et al., 2015). The effect of the EASMon the tropospheric O3 was previously detected with a de-crease in the O3 partial column using data from IASI overseveral Indian and Chinese cities (Dufour et al., 2010; Safied-dine et al., 2013). Using the Ozone Monitoring Instrument(OMI) and Microwave Limb Sounder (MLS) measurements,together with a regional chemistry and transport model, Zhaoet al. (2010) showed that the air quality over southeasternChina is affected by the EASM, leading to an influence ex-tending to central East China from June to July. At 300 hPa,the Tropospheric Emission Spectrometer (TES) observationsover India showed enhanced O3 abundances during June andJuly followed by a decrease in August (Worden et al., 2009).
The main objective of this study is to document the effectof the monsoon on the regional and vertical distribution oftropospheric O3 in East Asia during the summer using dif-ferent observation data sets and relating them to one another.After this introduction, Sect. 2 will look at 6 years of tropo-spheric 0–6 km O3 data and at a case study of the monsoon of2011. We study the relationship between the tropospheric 0–6 km O3 and CO total columns from IASI and different me-
teorological parameters from the ECMWF (European Cen-tre for Medium-Range Weather Forecasts) Reanalysis (ERA)(winds, cloud cover and relative humidity) (Dee et al., 2011).Section 3 will look at a dense set of vertical O3 airborne pro-files (363 in total) used to validate the IASI-O3 columns aswell assess how well IASI captures the inter-annual variabil-ity of the EASM as observed by the aircraft data. Section 4will look at a ground stations data set at five locations: Hyder-abad, Udaipur, Jabalpur, Pearl River Delta (PRD) and NorthChina Plain (NCP), during the EASM of 2011. Conclusionsare given in Sect. 5.
2 Tropospheric O3 from IASI during the EASM
2.1 The IASI instrument
The IASI instruments launched onboard the MetOp plat-forms in October 2006 (IASI-A) and September 2012 (IASI-B) are nadir looking Fourier transform spectrometers thatprobe the Earth’s atmosphere in the thermal infrared spec-tral range between 645 and 2760 cm−1, with a spectral res-olution of 0.5 cm−1 (apodized) and 0.25 cm−1 spectral sam-pling. In this study, and to have a consistent O3 product overthe period 2008–2013, only IASI-A data have been used. TheIASI footprint is a matrix of 2× 2 pixels, each with 12 kmdiameter at nadir. IASI monitors the atmospheric composi-tion at any location two times per day (the satellite’s groundtrack is at about 09:30 local time in the morning and 21:30in the evening). Each IASI measures many of the chemicalcomponents that play a key role in the climate system andin several aspects of atmospheric pollution. Global distribu-tions of O3 vertical profiles are retrieved in near real timeusing a dedicated radiative transfer and retrieval software forthe IASI O3 product, the Fast Optimal Retrievals on Lay-ers for IASI (FORLI-O3) (Hurtmans et al., 2012). Data areselected using a filter for scenes with no or low cloud cov-erage (below 13 %), and by rejecting all observations withroot mean square (RMS) of the spectral fit residual largerthan 3.5×10⁻⁸ W cm−2 sr cm−1. Details about the chemicalcomponents that can be measured by IASI can be found inClerbaux et al. (2009), Coheur et al. (2009) and Clarisse etal. (2011). IASI tropospheric O3 retrieved from FORLI hasbeen extensively validated against ozonesondes during theperiod 2008–2014 and results show that IASI underestimatestropospheric O3 by 12 to 14 % in the mid-latitudes and trop-ics (Boynard et al., 2016).
2.2 Tropospheric O3 during the EASM for 2008–2013
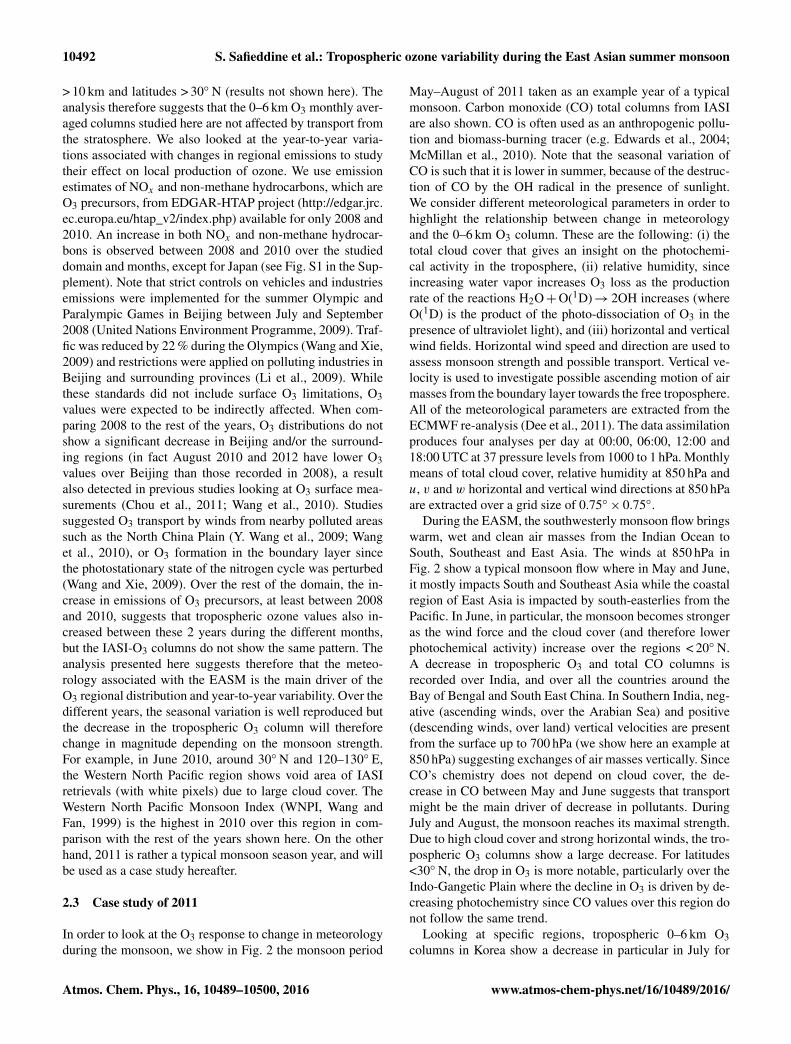
To look at the inter-seasonal and inter-annual variation oftropospheric O3 during the monsoon, we show in Fig. 1the monthly distribution (May–September) of the IASI 0–6 km O3 column over the period 2008–2013. Only IASI day-time observations are used, since better thermal contrast, andhence better sensitivity to the lower troposphere, is usually
Atmos. Chem. Phys., 16, 10489–10500, 2016 www.atmos-chem-phys.net/16/10489/2016/
S. Safieddine et al.: Tropospheric ozone variability during the East Asian summer monsoon 10491
Figure 1. Monthly averaged daytime tropospheric 0–6 km O3 column from IASI over the EASM region and period (May–September) forthe years 2008–2013. The decrease due to the monsoon is more prominent to the south of the domain.
obtained during the day (Clerbaux et al., 2009). Earlier stud-ies have shown that the information content in the satellitemeasurement varies, and is generally maximal in the mid-to upper troposphere, and lower at the surface (Barret et al.,2011; Dufour et al., 2012; Safieddine et al., 2014). The 0–6 km O3 column is used to eliminate any possible strato-spheric intrusions and previous studies have shown that withthe 0–6 km column, at least one piece of information is avail-able for the IASI retrieval (Barret et al., 2011; Dufour et al.,2012). Limitations in the sensitivity provide sources of er-ror that can influence our conclusions about the observed O3distribution, especially close to the surface. Another sourceof error emerge from the fact that the IASI observations usedhere are for scenes (pixels) with no or low cloud contamina-tion, and therefore reflect mostly the state of the atmospherebefore or after the rain/high cloud episodes that the EASMwill generate.
The monthly average tropospheric O3 columns from IASIshown here have different observation counts at each gridpoint, which may correspond to the average of one to morethan 200 observations. Despite these limitations, this is thebest-known data set of remote infrared retrieved O3 columnscovering the entire monsoon region, and we assume that theaverage effect of the monsoon on the tropospheric O3 col-umn from one month to the other can be reflected in one or
more observations. The seasonal variation of O3 as detectedby IASI is highly dependent on photochemical activity andis generally higher in summer and lower in winter (Safied-dine et al., 2013). However, within the EASM region, IASIshows in Fig. 1 that this typical seasonality is broken andon average, the 0–6 km O3 columns are lower in June–July–August (JJA) in comparison with May. The Asian monsoononset date is around the mid-May and June (Parthasarathy etal., 1994; B. Wang et al., 2009; Yang and Lau, 1998). Fig-ure 1 shows that the largest decrease is recorded in southernIndia, where clean air masses from the Pacific starting typ-ically in May (generating the Indian Summer Monsoon, asubsystem of the EASM) will be responsible of a decreasereaching 15-20 Dobson unit (DU) in JJA. With the marchof the monsoon northeastward, the decrease becomes mostprominent in July and August at higher latitudes. To under-stand the year-to-year variability in tropospheric ozone, welooked at possible stratospheric intrusions into the 0–6 km O3column. Potential vorticity (PV) and the water vapor mixingratio (Qvap) measurements were used as markers of transportfrom the upper troposphere–lower stratosphere (UTLS) tothe troposphere, and extracted at different altitudes. We useddata from the ERA-interim reanalysis (more info about thisdata set is provided in Sect. 2.3), and it was seen that down-ward transport from the UTLS can have an effect at altitude
www.atmos-chem-phys.net/16/10489/2016/ Atmos. Chem. Phys., 16, 10489–10500, 2016
10492 S. Safieddine et al.: Tropospheric ozone variability during the East Asian summer monsoon
> 10 km and latitudes > 30◦ N (results not shown here). Theanalysis therefore suggests that the 0–6 km O3 monthly aver-aged columns studied here are not affected by transport fromthe stratosphere. We also looked at the year-to-year varia-tions associated with changes in regional emissions to studytheir effect on local production of ozone. We use emissionestimates of NOx and non-methane hydrocarbons, which areO3 precursors, from EDGAR-HTAP project (http://edgar.jrc.ec.europa.eu/htap_v2/index.php) available for only 2008 and2010. An increase in both NOx and non-methane hydrocar-bons is observed between 2008 and 2010 over the studieddomain and months, except for Japan (see Fig. S1 in the Sup-plement). Note that strict controls on vehicles and industriesemissions were implemented for the summer Olympic andParalympic Games in Beijing between July and September2008 (United Nations Environment Programme, 2009). Traf-fic was reduced by 22 % during the Olympics (Wang and Xie,2009) and restrictions were applied on polluting industries inBeijing and surrounding provinces (Li et al., 2009). Whilethese standards did not include surface O3 limitations, O3values were expected to be indirectly affected. When com-paring 2008 to the rest of the years, O3 distributions do notshow a significant decrease in Beijing and/or the surround-ing regions (in fact August 2010 and 2012 have lower O3values over Beijing than those recorded in 2008), a resultalso detected in previous studies looking at O3 surface mea-surements (Chou et al., 2011; Wang et al., 2010). Studiessuggested O3 transport by winds from nearby polluted areassuch as the North China Plain (Y. Wang et al., 2009; Wanget al., 2010), or O3 formation in the boundary layer sincethe photostationary state of the nitrogen cycle was perturbed(Wang and Xie, 2009). Over the rest of the domain, the in-crease in emissions of O3 precursors, at least between 2008and 2010, suggests that tropospheric ozone values also in-creased between these 2 years during the different months,but the IASI-O3 columns do not show the same pattern. Theanalysis presented here suggests therefore that the meteo-rology associated with the EASM is the main driver of theO3 regional distribution and year-to-year variability. Over thedifferent years, the seasonal variation is well reproduced butthe decrease in the tropospheric O3 column will thereforechange in magnitude depending on the monsoon strength.For example, in June 2010, around 30◦ N and 120–130◦ E,the Western North Pacific region shows void area of IASIretrievals (with white pixels) due to large cloud cover. TheWestern North Pacific Monsoon Index (WNPI, Wang andFan, 1999) is the highest in 2010 over this region in com-parison with the rest of the years shown here. On the otherhand, 2011 is rather a typical monsoon season year, and willbe used as a case study hereafter.
2.3 Case study of 2011
In order to look at the O3 response to change in meteorologyduring the monsoon, we show in Fig. 2 the monsoon period
May–August of 2011 taken as an example year of a typicalmonsoon. Carbon monoxide (CO) total columns from IASIare also shown. CO is often used as an anthropogenic pollu-tion and biomass-burning tracer (e.g. Edwards et al., 2004;McMillan et al., 2010). Note that the seasonal variation ofCO is such that it is lower in summer, because of the destruc-tion of CO by the OH radical in the presence of sunlight.We consider different meteorological parameters in order tohighlight the relationship between change in meteorologyand the 0–6 km O3 column. These are the following: (i) thetotal cloud cover that gives an insight on the photochemi-cal activity in the troposphere, (ii) relative humidity, sinceincreasing water vapor increases O3 loss as the productionrate of the reactions H2O+O(1D)→ 2OH increases (whereO(1D) is the product of the photo-dissociation of O3 in thepresence of ultraviolet light), and (iii) horizontal and verticalwind fields. Horizontal wind speed and direction are used toassess monsoon strength and possible transport. Vertical ve-locity is used to investigate possible ascending motion of airmasses from the boundary layer towards the free troposphere.All of the meteorological parameters are extracted from theECMWF re-analysis (Dee et al., 2011). The data assimilationproduces four analyses per day at 00:00, 06:00, 12:00 and18:00 UTC at 37 pressure levels from 1000 to 1 hPa. Monthlymeans of total cloud cover, relative humidity at 850 hPa andu, v and w horizontal and vertical wind directions at 850 hPaare extracted over a grid size of 0.75◦× 0.75◦.
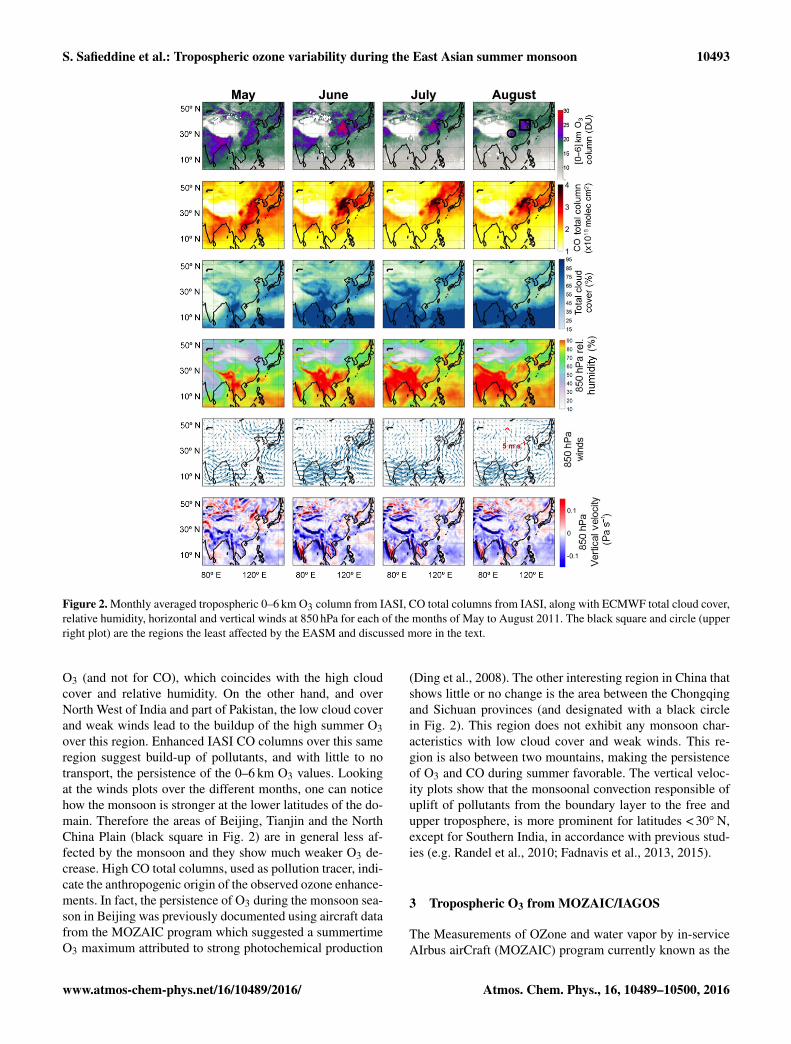
During the EASM, the southwesterly monsoon flow bringswarm, wet and clean air masses from the Indian Ocean toSouth, Southeast and East Asia. The winds at 850 hPa inFig. 2 show a typical monsoon flow where in May and June,it mostly impacts South and Southeast Asia while the coastalregion of East Asia is impacted by south-easterlies from thePacific. In June, in particular, the monsoon becomes strongeras the wind force and the cloud cover (and therefore lowerphotochemical activity) increase over the regions < 20◦ N.A decrease in tropospheric O3 and total CO columns isrecorded over India, and over all the countries around theBay of Bengal and South East China. In Southern India, neg-ative (ascending winds, over the Arabian Sea) and positive(descending winds, over land) vertical velocities are presentfrom the surface up to 700 hPa (we show here an example at850 hPa) suggesting exchanges of air masses vertically. SinceCO’s chemistry does not depend on cloud cover, the de-crease in CO between May and June suggests that transportmight be the main driver of decrease in pollutants. DuringJuly and August, the monsoon reaches its maximal strength.Due to high cloud cover and strong horizontal winds, the tro-pospheric O3 columns show a large decrease. For latitudes<30◦ N, the drop in O3 is more notable, particularly over theIndo-Gangetic Plain where the decline in O3 is driven by de-creasing photochemistry since CO values over this region donot follow the same trend.
Looking at specific regions, tropospheric 0–6 km O3columns in Korea show a decrease in particular in July for
Atmos. Chem. Phys., 16, 10489–10500, 2016 www.atmos-chem-phys.net/16/10489/2016/
S. Safieddine et al.: Tropospheric ozone variability during the East Asian summer monsoon 10493
Figure 2. Monthly averaged tropospheric 0–6 km O3 column from IASI, CO total columns from IASI, along with ECMWF total cloud cover,relative humidity, horizontal and vertical winds at 850 hPa for each of the months of May to August 2011. The black square and circle (upperright plot) are the regions the least affected by the EASM and discussed more in the text.
O3 (and not for CO), which coincides with the high cloudcover and relative humidity. On the other hand, and overNorth West of India and part of Pakistan, the low cloud coverand weak winds lead to the buildup of the high summer O3over this region. Enhanced IASI CO columns over this sameregion suggest build-up of pollutants, and with little to notransport, the persistence of the 0–6 km O3 values. Lookingat the winds plots over the different months, one can noticehow the monsoon is stronger at the lower latitudes of the do-main. Therefore the areas of Beijing, Tianjin and the NorthChina Plain (black square in Fig. 2) are in general less af-fected by the monsoon and they show much weaker O3 de-crease. High CO total columns, used as pollution tracer, indi-cate the anthropogenic origin of the observed ozone enhance-ments. In fact, the persistence of O3 during the monsoon sea-son in Beijing was previously documented using aircraft datafrom the MOZAIC program which suggested a summertimeO3 maximum attributed to strong photochemical production
(Ding et al., 2008). The other interesting region in China thatshows little or no change is the area between the Chongqingand Sichuan provinces (and designated with a black circlein Fig. 2). This region does not exhibit any monsoon char-acteristics with low cloud cover and weak winds. This re-gion is also between two mountains, making the persistenceof O3 and CO during summer favorable. The vertical veloc-ity plots show that the monsoonal convection responsible ofuplift of pollutants from the boundary layer to the free andupper troposphere, is more prominent for latitudes < 30◦ N,except for Southern India, in accordance with previous stud-ies (e.g. Randel et al., 2010; Fadnavis et al., 2013, 2015).
3 Tropospheric O3 from MOZAIC/IAGOS
The Measurements of OZone and water vapor by in-serviceAIrbus airCraft (MOZAIC) program currently known as the
www.atmos-chem-phys.net/16/10489/2016/ Atmos. Chem. Phys., 16, 10489–10500, 2016
10494 S. Safieddine et al.: Tropospheric ozone variability during the East Asian summer monsoon
European In-service Aircraft for a Global Observing Sys-tem (IAGOS) program (Nedelec et al., 2015), has providedin situ observations of ozone, water vapor, carbon monoxideand other trace gases made from multiple commercial air-craft since 1994 (Marenco et al., 1998; Thouret et al., 1998;http://www.iagos.org). In this study, we start by performinga validation analysis of the IASI data with 363 profiles fromaircraft take-off and landing; we then check how well IASIcaptures the inter-annual variation of O3 seen by the aircraftdata and finally we look at the monthly averaged vertical pro-files of tropospheric O3 over our study domain.
3.1 Validation of IASI data
The IASI-retrieved tropospheric O3 product is not a real con-centration profile, but an estimation of the true profile consid-ering the ability of the instrument to discriminate differentatmospheric layers. Therefore one cannot directly comparesatellite-retrieved profiles with high-resolution in situ obser-vations such as the aircraft data. Instead, each high-resolutionO3 profile measured by the aircraft needs to be convolved bythe low-resolution IASI averaging kernel matrix with the apriori profile, following Rodgers (2000) formulation:
xsmoothed = xa,IASI+AIASI(xaircraft− xa,IASI
), (1)
where xsmoothed is the smoothed profile that uses low-resolution measurement characteristics. AIASI is the low-resolution averaging kernel matrix. xaircraft is the high-resolution profile given by the aircraft, and xa,IASI is thelow-resolution IASI a priori profile constructed from theMcPeters/Labow/Logan climatology of O3 vertical distribu-tion, which combines long-term satellite limb measurementsand measurements from ozonesondes (see McPeters et al.,2007; Hurtmans et al., 2012). Before the smoothing, the val-idation profile has to cover the whole retrieval altitude range,which is from the ground up to 41 km. The aircraft data pro-files were therefore completed by the same a priori usedfor IASI so that the matrix calculation of Eq. (1) is valid.We have also used an IASI spatial coincidence criterion of±200 km around the position of the aircraft ascent or descent.In this section, both IASI day and nighttime observations areused for the validation of the aircraft data, and the temporalcoincidence is ±10 h.
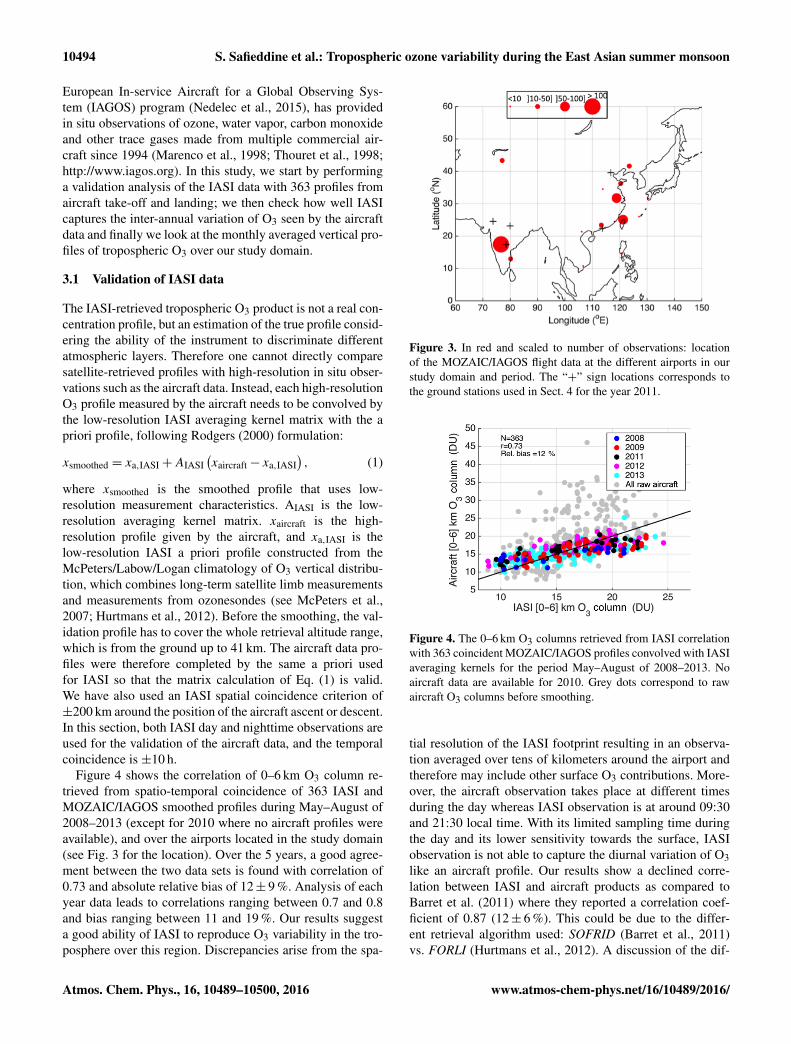
Figure 4 shows the correlation of 0–6 km O3 column re-trieved from spatio-temporal coincidence of 363 IASI andMOZAIC/IAGOS smoothed profiles during May–August of2008–2013 (except for 2010 where no aircraft profiles wereavailable), and over the airports located in the study domain(see Fig. 3 for the location). Over the 5 years, a good agree-ment between the two data sets is found with correlation of0.73 and absolute relative bias of 12± 9 %. Analysis of eachyear data leads to correlations ranging between 0.7 and 0.8and bias ranging between 11 and 19 %. Our results suggesta good ability of IASI to reproduce O3 variability in the tro-posphere over this region. Discrepancies arise from the spa-
Figure 3. In red and scaled to number of observations: locationof the MOZAIC/IAGOS flight data at the different airports in ourstudy domain and period. The “+” sign locations corresponds tothe ground stations used in Sect. 4 for the year 2011.
Figure 4. The 0–6 km O3 columns retrieved from IASI correlationwith 363 coincident MOZAIC/IAGOS profiles convolved with IASIaveraging kernels for the period May–August of 2008–2013. Noaircraft data are available for 2010. Grey dots correspond to rawaircraft O3 columns before smoothing.
tial resolution of the IASI footprint resulting in an observa-tion averaged over tens of kilometers around the airport andtherefore may include other surface O3 contributions. More-over, the aircraft observation takes place at different timesduring the day whereas IASI observation is at around 09:30and 21:30 local time. With its limited sampling time duringthe day and its lower sensitivity towards the surface, IASIobservation is not able to capture the diurnal variation of O3like an aircraft profile. Our results show a declined corre-lation between IASI and aircraft products as compared toBarret et al. (2011) where they reported a correlation coef-ficient of 0.87 (12± 6 %). This could be due to the differ-ent retrieval algorithm used: SOFRID (Barret et al., 2011)vs. FORLI (Hurtmans et al., 2012). A discussion of the dif-
Atmos. Chem. Phys., 16, 10489–10500, 2016 www.atmos-chem-phys.net/16/10489/2016/
S. Safieddine et al.: Tropospheric ozone variability during the East Asian summer monsoon 10495
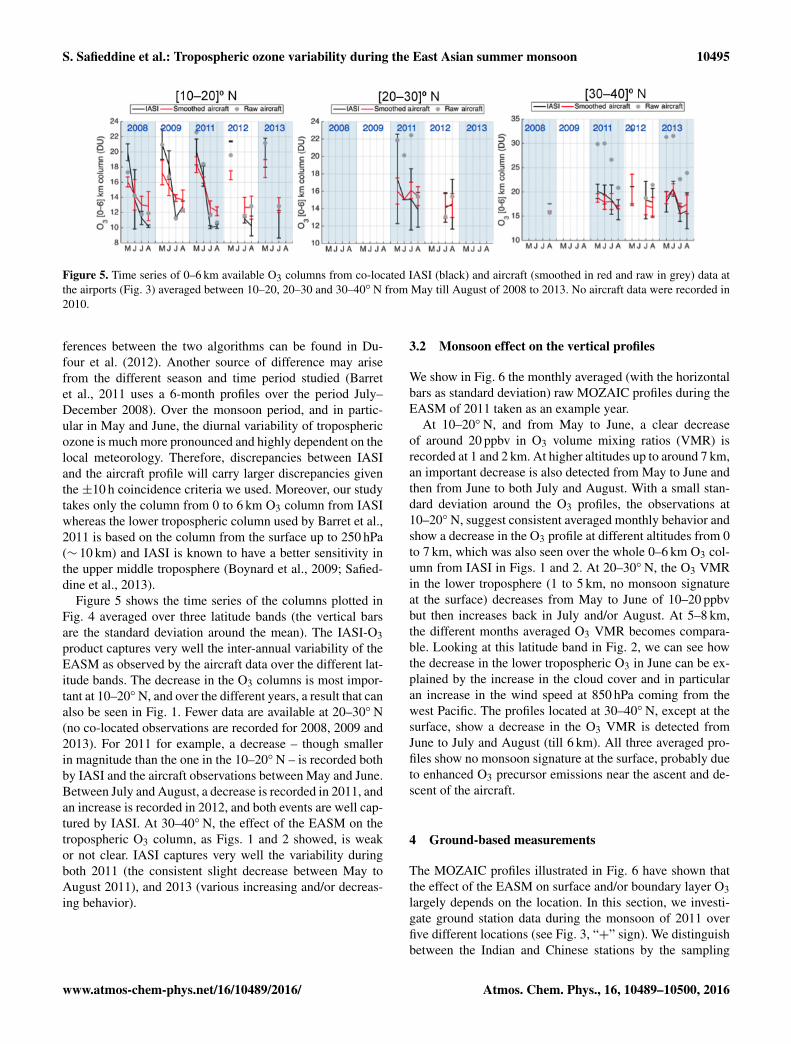
Figure 5. Time series of 0–6 km available O3 columns from co-located IASI (black) and aircraft (smoothed in red and raw in grey) data atthe airports (Fig. 3) averaged between 10–20, 20–30 and 30–40◦ N from May till August of 2008 to 2013. No aircraft data were recorded in2010.
ferences between the two algorithms can be found in Du-four et al. (2012). Another source of difference may arisefrom the different season and time period studied (Barretet al., 2011 uses a 6-month profiles over the period July–December 2008). Over the monsoon period, and in partic-ular in May and June, the diurnal variability of troposphericozone is much more pronounced and highly dependent on thelocal meteorology. Therefore, discrepancies between IASIand the aircraft profile will carry larger discrepancies giventhe ±10 h coincidence criteria we used. Moreover, our studytakes only the column from 0 to 6 km O3 column from IASIwhereas the lower tropospheric column used by Barret et al.,2011 is based on the column from the surface up to 250 hPa(∼ 10 km) and IASI is known to have a better sensitivity inthe upper middle troposphere (Boynard et al., 2009; Safied-dine et al., 2013).
Figure 5 shows the time series of the columns plotted inFig. 4 averaged over three latitude bands (the vertical barsare the standard deviation around the mean). The IASI-O3product captures very well the inter-annual variability of theEASM as observed by the aircraft data over the different lat-itude bands. The decrease in the O3 columns is most impor-tant at 10–20◦ N, and over the different years, a result that canalso be seen in Fig. 1. Fewer data are available at 20–30◦ N(no co-located observations are recorded for 2008, 2009 and2013). For 2011 for example, a decrease – though smallerin magnitude than the one in the 10–20◦ N – is recorded bothby IASI and the aircraft observations between May and June.Between July and August, a decrease is recorded in 2011, andan increase is recorded in 2012, and both events are well cap-tured by IASI. At 30–40◦ N, the effect of the EASM on thetropospheric O3 column, as Figs. 1 and 2 showed, is weakor not clear. IASI captures very well the variability duringboth 2011 (the consistent slight decrease between May toAugust 2011), and 2013 (various increasing and/or decreas-ing behavior).
3.2 Monsoon effect on the vertical profiles
We show in Fig. 6 the monthly averaged (with the horizontalbars as standard deviation) raw MOZAIC profiles during theEASM of 2011 taken as an example year.
At 10–20◦ N, and from May to June, a clear decreaseof around 20 ppbv in O3 volume mixing ratios (VMR) isrecorded at 1 and 2 km. At higher altitudes up to around 7 km,an important decrease is also detected from May to June andthen from June to both July and August. With a small stan-dard deviation around the O3 profiles, the observations at10–20◦ N, suggest consistent averaged monthly behavior andshow a decrease in the O3 profile at different altitudes from 0to 7 km, which was also seen over the whole 0–6 km O3 col-umn from IASI in Figs. 1 and 2. At 20–30◦ N, the O3 VMRin the lower troposphere (1 to 5 km, no monsoon signatureat the surface) decreases from May to June of 10–20 ppbvbut then increases back in July and/or August. At 5–8 km,the different months averaged O3 VMR becomes compara-ble. Looking at this latitude band in Fig. 2, we can see howthe decrease in the lower tropospheric O3 in June can be ex-plained by the increase in the cloud cover and in particularan increase in the wind speed at 850 hPa coming from thewest Pacific. The profiles located at 30–40◦ N, except at thesurface, show a decrease in the O3 VMR is detected fromJune to July and August (till 6 km). All three averaged pro-files show no monsoon signature at the surface, probably dueto enhanced O3 precursor emissions near the ascent and de-scent of the aircraft.
4 Ground-based measurements
The MOZAIC profiles illustrated in Fig. 6 have shown thatthe effect of the EASM on surface and/or boundary layer O3largely depends on the location. In this section, we investi-gate ground station data during the monsoon of 2011 overfive different locations (see Fig. 3, “+” sign). We distinguishbetween the Indian and Chinese stations by the sampling
www.atmos-chem-phys.net/16/10489/2016/ Atmos. Chem. Phys., 16, 10489–10500, 2016
10496 S. Safieddine et al.: Tropospheric ozone variability during the East Asian summer monsoon
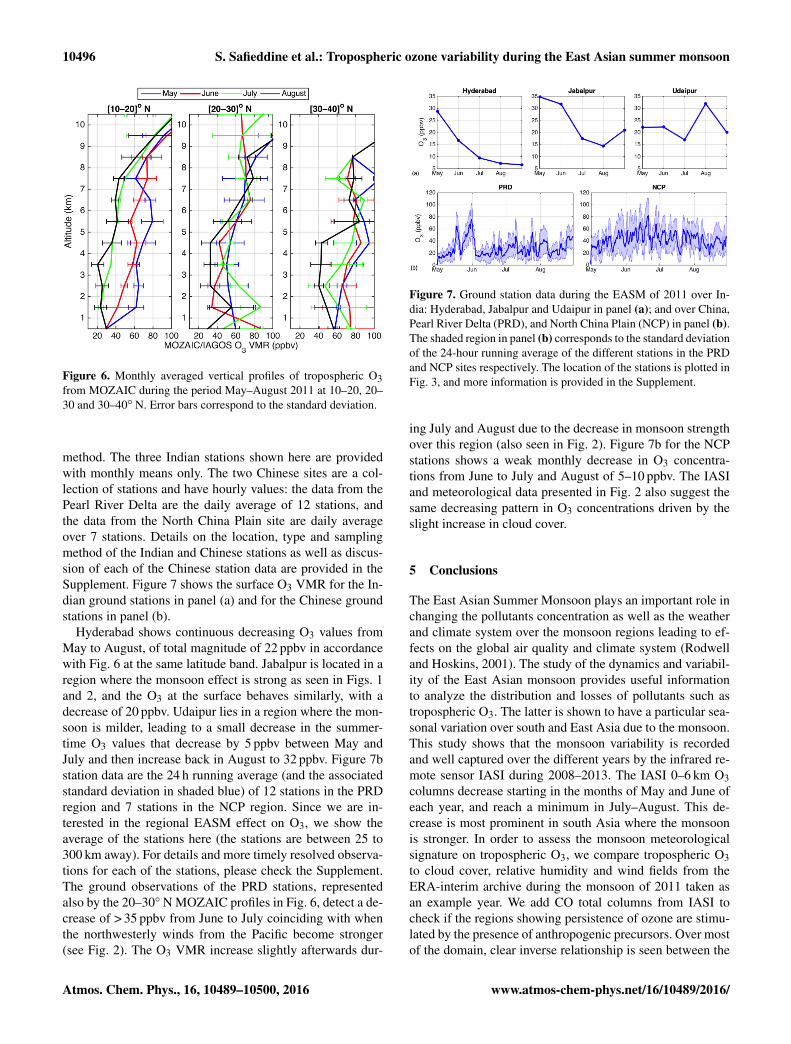
Figure 6. Monthly averaged vertical profiles of tropospheric O3from MOZAIC during the period May–August 2011 at 10–20, 20–30 and 30–40◦ N. Error bars correspond to the standard deviation.
method. The three Indian stations shown here are providedwith monthly means only. The two Chinese sites are a col-lection of stations and have hourly values: the data from thePearl River Delta are the daily average of 12 stations, andthe data from the North China Plain site are daily averageover 7 stations. Details on the location, type and samplingmethod of the Indian and Chinese stations as well as discus-sion of each of the Chinese station data are provided in theSupplement. Figure 7 shows the surface O3 VMR for the In-dian ground stations in panel (a) and for the Chinese groundstations in panel (b).
Hyderabad shows continuous decreasing O3 values fromMay to August, of total magnitude of 22 ppbv in accordancewith Fig. 6 at the same latitude band. Jabalpur is located in aregion where the monsoon effect is strong as seen in Figs. 1and 2, and the O3 at the surface behaves similarly, with adecrease of 20 ppbv. Udaipur lies in a region where the mon-soon is milder, leading to a small decrease in the summer-time O3 values that decrease by 5 ppbv between May andJuly and then increase back in August to 32 ppbv. Figure 7bstation data are the 24 h running average (and the associatedstandard deviation in shaded blue) of 12 stations in the PRDregion and 7 stations in the NCP region. Since we are in-terested in the regional EASM effect on O3, we show theaverage of the stations here (the stations are between 25 to300 km away). For details and more timely resolved observa-tions for each of the stations, please check the Supplement.The ground observations of the PRD stations, representedalso by the 20–30◦ N MOZAIC profiles in Fig. 6, detect a de-crease of > 35 ppbv from June to July coinciding with whenthe northwesterly winds from the Pacific become stronger(see Fig. 2). The O3 VMR increase slightly afterwards dur-
Figure 7. Ground station data during the EASM of 2011 over In-dia: Hyderabad, Jabalpur and Udaipur in panel (a); and over China,Pearl River Delta (PRD), and North China Plain (NCP) in panel (b).The shaded region in panel (b) corresponds to the standard deviationof the 24-hour running average of the different stations in the PRDand NCP sites respectively. The location of the stations is plotted inFig. 3, and more information is provided in the Supplement.
ing July and August due to the decrease in monsoon strengthover this region (also seen in Fig. 2). Figure 7b for the NCPstations shows a weak monthly decrease in O3 concentra-tions from June to July and August of 5–10 ppbv. The IASIand meteorological data presented in Fig. 2 also suggest thesame decreasing pattern in O3 concentrations driven by theslight increase in cloud cover.
5 Conclusions
The East Asian Summer Monsoon plays an important role inchanging the pollutants concentration as well as the weatherand climate system over the monsoon regions leading to ef-fects on the global air quality and climate system (Rodwelland Hoskins, 2001). The study of the dynamics and variabil-ity of the East Asian monsoon provides useful informationto analyze the distribution and losses of pollutants such astropospheric O3. The latter is shown to have a particular sea-sonal variation over south and East Asia due to the monsoon.This study shows that the monsoon variability is recordedand well captured over the different years by the infrared re-mote sensor IASI during 2008–2013. The IASI 0–6 km O3columns decrease starting in the months of May and June ofeach year, and reach a minimum in July–August. This de-crease is most prominent in south Asia where the monsoonis stronger. In order to assess the monsoon meteorologicalsignature on tropospheric O3, we compare tropospheric O3to cloud cover, relative humidity and wind fields from theERA-interim archive during the monsoon of 2011 taken asan example year. We add CO total columns from IASI tocheck if the regions showing persistence of ozone are stimu-lated by the presence of anthropogenic precursors. Over mostof the domain, clear inverse relationship is seen between the
Atmos. Chem. Phys., 16, 10489–10500, 2016 www.atmos-chem-phys.net/16/10489/2016/
S. Safieddine et al.: Tropospheric ozone variability during the East Asian summer monsoon 10497
IASI 0–6 km tropospheric O3 on one hand and cloud coverand winds on the other hand. This is explained by the factthat the high cloud cover that the monsoon generates, accom-panied with high relative humidity in the troposphere leadto a lower production rate since the photochemical activitywill be much lower and relative humidity is a sink of O3 inparticular in the background troposphere. On the other hand,the winds are also strong during the monsoon and O3 duringthis period can be transported either vertically, or horizon-tally to or from the Pacific and to the globe. Validation ofthe IASI-O3 columns with aircraft data shows a good cor-relation (r = 0.73, 12 %) between the 0–6 km columns fromIASI to that derived from 363 aircraft profiles. IASI is shownto reproduce very well the year-to-year variability in O3 seenby the aircraft data. A monsoon signature is detected on theO3 profiles over the different latitude bands of our studydomain that is in agreement with the IASI 0–6 km O3 col-umn spatial distribution. Ground station measurements of O3also show spatial dependence and are anti-correlated to theEASM strength. The stations in Central and North India aswell as in Pearl River Delta show a signature of the monsoonon ground O3 that can be explained by the change in meteo-rology over these regions. In northwest India, and the NorthChina plain, winds are weaker, and the cloud cover is smallerand thus the ground O3 shows a smaller decrease during theEASM.
More generally, this study shows that in case of no orscarce ground and aircraft measurements, satellite observa-tions, such as the one provided in this work using IASI, pro-vide valuable information that could help investigate the re-gional and global monsoon impact on the distribution of pol-lutants in the troposphere and in particular tropospheric O3.With IASI-C to be launched in 2018 onboard MetOp-C and anew series of three IASI-NG instruments on MetOp SecondGeneration Satellites around 2022 (Crevoisier et al., 2014),long-term IASI O3 time series obtained at high spatial reso-lution will be available to characterize and detect the onsetand the progression of the monsoon.
6 Data availability
The ETHER database (http://www.pole-ether.fr; Ether,2016) provides the IASI L1C data and L2 temperature data.MOZAIC/IAGOS data is available at http://www.iagos.org(IAGOS, 2016). Meteorological parameters used in thisstudy are extracted from the ECMWF Reanalysis archive(ERA-Interim, 2016) and are available at http://apps.ecmwf.int/archive-catalogue/. Station data used are available bycontacting the first author ([email protected]).
The Supplement related to this article is available onlineat doi:10.5194/acp-16-10489-2016-supplement.
Acknowledgements. IASI is a joint mission of EUMETSAT andthe Centre National d’Etudes Spatiales (CNES, France). The IASIL1 data are distributed in near real time by EUMETSAT throughthe EumetCast system distribution. MOZAIC is presently fundedby INSU-CNRS (France), Météo-France, Université Paul Sabatier(Toulouse, France) and Research Center Jülich (FZJ, Jülich,Germany). IAGOS has been and is additionally funded by the EUprojects IAGOS-DS and IAGOS-ERI. The authors acknowledgethe strong support of the European Commission, Airbus, andthe Airlines (Lufthansa, Air-France, Austrian, Air Namibia,Cathay Pacific, Iberia and China Airlines so far) who carry theMOZAIC or IAGOS equipment and perform the maintenancesince 1994. The authors are grateful to the ETHER database(http://www.pole-ether.fr) for providing the IASI L1C data andL2 temperature data. This study was carried out in the frameworkof the “East Asian Monsoon and air quality” project, which isa part of the DRAGON program (http://dragon3.esa.int), theEU-FP7 PANDA project (http://www.marcopolo-panda.eu/), theEUMETSAT O3M-SAF project, and the ESA O3 Climate ChangeInitiative (O3-CCI). The French scientists are grateful to CNES andCentre National de la Recherche Scientifique (CNRS) for financialsupport. The research in Belgium is funded by the Belgian StateFederal Office for Scientific, Technical and Cultural Affairs and theEuropean Space Agency (ESA Prodex arrangement). P. F. Coheuris Senior Research Associate with F.R.S-FNRS.
Edited by: P. MonksReviewed by: four anonymous referees
References
Akimoto, H.: Global air quality and pollution, Science, 302, 1717–1719, 2003.
Barret, B., Le Flochmoen, E., Sauvage, B., Pavelin, E., Matricardi,M., and Cammas, J. P.: The detection of post-monsoon tropo-spheric ozone variability over south Asia using IASI data, At-mos. Chem. Phys., 11, 9533–9548, doi:10.5194/acp-11-9533-2011, 2011.
Boynard, A., Clerbaux, C., Coheur, P.-F., Hurtmans, D., Tur-quety, S., George, M., Hadji-Lazaro, J., Keim, C., and Meyer-Arnek, J.: Measurements of total and tropospheric ozone fromIASI: comparison with correlative satellite, ground-based andozonesonde observations, Atmos. Chem. Phys., 9, 6255–6271,doi:10.5194/acp-9-6255-2009, 2009.
Boynard, A., Hurtmans, D., Koukouli, M. E., Goutail, F., Bureau,J., Safieddine, S., Lerot, C., Hadji-Lazaro, J., Pommereau, J.-P.,Pazmino, A., Zyrichidou, I., Balis, D., Barbe, A., Mikhailenko, S.N., Loyola, D., Valks, P., Van Roozendael, M., Coheur, P.-F., andClerbaux, C.: Seven years of IASI ozone retrievals from FORLI:validation with independent total column and vertical profilemeasurements, Atmos. Meas. Tech. Discuss., doi:10.5194/amt-2016-11, in review, 2016.
Chan, L. Y., Liu, H. Y., Lam, K. S., Wang, T., Oltmans, S. J.,and Harris, J. M.: Analysis of the seasonal behavior of tropo-spheric ozone at Hong Kong, Atmos. Environ., 32, 159–168,doi:10.1016/S1352-2310(97)00320-8, 1998.
Chou, C. C.-K., Tsai, C.-Y., Chang, C.-C., Lin, P.-H., Liu, S. C., andZhu, T.: Photochemical production of ozone in Beijing during
www.atmos-chem-phys.net/16/10489/2016/ Atmos. Chem. Phys., 16, 10489–10500, 2016
10498 S. Safieddine et al.: Tropospheric ozone variability during the East Asian summer monsoon
the 2008 Olympic Games, Atmos. Chem. Phys., 11, 9825–9837,doi:10.5194/acp-11-9825-2011, 2011.
Clarisse, L., R’Honi, Y., Coheur, P. F., Hurtmans, D., and Clerbaux,C.: Thermal infrared nadir observations of 24 atmospheric gases,Geophys. Res. Lett., 38, L10802, doi:10.1029/2011GL047271,2011.
Clerbaux, C., Boynard, A., Clarisse, L., George, M., Hadji-Lazaro,J., Herbin, H., Hurtmans, D., Pommier, M., Razavi, A., Turquety,S., Wespes, C., and Coheur, P.-F.: Monitoring of atmosphericcomposition using the thermal infrared IASI/MetOp sounder, At-mos. Chem. Phys., 9, 6041–6054, doi:10.5194/acp-9-6041-2009,2009.
Coheur, P.-F., Clarisse, L., Turquety, S., Hurtmans, D., and Cler-baux, C.: IASI measurements of reactive trace species inbiomass burning plumes, Atmos. Chem. Phys., 9, 5655–5667,doi:10.5194/acp-9-5655-2009, 2009.
Cooper, O. R., Parrish, D. D., Ziemke, J., Balashov, N. V., Cu-peiro, M., Galbally, I. E., Gilge, S., Horowitz, L., Jensen, N. R.,Lamarque, J.-F., Naik, V., Oltmans, S. J., Schwab, J., Shindell,D. T., Thompson, A. M., Thouret, V., Wang, Y., and Zbinden,R. M.: Global distribution and trends of tropospheric ozone:An observation-based review, Elem. Sci. Anthr., 2, 000029,doi:10.12952/journal.elementa.000029, 2014.
Crevoisier, C., Clerbaux, C., Guidard, V., Phulpin, T., Armante,R., Barret, B., Camy-Peyret, C., Chaboureau, J.-P., Coheur, P.-F., Crépeau, L., Dufour, G., Labonnote, L., Lavanant, L., Hadji-Lazaro, J., Herbin, H., Jacquinet-Husson, N., Payan, S., Péquig-not, E., Pierangelo, C., Sellitto, P., and Stubenrauch, C.: TowardsIASI-New Generation (IASI-NG): impact of improved spectralresolution and radiometric noise on the retrieval of thermody-namic, chemistry and climate variables, Atmos. Meas. Tech., 7,4367–4385, doi:10.5194/amt-7-4367-2014, 2014.
Dee, D. P., Uppala, S. M., Simmons, A. J., Berrisford, P., Poli,P., Kobayashi, S., Andrae, U., Balmaseda, M. A., Balsamo, G.,Bauer, P., Bechtold, P., Beljaars, A. C. M., van de Berg, L., Bid-lot, J., Bormann, N., Delsol, C., Dragani, R., Fuentes, M., Geer,A. J., Haimberger, L., Healy, S. B., Hersbach, H., Holm, E. V,Isaksen, L., Kallberg, P., Kohler, M., Matricardi, M., McNally,A. P., Monge-Sanz, B. M., Morcrette, J.-J., Park, B.-K., Peubey,C., de Rosnay, P., Tavolato, C., Thepaut, J.-N., and Vitart, F.: TheERA-Interim reanalysis: configuration and performance of thedata assimilation system, Q. J. Roy. Meteor. Soc., 137, 553–597,doi:10.1002/qj.828, 2011.
Ding, A. J., Wang, T., Thouret, V., Cammas, J.-P., and Nédélec, P.:Tropospheric ozone climatology over Beijing: analysis of aircraftdata from the MOZAIC program, Atmos. Chem. Phys., 8, 1–13,doi:10.5194/acp-8-1-2008, 2008.
Ding, A. J., Fu, C. B., Yang, X. Q., Sun, J. N., Zheng, L. F., Xie,Y. N., Herrmann, E., Nie, W., Petäjä, T., Kerminen, V.-M., andKulmala, M.: Ozone and fine particle in the western YangtzeRiver Delta: an overview of 1 yr data at the SORPES station,Atmos. Chem. Phys., 13, 5813–5830, doi:10.5194/acp-13-5813-2013, 2013.
Dufour, G., Eremenko, M., Orphal, J., and Flaud, J.-M.: IASIobservations of seasonal and day-to-day variations of tropo-spheric ozone over three highly populated areas of China: Bei-jing, Shanghai, and Hong Kong, Atmos. Chem. Phys., 10, 3787–3801, doi:10.5194/acp-10-3787-2010, 2010.
Dufour, G., Eremenko, M., Griesfeller, A., Barret, B.,LeFlochmoën, E., Clerbaux, C., Hadji-Lazaro, J., Coheur,P.-F., and Hurtmans, D.: Validation of three different scientificozone products retrieved from IASI spectra using ozonesondes,Atmos. Meas. Tech., 5, 611–630, doi:10.5194/amt-5-611-2012,2012.
Dufour, G., Eremenko, M., Cuesta, J., Doche, C., Foret, G., Beek-mann, M., Cheiney, A., Wang, Y., Cai, Z., Liu, Y., Takigawa,M., Kanaya, Y., and Flaud, J.-M.: Springtime daily variationsin lower-tropospheric ozone over east Asia: the role of cy-clonic activity and pollution as observed from space with IASI,Atmos. Chem. Phys., 15, 10839–10856, doi:10.5194/acp-15-10839-2015, 2015.
Edwards, D. P., Emmons, L. K., Hauglustaine, D. A., Chu, A., Gille,J. C., Kaufman, Y. J., P’etron, G., Yurganov, L. N., Giglio, L.,Deeter, M. N., Yudin, V., Ziskin, D. C.,Warner, J., Lamarque, J.-F., Francis, G. L., Ho, S. P., Mao, D., Chan, J., and Drummond,J. R.: Observations of Carbon Monoxide and Aerosol From theTerra Satellite: Northern Hemisphere Variability, J. Geophys.Res.-Atmos., 109, D24202, doi:10.1029/2004JD004727, 2004.
ERA-interim: ECMWF ReAnalysis, The European Centre forMedium-Range Weather Forecasts (ECMWF), available at:http://apps.ecmwf.int/archive-catalogue/, last access: 16 August2016.
Ether: IASI L1C data and L2 temperature data, Institut Pierre SimonLaplace (France), Centre National de la Recherche Scientifique(CNRS, France), Centre national d’études spatiales, available at:http://www.pole-ether.fr, last access: 16 August 2016.
Fadnavis, S., Semeniuk, K., Pozzoli, L., Schultz, M. G., Ghude,S. D., Das, S., and Kakatkar, R.: Transport of aerosols into theUTLS and their impact on the Asian monsoon region as seen ina global model simulation, Atmos. Chem. Phys., 13, 8771–8786,doi:10.5194/acp-13-8771-2013, 2013.
Fadnavis, S., Semeniuk, K., Schultz, M. G., Kiefer, M., Maha-jan, A., Pozzoli, L., and Sonbawane, S.: Transport pathwaysof peroxyacetyl nitrate in the upper troposphere and lowerstratosphere from different monsoon systems during the sum-mer monsoon season, Atmos. Chem. Phys., 15, 11477–11499,doi:10.5194/acp-15-11477-2015, 2015.
Hurtmans, D., Coheur, P. F., Wespes, C., Clarisse, L., Scharf,O., Clerbaux, C., Hadji-Lazaro, J., George, M., and Tur-quety, S.: FORLI radiative transfer and retrieval codefor IASI, J. Quant. Spectrosc. Ra., 113, 1391–1408,doi:10.1016/j.jqsrt.2012.02.036, 2012.
IAGOS: European In-service Aircraft for a Global Observing Sys-tem program, Centre National de la Recherche Scientifique(CNRS, France), Forschungszentrum Jülich, the Sixth ResearchFramework Programme (FP6), available at: http://www.iagos.org, last access: 16 August 2016.
Lal, D. M., Sachin, D. G., Patil, S. D., Kulkarni, S. H., Jena, C., Ti-wari, S., and Srivastava, M. K.: Tropospheric ozone and aerosollong-term trends over the Indo-Gangetic Plain (IGP), India, J.Atmos. Res., 116, 82–92, doi:10.1016/j.atmosres.2012.02.014,2012.
Lam, K. S., Wang, T. J., Chan, L. Y., Wang, T., and Harris, J.:Flow patterns influencing the seasonal behavior of surface ozoneand carbon monoxide at a coastal site near Hong Kong, Atmos.Environ., 35, 3121–3135, doi:10.1016/S1352-2310(00)00559-8,2001.
Atmos. Chem. Phys., 16, 10489–10500, 2016 www.atmos-chem-phys.net/16/10489/2016/
S. Safieddine et al.: Tropospheric ozone variability during the East Asian summer monsoon 10499
Lawrence, M. G. and Lelieveld, J.: Atmospheric pollutant outflowfrom southern Asia: a review, Atmos. Chem. Phys., 10, 11017–11096, doi:10.5194/acp-10-11017-2010, 2010.
Li, Y., Wang, W., Kan, H., Xu, X., and Chen, B.: Air quality andoutpatient visits for asthma in adults during the 2008 summerOlympic Games in Beijing, Sci. Total Environ., 408, 1226–1227,2009.
Marenco, A., Thouret, V., Nédélec, P., Smit, H., Helten, M., Kley,D., Karcher, F., Simon, P., Law, K., Pyle, J., Poschmann, G.,Von Wrede, R., Hume, C., and Cook, T.: Measurement of ozoneand water vapor by Airbus in-service aircraft: The MOZAICairborne program, an overview, J. Geophys. Res., 103, 25631,doi:10.1029/98JD00977, 1998.
McMillan, W. W., Pierce, R., Sparling, L. C., Osterman, G., Mc-Cann, K., Fischer, M. L., Rappenglueck, B., Newton, R., Turner,D. D., Kittaka, C., Evans, K., Biraud, S., Lefer, B., Andrews,A., and Oltmans, S.: An Observational and modeling strategy toinvestigate the impact of remote sources on local air quality: AHouston, Texas case study from TEXAQS II, J. Geophys. Res.-Atmos., 115, D01301, doi:10.1029/2009JD011973, 2010.
McPeters, R. D., Labow, G. J., and Logan, J. A.: Ozone climatolog-ical profiles for satellite retrieval algorithms, J. Geophys. Res.-Atmos., 112, D05308, doi:10.1029/2005JD006823, 2007.
Nedelec, P., Blot, R., Boulanger, D., Athier, G., Cousin, J.-M.,Gautron, B., Petzold, A., Volz-Thomas, A., and Thouret, V.: In-strumentation on commercial aircraft for monitoring the atmo-spheric composition on a global scale: the IAGOS system, tech-nical overview of ozone and carbon monoxide measurements,Tellus B, 67, 27791, doi:10.3402/tellusb.v67.27791, 2015.
Ohara, T., Akimoto, H., Kurokawa, J., Horii, N., Yamaji, K., Yan,X., and Hayasaka, T.: An Asian emission inventory of an-thropogenic emission sources for the period 1980–2020, At-mos. Chem. Phys., 7, 4419–4444, doi:10.5194/acp-7-4419-2007,2007.
Parthasarathy, B., Munot, A. A., and Kothawale, D. R.: All-Indiamonthly and seasonal rainfall series: 1871–1993, Theor. Appl.Climatol., 49, 217–224, doi:10.1007/BF00867461, 1994.
Randel, W. J., Park, M., Emmons, L., Kinnison, D., Bernath, P.,Walker, K. A., Boone, C., and Pumphrey, H.: Asian monsoontransport of pollution to the stratosphere, Science, 328, 611–613,doi:10.1126/science.1182274, 2010.
Richter, A., Burrows, J. P., Nu, H., Granier, C., and Niemeier, U.:Increase in tropospheric nitrogen dioxide over China observedfrom space, Nature, 437, 129–132, doi:10.1038/nature04092,2005.
Richter, A., Hilboll, A., and Burrows J. P.: Revisiting satellite de-rived tropospheric NO2 trends, Poster presentation submitted tothe EGU meeting, Vienna, Austria, 12–17 April 2015, avail-able at: http://presentations.copernicus.org/EGU2015-10674_presentation.pdf (last access: 16 August 2016), 2015.
Rodgers, C.: Inverse Methods for Atmospheric Sounding: The-ory and Practice, Series on Atmospheric, Oceanic and PlanetaryPhysics, vol. 2, World Scientific, Hackensack, Singapore, 2000.
Rodwell, M. J. and Hoskins, B. J.: Subtropical anticyclones andsummer monsoons, J. Climate, 14, 3192–3211, 2001.
Safieddine, S., Clerbaux, C., George, M., Hadji-Lazaro, J., Hurt-mans, D., Coheur, P. F., Wespes, C., Loyola, D., Valks, P., andHao, N.: Tropospheric ozone and nitrogen dioxide measurementsin urban and rural regions as seen by IASI and GOME-2, J. Geo-
phys. Res.-Atmos., 118, 10555–10566, doi:10.1002/jgrd.50669,2013.
Safieddine, S., Boynard, A., Coheur, P.-F., Hurtmans, D., Pfis-ter, G., Quennehen, B., Thomas, J. L., Raut, J.-C., Law, K. S.,Klimont, Z., Hadji-Lazaro, J., George, M., and Clerbaux, C.:Summertime tropospheric ozone assessment over the Mediter-ranean region using the thermal infrared IASI/MetOp sounderand the WRF-Chem model, Atmos. Chem. Phys., 14, 10119–10131, doi:10.5194/acp-14-10119-2014, 2014.
Thouret, V., Marenco, A., Sabatier, P., Logan, J. A., Ndec, P.,Grouhel, C., and Sabatier, P.: Comparisons of ozone measure-ments from the MOZAIC airborne program and the ozone sound-ing network at eight locations, J. Geophys. Res., 103, 25695–25720, doi:10.1029/98JD02243, 1998.
United Nations Environment Programme: Independent environ-mental assessment: Beijing 2008 Olympic Games, ISBN 978-92-807-2888-0, Nairobi, Kenya, 2009.
Van der A, R. J., Eskes, H. J., Boersma, K. F., van Noije, T.P. C., Van Roozendael, M., De Smedt, I., Peters, D. H. M.U., and Meijer, E. W.: Trends, seasonal variability and dom-inant NOx source derived from a ten year record of NO2measured from space, J. Geophys. Res.-Atmos., 113, D04302,doi:10.1029/2007JD009021, 2008.
Wang, B. and Fan, Z.: Choice of South Asian summer monsoonindices, B. Am. Meteorol. Soc., 80, 629–638, 1999.
Wang, B., Ding, Q., and Joseph, P. V: Objective definition ofthe Indian summer monsoon onset, J. Climate, 22, 3303–3316,doi:10.1175/2008JCLI2675.1, 2009.
Wang, T. and Xie, S.: Assessment of traffic-related air pollution inthe urban streets before and during the 2008 Beijing OlympicGames traffic control period, Atmos. Environ., 43, 5682–5690,doi:10.1016/j.atmosenv.2009.07.034, 2009.
Wang, T., Wei, X. L., Ding, A. J., Poon, C. N., Lam, K. S., Li, Y. S.,Chan, L. Y., and Anson, M.: Increasing surface ozone concen-trations in the background atmosphere of Southern China, 1994–2007, Atmos. Chem. Phys., 9, 6217–6227, doi:10.5194/acp-9-6217-2009, 2009.
Wang, T., Nie, W., Gao, J., Xue, L. K., Gao, X. M., Wang, X. F., Qiu,J., Poon, C. N., Meinardi, S., Blake, D., Wang, S. L., Ding, A. J.,Chai, F. H., Zhang, Q. Z., and Wang, W. X.: Air quality duringthe 2008 Beijing Olympics: secondary pollutants and regionalimpact, Atmos. Chem. Phys., 10, 7603–7615, doi:10.5194/acp-10-7603-2010, 2010.
Wang, Y., McElroy, M. B., Munger, J. W., Hao, J., Ma, H., Nielsen,C. P., and Chen, Y.: Variations of O3 and CO in summertimeat a rural site near Beijing, Atmos. Chem. Phys., 8, 6355–6363,doi:10.5194/acp-8-6355-2008, 2008.
Wang, Y., Hao, J., McElroy, M. B., Munger, J. W., Ma, H., Chen,D., and Nielsen, C. P.: Ozone air quality during the 2008 BeijingOlympics: effectiveness of emission restrictions, Atmos. Chem.Phys., 9, 5237–5251, doi:10.5194/acp-9-5237-2009, 2009.
Worden, J., Jones, D. B. A., Liu, J., Parrington, M., Bow-man, K., Stajner, I., Beer, R., Jiang, J., Thouret, V., Kulawik,S., Li, J.-L. F., Verma, S., and Worden, H.: Observed verti-cal distribution of tropospheric ozone during the Asian sum-mertime monsoon, J. Geophys. Res.-Atmos., 114, D13304,doi:10.1029/2008JD010560, 2009.
Xu, X., Lin, W., Wang, T., Yan, P., Tang, J., Meng, Z., and Wang,Y.: Long-term trend of surface ozone at a regional background
www.atmos-chem-phys.net/16/10489/2016/ Atmos. Chem. Phys., 16, 10489–10500, 2016

10500 S. Safieddine et al.: Tropospheric ozone variability during the East Asian summer monsoon
station in eastern China 1991–2006: enhanced variability, At-mos. Chem. Phys., 8, 2595–2607, doi:10.5194/acp-8-2595-2008,2008.
Yang, S. and Lau, K.-M.: Influences of Sea Surface Temperatureand Ground Wetness on Asian Summer Monsoon, J. Climate,11, 3230–3246, 1998.
Yang, Y., Liao, H., and Li, J.: Impacts of the East Asian sum-mer monsoon on interannual variations of summertime surface-layer ozone concentrations over China, Atmos. Chem. Phys., 14,6867–6879, doi:10.5194/acp-14-6867-2014, 2014.
Zhao, C., Wang, Y., Yang, Q., Fu, R., Cunnold, D., and Choi, Y.:Impact of East Asian summer monsoon on the air quality overChina: View from space, J. Geophys. Res.-Atmos., 115, D09301,doi:10.1029/2009JD012745, 2010.
Zhou, D., Ding, A., Mao, H., Fu, C., Wang, T., Chan, L. Y., Ding,K., Zhang, Y., Liu, J., Lu, A., and Hao, N.: Impacts of theEast Asian monsoon on lower tropospheric ozone over coastalSouth China, Environ. Res. Lett., 8, 44011, doi:10.1088/1748-9326/8/4/044011, 2013.
Atmos. Chem. Phys., 16, 10489–10500, 2016 www.atmos-chem-phys.net/16/10489/2016/