tropopause height and solar activity
TRANSCRIPT
Tellus (1979), 31,515-520
Tropopause height and solar activity
By MITA RAJARAM, B. P. SINGH, Indian Institute of Geomagnetism, Colaba, Bombay 400 005, India, and H. V. GUPTA, Regional Meteorological Centre, Colaba, Bombay 400 005, India
(Manuscript received May 9, 1978; in final form June 28, 1979)
ABSTRACT The variations in tropopause height with sunspot activity for 11 Indian stations have been studied for the period 1960 to 1972. The annual mean tropopause heights were plotted against Zurich sunspot numbers. The plots show clear latitudinal dependence in height variations. We calculated the correlation coefficients between tropopause height and sunspot numbers for lags varying from 0 to 5 years. The correlation coefficients for lag = 0 and lag = 3 exhibit entirely different latitudinal dependence. The largest negative correlatidn for mid-latitudes and an insignificant correlation for equatorial regions is found with lag = 0; whereas, for a lag of 3 years, the largest negative correlation is seen in the equatorial region with insignificant correlation for mid latitudes. This study shows that in low latitudes both the particle and electromagnetic part of the solar radiation cause changes in atmospheric circulation. Differences in sign of correlation coefficients between Indian and American regions suggest strong longitudinal dependence of sdar-meteorological relationships'
1. Introduction
A major difticulty of investigating solar radia- tion changes relevant to s.t.p.-meteorology is that it is not yet known whether solar phenomena influ- ence the troposphere through changes in the e.m. radiation, solar particle flux or modulations by the solar wind of the galactic cosmic ray flux. Investi- gations using daily values of different types of solar emission and atmospheric circulation are needed to resolve this problem but suitable solar data are cur- rently not available. A great deal of research has been undertaken in this field, the results of which are not exactly in conformity with each other. Variations of several meteordlogical parameters with sunspot activity have been studied. However, no uniform picture emerges when a global study is undertaken. This suggests that a regional study would prove to be more informative.
In the 1 1-year solar cycle, the EUV and particle radiations do not follow the sunspot number in a systematic pattern. To be able to identify the rela- tive importance of the EUV and particle radiation in modifying any meteorological parameter, it is of paramount importance to be able to isolate events of solar origin pertaining to maximum solar EUV emission and maximum solar particle emission. It is well established that the geomagnetic field is most
disturbed on the declining phase of the sunspot activity. It is the particle emission from the sun which controls the geomagnetic vqriations, Hence, not only could the correlation coefficient of a meteorological parameter directly with the sunspot number be used as an index to identify the mechanisms of solar terrestrial interactions, but also its correlation at a phase lag of a few years.
Schuurmanns and Oort (1969) havc s tudid changes in height of several constgpt pressure levels in the troposphere and lower stratosphere after streng solar flares, ip the northern hemi- sphere, north of 10°N. They say that it appear8 more likely that the atmospheric reaction patterns can be attributed to very energetic solar particles rather than ephanced U.V. radiation. In their study they found that the maximum response occurs near the tropopause. Hence in our analysis we have limited ourselves to study the variations of tropo- pause level with sunspot activity. Studies by Ramkrishna and Seshamani (1973) and Reddy and Rao (1977) indicate that various atmospheric effects are carried by day-today variations in salar electro-magnetic emissions. Thus particle and electro-magnetic radiations of solar origin seem to show different effects depending upon the region under consideration; marked latitudinal depen- dence also seems to exist.
Tellus 3 1 (l979),6 0040-2826/79/0605 15-06%02.50/0 0 1979 Munksgaard. Copenhagen
516 M. RAJARAM, B. P. SINGH AND H. V. GUPTA
An analysis carried out by Cole (1975) for 11 Pacific and Caribbean stations shows that the largest variation in tropopause height with sunspot activity occurs near the equator and the correla- tion coefficient seems to have a geometry related to the geomagnetic field of the earth. We have carried out a similar analysis to study the effects of solar activity in the Indian region up to 28' N.
2. Data and analysis
In the present analysis radio sonde data pub- lished by the India Meteorological Department are used. The tropopause is defined according to the WMO code F N 35 for upper wind data. The 'first tropopause' is defined as the lowest level at which the temperature lapse rate decreases to 2 O C/km or less, provided also the average lapse rate between this level and all higher levels within 2 km does not exceed 2OC/km. Both the tephigram and the height-pressure curves are used to ascertain the lapse rates of different layers in the vicinity of the tropopause. If above the first tropopause the average lapse rate between any level and all higher levels within 1 km exceeds 3 OC/km, then a second tropopause is defined as above. This tropopause may be either within, or above, the 1-km layer. This second tropopause has been used in the present analysis. The tropopause heights are measured in geopotential metres (GPM). Annual mean of the 00 GMT and 12 GMT tropopause heights are used to take care of both the diurnal and seasonal varia- tions.
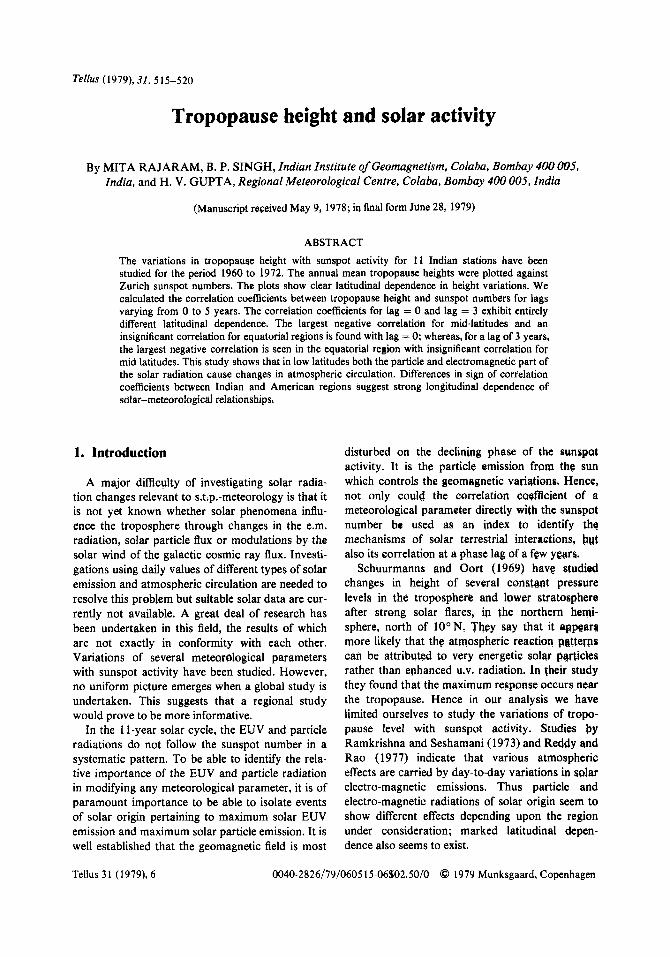
We have used tropopause heights from 11 Indian stations during the period 1960-1972 as only after 1960 could we obtain adequate coverage of stations. The stations used in this analysis are: Delhi, Gauhati, Ahmedabad, Calcutta, Nagpur, Bombay, Vishakapatnam, Bangalore, Madras, Port Blair and Trivandrum. A plot of the annual tropo- pause levels for the various stations during the period 1960-1972 is given in Fig. 1. The stations are plotted in an increasing order of latitude. The maximum variation in tropopause height is of the order of 1 km in 16 km at Delhi. In the same figure a plot of the annual Zurich sunspot number from 1960 to 1972 is given. From the figure it is evident that for stations above Vishakapatnam, tropo- pause height decreases with increase in solar activity, though for the equatorial region no signifi-
SUNSPOT NWWR
25 0
17500 - 16wo[ DELHl
E - GAUHATI
15500
17500
16500
15500
17500 r
16500 1 15500 ::::: [ AHMEOABAD
15500
17500 r 16500 /-r 15500 1 17500 r
16500 1 BOMBAV
15500 ' :":' 1 VISHAIAPATNAM
15500 t
:::I,"[ BANGALORE
15500 ' 16500 r MADRAS
15500 t 16500 15500 F 7 PORT-BLAIR
16500 [ 1RIVANDRUU
15500 , , I I ,
60 62 6& 66 68 70 7 1
YEARS
1. Trooooause levels during the period 1960-1972 . . - . and Zurich sunspot numbers (topmost) during the same period.
cant variation in tropopause height is associated with solar activity.
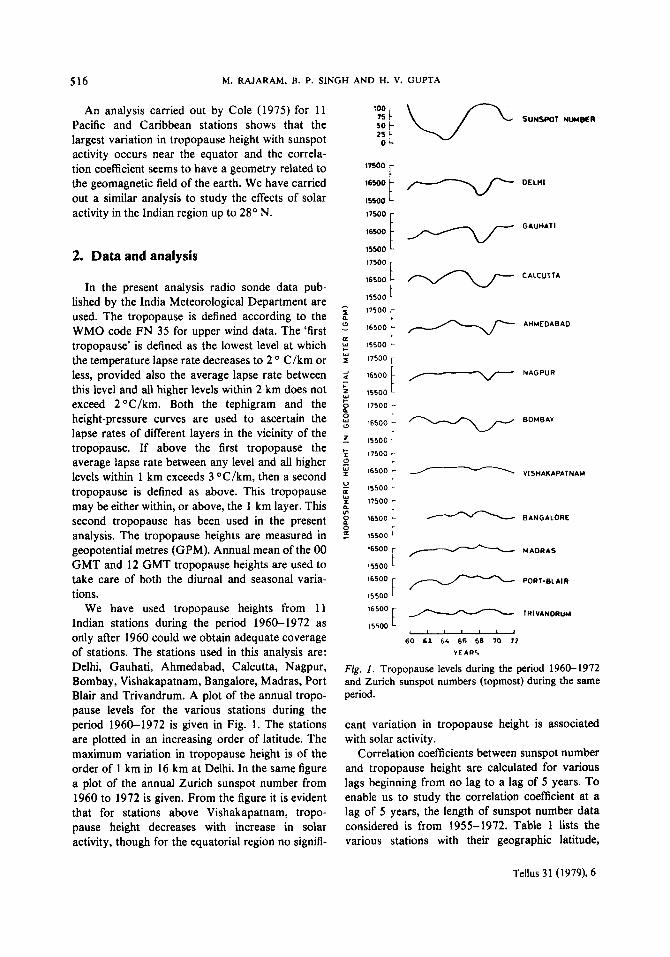
Correlation coefficients between sunspot number and tropopause height are calculated for various lags beginning from no lag to a lag of 5 years. To enable us to study the correlation coefficient at a lag of 5 years, the length of sunspot number data considered is from 1955-1972. Table 1 lists the various stations with their geographic latitude,
Tellus 31 (1979), 6
Tab
le 1
. Co
rrel
atio
n co
efic
ient
bet
ween
ann
ual t
ropo
paus
e he
ight
and
suns
pot n
umbe
rs fo
r va
rious
lags
for I1
stat
ions
. The
geog
raph
ic la
titud
e an
d lo
ngitu
de a
nd t
he g
eom
agne
tic l
atitu
de o
f ea
ch s
tatio
n ar
e lis
ted.
Coe
ficie
nts
unde
rline
d on
ce a
re v
alid
at
the
95%
lev
el a
nd t
hose
un
derli
ned t
wice
at t
he 9
9% le
vel
2 $ 2 3
Geo
grap
hic
Deg
rees
C
orre
latio
n coe
ffic
ient
s at
? N
ame
of
Geo
mag
netic
of
m
st
atio
n La
titud
e Lo
ngitu
de
Latit
ude
free
dom
L
ag=
O
Lag
= 1
L
ag=
2
Lag
=3
L
ag=
4
Lag
=5
ii
Del
hi
Gau
hati
Ahm
edab
ad
Cal
cutta
N
agpu
r B
omba
y V
isha
kapa
tnam
B
anga
lore
M
adra
s Port B
lair
Triv
andr
um
28.6
" N
26
.0"
N
23.0
" N
22
.5"
N
21.1
"N
19.0
" N
17
.66"
N
13.0
" N
13
.0°
N
11.8
3" N
8.
4" N
77.1
"E
91.9
"E
72.7
" E
88.4
" E
79.0
"E
73.0
"E
83.3
"E
77.6
" E
80.3
" E
92.5
" E
77.0
"E
16.1
2" N
14
.81"
N
13.6
6" N
11
.64"
N
11.1
1" N
9.
66"
N
7.23
" N
3.
17"N
2.9
O N
0.7
2O N
1.
35O
S
11
11
11
11
11
11
11 9 11
11
11
-0.5
96
-0.2
8 1
-0.3
50
-0.3
94
-0.3
33
-0.3
79
-0.2
74
+0.1
99
+0.0
04
+0.1
16
+0.0
09
-0.4
87
-0.4
28
-0.4
49
-0.4
3 1
-0.5
50
-0.1
82
-0.5
80
-0.0
87
-0.4
35
-0.4
07
-0.2
89
-0.1
83
-0.2
4 1
-0.4
14
-0
.207
-0
.526
-0
.2
1 1
-0.7
1 1
-0.4
89
-0.6
65
-0.6
33
-0.3
12
+0.0
62
+0.2
34
-0.1
00
-0.0
23
-0.3
18
-0.2
01
-0.0
64
+O.O 1
1 -0
.368
-0
.139
+0
.470
+0
.558
-0
.615
-0
.432
=Q
&U
-0
.675
-0
.707
-0
.554
-0
.696
-0
.647
-0
.3
14
-0.2
80
-
+0.3
84
5 +0
.044
5
+0.0
92
+0.1
89
p +0
.410
5
+0.0
29
> -0
.427
2
-0.2
91
3
+0.0
69
>
-0.1
32
5
-0.0
09
518 M. RAJARAM, B. P. SINGH AND H. V. GUPTA
4 -
2 -
longitude and geomagnetic latitude. The calculated correlation coefficient at various lags is also listed. From the table it is clear that for most of the stations for a lag of more than 3 years the correla- tion coefficient decreases. Depending upon the significance level, the correlation coefficients are underlined. Coefficients underlined once are valid at the 95% level and those underlined twice at the 99% level. It is interesting to note that at zero lag only Delhi attains the 95% significance level; whilst for a lag of 3 years, 4 stations out of 11 are valid at the 95% significance level. In fact Madras and Port Blair attain the 99% level.
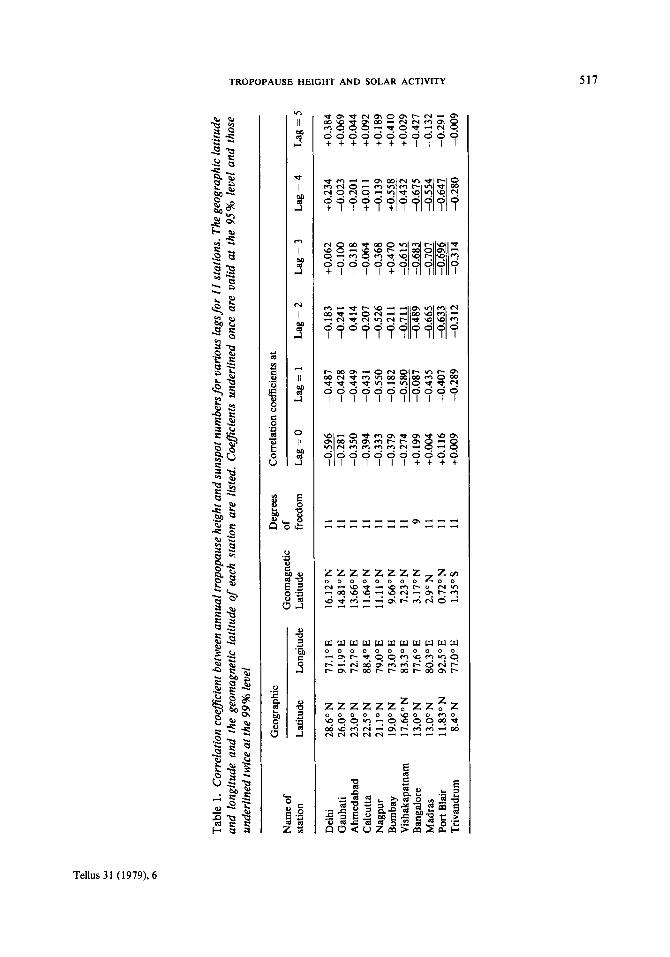
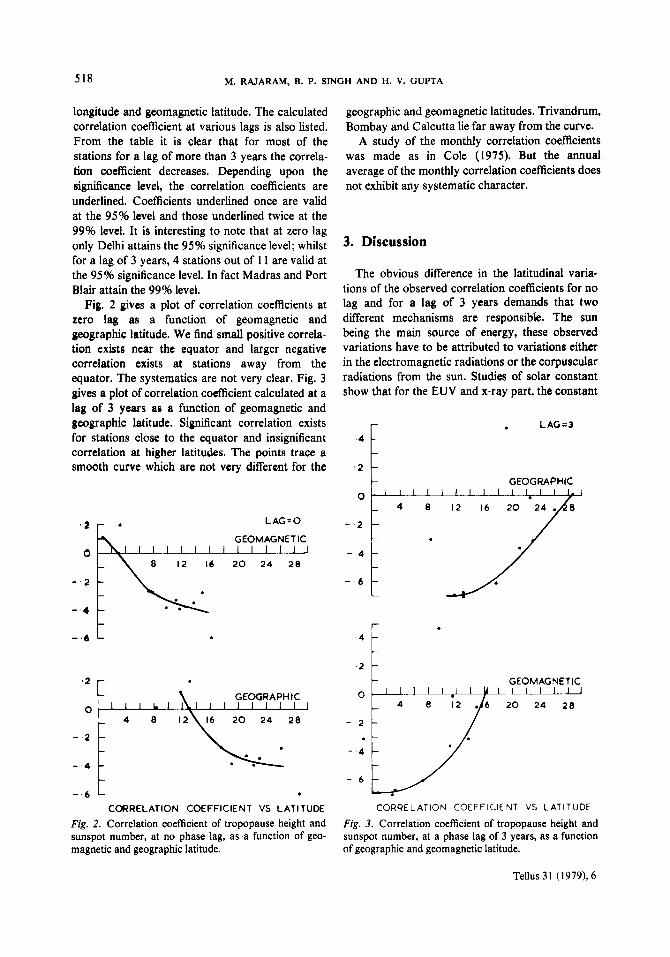
Fig. 2 gives a plot of correlation coefficients at zero lag as a function of geomagnetic and geographic latitude. We find small positive correla- tion exists near the equator and larger negative correlation exists at stations away from the equator. The systematics are not very clear. Fig. 3 gives a plot of correlation coefficient calculated at a lag of 3 years a8 a function of geomagnetic and geographic latitude. Significant correlation exists for stations close to the equator and insignificant correlation at higher latitudes. The points trace a smooth curve which are not very different for the
-
- GEOMAGNETIC
LAG.0
GEOMAGNETIC
2 0 24 2 0
- .*
. 2 - GEOGRAPHIC
- . 2 - - - 4 - - - . 6 -
CORRELATION COEFFICIENT VS LATITUDE Fig. 2. Correlation coefficient of tropopause height and sunspot number, at no phase lag, as ,a function of geo- magnetic and geographic latitude.
geographic and geomagnetic latitudes. Trivandrum, Bombay and Calcutta lie far away from the curve.
A study of the monthly correlation coefficients was made as in Cole (1975). But the annual average of the monthly correlation coefficients does not exhibit any systematic character.
3. Discussion
The obvious difference in the latitudinal varia- tions of the observed correlation coefficients for no lag and for a lag of 3 years demands that two different mechanisms are responsible. The sun being the main source of energy, these observed variations have to be attributed to variations either in the electromagnetic radiations or the corpuscular radiations from the sun. Studies of solar constant show that for the EUV and x-ray part, the constant
. LAG=3
GEOGRAPHIC
TROPOPAUSE HEIGHT AND SOLAR ACTIVITY 5 19
changes by a factor of 2 during solar flares (Domingo, 1976). These changes are at a maxi- mum during the sunspot maximum years. Based on these and other studies it has been concluded that solar terrestrial relationships that depend on the energy input through electromagnetic radiation vary in phase with the sunspot number. On the other hand, recurrent, non-sudden commencement type geomagnetic storms controlled by particle injection show a maximum 2 years after the maximum in sunspot number (Newton and Mil- som, 1954). The geomagnetic planetary index, Kp, which is directly controlled by the particle flux, exhibits a very pronounced peak lying on the declining phase of the solar cycle.
One line of approach could be to associate the changes in tropopause height for no lag to changes in the solar constant which is directly a measure of the changes in the solar electromagnetic output. The solar constant does exhibit a 27-day variation and the 11-year solar cycle effects could be con- sidered as the 1 1-year variation of the amplitude of this 27-day forcing function (Volland, 1976). In that case, the observed latitudinal variation, for no lag, should compare with the calculated latitudinal variation in a given parameter set up by the 27-day variations of the solar constant. Model calcula- tions of Volland (1976, 1977) show that small changes in the solar constant generate atmos- pheric planetary waves having maximum ampli- tude at higher latitudes. The observed correlation coefficient at no lag (Fig. 2) exhibits a similar lati- tudinal dependence. It is dimcult to explain the cause of the observed correlation at a lag of 3 years, which exhibits entirely different latitudinal variation when compared to those obtained for no lag. It can probably be associated with particle injection. The mechanism responsible for the geo- magnetic planetary index K p exhibiting a pro- nounced maximum on the declining phase of the solar cycle is possibly responsible for the corre- lation observed at a lag of 3 years.
Another aspect of the present study is the difference in magnitude of the correlation coeffi- cient, for no lag, between the Indian and the Pacific region. In the Indian region we get about zero cor- relation for the equatorial stations, whilst Cole (1975) gets a large positive correlation coefficient for the Pacific and Caribbean equatorial stations. However, there exists a striking similarity in the two regions, in the sense that the correlation coeffi-
cient exhibits similar graphical trends decreasing with latitude for both the regions. The difference in the two zones seems to be a problem of some significance, which can be more thoroughly studied using data from the Global Atmospheric Research Programme. King et al. (1977) also observe a longitudinal variation of the height of the 500 mb constant pressure level. A correlation coefficient for a lag of 3 years has not been reported for the Pacific region, therefore further comparison is not possible at this stage. We may, however, point out that geomagnetic fluctuations, which are a direct index of the entry of particle flux, do show larger enhancements in the American zone as compared With similar fluctuations in the Indian zone (Agarwal et al., 1978). It may be noted that in the Indian sector the dip equator is situated at about 10°N and in the American sector it is at about 12" S. A station having a geographic latitude of 21 O N (Nagpur) has a geomagnetic latitude of 11 O N in the Indian sector and the same latitude (Merida) has a geomagnetic latitude of 3 1 O N in the American sector. This difference in the two sectors will introduce a great variance in the particle precipitation in the two regions and could possibly result in longitudinal variation of solar-weather relationships. The possibility of internal mechan- isms changing the entire circulation following events on the sun cannot be ruled out. Bucha (1976, 1977) has been able to explain the trends in climate of the American-European region on this line. We have to await such studies for the Indian region before the two could be compared.
4. Conclusion
The correlation coefficient between the tropo- pause height and sunspot number at no lag and at a lag of 3 years shows entirely different latitudinal dependence. It seems appropriate to associate this latitudinal variation of the correlation coefficient at no lag to the changes associated with variations in the electromagnetic radiation from the sun, whilst the correlation at a lag of 3 years appears to be related to changes associated with variations in the corpuscular output from the sun. The changes in meteorological parameter seem to differ consider- ably from one longitude sector to another longi- tude sector, consequently studies undertaken to
Tellus 3 1 (1979),6
5 20 M. RAJARAM, B. P. SINGH AND H. V. GUPTA
establish solar climatic relationships will remain inconclusive if averages of meteorological para- meters are taken for fixed latitudinal zones by averaging data from various longitudinal areas. It would thus be of greater relevance to make studies for specific regions.
5. Acknowledgements
We would like to thank Prof. B. N. Bhargava and Dr A. K. Mukherjee for their helpful com- ments. We are also indebted to Prof. K. D. Cole for his interest in this work.
REFERENCES
Agarwal, A. K., Rastogi, R. G., Nityananda, N. and Singh, B. P. 1978. The effect of IMF on short period fluctuations. Nature 272, 517-518.
Bucha, V. 1976. Changes in the geomagnetic field and solar wind causes of climate and atmospheric circula- tion., Studia Geophys. Geod. 20, 346-365.
Bucha, V. 1977. Geophysical events affecting changes of climate and weather. Studia Geophys. Geod. 21, 350- 359.
Cole, H. P. 1975. An investigation of a possible relation- ship between the height of the low-altitude tropo- pause and the sunspot number. J. Atmos. Sci. 32,998- 1001.
Domingo, V. 1976. Solar radiation variation and climate. Proceedings of the ESLAB Symposium on Atmospheric Physics from Spacelab. Frascati, Italy, 22-14 May, 1976, pp. 21-41. D. Reidel Publi- cation.
King, J. W., Slater, A. J., Stevens, A. D., Smith, P. A. and Willis, D. M. 1977. Large-amplitude standing
planetary waves induced in the troposphere by the Sun. J. Atmos. Terr. Phys. 39, 1357-1367.
Newton, H. W. and Milsom, A. S. 1954. The distri- bution of great and small geomagnetic storms in the sunspot cycle. J. Geophys. Res. 59,203-214.
Ramkrishna, S. and Seshamani, R. 1973. The effect of solar activity on temperatures in the equatorial meso- sphere. J. Atmos. Terr. Phys. 35, 1631-1641.
Reddy, S. J. and Rao, K. R. 1977. Effect of solar flare on lower tropospheric temperature and pressure. Indian J. Radio Space Phys. 6,44-50.
Schuurmans, C. J. E. and Oort, A. H. 1969. A statistical study of pressure changes in the troposphere and lower stratosphere after strong solar flares. Pugeoph
Volland, H. 1976. The variable solar constant-a pos- sible source of the solar activity-weather relationship. Transact AGU 57,925.
Volland, H. 1977. Can sunspots influence our weather? Nature 269,4GQ-401.
75,233-246.
BbICOTA TPOllOIIAY3bI ti COJIHEYHAR AKTHBHOCTb
Tellus 3 1 (1979), 6