trophic interactions in the pelagic - awiepic.awi.de/16171/1/kno2007a.pdf · microbial food web ......
TRANSCRIPT

Trophic interactions in the pelagic
Dissertationzur Erlangung des Doktorgrades
der Mathematisch-Naturwissenschaftlichen Fakultätder Christian-Albrechts-Universität
zu Kiel
vorgelegt von
Susanna KnotzKiel 2006

Referent: Professor Dr. U. Sommer
Koreferent: PD Dr. M. Boersma
Tag der mündlichen Prüfung: 6. Juli 2006
Zum Druck genehmigt: 4. Januar 2007
der Dekan: gez. J. Grotemeyer
2

ContentChapter 1: Community structure of marine pelagic food webs and trophic interactions................................................................................................................ 5
1.1. Introductory remarks................................................................................................... 51.2. The North Sea plankton communities off Helgoland ...............................................6
Phytoplankton................................................................................................................................ 6Zooplankton................................................................................................................................... 7Ichthyoplankton.............................................................................................................................. 8Microbial food web......................................................................................................................... 9
1.3. Factors influencing plankton communities.............................................................10Hydrography of the German Bight (Otto et al. 1990).................................................................... 10Irradiance, temperature and salinity............................................................................................. 11Nutrients and nutrient limitation – food quantity and quality......................................................... 11Algal toxins and chemical defence............................................................................................... 14Anthropogenic impacts – excess nutrients, toxins, fishing, climate change................................. 15
1.4. Internal factors influencing zooplankton communities ........................................ 161.5. Overview of the following chapters..........................................................................17
Chapter 2: Microassays for a set of enzymes in individual small marine copepods ................................................................................................................. 19
2.1. Introduction................................................................................................................ 192.2. Materials and methods.............................................................................................. 202.3. Results and discussion............................................................................................. 24
Chapter 3: Sublethal physiological effects of food limitation in copepods ...... 283.1. Introduction................................................................................................................ 283.2. Material and Methods................................................................................................ 30
Laboratory experiments............................................................................................................... 30Digestive enzyme activities.......................................................................................................... 30Water soluble protein content of individuals................................................................................. 30Protease zymograms................................................................................................................... 31Statistics ...................................................................................................................................... 32
3.3. Results........................................................................................................................ 32Mortality and survival after starvation........................................................................................... 32Hunger experiments – digestive enzyme activities and protein contents..................................... 33Hunger experiments – protease zymograms................................................................................ 34Species comparison – protease zymograms ............................................................................... 35
3.4. Discussion.................................................................................................................. 36Time scales of reactions.............................................................................................................. 37Role of enzymes.......................................................................................................................... 39Zymograms.................................................................................................................................. 40Species specificity........................................................................................................................ 41Sexual differences........................................................................................................................ 41Conclusion .................................................................................................................................. 41
Chapter 4: Influence of food quality and quantity on egg production of Acartia clausi and Temora longicornis during a spring phytoplankton bloom.............. 43
4.1. Introduction................................................................................................................ 434.2. Material and Methods................................................................................................ 45
Sampling – animals and surface seawater................................................................................... 45
3

Abiotic environmental data........................................................................................................... 46Phytoplankton determination........................................................................................................ 46Dry mass, C, N and P determination............................................................................................ 46Copepod egg production.............................................................................................................. 47Copepod grazing selectivity......................................................................................................... 48Statistics....................................................................................................................................... 50
4.3. Results........................................................................................................................ 50Abiotic factors............................................................................................................................... 50Prey community structure influencing egg production.................................................................. 51Stoichiometric factors influencing egg production........................................................................ 57Grazing behaviour........................................................................................................................ 58
4.4. Discussion.................................................................................................................. 64Conclusion................................................................................................................................... 68
Chapter 5: Stable isotopes as predictors of copepod reproductive success....695.1. Introduction ............................................................................................................... 695.2. Material and Methods................................................................................................ 71
Seasonal Study............................................................................................................................ 71Sampling – animals and surface seawater................................................................................... 71Copepod egg production ............................................................................................................. 72Stable isotope determination........................................................................................................ 72Protein content and enzyme activities.......................................................................................... 72Spatial study................................................................................................................................. 73C, N and P determination............................................................................................................. 74
5.3. Results........................................................................................................................ 74Seasonal Study............................................................................................................................ 74Protein and digestive enzyme activities....................................................................................... 81Spatial study................................................................................................................................. 85
5.4. Discussion.................................................................................................................. 86Stable isotopes............................................................................................................................. 86Digestive enzymes....................................................................................................................... 89Conclusions.................................................................................................................................. 90
Chapter 6: General discussion: synthesis and outlook....................................... 926.1. Synthesis.................................................................................................................... 926.2. Outlook........................................................................................................................99
Chapter 7: Summary.............................................................................................. 100Chapter 8: Zusammenfassung............................................................................. 102Chapter 9: References........................................................................................... 104Danksagung........................................................................................................... 116Curriculum Vitae von Susanna Knotz.................................................................. 117Description of the scientific contributions to multiple author manuscripts.... 120Erklärung................................................................................................................ 121
4

Chapter 1: General introduction
Chapter 1: Community structure of marine pelagic food webs and trophic interactions1.1. Introductory remarksThis chapter presents a short overview of the processes and interconnections in the
marine food web as well as the plankton communities and typical representatives of
trophic levels of the North Sea around Helgoland (Fig. 1.1). Factors that shape and
change food webs in the zooplankton-phytoplankton interface are also introduced as
well as the contents of the following chapters.
Presently, we can describe plankton community structures (based on data from
cruises (Krause and Radach 1980), long-term sampling (Franke et al. 2004), and
Continuous Plankton Recorder surveys (Barnard et al. 2004; Beaugrand 2004), but
we still do not fully understand the underlying dynamic mechanisms that drive the
system. To model and to predict the structures of these communities, we need to
know more about the timing of the different influencing factors. That is, we need to
link individual life history dynamics with population and community dynamics. This
thesis identifies external and internal factors that influence individual plankton
organisms as well as community structure. This thesis was conducted as part of the
"Helgoland Food Web Project" and the "GLOBEC-Germany Project".
5
Fig. 1.1: Sampling station Helgoland Reede in between the islands Helgoland and Düne (54°11.3'N, 007°54.0'E) (with courtesy of FRS Helgoline GmbH&Co.KG: http://www.helgoline.de/presse_fotos.php).

Chapter 1: General introduction
Previously, the general view of energy flow was that of a linear food chain that
directly linked primary producers via herbivorous zooplankton to carnivorous
predators such as fish. However, we now know that this is a highly oversimplified
picture, and that trophic interactions are much more reticulate than previously
thought.
Bottom-up, competitive and top-down processes shape plankton communities. Most
calanoid copepods which often dominate the zooplankton community, have an
omnivorous feeding mode, during which they ingest phytoplankton,
microzooplankton, and even detritus (Kleppel 1993). Many calanoid copepods prefer
herbivorous microzooplankton, and in many cases, this selectivity can reduce the
grazing pressure on smaller phytoplankters, such as heterotrophic dinoflagellates
and other protozoans, which tend to be the most efficient herbivores (Kiørboe et al.
1996; Paffenhöfer 1998a; Sommer and Sommer 2006). Hence, we now recognize
that the microbial food web is intertwined with the classical food web such that, for
example, there are even fish larvae that feed directly on microzooplankton (Fukami et
al. 1999). Other interactions that can cause deviations from the classical linear food
chain include cannibalism (Kang and Poulet 2000) as well as chemical (Shaw et al.
1995; Teegarden 1999) and mechanical feeding deterrents (Dutz et al. 2005).
Nutritional deficiencies of phytoplankton affect the fecundity and biochemical
constitution of grazers. Biochemical deficiency can be passed on to the top predators
and influence their population dynamics (bottom-up control) (Malzahn 2006).
The different trophic levels are dominated by a specific assortment of organisms,
which are presented in section 1.2. Hydrographical and meteorological parameters
influence advection, nutrient availability, food concentration, and food quality. As a
result, the structure of the pelagic community and the biomass of the community vary
considerably seasonally and spatially.
1.2. The North Sea plankton communities off Helgoland PhytoplanktonPhytoplankton is the basis of all life in marine ecosystems. In the North Sea,
phytoplankton communities are dominated by Bacillariophycea (diatoms) – which
range in size from 5-500 µm – mainly during spring and autumns blooms. Some
important representatives of diatoms are the genera Chaetoceros, Thalassiosira,
Coscinodiscus, Rhizosolenia, Odontella, Leptocylindrus and Skeletonema
6

Chapter 1: General introduction
(Hoppenrath 2004). Haptophyceae or Prymnesiophycea (Phaeocystis,
Chrysochomulina, Emiliana) usually peak after diatom maxima. They occur in single
cells of about 5 to 15 µm, although some species such as Phaeocystis can form
colonies up to 10 mm in size. Autotrophic Dinophycea (dinoflagellates) (Ceratium,
Gonyaulax, Alexandrium, Dynophysis) are the main producers during the summer
months (5-200 µm). During the same period, Cryptophycea are abundant in coastal
communities as well as in the Central North Sea (3-20 µm). Crysophycea are usually
represented by silicoflagellates such as Distephanus but only form minor
components of the phytoplankton community in the North Sea. Small procaryotic
Cyanophycea (~ 1 µm), for example, Synechococcus are probably more important as
previously thought (Reid et al. 1990).
ZooplanktonMarine pelagic zooplankton larger than 0.2 mm is dominated by copepods around
the globe. As a result, these crustaceans form an important link between primary
producers and higher trophic levels in all pelagic food webs. They are the most
important food source for fish larvae in the plankton. Thus, the condition of copepods,
and shifts in zooplankton communities are of high economic significance for the
fisheries industry (Beaugrand et al. 2003). Small copepods of 0.5 to 1.5 mm length
dominate the mixed waters of the shallow North Sea. The dominant copepod species
at Helgoland roads are Acartia sp. (mainly A. clausi), Centropages hamatus, C.
typicus, Paracalanus sp. and Pseudocalanus elongatus, and Temora longicornis.
Other abundant copepods in the area are Corycaeus anglicus, Euterpina acutifrons,
and species of the genera Cyclopina, Microsetella, Oithona and Tisbe (Fransz et al.
1991; Greve et al. 2004). Usually, herbivorous copepods dominate the spring
followed by more carnivorous copepods during the summer, and detrivorous
harpacticoids later in the year (Greve et al. 2004). The main predators on copepods
are fish larvae and adult planktivorous fish; however, predators also include other
zooplankton such as the chaetognaths Sagitta setosa and S. elegans or the
ctenophore Pleurobrachia pileus. The turbellarian Alaurina composita can have
significant predatory impact on the copepod community (Greve et al. 2004). There
are three regular occurring species of scyphomedusae (Aurelia aurita, Cyanea
lamarcki, and C. capellata) and smaller hydromedusae. Three species of
cladocerans (Podon intermedius, P. leuckarti, Evadne nordmanni) are also common
in the North Sea. Since 1991 (first record), another cladoceran Penilia avirostris has
7

Chapter 1: General introduction
been found to reach high abundances during the summer months. Along with P.
avirostris the salp Doliolum nationalis and the siphonophoran Muggiaea atlantica
(Greve 1994) have become part of the Helgoland Roads zooplankton community
only fairly recently (Greve et al. 2004). In the southern North Sea, euphausids
(mainly Nyctiphanes couchii) are only infrequently met (Lindley 1982). During the
summer months, the appendicularians Oikopleura dioica and Fritillaria borealis are
abundant. The only holoplanktonic polychaets are Tomopteris helgolandicus and T.
septemtrionalis. An assortment of decapod, gastropod and bivalve larvae,
echinoderm larvae, and larvae of cirripeds as well as a variety of polychaet larvae are
meroplanktonic species that can be dominant at certain times in shallow areas of the
North Sea.
The main focus of this thesis is on copepods, with special attention to the abundant
species Temora longicornis and Acartia clausi (Greve et al. 2004) (Halsband and
Hirche 2001) (Fig. 1.2.).
IchthyoplanktonMany benthic and most pelagic North Sea fish species do not attach their eggs to
any substrate and instead release them into the water column. Even if the eggs are
demersal, this phase is usually followed by a planktonic phase of the larvae. Around
Helgoland, two peaks in ichthyoplankton density occur, one early in the year during
late winter and spring, and a second one in June/July (Malzahn 2006). By far the
most abundant fish larvae are lesser sandeel (Ammodytes marinus), followed by dab
(Limanda limanda). In the beginning, larval fish preferentially feed on small
zooplankton, but also on heterotroph protozoans and even phytoplankton. However,
phytoplankton does not support the successful development of fish larvae (Malzahn
8
Fig. 1.2: a) Acartia clausi female, b) Temora longicornis female.
Chapter 1: General introduction
2006), but can trigger digestive processes and enhance survival and growth (Cahu et
al. 1998). Surviving fish larvae quickly develop to visual predators preferring larger
prey with growing size. The efficiency of the food web for fish recruitment is
determined in part by the number of trophic steps between primary producers and
fish (Sommer et al. 2002).
Microbial food webPicophytoplankton and bacteria often form the bulk of phytoplankton and can
dominate primary production (Fogg 1995). The microbial food web plays an important
role in recycling nutrients (Thor et al. 2003). The organisms of the microbial food web
can provide particulate organic matter for higher trophic levels in the plankton food
web. Nutrients are recycled by bacteria to a large extent, but bacteria can also
accentuate nutrient limitation effects by competing with phytoplankton for nutrients in
nutrient depleted conditions (Guerrini et al. 1998).
Bacteria and nanoflagellates reach high abundances in coastal waters of the North
Sea ranging from 2.7 to 4.5 x 10⁶ cells mL-1. In frontal systems, even higher numbers
can be encountered (Van Duyl et al. 1990). Bacterioplankton shows seasonal and
geographical variations related to phytoplankton development and temperature
(Billen et al. 1990; Gerdts et al. 2004). Bacterial numbers and community structure
stay relatively stable from October to March. Community shifts arise during March
just before numbers go up, while the highest community variability occurs from April
to July (Gerdts et al. 2004). Numbers are mainly controlled by HNF (Zubkov et al.
2001; Beardsley et al. 2003) and bacteriophages (Wichels et al. 2002). Heterotrophic
flagellates and other protozoans are competitive grazers as well as an additional food
source for copepods. Different copepod species exhibit variable impacts on ciliate
communities (Gismervik 2006). Copepod grazing on flagellates can stimulate
bacterial growth (Van Wambeke et al. 1996) as well as phytoplankton development
by reducing numbers of the efficient microzooplankton herbivores (Kiørboe et al.
1996; Maar et al. 2002). Cladocerans and doliolids supported growth of bacteria by
removing bacterivorous HNF more than copepods, which mainly feed on larger
phytoplankton and not controlling HNF, which feed on bacteria (Katechakis et al.
2002). Non loricate ciliates such as Strombidium and Lohmanniella and loricate
forms such as Tintinnopsis dominate the ciliate fauna in the North Sea. The
hetereotrophic dinoflagellate Noctiluca scintillans can form extensive blooms that
feed on detritus, phytoplankton, and zooplankton (Fock and Greve 2002).
9
Chapter 1: General introduction
1.3. Factors influencing plankton communitiesHydrography of the German Bight (Otto et al. 1990)The German Bight is a very shallow part of the North Sea with an average depth of
about 20 m and where tidal currents lead to a mixing of different water masses.
Temperature differences between summer and winter are extreme in the continental
coastal waters as compared to areas that are influenced by North Atlantic water
masses. Zooplankton distribution in the North Sea differs between three main water
bodies: Atlantic water masses, central North Sea water mass, and coastal water
masses (Krause 1995).
The overall current in the North Sea is anti-clockwise. Thus, water in the German
Bight moves from west to east and northwards along the Frisian coast. Water
masses are moved around by tidal currents. Two amphidromic points are centres of
tidal strengths in the German Bight. One is located at the Eastern tip of the Dogger
Bank and the other near the entry of the Southern Bight. Atlantic water flows in
through the English Channel and the northern pathway, mainly during autumn and
winter. A strip of mixed coastal water is separated from the usually stratified central
North Sea waters by a slightly changing transitional zone which encompasses the
sea around Helgoland. The main outflow of North Sea water is northward bound
flowing along the Norwegian coast.
The German Bight is also influenced by large freshwater masses. Frontal zones can
develop in areas where water masses of different density meet, that is, water masses
with different temperatures and/or salinity. Three types of frontal zones can occur in
the German Bight (Otto et al. 1990) after (Krause et al. 1986): Tidal mixing fronts
forced by tidal friction mixing, wind stress and temperature as along the Frisian coast;
river plume fronts along the Danish-German coastline of Jutland between freshwater
and oceanic water; and upwelling fronts west of Helgoland where bottom water
advected from the central North Sea is forced upward by easterly wind stress. Where
two water masses meet a strong horizontal gradient in salinity and or temperature is
apparent.
The main nutrient input into the German Bight is from the freshwater systems of the
Elbe, Weser and Ems rivers. As a result, a gradient exists from high coastal
concentrations towards the lower nutrient concentrations of the central North Sea
(Raabe et al. 1997). The nutrient distribution and cycling in the North Sea is
10

Chapter 1: General introduction
hydrographically influenced (Brockmann et al. 1990). The transitional zone of a
shallow water frontal system contains the highest nutrient values and turnover rates
compared to the adjacent stratified and mixed waters. Hence, the waters in this zone
trigger the growth of phytoplankton in the frontal areas (Maguer et al. 2000).
Irradiance, temperature and salinityIn the temperate zones of the globe, seasonally variable irradiance mainly plays a
role for primary production, which in turn influences all other trophic levels. With
increasing light in spring phytoplankton blooms develop. Biochemical compounds of
phytoplankton can vary extremely between photoperiod and dark phase (Granum et
al. 2002). The light regime (intensity and spectrum) can alter algal nutrient
requirements (Wynne and Rhee 1986), which can affect grazers (Hessen et al.
2002). In response to low light conditions, the chlorophyll-a contents of algae are
increased to increase the light harvesting ability of the algae (Geider 1987). With
such an increase in chlorophyll-a, the demand for nitrogen increases, which in turn
increases the risk of nitrogen-limitation.
The metabolic processes of poikilothermic marine invertebrates are correlated with
temperature. Hence, energy demands increase with increasing temperature due to
rising metabolic activity. Food ingestion of copepods increases with rising
temperature (Kiørboe et al. 1982), as does egg production (Halsband and Hirche
2001; Holste and Peck 2006). Higher temperatures increase food limitation
thresholds by increasing the energy demand of marine crustaceans, as well as
influencing individual and population growth (Savage et al. 2004). Sub-populations of
the same species occurring over a wide geographical range such as the calanoid
copepod Centropages typicus are adapted to different optimal temperatures in areas
of different latitudes (Halsband-Lenk et al. 2002).
Nutrients and nutrient limitation – food quantity and qualityFood is the single most important biological (bottom-up) factor that determines
copepod success, as it affects developmental times, weight and egg production of
copepods (Hirche et al. 1997; Rey-Rassat et al. 2002). Copepods respond to
increased food availability with increased ingestion linearly up to the incipient limiting
level (Mayzaud and Poulet 1978; Mayzaud et al. 1992).
Apart from the quantity of the food, the quality of food can also play a major role. First
and foremost, the spectrum of the available particles is of importance. Ciliates
(Bonnet and Carlotti 2001) or heterotrophic dinoflagellates (Klein Breteler 1980)
11

Chapter 1: General introduction
provided in conjunction with phytoplankton can enhance the fecundity and viability of
copepods. Heterotrophic dinoflagellates produce essential fatty acids that are absent
in their phytoplankton food, thereby upgrading the food quality for copepods (Klein
Breteler et al. 1999; Veloza et al. 2006). One of the other main quality determining
factors is the nutrient content of the food (algae). Phytoplankton organisms depend
on an assortment of nutrients in the water to grow. The most important nutrients
besides carbon (C) are nitrogen (N), phosphorus (P) and iron (Fe). Silica (Si) is also
important for diatoms and other silica shell forming phytoplankton such as
silicoflagellates. Globally, nitrogen and iron probably play the largest roles, but
recently a growing role for phosphorus has been acknowledged for the open water
marine environment (Brockmann et al. 1990; Downing et al. 1999). Phosphorus even
seems to be widely limiting phytoplankton in oceans (Sañudo-Wilhelmy et al. 2004).
According to Redfield (1958), the general ratio between carbon, nitrogen, and
phosphorus is 106:16:1 (C.N.P) (Redfield 1958). However, this ratio tends to vary
between species, and can have even larger variation within a species due to the
physiological state of individuals. In general, phytoplankton is usually severely N-
limited at a N:P ratio of < 5, and P limited when this ratio is over 100. Replete
conditions are indicated by ratios in the range of 5-19 (Geider and La Roche 2002).
Nutrient deficiency changes the growth behaviour and biochemical constituents of
phytoplankton. Phytoplankton exponential growth ceases upon nutrient limitation,
which leads to a stationary phase and senescence. During a phytoplankton bloom
massive biochemical changes occur that can be related to the nutrient availability
(Morris et al. 1983; Morris et al. 1985). Nutrient limited cells may be larger and
denser than cells grown under optimal nutrient conditions. The protein content of
nitrogen depleted phytoplankton is decreased while phosphate limited algae rather
produce more carbohydrates and lipids (Kilham et al. 1997). Phosphate deficiency
leads to lower DNA levels (phosphate is a major compound of DNA and RNA), while
protein and chlorophyll-a (chl-a) contents remain similar. Nitrogen limitation affects
protein and chl-a contents of cells (Granum et al. 2002). Therefore, a higher
protein:DNA or chl-a:DNA ratio indicates phosphate rather than nitrogen limitation
(Berdalet et al. 1996). Nutrient deficient phytoplankton produces and releases more
polysaccharides (Penna et al. 2000). In nutrient limited phytoplankton bulk lipids
increase and are dominated by storage and membrane lipids formed of
12

Chapter 1: General introduction
triacylglycerols (TAG) (Roessler 1990). TAG contains mostly monounsaturated fatty
acids (MUFA) and saturated fatty acids (SFA) with no nitrogen. Nitrogen and
phosphate depletion can reduce absolute and proportionate levels of poly
unsaturated fatty acids (PUFA) and decrease the sterol content in diatoms, eliciting
negative effects on copepod development (Klein Breteler et al. 2005). However,
higher levels of essential PUFAs have been found in phosphorus limited
phytoplankton compared to phosphorus sufficient algae (Müller-Navarra 1995;
Malzahn 2006).
Hence, the underlying biochemical compounds, and their bioavailability should not be
neglected when evaluating effects of nutrient depletion (Geider and La Roche 2002;
Anderson et al. 2004) as the analysis of elemental ratios does not normally suffice to
recognize biochemical limitations (Anderson and Hessen 1995). Distinct fatty acids
and amino acids have been recognized to be limiting for zooplankton (Kleppel et al.
1998; Anderson and Pond 2000). Different phytoplankton species and other
organisms differ in their fatty acid profiles per se (Reitan et al. 1997). The most
important fatty acids that have been identified to limit copepod growth and
reproduction include eicosapentaenoic acid (20:5(n-3); EPA) and docosahexaenoic
acid (22:6(n-3); DHA). These fatty acids are often limiting in the field (Jónasdóttir
1994; Jónasdóttir et al. 1995; Arendt et al. 2005), but amino acids have also been
mentioned as limiting factors for zooplankton reproduction (Guisande et al. 2000;
Guisande et al. 2002).
Coming back to nutrients, grazers normally display homeostastis in their C:N:P
stoichiometry despite large stoichiometric changes in their prey (Koski 1999; Pertola
et al. 2002). Grazers can adjust their feeding strategy to the nutrient limitation of their
prey (Mitra and Flynn 2005). Compensatory grazing was observed in Daphnia
magna fed with phosphate limited algae (Plath and Boersma 2001) and in Acartia
tonsa feeding with 480% higher rates on low quality dinoflagellate Karenia brevis as
compared to high quality Rhodomonas lens (Prince et al. 2006). It has been
hypothesized that by feeding more, more energy is used for nutrient uptake, which
counterbalances mineral imbalances (Plath and Boersma 2001). Moreover, selective
digestive processes are predicted to decrease the assimilation of a superfluous
element and to increase the release rate of the element (Darchambeau 2005).
Indeed, copepods and other zooplankton grazers did release excess nutrients that
were immediately taken up by slightly nitrogen limited phytoplankton (Katechakis et
13

Chapter 1: General introduction
al. 2002). High C:N ratios of prey often cause lower egg production rates in copepods
(Checkley 1980b). Lower C:N ratios have similar effects as a temperature increase
when food concentration is not limiting (Ambler 1986), but nitrogen deficient
phytoplankton can also have an opposite effect on copepod fecundity by increasing
egg production rates (Augustin and Boersma 2006).
Despite the relative homeostasis of copepods mineral changes can be passed on to
the herbivore levels (Van Nieuwerburgh et al. 2004; Malzahn 2006), but mostly
indirectly. The fatty acid composition of copepod grazers and their eggs reflects that
of their food, so that changes in selective feeding during seasons can be followed
(Peters et al. 2006). Even typical bacterial fatty acids that were transferred via ciliates
can be traced (Ederington et al. 1995). Different signatures of algae species can be
traced via herbivores up to fish larvae (Reitan et al. 1997; Pedersen et al. 1999).
Therefore, characteristic fatty acid profiles can be used as food type or trophic
markers throughout the food web (Dalsgaard et al. 2003). Thus, nutrient limitation
that changes the fatty acid profiles of prey organisms leaves its traces throughout the
food web.
Algal toxins and chemical defenceAlgae produce biochemicals (toxins, feeding deterrents) that suppress grazing but
they can also inhibit competitors with allelochemicals (Legrand et al. 2003). Nutrient
deficiency triggers or increases toxin production in such different algal species as
Chrysochromulina polylepis (Johansson and Granéli 1999), Pseudonitzschia seriata
(Fehling et al. 2004), different Alexandrium species (Frangópulos et al. 2004) and
Prymnesium parvum (Granéli and Johansson 2003). In Alexandrium funduyense,
toxin production ceased upon nitrogen limitation but increased when phosphate and
nitrogen were limiting (John and Flynn 2000). Several copepod species are able to
discriminate between toxic and non-toxic strains of Alexandrium and select for non-
toxic alternatives (Teegarden 1999). Phaeocystis is grazed by copepods mainly in its
colonial form but only to a low extent. Copepods select against the haptophyte during
peak abundance and the algae seems to be unsuitable for copepod nutrition (Klein
Breteler and Koski 2003) Instead, during blooms they prefer the accompanying
heterotroph protozoan fauna (Gasparini et al. 2000; Tang et al. 2001; Koski et al.
2005).
14

Chapter 1: General introduction
For many years diatoms in general were considered as first rate food for copepods.
Copepod populations usually develop well following springtime diatom blooms
(Gowen et al. 1999). Recently, however, evidence was presented that diatoms may
be low quality food for copepods (Ban et al. 1997). The low quality was ascribed to
toxic aldehydes that are produced by the diatoms upon grazing, thus arresting
embryonic development (Miralto et al. 1999; Ianora et al. 2004). Others presented
evidence that alternative food in naturally occurring diatom concentrations
encountered in the field could probably compensate deleterious effects of diatoms
(Irigoien et al. 2002). Grazing experiments with mixed food items indicated that
copepods could indeed compensate negative effects caused by putative toxic
phytoplankton including diatoms (Colin and Dam 2002). Recently, negative diatom
effects on egg production and hatching success could clearly be ascribed to
nutritional deficiency of diatoms rather than toxicity (Jones and Flynn 2005). Even a
small proportion of good dinoflagellate food had beneficial effects on fecundity and
vitality of copepods.
Anthropogenic impacts – excess nutrients, toxins, fishing, climate changeCoastal zones of the sea are strongly influenced by human activity. Besides the
higher natural inflow of organic matter and inorganic nutrients transported by rivers,
waste water including additional high amounts of organic and inorganic compounds
and toxic substances from land runoff and atmospheric emission affect life in coastal
zones. Fishery and oil industry also affect life in the oceans, especially in a heavily
used shelf sea as the North Sea. Anthropogenic nutrient input does affect the primary
production level without directly affecting the herbivorous zooplankton trophic level
(Micheli 1999). However, additional nutrient inputs can shift primary producer
communities to inedible or low quality organisms (Müller-Navarra et al. 2004).
Fisheries reduces grazing pressure on mesozooplankton but may support the
development of jellyfish or other alternative predators.
New species that drift into the area may suddenly find a suitable environment to
establish a stock population (Greve et al. 2004). Temperature influences zooplankton
communities from such different seas as Black Sea, North Sea, and Baltic Sea in
similar ways (Niermann et al. 1998). In the past 100 years the average global
temperature has risen by 0.6 °C. This shift has already lead to pronounced effects on
a vast assortment of terrestrial and marine species, their range and abundance, and
15

Chapter 1: General introduction
timing of events in their life cycles (Root et al. 2003). The authors found a
considerable range shift polewards and a time shift towards earlier starts of events
such as migration, flowering, or egg laying during spans of 10 years in 80 % of the
species or species groups treated in the studies. Community shifts due to climatic
change (Hays et al. 2005) can lead to increasing trophic mismatch situations
(Cushing 1990; Edwards and Richardson 2004; Richardson and Schoeman 2004).
The German Bight is a frontier zone for some northern as well as for some southern
species. Southern species are better adjusted to higher temperatures. Thus, their
offspring survival rate may increase, while northern species may find less suitable
conditions for their survival. In the waters around Helgoland, the average salinity has
increased and the average sea surface temperature has risen by 1.13°C over the last
4 decades, which have shifted the onset of the spring diatom bloom to a later date
potentially due to increased winter grazing (Greve et al. 2004; Wiltshire and Manly
2004).
1.4. Internal factors influencing zooplankton communities The antennules of copepods are equipped with mechanosensors and chemosensors
(Bundy and Paffenhöfer 1993). In principle they can remotely detect
hydromechanical as well as chemical signals in the water. Chemoreception is not
necessary for the perception of prey in the far field (Bundy et al. 1998). Copepods
can differentiate hydromechanical signals of prey from predators and discern these
from background signals of the ambient flow (Hwang and Strickler 2001). Motility of
prey can be a positive selective force (DeMott and Watson 1991). A general model
for predators with different feeding modes and prey motility or sinking was developed
to calculate distance perception and differentiation between prey and predator
signals (Kiørboe et al. 1999; Kiørboe and Visser 1999). The model predicts the
predation risks of differently behaving copepods with a set of different prey (Viitasalo
et al. 1998). The mechanosensory warning system of copepods habituates quickly
under high turbulence; copepods can avoid unnecessary flight movements and
improve their foraging success in turbulent water (Hwang et al. 1994). Copepods do
feed selectively. They can sense large cells remotely but can also handle prey
smaller than 10 µm (Price et al. 1983). Copepods adjust their feeding mode to the
cell sizes they encounter: small cells are ingested by regular flapping of the
mouthparts, which is occasionally interrupted by combing the feeding appendages,
16

Chapter 1: General introduction
while larger cells are individually handled (Vanderploeg and Paffenhöfer 1985; Price
and Paffenhöfer 1986). Copepods can reject cells of "bad taste" with some wide
sweeping movements. They can manipulate cells (chop-stick feeding), for example
remove spines from Chaetoceros sp., align chain forming diatoms to fit into their
mouth (banana-like feeding) or squeeze the contents out of dinoflagellates with
strong cell walls (R. Strickler, personal communication). Besides chemosensory
detection of potential mating partners, it was unclear whether copepods use
chemosensors on their antennules to detect food in their vicinity, and not just after
they have captured it. Electrophysiological experiments on isolated antennules of
female Temora longicornis have shown that copepods can definitely sense cell free
algal homogenates and several amino acids with their antennules (Schütte 2006).
Chemosensory abilities enable copepods to select for taste and therefore quality of
prey (DeMott 1986; Paffenhöfer 1998b). Food concentration and feeding history
influence selective grazing behaviour (Donaghay and Small 1979; DeMott 1989) and
the acclimation of the digestive system (Hassett and Landry 1983; Landry and
Hassett 1985; Roche-Mayzaud et al. 1991; Mayzaud et al. 1992). Digestive
physiology and its underlying genetic control is a potential factor that determines
selective feeding behaviour (Sotka 2003). Copepods can digest a great variety of
possible substrates (Mayzaud and Mayzaud 1981). The set of digestive enzymes
and their portion in the organism can help to determine their nutritional (Kumlu 1997)
or trophic status (Jones et al. 1997). High enzyme activity can denote the importance
of the substrate for the analysed animal but also the deficiency or difficult digestibility
of the available natural substrate. Therefore, interpretation of digestive enzyme
studies can be ambiguous. Digestive enzyme activities can change during ontogeny,
which suggests different food niches for each developmental stage (Hirche 1981;
Johnston 2003). Similarity between phylogenetic related species can overrule
nutritional differences (Chan et al. 2004). Digestive enzymes are released into the
water and can even override the bacterial extracellular enzymatic activity (Vrba et al.
2004). For larger crustaceans, enzyme studies on faecal pellets have been carried
out to survey changes in the digestive system over a longer period with minimal
animal disturbance (Cordova-Murueta et al. 2003).
1.5. Overview of the following chaptersThe aim of this study is to identify internal physiological factors that influence the
adaptability of different copepod species to different food niches within the same
17

Chapter 1: General introduction
environment. The focus is on the digestive enzyme system and the grazing
behaviour of copepods and the potential of these internal factors to react to food
quantity and quality changes. This study also examines the possible influence of
general nutritional factors on copepod reproduction in the field. The influence of
copepod and seston stoichiometry and stable isotopes on reproduction are evaluated
from a spring survey at Helgoland and compared with the conditions in a temporal
study at Helgoland and a spatial study within the German Bight.
The two following chapters concentrate on the methodology to evaluate internal
copepod physiology. Chapter 2 presents methods to measure digestive enzyme
activities and the water soluble protein content on an individual basis. The methods
are tested on differently sized small North Sea copepods and accompanied by
measurements of lipid and elemental content. Data for different dominant copepod
species of the North Sea are compared. Chapter 3 presents a method to determine
protease isozyme patterns in individual copepods is presented. Intra-specific versus
inter-specific and environmentally caused variability of isozyme production and the
possible ecological significance for copepods is also discussed.
Chapter 4 discusses the influence of grazing activity, food quality, quantity and the
physical environment on copepod fecundity and physiology during spring, a time of
strongly changing parameters. The main focus of the chapter is on elemental quality.
Chapter 5 concentrates on a temporal and spatial study on the influence of trophic
level and digestive physiology on copepod fitness and fecundity. Chapter 6 presents
a synthesis of the results and discusses their possible meaning for increasing model
predictability.
18

Chapter 2: Microassays for a set of enzymes in individual copepods
Chapter 2: Microassays for a set of enzymes in individual small marine copepods Fluorogenic assays for a set of 5 enzymes which are involved in digestion and food
utilization (alanine and arginine aminopeptidase, lipase/esterase, chitobiase, and
beta-glucosidase) were optimised to measure activities of these enzymes in the
same extracts of individual small North Sea copepods. The enzyme activities of
Acartia clausi, Centropages typicus, Corycaeus anglicus, Paracalanus parvus, and
Temora longicornis showed distinct species specific activity patterns, but also high
intra-specific variability. Protein, lipids, carbon and nitrogen (C, N) were determined
with micro-scale assays in individual copepods or in batches of 10 to 50 animals.
Water soluble protein contents ranged from 16 to 38%, and lipid contents from 2.4 to
5.5% of dry mass. The molar C:N ratios were between 4.1 and 4.5. The presented
microassays provide suitable tools for studying physiological reactions of copepods
and other small pelagic crustaceans in response to variable environmental
conditions.
2.1. IntroductionCopepods hold key positions in pelagic food webs and contribute significantly to the
transfer of matter and energy between trophic levels. However, the detailed functions
of particular species or developmental stages within pelagic food webs are still
largely unknown due to the variety of possible trophic interactions.
The biochemical utilization of food is facilitated by a set of digestive enzymes that are
synthesized in the midgut region of copepods (Arnaud et al. 1980; Brunet et al.
1994). The activities of such enzymes reflect the potential to digest different organic
matter and may indicate adaptations to different food sources (Rodriguez et al. 1994;
Jones et al. 1997; Le Vay et al. 2001). Even though digestive enzymes have been
measured extensively in copepods since the 1970’s (Boucher and Samain 1974;
Mayzaud and Conover 1976; Mayzaud and Poulet 1978), the sensitivity of the
enzyme assays was low, and hence mostly applicable to pooled samples of up to
several hundred copepods or to larger animals (Johnston and Freeman 2005).
Accordingly, information on developmental stages or species was difficult to obtain,
while information on individual copepods was not available. However, this information
is crucial in interpreting physiological conditions and trophic interactions.
19
Chapter 2: Microassays for a set of enzymes in individual copepods
In this study, we adapted sensitive enzyme assays previously used to detect
enzymatic activity in water samples (Hoppe 1983; Oosterhuis et al. 2000; Sastri and
Roff 2000) to measure enzyme activities in individual copepods. The catalytic
potential in different species may provide additional information on the utilization of
food that is preferably eaten by these animals or help to explain the dynamics of
nutrient uptake. Beyond that, we analysed general nutritive parameters such as lipid
and water soluble protein content of the animals as well as their C and N content. As
test organisms, we used the most abundant pelagic North Sea copepods around
Helgoland known for their carnivorous, omnivorous and more herbivorous feeding
modes (Kleppel 1993). In this study we concentrated on copepods to establish the
analytical methods. However, the analytical procedure will be suitable for a wide
range of small pelagic crustacean or their developmental stages.
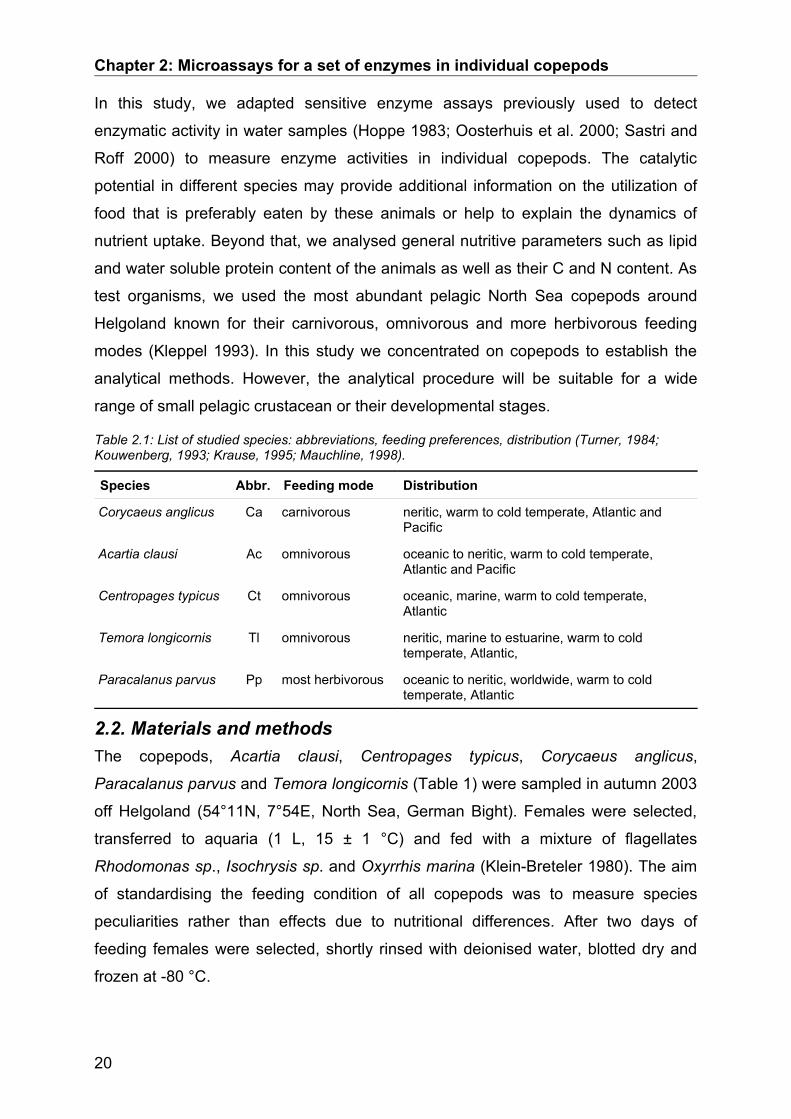
Table 2.1: List of studied species: abbreviations, feeding preferences, distribution (Turner, 1984; Kouwenberg, 1993; Krause, 1995; Mauchline, 1998).
Species Abbr. Feeding mode Distribution
Corycaeus anglicus Ca carnivorous neritic, warm to cold temperate, Atlantic and Pacific
Acartia clausi Ac omnivorous oceanic to neritic, warm to cold temperate, Atlantic and Pacific
Centropages typicus Ct omnivorous oceanic, marine, warm to cold temperate, Atlantic
Temora longicornis Tl omnivorous neritic, marine to estuarine, warm to cold temperate, Atlantic,
Paracalanus parvus Pp most herbivorous oceanic to neritic, worldwide, warm to cold temperate, Atlantic
2.2. Materials and methodsThe copepods, Acartia clausi, Centropages typicus, Corycaeus anglicus,
Paracalanus parvus and Temora longicornis (Table 1) were sampled in autumn 2003
off Helgoland (54°11N, 7°54E, North Sea, German Bight). Females were selected,
transferred to aquaria (1 L, 15 ± 1 °C) and fed with a mixture of flagellates
Rhodomonas sp., Isochrysis sp. and Oxyrrhis marina (Klein-Breteler 1980). The aim
of standardising the feeding condition of all copepods was to measure species
peculiarities rather than effects due to nutritional differences. After two days of
feeding females were selected, shortly rinsed with deionised water, blotted dry and
frozen at -80 °C.
20

Chapter 2: Microassays for a set of enzymes in individual copepods
Cephalothorax lengths and widths were measured in 20-30 live individuals under a
dissection microscope using a video analysis system (analysis, Soft Imaging
System).
Water soluble protein content of individual females was measured with the
bicinchoninic acid assay (BCA, Pierce Ltd.) (Smith et al. 1985). The method was
adapted for the use in 96-well microplates. Individuals were ground in reaction cups
with a micropestle in 55 µL deionised water, while being cooled on ice. The extracts
were centrifuged for 10 min (15000 g, 4°C). Fifty µL of supernatant were mixed with
250 µL test kit reagents and incubated for 1 h at room temperature. The microplates
were read at 550 nm (Dynatech MR 7000). Bovine serum albumin (BSA, 1 to 5 µg
per well) was used as standard.
Table 2.2: List of enzymes, substrates, and assay conditions.
Enzyme Substrate Source Buffer system pH
Chitobiase 4-Methylumbelliferyl N-acetyl-beta-D-glucosaminide
Sigma 2133
McIlvaine 5
Beta-glucosidase 4-Methylumbelliferyl beta-D-glucoside Sigma 3633
McIlvaine 5
Esterase/lipase 4-Methylumbelliferyl butyrate Fluka 19362
Tris/HCl 7
Alanine aminopeptidase
L-Alanine-4-methyl-7-coumarinylamide- trifluoroacetate
Fluka 05198
Tris/HCl 7
Arginine aminopeptidase
L-Arginine-7-amido-4-methylcoumarin hydrochloride
Sigma 2027
Tris/HCl 7
Total lipids were measured with the sulphophosphovanillin method (Zöllner and
Kirsch 1962). A commercial test kit (Merckotest 3321) was adjusted for the use in 96-
well microplates. Copepods (10 to 35 individuals per replicate) were boiled for 10 min
in 60 µL concentrated sulphuric acid in stoppered glass vials. After cooling to room
temperature, 30 µL of the solution were transferred into microplate wells. Samples
received 300 µL of phosphovanillin reagent (8 mmol L-1) and blanks were prepared
with 300 µL of phosphoric acid (11.9 mol L-1). Standards (1.2 to 6 µg serum lipids per
well) were treated alike. A gravimetric control of copepod lipids could not be done
due to the extreme low amount of material. The optical density (OD) was read at 530
nm. A lipid extraction step was not necessary as preliminary experiments showed
that the yield did not improve after extraction with chloroform/methanol.
21

Chapter 2: Microassays for a set of enzymes in individual copepods
Carbon, nitrogen and dry mass (dm) were analysed in pools of 25 to 50 freeze dried
females with a CHN analyser (Fisions Instruments EA 1108). Acetanilide (Thermo
Quest, 338 36700) served as standard.
Enzyme activities were measured in individual females. These were homogenized
with a micropestle in 200 µL of ice cold Tris/HCl buffer (0.1 mol L-1, pH 8) and
centrifuged for 10 min at 15000 g and 4 °C. Extracts of a single animal were used for
the analysis of two protein degrading exopeptidases (arginine and alanine
aminopeptidase), lipid hydrolysing esterase/lipase, and two carbohydrases
(chitobiase and beta-glucosidase). Assays were run at 25 °C with 5 to 40 µL of
sample. Stock solutions of the substrates (Table 2.2) were prepared in ethylene
glycol monomethylether (5 mmol L-1).
Table 2.3: Morphometric and nutritive data (mean ± SD); Sp. = species, Cs = cephalosome, dm = dry mass; Protein = water soluble protein; * 25 to 50 individuals per replicate; ** 10 to 35 individuals per replicate. Sp. Dry mass*
(µg ind-1)Cs length(µm ind-1)
Cs width(µm ind-1)
Carbon* (% dm)
Nitrogen* (% dm)
Molar C:N* Lipid** (% dm)
Protein (% dm)
Ca 4.62 ± 0.04 (n=3)
636 ± 33 (n=20)
272 ± 11 (n=20)
39.8 ± 1.0 (n=3)
10.6 ± 0.3 (n=3)
4.36 ± 0.01 (n=3)
3.9 ± 0.8 (n=5)
38 ± 9 (n=20)
Ac 6.02 ± 0.37 (n=4)
772 ± 31 (n=92)
250 ± 10 (n=92)
44.0 ± 0.3 (n=4)
12.3 ± 0.3 (n=4)
4.19 ± 0.07 (n=4)
5.5 ± 1.0 (n=21)
24 ± 8 (n=24)
Ct 37.86 ± 1.57 (n=4)
1208 ± 55 (n=33)
504 ± 20 (n=33)
43.9 ± 0.7 (n=4)
12.5 ± 0.2 (n=4)
4.10 ± 0.03 (n=4)
2.4 ± 0.4 (n=4)
19 ± 5 (n=24)
Tl 30.35 ± 4.79 (n=3)
824 ± 92 (n=20)
491 ± 40 (n=20)
45.0 ± 0.3 (n=3)
12.1 ± 0.1 (n=3)
4.33 ± 0.01 (n=3)
4.5 ± 0.2 (n=4)
16 ± 4 (n=30)
Pp 6.62 ± 0.26 (n=2)
n. d. n. d. 44.4 ± 1.3 (n=2)
11.5 ± 0.4 (n=2)
4.50 ± 0.29 (n=2)
5.0 ± 1.2 (n=4)
16 ± 8 (n=24)
Substrate concentrations in the assays were 100 µmol L-1 in a total volume of 500 µL
Tris/HCl (0.1 mol L-1) or citrate-phosphate buffer (McIlvaine 1921). Fluorescence was
measured at 360 nm (excitation) and 450 nm (emission) for 10 to 60 min with a
Kontron SFM 25 device. Blanks were run in parallel. The rate of autolysis was tested
for each substrate at all given assay conditions and subtracted from the assay-
results. Standard curves were prepared with 4-beta-methylumbelliferone (MUF) and
7-amino-4-methylcoumarin (AMC). The effect of pH on MUF and AMC fluorescence
was determined. Enzyme activities were calculated in relation to the average water
soluble protein content of either species and were presented as specific activities
(nmol h-1 mgprot-1). The linearity of the assay was tested with extracts of A. clausi and
22

Chapter 2: Microassays for a set of enzymes in individual copepods
T. longicornis. The fluorescence increased linearly between 2 and 8% of a copepod
as extract in the final assay preparation ( y=0.79∗x0.0001 , r 2=0.98 ,
p=0.01 ). The pH-profiles of all enzymes were determined between pH 4 and pH 8
with extracts of T. longicornis females. Lipase/esterase and peptidase showed
maximum activities at pH 7 and carbohydrases at pH 5. The standard assays for
these enzymes were run at the respective pH of maximum activity (Table 2.2).
23
Fig. 2.1: pH-profiles of all enzymes measured with extracts of T. longicornis females (n = 3; means ± SD).
a) alanine-peptidasere
lativ
e ac
tivity
(%)
0
20
40
60
80
100
120b) arginine-peptidase
0
20
40
60
80
100
120
c) esterase/lipase
rela
tive
activ
ity (%
)
0
20
40
60
80
100
120
d) chitobiase
pH
3 4 5 6 7 8 9
rela
tive
activ
ity (%
)
0
20
40
60
80
100
120
e) beta-glucosidase
pH
3 4 5 6 7 8 90
20
40
60
80
100
120
Chapter 2: Microassays for a set of enzymes in individual copepods
2.3. Results and discussionThe copepod species selected for our study overlap widely in their area of distribution
and are abundant in the North Sea. However, they differ distinctly in feeding habits
and in size. The smaller species A. clausi, C. anglicus and P. parvus weighed 4.6 to
6.6 µg (dry mass) while the dry mass of T. longicornis and C. typicus amounted to
30-38 µg (Table 2.3). Due to the small size of copepods the measurements of
enzyme activities and storage products require optimised methods such as micro-
scale extraction procedures, sensitive substrates, and optimum assay conditions.
Enzyme activities were highest at neutral to slightly acidic conditions: the
exopeptidases and esterase/lipase at pH 7 and 8 (Fig. 2.1a, b, c), and the
carbohydrases at pH 5 and 6 (Fig. 2.1d, e). These activity optima correspond with the
neutral to slightly acidic pH that was determined in vivo in the gut of Calanus
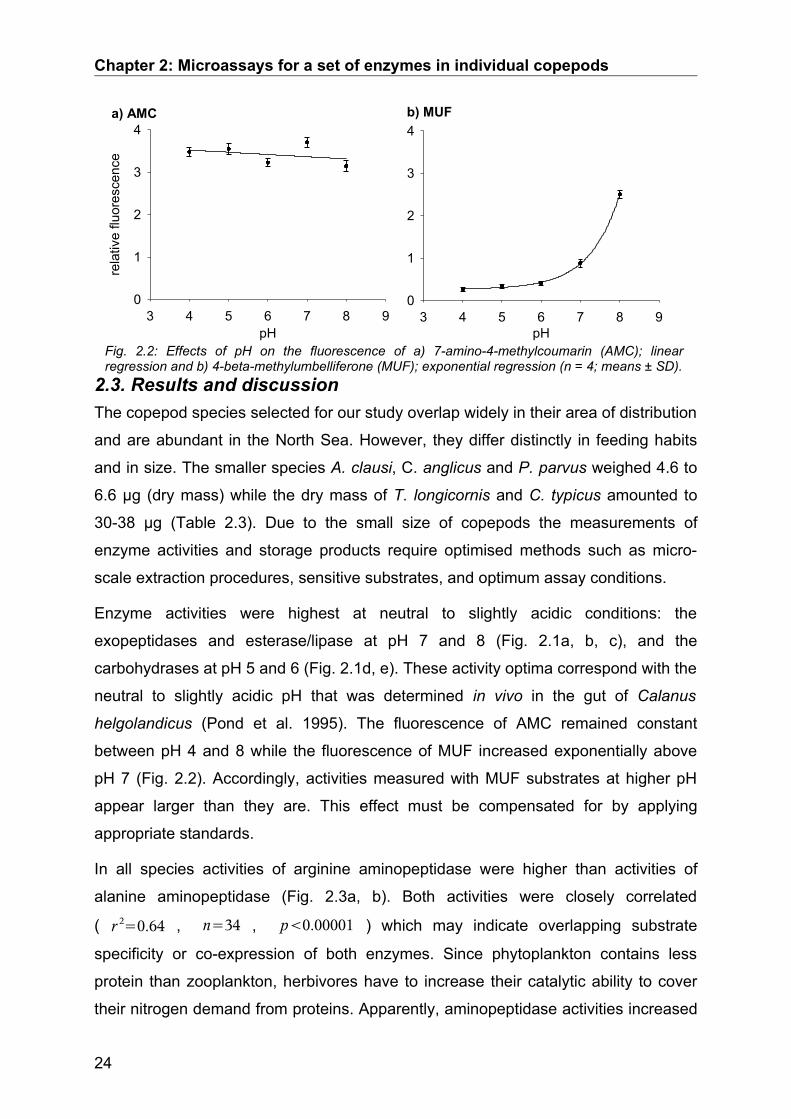
helgolandicus (Pond et al. 1995). The fluorescence of AMC remained constant
between pH 4 and 8 while the fluorescence of MUF increased exponentially above
pH 7 (Fig. 2.2). Accordingly, activities measured with MUF substrates at higher pH
appear larger than they are. This effect must be compensated for by applying
appropriate standards.
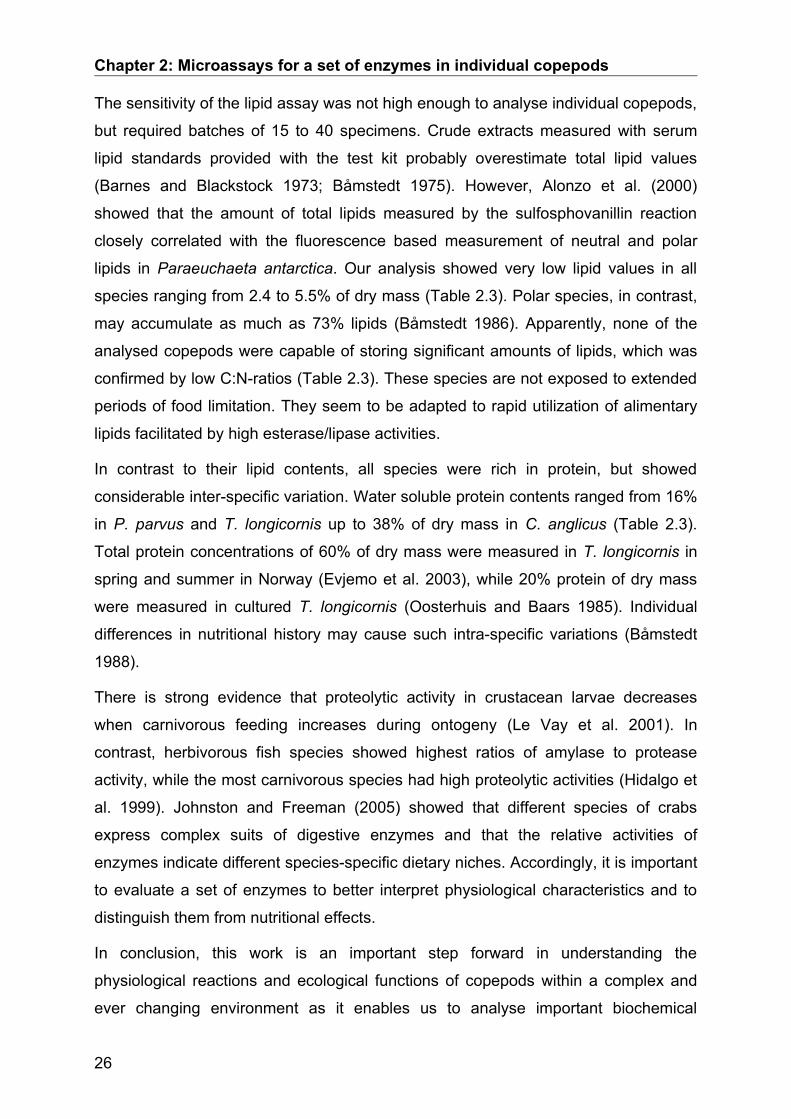
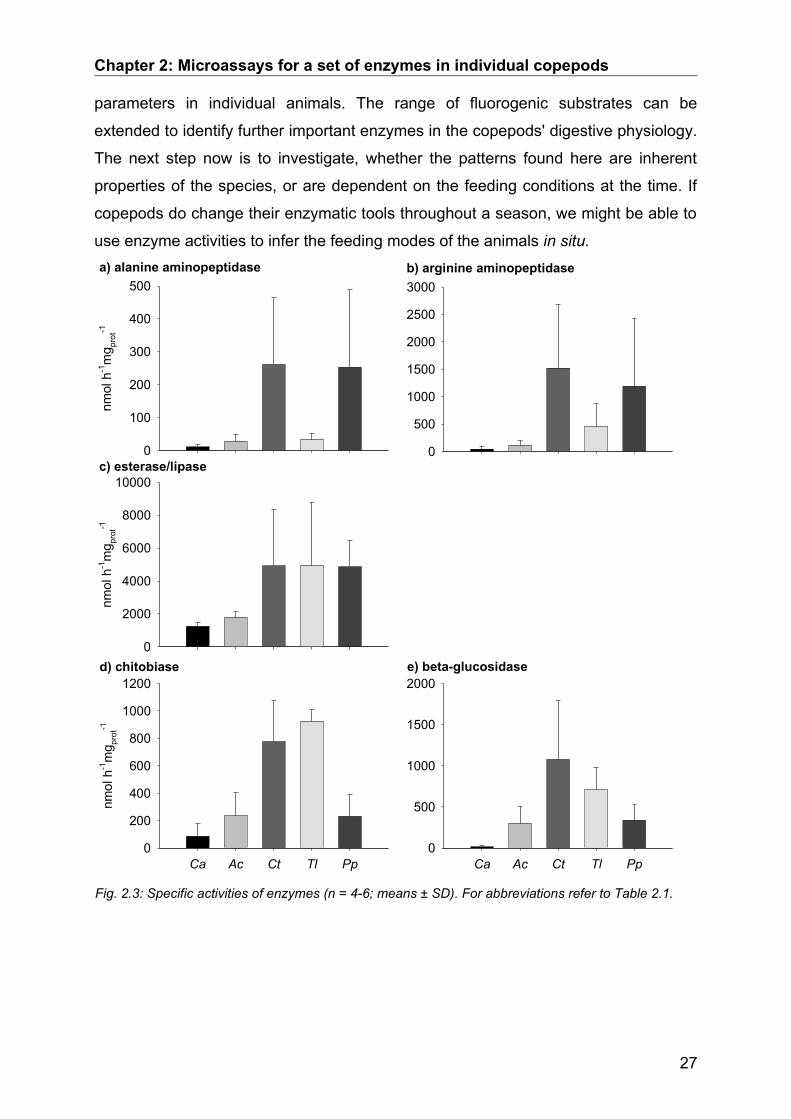
In all species activities of arginine aminopeptidase were higher than activities of
alanine aminopeptidase (Fig. 2.3a, b). Both activities were closely correlated
( r 2=0.64 , n=34 , p0.00001 ) which may indicate overlapping substrate
specificity or co-expression of both enzymes. Since phytoplankton contains less
protein than zooplankton, herbivores have to increase their catalytic ability to cover
their nitrogen demand from proteins. Apparently, aminopeptidase activities increased
24
Fig. 2.2: Effects of pH on the fluorescence of a) 7-amino-4-methylcoumarin (AMC); linear regression and b) 4-beta-methylumbelliferone (MUF); exponential regression (n = 4; means ± SD).
b) MUF
pH3 4 5 6 7 8 9
0
1
2
3
4a) AMC
pH3 4 5 6 7 8 9
rela
tive
fluor
esce
nce
0
1
2
3
4

Chapter 2: Microassays for a set of enzymes in individual copepods
with the degree of herbivory. T. longicornis and P. parvus are considered more
herbivorous than C. typicus and A. clausi, while C. anglicus is a carnivore (Turner
1984; Kouwenberg 1993; Mauchline 1998). C. anglicus showed the lowest and P.
parvus and C. typicus the highest amino-peptidase activities. Therefore, the
exopeptidases analysed here seem as suitable for the interpretation of zooplankton
feeding modes as shown previously for endopeptidases such as trypsin (Rodriguez
et al. 1994; Jones et al. 1997; Le Vay et al. 2001).
MUF-butyrate, was hydrolysed at rates of 1200 nmol h-1 mgprot-1
in C. anglicus to 5000
nmol h-1 mgprot-1
in T. longicornis (Fig. 2.3c). These particularly high activities of
esterase/lipase clearly reflect the high potential of all species to utilize lipids. None of
the species from the North Sea studied here store significant amounts of lipids (Tab.
III). Therefore, these species highly depend on the immediate and rapid utilization of
alimentary fatty acids, and thus, on high esterase/lipase activities. Besides their
nutritive value, lipids are important compounds of egg yolk and thus crucial for
reproductive success. All copepods used in this study were adult females which were
able to reproduce. Accordingly, high esterase/lipase activities may fuel vitellogenesis
in reproducing females by utilizing alimentary lipids (Gatten et al. 1980).
Crustaceans express two forms of chitinolytic enzymes that are involved in moulting
or digestion (Peters et al. 1999). Since adult copepods do not moult, they most likely
express exclusively digestive chitobiase. It hydrolyses oligomers of N-acetyl-
glucosamines (NAG) derived from chitin degradation to NAG monomers. Total
activities of chitobiase ranged between 90 and 930 nmol h-1 mgprot-1. Surprisingly,
species considered more carnivorous showed low chitobiase activities, while the
more herbivorous species expressed elevated activities. Therefore, herbivorous
copepods may be capable of utilising diatom chitin by elevated chitobiase activities
as suggested for Antarctic krill (Saborowski and Buchholz 1999).
Beta-glucosidase hydrolyses terminal beta-D-glucose from various polysaccharide
sources such as cellulose or laminarin and is involved in many metabolic processes.
Accordingly, beta-glucosidase should exhibit high activities in all studied species.
However, we found a wide range of activities from as low as 15 nmol h-1 mgprot-1 in C.
anglicus to 1100 nmol h-1 mgprot-1 in C. typicus. Therefore, we have to consider that
additional enzymes with wide specificities may complement beta-glucosidase activity,
e.g. galactosidases or alpha-glucosidases.
25
Chapter 2: Microassays for a set of enzymes in individual copepods
The sensitivity of the lipid assay was not high enough to analyse individual copepods,
but required batches of 15 to 40 specimens. Crude extracts measured with serum
lipid standards provided with the test kit probably overestimate total lipid values
(Barnes and Blackstock 1973; Båmstedt 1975). However, Alonzo et al. (2000)
showed that the amount of total lipids measured by the sulfosphovanillin reaction
closely correlated with the fluorescence based measurement of neutral and polar
lipids in Paraeuchaeta antarctica. Our analysis showed very low lipid values in all
species ranging from 2.4 to 5.5% of dry mass (Table 2.3). Polar species, in contrast,
may accumulate as much as 73% lipids (Båmstedt 1986). Apparently, none of the
analysed copepods were capable of storing significant amounts of lipids, which was
confirmed by low C:N-ratios (Table 2.3). These species are not exposed to extended
periods of food limitation. They seem to be adapted to rapid utilization of alimentary
lipids facilitated by high esterase/lipase activities.
In contrast to their lipid contents, all species were rich in protein, but showed
considerable inter-specific variation. Water soluble protein contents ranged from 16%
in P. parvus and T. longicornis up to 38% of dry mass in C. anglicus (Table 2.3).
Total protein concentrations of 60% of dry mass were measured in T. longicornis in
spring and summer in Norway (Evjemo et al. 2003), while 20% protein of dry mass
were measured in cultured T. longicornis (Oosterhuis and Baars 1985). Individual
differences in nutritional history may cause such intra-specific variations (Båmstedt
1988).
There is strong evidence that proteolytic activity in crustacean larvae decreases
when carnivorous feeding increases during ontogeny (Le Vay et al. 2001). In
contrast, herbivorous fish species showed highest ratios of amylase to protease
activity, while the most carnivorous species had high proteolytic activities (Hidalgo et
al. 1999). Johnston and Freeman (2005) showed that different species of crabs
express complex suits of digestive enzymes and that the relative activities of
enzymes indicate different species-specific dietary niches. Accordingly, it is important
to evaluate a set of enzymes to better interpret physiological characteristics and to
distinguish them from nutritional effects.
In conclusion, this work is an important step forward in understanding the
physiological reactions and ecological functions of copepods within a complex and
ever changing environment as it enables us to analyse important biochemical
26
Chapter 2: Microassays for a set of enzymes in individual copepods
parameters in individual animals. The range of fluorogenic substrates can be
extended to identify further important enzymes in the copepods' digestive physiology.
The next step now is to investigate, whether the patterns found here are inherent
properties of the species, or are dependent on the feeding conditions at the time. If
copepods do change their enzymatic tools throughout a season, we might be able to
use enzyme activities to infer the feeding modes of the animals in situ.
27
Fig. 2.3: Specific activities of enzymes (n = 4-6; means ± SD). For abbreviations refer to Table 2.1.
a) alanine aminopeptidase
nmol
h-1
mg pr
ot-1
0
100
200
300
400
500b) arginine aminopeptidase
0
500
1000
1500
2000
2500
3000
c) esterase/lipase
nmol
h-1
mg pr
ot-1
0
2000
4000
6000
8000
10000
d) chitobiase
Ca Ac Ct Tl Pp
nmol
h-1
mg pr
ot-1
0
200
400
600
800
1000
1200e) beta-glucosidase
Ca Ac Ct Tl Pp0
500
1000
1500
2000

Chapter 3: Physiological effects of food limitation
Chapter 3: Sublethal physiological effects of food limitation in copepods Most copepods from the North Sea do not accumulate significant amounts of lipids
and, thus, are vulnerable to food limitation. The effects of short term starvation on
digestive capabilities were studied in individuals of Acartia clausi and Acartia tonsa.
In both species hunger caused a decrease in chitobiase activity and an increase of
alanine aminopeptidase activity. The water soluble protein content decreased.
Activities of arginine aminopeptidase, beta glucosidase and esterase/lipase,
however, remained unaffected. Similarly, the patterns of endopeptidase isozymes did
not differ significantly between fed and starved individuals. Apparently, the
expression of enzymes which perform extra-cellular digestion of food compounds,
e.g. chitobiase, is rapidly reduced while the expression of enzymes which potentially
catalyse intracellular catabolic reactions remains unaffected. Proteases appeared to
be an important group of enzymes in Acartia clausi and in Acartia tonsa showing
several isozymes which were not affected by short term starvation. Comparison with
other species (Centropages typicus, Corycaeus anglicus, Paracalanus parvus,
Temora longicornis) showed that each species express a distinct species-specific
pattern of proteases. The temporary utilization of endogenous compounds,
particularly proteins, enables the copepods to survive short periods of food limitation.
3.1. IntroductionCopepods show fundamentally different life history traits in response to regional
environmental conditions. Polar regions are characterised by a distinct seasonality in
primary production. During the spring phytoplankton bloom food availability is
sufficient while it is limiting during other seasons, particularly winter. Therefore, many
polar and sub-polar copepod species spend the winter period diapausing or they
metabolize stored lipids which they accumulated during the productive seasons.
Their amount of storage lipids, e.g. wax esters may exceed 70% of the body dry
mass (Lee et al. 2006). In contrast to Calanus finmarchicus and Pseudocalanus
elongatus, the neritic copepods Acartia clausi, Centropages hamatus and Temora
longicornis do not accumulate wax esters as storage products (Kattner et al. 1981).
Only during the spring and late summer phytoplankton blooms the pool of storage
lipids (triacylglycerides) and the amount of polyunsaturated fatty acids increase.
28

Chapter 3: Physiological effects of food limitation
The patterns of fatty acids change with seasons, implying that these copepods utilize
different food sources throughout the year. An opportunistic nutritional strategy is
supported by high activities of carbohydrases, esterases/lipases, and proteases
which allow for rapid hydrolysation of alimentary lipids and proteins (chapter 2).
Fluctuations in food availability also appear in the otherwise highly productive coastal
waters of the southern North Sea due to the prevalence of low quality food species.
In winter when phytoplankton growth is low but nutrients are sufficient, high
proportions of detritus may reduce food quality (Mayzaud et al. 1998). Accordingly,
species which are physiologically not prepared to sustain periods of food limitation
may severely suffer from starvation. Acartia clausi, Centropages hamatus, C. typicus,
Paracalanus parvus, and Temora longicornis belong to the most frequent species of
calanoid copepods dominating the zooplankton community in the southern North Sea
(Krause 1995; Greve et al. 2004). A. tonsa is a brackish water species only abundant
in estuaries around the North Sea and in the Baltic Sea. Pseudocalanus elongates is
as abundant as the other small copepods. Similar to Calanus helgolandicus and C.
finmarchicus which, however occur only in minor numbers in the southern North Sea,
P. elongates is known to store wax esters. Corycaeus anglicus is a carnivorous
poecilostomatoid species that is mainly abundant from summer throughout winter.
The sublethal physiological effects of starvation in copepods have not yet been
sufficiently described. Acartia clausi, A. tonsa, Centropages hamatus but also
Calanus pacificus exhibit a hunger response after starvation with increased
respiration and feeding rates (Hassett and Landry 1988; Tiselius 1998; Thor 2003).
Harris et al. (1986) proposed a compensatory mechanism for balancing between
optimal foraging and assimilation as well as the costs of enzyme synthesis. Hassett
and Landry (1990) agree with their model that low food concentrations may increase
the digestive abilities of copepods to counterbalance threatening food limitation while
enzyme activities may decrease at very high food concentrations to reduce the effort.
However, Båmstedt (1988) pointed out that physiological responses to the
environment can vary considerably even within a population.
Accordingly, it appears to be crucial that we demonstrate biochemical and
physiological reactions on an individual basis. Studies on individual copepods,
however, are rare due to the lack of appropriate and sensitive micro-analytical
methods. The present work was aimed at studying the effects of short term starvation
on the digestive potential of copepods. The specific activities of a set of important
29

Chapter 3: Physiological effects of food limitation
digestive enzymes were measured in individuals and the expression of proteinase
isoforms was determined by zymograms (Guérin and Kerambrun 1982, García-
Carreño et al. 1993).
3.2. Material and MethodsLaboratory experimentsA. clausi and A. tonsa cultures were maintained in filtered natural sea water (1 µm
membrane filters) at 15 ± 1°C in a 16:8 hours light:dark cycle (culturing conditions).
They were fed ad libitum with Rhodomonas sp. (~500 µg C L-1) grown in semi-
continuous batch cultures in f/2-medium without silicate (Guillard and Ryther 1962;
Guillard 1975).
Survival under different food regimes was determined in artificial seawater at a
salinity of 30 (hw professional Meersalz, Wiegand GmbH, Krefeld, Germany). Ten to
thirteen A. clausi specimens were incubated in each of nine 1 L-bottles for 4 days
under culturing conditions. Water and food were exchanged every 24 h, copepods
were counted, and dead copepods were removed from the bottles. Control groups
were fed with the flagellate Rhodomonas sp. (500 µg C L-1). For biochemical
analyses 30 individuals of A. tonsa and A. clausi females were kept without food for 2
days. Control groups of 30 individuals of each species were fed ad libitum with
Rhodomonas sp.
Digestive enzyme activitiesActivities of chitobiase, beta-glucosidase, esterase/lipase, arginine- and alanine-
peptidase were measured with fluorogenic substrates in McIlvaine buffer (McIlvaine
1921) at pH 5 (carbohydrases) and pH 7 (esterase/lipase and aminopeptidases). All
enzyme activities were measured in the same extracts of each of 6 individuals per
species and treatment (chapter 3). Enzyme activities were normalised to the average
protein contents of 9-10 individuals of each species and treatment and were
expressed as specific activities (nmol h-1 mgprot-1).
Water soluble protein content of individualsAverage water soluble protein contents of individual copepods were determined with
a modified micro BCA-protein-assay (chapter 2) from Pierce Ltd. (no. 23231, 23232,
23234) (Smith et al. 1985).
30

Chapter 3: Physiological effects of food limitation
Protease zymogramsZooplankton was collected in autumn 2003 off Helgoland (German Bight, North Sea)
with plankton nets of 280 and 150 µm mesh size. Females and males of the species
Acartia clausi, Centropages typicus, Corycaeus anglicus, Paracalanus parvus and
Temora longicornis were sorted out immediately after capture and maintained for 2
days at 15 ± 1°C and 16:8 hours light:dark cycle, and fed with a flagellate mixture of
Rhodomonas sp., Isochrysis sp. and Oxyrrhis marina (Klein Breteler 1980). The
flagellates were grown in semi-continuous batch cultures on f/2-medium without
silicate (Guillard and Ryther 1962; Guillard 1975). Individuals of A. tonsa were
obtained from cultures at the marine station that were kept under the same culturing
conditions as T. longicornis. Specimens selected for biochemical analyses were
briefly rinsed with deionised water, blotted dry and immediately deep frozen at -80°C.
Individual copepods or pools of 10 animals were homogenised in 15 or 100 µL
sample buffer (0.12 mol L-1 Tris/HCl buffer, pH 6.8) containing 30% glycerine and 4%
sodium dodecyl sulphate (SDS) and traces of bromophenol blue. Samples were
centrifuged (15000 g, 4°C, 10 min) and 5-10 µL of the supernatants were applied to
mini-gels (8 x 10 x 0.075 cm) for discontinuous SDS-PAGE (Laemmli 1970;
Schägger and von Jagow 1987). The composition of the stacking gel was 4%T,
2.6%C (0.5 mol L-1 Tris/HCl buffer, pH 6.8), and the composition of the separation gel
was 12.3%T, 2.6%C (1.5 mol L-1 Tris/HCl buffer, pH 8.8). Two gels with the same
samples were run in parallel in a vertical electrophoresis unit (Hofer SE 250, 300 V,
15 mA per gel, 0 °C)
Following the native SDS-PAGE gels were incubated in an icecold 3% casein
solution (0.05 mol L-1 Tris/HCl, pH 8.0) for 30 min. Casein was allowed to penetrate
into the gels for 30 min while being cooled in an ice water bath. Thereafter,
temperature was raised to ~25°C and active proteases were allowed to digest casein
in the gel for another 90 min (García-Carreño et al. 1993). Gels were rinsed
thoroughly with deionised water and stained overnight (0.1% coomassie billiant blue
R-250 in 40% methanol and 10% acetic acid solution). The next morning gels were
de-stained in a 40% methanol and 10 % acetic acid solution.
Clear zones represented active endopeptidases due to casein digestion in an
otherwise blue casein containing gel. Molecular weight markers (Sigma Low Range
Marker (6.5-66 kDa) and a 10 kDa-step marker, Biomol) were applied to each gel.
31

Chapter 3: Physiological effects of food limitation
Gels were photographed (BioRad ChemiDocTMXRS camera system) and analysed
using QuantityOne analysis software (BioRad).
Statistics Statistical analysis of data sets was carried out with the Statistica 6.1 software
package (StatSoft, Inc., Tulsa, OK, USA). Homogeneously distributed data were
tested for significant differences with an ANOVA and Least Significance Difference
test or Student-t-test. Data that were not homogeneously distributed were tested for
significant differences with the non-parametric Wald-Wolfowitz-Test and corrected for
small sample sizes.
3.3. ResultsMortality and survival after starvationAfter 24 hours, copepods died only in the treatments without food. From the second
day on mortality occurred in both treatments (Fig. 3.1). For copepods without food
the average daily mortality rate amounted to 19 ± 2% (means ± SE) as compared to
the 6 ± 2% rate in the Rhodomonas sp. control. Mortality rates and survival were
significantly different between treatments on all four days (LSD-Test, p≤0.05).
32
Fig. 3.1: Acartia clausi: percent survivors without food or fed with Rhodomonas sp. (500 µg C l-1), (means ± SE, N=9-10).
days0 1 2 3 4
surv
ivor
s (%
)
40
50
60
70
80
90
100
110
no foodRh. 500 µg C l-1

Chapter 3: Physiological effects of food limitation
Hunger experiments – digestive enzyme activities and protein contentsAlanine aminopeptidase activity was significantly higher in starving than in fed A.
clausi individuals ( p=0.034 ) (Fig. 3.2a). No significant differences appeared in
arginine aminopeptidase (Fig. 3.2b), esterase/lipase (Fig. 3.2c), and beta-
glucosidase activity (Fig. 3.2e). Chitobiase activity was significantly lower in unfed
than in fed individuals ( p=0.034 , Fig. 3.2d). In starving A. tonsa individuals only
chitobiase activity was significantly lower than in fed individuals ( p=0.024 , Fig.
3.3d). A decrease of alanine aminopeptidase activity was caused by the no food
treatment with only 89% probability ( p=0.11 , Fig. 3.3a). Activities of arginine
33
Fig. 3.2: Acartia clausi: specific digestive enzyme activities of fed and non-fed individuals; (N=6 ± SE); *: treatments significantly different.
c) esterase/lipase
(nm
ol h
-1 m
g pro
t-1)
0
500
1000
1500
2000
2500
e) beta-glucosidase
food no food0
50
100
150
200d) chitobiase
food no food
(nm
ol h
-1 m
g pro
t-1)
0
20
40
60
80
100
b) arginine aminopeptidase
0
10
20
30
40a) alanine aminopeptidase
(nm
ol h
-1 m
g pro
t-1)
020406080
100120140160
*
*

Chapter 3: Physiological effects of food limitation
aminopeptidase (Fig. 3.3b), esterase/lipase (Fig. 3.3c) and beta-glucosidase (Fig.
3.3.e) did not differ significantly between treatments. Water soluble protein contents
declined in starving A. tonsa ( p0.001 ) while no significant difference appeared
between fed and unfed A. clausi (Fig. 3.4).
Hunger experiments – protease zymogramsProtease zymograms of A. tonsa individuals did not show differences between
hunger and control treatments (Fig. 3.5). However, individual variability was common,
particularly in the expression of the 54 kDa band and to a lesser extent the
34
Fig. 3.3: Acartia tonsa: specific digestive enzyme activities of fed and non-fed individuals (N=6 ± SE); *: treatments significantly different.
a) alanine aminopeptidase(n
mol
h-1
mg p
rot-1
)
0
20
40
60
80
c) esterase/lipase
(nm
ol h
-1 m
g prot
-1)
0
200
400
600
800
1000
1200
e) beta-glucosidase
food no food0
200
400
600
800
d) chitobiase
food no food
(nm
ol h
-1 m
g prot
-1)
0
50
100
150
200
250
b) arginine aminopeptidase
0
20
40
60
80
100
120
*

Chapter 3: Physiological effects of food limitation
expression of the 17.6 and 19.3 kDa enzyme bands. Activity bands in the two A.
clausi gels were too weak to be photographed and visualized with QuantityOne
Software. However, after trans-illumination on a light box visible details of the gels
were identified and recorded manually. The 65.6 kDa band only occurred in 3 of 6
individuals in the control group. The 46.4 kDa band was present in all animals but
appeared generally weaker in the hunger group. The 23.5 kDa band was present in
all individuals, however, it was weaker in one of the starved individuals. The 20.1 kDa
band was only visible in one individual of each group. The 15.5 kDa band was only
weakly visible in 2 control and 3 hunger group individuals.
Species comparison – protease zymograms The protease zymograms of 6 common copepod species revealed individual inter-
specific patterns (Fig. 3.6a) with distinct activity bands (Fig. 3.6b). In most species
several activity bands were present. The highest numbers of casein digesting
proteases appeared in A. clausi (8 bands) and T. longicornis (7 bands). In C. typicus
and T. longicornis some active proteins had not migrated into the gel (light band on
top of the lanes, Fig. 3.6a). A. tonsa and T. longicornis zymograms of females and
males showed the same pattern (Fig. 3.7). No sex-specific differences were present.
35
Fig. 3.4: Water soluble protein content of fed and non-fed Acartia clausi and A. tonsa specimens (means ± SE, N=9-10); *: treatments significantly different.
Acartia clausi Acartia tonsa
wat
er s
olub
le p
rote
in (µ
g)
0.0
0.5
1.0
1.5
2.0
2.5
3.0foodno food
*
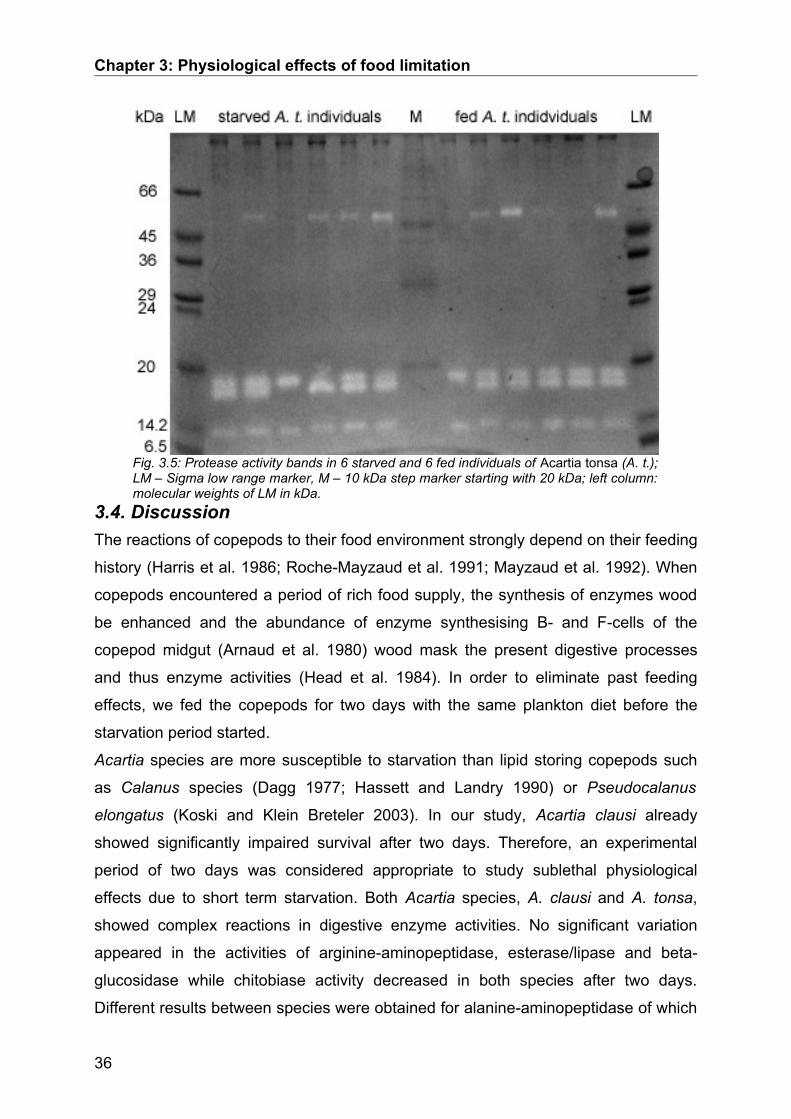
Chapter 3: Physiological effects of food limitation
3.4. DiscussionThe reactions of copepods to their food environment strongly depend on their feeding
history (Harris et al. 1986; Roche-Mayzaud et al. 1991; Mayzaud et al. 1992). When
copepods encountered a period of rich food supply, the synthesis of enzymes wood
be enhanced and the abundance of enzyme synthesising B- and F-cells of the
copepod midgut (Arnaud et al. 1980) wood mask the present digestive processes
and thus enzyme activities (Head et al. 1984). In order to eliminate past feeding
effects, we fed the copepods for two days with the same plankton diet before the
starvation period started.
Acartia species are more susceptible to starvation than lipid storing copepods such
as Calanus species (Dagg 1977; Hassett and Landry 1990) or Pseudocalanus
elongatus (Koski and Klein Breteler 2003). In our study, Acartia clausi already
showed significantly impaired survival after two days. Therefore, an experimental
period of two days was considered appropriate to study sublethal physiological
effects due to short term starvation. Both Acartia species, A. clausi and A. tonsa,
showed complex reactions in digestive enzyme activities. No significant variation
appeared in the activities of arginine-aminopeptidase, esterase/lipase and beta-
glucosidase while chitobiase activity decreased in both species after two days.
Different results between species were obtained for alanine-aminopeptidase of which
36
Fig. 3.5: Protease activity bands in 6 starved and 6 fed individuals of Acartia tonsa (A. t.); LM – Sigma low range marker, M – 10 kDa step marker starting with 20 kDa; left column: molecular weights of LM in kDa.

Chapter 3: Physiological effects of food limitation
activity increased in A. clausi but remained unchanged in A. tonsa. Apparently, both
species do not react in the same way to short term starvation. A detailed
interpretation, however, has to include the time scales of physiological reactions and
the function of the analysed enzymes.
a) b)
A.c. A.t. C.a. P.p. C.t. T.l.
65.654.0 54.5
50.4 48.946.435.4 35.227.8 27.623.5 22.5 22.3 21.820.1 20.5 21.1 20.6
19.3 18.8 19.017.6 17.0 17.1
15.5 15.013.4
Fig. 3.6: a) Protease activity bands of species (pools of 10 individuals): LM – Sigma low range marker, A. c. - Acartia clausi, A .t. - Acartia tonsa, C. a. - Corycaeus anglicus, M – 10 kDa step marker starting with 20 kDa, P. p. - Paracalanus parvus, C. t. – Centropages typicus, T. l. - Temora longicornis; left column: molecular weights of LM in kDa. b) Table with molecular weights of copepod proteases in kDa.
Time scales of reactionsReactions of copepods to starvation and resulting changes in their enzyme activities
have been studied in several species. Most distinct enzyme activity decreases
appeared at the long term scale in different omnivorous Calanus species (Hirche
1996; Han et al. 2002), carnivorous cyclopoid species (Krylov et al. 1996) and
harpacticoid copepods (Lonsdale et al. 1998) which undergo diapause during non-
supportive environmental conditions. In order to save metabolic energy these species
reduce the synthesis of metabolic superficial enzymes and increase the utilization of
endogenous storage products such as lipids and proteins. The reduction of digestive
enzyme activities coincides with reduced gut epithelia and, therefore, with depleted
enzyme stores (Hallberg and Hirche 1980).
Reactions of copepod digestive enzymes to short-term starvation were less distinct
and the available studies do not provide coherent results. No changes in enzyme
activities were reported in Calanus pacificus and Acartia tonsa upon short-term
starvation (Hassett and Landry 1988; Hassett and Blades-Eckelbarger 1995) nor did
digestive enzyme activities follow diurnal feeding rhythms in Temora longicornis and
Centropages hamatus (Head et al. 1984), or in Pseudocalanus elongates and
37
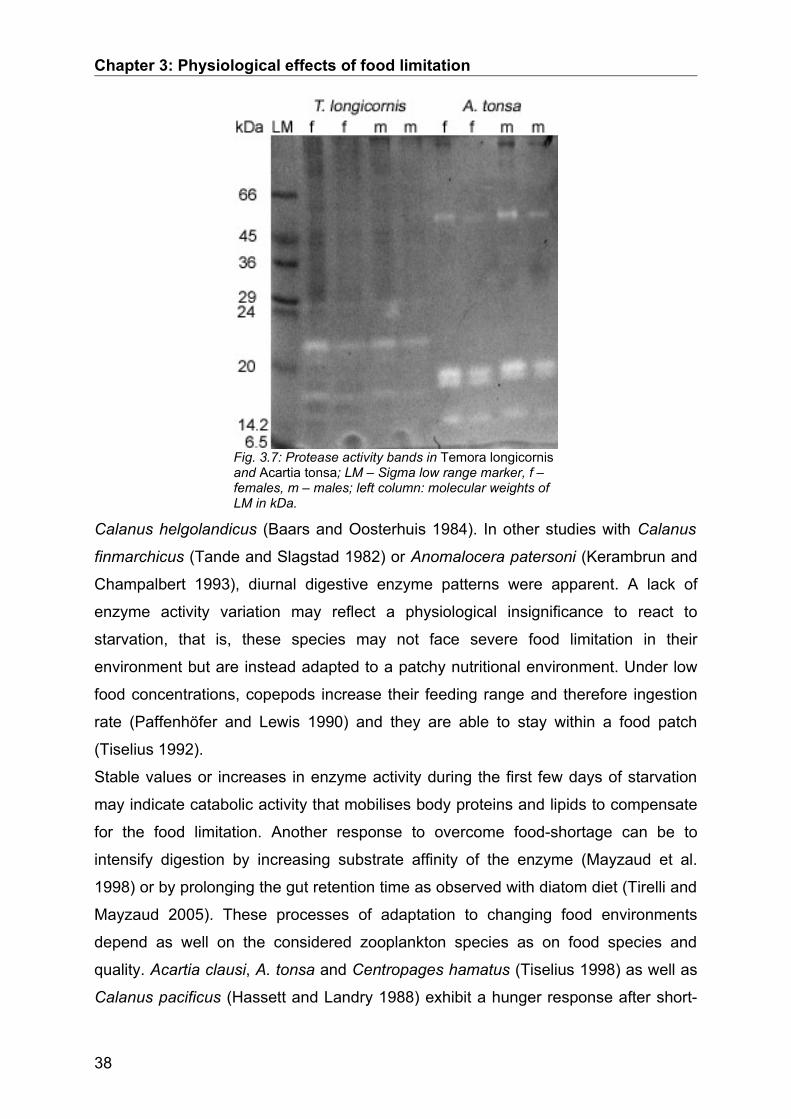
Chapter 3: Physiological effects of food limitation
Calanus helgolandicus (Baars and Oosterhuis 1984). In other studies with Calanus
finmarchicus (Tande and Slagstad 1982) or Anomalocera patersoni (Kerambrun and
Champalbert 1993), diurnal digestive enzyme patterns were apparent. A lack of
enzyme activity variation may reflect a physiological insignificance to react to
starvation, that is, these species may not face severe food limitation in their
environment but are instead adapted to a patchy nutritional environment. Under low
food concentrations, copepods increase their feeding range and therefore ingestion
rate (Paffenhöfer and Lewis 1990) and they are able to stay within a food patch
(Tiselius 1992).
Stable values or increases in enzyme activity during the first few days of starvation
may indicate catabolic activity that mobilises body proteins and lipids to compensate
for the food limitation. Another response to overcome food-shortage can be to
intensify digestion by increasing substrate affinity of the enzyme (Mayzaud et al.
1998) or by prolonging the gut retention time as observed with diatom diet (Tirelli and
Mayzaud 2005). These processes of adaptation to changing food environments
depend as well on the considered zooplankton species as on food species and
quality. Acartia clausi, A. tonsa and Centropages hamatus (Tiselius 1998) as well as
Calanus pacificus (Hassett and Landry 1988) exhibit a hunger response after short-
38
Fig. 3.7: Protease activity bands in Temora longicornis and Acartia tonsa; LM – Sigma low range marker, f – females, m – males; left column: molecular weights of LM in kDa.
Chapter 3: Physiological effects of food limitation
term starvation. Their ingestion rates increase beyond levels that are observed in the
same food concentrations before starvation. The respiration rate is elevated in A.
tonsa that are recovering from short-term starvation periods reflecting increased
activity and metabolism (Thor 2003). Stable or elevated enzyme activity levels in the
beginning of food limitation are a perfect match to a feeding behaviour that
compensates for the experienced nutritional shortcomings during the search for a
new food patch. Species-specific acclimation times to reduced food levels can be
explained by different foraging strategies, habitat ranges and vertical migration
patterns that avoid or are adapted to periodic food limitation (Tiselius 1998).
Instantaneous reduction of enzyme expression upon starvation was shown for trypsin
in Temora longicornis (Kumlu 1997) and for 3 carbohydrases in Calanus pacificus
(Hassett and Landry 1990). However, the dynamics in Calanus pacificus depended
on the origin of the animals and their initial enzyme levels. Low initial enzyme levels
were present in small specimens that partly comprised animals from the over-
wintering population; higher initial levels were measured in large animals of later
spring generations. An enzyme activity decrease was only observed in the large
animals. On a longer time scale all studies named above showed decreased enzyme
activities in copepods upon starvation, decreases occurring later in lipid storing
species. The drop in enzymatic expression was often followed by an increase in
mortality. In these cases, the species apparently reduced synthesis of enzymes and
saved metabolic energy to sustain longer starvation periods.
Digestive enzymes react faster to food quality changes than to changes in
concentration (Mayzaud et al. 1998). Hence, the digestive system of copepods is a
potential mediator for observed low quality food inhibition of growth and reproduction
in copepods (Koski et al. 1998).
Role of enzymesThe interpretation of varying enzyme activities has to consider the detailed
biochemical function of the studied enzyme. Enzymes which are released from gut
cells to predominantly digest external food need to be distinguished from those
enzymes which are also capable of hydrolysing internal storage products.
Chitinolytic enzymes are involved in digestion and in moulting. They express specific
isoforms in the digestive tract and in the integument (Peters et al. 1999). Since adult
copepods do not grow and moult, the presence of moulting chitobiases may be
neglected. Accordingly, the observed decrease in chitobiase activity is most likely a
39

Chapter 3: Physiological effects of food limitation
reaction of the digestive enzyme to the lack of suitable substrates. Similar reactions
were observed in euphausids. Starvation caused a reduction of chitinolytic activity in
the stomachs and in the midgut glands of Antarctic krill (Saborowski and Buchholz
1999). Chitobiase pools are apparently quickly depleted and not needed for
catabolism upon starvation.
Beta-glucosidase and lipase/esterase are enzymes that could participate in
catabolism of body proteins and lipids. Beta-glucosidase hydrolyses terminal beta-D-
glucose mainly from the mainly beta-linked structural polysaccharides and is also
involved in metabolic processes. Lipases/esterases are degrading lipids. Copepods
that do not store lipids put their energy uptake into reproduction as long as their basic
metabolic needs are met. Triacylglycerols are directly transferred into egg production
in copepods (Gatten et al. 1980).
Exopeptidases, such as alanine-aminopeptidase, may be important in the
mobilisation of internal body stores. In starving zooplankton, internal proteins and
lipids are degraded (Mayzaud 1976). The mode and rate of lipid and protein
catabolism varies significantly between species and their ability to accumulate
storage products. Elevated catabolism of endogenous proteins upon starvation was
observed in A. clausi (Mayzaud 1976) and T. longicornis (Helland et al. 2003). Both
species are not capable of storing significant lipid reserves and thus catabolise
internal proteins upon starvation. Accordingly, activities of protein-hydrolysing
enzymes have to remain high to supply metabolites. In particular, alanine represents
an important metabolite which can enter and supply metabolic pathways in many
positions.
Basic metabolism is maintained on reduced levels upon starvation (Thor 2003).
However, egg production ceases more rapidly in non-lipid storing copepods than in
lipid storing copepods (Dagg 1977). Quantitative and qualitative food limitation
affects egg production even in lipid-storing copepods and the negative effect can
prevail (Rey-Rassat et al. 2002b; Niehoff 2004). Such a negative effect is probably
caused by high costs of gonad maturation (Niehoff 2000; Rey-Rassat et al. 2002a).
ZymogramsProteins are a very important group of nutrients, thus proteolytic enzymes are
essential in the digestive tract of most organisms. In crustaceans, endopetidases
appeared in various isoforms. The analysis of endopeptidases by zymography is a
suitable tool to reveal differences between species, sexes, or treatments (Einsele
40

Chapter 3: Physiological effects of food limitation
1988, Schwenzen and Bulnheim 1991, Kerambrun and Champalbert 1975). The
protease isozyme patterns of the two Acartia species were similar in fed and starved
animals. These results are in agreement with the enzyme activity measurement,
showing that the two copepod species do not visibly alter enzyme patterns.
Apparently, the genetic variation of proteases was more pronounced than possible
nutritional effects. Such an internal determination of isotrypsin patterns independent
of potential external nutritional stimuli was described for whiteleg shrimp
(Litopennaeus vannamei) (Sainz et al. 2005).
Species specificityInter-specific patterns of metabolic and digestive enzymes in copepods have been
described (Riviere 1983) and used for the biochemical identification of species in the
genera Megacyclops (Einsle 1988) and Tisbe (Schwenzer and Bulnheim 1991). The
expression of different isoforms of digestive enzymes was identified as a factor that
controls food preference in amphipods (Guarna and Borowsky 1993; Sotka 2003). A
feedback mechanism between digestive system and food ingestion, mediated by
chemoreception is suggested for copepods (Mayzaud et al. 1998). The
endopeptidase zymograms of the copepods analysed for this study showed high
species-specificity. Almost no overlap of protease bands was detected between
species. Even closely relates species like A. clausi and A. tonsa showed
characteristic individual isozyme patterns.
Sexual differencesSimilarities in the protease patterns between sexes as observed in A. tonsa and T.
longicornis hint to a similar nutrition of males and females. This observation is in
contrast to sexual dimorphic esterase zymograms in Anomalocera patersoni
(Kerambrun and Champalbert 1975). Esterases participate in lipid degradation and,
therefore, in the transfer of nutritional lipids into egg production (Kattner and Krause
1989).
Conclusion In the south-eastern North Sea copepod species that do not store significant
amounts of lipids are abundant. Their digestive physiology and feeding behaviour is
optimally adapted to an environment where patchiness may appear but extended
periods of starvation are rarely encountered. They are able to survive short starvation
periods of only a few days. However, starvation has implications for population
41

Chapter 3: Physiological effects of food limitation
dynamics because it affects egg production. The energy that can be released from
internal body nutrients is only sufficient for basic metabolism for a few days. The
synthesis of enzymes that do not participate in catabolism decreases immediately.
Some enzyme activities remain high during short-term starvation, probably so that
the copepods can be prepared for compensatory feeding (hunger response) when
the next food patch is foraged and/or to aid in metabolising body proteins and lipids
to maintain basic metabolism.
42

Chapter 4: Food quality and egg production – spring bloom
Chapter 4: Influence of food quality and quantity on egg production of Acartia clausi and Temora longicornis during a spring phytoplankton bloomEgg production of Acartia clausi and Temora longicornis was monitored off Helgoland
(54°11N, 7°54E, North Sea, German Bight) from mid February until the end of May
2004. It was accompanied by a high-frequency sampling of abiotic and biotic
environmental parameters, and the determination of size-fractionated grazing. The
food quality parameters, seston C:N ratio, and particulate organic phosphorus (POP)
content of total particulate phosphorus (TPP) explained more of the variance in
carbon-specific and temperature normalized egg production than food quantity
parameters. The quality of size classes changed seasonally, and the copepods
preferred different size classes in different periods of spring. Similarities and
differences in food gathering strategies of the two co-occurring copepod species are
discussed.
4.1. IntroductionCopepods play a central role in marine food webs. Their population dynamics
influence the constitution and development of primary producer communities, directly
by grazing (Sommer 1988; Cyr and Curtis 1999), or indirectly through competition
with other grazers, or by grazing on other herbivores (Kiørboe et al. 1996; Gasparini
et al. 2000). Furthermore, their number and nutritional quality influence the
reproduction and survival of secondary consumers such as fish (St. John et al. 2001;
Malzahn 2006), or they act as transmitters of toxins such as paralytic shell fish
poisoning (PSP) (Turner et al. 2000). As a consequence, it is of paramount
importance to understand the factors that drive reproductive success in copepods.
Many factors have been identified that influence reproductive success of copepods:
temperature, salinity, and turbulence are the most important abiotic factors, whereas
the nutritional environment, food quantity and quality are the main biotic drivers of
reproductive success. However, it remains unclear, how these different factors
interact.
Female size strongly effects egg production of A. clausi and T. longicornis (Halsband
and Hirche 2001). Temperature and food concentration influence copepod size (Klein
Breteler and Gonzales 1988) and gonad maturity, and therefore affect egg production
(Niehoff 2003). Turbulence influences depth preference and prey encounter rate, and
therefore grazing performance of copepods (Kiørboe and Saiz 1995; Visser et al.
43
Chapter 4: Food quality and egg production – spring bloom
2001). The evaluation of food quality effects is more complex. Nutrient limitation
(John and Flynn 2000) and age (Estep et al. 1990) influence the biochemical
composition of prey species. Biochemical deficient food can hamper reproductive
success: highly-unsaturated fatty acids (Jónasdóttir et al. 1995), essential amino
acids (Guisande et al. 2002; Arendt et al. 2005), and sterols (Klein Breteler et al.
1999; Hassett 2004) are important quality determinants. Potentially toxic food
species decrease the effective food concentration, or when grazed upon, affect the
reproductive success of copepods. Examples are: aldehyde-producing diatoms such
as Skeletonema costatum and Thalassiosira rotula (Ianora et al. 2004),
dimethylsulfoniopropionate (DMSP) producing prymnesiophyte Phaeocystis globosa
(Hansen 1995; Koski et al. 2005), and paralytic shell fish poisoning (PSP) producing
Alexandrium sp. (Dutz 1998; Teegarden 1999).
Many copepods are known to feed omnivorously on phytoplankton, microzooplankton
and on detritus (Kleppel 1993). However, copepods do not feed indiscriminately on
all potential food particles. To increase feeding efficiency, they select for large size
(Hansen et al. 1994) and high quality (Cowles et al. 1988; DeMott 1988; Koski and
Klein Breteler 2003) of food particles. Grazing on cells that are of different nutritional
quality but belong to the same food species can vary stronger than grazing on
different species (Long and Hay 2006). Further, ingestion rates of copepods depend
on their feeding history (Donaghay and Small 1979; Donaghay 1988).
In freshwater ecosystems the role of macronutrient ratios (C:N:P) has been
researched extensively, as reviewed by Frost et al. (2005). Macronutrient ratios
influence ecosystems, that is, autotrophs change their stoichiometry and
concomitantly their biochemical composition depending on nutrient availability, while
herbivores and higher level carnivores stay homeostatic (Sterner and Elser 2002).
Therefore, nitrogen and/or phosphorus depletion lead to a potential imbalance
between the homeostatic consumer and its food. This imbalance causes costs in the
consumer that affect ontogenetic development, growth, and reproduction (Sterner
and Schulz 1998; Boersma 2000). However, grazers can adjust their feeding
behaviour and physiology to cope with nutritional imbalances: selective feeding
(DeMott 1989; Acharya et al. 2004), compensatory ingestion (Plath and Boersma
2001), and adjusted digestion (Darchambeau 2005) can decrease negative effects of
imbalanced food. Therefore, the implementation of stoichiometric food quality into
models may greatly enhance model predictability (Mitra 2006).
44

Chapter 4: Food quality and egg production – spring bloom
We studied the influence of changing bulk seston macronutrient ratios on the
reproduction of two dominant North Sea copepods, Acartia clausi and Temora
longicornis. Concomitantly, size selective grazing on the natural seston particle
assembly was measured for both species. The potential nutrient uptake of copepods
was calculated for different particle size classes at three phases of spring 2004
(before phytoplankton increase, during increase, and at maximum).
4.2. Material and MethodsSampling – animals and surface seawaterThe copepods, Acartia clausi and Temora longicornis, were sampled twice weekly
throughout a period from mid February until the end of May 2004 off Helgoland
(54°11.3'N, 7°54.0'E, North Sea, German Bight). Adult females were selected and
transferred to experimental vessels containing natural sea water at in situ
temperature, at the same time other females were shortly rinsed with deionised
water, blotted dry and frozen at -80 °C for biochemical and physiological analyses.
Surface seawater samples were taken simultaneously with zooplankton samples,
pre-filtered (300 µm), and stored cold in opaque 10 L plastic containers until filtration
or use in experiments within 4 hours. 250 mL were stored in brown bottles, fixed with
Lugol’s solution, and subsequently used to count particles. For each seston
parameter (total particulate carbon (TPC), nitrogen (TPN), phosphorus (TPP), and
particulate organic (POP) and inorganic phosphorus (PIP)) 3 to 6 parallels of 300-
1200 mL were filtered onto pre-combusted (6 h, 420 °C) glass fibre filters (Whatman,
GF/C, 25 mm diameter). Smaller animals were picked from the filters under a
dissection microscope at 50x magnification after filtration. Filters were stored
individually in reaction tubes at -80 °C.
Additional samples were taken three times during spring to investigate size-
fractionated division of nutrients, grazing on the major size classes, and the
enzymatic composition of the two copepod species under investigation. This was
done whithin an early period of low food concentration (February and March = period
a), a period when phytoplankton biomass was building-up (April = period b), and a
period of highest phytoplankton biomass (May = period c). Four different size classes
were created (< 10 µm, 10-40 µm, 40-100 µm, and 100-300 µm). The <10 µm
fraction dominated at all times. Therefore, a subtractive sampling strategy would
have masked results of less abundant size classes. Sea water samples were
45
Chapter 4: Food quality and egg production – spring bloom
fractionated by gently pouring the water through a set of sieves. The fractions > 10
µm were resuspended in 450-500 mL filtered sea water (Whatman GF/C), gently
mixed, and even volumes distributed between filters; the < 10 µm fraction was filtered
directly. Ten litre volumes per filter were necessary to yield enough material in the
two larger size fractions, while 500-700 mL were sufficient for the <10 µm fraction.
The summed up fraction results gave total seston values that were comparable to
values measured within 2 days earlier or later.
Abiotic environmental dataSea surface temperature was determined during sampling. Wind and weather data
for Helgoland were collected from Deutscher Wetterdienst (www.dwd.de), and lunar
and tidal information from Bundesamt für Seeschifffahrt und Hydrographie
(www.bsh.de) to check the data for biases caused by wind and tides.
Phytoplankton determinationPhytoplankton was counted by the Utermöhl method in 25 and 50 mL samples
(Utermöhl 1931), and phytoplankton biomass and organic phytoplankton carbon were
calculated from cell sizes (PhytoC) (Hillebrand et al. 1999). The percentage of
phytoplankton carbon on total particulate carbon was determined (PhytoC
percentage).
Dry mass, C, N and P determinationTotal particulate carbon (TPC) and nitrogen (TPN) contents of freeze dried and heat
dried (60°C, 12 h) seston filters and 5 to 50 copepods were measured with a CHN
analyser (Fisons Instruments EA 1108). Acetanilid (Thermo Quest, 338 36700)
served as standard. Molar C:N ratios were calculated. C and N were analysed in the
same samples.
We differentiated between particulate organic phosphorus (POP) and particulate
inorganic phosphorus (PIP) of the seston filters after (Aspila et al. 1976). Total
particulate phosphorus (TPP) was determined by combusting the filters at 520°C for
two hours, extraction in 6 mL1N HCl for 18 hours and measuring dissolved inorganic
phosphorus (DIP) in the neutralized extract after Grasshoff et al. (1983). PIP was
determined by extracting the uncombusted filters for 18 hours in 6 mL 1N HCl and
measuring DIP in the neutralized extract with an AutoAnalyser after Grasshoff et al.
(1983). POP was calculated from the difference between average TPP and PIP. The
percentage of POP on TPP was calculated (POP %).
46

Chapter 4: Food quality and egg production – spring bloom
Copepod egg productionThirty females of each species were transferred into the wells of 6-well microplates.
Each well contained 9-10 mL sieved seawater (55 µm). Temperature and light
conditions were adjusted to in situ conditions every day (WTB binder incubator). After
24 hours females were removed from the wells, and prosome lengths were
determined under a dissection microscope using a video analysis system (analysis,
Soft Imaging System). Individually based egg production of both species was
correlated to temperature (A. c.: r 2=0.39 , p=0.002 ; T. l.: r 2=0.60 ,
p=0.00003 ) and animal carbon content (A. c.: r 2=0.62 , p=0.00001 ; T. l.:
r 2=0.45 , p=0.0006 ). To detect correlations of egg production with nutritional
factors, individual egg production was standardised to a temperature of 10°C with a
Q10=3 (Kiørboe and Sabatini 1995) and normalised to calculated carbon contents
of the animals. Therefore, when egg production is mentioned in the following,
temperature standardised (10 °C) carbon specific egg production is meant.
Carbon contents were calculated from the linear regression of measured carbon
contents with average prosome lengths of all available Helgoland Roads data (T.
longicornis: µgC=0.0470∗length−31.71 , r=0.81 , r 2=0.66 , p0.000001 ,
N=118 measured between 10/02/2004 and 24/05/2005; A. clausi:
47
Fig. 4.1: Measured A. clausi and T. longicornis carbon values against calculated carbon (see methods), means ± SE; line denoting 1:1 relationship.
measured copepod C (µg)
0 5 10 15 20 25
calc
ulat
ed c
opep
od C
(µg)
0
5
10
15
20
25A. c. T. l.
Chapter 4: Food quality and egg production – spring bloom
µgC=0.01184∗length−7.06 , r=0.93 , r 2=0.87 , p0.000001 , N=42
measured between 10/02/04 and 23/07/04). Calculated carbon values correspond
well with the fewer actually measured carbon values (Fig. 4.1). Phaeocystis globosa
dominated the phytoplankton community in May (44 % of phytoplankton carbon). As
this alga is a notoriously bad food for many copepods (Dutz et al. 2005), and we
were mainly interested in more subtle effects of the food, we excluded the May data
from the correlation analyses of biochemical nutritional factors with egg production.
Indeed egg production during May (displayed by open symbols in Fig. 4.2) was low.
Copepod grazing selectivitySeawater (300 µm pre-filtered) was gently siphoned into all experimental bottles.
Initial prey field was determined in 3 sub-samples. Grazing experiments were
conducted in three parallels in 1 L bottles with 7 T. longicornis, and 11 A. clausi
females per bottle. Changes in the number of potential food organisms independent
of copepod grazing were recorded in three controls without copepods. Experimental
and control bottles were incubated for 24 hours under in situ temperature and light
conditions (adjusted daily) and rolled overhead gently every hour during daytime;
from 10 pm to 9 am bottles were not moved. Grazing experiments were started
between 3 and 5 pm. Particle concentrations in size classes (3-5, 5-10, 10-20, 20-40
µm) were determined with a Casy particle counter (Schärfe System GmbH,
Reutlingen, Germany).
Size class specific and carbon specific gross grazing (GFRC) per day was calculated
using the arithmetic mean of particles in control (Ncontrol) and grazing bottles (Ngrazing)
after 24 hours available per copepod carbon (Cind) for both copepod species because
control growth was negligible (Vanderploeg et al. 1984): GFRC=N control−N grazing 24h∗N ind∗C ind
.
Negative ingestion values were set as zero. Particles larger than 40 µm were very
rare and not considered. Medium food concentration available per µg copepod
carbon was divided by the number of copepods in the grazing bottles (Nind) and their
average carbon content (Cind).
Size selective grazing is displayed by plotting the percentage of the size class in the
ingested food against the percentage of the same size class in the available food and
48
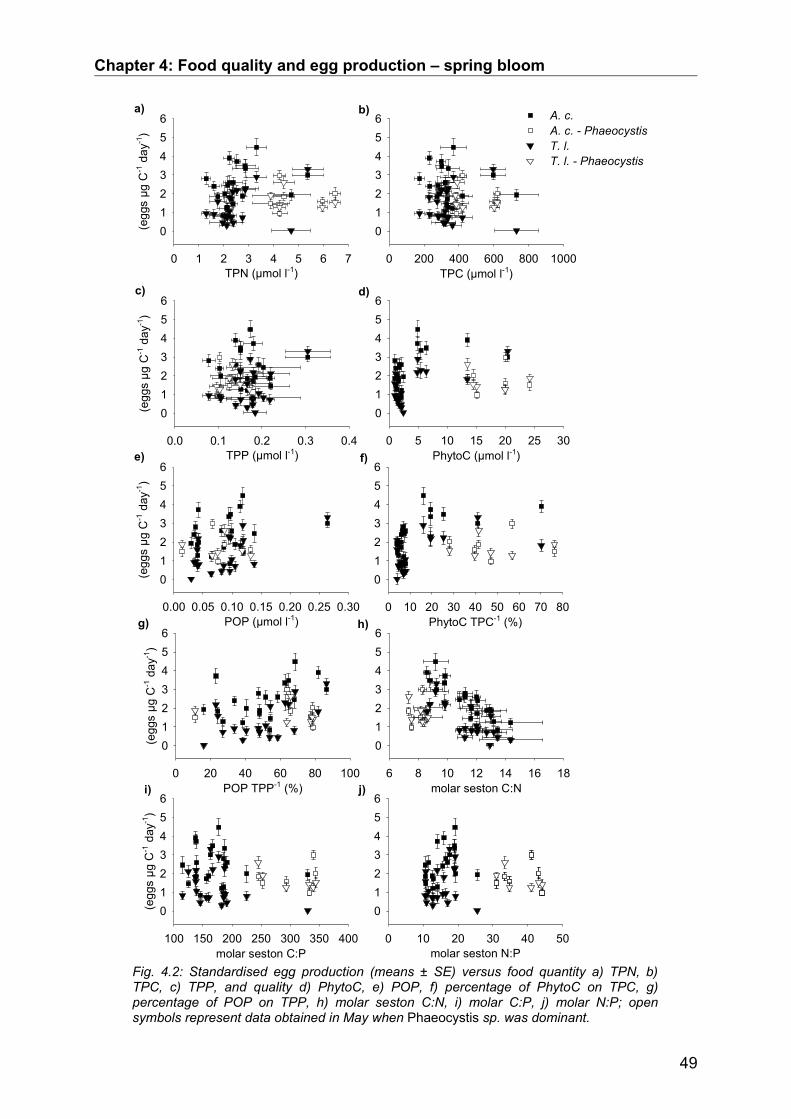
Chapter 4: Food quality and egg production – spring bloom
49
Fig. 4.2: Standardised egg production (means ± SE) versus food quantity a) TPN, b) TPC, c) TPP, and quality d) PhytoC, e) POP, f) percentage of PhytoC on TPC, g) percentage of POP on TPP, h) molar seston C:N, i) molar C:P, j) molar N:P; open symbols represent data obtained in May when Phaeocystis sp. was dominant.
a)
TPN (µmol l-1)0 1 2 3 4 5 6 7
(egg
s µg
C-1
day
-1)
0123456
b)
TPC (µmol l-1)0 200 400 600 800 1000
0123456
f)
PhytoC TPC-1 (%)0 10 20 30 40 50 60 70 80
0123456
g)
POP TPP-1 (%)0 20 40 60 80 100
(egg
s µg
C-1
day
-1)
0123456
h)
molar seston C:N6 8 10 12 14 16 18
0123456
i)
molar seston C:P100 150 200 250 300 350 400
(egg
s µg
C-1
day
-1)
0123456
j)
molar seston N:P0 10 20 30 40 50
0123456
A. c.A. c. - PhaeocystisT. l. T. l. - Phaeocystis
c)
TPP (µmol l-1)0.0 0.1 0.2 0.3 0.4
(egg
s µg
C-1
day
-1)
0123456
d)
PhytoC (µmol l-1)0 5 10 15 20 25 30
0123456
e)
POP (µmol l-1)0.00 0.05 0.10 0.15 0.20 0.25 0.30
(egg
s µg
C-1
day
-1)
0123456
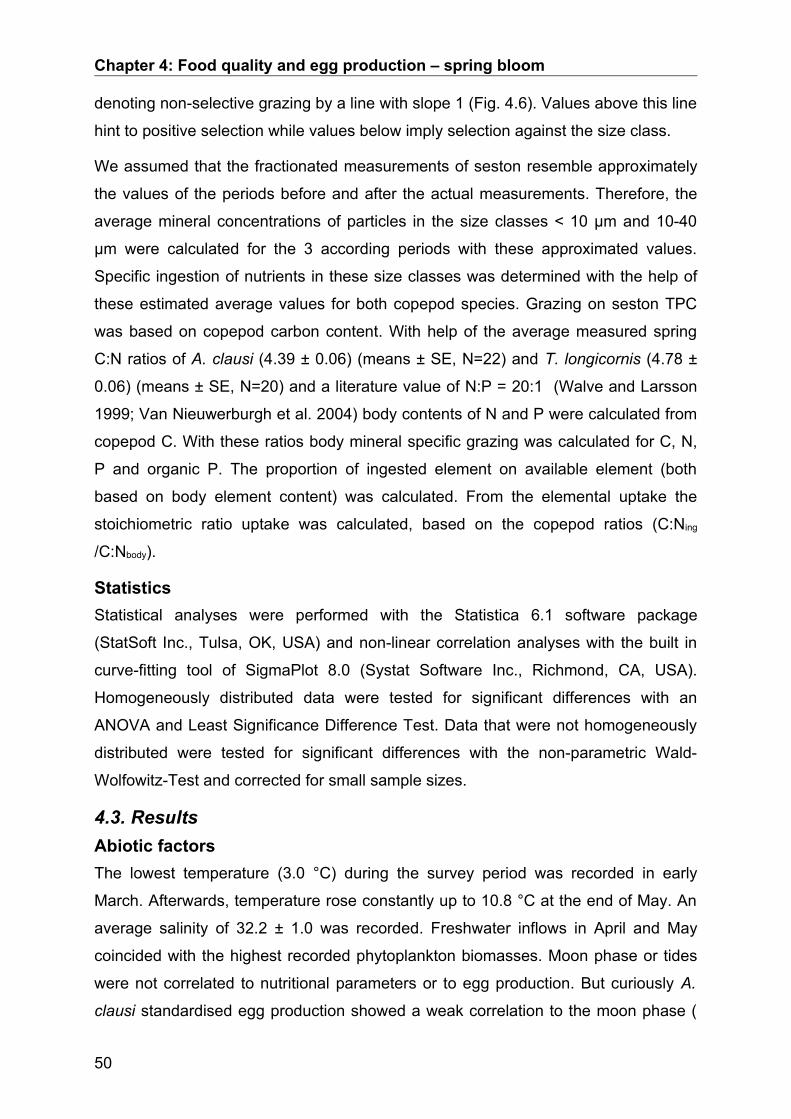
Chapter 4: Food quality and egg production – spring bloom
denoting non-selective grazing by a line with slope 1 (Fig. 4.6). Values above this line
hint to positive selection while values below imply selection against the size class.
We assumed that the fractionated measurements of seston resemble approximately
the values of the periods before and after the actual measurements. Therefore, the
average mineral concentrations of particles in the size classes < 10 µm and 10-40
µm were calculated for the 3 according periods with these approximated values.
Specific ingestion of nutrients in these size classes was determined with the help of
these estimated average values for both copepod species. Grazing on seston TPC
was based on copepod carbon content. With help of the average measured spring
C:N ratios of A. clausi (4.39 ± 0.06) (means ± SE, N=22) and T. longicornis (4.78 ±
0.06) (means ± SE, N=20) and a literature value of N:P = 20:1 (Walve and Larsson
1999; Van Nieuwerburgh et al. 2004) body contents of N and P were calculated from
copepod C. With these ratios body mineral specific grazing was calculated for C, N,
P and organic P. The proportion of ingested element on available element (both
based on body element content) was calculated. From the elemental uptake the
stoichiometric ratio uptake was calculated, based on the copepod ratios (C:Ning
/C:Nbody).
StatisticsStatistical analyses were performed with the Statistica 6.1 software package
(StatSoft Inc., Tulsa, OK, USA) and non-linear correlation analyses with the built in
curve-fitting tool of SigmaPlot 8.0 (Systat Software Inc., Richmond, CA, USA).
Homogeneously distributed data were tested for significant differences with an
ANOVA and Least Significance Difference Test. Data that were not homogeneously
distributed were tested for significant differences with the non-parametric Wald-
Wolfowitz-Test and corrected for small sample sizes.
4.3. ResultsAbiotic factorsThe lowest temperature (3.0 °C) during the survey period was recorded in early
March. Afterwards, temperature rose constantly up to 10.8 °C at the end of May. An
average salinity of 32.2 ± 1.0 was recorded. Freshwater inflows in April and May
coincided with the highest recorded phytoplankton biomasses. Moon phase or tides
were not correlated to nutritional parameters or to egg production. But curiously A.
clausi standardised egg production showed a weak correlation to the moon phase (
50

Chapter 4: Food quality and egg production – spring bloom
r 2=0.19 , p=0.05 , including May data) potentially indicating increased spawning
activity around full moon. Table 4.1: Food Quantity in size fractions (µmol l-1) and fraction percentages on the total particulate material < 300 µm (N=3-8; means ± SD).
FractionDate
TPCµmol
L-1 SD %
TPNµmol
L-1 SD %
TPPµmol
L-1 SD %
<10 µm
10/3/04 33.7 ± 4.0 77.9 2.96 ± 0.32 79.4 0.1621 ± 0.0026 84.214/4/04 21.9 ± 1.4 71.2 2.19 ± 0.11 67.2 0.1220 ± 0.0002 70.019/5/04 37.4 ± 2.4 72.4 5.04 ± 0.29 77.9 0.1074 ± 0.0044 71.6
10-40 µm
10/3/04 6.9 ± 1.6 15.9 0.55 ± 0.12 14.7 0.0210 ± 0.0017 10.914/4/04 4.5 ± 0.4 14.6 0.51 ± 0.03 15.8 0.0173 ± 0.0064 9.919/5/04 4.6 ± 0.1 8.9 0.53 ± 0.02 8.2 0.0083 ± 0.0072 5.6
40-100 µm
10/3/04 2.2 ± 0.4 5.0 0.17 ± 0.03 4.5 0.0089 ± 0.0011 4.614/4/04 2.5 ± 0.2 8.0 0.29 ± 0.02 9.0 0.0175 ± 0.0019 10.019/5/04 6.0 ± 0.2 11.6 0.59 ± 0.03 9.1 0.0253 ± 0.0037 16.9
100-300 µm
10/3/04 0.6 ± 0.2 1.3 0.05 ± 0.02 1.4 0.0006 ± 0.0005 0.314/4/04 1.9 ± 0.2 6.2 0.26 ± 0.03 7.9 0.0176 ± 0.0057 10.119/5/04 3.6 ± 0.2 7.0 0.31 ± 0.02 4.8 0.0088 ± 0.0011 5.9
Prey community structure influencing egg productionDiatom numbers began to develop at the beginning of April and reached maximum
densities by the end of April and in mid May. Standardised egg production of T.
longicornis was linearly correlated to diatom concentrations (centrales: r 2=0.40 ,
p=0.007 ; pennales: r 2=0.35 , p=0.01 ). However, the correlations were of a
saturation type exponential function similar as the function displayed by the PhytoC
proportion on TPC concentration during spring as correlated with egg production
(Fig. 4.3a and d). A. clausi standardised egg production was not correlated to diatom
concentrations but copepod carbon content was (centrales: r 2=0.24 , p=0.03 ;
pennales: r 2=0.24 , p=0.05 ). Ciliates peaked in mid February, in early March
and in mid April. No significant correlations of ciliate concentrations with standardised
egg production or copepod carbon content were found. During the whole period
flagellates smaller than 15 µm were abundant, the smaller ones were more abundant
in numbers than the larger ones. The diatom Thalassionema nitzschoides was
dominant until the end of April. Besides this species the diatom Paralia sulcata
played a major role in early spring until the end of March. In mid April other diatoms
(Chatonella sp., Guinardia delicatula, Odontella aurita, Thalassiosira decipiens and
51

Chapter 4: Food quality and egg production – spring bloom
T. nordenskjöldii) proliferated. During May, the haptophycean Phaeocystis globosa
dominated with maximum numbers of 13-14 million cells L-1 from 10th to 21st May
(with a dent of 2.8 million cells L-1 on the 13th May).
Stoichiometric food quantity and quality started to change considerably in the first
week of April (Table 4.1, Table 4.2 and Fig. 4.4). The proportion of PhytoC on TPC
(PhytoC %) increased from about 6 to 40%, the POP proportion of TPP (POP %)
from about 40 to 80% (Fig. 4.4a). An increase in POP concentration and a decrease
in PIP concentration interacted to lead to a higher POP proportion on TPP (Table
4.1).
52
Fig. 4.3: Regression plots: significant correlations of egg production with nutritional parameters as in Table 4.1 (only May data); in a) + b) regression function f(x)=a*(1-e-bx), otherwise linear regression.
b)
PhytoC TPC-1 (%)0 20 40 60 80
0123456
d)
POP TPP-1 (%)0 20 40 60 80 100
(egg
s µg
C-1
day
-1)
0123456
e)
molar seston C:N6 8 10 12 14 16 18
0123456
A. c.T. l. A. c. regressionT. l. regression
a)
PhytoC (µmol l-1)0 5 10 15 20 25
0123456
c)
POP (µmol l-1)0.00 0.05 0.10 0.15 0.20 0.25 0.30
(egg
s µg
C-1
day
-1)
0123456

Chapter 4: Food quality and egg production – spring bloom
Molar seston C:N improved from a poor quality 13:1 ratio to a higher quality 8:1 ratio
(Fig. 4.4b). This was mainly caused by the over-proportional increase in TPN as
compared to TPC. The ratios of seston C:P and seston N:P were lowest (= best
quality) in early and late April but revealed an increasing imbalance between
phosphorus and the other elements in May, exceeding any values determined before
(Fig. 4.4c). Table 4.2: Seston elemental contents during spring; data of size fractioned filters in italics.
Date TPC(µmol L-1)
TPN(µmol L-1)
TPP(µmol L-1)
POP(µmol L-1)
PIP(µmol L-1)
16/02/04 22.52 ± 1.66 2.01 ± 0.09 0.111 ± 0.007 0.047 0.0646 ± 0.007119/02/04 33.70 2.55 ± 0.21 0.182 ± 0.006 0.069 0.1138 ± 0.003323/02/04 30.25 ± 4.46 2.12 ± 0.28 0.166 ± 0.002 0.064 0.1020 ± 0.013526/02/04 25.99 ± 5.88 1.96 ± 0.54 0.179 ± 0.007 0.096 0.0824 ± 0.018901/03/04 28.15 ± 1.76 2.13 ± 0.08 0.152 ± 0.033 0.041 0.1105 ± 0.002604/03/04 35.01 ± 4.63 2.75 ± 0.08 0.219 ± 0.009 0.105 0.1134 ± 0.002108/03/04 23.83 ± 5.22 2.04 ± 0.41 0.106 ± 0.025 0.043 0.0631 ± 0.008410/03/04 43.34 ± 6.21 3.73 ± 0.49 0.193 ± 0.006 0.082 0.1106 ± 0.007811/03/04 26.76 ± 1.54 2.23 ± 0.14 0.193 ± 0.007 0.100 0.0931 ± 0.005115/03/04 19.39 ± 2.20 1.61 ± 0.23 0.103 ± 0.009 0.035 0.0683 ± 0.031018/03/04 14.52 ± 2.25 1.29 ± 0.19 0.078 ± 0.015 0.037 0.0412 ± 0.002922/03/04 60.88 ± 10.3 4.70 ± 0.77 0.184 ± 0.026 0.030 0.1546 ± 0.060125/03/04 27.81 ± 0.88 2.31 ± 0.06 0.179 ± 0.007 0.086 0.0931 ± 0.002629/03/04 26.79 ± 4.81 2.38 ± 0.38 0.140 ± 0.006 0.082 0.0580 ± 0.000901/04/04 22.88 ± 3.97 1.77 ± 0.33 0.166 ± 0.051 0.040 0.1259 ± 0.000705/04/04 27.48 ± 2.47 2.37 ± 0.20 0.220 ± 0.042 0.120 0.1008 ± 0.022608/04/04 23.33 ± 2.93 2.15 ± 0.24 0.203 ± 0.084 0.138 0.0652 ± 0.002713/04/04 28.25 ± 5.44 2.87 ± 0.52 0.151 ± 0.004 0.095 0.0563 ± 0.006314/04/04 30.71 ± 2.16 3.26 ± 0.18 0.174 ± 0.014 0.113 0.0615 ± 0.000915/04/04 30.69 ± 6.26 3.32 ± 0.40 0.173 ± 0.006 0.119 0.0546 ± 0.000919/04/04 25.14 ± 3.23 2.86 ± 0.41 0.151 ± 0.004 0.098 0.0531 ± 0.000122/04/04 24.89 ± 2.17 2.53 ± 0.16 0.180 ± 0.021 0.042 0.1386 ± 0.009926/04/04 19.12 ± 1.82 2.22 ± 0.22 0.139 ± 0.009 0.114 0.0255 ± 0.011529/04/04 49.72 ± 5.85 5.37 ± 0.62 0.305 ± 0.053 0.264 0.0411 ± 0.002403/05/04 32.47 ± 3.68 4.42 ± 0.41 0.132 ± 0.007 0.087 0.0450 ± 0.015506/05/04 32.07 ± 2.78 4.25 ± 0.31 0.096 ± 0.016 0.076 0.0205 ± 0.001010/05/04 50.25 ± 2.51 5.97 ± 0.20 0.171 ± 0.014 0.132 0.0389 ± 0.017713/05/04 31.75 ± 5.97 3.89 ± 0.76 0.125 ± 0.040 0.014 0.1115 ± 0.010317/05/04 35.15 ± 1.58 4.24 ± 0.23 0.103 ± 0.003 0.066 0.0375 ± 0.018919/05/04 51.60 ± 2.87 6.47 ± 0.35 0.150 ± 0.016 0.1175 0.0366 ± 0.001724/05/04 50.94 ± 2.95 5.83 ± 0.31 0.223 ± 0.015 0.149 0.0740 ± 0.003427/05/04 27.07 ± 3.72 3.27 ± 0.43 0.126 ± 0.044 0.082 0.0439 ± 0.0278
Food quantity (Table 4.1) and quality (Fig. 4.5) varied in the size classes. The < 10
µm fraction comprised 67 to 84% of the total quantity independent of measured
parameter and without great seasonal variability. All parameters in the 10-40 µm size
53

Chapter 4: Food quality and egg production – spring bloom
class decreased between March and May. Oppositely, in the 40-100 µm fraction all
parameters increased within this period. TPC and TPN about doubled, TPP even
quadrupled. The strongest seasonal changes were observed in the largest fraction
(100-300 µm). For TPN and TPP highest percentages were reached in April, for TPC
a further increase was recorded in May. However, the absolute percentages of the
54
Fig. 4.4: Development of quality parameters during spring: a) percentage of POP TPP-1 and of PhytoC TPC-1 (calculated from means), b) particulate molar C:N (N=3-6; mean ± SD), c) particulate molar C:P and N:P (calculated from means); note different scales.
b)
mol
ar C
:N
6
8
10
12
14
16
18
a)
(%)
0
20
40
60
80
100 PhytoC/TPC (%) POP/TPP (%)
c)
Mar/04 Apr/04 May/04 Jun/04
mol
ar C
:P
100
150
200
250
300
350
400m
olar
N:P
0
10
20
30
40
50C:PN:P
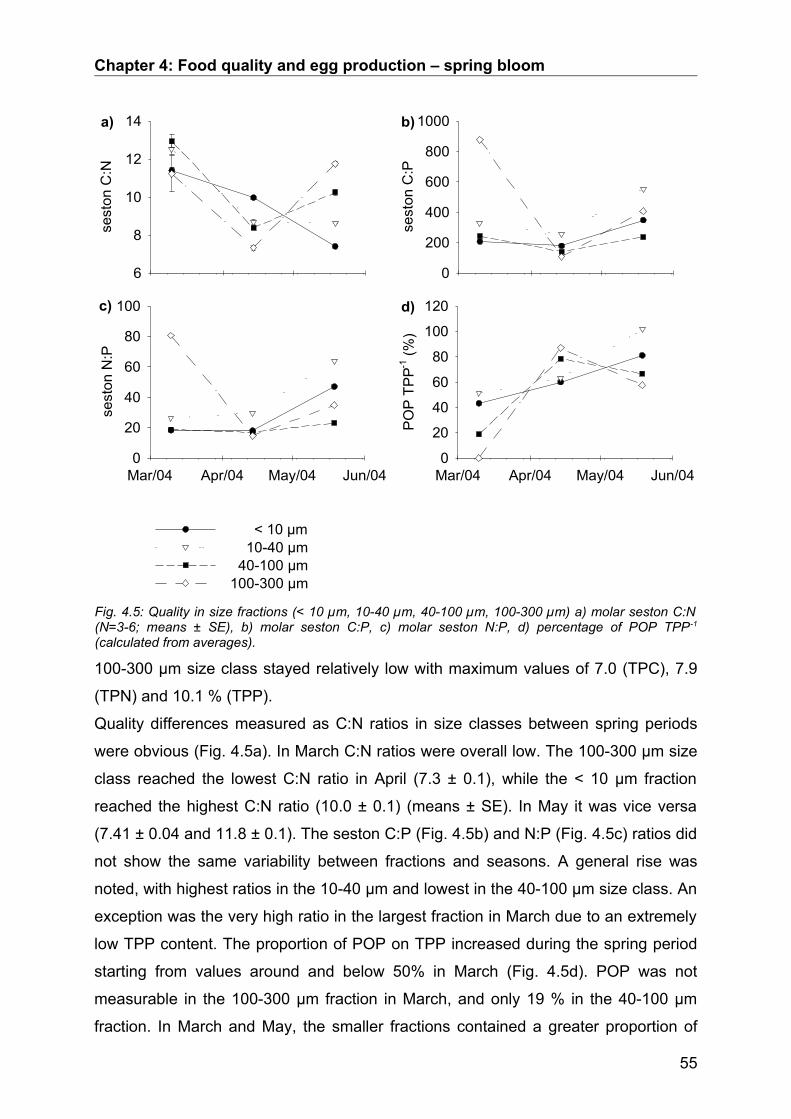
Chapter 4: Food quality and egg production – spring bloom
100-300 µm size class stayed relatively low with maximum values of 7.0 (TPC), 7.9
(TPN) and 10.1 % (TPP).
Quality differences measured as C:N ratios in size classes between spring periods
were obvious (Fig. 4.5a). In March C:N ratios were overall low. The 100-300 µm size
class reached the lowest C:N ratio in April (7.3 ± 0.1), while the < 10 µm fraction
reached the highest C:N ratio (10.0 ± 0.1) (means ± SE). In May it was vice versa
(7.41 ± 0.04 and 11.8 ± 0.1). The seston C:P (Fig. 4.5b) and N:P (Fig. 4.5c) ratios did
not show the same variability between fractions and seasons. A general rise was
noted, with highest ratios in the 10-40 µm and lowest in the 40-100 µm size class. An
exception was the very high ratio in the largest fraction in March due to an extremely
low TPP content. The proportion of POP on TPP increased during the spring period
starting from values around and below 50% in March (Fig. 4.5d). POP was not
measurable in the 100-300 µm fraction in March, and only 19 % in the 40-100 µm
fraction. In March and May, the smaller fractions contained a greater proportion of
55
Fig. 4.5: Quality in size fractions (< 10 µm, 10-40 µm, 40-100 µm, 100-300 µm) a) molar seston C:N (N=3-6; means ± SE), b) molar seston C:P, c) molar seston N:P, d) percentage of POP TPP-1
(calculated from averages).
a)se
ston
C:N
6
8
10
12
14
d)
Mar/04 Apr/04 May/04 Jun/04
PO
P T
PP-1
(%)
0
20
40
60
80
100
120c)
Mar/04 Apr/04 May/04 Jun/04
sest
on N
:P
0
20
40
60
80
100
< 10 µm 10-40 µm 40-100 µm100-300 µm
b)
sest
on C
:P
0
200
400
600
800
1000
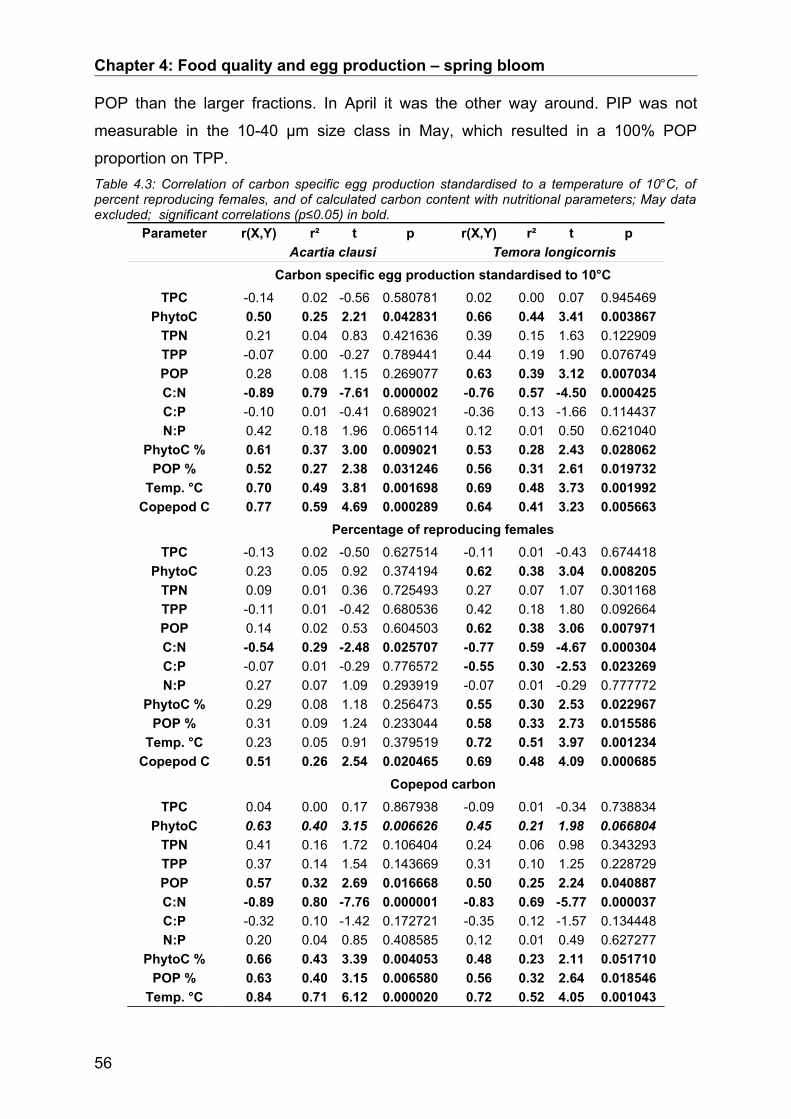
Chapter 4: Food quality and egg production – spring bloom
POP than the larger fractions. In April it was the other way around. PIP was not
measurable in the 10-40 µm size class in May, which resulted in a 100% POP
proportion on TPP.Table 4.3: Correlation of carbon specific egg production standardised to a temperature of 10°C, of percent reproducing females, and of calculated carbon content with nutritional parameters; May data excluded; significant correlations (p≤0.05) in bold.
Parameter r(X,Y) r² t p r(X,Y) r² t pAcartia clausi Temora longicornis
Carbon specific egg production standardised to 10°CTPC -0.14 0.02 -0.56 0.580781 0.02 0.00 0.07 0.945469
PhytoC 0.50 0.25 2.21 0.042831 0.66 0.44 3.41 0.003867TPN 0.21 0.04 0.83 0.421636 0.39 0.15 1.63 0.122909TPP -0.07 0.00 -0.27 0.789441 0.44 0.19 1.90 0.076749POP 0.28 0.08 1.15 0.269077 0.63 0.39 3.12 0.007034C:N -0.89 0.79 -7.61 0.000002 -0.76 0.57 -4.50 0.000425C:P -0.10 0.01 -0.41 0.689021 -0.36 0.13 -1.66 0.114437N:P 0.42 0.18 1.96 0.065114 0.12 0.01 0.50 0.621040
PhytoC % 0.61 0.37 3.00 0.009021 0.53 0.28 2.43 0.028062POP % 0.52 0.27 2.38 0.031246 0.56 0.31 2.61 0.019732
Temp. °C 0.70 0.49 3.81 0.001698 0.69 0.48 3.73 0.001992Copepod C 0.77 0.59 4.69 0.000289 0.64 0.41 3.23 0.005663
Percentage of reproducing femalesTPC -0.13 0.02 -0.50 0.627514 -0.11 0.01 -0.43 0.674418
PhytoC 0.23 0.05 0.92 0.374194 0.62 0.38 3.04 0.008205TPN 0.09 0.01 0.36 0.725493 0.27 0.07 1.07 0.301168TPP -0.11 0.01 -0.42 0.680536 0.42 0.18 1.80 0.092664POP 0.14 0.02 0.53 0.604503 0.62 0.38 3.06 0.007971C:N -0.54 0.29 -2.48 0.025707 -0.77 0.59 -4.67 0.000304C:P -0.07 0.01 -0.29 0.776572 -0.55 0.30 -2.53 0.023269N:P 0.27 0.07 1.09 0.293919 -0.07 0.01 -0.29 0.777772
PhytoC % 0.29 0.08 1.18 0.256473 0.55 0.30 2.53 0.022967POP % 0.31 0.09 1.24 0.233044 0.58 0.33 2.73 0.015586
Temp. °C 0.23 0.05 0.91 0.379519 0.72 0.51 3.97 0.001234Copepod C 0.51 0.26 2.54 0.020465 0.69 0.48 4.09 0.000685
Copepod carbonTPC 0.04 0.00 0.17 0.867938 -0.09 0.01 -0.34 0.738834
PhytoC 0.63 0.40 3.15 0.006626 0.45 0.21 1.98 0.066804TPN 0.41 0.16 1.72 0.106404 0.24 0.06 0.98 0.343293TPP 0.37 0.14 1.54 0.143669 0.31 0.10 1.25 0.228729POP 0.57 0.32 2.69 0.016668 0.50 0.25 2.24 0.040887C:N -0.89 0.80 -7.76 0.000001 -0.83 0.69 -5.77 0.000037C:P -0.32 0.10 -1.42 0.172721 -0.35 0.12 -1.57 0.134448N:P 0.20 0.04 0.85 0.408585 0.12 0.01 0.49 0.627277
PhytoC % 0.66 0.43 3.39 0.004053 0.48 0.23 2.11 0.051710POP % 0.63 0.40 3.15 0.006580 0.56 0.32 2.64 0.018546
Temp. °C 0.84 0.71 6.12 0.000020 0.72 0.52 4.05 0.001043
56
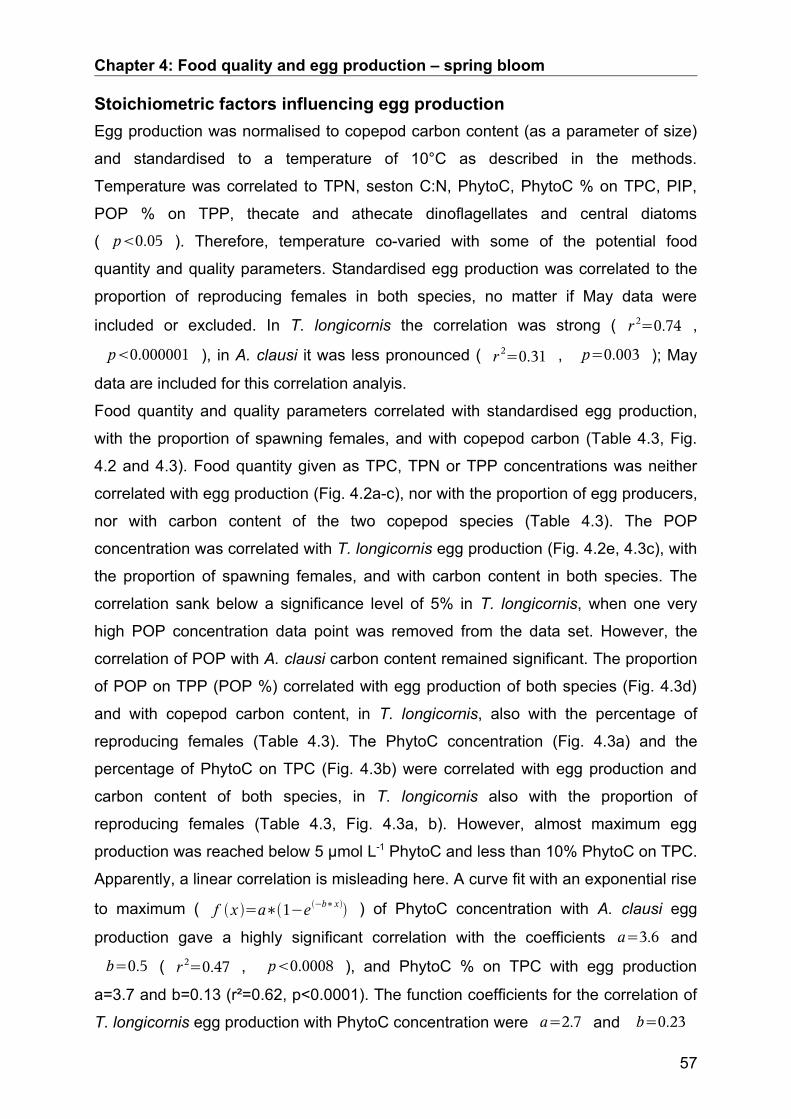
Chapter 4: Food quality and egg production – spring bloom
Stoichiometric factors influencing egg productionEgg production was normalised to copepod carbon content (as a parameter of size)
and standardised to a temperature of 10°C as described in the methods.
Temperature was correlated to TPN, seston C:N, PhytoC, PhytoC % on TPC, PIP,
POP % on TPP, thecate and athecate dinoflagellates and central diatoms
( p0.05 ). Therefore, temperature co-varied with some of the potential food
quantity and quality parameters. Standardised egg production was correlated to the
proportion of reproducing females in both species, no matter if May data were
included or excluded. In T. longicornis the correlation was strong ( r 2=0.74 ,
p0.000001 ), in A. clausi it was less pronounced ( r 2=0.31 , p=0.003 ); May
data are included for this correlation analyis.
Food quantity and quality parameters correlated with standardised egg production,
with the proportion of spawning females, and with copepod carbon (Table 4.3, Fig.
4.2 and 4.3). Food quantity given as TPC, TPN or TPP concentrations was neither
correlated with egg production (Fig. 4.2a-c), nor with the proportion of egg producers,
nor with carbon content of the two copepod species (Table 4.3). The POP
concentration was correlated with T. longicornis egg production (Fig. 4.2e, 4.3c), with
the proportion of spawning females, and with carbon content in both species. The
correlation sank below a significance level of 5% in T. longicornis, when one very
high POP concentration data point was removed from the data set. However, the
correlation of POP with A. clausi carbon content remained significant. The proportion
of POP on TPP (POP %) correlated with egg production of both species (Fig. 4.3d)
and with copepod carbon content, in T. longicornis, also with the percentage of
reproducing females (Table 4.3). The PhytoC concentration (Fig. 4.3a) and the
percentage of PhytoC on TPC (Fig. 4.3b) were correlated with egg production and
carbon content of both species, in T. longicornis also with the proportion of
reproducing females (Table 4.3, Fig. 4.3a, b). However, almost maximum egg
production was reached below 5 µmol L-1 PhytoC and less than 10% PhytoC on TPC.
Apparently, a linear correlation is misleading here. A curve fit with an exponential rise
to maximum ( f x =a∗1−e −b∗x ) of PhytoC concentration with A. clausi egg
production gave a highly significant correlation with the coefficients a=3.6 and
b=0.5 ( r 2=0.47 , p0.0008 ), and PhytoC % on TPC with egg production
a=3.7 and b=0.13 (r²=0.62, p<0.0001). The function coefficients for the correlation of
T. longicornis egg production with PhytoC concentration were a=2.7 and b=0.23
57
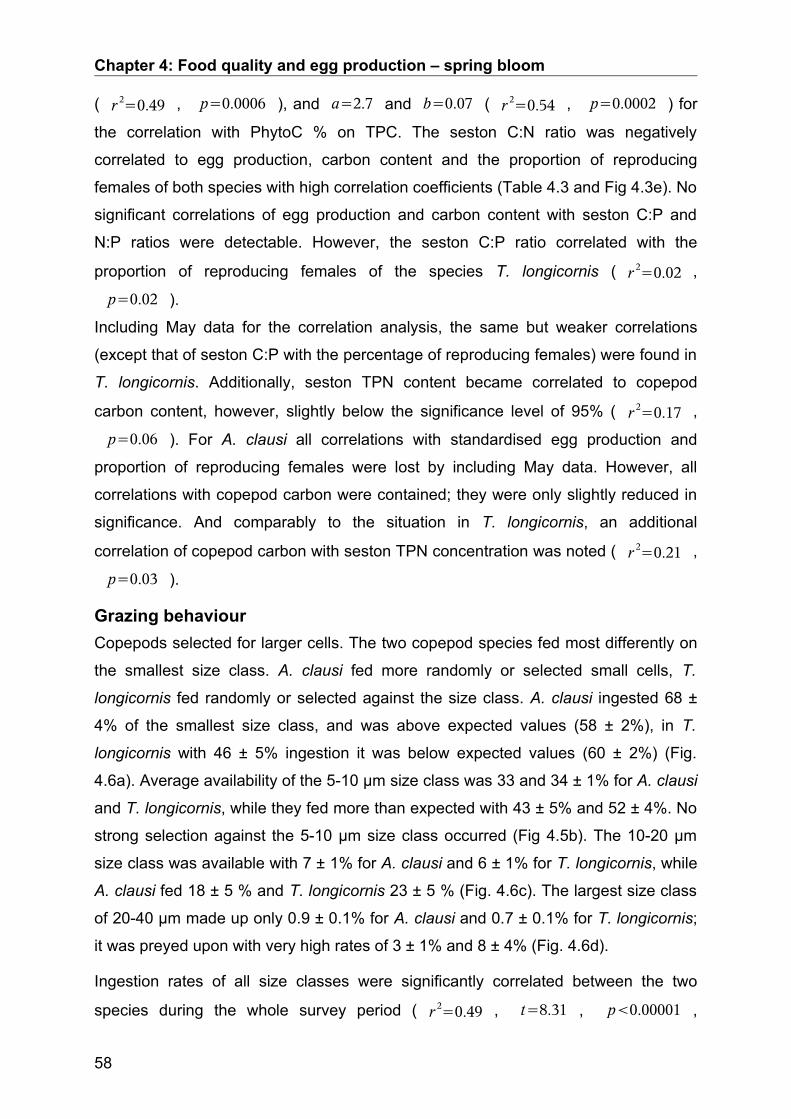
Chapter 4: Food quality and egg production – spring bloom
( r 2=0.49 , p=0.0006 ), and a=2.7 and b=0.07 ( r 2=0.54 , p=0.0002 ) for
the correlation with PhytoC % on TPC. The seston C:N ratio was negatively
correlated to egg production, carbon content and the proportion of reproducing
females of both species with high correlation coefficients (Table 4.3 and Fig 4.3e). No
significant correlations of egg production and carbon content with seston C:P and
N:P ratios were detectable. However, the seston C:P ratio correlated with the
proportion of reproducing females of the species T. longicornis ( r 2=0.02 ,
p=0.02 ).
Including May data for the correlation analysis, the same but weaker correlations
(except that of seston C:P with the percentage of reproducing females) were found in
T. longicornis. Additionally, seston TPN content became correlated to copepod
carbon content, however, slightly below the significance level of 95% ( r 2=0.17 ,
p=0.06 ). For A. clausi all correlations with standardised egg production and
proportion of reproducing females were lost by including May data. However, all
correlations with copepod carbon were contained; they were only slightly reduced in
significance. And comparably to the situation in T. longicornis, an additional
correlation of copepod carbon with seston TPN concentration was noted ( r 2=0.21 ,
p=0.03 ).
Grazing behaviourCopepods selected for larger cells. The two copepod species fed most differently on
the smallest size class. A. clausi fed more randomly or selected small cells, T.
longicornis fed randomly or selected against the size class. A. clausi ingested 68 ±
4% of the smallest size class, and was above expected values (58 ± 2%), in T.
longicornis with 46 ± 5% ingestion it was below expected values (60 ± 2%) (Fig.
4.6a). Average availability of the 5-10 µm size class was 33 and 34 ± 1% for A. clausi
and T. longicornis, while they fed more than expected with 43 ± 5% and 52 ± 4%. No
strong selection against the 5-10 µm size class occurred (Fig 4.5b). The 10-20 µm
size class was available with 7 ± 1% for A. clausi and 6 ± 1% for T. longicornis, while
A. clausi fed 18 ± 5 % and T. longicornis 23 ± 5 % (Fig. 4.6c). The largest size class
of 20-40 µm made up only 0.9 ± 0.1% for A. clausi and 0.7 ± 0.1% for T. longicornis;
it was preyed upon with very high rates of 3 ± 1% and 8 ± 4% (Fig. 4.6d).
Ingestion rates of all size classes were significantly correlated between the two
species during the whole survey period ( r 2=0.49 , t=8.31 , p0.00001 ,
58
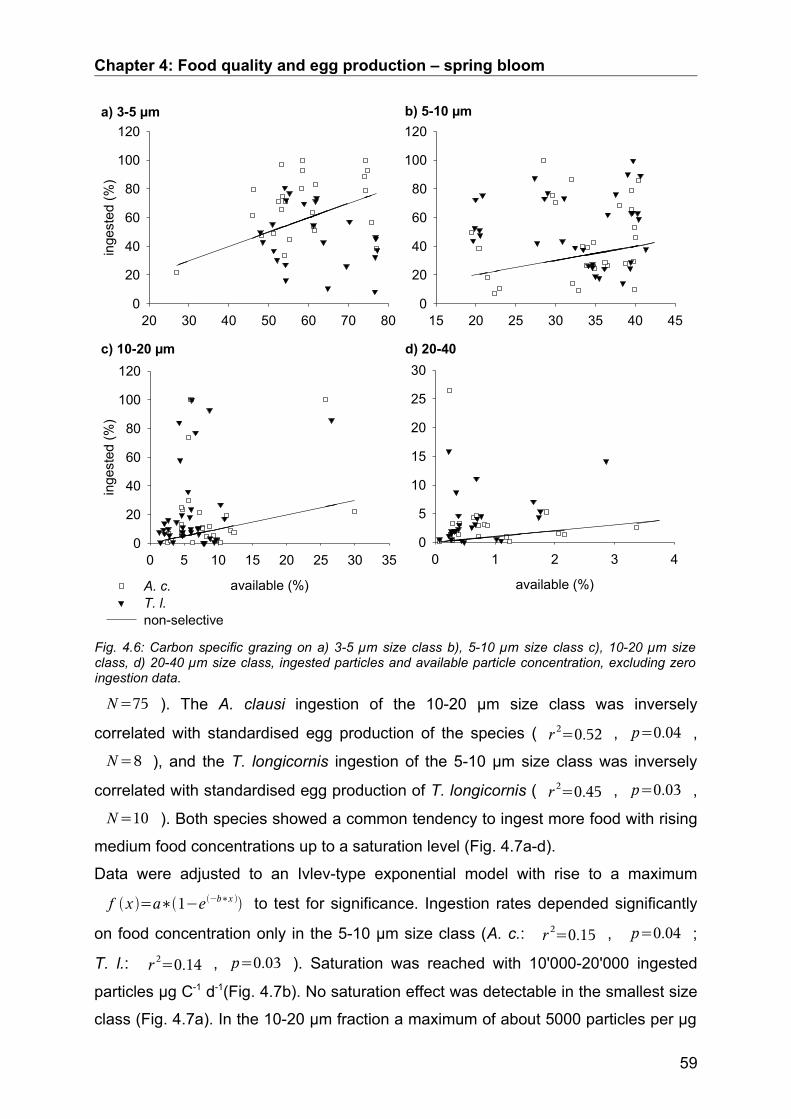
Chapter 4: Food quality and egg production – spring bloom
N=75 ). The A. clausi ingestion of the 10-20 µm size class was inversely
correlated with standardised egg production of the species ( r 2=0.52 , p=0.04 ,
N=8 ), and the T. longicornis ingestion of the 5-10 µm size class was inversely
correlated with standardised egg production of T. longicornis ( r 2=0.45 , p=0.03 ,
N=10 ). Both species showed a common tendency to ingest more food with rising
medium food concentrations up to a saturation level (Fig. 4.7a-d).
Data were adjusted to an Ivlev-type exponential model with rise to a maximum
f x =a∗1−e −b∗x to test for significance. Ingestion rates depended significantly
on food concentration only in the 5-10 µm size class (A. c.: r 2=0.15 , p=0.04 ;
T. l.: r 2=0.14 , p=0.03 ). Saturation was reached with 10'000-20'000 ingested
particles µg C-1 d-1(Fig. 4.7b). No saturation effect was detectable in the smallest size
class (Fig. 4.7a). In the 10-20 µm fraction a maximum of about 5000 particles per µg
59
Fig. 4.6: Carbon specific grazing on a) 3-5 µm size class b), 5-10 µm size class c), 10-20 µm size class, d) 20-40 µm size class, ingested particles and available particle concentration, excluding zero ingestion data.
a) 3-5 µm
20 30 40 50 60 70 80
inge
sted
(%)
0
20
40
60
80
100
120b) 5-10 µm
15 20 25 30 35 40 450
20
40
60
80
100
120
c) 10-20 µm
available (%)
0 5 10 15 20 25 30 35
inge
sted
(%)
0
20
40
60
80
100
120
A. c. T. l. non-selective
d) 20-40
available (%)
0 1 2 3 40
5
10
15
20
25
30

Chapter 4: Food quality and egg production – spring bloom
C-1 d-1 occurred (Fig. 4.7c). About 600 ingested particles per µg C-1 d-1 was the
maximum in the largest size class (Fig. 4.7d). The percentage of the grazed particles
60
Fig. 4.7: Carbon specific particle ingestion (a-d) and percent of ingested on available particles (e-h) per µg copepod carbon; neighbouring graphs display results for the same size class (same x-axis).
a) 3-5 µm
0.0 8.0e+4 1.6e+5 2.4e+5 3.2e+5
inge
sted
par
ticle
s (N
µg
C-1
d-1
)
0
10000
20000
30000
40000
50000
b) 5-10 µm
0.0 8.0e+4 1.6e+5 2.4e+5 3.2e+5
inge
sted
par
ticle
s (N
µg
C-1
d-1
)
0
10000
20000
30000
40000
50000
c) 10-20 µm
0 8000 16000 24000 32000
inge
sted
par
ticle
s (N
µg
C-1
d-1
)
0
1000
2000
3000
4000
5000
d) 20-40 µm
mean available particles (N µg C-1 d-1)
0 800 1600 2400 3200
inge
sted
par
ticle
s (N
µg
C-1
d-1
)
0
200
400
600
800
1000
A. c.T. l.
e) 3-5 µm
0.0 8.0e+4 1.6e+5 2.4e+5 3.2e+5
inge
sted
par
ticle
s (%
)
0
20
40
60
80
100
120
f) 5-10 µm
0.0 8.0e+4 1.6e+5 2.4e+5 3.2e+5
inge
sted
par
ticle
s (%
)
0
10
20
30
40
50
60
70
g) 10-20 µm
0 8000 16000 24000 32000
inge
sted
par
ticle
s (%
)
0
20
40
60
80
h) 20-40 µm
mean available particles (N µg C-1 d-1)
0 800 1600 2400 3200
inge
sted
par
ticle
s (%
)
0
20
40
60
80
100
120

Chapter 4: Food quality and egg production – spring bloom
on the available particles of a given size class was calculated, and is displayed in the
neighbouring graphs (Fig. 4.7e-h). At low food concentrations the percentages of
grazed particles on available particles varied over a wide range, which means that
food levels were limiting.
61
Fig. 4.8: Body nutrient specific grazing on seston nutrients: a-d) ingestion rates, e-h) % ingested of available nutrients per body nutrients.
a)
available (µmol TPC µmol C1 d-1)0 2 4 6 8 10 12 14 16 18 20
inge
sted
(µ
mol
TPC
µm
ol C
-1 d
-1)
0.0
0.5
1.0
1.5
2.0
2.5
3.0
b)
available (µmol TPN µmol N-1 d-1)0 1 2 3 4 5 6 7
inge
sted
(µm
ol T
PN
µm
ol N
-1 d
-1)
0.0
0.2
0.4
0.6
0.8
1.0
1.2
1.4
c)
available (µmol TPP µmol P-1 d-1)0 2 4 6 8 10 12
inge
sted
(µ
mol
TPP
µm
ol P
-1 d
-1)
0.0
0.2
0.4
0.6
0.8
1.0
1.2
1.4
d)
available (µmol POP µmol P-1 d-1)0 1 2 3 4 5 6
inge
sted
(µ
mol
PO
P µ
mol
P-1
d-1
)
0.0
0.2
0.4
0.6
0.8
1.0
A. c.T. l.
e)
available (µmol TPC µmol C1 d-1)0 2 4 6 8 10 12 14 16 18 20
inge
sted
:ava
ilabl
e (%
)
0
20
40
60
80
f)
available (µmol TPN µmol N-1 d-1)0 1 2 3 4 5 6 7
inge
sted
:ava
ilabl
e (%
)
0
20
40
60
80
g)
available (µmol TPP µmol P-1 d-1)0 2 4 6 8 10 12
inge
sted
:ava
ilabl
e (%
)
0
20
40
60
80
h)
available (µmol POP µmol P-1 d-1)0 1 2 3 4 5 6
inge
sted
:ava
ilabl
e(%
)
0
20
40
60
80

Chapter 4: Food quality and egg production – spring bloom
Body specific nutrient ingestion on particles < 40 µm did not follow a saturation type
feeding behaviour (Fig. 4.8). Maximum nutrient specific feeding occurred already at
low available nutrient concentrations. Carbon uptake of A. clausi could well exceed
1:1 (µmol µmol-1 day-1) and reached maximum rates of 2.5 (µmol µmol-1 day-1) (Fig.
4.8a). Nutrient uptake of N, P and organic P rarely exceeded 1:1 (µmol µmol-1 day-1)
in A. clausi (Table 4.4, Fig. 4.8b-d). T. longicornis ingested generally lower nutrient
ratios (seston:body) than A. clausi. Body specific C uptake never exceeded 1:1 (µmol
µmol-1 day-1) (Fig. 4.8a), specific N and P uptake was not higher than 0.6:1 (µmol
µmol-1 day-1)(Fig. 4.8b,c), and the uptake of organic P per body P did not exceed
0.4:1 (µmol µmol-1 day-1)(Fig. 4.8d). Rapid satisfaction of nutrient demands was
apparent with increasing nutrient availability. Saturation occurred more rapidly in T.
longicornis than in A. clausi (Fig. 4.8e-h). However, the data range of available
nutrients per body nutrients was smaller for T. longicornis due to the larger body
mass of the species.
Table 4.4: Percentage of nutrient uptake in size classes < 10 µm and 10-40 µm, and average body nutrient specific nutrient uptake < 40 µm (N=35-38; means ± SE).
ingested seston:body
nutrient per day
Acartia clausi Temora longicornis
< 10(%)
SE 10-40 (%)
SE < 10 (%)
SE 10-40 (%)
SE
TPC C-1 d-1 74 ± 5 26 ± 5 61 ± 5 39 ± 5TPN N-1 d-1 73 ± 5 27 ± 5 61 ± 5 39 ± 5TPP P-1 d-1 78 ± 5 22 ± 5 67 ± 5 33 ± 5POP P-1 d-1 77 ± 5 24 ± 5 65 ± 5 35 ± 5
< 40 (µmol µmol-1 d-1) SE < 40 (µmol µmol-1 d-1) SE
TPC C-1 d-1 0.78 ± 0.12 0.30 ± 0.04TPN N-1 d-1 0.35 ± 0.05 0.15 ± 0.02TPP P-1 d-1 0.37 ± 0.06 0.15 ± 0.02POP P-1 d-1 0.24 ± 0.04 0.09 ± 0.01
The < 10 µm size class was identified as the major source for nutrients (Fig. 4.9,
Table 4.4). Maximum seston nutrient uptake by body nutrient content was reached in
mid-April in both species irrespective of the type of nutrient (Fig. 4.9).
However high nutrient ingestion already occurred in the early spring phase, in March,
when phytoplankton biomass had not yet begun to increase dramatically. The uptake
of C:N and C:P revealed imbalances (Fig. 4.10a,b). However, the C:N imbalance
decreased over time with increasing seston C:N quality (decreasing values). C:N was
62
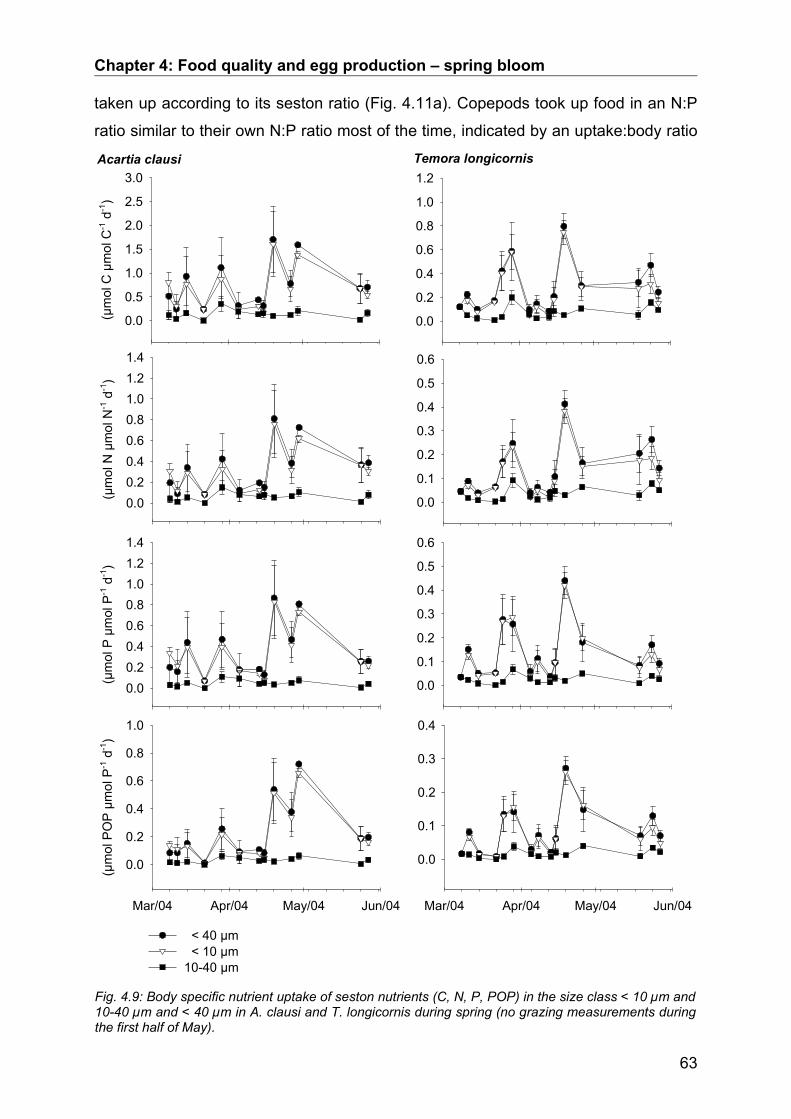
Chapter 4: Food quality and egg production – spring bloom
taken up according to its seston ratio (Fig. 4.11a). Copepods took up food in an N:P
ratio similar to their own N:P ratio most of the time, indicated by an uptake:body ratio
63
Fig. 4.9: Body specific nutrient uptake of seston nutrients (C, N, P, POP) in the size class < 10 µm and 10-40 µm and < 40 µm in A. clausi and T. longicornis during spring (no grazing measurements during the first half of May).
(µm
ol N
µm
ol N
-1 d
-1)
0.00.20.40.60.81.01.21.4
Acartia clausi
(µm
ol C
µm
ol C
-1 d
-1)
0.0
0.5
1.0
1.5
2.0
2.5
3.0Temora longicornis
0.0
0.2
0.4
0.6
0.8
1.0
1.2
0.0
0.1
0.2
0.3
0.4
0.5
0.6
(µm
ol P
µm
ol P
-1 d
-1)
0.00.20.40.60.81.01.21.4
0.0
0.1
0.2
0.3
0.4
0.5
0.6
Mar/04 Apr/04 May/04 Jun/04
(µm
ol P
OP
µm
ol P
-1 d
-1)
0.0
0.2
0.4
0.6
0.8
1.0
< 40 µm < 10 µm10-40 µm
Mar/04 Apr/04 May/04 Jun/04
0.0
0.1
0.2
0.3
0.4

Chapter 4: Food quality and egg production – spring bloom
of 1:1 (Fig. 4.10c). The proportion of ingested organic P on TPP dropped at the end
of March, and then rose to a high level (Fig. 4.10d) that reflected the development in
the seston (Fig. 4.11d). Both species ingested C:N and POP:TPP according to the
seston ratios, indicated by the line at a ratio of 1 (ingested ratio per copepod ratio
divided by seston ratio) (Fig. 4.11a, d). Slightly increased body specific C:P and N:P
ingestion occurred during April (Fig. 4.11b, c).
4.4. DiscussionTemperature is acknowledged as an important regulating factor of biological
processes. In a study on dominant Helgoland species, including A. clausi and T.
longicornis, temperature was described as a more important factor regulating egg
production than food quantity (Halsband and Hirche 2001). Laboratory experiments
show a clear dependence of egg production on temperature under saturating food
concentrations (Halsband-Lenk et al. 2002; Castro-Longoria 2003; Holste and Peck
2006). However, in the field, food concentration and quality do not stay stable
throughout longer periods, and potential temperature dependent laboratory egg
production rates may not be reached (Hirst and Bunker 2003). Moreover, saturating
food concentration increases with temperature (Bunker and Hirst 2004; Maps et al.
2005). In our field study, food quantity and quality were rising concomitantly with
64
Fig. 4.10: Elemental ratios of ingested food versus body ratios over time: a) C:Ning C:Nbody-1, b) C:Ping
C:Pbody-1, c) N:Ping N:Pbody
-1, d) POP TPPing-1.
a)
C:N
ing C
:Nbo
dy-1
1.41.61.82.02.22.42.62.83.03.2 b)
C:P
ing C
:Pbo
dy-1
1.01.52.02.53.03.54.04.55.0
c)
Mar/04 Apr/04 May/04 Jun/04
N:P
ing N
:Pbo
dy-1
0.0
0.5
1.0
1.5
2.0
2.5
3.0 A. c.T. l.
d)
Mar/04 Apr/04 May/04 Jun/04
PO
P:T
PP in
g
0.0
0.2
0.4
0.6
0.8
1.0
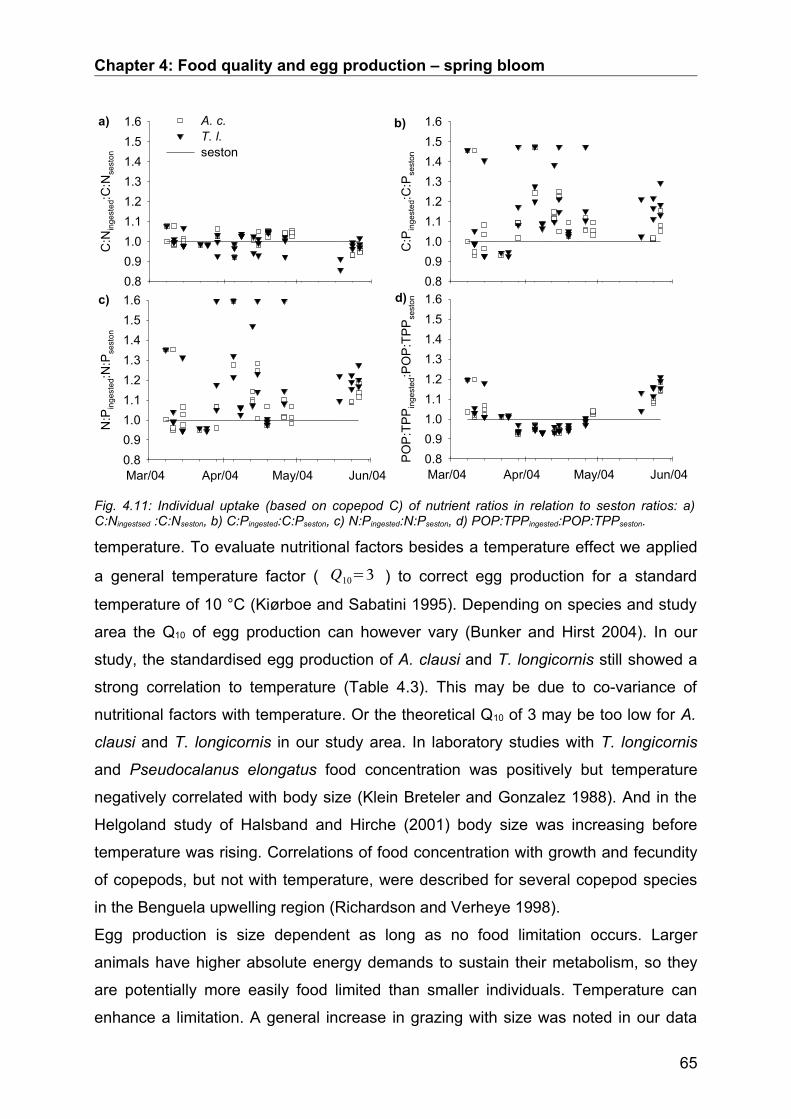
Chapter 4: Food quality and egg production – spring bloom
temperature. To evaluate nutritional factors besides a temperature effect we applied
a general temperature factor ( Q10=3 ) to correct egg production for a standard
temperature of 10 °C (Kiørboe and Sabatini 1995). Depending on species and study
area the Q10 of egg production can however vary (Bunker and Hirst 2004). In our
study, the standardised egg production of A. clausi and T. longicornis still showed a
strong correlation to temperature (Table 4.3). This may be due to co-variance of
nutritional factors with temperature. Or the theoretical Q10 of 3 may be too low for A.
clausi and T. longicornis in our study area. In laboratory studies with T. longicornis
and Pseudocalanus elongatus food concentration was positively but temperature
negatively correlated with body size (Klein Breteler and Gonzalez 1988). And in the
Helgoland study of Halsband and Hirche (2001) body size was increasing before
temperature was rising. Correlations of food concentration with growth and fecundity
of copepods, but not with temperature, were described for several copepod species
in the Benguela upwelling region (Richardson and Verheye 1998).
Egg production is size dependent as long as no food limitation occurs. Larger
animals have higher absolute energy demands to sustain their metabolism, so they
are potentially more easily food limited than smaller individuals. Temperature can
enhance a limitation. A general increase in grazing with size was noted in our data
65
Fig. 4.11: Individual uptake (based on copepod C) of nutrient ratios in relation to seston ratios: a) C:Ningestsed :C:Nseston, b) C:Pingested:C:Pseston, c) N:Pingested:N:Pseston, d) POP:TPPingested:POP:TPPseston.
a)C
:Nin
gest
ed:C
:Nse
ston
0.80.91.01.11.21.31.41.51.6 b)
C:P
inge
sted
:C:P
sest
on
0.80.91.01.11.21.31.41.51.6
c)
Mar/04 Apr/04 May/04 Jun/04
N:P
inge
sted
:N:P
sest
on
0.80.91.01.11.21.31.41.51.6
A. c.T. l.seston
d)
Mar/04 Apr/04 May/04 Jun/04
PO
P:T
PP
inge
sted
:PO
P:T
PP
sest
on
0.80.91.01.11.21.31.41.51.6

Chapter 4: Food quality and egg production – spring bloom
sets supporting this view. Therefore, we standardised grazing and egg production to
copepod carbon content. With such corrected egg production data sets we analysed
the correlation of egg production with nutritional factors.
Seston quantity factors given as TPC, TPN, and TPP concentration were not
correlated with egg production. This lack of correlation points to a qualitative rather
than a quantitative food limitation of copepod reproduction. Phytoplankton carbon
and proportion of TPC as well as concentrations of distinct phytoplankton taxa have a
quantitative as well as a qualitative aspect. The very steep slope of the exponential
relation between phytoplankton carbon concentration and copepod egg production
denotes that copepods were obviously not limited by total phytoplankton carbon. The
Ivlev-type correlations of diatom concentration with T. longicornis egg production and
A. clausi body carbon showed a steep increase. Almost maximum egg production
values were found at very low phytoplankton and diatom concentrations. Therefore,
one can conclude that phytoplankton and the tested taxa do not greatly affect
copepod reproduction. However, high phytoplankton concentrations probably support
maximum egg production rates. Among stoichiometric ratios, the strong correlation
with the seston C:N ratio supports the view that nitrogen is the most important limiting
factor in this marine environment. However, our data also support a potentially
limiting copepod demand for P to maximise egg production.
In the marine environment most of the P occurs in dissolved form as compared to
particulate and organismic P (Hassett et al. 1997). The Helgoland seston N:P ratios
pointed to no or moderate nutrient deficiency, while the C:P ratios depicted moderate
to severe deficiencies, and the C:N ratios showed moderate deficiency. However, the
ratios can vary between phytoplankton species (Klausmeier et al. 2004). Therefore,
copepods should use strategies such as selective or compensatory feeding to
circumvent nutrient limitations. They are able to differentiate not only the size but also
the quality of a potential prey (Cowles et al. 1988; Donaghay 1988). High detritus
loads, for example, decrease food quality and can prevent a saturation of the
ingestion rate (Paffenhöfer and Van Sant 1985; Mayzaud et al. 1998). Ingestion on
all size classes followed similar saturation type patterns. However, we did only
measure size-specific and not food-species-specific feeding. The nutrient specific
feeding revealed highest maximum ingestion rates at low available nutrient
concentrations. Maximum uptake rates of N, P and organic P were 1:1 (µmol µmol-1
day-1) and slightly above. In carbon terms, most values stayed around 1:1 (µmol
66

Chapter 4: Food quality and egg production – spring bloom
µmol-1 day-1) but uptake rates could rise up to 2.5:1 (µmol µmol-1 day-1). These
patterns and the very high carbon ingestion rates point to a compensatory feeding to
circumvent N and P limitation. At many times, however, feeding rates were so low at
low food or nutrient concentrations that they were probably not sufficient to sustain a
good fitness of the grazers. Copepods have been shown to maximise protein
ingestion (Libourel-Houde and Roman 1987). Additionally to the accepted view that
marine sites are widely N limited (Elser and Hassett 1994), evidence is accumulating
that P can be limiting in marine environments as well, especially in open ocean areas
(Downing et al. 1999; Guildford and Hecky 2000). The presented data support the
view that both elements can be limiting in the ocean.
Responses to food quality are more obvious at higher than at lower food
concentrations (Koski and Klein Breteler 2003) but are also measurable at low
concentrations (Boersma and Kreutzer 2002).
Copepods cannot only adapt their grazing behaviour but also their digestive system
to changes in food quantity and quality, so that they are able to compensate possible
negative effects (Hassett and Landry 1990). Nevertheless, nutritional imbalances can
be passed on from prey to copepod (Van Nieuwerburgh et al. 2004). The results of
Van Nieuwerburgh et al. (2004) support the hypothesis that copepods do not regulate
their body functions homeostatically but rheostatically, adapting to their ever
changing environment (Villar-Argaiz et al. 2002). Such a slight adaptation can reduce
the danger of nutrient limitation for copepods.
In this study, feeding on the largest cells was not measured because particles larger
than 40 µm were rare. Copepods in the field may cruise a larger area than a 1 L
bottle volume and thereby may be selecting differently in nature. Copepod grazing
impact on herbivorous microzooplankton can lead to negative grazing results on
smaller size fractions. Pico- and nanoplankton may benefit from the top-down control
of copepods on microzooplankton herbivores. But an increase in the small fractions
can also be due to the break-down of larger cells. The selection against the 3-5 µm
fraction in T. longicornis (Fig. 4.5a) may reflect such a connection, especially since
otherwise, T. longicornis seems to prefer larger particles stronger than A. clausi.
Our data hint to a diatom preference of T. longicornis over other prey taxa.
Phaeocystis seems to affect egg production (Bautista et al. 1994; Devreker et al.
2005) despite stoichiometric quality (this study). However, growth phase and nutrient
condition of the algae seem to play a role in toxin-production (Koski et al. 2005).
67

Chapter 4: Food quality and egg production – spring bloom
The number of spawning females greatly effected egg production in other species as
well (Campbell and Head 2000). Food quantity and quality factors can act on gonad
maturity, thereby, influencing the number of spawning females (Niehoff 2004). In A.
clausi nutritional factors seemed to act more directly on the individual female egg
production. Adult copepods do not grow or moult. Therefore, they can transfer most
of the energy they take up, into egg production.
We have shown that the < 10 µm size class usually contains the largest proportion of
C, N and P. Copepods did take up the main proportion of nutrients through grazing
on this small seston fraction. From culturing it is known that several copepod species
thrive when fed exclusively with the rather small Rhodomonas sp. (5-8 µm) and
Oxyrrhis marina (13 µm) cells (Klein Breteler 1980). Especially, when larger food
particles are scarce, animals have to rely on smaller food particles and inferior food
to circumvent food limitation (Chervin 1978). Nevertheless, they usually strongly
select for larger prey.
The results that we present here may be biased because we calculated with average
nutrients in size classes, and did not know what proportion of nutrients the copepods
really took up. This may be a rather rough estimate at times. Small flagellates and
detritus mainly comprise the size class < 10 µm. Larger flagellates, small diatoms
and small protozoans can be found in the size class between 10 and 20 µm, larger
protozoans and largest flagellates between 20 and 40 µm. Large diatoms and diatom
chains, and largest dinoflagellates belong to the size class > 40 µm. In the early
spring phase, detritus formed a large part of the seston particles. Detritus is ingested
by copepods but it is of inferior quality compared to living prey (Chervin 1978;
Mayzaud et al. 1998).
ConclusionStoichiometric imbalances between seston and copepods interfered with copepod
reproduction. The effect was probably transferred by the grazing behaviour of the
copepods. Their ingestion of seston C:N reflected the environmental seston C:N
ratio, the same was true for the POP:TPP proportion uptake. Both factors were
correlated to egg production. The analyses of potential nutrient uptake showed that N
and P are potentially limiting for copepods in the marine environment. Both species
took up the largest part of their nutrient demand by grazing on the < 10 µm seston
size fraction which contained the bulk of particle bound nutrients.
68

Chapter 5: Stable isotopes and reproductive success
Chapter 5: Stable isotopes as predictors of copepod reproductive successThe stable isotope signatures of seston and copepods varied considerably in time
and space, and also within seston size fractions. The δ13C and δ15N profiles of marine
seston had a modulating effect on egg production patterns of dominant North Sea
copepod species, Acartia clausi and Temora longicornis. The seston d15N signature
was significantly negatively correlated with the molar T. longicornis C:N ratio. A.
clausi showed the same trend. Over the year the seston δ13C was positively
correlated with seston C:N and negatively with egg production of both species.
A. clausi and T. longicornis fed on similar trophic levels (δ15N signature) during a
spring bloom but they utilized different carbon sources (δ13C signature). These
differences could be due to selective feeding and/or variable digestion between the
two species. Copepod digestive enzyme activities showed distinct species-specific
and seasonal patterns. Chitobiase activity indicated carbon assimilation while
arginine aminopeptidase, esterase/lipase and beta-glucosidase activity were
indicators of nitrogen assimilation.
5.1. Introduction External and internal factors determine fecundity of copepods. External factors, i.e.
hydrography, temperature, food quantity and quality, are the same for all co-
occurring species in space and time, but different species may react in distinct ways
to these factors as they differ in physiology and behaviour.
Stable isotope analyses have become a useful tool for food web studies. Animals
with high turnover rates such as heterotroph protozoans and zooplankton reflect the
signals of their food, slightly accumulating the heavy isotopes compared to their food.
Animals or tissues of similar metabolic characteristic can be placed into trophic
schemes with help of stable isotope analysis. Each trophic level is enriched in δ15N
and also in δ 13C. A 15N enrichment of 1.3 to 5.3 with an average of 3.4 ± 1.1 ‰ per
trophic level has been determined across several food chains (Minagawa and Wada
1984). An enrichment of < 1 ‰ per trophic level is usually apparent in δ 13C food web
signatures (Fry et al. 1984). Autotroph species vary considerably in their stable
isotope signatures (Leboulanger et al. 1995). However, light regime, source of
nutrients and nutritional stress can influence the stable isotope signature of primary
producers as well as turnover rates and temperature (Leboulanger et al. 1995;
Adams and Sterner 2000).
69

Chapter 5: Stable isotopes and reproductive success
The internal physiology of an animal affects its reactions to the environmental
condition. Especially, digestive physiology holds a key position as it determines the
way how an organism deals with its resources. For example, research on amphipods
provides strong evidence that selective feeding behaviour is determined by the
genetically determined digestive physiology (Guarna and Borowsky 1993; Sotka
2003). Moreover, the principal set of digestive enzymes such as iso-trypsins in
Litopenaeus vannamei (Sainz et al. 2005) or proteases in copepods (chapter 3) does
not change as a result of changes in quality or quantity of resources but rather shows
a genetically determined variability. However, the activity of single enzymes can be
adjusted to both food quantity and quality. Harris (1986) suggested that digestive
enzymes play a regulating role to deal with varying food concentrations, with
enhanced digestion at low food concentrations and reduced digestive activity when
food is abundant. This compensatory mechanism is variable and depends on
previous feeding experience of the copepods (Roche-Mayzaud et al. 1991; Mayzaud
et al. 1992). In general, individuals that survived food shortage show a hunger
response, overshooting feeding and respiration rates (Tiselius 1998; Thor 2003).
Copepods adapt their feeding behaviour to the concentration of the food. They are
able to switch between non-selective and selective feeding modes depending on the
particle distribution, size and quality they encounter (Price et al. 1983; Price and
Paffenhöfer 1986). If food particles are scarce the animals tend to feed
indiscriminately, if food particles are abundant they tend to select the particles with
the best nutritional value for their needs (Donaghay 1988). They prefer actively
growing phytoplankton (Cowles et al. 1988) and select against toxic cells (Teegarden
1999). Copepods are able to discern different food qualities by amino acids (Poulet
and Ouellet 1982; Schütte 2006). Moreover, copepods can compensate for a lack in
quality by compensatory feeding or prolonged gut evacuation times (Tirelli and
Mayzaud 2005).
Nutritional quantity and quality of seston change over time and space. Seasonal
changes in seston composition and concentration are pronounced, and hydrographic
phenomena such as fronts or eddies can create steep gradients of food quantity and
quality (Raabe et al. 1997). In the transitional zone of fronts, nutrients and particles
accumulate. Thus, frontal systems, especially the transitional zone, are high
productivity areas in the sea that structure plankton communities horizontally
(Thibault et al. 1994; Nielsen and Munk 1998; Albaina and Irigoien 2004).
70
Chapter 5: Stable isotopes and reproductive success
This study was designed to reveal possible links between external factors and
copepod physiology that all together explain variances in fecundity and differences
between species. The different parameters were studied during a one-year cycle
including 2 spring times. The variability in time at station Helgoland Roads (7°54.0'E,
54°11.3'N) was compared with spatial variability in the German Bight and adjacent
southern North Sea zones during the GLOBEC-cruise HE211 of R/V Heincke in June
2004 (Fig. 5.1).
5.2. Material and MethodsSeasonal Study
We used a two-pronged approach for a seasonal study at Helgoland Roads. In spring
2004, we carried out an intensive sampling strategy (see also chapter 4), where we
sampled seston and individual copepods twice weekly. During the rest of the year,
we sampled seston and Temora longicornis females on a weekly basis. To assess
the importance of spatial variation we sampled different water masses during a North
Sea cruise (R/V Heincke, GLOBEC-cruise HE211, 18/06/2004-23/06/2004),
determined nutritional characteristics of Temora to be able to compare the results of
the time-series analysis with the spatial analysis.
Sampling – animals and surface seawaterThe copepods Acartia clausi and Temora longicornis were sampled twice weekly
during a period from mid February until the end of May 2004 off Helgoland (North
Sea, German Bight). Adult females were selected and transferred to experimental
vessels containing natural sea water at in situ temperature, or they were shortly
rinsed with deionised water, blotted dry and frozen at -80 °C for biochemical and
physiological analyses. From May 2004 to May 2005, we sampled only Temora
longicornis individuals once a week.
Surface seawater samples were taken simultaneously with zooplankton samples,
pre-filtered (300 µm), and stored cold in opaque 10 L plastic containers until filtration.
For each seston parameter (total particulate carbon (TPC), nitrogen (TPN),
phosphorus (TPP), particulate organic (POP) and inorganic phosphorus (PIP), and
stable isotope ratios of 13C:12C and 15N:14N), three parallels of 300-1200 mL were
filtered onto pre-combusted (6 h, 420 °C) glass fibre filters (Whatman, GF/C, 25 mm
diameter). After filtration visible animals > 100 µm were picked off manually under a
71
Chapter 5: Stable isotopes and reproductive success
dissection microscope at 50x magnification. Filters were stored individually in
reaction tubes at -80 °C.
Copepod egg production During spring and summer of 2004, we measured the in situ egg production rates of
the two focal species of this study on a twice weekly basis, from September to
December on a monthly basis. Thirty females each of the two species (Acartia clausi
and Temora longicornis) were transferred into single wells of 6-well microplates.
Each well contained 9-10 mL sieved seawater (55 µm). Temperature and light
conditions were adjusted to in situ conditions daily (WTB binder incubator). After 24
hours females were removed from the wells, and eggs were counted.
Stable isotope determinationStable isotope analyses give us insights into the nutritional sources plants and
animals are using. The stable isotope pattern of a grazing organism reflects the
stable isotope pattern of its food source. Especially, the signatures of 13C and 15N are
widely used in ecology. The ratio between 13C and 12C gives an indication of the
carbon source that was foraged. The enrichment of the stable nitrogen isotope 15N
can be used as a trophic tracer because the stable isotope signatures of a consumer
generally reflects the isotopic composition of their diets and enriches the heavier
isotopes in a relatively dependable manner (Minagawa and Wada 1984). Stable
isotopes of carbon and nitrogen were measured in 2 to 6 parallels with 5 to 17 heat
dried (60°C, 12 h) adult female copepods per measurement (UC Davis-Stable
Isotope Facility, CA, USA). Occasionally only one sample was measured due to a
lack of material. Carbon and nitrogen stable isotope ratios were determined by
continuous flow isotope ratio mass spectrometry. Stable isotope ratios are given
using the δ notation expressed in units per mil as follows:
δ ‰=R sampleRstandard
−1∗1000 , and R= C13
C12 or R= N15
N14.
δ15N was calibrated versus air, δ13C versus Peedee belemnite carbonite.
Protein content and enzyme activitiesWater soluble protein contents of individual females (N=5-10) were measured with
the bicinchoninic acid assay (BCA, Pierce Ltd.) (chapter 2). Bovine serum albumin
(BSA, 1 to 5 µg per well) was used as standard.
72
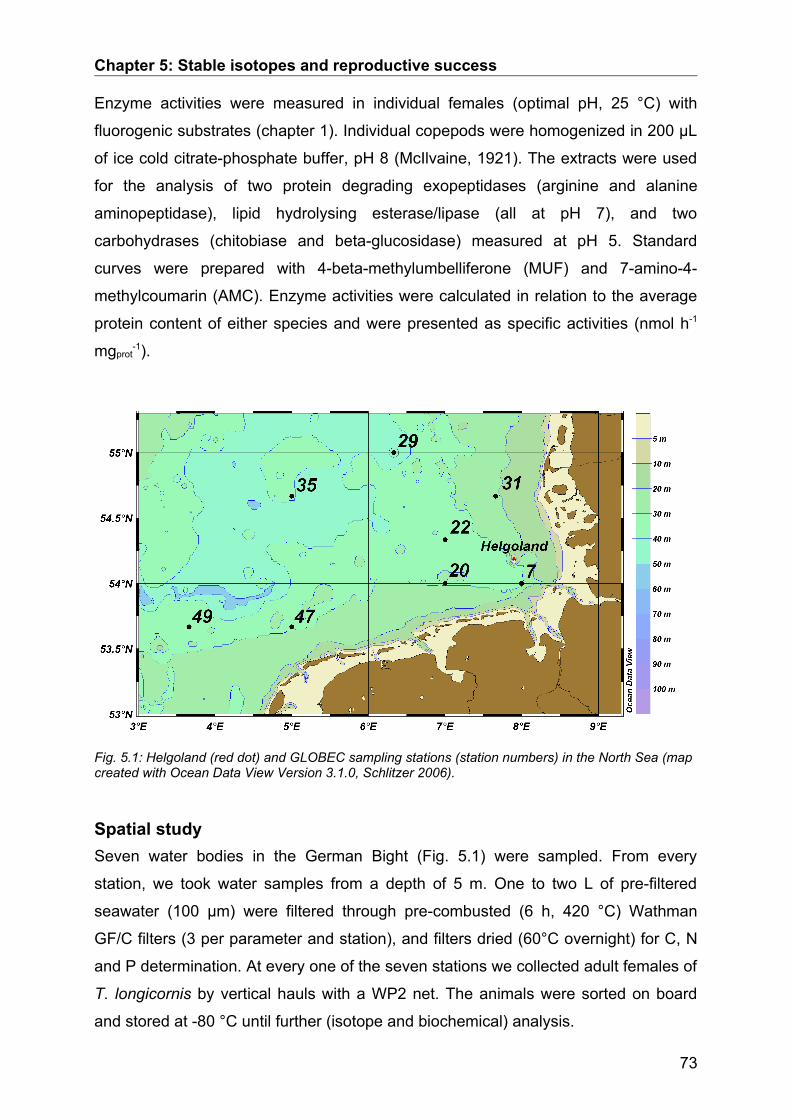
Chapter 5: Stable isotopes and reproductive success
Enzyme activities were measured in individual females (optimal pH, 25 °C) with
fluorogenic substrates (chapter 1). Individual copepods were homogenized in 200 µL
of ice cold citrate-phosphate buffer, pH 8 (McIlvaine, 1921). The extracts were used
for the analysis of two protein degrading exopeptidases (arginine and alanine
aminopeptidase), lipid hydrolysing esterase/lipase (all at pH 7), and two
carbohydrases (chitobiase and beta-glucosidase) measured at pH 5. Standard
curves were prepared with 4-beta-methylumbelliferone (MUF) and 7-amino-4-
methylcoumarin (AMC). Enzyme activities were calculated in relation to the average
protein content of either species and were presented as specific activities (nmol h-1
mgprot-1).
Spatial studySeven water bodies in the German Bight (Fig. 5.1) were sampled. From every
station, we took water samples from a depth of 5 m. One to two L of pre-filtered
seawater (100 µm) were filtered through pre-combusted (6 h, 420 °C) Wathman
GF/C filters (3 per parameter and station), and filters dried (60°C overnight) for C, N
and P determination. At every one of the seven stations we collected adult females of
T. longicornis by vertical hauls with a WP2 net. The animals were sorted on board
and stored at -80 °C until further (isotope and biochemical) analysis.
73
Fig. 5.1: Helgoland (red dot) and GLOBEC sampling stations (station numbers) in the North Sea (map created with Ocean Data View Version 3.1.0, Schlitzer 2006).

Chapter 5: Stable isotopes and reproductive success
Table 5.1: Ranges of stable isotope values in seston and copepod samples (N=3-6, means ± SD); total period: 16/02/2004-19/04/2005; spring 04: 16/02-27/05/2004; spring 05: 15/02-19/04/2005.
Parameter/Period
Min ( ‰ ) Min day Max ( ‰ ) Max day
Seston δ15NTotal 4.9 ± 0.1 26/04/2004 11.9 ± 0.4 06/08/2004Spring 04 4.9 ± 0.1 26/04/2004 10.4 ± 0.5 14/04/2004Spring 05 7.5 ± 1.6 01/03/2005 10.0 ± 0.6 10/04/2005T. l. δ15Ntotal 8.5 ± 0.7 19/02/2004 15.6 ± 0.4 22/03/2005Spring 04 8.5 ± 0.7 19/02/2004 15.0 ± 0.1 29/03/2004Spring 05 12.7 ± 0.7 08/03/2005 15.6 ± 0.4 22/03/2005A. c. δ15NSpring 04 7.7 ± 0.0 29/04/2004 13.8 ± 0.3 13/04/2004Seston δ13CTotal -23.7 ± 0.3 05/04/2004 -12.8 ± 0.4 19/11/2004Spring 04 -22.3 ± 0.1 13/05/2004 -16.7 ± 0.2 22/03/2004Spring 05 -23.7 ± 0.3 05/04/2005 -16.8 ± 0.1 15/02/2005T. l. δ13CTotal -21.1 ± 0.3 01/07/2004 16.7 ± 0.10 04/11/2004Spring 04 -20.8 ± 0.0 19/04/2004 -17.8 ± 0.03 27/05/2004Spring 05 -20.1 ± 0.2 12/04/2005 -18.7 ± 0.20 22/02/2004A. c. δ13CSpring 04 -23.5 ± 0.0 15/04/2004 -17.4 ± 0.02 27/05/2004
C, N and P determinationSeston filters were analysed for total particulate carbon (TPC) and nitrogen (TPN)
using a CHN analyser (Fisons Instruments EA 1108). Acetanilid (Thermo Quest, 338
36700) served as standard. Molar C:N ratios were calculated. Differentiation between
particulate organic phosphorus (POP) and particulate inorganic phosphorus (PIP)
was done after Aspila et al. (1976). Total particulate phosphorus (TPP) was
determined by combusting the filter at 520°C for two hours, extraction in 6 mL 1N HCl
for 18 hours and measuring dissolved inorganic phosphorus (DIP) in the neutralized
extract after Grasshoff et al. (1983). PIP was determined by extracting the
uncombusted filter for 18 hours in 6 mL 1N HCl and measuring DIP in the neutralized
extract with an AutoAnalyser after Grasshoff et al. (1983). POP was calculated from
the difference between average TPP and PIP.
5.3. ResultsSeasonal StudyStable isotope patterns of copepods and seston varied considerably during a year
(Fig. 5.2), and between size fractions as measured in 3 phases of spring 2004 (Fig.
5.3). Stable δ15N (Fig. 5.2a, Table 5.1) ranged from 4.9 ± 0.07 ‰ to 11.9 ± 0.4 ‰ in
seston (means ± SD, also the following values), from 8.5 ± 0.7 to 15.6 ± 0.4 in T.
longicornis, and from 7.7 to 13.8 in A. clausi which was only measured during spring
74

Chapter 5: Stable isotopes and reproductive success
2004. Seston δ15N increased during spring 2004, dropping steeply from mid-April to
the lowest value end of April, then increasing again toward mid-May, dropping again.
Maximum values occurred during July and August, another minimum followed at the
end of August. From October throughout February the seston δ15N signature stayed
relatively stable at a medium level of 8.9 ± 0.8 (N=18; mean ± SD). Values started to
rise again in March 2005. The copepods more or less follow the seston pattern but
on a higher level.
Seston δ13C ranged from -23.7 ± 0.3 ‰ to -12.8 ± 0.4 ‰ , in T. longicornis from
-21.1 ± 0.3 ‰ to -16.7 ± 0.1 ‰ , in A. clausi from -23.5 ± 0 ‰ to -17.41 ± 0.02 ‰
(Fig. 5.2b, Table 5.1). During both spring times the values decreased due to a shift in
the seston composition. Lowest values occurred in late April and early May, and in
June and July. From August until the end of February the seston δ13C stayed
relatively high, with highest values from mid-November till mid-January. The copepod
δ13C ratios were at similar levels as seston. The δ13C signal of A. clausi was
consistently lower than the signal of Temora. This is considered a first hint that the
two species selected distinct food items out of the bulk seston.
The four size fractions of three spring phases showed some peculiarities. The
phases were (as in chapter 3): March: early phase with low phytoplankton and high
seston C:N; April: phytoplankton growth phase with decreasing seston C:N; May: late
75
Fig. 5.2: Seston and copepod stable isotopes during a year including 2 spring times (N=3-6, means ± SE), Acartia clausi was only sampled during spring 2004.
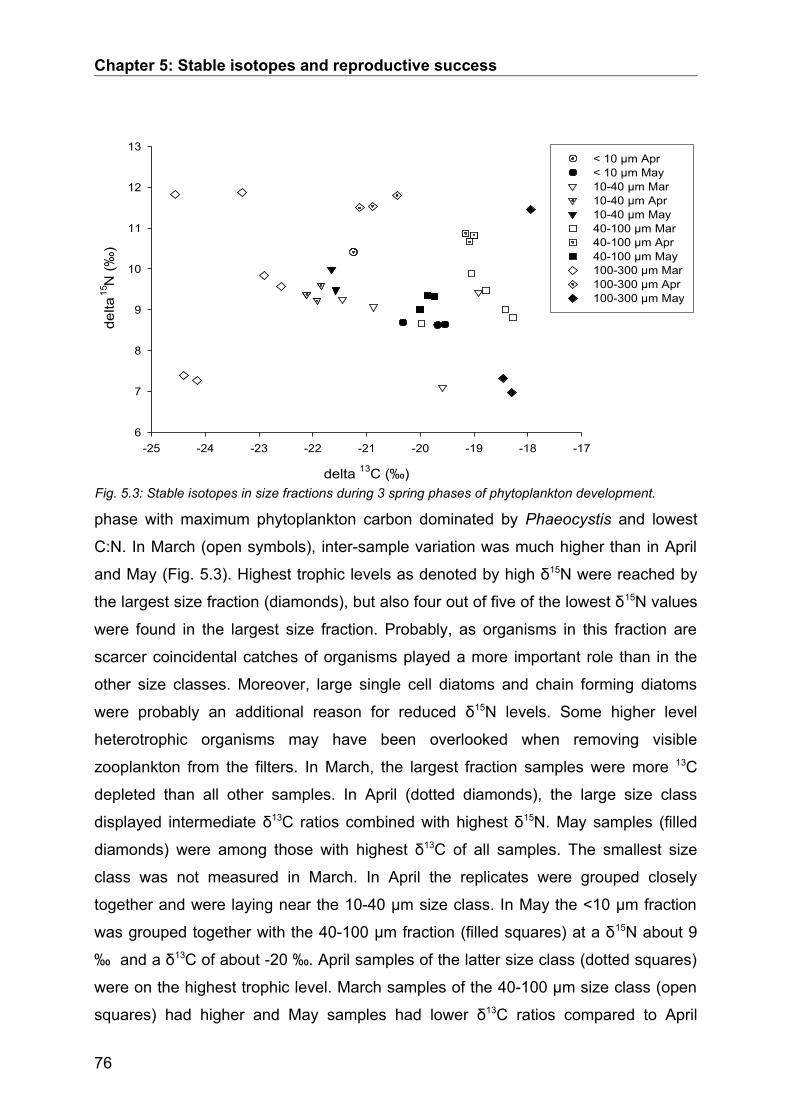
Chapter 5: Stable isotopes and reproductive success
phase with maximum phytoplankton carbon dominated by Phaeocystis and lowest
C:N. In March (open symbols), inter-sample variation was much higher than in April
and May (Fig. 5.3). Highest trophic levels as denoted by high δ15N were reached by
the largest size fraction (diamonds), but also four out of five of the lowest δ15N values
were found in the largest size fraction. Probably, as organisms in this fraction are
scarcer coincidental catches of organisms played a more important role than in the
other size classes. Moreover, large single cell diatoms and chain forming diatoms
were probably an additional reason for reduced δ15N levels. Some higher level
heterotrophic organisms may have been overlooked when removing visible
zooplankton from the filters. In March, the largest fraction samples were more 13C
depleted than all other samples. In April (dotted diamonds), the large size class
displayed intermediate δ13C ratios combined with highest δ15N. May samples (filled
diamonds) were among those with highest δ13C of all samples. The smallest size
class was not measured in March. In April the replicates were grouped closely
together and were laying near the 10-40 µm size class. In May the <10 µm fraction
was grouped together with the 40-100 µm fraction (filled squares) at a δ15N about 9
‰ and a δ13C of about -20 ‰. April samples of the latter size class (dotted squares)
were on the highest trophic level. March samples of the 40-100 µm size class (open
squares) had higher and May samples had lower δ13C ratios compared to April
76
Fig. 5.3: Stable isotopes in size fractions during 3 spring phases of phytoplankton development. delta 13C (‰)
-25 -24 -23 -22 -21 -20 -19 -18 -17
delta
15N
(‰)
6
7
8
9
10
11
12
13< 10 µm Apr< 10 µm May10-40 µm Mar10-40 µm Apr10-40 µm May40-100 µm Mar40-100 µm Apr40-100 µm May100-300 µm Mar100-300 µm Apr100-300 µm May

Chapter 5: Stable isotopes and reproductive success
samples. The 10-40 µm class (top-down triangles) was quite homogenously grouped
together throughout all spring phases (δ15N: 9 to 10; δ13C: -22.5 to -21) with the
exception of 2 March samples (open symbols). Both had higher δ 13C ratios, and one
of them was on a lower δ15N level (7 ‰).
Copepod stable isotope patterns were correlated to the seston isotope patterns (Fig.
5.4). The correlation of T. longicornis δ15N with seston was significant ( r 2=0.24 ,
p=0.004 ). The correlation of T. longicornis δ13C with seston ( r 2=0.14 ,
p=0.04 ) was weaker. In A. clausi, the δ15N correlation with seston was weaker (
r 2=0.27 , p=0.03 ) than that of δ13C ( r 2=0.38 , p=0.01 ). However, a
negative relationship between all T. longicornis δ15N and δ13C ( N=113 ,
r 2=0.08 , p=0.002 ) as compared to a weak positive relationship of the two
stable isotope ratios in the seston ( N=189 , r 2=0.02 , p=0.03 ) hint to a
selective use of the total seston source.
A comparison of the stable isotopes of both species during spring revealed that T.
longicornis (Fig. 5.5a) was feeding on a more 13C enriched source than A. clausi (Fig.
77
Fig. 5.4: Copepod stable isotopes versus seston stable isotopes with regression lines (N=3-6, means ± SD); occasionally only one parallel.
a)
cope
pod
delta
15N
(‰)
6
8
10
12
14
16
T. l. - spring 04T. l. - restT. l. - spring 05
b)
cope
pod
delta
13C
(‰)
-24
-22
-20
-18
-16
c)
seston delta 15N (‰ )
4 5 6 7 8 9 10 11 12 13
cope
pod
delta
15N
(‰)
6
8
10
12
14
16
A. c. - spring 04
d)
seston delta 13C (‰ )
-23 -22 -21 -20 -19 -18 -17 -16
cope
pod
delta
13C
(‰)
-28
-26
-24
-22
-20
-18
-16

Chapter 5: Stable isotopes and reproductive success
5.5b) except in May. In the early spring phase T. longicornis was grazing on highest
δ15N levels but switched to very low levels during March, this indicates the usage of
another main food source. The span of δ13C depicts that A. clausi was utilizing
carbon sources of greater variability than T. longicornis. Seston δ15N was generally
lower than copepod δ15N but the lowest δ13C were still higher compared to copepod
values (Fig. 5.5c). During the phytoplankton increase phase A. clausi acquired more
78
Fig. 5.5: Stable isotopes of a) Temora longicornis, b) Acartia clausi and c) seston during spring 2004, phytoplankton bloom phases signified by different symbols.
c)
delta 13C (‰)-24 -22 -20 -18 -16
delta
15N
(‰)
4
6
8
10
12
14
16
early phase (Feb & Mar)increase phase (Apr)maximum & decay (May)
a)de
lta 15
N (‰
)
4
6
8
10
12
14
16 b)
delta 13C (‰)-24 -22 -20 -18 -16
delta
15N
(‰)
4
6
8
10
12
14
16
Fig. 5.6 Difference between Temora longicornis/Acartia clausi and seston a) δ15N and b) δ13C; (N=3, means, no copepod results in December and January).

Chapter 5: Stable isotopes and reproductive success
13C depleted carbon than at other times. The two copepods had a similar δ15N
signature distance to seston during spring that only deviated in early February, being
higher in A. clausi (Fig. 5.6a). In March and April, the distances between copepods
and seston appear to reach maxima denoting a relative increase of the phytoplankton
proportion in the environment that decreases the seston δ15N signal. During summer
the heterotroph proportions of seston increased to maximum levels (Fig. 5.2a)
probably reducing the distance of the copepods to the seston signal. A. clausi kept a
constantly larger, more depleted distance to seston δ13C as T. longicornis during
early spring 2004. The negative distance between T. longicornis and seston δ13C
began to change from mid April on, the copepod becoming more enriched compared
to seston; A. clausi followed the same trend in May. The distance of T. longicornis to
seston δ13C ranged between 0 and +2 throughout summer. During spring 2005 T.
longicornis became depleted in comparison to seston similarly to spring 2004 but for
a shorter period. This indicates highly selective feeding on a carbon source with a
low δ13C during spring when phytoplankton food was abundant.
Both stable isotope ratios showed significant relationships with copepod egg
production and body biochemistry and physiology. Egg production was negatively
correlated to seston δ13C in T. longicornis ( r 2=0.17 , p=0.02 ) and A. clausi
79
Fig. 5.7: Egg production of copepods is negatively correlated to seston δ13C over the year.
seston de lta 13C (‰ )
-22 -20 -18 -16
(egg
s fe
mal
e-1 d
ay-1
)
0
10
20
30
40
50
T. longicornisA . clausiT . l., r=0.41, p=0.02A. c. r=0.47, p=0.004
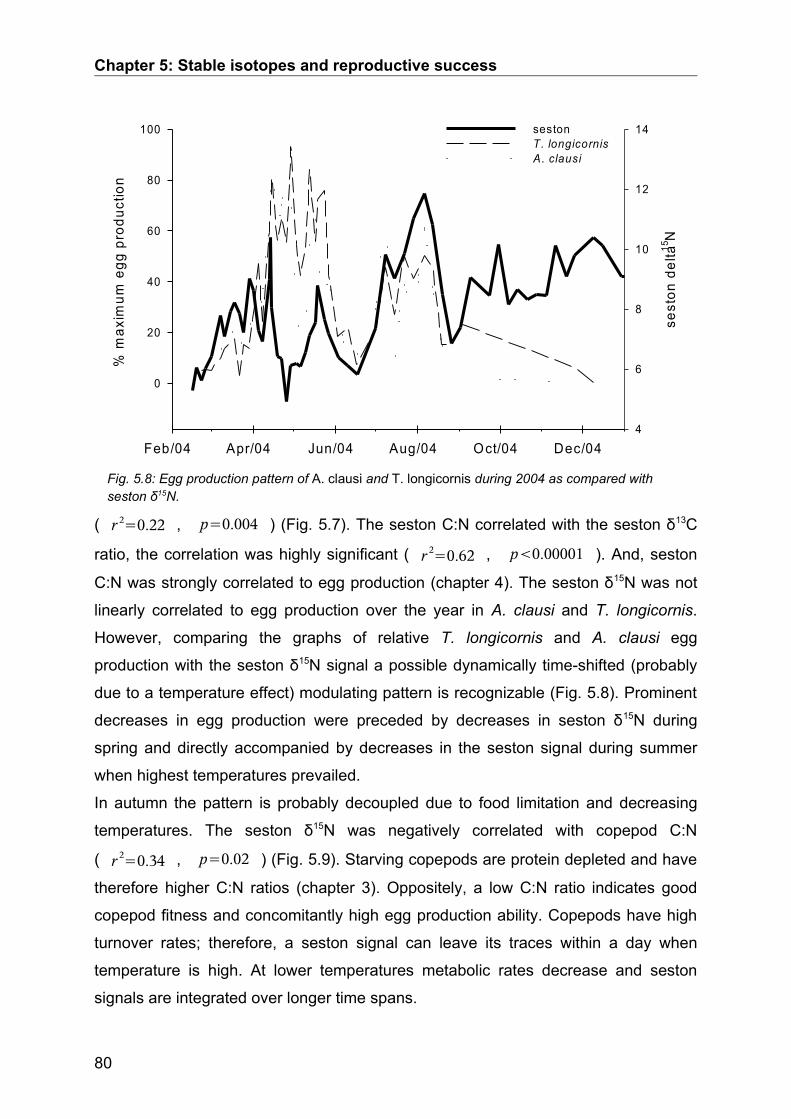
Chapter 5: Stable isotopes and reproductive success
( r 2=0.22 , p=0.004 ) (Fig. 5.7). The seston C:N correlated with the seston δ13C
ratio, the correlation was highly significant ( r 2=0.62 , p0.00001 ). And, seston
C:N was strongly correlated to egg production (chapter 4). The seston δ15N was not
linearly correlated to egg production over the year in A. clausi and T. longicornis.
However, comparing the graphs of relative T. longicornis and A. clausi egg
production with the seston δ15N signal a possible dynamically time-shifted (probably
due to a temperature effect) modulating pattern is recognizable (Fig. 5.8). Prominent
decreases in egg production were preceded by decreases in seston δ15N during
spring and directly accompanied by decreases in the seston signal during summer
when highest temperatures prevailed.
In autumn the pattern is probably decoupled due to food limitation and decreasing
temperatures. The seston δ15N was negatively correlated with copepod C:N
( r 2=0.34 , p=0.02 ) (Fig. 5.9). Starving copepods are protein depleted and have
therefore higher C:N ratios (chapter 3). Oppositely, a low C:N ratio indicates good
copepod fitness and concomitantly high egg production ability. Copepods have high
turnover rates; therefore, a seston signal can leave its traces within a day when
temperature is high. At lower temperatures metabolic rates decrease and seston
signals are integrated over longer time spans.
80
Fig. 5.8: Egg production pattern of A. clausi and T. longicornis during 2004 as compared with seston δ15N.
Feb/04 Apr/04 Jun/04 Aug/04 Oct/04 Dec/04
sest
on d
elta15
N
4
6
8
10
12
14%
max
imum
egg
pro
duct
ion
0
20
40
60
80
100 sestonT. longicornisA. clausi

Chapter 5: Stable isotopes and reproductive success
Protein and digestive enzyme activitiesIn both species water soluble protein contents increased throughout the season. In
A. clausi all values were significantly different from each other ( p0.001 ), in T.
longicornis the protein content in February did not differ significantly from that in
March, but all other values were significantly different from each other. Relative
protein content about doubled in A. clausi while it stayed relatively stable in T.
longicornis (Table 5.2). Activities of the same enzymes measured between February
and May were significantly different between both species (Student-t-Test,
p0.05 ) with the exception of alanine aminopeptidase. In A. clausi the seasonal
patterns of arginine aminopeptidase (Fig. 5.10a), esterase/lipase (Fig. 5.10c) and
chitobiase activity (Fig. 5.10d) were similar with lowest activities in March. However,
seasonal patterns of arginine aminopeptidase (Fig. 5.10a) and esterase/lipase (Fig.
5.10c) were not significant.
Lowest alanine aminopeptidase activities in April were significantly different from the
other months (LSD-Test, p0.05 , Fig. 5.10b). Beta-Glucosidase activity was
constantly rising, activities in May being significantly different from the other months
(LSD-Test, p0.05 ). Enzyme activities of T. longicornis followed other seasonal
81
Fig. 5.9: Correlation of seston δ15N with copepod C:N (N=3, means ± SD), linear regressions for both species: T. l.-C:N = 5.4 – 0.1 * seston δ15N (r=0.49; r²=0.24, F=10.2, p=0.003); A. c.-C:N = 4.9 -0.07 * seston δ15N (r=0.41, r²=0.17, F=3.4, p=0.08).
seston delta 15N (‰)
4 6 8 10 12 14
cope
pod
mol
ar C
:N
3.8
4.0
4.2
4.4
4.6
4.8
5.0
5.2
5.4
5.6
T. longicornisA. clausiT. l. p=0.003A. c. p=0.08
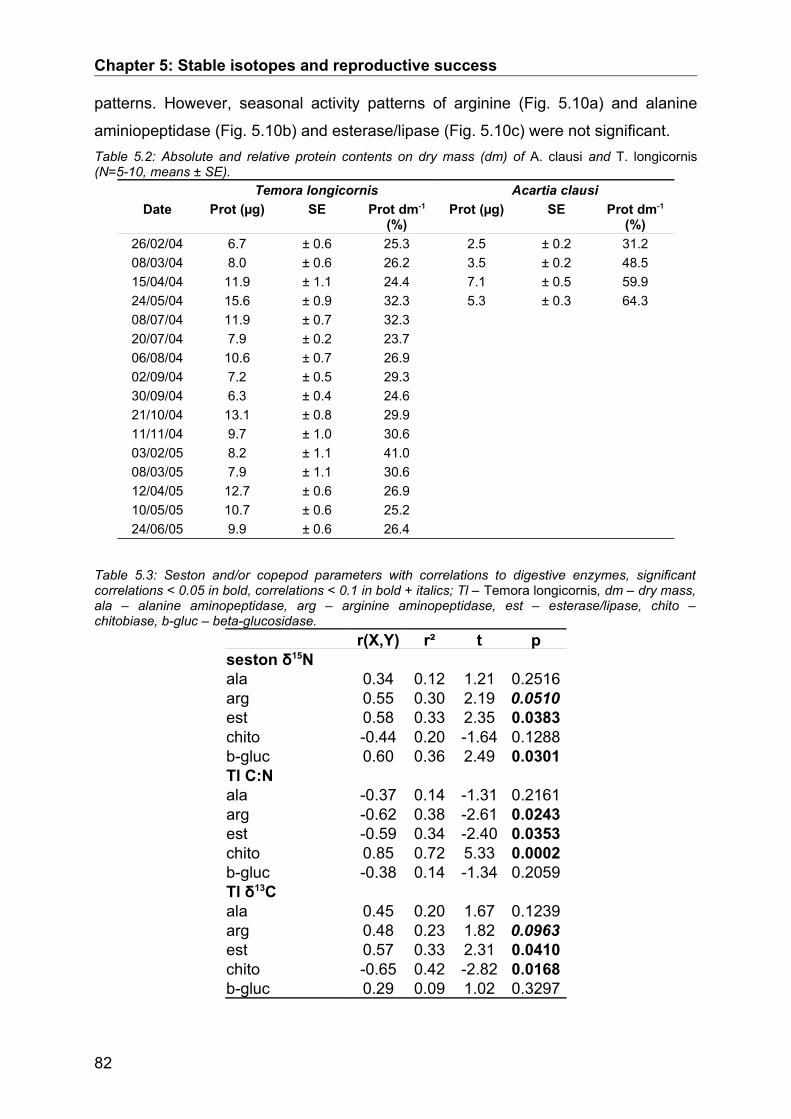
Chapter 5: Stable isotopes and reproductive success
patterns. However, seasonal activity patterns of arginine (Fig. 5.10a) and alanine
aminiopeptidase (Fig. 5.10b) and esterase/lipase (Fig. 5.10c) were not significant. Table 5.2: Absolute and relative protein contents on dry mass (dm) of A. clausi and T. longicornis (N=5-10, means ± SE).
Temora longicornis Acartia clausiDate Prot (µg) SE Prot dm-1
(%)Prot (µg) SE Prot dm-1
(%)26/02/04 6.7 ± 0.6 25.3 2.5 ± 0.2 31.208/03/04 8.0 ± 0.6 26.2 3.5 ± 0.2 48.515/04/04 11.9 ± 1.1 24.4 7.1 ± 0.5 59.924/05/04 15.6 ± 0.9 32.3 5.3 ± 0.3 64.308/07/04 11.9 ± 0.7 32.320/07/04 7.9 ± 0.2 23.706/08/04 10.6 ± 0.7 26.902/09/04 7.2 ± 0.5 29.330/09/04 6.3 ± 0.4 24.621/10/04 13.1 ± 0.8 29.911/11/04 9.7 ± 1.0 30.603/02/05 8.2 ± 1.1 41.008/03/05 7.9 ± 1.1 30.612/04/05 12.7 ± 0.6 26.910/05/05 10.7 ± 0.6 25.224/06/05 9.9 ± 0.6 26.4
Table 5.3: Seston and/or copepod parameters with correlations to digestive enzymes, significant correlations < 0.05 in bold, correlations < 0.1 in bold + italics; Tl – Temora longicornis, dm – dry mass, ala – alanine aminopeptidase, arg – arginine aminopeptidase, est – esterase/lipase, chito – chitobiase, b-gluc – beta-glucosidase.
r(X,Y) r² t pseston δ15Nala 0.34 0.12 1.21 0.2516arg 0.55 0.30 2.19 0.0510est 0.58 0.33 2.35 0.0383chito -0.44 0.20 -1.64 0.1288b-gluc 0.60 0.36 2.49 0.0301Tl C:Nala -0.37 0.14 -1.31 0.2161arg -0.62 0.38 -2.61 0.0243est -0.59 0.34 -2.40 0.0353chito 0.85 0.72 5.33 0.0002b-gluc -0.38 0.14 -1.34 0.2059Tl δ13Cala 0.45 0.20 1.67 0.1239arg 0.48 0.23 1.82 0.0963est 0.57 0.33 2.31 0.0410chito -0.65 0.42 -2.82 0.0168b-gluc 0.29 0.09 1.02 0.3297
82
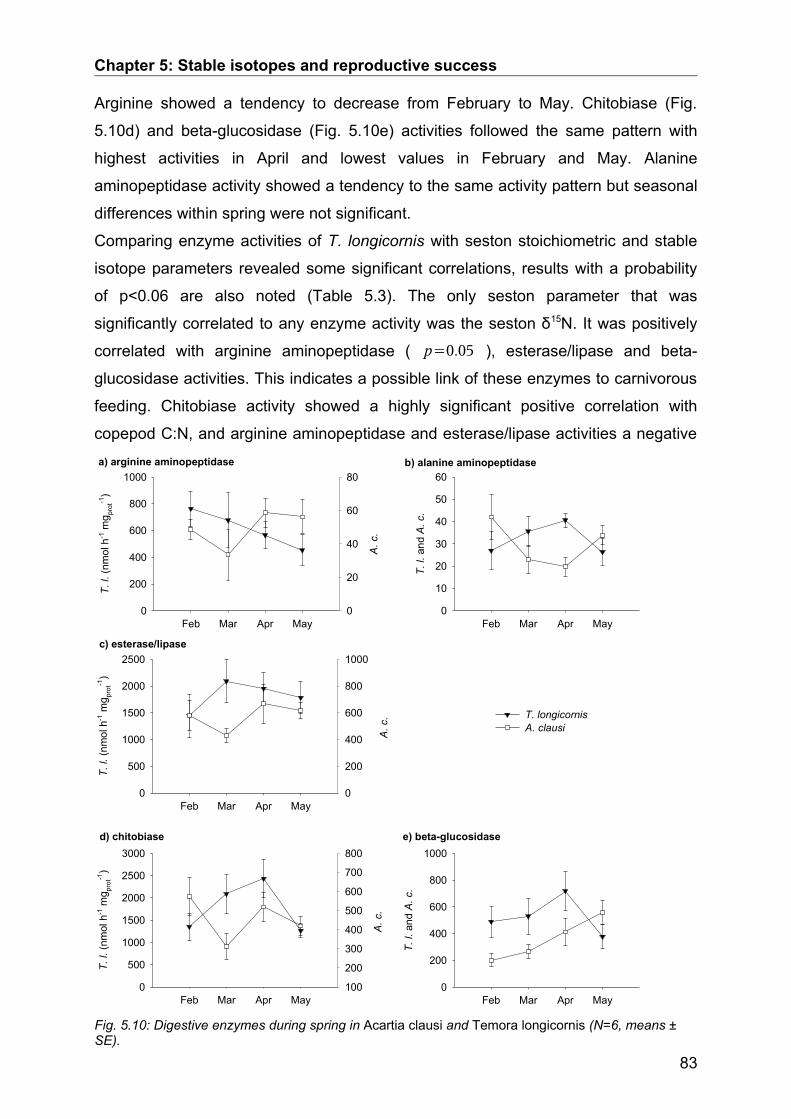
Chapter 5: Stable isotopes and reproductive success
Arginine showed a tendency to decrease from February to May. Chitobiase (Fig.
5.10d) and beta-glucosidase (Fig. 5.10e) activities followed the same pattern with
highest activities in April and lowest values in February and May. Alanine
aminopeptidase activity showed a tendency to the same activity pattern but seasonal
differences within spring were not significant.
Comparing enzyme activities of T. longicornis with seston stoichiometric and stable
isotope parameters revealed some significant correlations, results with a probability
of p<0.06 are also noted (Table 5.3). The only seston parameter that was
significantly correlated to any enzyme activity was the seston δ15N. It was positively
correlated with arginine aminopeptidase ( p=0.05 ), esterase/lipase and beta-
glucosidase activities. This indicates a possible link of these enzymes to carnivorous
feeding. Chitobiase activity showed a highly significant positive correlation with
copepod C:N, and arginine aminopeptidase and esterase/lipase activities a negative
83
Fig. 5.10: Digestive enzymes during spring in Acartia clausi and Temora longicornis (N=6, means ± SE).
b) alanine aminopeptidase
Feb Mar Apr May
T. l.
and
A. c
.
0
10
20
30
40
50
60
T. longicornisA. clausi
a) arginine aminopeptidase
Feb Mar Apr May
T. l.
(nm
ol h
-1 m
g prot
-1)
0
200
400
600
800
1000
A. c
.
0
20
40
60
80
c) esterase/lipase
Feb Mar Apr May
T. l.
(nm
ol h
-1 m
g prot
-1)
0
500
1000
1500
2000
2500
A. c
.
0
200
400
600
800
1000
d) chitobiase
Feb Mar Apr May
T. l.
(nm
ol h
-1 m
g prot
-1)
0
500
1000
1500
2000
2500
3000
A. c
.
100
200
300
400
500
600
700
800e) beta-glucosidase
Feb Mar Apr May
T. l.
and
A. c
.
0
200
400
600
800
1000

Chapter 5: Stable isotopes and reproductive success
correlation to copepod C:N. Therefore, chitobiase activity indicates carbon
assimilation, while arginine aminopeptidase, esterase/lipase and beta-glucosidase
indicate the assimilation of nitrogen.
The copepod δ13C ratio was negatively correlated with chitobiase activity and
positively with arginine aminopeptidase and esterase/lipase activity. Hence, a low
copepod δ13C denotes high chitobiase activity accompanied by high C assimilation.
No direct correlations of egg production with enzyme activities could be observed
(there were too few overlapping data points with enough variance).
84
Fig. 5.11 Temora longicornis: specific enzyme activities in the German Bight, June 2004 (N=6; means ± SE).
a) arginine aminopeptidase
(nm
ol h
-1 m
g pro
t-1)
200
400
600
800
1000
1200
1400
1600b) alanine aminopeptidase
20
30
40
50
60
70
80
e) beta-glucosidase
7 20 22 29 31 35 47 49400
600
800
1000
1200
1400d) chitobiase
7 20 22 29 31 35 47 49
(nm
ol h
-1 m
g prot
-1)
400
600
800
1000
1200
c) esterase/lipase
(nm
ol h
-1 m
g prot
-1)
400600800
100012001400160018002000

Chapter 5: Stable isotopes and reproductive success
Spatial studyMeasurements of T. longicornis enzymatic (Fig. 5.11), biochemical and stable
isotope (Fig. 5.12) and also seston stoichiometric parameters (Fig. 5.13) at 7 stations
(Fig. 5.1) distributed over the German Bight and adjacent areas of the southern North
Sea revealed high spatial variability. The stations were sampled within 5 days in June
2004. The arginine aminopeptidase of T. longicornis was the enzyme that had the
highest variability between stations (Fig. 5.11a). Enzyme activities at station 49 close
to the Channel had highest over all enzyme activities of all stations. No correlations
of enzyme activities with any seston or animal parameters were found within this
spatial data set. The control of enzyme activity is very complex and may not be easily
assigned to bulk food parameters because copepods can feed selectively and adapt
85
Fig. 5.12 Biochemical and stable isotope data of T. longicornis in the southern North Sea: a) dry mass, b) protein proportion of dry mass, c) copeod δ15N versus δ13C:, d) molar C:N, e) δ15N, f) δ13C (means ± SE).
a)
dry
mas
s (µ
g)
152025303540455055
b)
7 20 22 29 31 35 47 49
prot
ein
dm-1
(µg:
µg)
0.26
0.28
0.30
0.32
0.34
0.36
0.38
0.40
d)m
olar
C:N
4.6
4.8
5.0
5.2
5.4
5.6
5.8
c)
delta 13C (‰)-24
.0-23
.0-22
.0-21
.0-20
.0-19
.0-18
.0-17
.0-16
.0
delta
15N
(‰)
4
6
8
10
12
14
16
7202229313549
e)
delta
15N
(‰)
6789
1011121314
f)
7 20 22 29 31 35 47 49
delta
13C
(‰)
-21
-20
-19
-18
-17
-16

Chapter 5: Stable isotopes and reproductive success
their enzyme activities to the environmental conditions they encounter to optimise
energy transfer (chapters 2 and 3).
T. longicornis dry mass (Fig. 5.12a) and prosome length, width, N, C, and protein
content varied significantly between stations (ANOVA, p0.03 ). The proportion of
body protein on dry mass (Fig. 5.12b) was positively correlated with C, N and P
content of the two small seston size fractions ( p0.03 ). However, the copepod
molar C:N (Fig 5.12d) did not differ significantly between stations. The copepod
stable isotope signatures were significantly different between stations (Fig. 5.12c, e,
f). The C (Fig. 5.13a) and N (Fig. 5.13b) contents and molar C:N (Fig. 5.13e) of all
seston size fractions varied significantly between stations (ANOVA, p0.003 ).
C and N contents of all seston size fractions except for the largest (30-100 µm) were
negatively correlated with body mass and body C and N contents ( p0.04 ).
Copepod dry mass, C and N content were negatively correlated with seston P
content of the 10-20 µm seston size class ( p0.05 ). These correlations could be
interpreted in a way, that the smaller seston particles do not support favourable
energy transfer to copepods. Copepod C:N ratio was positively correlated with seston
C:P (Fig. 5.13f) in the 30-100 µm size class ( p0.03 ). The C:P ratio of the 30-100
µm size class was negatively correlated to both stable isotope ratios. So, indirectly
one can say that the stoichiometric quality in terms of P proportion in this large
seston class leads to a high quality and fitness of the copepod. The N:P ratio (Fig.
5.13g) of this seston size class was correlated with body δ13C ( p0.05 ).
5.4. DiscussionInternal factors such as selective feeding and selective digestion control how different
species utilize their environment. The stable isotope patterns of grazers reflect the
stable isotope signatures of their food. Therefore, differences in stable isotope
patterns between co-occurring species hint to selective assimilation abilities, no
matter whether controlled by selective feeding or by selective digestion.
Stable isotopesWe found an inverse relationship between seston δ15N and copepod molar C:N. Low
copepod molar C:N as well as a high protein:dry mass ratio are favourable for egg
production (Checkley 1980a). The higher the seston δ15N value, the higher is the
proportion of heterotroph particles in the seston, or in other words the potential for
carnivorous feeding for copepods. Starving and N limited zooplankton loose body
86
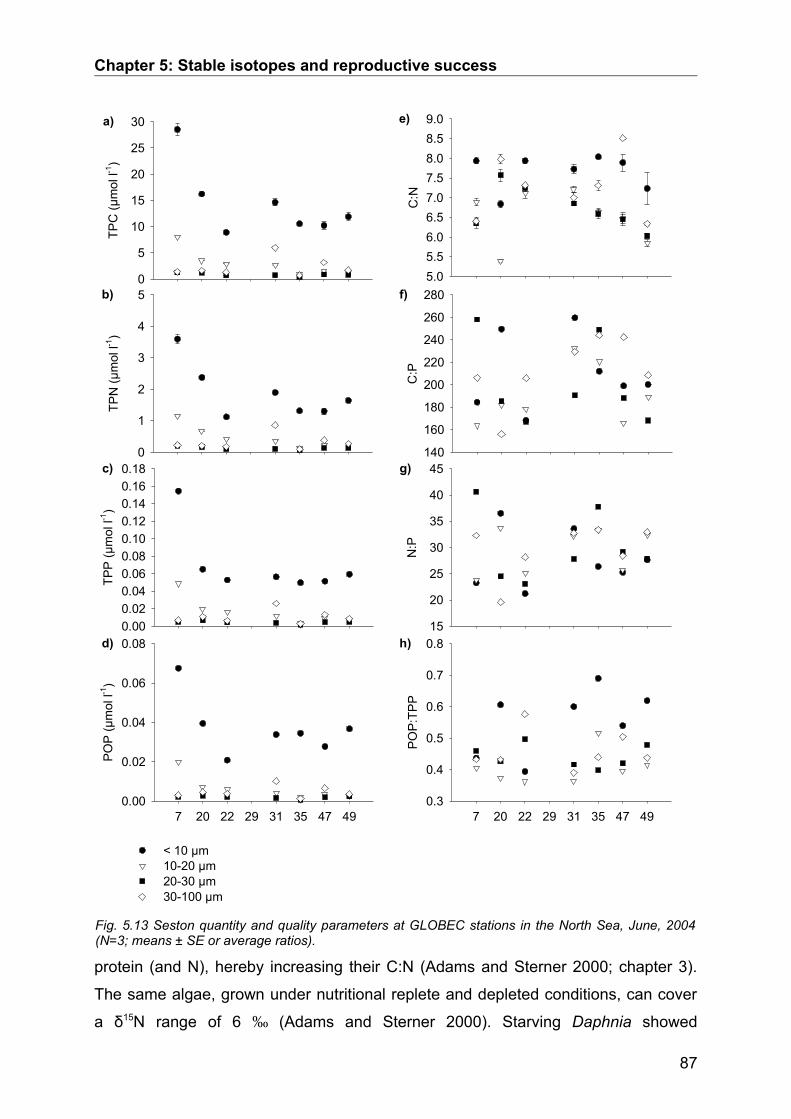
Chapter 5: Stable isotopes and reproductive success
protein (and N), hereby increasing their C:N (Adams and Sterner 2000; chapter 3).
The same algae, grown under nutritional replete and depleted conditions, can cover
a δ15N range of 6 (Adams and Sterner 2000). Starving Daphnia showed
87
Fig. 5.13 Seston quantity and quality parameters at GLOBEC stations in the North Sea, June, 2004 (N=3; means ± SE or average ratios).
a)TP
C (µ
mol
l-1)
0
5
10
15
20
25
30
b)
TPN
(µm
ol l-1
)
0
1
2
3
4
5
c)
TPP
(µm
ol l-1
)
0.000.020.040.060.080.100.120.140.160.18
e)
C:N
5.05.56.06.57.07.58.08.59.0
f)
C:P
140
160
180
200
220
240
260
280
g)
N:P
15
20
25
30
35
40
45
h)
7 20 22 29 31 35 47 49
PO
P:T
PP
0.3
0.4
0.5
0.6
0.7
0.8d)
7 20 22 29 31 35 47 49
PO
P (µ
mol
l-1)
0.00
0.02
0.04
0.06
0.08
< 10 µm10-20 µm20-30 µm30-100 µm

Chapter 5: Stable isotopes and reproductive success
enrichment of 15N, probably due to the catabolism of body proteins, and the
concomitant increased excretion of 14N compared to 15N (Adams and Sterner 2000).
Accordingly, light 12C is preferably excreted over heavy 13C (Klein Breteler et al.
2002).
In spring, concomitantly with increasing phytoplankton biomass, copepod
reproduction increased with decreasing δ13C. Both copepod species contained a
lower proportion of heavy 13C than the bulk seston, indicating highly selective feeding
on a source with a relatively low proportion of 13C compared to bulk seston. In spring
2005 the seston δ13C dropped more dramatically than in 2004. But T. longicornis fed
on a similar food source as in spring 2004 in respect to δ13C. In the summer months,
in autumn, and in winter, copepods exhibited a δ13C signature that was less depleted
in heavy isotope than bulk seston. Therefore, selective feeding may be most
prominent during spring and less so during other seasons.
An increase in seston δ13C values can signify nutrient limitation. Under phosphorus
limitation a marine diatom accumulated heavy 13C with a similar rate as carbon
enriched phytoplankton (Gervais and Riebesell 2001). The positive correlation of
seston N:P (30-100 µm size class) with body δ13C at the North Sea stations does
support this finding. Larger phytoplankton was possibly enriched in 13C due to
phosphorus depletion, and this effect may be transferred to copepods. Otherwise,
diatoms in the growth phase are enriched in 13C (δ13C ranging from -15 to -19)
compared to most particulate matter that is rather 13C depleted (δ13C ranging from
-21 to -25) (Fry and Wainright 1991). T. longicornis δ13C was only below -20 ‰, when
being on very high δ15N > 12 ‰ at the same time. However, marine microalgal δ13C
can vary greatly from -30.2 to -12.7 in different species and under varying growth
conditions (Leboulanger et al. 1995).
In winter, high average wind speeds mix the water column of the shallow North Sea
areas. The detritus proportion on seston increases. Detritus is usually depleted in
δ13C (Bouillon et al. 2000) and an inferior food source for copepods (Mayzaud et al.
1998). High seston C:N together with low seston δ13C would be an indicator of high
amounts of detritus and benthic material or of freshwater influence. Low salinity
coastal water is influenced by river run-off, and therefore, contains high nutrient loads
compared to offshore water and terrestrial material. Nitrogen input makes algae
lighter and decreases δ15N, riverine phytoplankton is depleted of 13C compared to
88

Chapter 5: Stable isotopes and reproductive success
oceanic phytoplankton and can have similar low values as terrestrial material of
-28‰ (Peterson 1999).
Digestive enzymesBoth species adapt their digestive enzymes to the same food environment in a
species-specific way. The strong increase in relative protein content during the spring
bloom in A. clausi as compared to T. longicornis denotes a protein limitation in A.
clausi in the beginning that is decreasing during the observed period. Either, T.
longicornis was not protein limited or the ingested food did not support increased
protein assimilation. The species-specific sets of digestive enzymes may enable the
two species to utilise deficient particles in a way that circumvents imbalances
(Anderson et al. 2004). The lower enzyme activities in March and April 2004 may
denote an increased ingestion of easily digestible heterotrophic food or food with
lower protein contents.
The specific set of digestive isozymes within some crustacean species is rather
genetically determined than environmentally (Sainz et al. 2005; chapter 3). This
genetic determination of the digestive system explains food choice in amphipods
(Guarna and Borowsky 1993; Sotka 2003) and may also control food selection in
copepods. Stable isotope analysis of copepods and seston hints to selective feeding
on the available seston components. Enzyme activities could be related to seston
and body stable isotopes. High chitobiase activity was correlated to a high body C
proportion and a rather depleted body δ13C. The seston δ13C was inversely correlated
to egg production in T. longicornis and other copepods. Further, as stated above,
nitrogen limited growth decreases the phytoplankton δ15N and leads to a high body
C:N of cladocerans (Adams and Sterner 2000). Accordingly, we found a negative
correlation between seston δ15N and copepod C:N. The negative correlation of
arginine aminopeptidase and esterase/lipase with copepod C:N and the positive
correlation to seston δ15N may hint to a compensatory mechanism on the digestive
physiology level of T. longicornis to circumvent nitrogen imbalances. But more
probably it indicates high utilization rates of heterotroph organisms in the seston. This
view is supported by the correlation of increasing seston δ15N with decreasing body
C:N. Arginine aminopeptidase cleaves arginine and lysine from oligopeptides.
Esterase/lipase hydrolyses carboxylic esters and thioesters. High enzyme activities
usually denote the importance of the substrate in the nutrition of the animal.
Nevertheless, high activities are also found when the substrate is not easily
89

Chapter 5: Stable isotopes and reproductive success
digestible, for example autotroph protein sources require higher protease levels than
heterotrophic sources (Jones et al. 1997; chapter 1). And, at low substrate
concentrations high enzyme activities may be needed to compensate for threatening
food limitation or to prepare the digestive system for compensatory feeding when the
next food patch is foraged (Harris et al. 1986). T. longicornis and A. clausi are
adapted to a patchy food environment where they can encounter short-term food
limitation but do not experience long term starvation.
No clear patterns of biochemical and physiological parameters were discernible
between stations or water masses in the southern North Sea. The range of stable
isotopes in T. longicornis was similar over all stations including the Helgoland station.
The animals may use a similar total spectrum of food over all stations and in time.
The C:N ratios did not differ much but tended to be lower at German Bight stations
20 and 22. The most significant variability between stations was seen within the
range of arginine aminopeptidase activities, relative protein contents, and delta 13C
ratios. The highest arginine aminopeptidase activity occurred at the Channel station
(49), the lowest at the most estuarine station (7). The most remote station 35 showed
similar enzyme patterns as station 7 and 20 in the German Bight and the highest dry
mass combined with low relative protein content. T. longicornis did rarely show δ13C
below -20 ‰ and if, then in combination with a high δ15N. Such a signature
combination was seen at the Channel station 49. At this station individual dry mass
was among the highest, the relative protein content was the lowest of all stations,
combined with over-all highest enzyme activities, and higher arginine
aminopeptidase than chitobiase activity. The enzyme activities and the low protein
proportion do hint to food limitation. Highest δ15N values were found at station 49,
and at the German Bight stations except for the northernmost station (31). The
highest relative protein content at station 7 closest to the Elbe and Weser estuaries
was combined with the lowest individual dry mass of all stations and the lowest beta-
glucosidase activity but a high ratio of chitobiase to arginine aminopeptidase activity.
The enzyme activities were overall low. At the northern offshore station (29) the
combination of the lowest δ15N and δ13C were found implying a more herbivorous
food source than at the other stations.
ConclusionsSeston stable isotopes, especially the δ13C can be seen and implemented as a
general modulator of egg production in copepods despite differences between
90

Chapter 5: Stable isotopes and reproductive success
copepod species. At certain times such as spring, the seston δ15N pattern may be
used to predict copepod egg production with a time shift of about 10-15 days. Further
studies of seston-zooplankton-δ15N relations are necessary to strengthen this
statement. Digestive enzymes may indeed be used as additional tools to signify
species-specific selective feeding. And, at least chitobiase and arginine
aminopeptidase activities in adult copepods seem to depict the nutritional status of
the animal and therefore reflect the reproductive ability of females. The combination
of these different measurements is certainly a promising avenue in our quest to
unravel the factors that determine reproductive success of copepods in the world’s
seas.
91

Chapter 6: General discussion
Chapter 6: General discussion: synthesis and outlook6.1. SynthesisThis study shows that internal parameters of copepods greatly influence the energy
transfer between prey and grazer. Grazing behaviour and digestive system of
copepods interact in mediating the environmental signals of nutritional quality to the
copepod. Food quality was identified as an important parameter influencing egg
production rates in copepods, more important than food quantity.
Temperature has been suggested as the major controlling factor of reproductive
output in North Sea copepod species (Halsband and Hirche 2001), with food
concentrations only having minor effects (Koski and Kuosa 1999; Halsband-Lenk et
al. 2004). The present study and several other field studies have, however, shown
that egg production is often decoupled from temperature and food concentration and
rather depends on other factors such as food quality in terms of C:N:P ratios (chapter
3), fatty acids (Jónasdóttir et al. 1995; Arendt et al. 2005), amino acids (Guisande et
al. 2000; Guisande et al. 2002) or species composition with species that have
different biochemical qualities (Kleppel and Burkart 1995; Schmidt et al. 1998).
However, a temperature effect on copepod metabolism generally interacts with
temperature effects on nutritional factors, and hence the direct and indirect effects of
temperature are difficult to evaluate separately. Nevertheless, the results of this
thesis suggest that temperature and food concentration should be seen as absolute
switches setting a baseline which is modulated by the food quality effects on
copepod nutritional condition and egg production ability.
Acartia clausi and Temora longicornis ingested nitrogen and phosphorus in ratios
that suited their body elemental composition (chapter 4). Highest body specific
elemental uptake rates were found when the concentrations of these elements in the
seston were low. This indicates elemental food limitation at certain times, with
resulting compensatory feeding, as was reported earlier for A. tonsa (Prince et al.
2006) or freshwater cladocerans (Plath and Boersma 2001). In the grazing
experiments it was observed that the C:N of the ingested food was similar to seston
C:N and the relative ingestion of POP compared to TPP also followed the seston
signal. However, the C:N of ingested particles in relation to copepod body C:N
revealed imbalances. With decreasing seston C:N (rising quality) the ingested excess
carbon decreased, in principal lowering the imbalance between ingested C:N and
92

Chapter 6: General discussion
body C:N. This reduction of the stoichiometric imbalance should therefore lead to a
gain in energy that should be available for egg production.
The imbalance of ingested food with copepod body stoichiometry may be less
pronounced in reality than is indicated by this study. First, copepod acquisition of
minerals and imbalances between ingested and body stoichiometric ratios were
calculated under the assumption of homeostasis in grazers. However, the measured
body C:N of A. clausi and T. longicornis does vary over a range of 1 carbon atom per
nitrogen (Fig. 6.1). High variability in body C:N was obvious in T. longicornis while A.
clausi rather switched from a high level body C:N ratio during high seston C:N to a
lower level with minor variability during timeas of better stoichiometric food quality. Of
course, it has to be remembered that one would expect a difference between body
carbon and ingested carbon, since carbon is oxidised in respiratory metabolism, and
dissipates as CO2. In fact, a gross growth efficiency for carbon of around 30% is
normal, which necessitates a higher relative uptake for carbon than for nitrogen, and
the high molar rates of 2.5:1 ingested carbon:body carbon may not be that
imbalanced. Nevertheless, in the instances of these high values, a change in the
body C:N of the copepods was observed. It remains to be seen whether this is an
adaptation to low food quality (reducing the imbalance between food and body ratios)
93
Fig. 6.1: Body C:N variability of A. clausi and T. longicornis during spring 2004 and absolute carbon contents that were taken to determine the average stoichiometric ratio in both species during spring.
Feb/04 Mar/04 Apr/04 May/04 Jun/04
cope
pod
mol
ar C
:N
4.0
4.2
4.4
4.6
4.8
5.0
5.2
5.4
5.6
cope
pod
carb
on (µ
g)
0
5
10
15
20
25C:N A. clausi C:N T. longicornisC A. clausiC T. longicornis

Chapter 6: General discussion
or caused by the imbalanced food, and a result of the animal not being able to
maintain its homeostasis when the food shows severe imbalances (Van
Nieuwerburgh et al. 2004; Malzahn 2006). In fact, As T. longicornis eggs contain
higher lipid proportions than adult copepods (Helland et al. 2003), the increase in
body C:N in both species in April may not necessarily indicate a decreasing fitness of
adult animals but rather an increase in ovary production because in both species
maximal egg production rates were recorded in mid-April.
Secondly, the body specific ingestion of elements was calculated from bulk seston
and its relative amounts on ingested particles in two size classes. However,
especially the stable δ13C ratios of copepods showed that A. clausi and T. longicornis
feed selectively on different food sources at least during spring (chapter 5). Bulk
seston C:N was positively correlated with seston δ13C. However, differentiating the
seston signal into size classes showed how diverse the stable isotope signatures in
size classes were (Fig. 6.2). Nevertheless, bulk seston parameters do reflect the
condition and reproductive ability of 2 different copepod species.
Third, by regulation of enzyme activity the digestive system has the potential to
increase C excretion and thus counterbalance imbalances from higher proportions of
94
Fig. 6.2: Seston δ13C versus seston C:N in size classes.
C:N
6 8 10 12 14 16
sest
on d
elta
13C
-25
-24
-23
-22
-21
-20
-19
-18
-17
< 10 µm 10-40 µm 40-100 µm100-300 µm

Chapter 6: General discussion
C compared to other nutrients (Katechakis et al. 2002; Darchambeau 2005). In the
present study a positive correlation between T. longicornis C:N and chitobiase
activity was found and a negative correlation to arginine aminopeptidase activity.
Chitobiase is a carbohydrase that digests chitobiose, a chitin degradation product but
also similar substrates such as aminosugars derived from glycopeptides.
Exoskeletons of arthropods such as crustaceans but also diatom shells contain
chitin. Copepods may be utilising diatom chitin as was suggested for Antarctic krill
(Saborowski and Buchholz 1999). The correlation of chitobiase activity with a high
relative C content of T. longicornis indicates C assimilation through this pathway.
Arginine aminopeptidase was negatively correlated to copepod C:N and therefore
rather indicates N assimilation. It is an exopeptidase that releases arginine and lysine
from oligopeptides that have been cleaved by endopeptidases.
Both enzymes display activity changes in opposite ways and differ between the two
spring seasons (Fig. 6.3a, b). The bulk seston C:N pattern differs from the copepod
body C:N pattern (Fig. 6.4). That displays that the copepods do not assimilate food in
95
Fig. 6.3: Specific a) arginine aminopeptidase and b) chitobiase activity of T. longicornis during the year.
a) arginine aminopeptidase
Feb/04 Jun/04 Oct/04 Feb/05
(nm
ol h
-1 m
g prot
-1)
0
500
1000
1500
2000
2500
3000b) chitiobiase
Feb/04 Jun/04 Oct/04 Feb/050
500
1000
1500
2000
2500
3000
Fig. 6.4: Seston and T. longicornis molar C:N during the year.
Feb/04 Jun/04 Oct/04 Feb/05
mol
ar s
esto
n C
:N
468
10121416182022
mol
ar T. l
. C:N
3.84.04.24.44.64.85.05.25.45.6seston
T. l.

Chapter 6: General discussion
stoichiometric ratios as encountered but that they use distinct food sources within
bulk seston.
In spring 2004 the food source of T. longicornis has a similar stoichiometric pattern
as bulk seston, while in summer and spring 2005, obviously more N over C
(compared to seston) is assimilated. This is reflected by high arginine
aminopeptidase activities compared to chitobiase activities during these periods.
Hence, copepods clearly do adjust their digestive system to the food they choose out
of the total seston.
Starving and nitrogen limited zooplankton organism with low amounts of storage
lipids, such as the copepods under study, catabolise body protein as shown by a
reduction of protein under limiting conditions, and high activities of enzymes that are
correlated with high relative body nitrogen contents (chapter 2). Metabolising internal
protein leads to an over-proportional excretion of light 14N compared to 15N
(Minagawa and Wada 1984). Therefore, the body δ15N should not only increase in
animals feeding on higher trophic levels but also in starved and nitrogen limited
copepods. Both situations can easily be differentiated by concomitant evaluation of
the body C:N ratios, being low in well conditioned copepods utilizing easily digestible,
protein rich material and high in starved or nutrient limited animals. Indeed, the latter
situation has been shown experimentally in daphnids feeding on nitrogen limited
algae (Adams and Sterner 2000).
A. clausi and T. longicornis feed on different food sources during the phytoplankton
spring bloom as depicted by stable isotope analyses and digestive enzyme studies.
Surprisingly, these different feeding strategies lead to the same reproductive
success. Both species included small nanoplankton in their nutrition, but T.
longicornis to a lesser extent than A. clausi. However, both selected for larger
particles, but these are scarce. As a result, both species acquired most of their
minerals from plankton smaller than 10 µm. Particle counter based grazing rate
determinations in bottle experiments bare some methodological problems. An
increase in small particles in the grazed bottles can be caused by the growth of small
nanoplankton but can also be a result of sloppy feeding. Both processes
underestimate feeding on small particles. When large food particles are rare,
individual feeding on these particles may be underestimated in bottle experiments
because the grazer concentration in experiments greatly exceeds that in the field.
Field concentrations of adult calanoid copepods were less than 1 per litre during
96
Chapter 6: General discussion
spring 2004 (Laakmann 2004). Furthermore, copepods may scan and cruise larger
areas than just a one litre volume in the field (Paffenhöfer and Lewis 1990). Further,
competitive heterotroph protozoans that slip the pre-sieving of natural seawater that
is used for grazing experiments may outcompete copepod grazers, resulting in lower
concentrations of the small particles in control bottles than in bottles containing
copepods (Paffenhöfer 1998a).
However, even if the grazing results have to be interpreted with some caution, the
differences between the size classes were such that the conclusion seems justified
that even though copepods feed selectively on larger particles they obtain most of
their nutrients from the smaller particles.
Both species show a hovering, sinking and hopping rather than cruising behaviour to
find food. Copepods adjust their feeding habit to the size of particles they sense with
their antennules (Price et al. 1983). A size of about 5-10 µm appears to be the
boarder for individual prey handling in many species. Smaller particles cannot be
rejected singly but only as bulk when toxicity or low quality is sensed by the
chemoreceptors (Price et al. 1983). Getting rid of small particles may therefore cost
more than it pays off when low food quality is sensed. Since the smallest size fraction
of seston contains most of the nutrients that are available, the ingestion of these
particles determines the stoichiometric ratio of the ingested food.
Food ingestion is the first, food assimilation the next step in energy transfer from
lower trophic levels to copepods. What is assimilated is indicated by stable isotope
analyses of the copepods. How copepods assimilate this food, and which enzymes
they use to do so, was analysed with a method specially adapted to (mostly single
individuals of) copepods using fluorogenic substrates that greatly increase sensitivity
of an enzyme assay (chapter 2). Each copepod species was equipped with a unique
set of proteases. Sexes did not differ in their principle enzyme equipment and only
minor protease isozyme pattern variability occurred between individuals of one
species. The principal pattern did not switch in response to short-term starvation.
Enzyme production is obviously rather genetically determined than by environmental
parameters. Therefore, the digestive system probably determines selective feeding
and chemosensory abilities in copepods, rather than the reverse. This study indicates
that the combination of stable isotope analyses with enzymatic analyses has large
potential to explain selective ingestion and assimilation abilities of different species.
Despite conserved protease isozyme patterns the activities of some enzymes can
97

Chapter 6: General discussion
change upon short-term starvation in two Acartia species (chapter 3). Chitobiase
activity was reduced under starvation. Therefore, this enzyme is probably not
involved in catabolising internal resources and may denote a general food limitation
situation, also in other copepod and zooplankton species. The other enzymes
(alanine and arginine aminopeptidase, esterase/lipase and beta-glucosidase) are
probably needed for catabolic processes (chapter 3) as well as feeding, which might
explain why their activity was not reduced or even had higher activities under
starvation. A low chitobiase to arginine aminopeptidase (or also esterase/lipase and
beta-glcuosidase) ratio may, therefore, indicate a food limiting situation. High ratios of
chitobiase activity to arginine aminopeptidase activity were found at the German
Bight stations combined with high relative protein contents. Unfortunately, the ratio
may also reflect the exploitation of a specific food source that needs adjusted
enzyme activities as mentioned above.
Each copepod species has obviously highly conserved enzyme patterns, especially
the proteases. A genetic determination of protein digestion and amino acid
assimilation is supported by the findings that copepod reproductive performance is
highest when the amino acid composition of ingested food meets the species-specific
amino acid composition of the grazer (Guisande et al. 2000). In contrast, reports exist
that in other enzyme classes (carbohydrases or esterases and lipases) or species
the isozyme production can be environmentally regulated (Guérin and Kerambrun
1982).
In summary, stoichiometric food quality (C:N) is a major determining factor for
reproductive success of different copepod species during the year. The seston C:N
ratio is correlated to the δ13C signature of seston. Temporal and spatial patterns of
food quantity and quality are highly variable. Copepods can adjust their grazing
behaviour and digestive enzyme system in a compensatory mechanism to assimilate
elements in ratios that suit them best, also foraging on the < 10 µm seston size class
to a large extent. However, their nutrient body stoichiometry is not completely
homeostatic. Different species do ingest and assimilate food selectively. Food
selectivity is probably mediated by their genetically determined equipment with
digestive tools that are highly species specific. The regulation of enzyme activity
however is determined by the specific needs of copepods. Arginine aminopeptidase
and chitobiase may be good indicators of the elemental assimilation of N and C,
respectively, although it remains to be seen how this works mechanistically. Despite
98

Chapter 6: General discussion
the selective feeding of the copepods, bulk seston C:N or also δ13C are good
predictors of egg production rates.
6.2. OutlookTemperature is only a basic delimiter of secondary production in the field together
with food concentration. Thus, including food quality, digestive enzyme action, and
grazing patterns, and combining theses values with stable isotope analyses, is the
way to increase our predictive power on the processes that regulate the interactions
between zooplankton and phytoplankton.
In future, population dynamics studies in food webs should include an evaluation of
the influence of food quality on hatching success, developmental success and
predation risk.
Applying physiological micromethods to study digestive enzymes, such as presented
here, can dramatically reduce the sampling effort in field studies. Other enzymes
should be screened to find an equivalent for phosphorus assimilation to round up the
picture of mineral transfer through selective ingestion and assimilation.
The results from the field need to be confirmed by experimental approaches that
define the real prey field as compared to the total potential prey field as given by bulk
seston of different copepod species. The influence of mineral deficiencies,
eutrophication, toxic substances and the interaction with temperature on stable
isotope signatures, grazer physiology and behaviour need to be defined to further
refine the present knowledge.
99
Chapter 7: Summary
Chapter 7: SummaryThe aim of this study was to identify internal physiological factors and external
nutritional factors that have the potential to influence the population dynamics of
dominant copepod species in the North Sea. Seston quality in terms of C:N:P
stoichiometry correlated significantly with reproduction of copepods. Grazing
behaviour and the digestive system were found to interact in mediating the prominent
effect of food quality on copepod condition and reproduction. Food quality changed
considerably over time and space during the 2004-2005 sampling carried out in this
study. Stable isotope ratios of the seston indicated major seston composition shifts in
spring and a strong heterotroph component in summer.
Assay protocols were developed to measure a set of 5 digestive enzymes and water
soluble protein in individual copepods weighing between 5 and 35 µg dry mass. The
methods were applied to 5 abundant North Sea species. They differed in bulk
nutrient contents and stoichiometric ratio. The specific enzyme activities were high
and showed high individual variability.
In a short-term starvation experiment sublethal effects on digestive enzymes were
evaluated in A. clausi and A. tonsa. The resulting patterns were complex. Chitobiase
activity decreased in starved individuals of both species while the other enzymes
showed no change or even an activity increase (alanine aminopeptidase in A. clausi).
Results are discussed as a possible adaptation to a patchy food environment
(chapter 2). Protease isozyme patterns did not change as a result of short time
starvation. Instead, highly conserved species-specific patterns were revealed.
Genetic regulation of the enzyme equipment and the possible influence of the
digestive system on food selectivity are discussed (chapter 3).
A temporal study at Helgoland and a spatial study in the North Sea examined the
nutritional value of bulk seston for copepods. Food quantity was of minor importance
in influencing copepod reproduction, although, high concentrations of phytoplankton
supported highest egg production rates. Bulk seston quality as measured by C:N
ratio and the proportion of particulate organic phosphorus (POP) on total particulate
phosphorus (TPP) were significantly correlated to egg production of A. clausi and T.
longicornis. Grazing behaviour hinted to compensatory feeding at low specific food
concentrations in both species. Mineral uptake rates in March were high and rather
independent of phytoplankton concentration. The largest proportion of elements was
bound in the < 10 µm size class and copepods covered their mineral demand mainly
100

Chapter 7: Summary
by feeding on this smallest size class. Copepods took up seston N:P in ratios
matching their body ratios. Body specific N and P uptake did only rarely exceed a
ratio of 1:1 (µmol µmol-1 day-1) and then were only slightly higher. However, C uptake
reached values of up to 2.5:1 (µmol µmol-1 day-1). Ingested C:N and POP proportion
followed the seston signature. Therefore, with increasing seston quality (decreasing
C:N) the C:N imbalance decreased (chapter 4).
Stable isotope ratio analyses of carbon and nitrogen displayed that A. clausi and T.
longicornis were feeding on similar high trophic levels compared to seston, as
deduced from the δ15N signal, but they utilised different carbon sources within the
seston as displayed by δ13C. Over the year seston δ13C was inversely correlated to
egg production in A. clausi and T. longicornis, indicating that food sources containing
a lower proportion of heavy 13C isotope as encountered in spring are favourable for
copepods. The lowest δ13C values in T. longicornis coincided with highest δ15N
values. Chitobiase activity of T. longicornis was positively correlated to body C:N and
negatively to body δ13C, while arginine aminopeptidase, esterase/lipase and beta-
glucosidase were negatively correlated to body C:N and positively to body δ13C.
Therefore, the two enzyme types denote assimilation of C and N, respectively. A high
relative body N content indicates good fitness. A low body δ13C could stand for high
turnover rates of carbon (chapter 5).
Combining enzymatic with stable isotope and stoichiometric analyses in field studies
can explain processes on the zooplankton-phytoplankton interaction level far better
than using just one approach. The methods could be further refined by looking closer
at species-specific interactions between trophic community levels. Experimental
approaches should clarify the so far hypothetical link between seston stable isotope
parameters, digestive enzyme action and copepod condition (reproductive ability).
101

Chapter 8: Zusammenfassung
Chapter 8: ZusammenfassungMit dieser Arbeit sollten interne physiologische und externe Ernährungsfaktoren
identifiziert werden, die potentiell die Populationsdynamik dominanter
Copepodenarten in der Nordsee beeinflussen. Es wird gezeigt, dass Sestonqualität,
ausgedrückt als C:N:P Stöchiometrie, signifikant mit der Reproduktion von
Copepoden korrelierte. Fraßverhalten und Verdauungssystem interagierten bei der
Übertragung eines deutlichen Futterqualitätseffekts auf die Tiere, ihren
Ernährungszustand und ihre Fortpflanzungsfähigkeit. Die Futterqualität schwankte
deutlich in Raum und Zeit während der Probenkampagne für diese Studie in den
Jahren 2004 und 2005. Die Analyse der stabilen Isotopenverhältnisse zeigte, dass
sich im Frühling die Zusammensetzung des Sestons jeweils stark veränderte und
dass während des Sommers Heterotrophe dominierten.
Analyseprotokolle wurden entwickelt, mit denen 5 verschiedene Verdauungsenzyme
gleichzeitig oder wasserlösliche Proteine in einzelnen Copepoden gemessen werden
können, die nur 5-35 µm Trockenmasse wiegen. Die Methoden wurden dann auf 5
häufige Nordseearten angewendet. Die Copepoden unterschieden sich in
Nährstoffgehalten und stöchiometrischen Verhältnissen. Die spezifischen
Enzymaktivitäten zeigten hohe Aktivitäten und intra-spezifische Variabilität (Kapitel
2). Sublethale Effekte auf das Enzymsystem von A. clausi und A. tonsa wurden in
Kurzzeit-Hunger-Versuchen untersucht. Die Ergebnisse waren komplex: Die
Chitobiaseaktivität sank in gehungerten Individuen beider Arten, während die
anderen Enzyme keine Veränderungen zeigten oder eine erhöhte Aktivität aufwiesen
(Alanin-Aminopeptidase in A. clausi). Die Ergebnisse werden als Anpassung an eine
hoch-variable Umwelt diskutiert. Protease Isoenzym-Muster veränderten sich nicht
durch die Kurzzeit-Hunger-Situation. Es traten jedoch hoch-konservierte inter-
spezifische Muster zu Tage. Die genetische Regulierung der Enzymausstattung und
mögliche Einflüsse des Verdauungssystems auf Fraßselektivität werden diskutiert
(Kapitel 3).
Eine Zeitreihenstudie vor Helgoland und eine räumliche Studie in der Nordsee
untersuchte den Ernährungswert von Seston für Copepoden. Die Futterquantität
beeinflusste die Fortpflanzung kaum, obwohl hohe Konzentrationen an
Phytoplankton höchste Eiproduktionsraten unterstützen. Die Gesamtsestonqualität,
ausgedrückt als C:N Verhältnis und als Anteil von organischem Phosphor (POP) am
102

Chapter 8: Zusammenfassung
Gesamtphosphor (TPP), korrelierte signifikant mit der Eiproduktionsrate von A. clausi
und T. longicornis. Bei niedriger spezifischer Futterkonzentration wies das
Fraßverhalten auf kompensatorischen Fraß in beiden Arten hin. Die kleinste Seston-
Größenklasse, < 10 µm, enthielt die höchsten Konzentrationen an jeweiligen
Elementen, und Copepoden nutzten diese Größenklasse als Hauptfutterquelle.
Copepoden nahmen Seston N:P in Verhältnissen auf, die ihren Körperverhältnissen
entsprachen. Körpermineral-spezifische Aufnahmeraten für N und P überstiegen nur
selten und unwesentlich ein Verhältnis von 1:1 (µmol µmol-1 Tag-1). Jedoch ereichte
die C-Aufnahmerate Werte von bis zu 2.5:1 (µmol µmol-1 Tag-1). Das C:N-Verhältnis
und der POP-Anteil der aufgenommenen Nahrung entsprachen der Sestonsignatur.
Mit ansteigender Sestonqualität (niedrigerem C:N) verminderte sich das
Ungleichgewicht zwischen Körper-C:N und Seston C:N (Kapitlel 4).
Aus den δ15N-Signalen ging hervor, dass A. clausi und T. longicornis auf ähnlich
hohen trophischen Ebenen gegenüber dem Gesamtseston fraßen. Jedoch nutzten
sie unterschiedliche Kohlenstoffquellen innerhalb des Sestons, angezeigt durch die
δ13C-Signaturen. Über das Jahr war Seston δ13C invers mit der Eiproduktion von A.
clausi und T. longicornis korreliert, was darauf hinweist, dass Futterquellen mit
niedrigem Anteil an schwerem 13C, wie sie im Frühjahr auftreten, förderlich für
Copepoden sind. Die niedrigsten δ13C-Werte in T. longicornis traten zusammen mit
den höchsten δ15N-Werten auf. Die Chitobiaseaktivtiät von T. longicornis war positiv
korreliert mit dem Körper C:N-Verhältnis und negativ mit dem Körper δ13C, während
Arginin-Aminopeptidase, Esterase/Lipase und Beta-Glucosidase positiv mit dem
Körper C:N-Verhältnis und negativ mit dem δ13C-Wert korreliert waren. Beide
Enzymtypen weisen damit auf eine Funktion in der C- bzw. N-Assimilation hin. Ein
hoher relativer Körper-N-Gehalt zeigt eine gute Fitness der Copepoden an. Hohe
Umsatzraten könnten das niedrige Körper δ13C Verhältnis erklären (Kapitel 5).
Die Kombination von enzymatischen mit stabilen Isotopen und stöchiometrischen
Analysen in Feldstudien kann Interaktionsprozesse auf der Zooplankton-
Phytoplankton-Ebene besser erklären als nur einer der Analysentypen. Die Methodik
könnte verfeinert werden, um noch mehr auf die artspezifischen Interaktionen
zwischen trophischen Gemeinschaftsebenen einzugehen. Experimentelle
Folgestudien sollten belegen, dass die bislang hypothetische Verbindung zwischen
stabilen Isotopen, Verdauungsenzymen und Copepodenfitness
(Fortpflanzungsfähigkeit) Bestand hat.
103
Chapter 9: References
Chapter 9: ReferencesAcharya K, Kyle M, Elser JJ (2004) Effects of stoichiometric dietary mixing on Daphnia growth.
Oecologia 138: 333-340Adams TS, Sterner RW (2000) The effect of dietary nitrogen content on trophic level 15N enrichment.
Limnol Oceanogr 45: 601-607Albaina A, Irigoien X (2004) Relationships between frontal structures and zooplankton communities
along a cross-shelf transect in the Bay of Biscay (1995 to 2003). Mar Ecol Prog Ser 284: 65-75
Alonzo, F., Mayzaud, P., Razoul, S. (2000) Egg production, population structure and biochemical composition of the subantarctic copepod Paraeuchaeta antarctica in the Kerguelen Archipelago. Mar Ecol Prog Ser 205: 207-217.
Ambler JW (1986) Effect of food quantity and quality on egg production of Acartia tonsa Dana from East Lagoon, Galveston, Texas. Estuar Coast Shelf Sci 23: 183-196
Anderson TR, Boersma M, Raubenheimer D (2004) Stoichiometry: linking elements to biochemicals. Ecology 85: 1193-1202
Anderson TR, Hessen DO (1995) Carbon or nitrogen limitation in marine copepods? J Plankton Res 17: 317-331
Anderson TR, Pond DW (2000) Stoichiometric theory extended to micronutrients: comparison of the roles of essential fatty acids, carbon, and nitrogen in the nutrition of marine copepods. Limnol Oceanogr 45: 1162-1167
Arendt KE, Jónasdóttir SH, Hansen PJ, Gärtner S (2005) Effects of dietary fatty acids on the reproductive success of the calanoid copepod Temora longicornis. Mar Biol 146: 513-530
Arnaud J, Brunet M, Mazza J (1978) Studies on the midgut of Centropages typicus (copepod, calanoid). I. Structural and ultrastructural data. Cell Tissue Res 187: 333-353
Arnaud, J., Brunet, M., Mazza, J. (1980) Comparative structure and ultrastructure of the midgut in several species of calanoid copepods. Zoomorphologie 95: 213-233.
Aspila KI, Agemian H, Chau ASY (1976) A semi-automatic method for the determination of inorganic, organic and total phosphate in sediments. The Analyst 101: 187-197
Augustin CB, Boersma M (2006) Effects of nitrogen stressed algae on different Acartia species. J Plankton Res 28: 429-436
Baars MA, Oosterhuis SS (1984) Diurnal feeding rhythms in North Sea copepods measured by gut fluorescence, digestive enzyme activity and grazing on labelled food. Neth J Sea Res 18: 97-119
Ban S, Burns C, Castel J, Chaudron Y, Christou E, Escribano R, Umani SF, Gasparini S, Ruiz FG, Hoffmeyer M, Ianora A, Kang H-K, Laabir M, Lacoste A, Miralto A, Ning X, Poulet S, Rodriguez V, Runge J, Shi J, Starr M, Uye S-i, Wang Y (1997) The paradox of diatom-copepod interactions. Mar Ecol Prog Ser 157: 287-293
Barnard R, Batten SD, Beaugrand G, Buckland C, Conway DVP, Edwards M, Finlayson J, Gregory LW, Halliday NC, John AWG, Johns DG, Johnson AD, Jonas TD, Lindley JA, Nyman J, Pritchard P, Reid PC, Richardson AJ, Saxby RE, Sidey J, Smith MA, Stevens DP, Taylor CM, Tranter PRG, Walne AW, Wootton M, Wotton COM, Wright JC (2004) Continuous Plankton Records: Plankton Atlas of the North Atlantic Ocean (1958–1999). II. Biogeographical charts. Mar Ecol Prog Ser Suppl: 11-75
Barnes, H. Blackstock, J. (1973) Estimation of lipids in marine animals and tissues: detailed investigation of the sulphophosphovanillin method for total lipids. J Exp Biol Ecol 12: 103-118.
Bautista B, Harris RP, Rodriguez V, Guerrero F (1994) Temporal variability in copepod fecundity during two different spring bloom periods in coastal waters off Plymouth (SW England). J Plankton Res 16: 1367-1377
Beardsley C, Pernthaler J, Wosniok W, Amann R (2003) Are readily culturable bacteria in Coastal North Sea waters suppressed by selective grazing mortality? Appl Environ Microbiol 69: 2624-2630
Beaugrand G (2004) Continuous Plankton Records: Plankton Atlas of the North Atlantic Ocean (1958–1999). I. Introduction and methodology. Mar Ecol Prog Ser Suppl: 3-10
Beaugrand G, Brander KM, Lindley JA, Souissi S, Reid PC (2003) Plankton effect on cod recruitment in the North Sea. Nature 426: 661-664
Berdalet E, Marrasé C, Estrada M, Arin L, MacLean ML (1996) Microbial community responses to nitrogen- and phosphorus-deficient nutrient inputs: microplankton dynamics and biochemical characterization. J Plankton Res 18: 1627-1641
104
Chapter 9: References
Billen G, Joiris C, Meyer-Reil L, Linderboom H (1990) Role of bacteria in the North Sea ecosystem. Neth J Sea Res 26: 265-293
Bochdansky AB, Puskaric S, Herndl GJ (1995) Influence of zooplankton grazing on free dissolved enzymes in the sea. Mar Ecol Prog Ser 121: 53-63
Boersma M (2000) The nutritional quality of P-limited algae for Daphnia. Limnol Oceanogr 45: 1157-1161
Boersma M, Kreutzer C (2002) Life at the edge: is food quality really of minor importance at low quantities? Ecology 83: 2552-2561
Bonnet D, Carlotti F (2001) Development and egg production in Centropages typicus (Copepoda: Calanoida) fed different food types: a laboratory study. Mar Ecol Prog Ser 224: 133-148
Boucher, J. Samain, J. F. (1974) L 'activité amylasique indice de la nutrition du zooplancton; mise en evidence d'un rythme quotidien en zone d'upwelling. Tethys 6: 179-188
Bouillon S, Mohan PC, Sreenivas N, Dehairs F (2000) Sources of suspended organic matter and selective feeding by zooplankton in an estuarine mangrove ecosystem as traced by stable isotopes. Mar Ecol Prog Ser 208: 79-92
Brockmann UH, Laane RWPM, Postma H (1990) Cycling of nutrient elements in the North Sea. Neth J Sea Res 26: 239-264
Brunet, M., Arnaud, J., Mazza, J. (1994) Gut structure and digestive cellular processes in marine Crustacea. Oceanogr. Mar. Biol. Annu. Rev. 32: 335-367
Bundy MH, Gross TF, Vanderploeg HA, Strickler JR (1998) Perception of inert particles by calanoid copepods: behavioral observations and a numerical model. J Plankton Res 20: 2129-2152
Bundy MH, Paffenhöfer GA (1993) Innervation of copepod antennules investigated using laser scanning confocal microscopy. Mar Ecol Prog Ser 102: 1-14
Bunker AJ, Hirst AG (2004) Fecundity of marine planktonic copepods: global rates and patterns in relation to chlorophyll a, temperature and body weight. Mar Ecol Prog Ser 279: 161-181
Båmstedt, U. (1975) Studies on the deep-water pelagic community of Korsfjorden, Western Norway – Ecological aspects of individual variations in weight and protein and lipid content of Euchaeta norvegica. Sarsia 59: 31-46
Båmstedt, U. (1986) Chemical composition and energy content. In: Corner, E. D. S. and O'Hara, S. C. M., (Eds), The biological chemistry of marine copepods. Clarendon Press, Oxford, pp. 1-58.
Båmstedt, U. (1988) Ecological significance of individual variability in copepod bioenergetics. Hydrobiol 167/168, 43-59.
Cahu CL, Zambonino Infante JL, Péres A, Quazuguel P, Le Gall MM (1998) Algal addition in sea bass (Dicentrarchus labrax) larvae rearing: effect on digestive enzymes. Aquaculture 161: 479-489
Campbell RW, Head EJ (2000) Egg production rates of Calanus finmarchicus in the western North Atlantic: effect of gonad maturity, female size, chlorophyll concentration, and temperature. Can J Fish Aquat Sci/J Can Sci Halieut Aquat 57: 518-529
Castro-Longoria E (2003) Egg production and hatching success of four Acartia species under different temperature and salinity regimes. J Crust Biol 23: 289-299
Chan AS, Horn MH, Dickson KA, Gawlicka A (2004) Digestive enzyme activities in carnivores and herbivores: comparisons among four closely related prickleback fishes (Teleostei: Stichaeidae) from a California rocky intertidal habitat. J Fish Biol 65: 848-858
Checkley DM, Jr. (1980a) The egg production of a marine planktonic copepod in relation to its food supply: laboratory studies. Limnol Oceanogr 25: 430-446
Checkley DM, Jr. (1980b) Food limitation of egg production by a marine, planktonic copepod in the sea off southern California. Limnol Oceanogr 25: 991-998
Chervin MB (1978) Assimilation of particulate organic carbon by estuarine and coastal copepods. Mar Biol 49: 265-275
Colin SP, Dam HG (2002) Testing for toxic effects of prey on zooplankton using sole versus mixed diets. Limnol Oceanogr 47: 1430-1437
Cordova-Murueta JH, García-Carreño FL, Navarrete-del-Toro MdlA (2003) Digestive enzymes present in crustacean feces as a tool for biochemical, physiological, and ecological studies. J Exp Mar Biol Ecol 297: 43-56
Cowles TJ, Olson RJ, Chisholm SW (1988) Food selection by copepods: discrimination on the basis of food quality. Mar Biol 100: 41-49
Cushing DH (1990) Plankton production and year-class strength in fish populations: an update of the match/mismatch hypothesis. Adv Mar Biol 26: 249-292
Cyr H, Curtis JM (1999) Zooplankton community size structure and taxonomic composition affects size-selective grazing in natural communities. Oecologia 118: 306-315
Dagg M (1977) Some effects of patchy food environments on copepods. Limnol Oceanogr 22: 99-107Dalsgaard J, St. John M, Kattner G, Müller-Navarra DC, Hagen W (2003) Fatty acid trophic markers in
the pelagic marine environment. Adv Mar Biol 45: 225-340
105

Chapter 9: References
Darchambeau F (2005) Filtration and digestion responses of an elementally homeostatic consumer to changes in food quality: a predictive model. Oikos 111: 322-336
DeMott WR (1986) The role of taste in food selection by freshwater zooplankton. Oecologia 69: 334-340
DeMott WR (1988) Discrimination between algae and detritus by freshwater and marine zooplankton. Bull Mar Sci 43: 486-499
DeMott WR (1989) Optimal foraging theory as a predictor of chemically mediated food selection by suspension-feeding copepods. Limnol Oceanogr 34: 140-154
DeMott WR, Watson MD (1991) Remote detection of algae by copepods: responses to algal size, odors and motility. J Plankton Res 13: 1203-1222
Devreker D, Souissi S, Seuront L (2005) Effects of chlorophyll concentration and temperature variation on the reproduction and survival of Temora longicornis (Copepoda, Calanoida) in the Eastern English Channel. J Exp Mar Biol Ecol 318: 145-162
Donaghay PL (1988) Role of temporal scales of acclimation, food quality and trophic dominance in controlling the evolution of copepod feeding behavior. Bull Mar Sci 43: 469-485
Donaghay PL, Small LF (1979) Food selection capabilities of the estuarine copepod Acartia clausi. Mar Biol 52: 137-146
Downing JA, Osenberg CG, Sarnelle O (1999) Meta-analysis of marine nutrient-enrichment experiments: variation in the magnitutde of nutrient limitation. Ecology 80: 1157-1167
Dutz J (1998) Repression of fecundity in the neritic copepod Acartia clausi exposed to the toxic dinoflagellate Alexandrium lusitanicum: relationship between feeding and egg production. Mar Ecol Prog Ser 175: 97-107
Dutz J, Klein Breteler WCM, Kramer G (2005) Inhibition of copepod feeding by exudates and transparent exopolymer particles (TEP) derived from a Phaeocystis globosa dominated phytoplankton community. Harmful Algae 4: 929-940
Ederington MC, McManus GB, Harvey HR (1995) Trophic transfer of fatty acids, sterols, and a triterpenoid alcohol between bacteria, a ciliate, and the copepod Acartia tonsa. Limnol Oceanogr 40: 860-867
Edwards M, Richardson AJ (2004) Impact of climate change on marine pelagic phenology and trophic mismatch. Nature 430: 881-884
Einsle UK (1988) Taxonomy of the genus Megacyclops (Crustacea, Copepoda): Morphometry and the use of enzyme electrophoresis Hydrobiologia 167-168: 387-391
Elser JJ, Hassett RP (1994) A stoichiometric analysis of the zooplankton-phytoplankton interaction in marine and freshwater ecosystems. Nature 370: 211-213
Estep KW, Nejstgaard JC, Skjoldal HR, Rey F (1990) Predation by copepods upon natural populations of Phaeocystis pouchetii as a function of the physiological state of the prey. Mar Ecol Prog Ser 67: 235-249
Evjemo, J. O., Reitan, K. I., Olsen, Y. (2003) Copepods as live food organisms in the larval rearing of halibut larvae (Hippoglossus hippoglossus L.) with special emphasis on the nutritional value. Aquaculture 227: 1-4
Fehling J, Davidson K, Bolch CJ, Bates SS (2004) Growth and domoic acid production by Pseudo-nitzschia seriata (Bacillariophyceae) under phosphate and silicate limitation. J Phycol 40: 674-683
Fock HO, Greve W (2002) Analysis and interpretation of recurrent spatio-temporal patterns in zooplankton dynamics: a case study on Noctiluca scintillans (Dinophyceae) in the German Bight (North Sea). Mar Biol 140: 59-73
Fogg GE (1995) Some comments on picoplankton and its importance in the pelagic ecosystem. Aquat Microb Ecol 9: 33-39
Frangópulos M, Guisande C, DeBlas E, Maneiro I (2004) Toxin production and competitive abilities under phosphorus limitation of Alexandrium species. Harmful Algae 3: 131-139
Franke HD, Buchholz F, Wiltshire KH (2004) Ecological long-term research at Helgoland (German Bight, North Sea): retrospect and prospect - an introduction. Helgol Mar Res 58: 223-229
Fransz HG, Colebrook JM, Gamble JC, Krause M (1991) The zooplankton of the North Sea. Neth J Sea Res 28: 1-52
Frost PC, Evans-White MA, Finkel ZV, Jensen TC, Matzek V (2005) Are you what you eat? Physiological constraints on organismal stoichiometry in an elementally imbalanced world. Oikos 109: 18-28
Fry B, Anderson RK, Entzeroth L, Bird JL, Parker PL (1984) 13C enrichment and oceanic food web structure in the northwestern Gulf of Mexico. Contrib Mar Sci 27: 49-63
Fry B, Wainright SC (1991) Diatom sources of 13C-rich carbon in marine food webs. Mar Ecol Prog Ser 76: 149-157
106

Chapter 9: References
Fukami K, Watanabe A, Fujita S, Yamaoka K, Nishijima T (1999) Predation on naked protozoan microzooplankton by fish larvae. Mar Ecol Prog Ser 185: 285-291
García-Carreño FL, Dimes LE, Haard NF (1993) Substrate-gel electrophoresis for composition and molecular weight of proteinases or proteinaceous proteinase inhibitors. Anal Biochem 214: 65-69
Gasparini S, Daro MH, Antajan E, Tackx M, Rousseau V, Parent JY, Lancelot C (2000) Mesozooplankton grazing during the Phaeocystis globosa bloom in the southern bight of the North Sea. J Sea Res 43: 345-356
Gatten, R. R., Sargent, J. R., Forsberg, T. E. V., O'Hara, S. C. M., Corner, E. D. S. (1980) On the nutrition and metabolism of zooplankton. XIV. Utilization of lipid by Calanus helgolandicus during maturation and reproduction. J Mar Biol Assoc UK 60: 391-399
Geider RJ (1987) Ligth and temperature depenence of the carbon to chlorophyll a ratio in microalgae and cyanobacteria: implications for physiology and growth of phytoplankton. New Phytologist 106: 1-34
Geider RJ, La Roche J (2002) Redfield revisited: variability of C:N:P in marine microalgae and its biochemical basis. Eur J Phycol 37: 1-17
Gerdts G, Wichels A, Döpke H, Klings K-W, Gunkel W, Schütt C (2004) 40-year long-term study of microbial parameters near Helgoland (German Bight, North Sea): historical view and future perspectives. Helgol Mar Res 58: 230-242
Gervais F, Riebesell U (2001) Effect of phosphorus limitation on elemental composition and stable carbon isotope fractionation in a marine diatom growing under different CO2 concentrations. Limnol Oceanogr 46: 497-504
Gismervik I (2006) Top-down impact by copepods on ciliate numbers and persistence depends on copepod and ciliate species composition. J Plankton Res 28: 499-507
Gowen R, McCullough G, Kleppel G, Houchin L, Elliott P (1999) Are copepods important grazers of the spring phytoplankton bloom in the western Irish Sea? J Plankton Res 21: 465-483
Granéli E, Johansson N (2003) Effects of the toxic haptophyte Prymnesium parvum on the survival and feeding of a ciliate: The influence of different nutrient conditions. Mar Ecol Prog Ser 254: 49-56
Granum E, Krikvold S, Myklestad SM (2002) Cellular and extracellular production of carbohydrates and amino acids by the marine diatom Skeletonema costatum: diel variations and effects of N depletion. Mar Ecol Prog Ser 242: 83-94
Grasshoff K, Erhardt M, Kremling K (1983) Methods of seawater analysis. Verlag Chemie, WeinheimGreve W (1994) The 1989 German Bight invasion of Muggiaea atlantica. ICES J Mar Sci 51: 355-358Greve W, Reiners F, Nast J, Hoffmann S (2004) Helgoland Roads meso- and macrozooplankton time-
series 1974 to 2004: lessons from 30 years of single spot, high frequency sampling at the only off-shore island of the North Sea. Helgol Mar Res 58: 274-288
Guarna MM, Borowsky RL (1993) Genetically controlled food preference: biochemical mechanisms. Proc Natl Acad Sci USA 90: 5257-5261
Guérin J-P, Kerambrun P (1982) Effects of diet on esterases, alkaline phosphatase, malate dehydrogenase and phosphoglucomutase activity observed by polyacrylamide gel electrophoresis in Tisbe holothuriae (harpacticoid copepod). Comp Biochem Physiol B 73: 761-770
Guerrini F, Mazzotti A, Boni L, Pistocchi R (1998) Bacterial-algal interactions in polysaccharide production. Aquat Microb Ecol 15: 247-253
Guildford SJ, Hecky RE (2000) Total nitrogen, total phosphorus, and nutrient limitation in lakes and oceans: Is there a common relationship? Limnol Oceanogr 45: 1213-1223
Guillard RRL (1975) Culture of phytoplankton for feeding marine invertebrates. In: Smith WL, Chanley MH (eds) Culture of marine invertebrate animals. Plenum Press, New York
Guillard RRL, Ryther JH (1962) Studies of marine planktonic diatoms. I. Cyclotella nana Hustedt and Detonula confervacea Cleve. Can J Microbiol 8: 229-239
Guisande C, Maneiro I, Riveiro I, Barreiro A, Pazos Y (2002) Estimation of copepod trophic niche in the field using amino acids and marker pigments. Mar Ecol Prog Ser 239: 147-156
Guisande C, Riveiro I, Maneiro I (2000) Comparisons among the amino acid composition of females, eggs and food to determine the relative importance of food quantity and food quality to copepod reproduction. Mar Ecol Prog Ser 202: 135-142
Hallberg E, Hirche H-J (1980) Differentiation of mid-gut in adults and over-wintering copepodids of Calanus finmarchicus (Gunnerus) and C. helgolandicus Claus. J Exp Mar Biol Ecol 48: 283-295
Han X, Wang R, Wang J (2002) Digestive gut structure and activity of protease, amylase, and alkaline phosphatase in Calanus sinicus during summer in the Yellow Sea and the East China Sea. J Exp Mar Biol Ecol 270: 131-146
107

Chapter 9: References
Halsband-Lenk C, Carlotti F, Greve W (2004) Life-history strategies of calanoid congeners under two different climate regimes: a comparison. ICES J Mar Sci 61: 709-720
Halsband-Lenk C, Hirche HJ, Carlotti F (2002) Temperature impact on reproduction and development of congener copepod populations. J Exp Mar Biol Ecol 271: 121-153
Halsband C, Hirche HJ (2001) Reproductive cycles of dominant calanoid copepods in the North Sea. Mar Ecol Prog Ser 209: 219-229
Hansen BW, Bjørnsen PK, Hansen PJ (1994) The size ratio between planktonic predators and their prey. Limnol Oceanogr 39: 395-403
Hansen FC (1995) Trophic interactions between zooplankton and Phaeocystis cf. globosa. Helgoländer Meeresunters 49: 283-293
Harris RP, Samain JF, Moal J, Martin-Jezequel V, Poulet SA (1986) Effects of algal diet on digestive enzyme activity in Calanus helgolandicus. Mar Biol 90: 353-361
Hassett RP (2004) Supplementation of a diatom diet with cholesterol can enhance copepod egg-production rates. Limnol Oceanogr 49: 488-494
Hassett RP, Blades-Eckelbarger P (1995) Diel changes in gut-cell morphology and digestive activity of the marine copepod Acartia tonsa. Mar Biol 124: 59-69
Hassett RP, Cardinale B, Stabler LB, Elser JJ (1997) Ecological stoichiometry of N and P in pelagic ecosystems: Comparison of lakes and oceans with emphasis on the zooplankton-phytoplankton interaction. Limnol Oceanogr 42: 648-662
Hassett RP, Landry MR (1983) Effects of food-level acclimation on digestive enzyme activities and feeding behavior of Calanus pacificus. Mar Biol 75: 47-55
Hassett RP, Landry MR (1988) Short-term changes in feeding and digestion by the copepod Calanus pacificus. Mar Biol 99: 63-74
Hassett RP, Landry MR (1990) Effects of diet and starvation on digestive enzyme activity and feeding behavior of the marine copepod Calanus pacificus. J Plankton Res 12: 991-1010
Hays GC, Richardson AJ, Robinson C (2005) Climate change and marine plankton. Trends Ecol Evol 20: 337-344
Head EJH, Wang R, Conover RJ (1984) Comparison of diurnal feeding rhythms in Temora longicornis and Centropages hamatus with digestive enzyme activity. J Plankton Res 6: 543-551
Helland S, Terjesen BF, Berg L (2003) Free amino acid and protein content in the planktonic copepod Temora longicornis compared to Artemia franciscana. Aquaculture 215: 213-228
Hessen DO, Færøvig PJ, Andersen T (2002) Light, nutrients, and P:C ratios in algae: grazer performance related to food quality and quantity. Ecology 83: 1886-1898
Hidalgo, M. C., Urea, E., Sanz, A. (1999)Comparative study of digestive enzymes in fish with different nutritional habits. Proteolytic and amylase activities. Aquaculture 170: 267-283
Hillebrand H, Dürselen C-D, Kirschtel D, Pollingher U, Zohary T (1999) Biovolume calculation for pelagic and benthic microalgae. J Phycol 35: 403-424
Hirche HJ (1981) Digestive enzymes of copepodids and adults of Calanus finmarchicus and C. helgolandicus in relation to particulate matter. Kiel Meeresforsch 5: 174-185
Hirche HJ (1996) Diapause in the marine copepod, Calanus finmarchicus - a review. Ophelia 44: 129-143
Hirche HJ, Meyer U, Niehoff B (1997) Egg production of Calanus finmarchicus: effect of temperature, food and season. Mar Biol 127: 609-620
Hirst AG, Bunker AJ (2003) Growth of marine planktonic copepods: Global rates and patterns in relation to chlorophyll a, temperature, and body weight. Limnol Oceanogr 48: 1988-2010
Holste L, Peck M (2006) The effects of temperature and salinity on egg production and hatching success of Baltic Acartia tonsa (Copepoda: Calanoida): a laboratory investigation. Mar Biol 148: 1061-1070
Hoppe, H. G. (1983) Significance of exoenzymatic activities in the ecology of brackish water: Measurements by means of methylumbelliferyl-substrates. Mar Ecol Progr Ser 11: 299-308
Hoppenrath M (2004) A revised checklist of planktonic diatoms and dinoflagellates from Helgoland (North Sea, German Bight). Helgol Mar Res 58: 243-251
Hwang JS, Costello JH, Strickler JR (1994) Copepod grazing in turbulent flow: elevated foraging behavior and habituation of escape responses. J Plankton Res 16: 421-431
Hwang JS, Strickler R (2001) Can copepods differentiate prey from predator hydromechanically? Zool Stud 40: 1-6
Ianora A, Miralto A, Poulet SA, Carotenuto Y, Buttino I, Romano G, Casotti R, Pohnert G, Wichard T, Colucci-D'Amato L, Terrazzano G, Smetacek V (2004) Aldehyde suppression of copepod recruitment in blooms of a ubiquitous planktonic diatom. Nature 429: 403-407
108
Chapter 9: References
Irigoien X, Harris RP, Verheye HM, Joly P, Runge J, Starr M, Pond D, Campbell R, Shreeve R, Ward P, Smith AN, Dam HG, Peterson W, Davidson R, et al. (2002) Copepod hatching success in marine ecosystems with high diatom concentrations. Nature 419: 387-389
Johansson N, Granéli E (1999) Cell density, chemical composition and toxicity of Chrysochromulina polylepis (Haptophyta) in relation to different N:P supply ratios. Mar Biol 135: 209-217
John EH, Flynn KJ (2000) Growth dynamics and toxicity of Alexandrium fundyense (Dinophyceae): the effect of changing N:P supply ratios on internal toxin and nutrient levels. Eur J Phycol 35: 11-23
Johnston DJ (2003) Ontogenetic changes in digestive enzyme activity of the spiny lobster, Jasus edwardsii (Decapoda; Palinuridae). Mar Biol 143: 1071-1082
Johnston, D. and Freeman, J. (2005) Dietary preference and digestive enzyme activities as indicators of trophic resource utilization by six species of crab. Biol Bull Mar Biol Lab Woods Hole 208, 36-46.
Jónasdóttir SH (1994) Effects of food quality on the reproductive success of Acartia tonsa and Acartia hudsonica: laboratory observations. Mar Biol 121: 67-81
Jónasdóttir SH, Fields D, Pantoja S (1995) Copepod egg production in Long Island Sound, USA, as a function of the chemical composition of seston. Mar Ecol Prog Ser 119: 87-98
Jones DA, Kumlu M, Le Vay L, Fletcher DJ (1997) The digestive physiology of herbivorous, omnivorous and carnivorous crustacean larvae: a review. Aquaculture 155: 289-299
Jones RH, Flynn KJ (2005) Nutritional status and diet composition affect the value of diatoms as copepod prey. Science 307: 1457-1459
Kang H-K, Poulet SA (2000) Reproductive success in Calanus helgolandicus as a function of diet and egg cannibalism. Mar Ecol Prog Ser 201: 241-250
Katechakis A, Stibor H, Sommer U, Hansen T (2002) Changes in the phytoplankton community and microbial food web of Blanes Bay (Catalan Sea, NW Mediterranean) under prolonged grazing pressure by doliolids (Tunicata), cladocerans or copepods (Crustacea). Mar Ecol Prog Ser 234: 55-69
Kattner G, Krause M (1989) Seasonal variations of lipids (wax esters, fatty acids and alcohols) in calanoid copepods from the North Sea. Mar Chem 26: 261-275
Kattner G, Krause M, Trahms J (1981) Lipid composition of some typical North Sea copepods. Mar Ecol Prog Ser 4: 69-74.
Kerambrun P, Champalbert G (1975) Analyse électrophorétique en gel de polyacrylamide des protéines d'Anomalocera patersoni (Copépode Pontellidé) et mise en évidence des activités estérasique. Elements d'un dimorphisme sexuel biochimique. C R Hebd Séances Acad Sci Paris 281: 1019-1022
Kerambrun P, Champalbert G (1993) Evidence for a dial rhythm of digestive enzyme activity in the neustonic copepod Anomalocera patersoni: relation with population densities. Biochem Syst Ecol 21: 575-582
Kilham SS, Kreeger DA, Goulden CE, Lynn SG (1997) Effects of nutrient limitation on biochemical constituents of Ankistrodesmus falcatus. Freshwat Biol 38: 591-596
Kiørboe T, Møhlenberg F, Nicolajsen H (1982) Ingestion rate and gut clearance in the planktonic copepod Centropages hamatus (Lilljeborg) in relation to food concentration and temperature. Ophelia 21: 181-194
Kiørboe T, Sabatini M (1995) Scaling of fecundity, growth and development in marine planktonic copepods. Mar Ecol Prog Ser 120: 285-298
Kiørboe T, Saiz E (1995) Planktivorous feeding in calm and turbulent environments, with emphasis on copepods. Mar Ecol Prog Ser 122: 135-145
Kiørboe T, Saiz E, Viitasalo M (1996) Prey switching behaviour in the planktonic copepod Acartia tonsa. Mar Ecol Prog Ser 143: 65-75
Kiørboe T, Saiz E, Visser A (1999) Hydrodynamic signal perception in the copepod Acartia tonsa. Mar Ecol Prog Ser 179: 97-111
Kiørboe T, Visser AW (1999) Predator and prey perception in copepods due to hydromechanical signals. Mar Ecol Prog Ser 179: 81-95
Klausmeier CA, Litchman E, Daufresne T, Levin SA (2004) Optimal nitrogen-to-phosphorus stoichiometry of phytoplankton. Nature 429: 171-174
Klein Breteler W, Koski M (2003) Development and grazing of Temora longicornis (Copepoda, Calanoida) nauplii during nutrient limited Phaeocystis globosa blooms in mesocosms. Hydrobiologia 491: 185-192
Klein Breteler WCM (1980) Continuous breeding of marine pelagic copepods in the presence of heterotrophic dinoflagellates. Mar Ecol Prog Ser 2: 229-233
109
Chapter 9: References
Klein Breteler WCM, Gonzalez SR (1988) Influence of temperature and food concentration on body size, weight and lipid content of two Calanoid copepod species. Hydrobiologia 167-168: 201-210
Klein Breteler, W. C. M., H. G. Fransz, and S. R. Gonzalez (1982) Growth and development of four calanoid copepod species under experimental and natural conditions. Neth J Sea Res 16:195-207
Klein Breteler WCM, Grice K, Schouten S, Kloosterhuis HT, Damste JSS (2002) Stable carbon isotope fractionation in the marine copepod Temora longicornis: Unexpectedly low δ13C value of faecal pellets. Mar Ecol Prog Ser 240: 195-204
Klein Breteler WCM, Schogt N, Baas M, Schouten S, Kraay GW (1999) Trophic upgrading of food quality by protozoans enhancing copepod growth: role of essential lipids. Mar Biol 135: 191-198
Klein Breteler WCM, Schogt N, Rampen S (2005) Effect of diatom nutrient limitation on copepod development: role of essential lipids. Mar Ecol Prog Ser 291: 125-133
Kleppel GS (1993) On the diets of calanoid copepods. Mar Ecol Prog Ser 99: 183-195Kleppel GS, Burkart CA (1995) Egg production and the nutritional environment of Acartia tonsa: the
role of food quality in copepod nutrition. ICES J Mar Sci 52: 297-304Kleppel GS, Burkart CA, Houchin L (1998) Nutrition and the regulation of egg production in the
calanoid copepod Acartia tonsa. Limnol Oceanogr 43: 1000-1007Koski M (1999) Carbon:nitrogen ratios of Baltic Sea copepods - indication of mineral limitation? J
Plankton Res 21: 1565-1573Koski M, Dutz J, Breteler W (2005) Selective grazing of Temora longicornis in different stages of a
Phaeocystis globosa bloom - a mesocosm study. Harmful Algae 4: 915-927Koski M, Breteler WK, Schogt N (1998) Effect of food quality on rate of growth and development of the
pelagic copepod Pseudocalanus elongatus (Copepoda, Calanoida). Mar Ecol Prog Ser 170: 169-187
Koski M, Klein Breteler WCM (2003) Influence of diet on copepod survival in the laboratory. Mar Ecol Progr Ser 264: 73-82
Koski M, Kuosa H (1999) Short communication. The effect of temperature, food concentration and female size on the egg production of the planktonic copepod Acartia bifilosa. J Plankton Res 21: 1779-1789
Kouwenberg, J. H. M., 1993. Sex ratio of calanoid copepods in relation to population composition in the Northwestern Mediterranean. Crustaceana 64, 281-299.
Krause G, Budeus G, Gerdes D, Schaumann K, Hesse K (1986) Frontal systems in the German Bight and their physical and biological effects. In: Nihoul JCJ (ed) Marine Interfaces Ecohydrodnynamics, pp 119-140
Krause M (1995) A review of hydrographic controls on the distribution of zooplankton biomass and species in the North Sea with particular reference to a survey conducted in January-March 1987. Prog Oceanogr 35: 81-152
Krause M, Radach G (1980) On the succession of developmental stages of herbivorous zooplankton in the northern North Sea during FLEX '76. 1. First statements about the main groups of the zooplankton community. Meteor Forschungsergeb A Phys. Chem. Meeres 133-149
Krylov PI, Alekseev VR, Frenkel OA (1996) Feeding and digestive activity of cyclopoid copepods in active diapause. Hydrobiologia 320: 71-79
Kumlu M (1997) The effect of feed types on survival and trypsin activity in Temora longicornis (Crustacea:Copepoda). Isr J Aquacult/Bamidgeh 49: 199-204
Laakmann S (2004) Abundanz und Reproduktionserfolg ausgewählter calanoider Copepoden während der Frühjahrsplanktonblüte um Helgoland. Masters Thesis, Bremen
Laemmli UK (1970) Cleavage of structural proteins during the assembly of the head of bacteriophage T4. Nature 227: 680-685
Landry MR, Hassett RP (1985) Time scales in behavioral, biochemical, and energetic adaptations to food-limiting conditions by a marine copepod. Arch Hydrobiol Beih Ergeb Limnol/Adv Limnol 21: 209-221
Leboulanger C, Descolas-Gros C, Fontugne MR, Bentaleb I, Jupin H (1995) Interspecific variability and environmental influence on particulate organic carbon delta 13C in cultured marine phytoplankton. J Plankton Res 17: 2079-2091
Lee RF, Hagen W, Kattner G (2006) Lipid storage in marine zooplankton. Mar Ecol Prog Ser 307: 273-306
Legrand C, Rengefors K, Fistarol GO, Granéli E (2003) Allelopathy in phytoplankton - biochemical, ecological and evolutionary aspects. Phycologia 42: 406-419
110

Chapter 9: References
Lester LJ, Cook JP (1987) Ontogenic changes in isozyme patterns of Penaeus species. Comp Biochem Physiol B 86: 253-258
Le Vay, L., Jones, D. A., Puello-Cruz, A. C., Sangha, R. S., Ngamphongsai, C. (2001) Digestion in relation to feeding strategies exhibited by crustacean larvae. Comp Biochem Physiol A 128: 621-628
Libourel-Houde SE, Roman MR (1987) Effects of food quality on the functional ingestion response of the copepod Acartia tonsa. Mar Ecol Progr Ser 40: 60-77
Lindley JA (1982) Continuous plankton records: Geographical variations in numerical abundance, biomass and production of euphausiids in the North Atlantic Ocean and the North Sea. Mar Biol 71: 7-10
Long JD, Hay ME (2006) When intraspecific exceeds interspecific variance: effects of phytoplankton morphology and growth phase on copepod feeding and fitness. Limnol Oceanogr 51: 988-996
Lonsdale DJ, Hassett RP, Dobbs FC, Yen J (1998) Physiological traits associated with a reproductive-resting stage in Coullana canadensis (Copepoda: Harpacticoida). Mar Biol 131: 123-131
Maar M, Nielsen TG, Richardson K, Christaki U, Hansen OS, Zervoudaki S, Christou ED (2002) Spatial and temporal variability of food web structure during the spring bloom in the Skagerrak. Mar Ecol Prog Ser 239: 11-29
Maguer J-F, L'Helguen S, Le Corre P (2000) Nitrogen uptake by phytoplankton in a shallow water tidal front. Estuar Coast Shelf Sci 51: 349-357
Malzahn AM (2006) Larval fish dynamics in changing environments. Dissertation. Leibniz Institute for Marine Sciences IfM/GEOMAR, Kiel
Maps F, Runge JA, Zaradjian B, Joly B (2005) Egg production and hatching success of Temora longicornis (Copepoda, Calanoida) in the southern Gulf of St. Lawrence. Mar Ecol Prog Ser 285: 117-128
Mauchline, J., 1998. The biology of calanoid copepods. Advances in Marine Biology. Vol. 33. Academic Press, London.
Mayzaud, P., Conover, R. J., 1976. Influence of potential food supply on the activity of digestive enzymes of neritic zooplankton. Proceedings of the 10th European Symposium on Marine Biology. 2, 415-427.
Mayzaud P, Mayzaud O (1981) Kinetic properties of digestive carbohydrases and proteases of zooplankton. Can J Fish Aquat Sci 38: 535-543
Mayzaud P, Poulet SA (1978) The importance of the time factor in the response of zooplankton to varying concentrations of naturally occurring particulate matter. Limnol Oceanogr 23: 1144-1154
Mayzaud P, Roche-Mayzaud O, Razouls S (1992) Medium term time acclimation of feeding and digestive enzyme activity in marine copepods: influence of food concentration and copepod species. Mar Ecol Prog Ser 89: 197-212
Mayzaud P, Tirelli V, Bernard JM, Roche-Mayzaud O (1998) The influence of food quality on the nutritional acclimation of the copepod Acartia clausi. J Mar Syst 15: 483-493
McIlvaine, T. C. (1921) A buffer solution for colorimetric comparison. J Biol Chem 49: 183-186Micheli F (1999) Eutrophication, fisheries, and consumer-resource dynamics in marine pelagic
ecosystems. Science 285: 1396-1398Minagawa M, Wada E (1984) Stepwise enrichment of 15N along food chains: further evidence and the
relation between 15N and animal age. Geochim Cosmochim Acta 48: 1135–1140Miralto A, Barone G, Romano G, Poulet SA, Ianora A, Russo GL, Buttino I, Mazzarella G, Laabir M,
Cabrini M, Giacobbe MG (1999) The insidious effect of diatoms on copepod reproduction. Nature 402: 173-176
Mitra A (2006) A multi-nutrient model for the description of stoichiometric modulation of predation in micro- and mesozooplankton. J Plankton Res 28: 597-611
Mitra A, Flynn KJ (2005) Predator-prey interactions: is 'ecological stoichiometry' sufficient when good food goes bad? J Plankton Res 27: 393-399
Morris RJ, McCartney MJ, Joint IR, Robinson GA (1985) Further studies of a spring phytoplankton bloom in an enclosed experimental ecosystem. J Exp Mar Biol Ecol 86: 151-170
Morris RJ, McCartney MJ, Robinson GA (1983) Studies of a spring phytoplankton bloom in an enclosed experimental ecosystem. I. Biochemical changes in relation to the nutrient chemistry of water. J Exp Mar Biol Ecol 70: 249-262
Müller-Navarra DC (1995) Biochemical versus mineral limitation in Daphnia. Limnol Oceanogr 40: 1209-1214
Müller-Navarra DC, Brett MT, Park S, Chandra S, Ballantyne AP, Zorita E, Goldman CR (2004) Unsaturated fatty acid content in seston and tropho-dynamic coupling in lakes. Nature 427: 69
Niehoff B (2000) Effect of starvation on the reproductive potential of Calanus finmarchicus. ICES J Mar Sci 57: 1764-1772
111

Chapter 9: References
Niehoff B (2003) Gonad morphology and oocyte development in Pseudocalanus spp. in relation to spawning activity. Mar Biol 143: 759-768
Niehoff B (2004) The effect of food limitation on gonad development and egg production of the planktonic copepod Calanus finmarchicus. J Exp Mar Biol Ecol 307: 237-259
Nielsen TG, Munk P (1998) Zooplankton diversity and the predatory impact by larval and small juvenile fish at the Fisher Banks in the North Sea. J Plankton Res 20: 2313-2332
Niermann U, Bingel F, Ergün G, Greve W (1998) Fluctuation of dominant mesozooplankton species in the Black Sea, North Sea and the Baltic Sea: Is a general trend recognisable? Turk J Zool 22: 63-81
Oosterhuis, S. S., Baars, M. A. (1985) On the usefulness of digestive enzyme activity as index for feeding activity in copepods. Hydrobiol Bull 19: 89-100
Oosterhuis, S. S., Baars, M. A., Klein-Breteler, W. C. M. (2000) Release of the enzyme chitobiase by the copepod Temora longicornis: Characteristics and potential tool for estimating crustacean biomass production in the sea. Mar Ecol Prog Ser 196: 195-206
Otto L, Zimmerman JTF, Furnes GK, Mork M, Saetre R, Becker G (1990) Review of the physical oceanography of the North Sea. Neth J Sea Res 26: 161-238
Paffenhöfer G-A, Lewis KD (1990) Perceptive performance and feeding behavior of calanoid copepods. J Plankton Res 12: 933-946
Paffenhöfer GA (1998a) Heterotrophic protozoa and small metazoa: feeding rates and prey-consumer interactions. J Plankton Res 20: 121-133
Paffenhöfer GA (1998b) On the relation of structure, perception and activity in marine planktonic copepods. J Mar Syst 15: 457-473
Paffenhöfer GA, Van Sant KB (1985) The feeding response of a marine planktonic copepod to quantity and quality of particles. Mar Ecol Prog Ser 27: 55-65
Pedersen L, Jensen HM, Burmeister AD, Hansen BW (1999) The significance of food web structure for the condition and tracer lipid content of juvenile snail fish (Pisces: Liparis spp.) along 65-72° N off West Greenland. J Plankton Res 9: 1593-1611
Penna A, Berluti S, Penna N, Magnani M (2000) Influence of nutrient ratios on the in vitro extracellular polysaccharide production by marine diatoms from the Adriatic Sea. Biol Mar Mediterr 7: 278-283
Pertola S, Koski M, Viitasalo M (2002) Stoichiometry of mesozooplankton in N- and P-limited areas of the Baltic Sea. Mar Biol 140: 425-434
Peters J, Renz J, Beusekom Jv, Boersma M, Hagen W (2006) Trophodynamics and seasonal cycle of the copepod Pseudocalanus acuspes in the Central Baltic Sea (Bornholm Basin): evidence from lipid composition. Mar Biol DOI: 10.1007/s00227-006-0290-8
Peters, G., Saborowski, R., Buchholz, F., Mentlein, R., 1999. Two distinct forms of the chitin-degrading enzyme N-acetyl-beta-D-glucosaminidase in the Antarctic krill: specialists in digestion and moult. Mar. Biol. 134, 697-703.
Peterson BJ (1999) Stable isotopes as tracers of organic matter input and transfer in benthic food webs: a review. Acta Oecologica 20: 479-487
Plath K, Boersma M (2001) Mineral limitation of zooplankton: stoichiometric constraints and optimal foraging. Ecology 82: 1260-1269
Pond, D. W., Harris, R. P., Brownlee, C. (1995) A microinjection technique using a pH-sensitive dye to determine the gut pH of Calanus helgolandicus. Mar Biol 123: 75-79
Poulet SA, Ouellet G (1982) The role of amino acids in the chemosensory swarming and feeding of marine copepods. J Plankton Res 4: 341-361
Price HJ, Paffenhöfer GA (1986) Effects of concentration on the feeding of a marine copepod in algal monocultures and mixtures. J Plankton Res 8: 119-128
Price HJ, Paffenhöfer GA, Strickler JR (1983) Modes of cell capture in calanoid copepods. Limnol Oceanogr 28: 116-123
Prince E, Lettieri L, McCurdy K, Kubanek J (2006) Fitness consequences for copepods feeding on a red tide dinoflagellate: deciphering the effects of nutritional value, toxicity, and feeding behavior. Oecologia 147: 479-488
Raabe TU, Brockmann UH, Dürselen C-D, Krause M, Rick H-J (1997) Nutrient and plankton dynamics during a spring drift experiment in the German Bight. Mar Ecol Prog Ser 156: 275-288
Redfield AC (1958) The biological control of chemical factors in the environment. Amer Sci 46: 205-221
Reid PC, Lancelot C, Gieskes WWC, Hagmeier E, Weichart G (1990) Phytoplankton of the North Sea and its dynamics: a review. Neth J Sea Res 26: 295-331
Reitan KI, Rainuzzo JR, Øie G, Olsen Y (1997) A review of the nutritional effects of algae in marine fish larvae. Aquaculture 155: 207-222
112

Chapter 9: References
Rey-Rassat C, Irigoien X, Harris R, Head R, Carlotti F (2002a) Growth and development of Calanus helgolandicus reared in the laboratory. Mar Ecol Prog Ser 238: 125-138
Rey-Rassat C, Irigoien X, Harris R, Head R, Carlotti F (2002b) Egg production rates of Calanus helgolandicus females reared in the laboratory: variability due to present and past feeding conditions. Mar Ecol Prog Ser 238: 139-151
Richardson AJ, Schoeman DS (2004) Climate Impact on plankton ecosystems in the Northeast Atlantic. Science 305: 1609-1612
Richardson AJ, Verheye HM (1998) The relative importance of food and temperature to copepod egg production and somatic growth in the southern Benguela upwelling system. J Plankton Res 20: 2379-2399
Riviere D (1983) Biochemical comparison of four species of planktonic copepods of the Northwest Mediterranean by means of enzymograms of esterases, leucine aminopeptidase, alkaline phosphatase, malate dehydrogenase and the malic enzyme. Mar Biol 75: 19-23
Roche-Mayzaud O, Mayzaud P, Biggs DC (1991) Medium-term acclimation of feeding and of digestive and metabolic enzyme activity in the neritic copepod Acartia clausi. 1. Evidence from laboratory experiments. Mar Ecol Progr Ser 69: 25-40
Rodriguez, A., Le Vay, L., Mourente, G., Jones, D. A. (1994) Biochemical composition and digestive enzyme activity in larvae and postlarvae of Penaeus japonicus during herbivorous and carnivorous feeding. Mar Biol 118: 45-51
Roessler PG (1990) Environmental control of glycerolipid metabolism in microalgae: commercial implicaitons and future research directions. J Phycol 26: 393-399
Root TL, Price JT, Hall KR, Schneider SH, Rosenzweig C, Pounds JA (2003) Fingerprints of global warming on wild animals and plants. Nature 421: 57-60
Saborowski, R., Buchholz, F. (1999) A laboratory study on digestive processes in the Antarctic krill, Euphausia superba, with special regard to chitinolytic enzymes. Polar Biol 21: 295-304
Sainz JC, García-Carreno FL, Córdova-Murueta JH, Cruz-Hernández P (2005) Whiteleg shrimp (Litopenaeus vannamei, Boone, 1931) isotrypsins: their genotype and modulation. J Exp Mar Biol Ecol 326: 105-113
Sañudo-Wilhelmy SA, Tovar-Sanchez A, Fu F-X, Capone DG, Carpenter EJ, Hutchins DA (2004) The impact of surface-adsorbed phosphorus on phytoplankton Redfield stoichiometry. Nature 432: 897-900
Sastri, A. R., Roff, J. C. (2000) Rate of chitobiase degradation as a measure of development rate in planktonic crustacea. Can J Fish Aquat Sci 57: 1965-1968
Savage VM, Gillooly JF, Brown JH, West GB, Charnov EL (2004) Effects of body size and temperature on population growth. Am Nat 163: 429-441
Schägger H, von Jagow G (1987) Tricine-sodium dodecyl sulfate-polyacrylamide gel electrophoresis for the separation of proteins in the range from 1 to 100 kDa. Anal Biochem 166: 368-379
Schlitzer, R. (2006) Ocean Data View, Version 3.1.0-2006, http://odv.awi.deSchmidt K, Kähler P, Bodungen B (1998) Copepod egg production rates in the Pomeranian Bay
(Southern Baltic Sea) as a function of phytoplankton abundance and taxonomic composition. Mar Ecol Prog Ser 174: 183-195
Schütte T (2006) Untersuchungen zur Nahrungsselektivität und zu chemosensorischen Fähigkeiten von Temora longicornis. Masters Thesis. Biologische Anstalt Helgoland, Oldenburg
Schwenzer DE, Bulnheim HP (1991) Enzyme electrophoretic studies as a contribution to the systematics of the taxon Tisbe (Copepoda, Harpacticoida). Z zool Syst Evolut-Forsch 29: 409-432
Shaw BA, Harrison PJ, Andersen RJ (1995) Feeding deterrence properties of apo-fucoxanthinoids from marine diatoms. 2. Physiology of production of apo-fucoxanthinoids by the marine diatoms Phaeodactylum tricornutum and Thalassiosira pseudonana, and their feeding deterrent effects on the copepod Trigriopus californicus. Mar Biol 124: 473-481
Smith, P. K., Krohn, R. I., Hermanson, G. T., Mallia, A. K., Gartner, F. H., Provenzano, M. D., Fujimoto, E. K., Goeke, N. M., Olson, B. J., Klenk, D. C. (1985) Measurement of protein using bicinchoninic acid. Anal Biochem 150: 76-85
Sommer U (1988) Phytoplankton succession in microcosm experiments under simultaneous grazing pressure and resource limitation. Limnol Oceanogr 33: 1037-1054
Sommer U, Sommer F (2006) Cladocerans versus copepods: the cause of contrasting top-down controls on freshwater and marine phytoplankton. Oecologia 147: 183-194
Sommer U, Stibor H, Katechakis A, Sommer F, Hansen T (2002) Pelagic food web configurations at different levels of nutrient richness and their implications for the ratio fish production:primary production. Hydrobiologia 484: 11-20
Sotka EE (2003) Genetic control of feeding preference in the herbivorous amphipod Ampithoe longimana. Mar Ecol Prog Ser 256: 305-310
113
Chapter 9: References
St. John MA, Clemmesen C, Lund T, Köster T (2001) Diatom production in the marine environment: implications for larval fish growth and condition. ICES J Mar Sci 58: 1106-1113
Sterner RW, Elser JJ (2002) Ecological stoichiometry: the biology of elements from molecules to the biophere. University Press, Princeton
Sterner RW, Schulz KL (1998) Zooplankton nutrition: recent progress and a reality check. Aquat Ecol 32: 261-279
Tande KS, Slagstad D (1982) Ecological investigation on the zooplankton community of Balsfjorden, Northern Norway. Seasonal and short-time variations in enzyme activity in copepodite stage V and VI males and females of Calanus finmarchicus (Gunnerus). Sarsia 67: 63-68
Tang KW, Jakobsen HH, Visser AW (2001) Phaeocystis globosa (Prymnesiophyceae) and the planktonic food web: feeding, growth, and trophic interactions among grazers. Limnol Oceanogr 46: 1860-1870
Teegarden GJ (1999) Copepod grazing selection and particle discrimination on the basis of PSP toxin content. Mar Ecol Prog Ser 181: 163-176
Thibault D, Gaudy R, Le Fevre J (1994) Zooplankton biomass, feeding and metabolism in a geostrophic frontal area (Almeria-Oran Front, western Mediterranean). Significance to pelagic food webs. J Mar Syst 5: 297-311
Thor P (2000) Relationship between specific dynamic action and protein deposition in calanoid copepods. J Exp Mar Biol Ecol 245: 171-182
Thor P (2003) Elevated respiration rates of the neritic copepod Acartia tonsa during recovery from starvation. J Exp Mar Biol Ecol 283: 133-143
Thor P, Dam HG, Rogers DR (2003) Fate of organic carbon released from decomposing copepod fecal pellets in relation to bacterial production and ectoenzymatic activity. Aquat Microb Ecol 33: 279-288
Tirelli V, Mayzaud P (2005) Relationship between functional response and gut transit time in the clanoid copepod Acartia clausi: role of food quantity and quality. J Plankton Res 27: 557-568
Tiselius P (1998) Short term feeding responses to starvation in three species of small calanoid copepods. Mar Ecol Prog Ser 168: 119-126
Tiselius P (1992) Behaviour of Acartia tonsa in patchy food environments. Limnol Oceanogr 37: 1640-1651
Turner, J. T., 1984. The feeding ecology of some zooplankters that are important prey items of larval fish. NOAA Tech. Rep. NMFS 7, 1-28.
Turner JT, Doucette GJ, Powell CL, Kulis DM, Keafer BA, Anderson DM (2000) Accumulation of red tide toxins in larger size fractions of zooplankton assemblages from Massachusetts Bay, USA. Mar Ecol Prog Ser 203: 95-107
Utermöhl H (1931) Neue Wege in der quantitativen Erfassung des Planktons (Mit besonderer Berücksichtigung des Ultraplanktons). Ver Int Verein Theor Angew Limnol 5: 567-595
Van Duyl FC, Bak RPM, Kop AJ, Nieuwland G (1990) Bacteria, auto- and heterotrophic nanoflagellates, and their relations in mixed, frontal and stratified waters of the North Sea. Neth J Sea Res 26: 97-109
Van Nieuwerburgh L, Wänstrand I, Snoeijs P (2004) Growth and C:N:P ratios in copepods grazing on N- or Si-limited phytoplankton blooms. Hydrobiologia 514: 57-72
Van Wambeke F, Christaki U, Gaudy R (1996) Carbon fluxes from the microbial food web to mesozooplankton. An approach in the surface layer of a pelagic area (NW Mediterranean Sea). Oceanologica Acta 19: 57-66
Vanderploeg HA, Paffenhöfer GA (1985) Modes of algal capture by the freshwater copepod Diaptomus sicilis and their relation to food-size selection. Limnol Oceanogr 30: 871-885
Vanderploeg HA, Scavia D, Liebig JR (1984) Feeding rate of Diaptomus sicilis and its relation to selectivity and effective food concentration in algal mixtures and in Lake Michigan. J Plankton Res 6: 919-941
Veloza AJ, Chu F-LE, Tang KW (2006) Trophic modification of essential fatty acids by heterotrophic protists and its effects on the fatty acid composition of the copepod Acartia tonsa. Mar Biol 148: 779-788
Viitasalo M, Kiørboe T, Flinkman J, Pedersen LW, Visser AW (1998) Predation vulnerability of planktonic copepods: consequences of predator foraging strategies and prey sensory abilities. Mar Ecol Prog Ser 175: 129-142
Villar-Argaiz M, Medina-Sánchez JM, Carrillo P (2002) Linking life history strategies and ontogeny in crustacean zooplankton: implications for homeostasis. Ecology 83: 1899-1914
Visser AW, Saito H, Saiz E, Kiørboe T (2001) Observations of copepod feeding and vertical distribution under natural turbulent conditions in the North Sea. Mar Biol 138: 1011-1019
114
Chapter 9: References
Vrba J, Callieri C, Bittl T, Šimek K, Bertoni R, Filandr P, Hartman P, Hejzlar J, Macek M, Nedoma J (2004) Are bacteria the major producers of extracellular glycolytic enzymes in aquatic environments? Internat Rev Hydrobiol 89: 102-117
Walve J, Larsson U (1999) Carbon, nitrogen and phosphorus stoichiometry of crustacean zooplankton in the Baltic Sea: implications for nutrient recycling. J Plankton Res 21: 2309-2321
Wichels A, Gerdts G, Schütt C (2002) Pseudoalteromonas spp. phages, a significant group of marine bacteriophages in the North Sea. Aquat Microb Ecol 27: 233-239
Wiltshire KH, Manly BFJ (2004) The warming trend at Helgoland Roads, North Sea: Phytoplankton response. Helgol Mar Res 58: 269-273
Wynne D, Rhee GY (1986) Effects of light intensity and quality on the relative N and P requirement (the optimum N:P ratio) of marine planktonic algae. J Plankton Res 8: 91-103
Zöllner, N., Kirsch, K. (1962) Über die quantitative Bestimmung von Lipoiden (Mikromethode) mittels der vielen natürlichen Lipoiden (allen bekannten Plasmalipoide) gemeinsamen Sulfosphovanillin-Reaktion. Z Ges Exp Med 135: 545-561
Zubkov MV, Sleigh MA, Burkill PH (2001) Heterotrophic bacterial turnover along the 20° W meridian between 59° N and 37° N in July 1996. Deep Sea Res II 48: 987-1001
115
DanksagungIch danke meinen beiden Betreuern P. D. Dr. Maarten Boersma und Dr. Reinhard Saborowski, die vor Ort auf Helgoland an der Biologischen Anstalt Helgoland in der Stiftung AWI (HGF) meine Ansprechpartner waren und meinem betreuenden Professor Dr. Ulrich Sommer an der Christian-Albrechts-Universität zu Kiel am Leibnitz-Institut IfM/Geomar, sowie den Mitgliedern meiner Prüfungskommission für ihr Interesse und ihre Zeit und Frau Heike Herden für Ihre Freundlichkeit.Ich danke Maarten Boersma für die Sicherung meiner Finanzierung während des größten Zeitraums meiner Arbeit über das BMBF-finanzierte Projekt GLOBEC-Deutschland, für die letzen paar Monate des Zusammenschreibens auch dem Arbeitsamt Pinneberg. AWI, GLOBEC-Deutschland und MARBEF danke ich für die zusätzliche finanzielle Unterstützung für Reisekosten, die es mir ermöglichte, an nationalen und internationalen Konferenzen in Gijon, Spanien und in Hammamet, Tunesien und an einem MARBEF-Copepoden-Kurs in Bizerte, Tunesien teilzunehmen.Den vielen Kollegen und Freunden von Foodweb, GLOBEC und der Biologischen Anstalt Helgoland danke ich für die nette Zusammenarbeit, besonders den Hauptakteuren der Projekte nebst meinen Betreuern also Jürgen Alheit, Justus van Beusekom, Fritz Buchholz, Gunnar Gerdts, Antje Wichels und Karen Wiltshire. Für tatkräftige Unterstützung und Diskussionen danke ich besonders Christian Agurto, Kristina Barz, Karin und Ulf Bickmeyer, Jörg Dutz, Andrea Gerecht, Magnus Hengevoß, Jens-Peter Hermann, Silvia Janisch, André Keunecke, Alexandra Kraberg, Sonja Leidenberger, Silke Laakmann, Anne Langer, Nina Mühlenbeck, Eva Nossek, Janna Peters, Jasmin Renz, Tatyana Romanova, Katrin Schachmann, Tanja Schütte, Anne Wesche und ganz besonders auch den Crews von Aade, Uthörn, Heincke, Alkor und Dana. Den Betreuern des Copepoda-Kurses in Tunesien danke ich für den erweiterten Horizont auf die Copepodenforschung: Geoff Boxshall, Jiang Shiou Hwang, Thomas Kiørboe, Carol Lee, Claude Razoul, François Schmitt, Sami Souissi, Rudi Strickler und den anderen Kursteilnehmern aus aller Welt, besonders Veronica, Neila und Mohammad. Für nette gemeinsame Stunden während und nach der Arbeit danke ich besonders Anne W. und Melanie, Gabriela und Luis, Tanja und Christina, Anne L. und Anne S., Arne und Nicole, Alex, Folke, Isa, Britta, Karin, Reinhold und den Volleyballern vom Vfl-Fosite. Nicht zuletzt danke ich meinem lieben Wolf, meinen lieben Eltern im Schwarzwald und meinen Freunden in Hamburg, Köln und Freiburg und sonstwo in der Welt für die moralische Unterstützung.
116

Curriculum Vitae von Susanna KnotzTÄTIGKEITEN UND WEITERBILDUNG
Oktober 2002 – dato Doktorandin der Christian-Albrechts Universität zu Kiel bei Prof. Dr. U. Sommer, P. D. Dr. M. Boersma und Dr. R. Saborowski an der Biologischen Anstalt Helgoland in der Stiftung Alfred-Wegener-Institut für Polar- und Meeresforschung (Helmholtz-Gemeinschaft) in dem BMBF-geförderten Projekt Globec-Deutschland eingebunden in das Foodweb Projekt Helgoland
Juli 2005 MARBEF-Training Course in the Biology and Systematics of Copepods, 04.-08.07.2005, University of Bizerte, Tunesien
September 2002 Öffentlicher Vortrag an der Fachhochschule Kiel über wissenschaftsjournalistisch aufbereitetes Gesundheitsthema
Mai – Juni 2002 P&R-Arbeit zur Einführung der EU-Wasserrahmenrichtlinie für das Umweltministerium Schleswig-Holstein im Auftrag der Agentur XÄM
März 2001 – September 2002 Mitarbeit im EU-Projekt Aqua-Chip in Zusammenarbeit mit Dr. G. Kasimir vom HYDRA-Institut Wien
Oktober – November 2001 Datenaufbereitung und grafische Gestaltung von Makrozoobenthosdaten im Auftrag des HYDRA-Instituts Konstanz, Büro P. Rey; Mitarbeit bei der Elektrobefischung verschiedener Fließgewässer in Liechtenstein und der Schweiz
Juni – August 2001 Regionalbearbeiterin für die Niederländische und Deutsche Nordsee für den ADAC-Sommerservice im Auftrag des HYDRA-Insituts Konstanz, Büro Peter Rey
Mai 2001 Biologisch-ökologische Fließgewässeruntersuchungen nach DIN 38410, Teil 2 für das Limnologische Institut Dr. Nowak
Mai 2001 Übersetzungsarbeiten für IBS-Multimedia, Todtnau
März – Mai 2001 Büroassistentin, Bürstenfabrik Knotz, Todtnau
September, November 2000 Übersetzungsarbeiten für IBS-Multimedia, Todtnau
März – April 2000 Übersetzungsarbeiten für IBS-Multimedia, Todtnau
117

August 1999 – Februar 2000 Gestaltungsaufträge für Greenpeace Hamburg
September 1999 Übersetzungsarbeiten für den Verlag MMK/ad press, Hamburg
August 1999 – Februar 2001 Wissenschaftliche Angestellte am Limnologischen Institut Dr. Nowak in Ottersberg, bis Februar 2000 als Teilzeitkraft, ab März 2000 als Vollzeitkraft und Bereichsleiterin der Abteilung Mikrobiologie/ Ökotoxikologie
Mai 1999 Werkvertrag bei Dr. Gesine Schütte, BIOGUM (Biologie, Umwelt, Technik), Institut für Allgemeine Botanik der Universität Hamburg
November 1998 – März 1999 Wissenschaftliche Hilfskraft am Institut für Hydrobiologie und Fischereiwissenschaft bei Dr. Anno Faubel an der Universität Hamburg
Juni – September 1998 Leonardo da Vinci-Stipendium für ein ENTRANTS-Projekt an der Universität Oslo und der Landwirtschaftlich-Technischen Hochschule Ås in Norwegen bei Jonathan E. Colman, Dr. Eigil Reimers und Dr. Stein R. Moe
April – Mai 1998 Zusammenarbeit mit Dipl.-Forstw. Gerhard Kihm für das Forstamte Ettlingenweier bei Karlsruhe
Februar 1998 Praktikum beim Verlag interconnections in Freiburg
Dezember 1997 – Jan. 1998 Wissenschaftliche Hilfskraft am Institut für Bodenkunde der Forstwissenschaftlichen Fakultät der Universität Freiburg bei Dr. Stefan Raspe
Oktober 1997 Meeresbiologiekurs "Ökosystem Mittelmeer" mit Tauchausbildung, 01.-11.10.1997, HYDRA Institut für Meereswissenschaften, Elba, Italien
September – November 1997 Praktikum bei impuls/UmTourS, einem Unternehmen für Landschaftsplanung und Umwelttouristik, Freiburg
Juni – August 1997 Mitarbeit bei der Neugestaltung des BUND-Waldschadenslehrpfades am Schauinsland bei Freiburg in Zusammenarbeit mit der Forstverwaltung und der Forstlichen Versuchsanstalt Freiburg
August 1995 Erstellen eines Warenpräsentationskataloges für die Bürstenfabrik Knotz, Todtnau
118

Oktober – November 1994 Praktikum in einem Telemetrieprojekt der Aktion Fischotterschutz e. V. in Demen (Mecklenburger Seenplatte) in Kooperation mit dem Umweltministerium Mecklenburg-Vorpommern
Oktober 1993 – Juni 1997 Abschluss des Biologiestudiums an der Albert-Ludwigs-Universität in FreiburgDiplomprüfungen in den Fächern Tierphysiologie/ Verhaltensbiologie; Neurobiologie/Biophysik; Zellbiologie; NeuropathologieDiplomarbeit "Neuronale Kontrolle der Verstärkung in einem Gelenkstellungsregelkreis der Stabheuschrecke Carausius morosus" bei Dr. Rolf Kittmann am Lehrstuhl Prof. Dr. K. Vogt in der Abteilung Tierphysiologie des Instituts für Zoologie
September 1992 – Mai 1993 Studium an der Brock University in St. Catharines, Ontario/KanadaHonours BSc Thesis "The effect of dopamine on second messenger systems in the hindgut of the crayfish Procambarus clarkii" bei A. Joffre MercierKurse in Datenverarbeitung, Meeresbiologie, Paläontologie
Mai – Juli 1992 Wissenschaftliche Hilfskraft in der Abteilung Tierphysiologie des Instituts für Zoologie der Universität Freiburg bei Dr. K.-G. Collatz
Oktober 1989 – August 1992 Biologiestudium an der Albert-Ludwigs-Universität in Freiburg im Breisgau
1980 – 1989 Gymnasium in Schönau im SchwarzwaldAbiturprüfungsfächer: Chemie, Englisch, Mathematik, Geschichte/Gemeinschaftskunde, Deutsch,Preis der Chemischen Industrie, Mitglied der Schülermitverwaltung und der Schülerzeitungsredaktion
SPRACHKENNTNISSE
Englisch mündlich und schriftlich fließend; Spanisch, Französisch, Norwegisch ausbaufähige Kenntnisse
Pinneberg, 31.5.2006, Susanna Knotz
119
Description of the scientific contributions to multiple author manuscripts
1) S. Knotz, M. Boersma, R. Saborowski "Microassays for a set of enzymes in individual small marine copepods" Comparative Biochemistry and Physiology, Part A 145/3: 406-411 (2006)
All analyses, the text writing and graphical presentation were done by Susanna Knotz under the supervision of PD Dr. Maarten Boersma and Dr. Reinhard Saborowski.
2) S. Knotz, C. B. Augustin, M. Boersma, R. Saborowski "Sublethal physiological effects of food limitation in copepods"
All analyses, the text writing and graphical presentation were done by Susanna Knotz under the supervision of PD Dr. Maarten Boersma and Dr. Reinhard Saborowski. C. B. Augustin assisted in gaining mortality data.
3) S. Knotz, S. Laakmann, J. J. E. van Beusekom, R. Saborowski, K. H. Wiltshire, M. Boersma "Food quality, quantity and hydrographic influence on Acartia clausi and Temora longicornis egg production during a spring phytoplankton bloom"
All analyses, the text writing and graphical presentation were done by Susanna Knotz under the supervision of PD Dr. Maarten Boersma and Dr. Reinhard Saborowski. Silke Laakmann provided data on egg production of Acartia clausi and Temora longicornis. Justus van Beusekom provided lab space and advised on phosphorus measurements, Karen Wilthire provided Date on phytoplankton, temperature and salinity.
4) S. Knotz, A. Malzahn, A. Wesche, J. J. E. van Beusekom, R. Saborowski, M. Boersma "Stable isotopes as predictors of copepod reproductive success"
All analyses, the text writing and graphical presentation were done by Susanna Knotz under the supervision of PD Dr. Maarten Boersma and Dr. Reinhard Saborowski. Arne Malzahn assisted in seston sampling and stable isotope sample preparation and Anne Wesche provided egg production data of four dominant copepods at Helgoland in 2004.
120

Erklärung
Die vorliegende Dissertation wurde selbstständig von mir angefertigt und ist nach Form und Inhalt meine eigene Arbeit. Sie wurde keiner anderen Stelle im Rahmen eines Prüfungsverfahrens vorgelegt. Dies ist mein bisher einziges und erstes Promotionsverfahren.
Die Promotion soll im Fach Meereskunde erfolgen.
Ich lasse Zuhörer für die Disputation zu.
Pinneberg, den 31. Mai, 2006
Susanna Knotz
121