trinity glen rose groundwater conservation district · 2 trinity glen rose groundwater conservation...
TRANSCRIPT
Trinity Glen Rose Groundwater Conservation District
Member District Position Joe duMenil .................................... District 2 ......................................... President Don Reddout ................................. District 1 ................................. Vice-President Jorge H. Gonzalez ........................ District 5 ........................................ Treasurer Joe Silman .................................... District 4 ......................................... Secretary Harris Dickey .................................. District 3 ............... Asst. Secretary/Treasurer
District Staff
George Wissmann ................................ ................................... General Manager Emily Weiner ........................................ ........... Administrative Program Manager
6335 Camp Bullis Road, Suite 25 San Antonio, TX 78257
Fax: (210) 698-1159 Phone: (210) 698-1155 www.trinityglenrose.com
2
Trinity Glen Rose Groundwater Conservation District Management Plan
Revision Record
Date Adopted Effective Date Version/Resolution______________________ October 14, 2004 October 14, 2004 Original Adoption, Board Resolution October 14, 2010 October 14, 2010 Revision/Re-Adoption, Board Resolution
3
TABLE OF CONTENTS
Section ..................................................................................................................... Page Time Period for this Plan ................................................................................................. 5
District Mission ................................................................................................................ 5
Statement of Guiding Principles ...................................................................................... 5
Commitment to Implement Groundwater Management Plan ........................................... 6
Joint Planning in Management Area ............................................................................... 7
Modeled Available Groundwater (Based on Desired Future Conditions) ........................ 8
General Description of the District ................................................................................. 10
Topography and Drainage ............................................................................................. 11
Water Resources within the Trinity Glen Rose Groundwater Conservation District ...... 11
Trinity Group of Aquifers ............................................................................................... 13
Surface Water Resources and Usage in Northern Bexar County .................................. 13
Projected Total Water Demand in Bexar County ........................................................... 13
Recharge of Groundwater in Bexar County ................................................................... 13
Recharge Enhancement Potential ................................................................................. 15
Projected Population in Bexar County ........................................................................... 15
Actions, Procedures, Performance, and avoidance Necessary to Effectuate the Management Plan ......................................................................................................... 16
Methodology for Tracking Progress in Achieving Management Goals .......................... 17
Groundwater Management Goals ................................................................................. 18
Appendix
Appendix A – GMA 9 Resolution #072610-01 ............................................................... 26
Appendix B – Estimated Historical Groundwater Use and 2012 State Water Plan Datasets: Trinity Glen Rose Groundwater Conservation District ................................... 28
Appendix C – GAM Run 10-050 MAG version 2 .................................. included in packet
Appendix D – GAM Run 15-001 ........................................................... included in packet
4
List of Maps
Map 1 - GMA9 ................................................................................................................. 7
Map 2 - Stratigraphic Cross Section of the Hill Country Area .......................................... 8
Map 3 - TGRGCD District Boundary ............................................................................... 9
List of Tables
Table 1 - TGRGCD Historical Groundwater Usage (2004-2014) .................................. 12
Table 2 - Flow Budget and Recharge Variable for TGRGCD ........................................ 14
Table 3 - Population Projections .................................................................................. 15
5
TIME PERIOD FOR THIS PLAN
This plan becomes effective upon adoption by the Trinity Glen Rose Groundwater Conservation District Board of Directors and subsequent approval by the Texas Water Development Board (TWDB). This plan incorporates a planning period of 50 years. After five years, the plan will be reviewed for consistency with the applicable Regional Water Plans, the State Water Plan, and Groundwater Management Area 9’s (GMA-9) Desire Future Conditions (DFC) and shall be readopted with or without amendments. The plan may be revised at anytime in order to maintain such consistency or as necessary to address any new or revised data, Groundwater Availability Models, Desired Future Conditions in GMA-9, or District management strategies.
DISTRICT MISSION The Trinity Glen Rose Groundwater Conservation District (TGRGCD or District) was created in 2001 during the 77th Texas Legislature and confirmed by voters in 2002. The District was created in response to the Texas Natural Resources Conservation Commission designating a portion of the Trinity Aquifer within Bexar Country as a Priority Groundwater Management Area (PGMA). The District was created for the purpose of conserving, preserving, recharging, protecting and preventing waste of groundwater from the Trinity Aquifer in Northern Bexar County. Additionally, the District is charged with developing and implementing regulatory programs for the resources within District boundaries. With continued growth in Northern Bexar County, the District is challenged with balancing the needs of families and business with the need to maintain the water resources in this area. To effectively meet these needs, the District’s mission and activities include conducting research, regulating water well drilling and production from permitted, non-exempt wells, collecting and analyzing well water and aquifer data, issuing permits for well drilling, modification, and plugging, promote the capping or plugging of abandoned wells, developing education and conservation programming, providing information and educational material to local property owners, interacting with other governmental or organizational entities, working with stakeholders to ensure a comprehensive management strategy, and undertaking other groundwater-related activities that may help meet the purposes of the District. The Texas Hill Country Area, which includes the Trinity Glen Rose GCD, was declared a Critical Groundwater Area by the then Texas Water Commission in 1990. This declaration, now known as the Hill Country Priority Groundwater Management Area (PGMA), gave notice to the residents of the area that water availability and quality will be at risk within the next 25 years. STATEMENT OF GUIDING PRINCIPLES The TGRGCD was created in order that appropriate groundwater management techniques and strategies could be implemented at the local level to address groundwater issues or problems within the District. The District will continue to incorporate the best and most current site-specific data available in the development of this plan to ensure the sustainability of the aquifers and achievement of the DFC’s. This plan serves as a guideline for the District to ensure greater understanding of local aquifer conditions, development of groundwater management concepts and strategies, and subsequent implementation of appropriate groundwater management policies.
6
COMMITMENT TO IMPLEMENT GROUNDWATER MANAGEMENT PLAN
To address potential groundwater quantity and quality issues, the District is committed to, and will actively pursue, the groundwater management strategies identified in this management plan. These management strategies will be implemented in conjunction with District Rules, policies, and activities in order to effectively manage and regulate the drilling of wells, production of groundwater within the District, protection of recharge features, pollution and waste prevention, and the possible transfer of water out of the District. This includes the evaluation of the impact(s) of conjunctive use of surface and groundwater. The term "conjunctive use" means the combined use of groundwater and surface water sources that optimizes the beneficial characteristics of each source (Texas Water Code, Chapter 36).
Additionally, the District will encourage conservation practices and efficient use of water resources, ensure compliance with the District Drought Contingency Plan, and provide for the identification of any critical groundwater depletion areas within the District.
To the greatest extent practicable, the District will cooperate with and coordinate its management plan and regulatory policies with adjacent groundwater districts, Groundwater Management Area 9, Regional Water Planning Groups, local water purveyors and stakeholders, and adjacent counties with similar aquifers and/or groundwater usage.
An electronic copy of the management plan is available online at www.trinityglenrose.com. A paper copy may be requested at the TGRGCD office, located at 6335 Camp Bullis Rd. Ste. 25, San Antonio, Texas 78257.
7
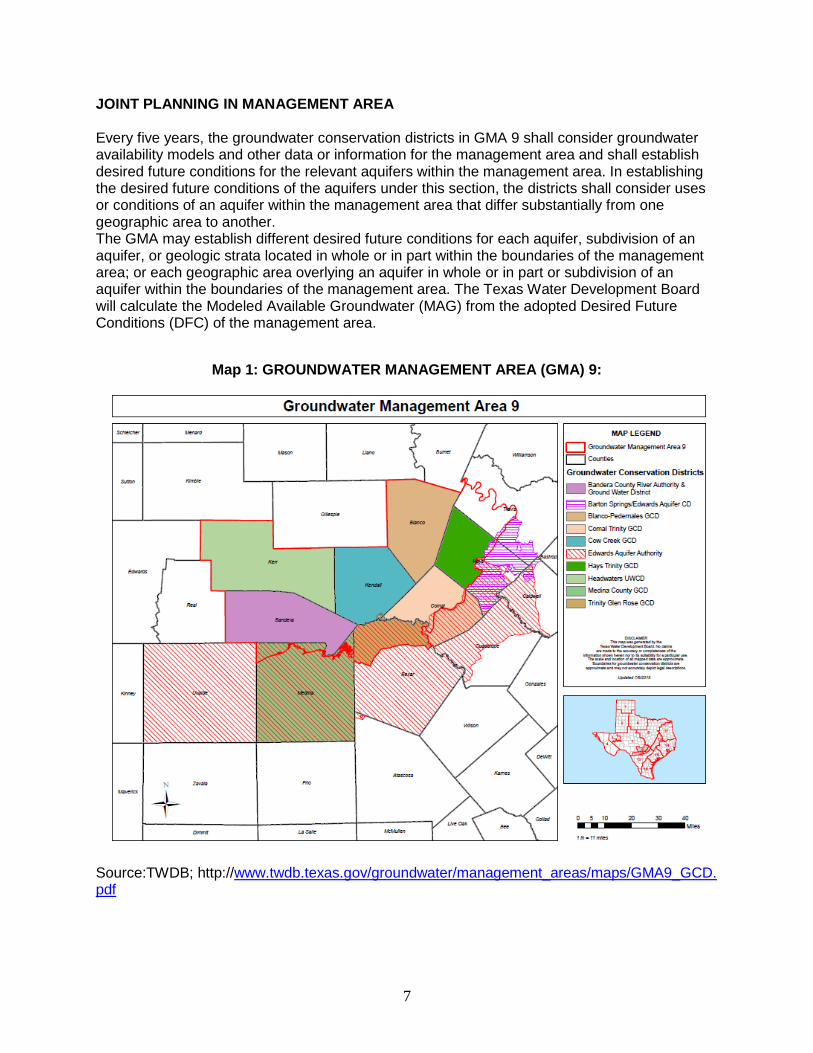
JOINT PLANNING IN MANAGEMENT AREA Every five years, the groundwater conservation districts in GMA 9 shall consider groundwater availability models and other data or information for the management area and shall establish desired future conditions for the relevant aquifers within the management area. In establishing the desired future conditions of the aquifers under this section, the districts shall consider uses or conditions of an aquifer within the management area that differ substantially from one geographic area to another. The GMA may establish different desired future conditions for each aquifer, subdivision of an aquifer, or geologic strata located in whole or in part within the boundaries of the management area; or each geographic area overlying an aquifer in whole or in part or subdivision of an aquifer within the boundaries of the management area. The Texas Water Development Board will calculate the Modeled Available Groundwater (MAG) from the adopted Desired Future Conditions (DFC) of the management area.
Map 1: GROUNDWATER MANAGEMENT AREA (GMA) 9:
Source:TWDB; http://www.twdb.texas.gov/groundwater/management_areas/maps/GMA9_GCD. pdf
8
MODELED AVAILABLE GROUNDWATER (BASED ON DESIRED FUTURE CONDITIONS)
Groundwater Management Area 9 has adopted Desired Future Conditions for the Aquifers located within its planning area. The total Modeled Available Groundwater (MAG) for the Trinity Group of Aquifers underlying TGRGCD is 25,511 ac-ft/yr (2010-2060). (GR10-050 MAG v. 2) The Desired Future Conditions for the aquifers located within the District boundaries and within Groundwater Management Area 9 have been established by Resolution #072610-01 (see appendix A).
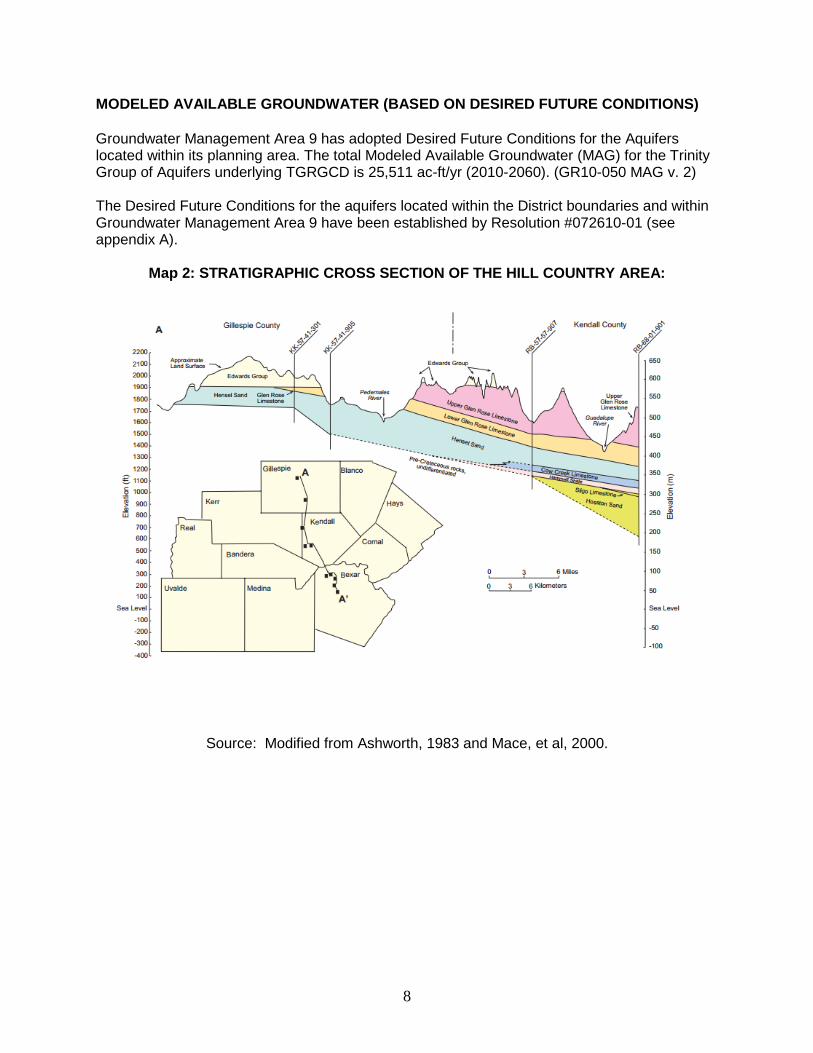
Map 2: STRATIGRAPHIC CROSS SECTION OF THE HILL COUNTRY AREA:
Source: Modified from Ashworth, 1983 and Mace, et al, 2000.
9
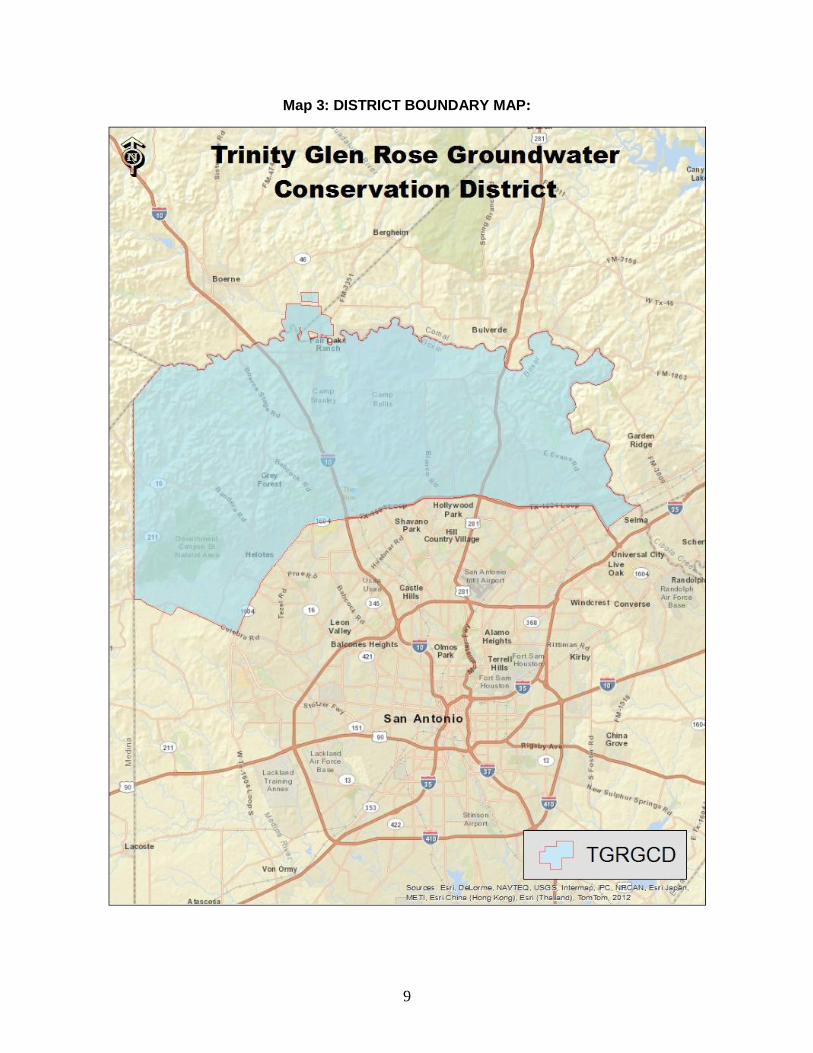
Map 3: DISTRICT BOUNDARY MAP:
10
GENERAL DESCRIPTION OF THE DISTRICT
The Trinity Glen Rose Groundwater Conservation District is located in Northern Bexar County and portions of Kendall and Comal Counties. The District covers approximately 311 square miles (199,574 acres). In 2001, the Texas Legislature passed House Bill (HB) 2005 creating the TGRGCD, in part due to a response to the State of Texas (TCEQ) designating the portion of the Trinity Group of Aquifers lying within Bexar County as a Priority Groundwater Management Area (PGMA). HB2005 outlined the District’s creation, authority, structure, and funding. In 2004, the City of Fair Oaks Ranch held an election and voted to become a part of the TGRGCD, expanding the District to include those portions of Kendall and Comal Counties within the boundaries of Fair Oaks Ranch. In 2009, the Texas Legislature passed HB1518 allowing an increase of production fees and allowing municipalities to request inclusion of annexed areas into the District as provided by Chapter 36 Texas Water Code, expanding the District boundaries. The District operates under the authority of these house bills, as well as the authority and duties set forth in Chapter 36 of the Texas Water Code.
The District is comprised of a 5-member Board of Directors elected to serve 4 year rotating terms. The District also employs one part-time general manager and 1 part-time administrative staff. The District finalized and approved well registration rules in 2002 and general district rules in 2003. Rules governing well construction standards were finalized and approved in 2005 and Drought Contingency Plan rules were finalized and approved in 2007. Rules governing well spacing, exportation, drought and conservation plans, contested case hearings, and variances were developed and/or amended, finalized, and approved in 2013. Rules governing fees were amended, finalized, and approved in 2014. Northern Bexar County’s economy is primarily residential. There are also large ranch holdings and military reservations in the area. The past 15 years has seen a dramatic increase in suburban development and increased residential population density. There is limited agricultural activity in the area that consists of small pastures, grazing, and native grassland open areas. The largest city within the District is San Antonio with a population of approximately 1.3 million.1 According to the Texas State Data Center and the State Demographer, the 2010 population for San Antonio was 1,327,407, an increase of over 15.96% since the national census in 2000. Approximately 185,0002 of the 1.3 million residents live within the District’s boundaries. The remainder of the District is made up of smaller cities including Fair Oaks Ranch and Grey Forest, as well as smaller subdivisions and rural residential population. The District encompasses a high-growth area with on-going plans for future development. Northern Bexar County lies within the San Antonio River basin and for statewide water planning purposes it is part of the South Central Texas Regional Water Planning Group (Region L). The District is also the southernmost portion of the Groundwater Management Area (GMA) 9. The region is unique in comparison to other areas within GMA9 due to the population density, impact of increasing development, and recharge impact from Cibolo Creek Watershed.
1 2010 US Census
2 Bickerstaff, Health, Delgado, and Acosta 2010 Redistricting Report
11
TOPOGRAPHY AND DRAINAGE The primary watershed in Northern Bexar County is the San Antonio River which is a tributary to the Guadalupe River. Surface drainage within the District is generally from northwest to southeast. Cibolo Creek is a tributary of the San Antonio River and drains from northwest to southeast across the Trinity Group of Aquifers and forms a large portion of the boundary between Northern Bexar County and adjacent counties. Cibolo Creek is a major recharge feature of the Trinity Group of Aquifers in Northern Bexar County and eventually confluences with the San Antonio River. The major geologic feature located within the District's boundaries is the Edwards Plateau. This broad, topographically high area is composed of Cretaceous age limestone, dolomite and marl. Deep erosion and down cutting by streams and rivers in the area have resulted in the Edwards Plateau being perceptibly higher than adjacent areas. The plateau is the southernmost extension of the Great Plains, extending westward from the Colorado River to the Pecos, and covers many Central and West Texas counties. It is bordered on the northeast by the pre-Cambrian rocks of the Llano Uplift. Northern Bexar County lies near the southeastern edge of the Plateau. Elevation within the District ranges from a low of approximately 730 feet above sea level where the Cibolo Creek leaves Northern Bexar County to the southeast to approximately 1,892 feet above sea level at Mount Smith in the northwestern portion of the district. WATER RESOURCES WITHIN THE TRINITY GLEN ROSE GROUNDWATER CONSERVATION DISTRICT Groundwater Resources and Usage in Northern Bexar County Within the TGRGCD boundaries, the only major aquifer managed by the TGRGCD that provides groundwater to county residents is the Trinity Group of Aquifers consisting of the Upper Glen Rose Limestone, Lower Glen Rose Limestone, Cow Creek Limestone, Sligo Limestone and Hosston Sand. In isolated areas, the Edwards Aquifer overlies portions of the Trinity Group of Aquifers and is utilized, but not overseen by TGRGCD. Residents drilling wells to be completed into the Edwards Aquifer must obtain a permit through the Edwards Aquifer Authority. In areas where a well is to be completed into the Trinity Group of Aquifers, but must pass through a portion of the Edwards Aquifer on the surface, the driller must obtain a “pass through” permit from the Edwards Aquifer Authority. Trinity well depths vary from shallow, hand-dug wells to drilled wells from 100 feet deep to over 1,600 feet deep based on TWDB records for Bexar County. Depths are highly variable even within the same aquifer and depend entirely on site-specific topography and geology, especially faulting. Water quality and water quantity also vary greatly throughout the District. Water quality within a specific aquifer can be defined or characterized in a general sense, but can still be affected by local geology, hydrology and structure.
12
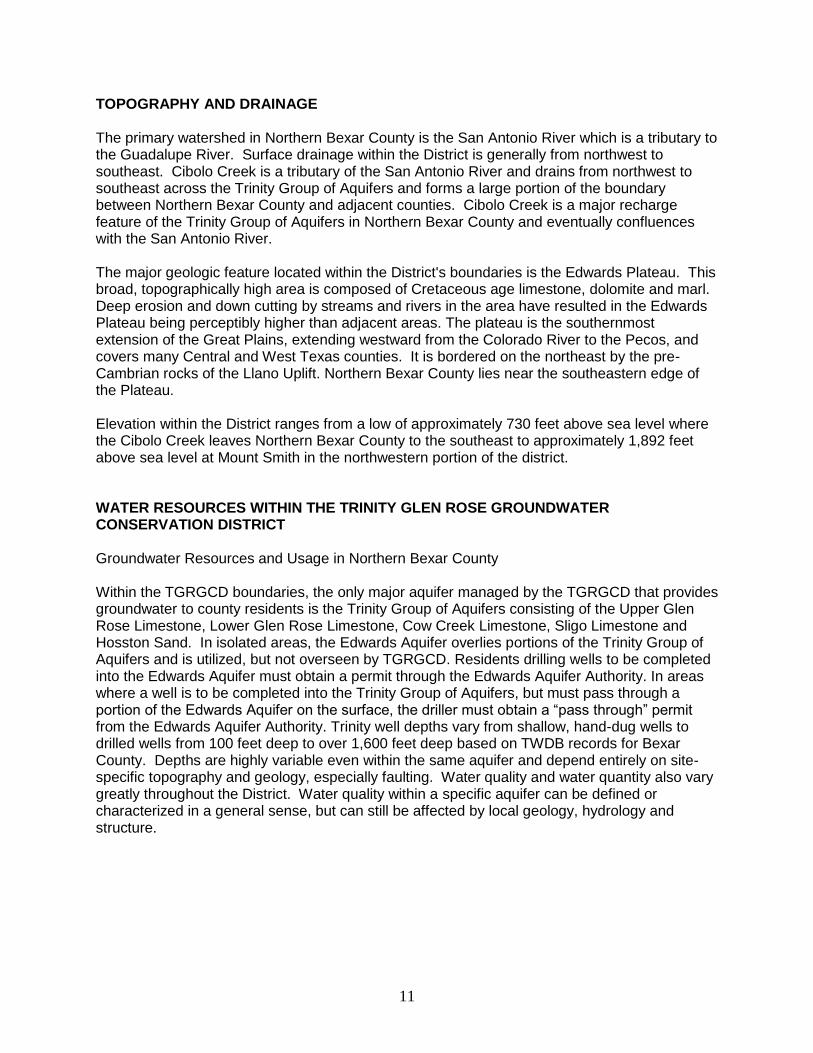
Table 1: TGRGCD Historical Groundwater Usage (in ac-ft) – 2004 - 20143
2004 2005 2006 2007 2008 2009 2010 2011 2012 2013 2014
Municipal PWS 6442 7779 7687 6427 8405 6245 7010 7969 6799 6584 5878
Irrigation 1327 1696 2204 1458 2360 2069 1874 2533 1745 1969 1901
Mining 867 1712 1775 1698 1229 1230 1458 1155 1032 1480 822
Agriculture 100 100 100 100 100 100 100 100 100 100 100
Sm. Business
55
Exempt 1500 1500 1500 1500 1500 1500 1500 1500 1500 1714 1615
Total 10236 12787 13266 11183 13594 11144 11942 13257 11176 11847 10370
It is important to note that the water available from other sources will increase or decrease depending on demand and the service plans managed by the major water utilities operating within the District, San Antonio Water System.
3 Trinity Glen Rose Groundwater Conservation District Pumpage Database. Values collected through non-exempt
user pumpage reports and estimated exempt use.
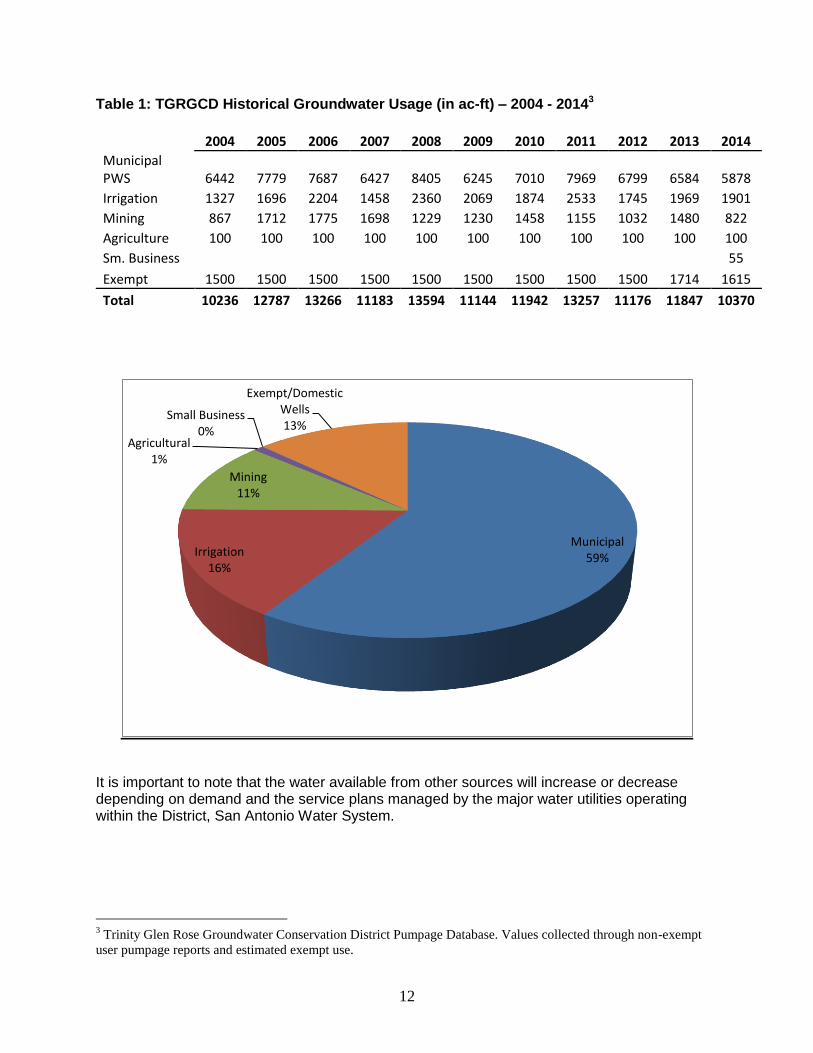
Municipal 59% Irrigation
16%
Mining 11%
Agricultural 1%
Small Business 0%
Exempt/Domestic Wells 13%
13
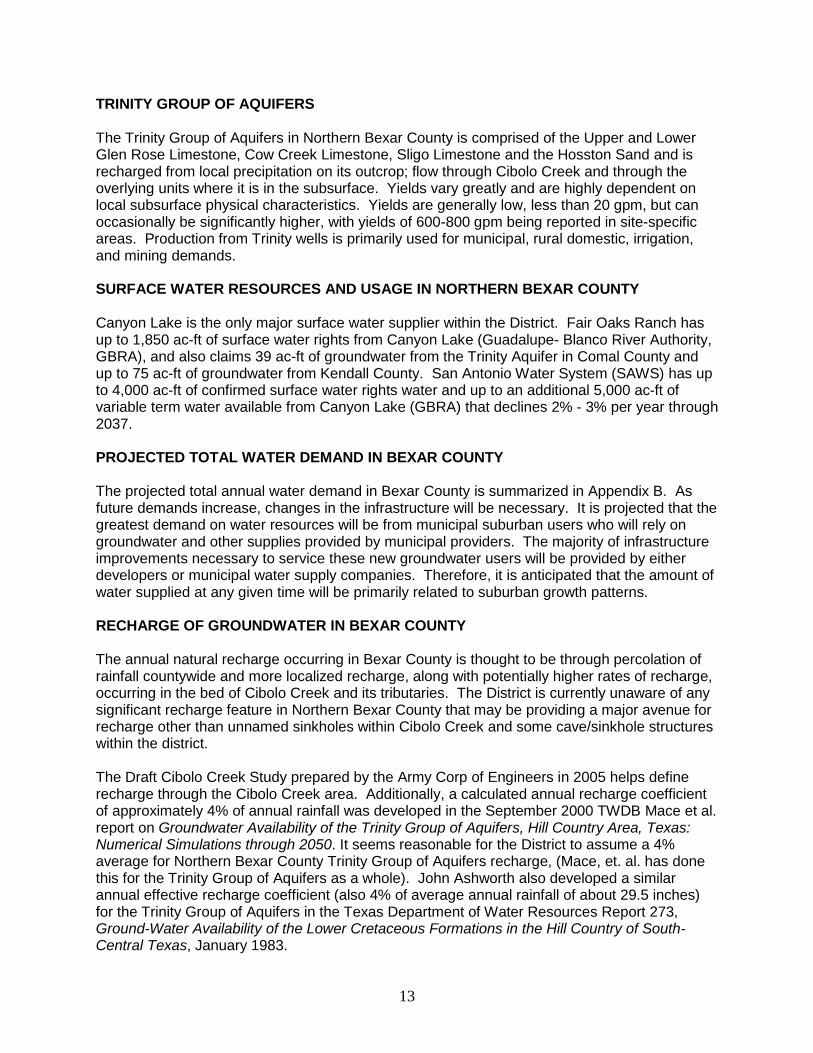
TRINITY GROUP OF AQUIFERS The Trinity Group of Aquifers in Northern Bexar County is comprised of the Upper and Lower Glen Rose Limestone, Cow Creek Limestone, Sligo Limestone and the Hosston Sand and is recharged from local precipitation on its outcrop; flow through Cibolo Creek and through the overlying units where it is in the subsurface. Yields vary greatly and are highly dependent on local subsurface physical characteristics. Yields are generally low, less than 20 gpm, but can occasionally be significantly higher, with yields of 600-800 gpm being reported in site-specific areas. Production from Trinity wells is primarily used for municipal, rural domestic, irrigation, and mining demands. SURFACE WATER RESOURCES AND USAGE IN NORTHERN BEXAR COUNTY Canyon Lake is the only major surface water supplier within the District. Fair Oaks Ranch has up to 1,850 ac-ft of surface water rights from Canyon Lake (Guadalupe- Blanco River Authority, GBRA), and also claims 39 ac-ft of groundwater from the Trinity Aquifer in Comal County and up to 75 ac-ft of groundwater from Kendall County. San Antonio Water System (SAWS) has up to 4,000 ac-ft of confirmed surface water rights water and up to an additional 5,000 ac-ft of variable term water available from Canyon Lake (GBRA) that declines 2% - 3% per year through 2037. PROJECTED TOTAL WATER DEMAND IN BEXAR COUNTY The projected total annual water demand in Bexar County is summarized in Appendix B. As future demands increase, changes in the infrastructure will be necessary. It is projected that the greatest demand on water resources will be from municipal suburban users who will rely on groundwater and other supplies provided by municipal providers. The majority of infrastructure improvements necessary to service these new groundwater users will be provided by either developers or municipal water supply companies. Therefore, it is anticipated that the amount of water supplied at any given time will be primarily related to suburban growth patterns. RECHARGE OF GROUNDWATER IN BEXAR COUNTY The annual natural recharge occurring in Bexar County is thought to be through percolation of rainfall countywide and more localized recharge, along with potentially higher rates of recharge, occurring in the bed of Cibolo Creek and its tributaries. The District is currently unaware of any significant recharge feature in Northern Bexar County that may be providing a major avenue for recharge other than unnamed sinkholes within Cibolo Creek and some cave/sinkhole structures within the district. The Draft Cibolo Creek Study prepared by the Army Corp of Engineers in 2005 helps define recharge through the Cibolo Creek area. Additionally, a calculated annual recharge coefficient of approximately 4% of annual rainfall was developed in the September 2000 TWDB Mace et al. report on Groundwater Availability of the Trinity Group of Aquifers, Hill Country Area, Texas: Numerical Simulations through 2050. It seems reasonable for the District to assume a 4% average for Northern Bexar County Trinity Group of Aquifers recharge, (Mace, et. al. has done this for the Trinity Group of Aquifers as a whole). John Ashworth also developed a similar annual effective recharge coefficient (also 4% of average annual rainfall of about 29.5 inches) for the Trinity Group of Aquifers in the Texas Department of Water Resources Report 273, Ground-Water Availability of the Lower Cretaceous Formations in the Hill Country of South-Central Texas, January 1983.
14
These recharge potentials are not to be confused with “recoverable” groundwater. Not all groundwater is recoverable. Some is lost to spring flow and seeps, some is used by plant life while the water is still near the surface, while some is almost permanently retained within the rock itself. However, water retained within the rock itself is a one-time recharge and should not affect available water from further recharge events. For instance, some areas of the Trinity Group of Aquifers may be a rather “tight” formation, particularly in the vertical direction. The Trinity Group of Aquifers in some areas is known to have low porosity and permeability, limited fracturing and faulting, and a complicated stratigraphy that includes layers of rock that reduce transmissivity and retard downward-moving recharge water. In other areas, dissolution of the limestone, cave/sinkhole formation, faulting, fracturing, higher porosity and permeability increase water movement and transmissivities as well as vertical movement. As a result, individual well yields can be very low to very high. Though large quantities of water may be present in the subsurface, much of the groundwater may be unrecoverable in some areas due to these hydrogeologic conditions while in other areas a large portion of the water is recoverable. As previously mentioned, some water recharging the Trinity Group of Aquifers will be lost, some through biologic uptake and some through discharge at springs and seeps that provide some base flow to local creeks and tributaries. This is water that the aquifer rejects on an average annual basis and is potentially available and can theoretically be retrieved (at least on a short-term basis) without diminishing the average volume of groundwater being recharged to storage or, in other words, without creating a water losing situation within the aquifer. Extensive pumping will also reduce the pressure head and may result in a significantly larger quantity of recharge water actually percolating downward into the aquifer providing recharge that would not be normally available thus providing more reliable, long-term well production. Once pumping exceeds average annual recharge, then the aquifer(s) will be providing water from storage (thought to be a relative large amount) and the groundwater level will decline over time.
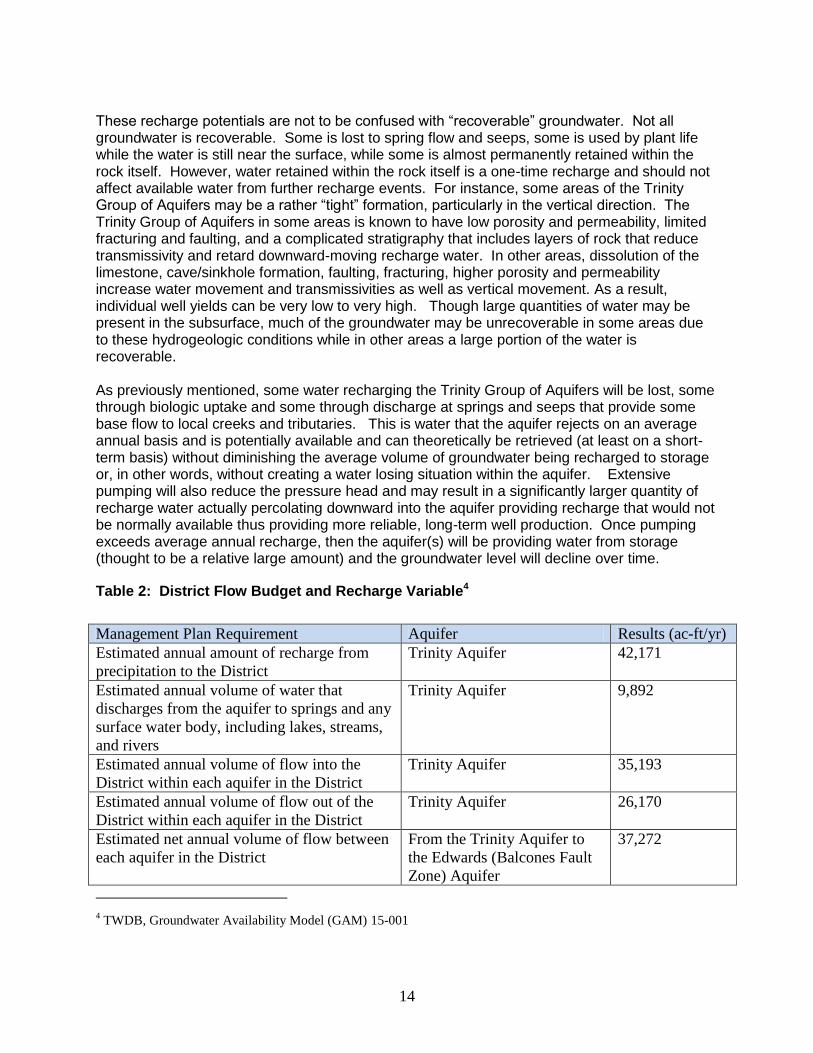
Table 2: District Flow Budget and Recharge Variable4
Management Plan Requirement Aquifer Results (ac-ft/yr)
Estimated annual amount of recharge from
precipitation to the District
Trinity Aquifer 42,171
Estimated annual volume of water that
discharges from the aquifer to springs and any
surface water body, including lakes, streams,
and rivers
Trinity Aquifer 9,892
Estimated annual volume of flow into the
District within each aquifer in the District
Trinity Aquifer 35,193
Estimated annual volume of flow out of the
District within each aquifer in the District
Trinity Aquifer 26,170
Estimated net annual volume of flow between
each aquifer in the District
From the Trinity Aquifer to
the Edwards (Balcones Fault
Zone) Aquifer
37,272
4 TWDB, Groundwater Availability Model (GAM) 15-001
15
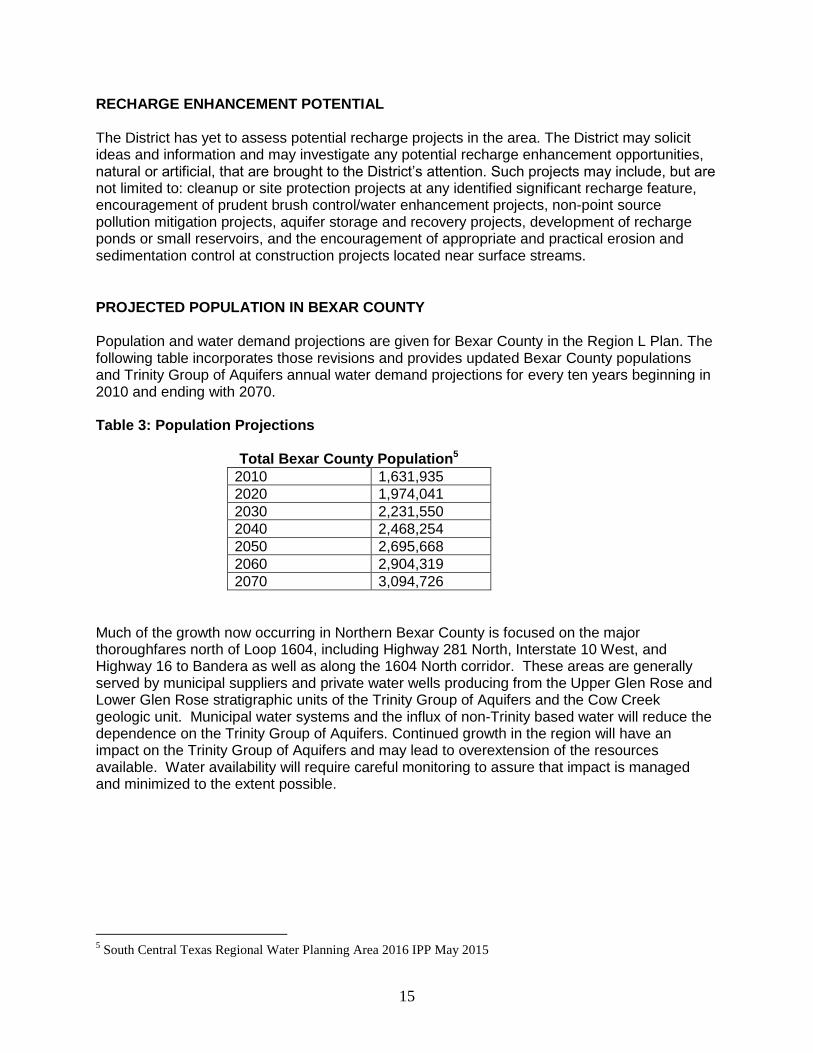
RECHARGE ENHANCEMENT POTENTIAL The District has yet to assess potential recharge projects in the area. The District may solicit ideas and information and may investigate any potential recharge enhancement opportunities, natural or artificial, that are brought to the District’s attention. Such projects may include, but are not limited to: cleanup or site protection projects at any identified significant recharge feature, encouragement of prudent brush control/water enhancement projects, non-point source pollution mitigation projects, aquifer storage and recovery projects, development of recharge ponds or small reservoirs, and the encouragement of appropriate and practical erosion and sedimentation control at construction projects located near surface streams. PROJECTED POPULATION IN BEXAR COUNTY Population and water demand projections are given for Bexar County in the Region L Plan. The following table incorporates those revisions and provides updated Bexar County populations and Trinity Group of Aquifers annual water demand projections for every ten years beginning in 2010 and ending with 2070. Table 3: Population Projections
Total Bexar County Population5
2010 1,631,935
2020 1,974,041
2030 2,231,550
2040 2,468,254
2050 2,695,668
2060 2,904,319
2070 3,094,726
Much of the growth now occurring in Northern Bexar County is focused on the major thoroughfares north of Loop 1604, including Highway 281 North, Interstate 10 West, and Highway 16 to Bandera as well as along the 1604 North corridor. These areas are generally served by municipal suppliers and private water wells producing from the Upper Glen Rose and Lower Glen Rose stratigraphic units of the Trinity Group of Aquifers and the Cow Creek geologic unit. Municipal water systems and the influx of non-Trinity based water will reduce the dependence on the Trinity Group of Aquifers. Continued growth in the region will have an impact on the Trinity Group of Aquifers and may lead to overextension of the resources available. Water availability will require careful monitoring to assure that impact is managed and minimized to the extent possible.
5 South Central Texas Regional Water Planning Area 2016 IPP May 2015
16
ACTIONS, PROCEDURES, PERFORMANCE AND AVOIDANCE NECESSARY TO EFFECTUATE THE MANAGEMENT PLAN The District will manage the supply of groundwater within the District based on the District’s best available data and its assessment of water availability and groundwater storage conditions. The most current Groundwater Availability Model and Managed Available Groundwater developed by the TWDB for the Trinity Group of Aquifers or other groundwater models, as well as other studies performed by other entities, will also aid in the decision making process by the District. The District has adopted Rules that require the permitting of non-exempt wells within the District consistent with the District Management Plan, the provisions of Chapter 36.113, and other pertinent sections of Chapter 36. District Rules can be found at http://www.trinityglenrose.com/#!district-rules/cg6n. The District is in agreement with the commonly accepted groundwater management principle that opposes the mining of groundwater. Therefore, it shall be the policy of the District to limit withdrawal of groundwater from permitted wells producing from Northern Bexar County aquifers to no more than the current groundwater availability volumes indicated for the Trinity Group of Aquifers in this Management Plan unless sufficient data is provided to indicate that water can be removed without causing regional reductions to the aquifer. Development or analysis of new or existing groundwater or aquifer data (MAG revisions) may result in changes to the groundwater availability volumes, with a corresponding change in production limits from the affected aquifers. The District has adopted rules that regulate the production of groundwater consistent with the provisions Chapter 36.116. The District wishes to emphasize that in regulating or limiting groundwater production, it shall be the policy of the District to recognize good scientific data in the development of groundwater usage. The District will implement and utilize the provisions of this groundwater management plan for all District activities. The District’s current and future Rules have and will be promulgated pursuant to the provisions of Texas Water Code Chapter 36 and shall address, implement, and be consistent with the provisions and policies of this plan. The District shall review and re-adopt this plan, with or without revisions, at least once every five years in accordance with Chapter 36.1072(e). Any amendment to this plan shall be in accordance with Chapter 36.1073. The District will seek cooperation and coordination in the development and implementation of this plan with the appropriate state, regional or local water management or planning entities.
The District will monitor groundwater conditions through its water level and water quality monitoring programs. If necessary, the District may, through the rule-making process, identify areas within the District which, based on results from District aquifer monitoring, are identified as Critical Groundwater Depletion Areas (CGDA). These areas, when identified by the District in accordance with District Rules, may require specific pumping limits or reduction measures to ensure that groundwater supply is maintained and protected.
The District will encourage cooperative and voluntary rule compliance, but if rule enforcement becomes necessary, the enforcement will be legal, fair, and impartial.
17
METHODOLOGY FOR TRACKING PROGRESS IN ACHIEVING MANAGEMENT GOALS The District will present an Annual Report to the Board of Directors on District performance and progress in achieving management goals and objectives at the last regular Board meeting of each fiscal year.
18
GROUNDWATER MANAGEMENT GOALS
1.0 Implement management strategies that will provide for the most efficient use of groundwater.
1.1 Management Objective
Implement and maintain a program of issuing well operating permits for non-exempt wells within the District.
Performance Standard
Once the operating permit issuance program is developed, the number of well operating permit applications and the number of permits issued for the year will be included in the Annual Report submitted to the Board of Directors of the District.
1.2 Management Objective
Maintain and regulate well construction and spacing standards through the issuance of well construction permits.
Performance Standard
Require permits for all wells drilled or plugged within the District and maintain a well database. Provide an annual report to the District Board which includes the number of wells drilled and plugged within the District during the past year. Through an interlocal agreement with San Antonio Water System (SAWS) well site inspections are performed before, during, and after the drilling of each new well in the District. Require state well logs and geophysical logs for each well drilled or plugged.
1.3 Management Objective
Collect meter readings and maintain database of monthly well pumping for non-exempt wells within the District. These reports are completed in accordance with the District Rules.
Performance Standard
Minimum of 75% of registered non-exempt well users monthly groundwater pumpage entered into District well production database.
2.0 Implement strategies that will control and prevent waste of groundwater.
2.1 Management Objective
Each year the District will provide to local newspapers or other local media, at least one article describing groundwater waste prevention practices available for implementation by groundwater users.
Performance Standard
19
Number of articles describing groundwater waste prevention submitted to local newspapers and/or local media each year to be included in the annual report submitted to the District Board of Directors.
2.2 Management Objective
Each year, the District will provide information to the public on eliminating or reducing wasteful practices in the use of groundwater by including information on groundwater waste reduction on the District’s website.
Performance Standard
Online resources available on District website addressing groundwater waste reduction practices.
2.3 Management Objective
Make a speaker available to local clubs and organizations or a display booth at public events.
Performance Standard
Number of speaking engagements or booth displays offered each year recorded in the annual report submitted to the District Board of Directors.
2.4 Management Objective
The District will make an annual evaluation of the District Rules and determine if amendments to the District Rules are recommended to prevent or reduce the waste of groundwater in the District.
Performance Standard
Agenda item during at least one meeting of the District Board of Directors to assess the need to amend District Rules to prevent or reduce the waste of groundwater within the District.
3.0 Implement strategies that will control and prevent subsidence.
The rigid geologic framework of the region precludes subsidence from occurring. Therefore, this goal is not applicable to the operations of this District.
4.0 Implement management strategies that will address conjunctive surface water management issues.
4.1 Management Objective
Collaborate with USGS and other agencies through spring surveys and other research projects regarding correlations between spring flow, surface stream elevations/flows, rainfall, and groundwater levels.
Performance Standard
20
Evaluate need throughout the year to conduct research and/or partner with other agencies to gather conjunctive surface water data and submit research recommendations to District Board of Directors annually.
5.0 Implement strategies that will address natural resource issues which impact the use and availability of groundwater, or which are impacted by the use of groundwater.
5.1 Management Objective
Partner with the Texas Stream Team at The Meadows Center for Water and the Environment to monitor water quality values for the Upper Cibolo Creek Watershed which provides local recharge to the Trinity Aquifers in Northern Bexar County.
Performance Standard
Continue to provide annual monetary contributions for the purchase of water quality testing supplies. Inform Board of Directors of any areas of concern related to water quality that may arise through testing during regular monthly board meetings. Continue to encourage public involvement during the public comment period at each District meeting of the Board of Directors to bring forward any additional natural resource issues.
6.0 Implement strategies that will address drought conditions.
6.1 Management Objective
Review Palmer Drought Severity Index (PDSI) posted on the National Weather Service - Climate Prediction Center website on a monthly basis.
Performance Standard
Report drought conditions to the District Board of Directors at least quarterly.
6.2 Management Objective
Provide and post drought-orientated literature on the District’s website.
Performance Standard
Drought-orientated literature posted on the District’s website. Place a link to the Texas Water Development Board drought information page (http://waterdatafortexas.org/drought/) on District website.
6.3 Management Objective
The District will collect water levels on selected monitor wells representative of the major aquifer within the District.
21
Performance Standard
Report monitor well network levels to the District Board of Directors at least quarterly to determine the need to implement drought contingency plan.
6.4 Management Objective
Monitor compliance of non-exempt wells with District’s Drought Contingency Plan once trigger conditions are reached.
Performance Standard
Preparation and distribution of Press Releases and District water restriction requirements to District water users.
7.0 Implement strategies that will address:
Conservation
7.1 Management Objective
Each year the District will provide local newspaper or media with at least one article identifying the importance of water conservation and water conservation methods.
Performance Standard
A copy of the article(s) regarding water conservation submitted each year will be included in the Annual Report to the District Board of Directors.
7.2 Management Objective
Provide water conservation guideline and resource links on the District’s website.
Performance Standard
Conservation guidelines and links posted on the District’s website.
7.3 Management Objective
Provide to the public, upon request, or during public outreach events, conservation literature handouts.
Performance Standard
Number of conservation handouts requested per year included in the Annual Report to the District Board of Directors.
Recharge Enhancement
7.4 Management Objective
Investigate potential natural or artificial recharge enhancement projects.
Performance Standard
22
Annually report to Board of Directors any potential recharge enhancement projects District is made aware of.
Rainwater Harvesting
7.5 Management Objective
Support efforts by encouraging rainwater harvesting and providing rainwater harvesting information to the public.
Performance Standard
Maintain brochures that are available to the public at the District office and have brochures available at public events.
Precipitation Enhancement
Not applicable to include since this objective is not cost effective at this time.
Brush Control
7.6 Management Objective
The District will encourage brush control and Best Management Practices related
to the same where appropriate.
Performance Standard
Annually, the District will conduct a review of the policies adopted by the District
related to brush control practices and/or the progression of brush control within
the District. A copy of the review will be included in the annual report to the
District Board of Directors. If it is found from review that no policies that relate to
brush control practices were adopted by the District during the previous year,
then a statement of such will be included in the annual report.
8.0 Addressing Desired Future Conditions in a quantitative manner
Management Objective
The District will monitor the static water level in the Trinity Aquifer to ensure the
achievement of the adopted DFC.
Performance Standard

23
The District will monitor the static water level in the Trinity Aquifer on a bimonthly
basis. The data will be presented to the District Board of Directors in an annual
report.
24
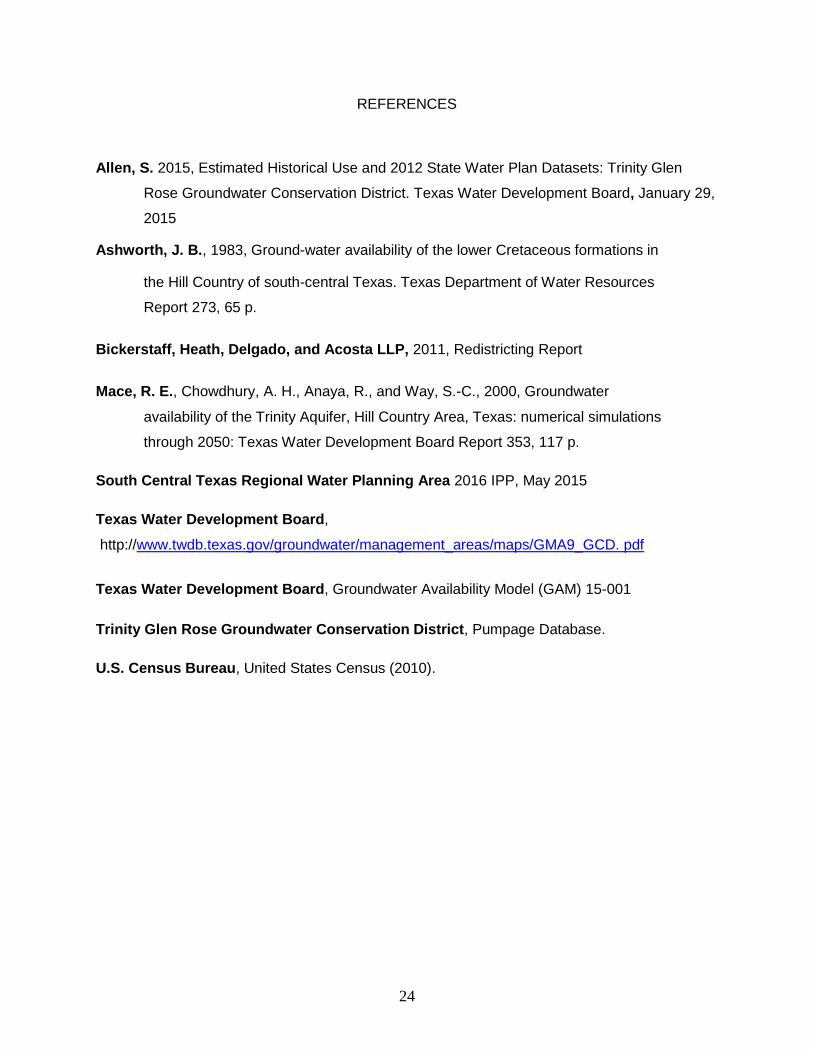
REFERENCES
Allen, S. 2015, Estimated Historical Use and 2012 State Water Plan Datasets: Trinity Glen
Rose Groundwater Conservation District. Texas Water Development Board, January 29,
2015
Ashworth, J. B., 1983, Ground-water availability of the lower Cretaceous formations in
the Hill Country of south-central Texas. Texas Department of Water Resources
Report 273, 65 p.
Bickerstaff, Heath, Delgado, and Acosta LLP, 2011, Redistricting Report
Mace, R. E., Chowdhury, A. H., Anaya, R., and Way, S.-C., 2000, Groundwater
availability of the Trinity Aquifer, Hill Country Area, Texas: numerical simulations
through 2050: Texas Water Development Board Report 353, 117 p.
South Central Texas Regional Water Planning Area 2016 IPP, May 2015
Texas Water Development Board,
http://www.twdb.texas.gov/groundwater/management_areas/maps/GMA9_GCD. pdf
Texas Water Development Board, Groundwater Availability Model (GAM) 15-001
Trinity Glen Rose Groundwater Conservation District, Pumpage Database.
U.S. Census Bureau, United States Census (2010).
25
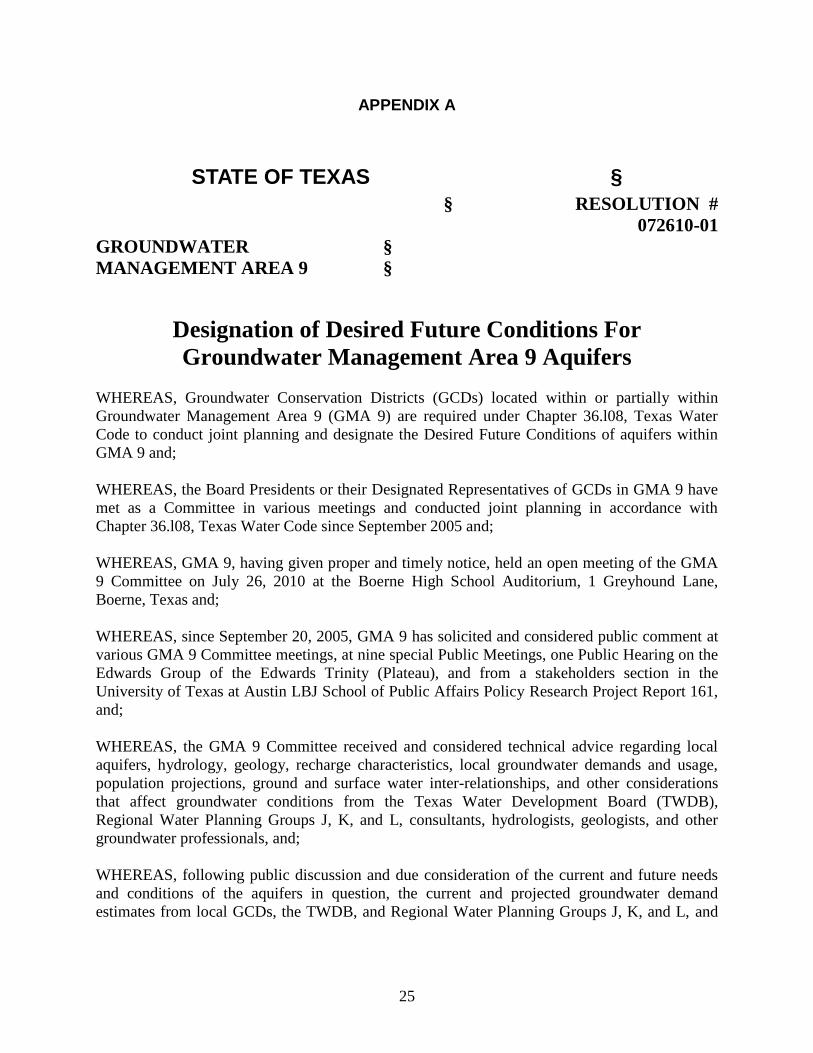
APPENDIX A
STATE OF TEXAS §
§ RESOLUTION #
072610-01
GROUNDWATER §
MANAGEMENT AREA 9 §
Designation of Desired Future Conditions For
Groundwater Management Area 9 Aquifers
WHEREAS, Groundwater Conservation Districts (GCDs) located within or partially within
Groundwater Management Area 9 (GMA 9) are required under Chapter 36.l08, Texas Water
Code to conduct joint planning and designate the Desired Future Conditions of aquifers within
GMA 9 and;
WHEREAS, the Board Presidents or their Designated Representatives of GCDs in GMA 9 have
met as a Committee in various meetings and conducted joint planning in accordance with
Chapter 36.l08, Texas Water Code since September 2005 and;
WHEREAS, GMA 9, having given proper and timely notice, held an open meeting of the GMA
9 Committee on July 26, 2010 at the Boerne High School Auditorium, 1 Greyhound Lane,
Boerne, Texas and;
WHEREAS, since September 20, 2005, GMA 9 has solicited and considered public comment at
various GMA 9 Committee meetings, at nine special Public Meetings, one Public Hearing on the
Edwards Group of the Edwards Trinity (Plateau), and from a stakeholders section in the
University of Texas at Austin LBJ School of Public Affairs Policy Research Project Report 161,
and;
WHEREAS, the GMA 9 Committee received and considered technical advice regarding local
aquifers, hydrology, geology, recharge characteristics, local groundwater demands and usage,
population projections, ground and surface water inter-relationships, and other considerations
that affect groundwater conditions from the Texas Water Development Board (TWDB),
Regional Water Planning Groups J, K, and L, consultants, hydrologists, geologists, and other
groundwater professionals, and;
WHEREAS, following public discussion and due consideration of the current and future needs
and conditions of the aquifers in question, the current and projected groundwater demand
estimates from local GCDs, the TWDB, and Regional Water Planning Groups J, K, and L, and
26
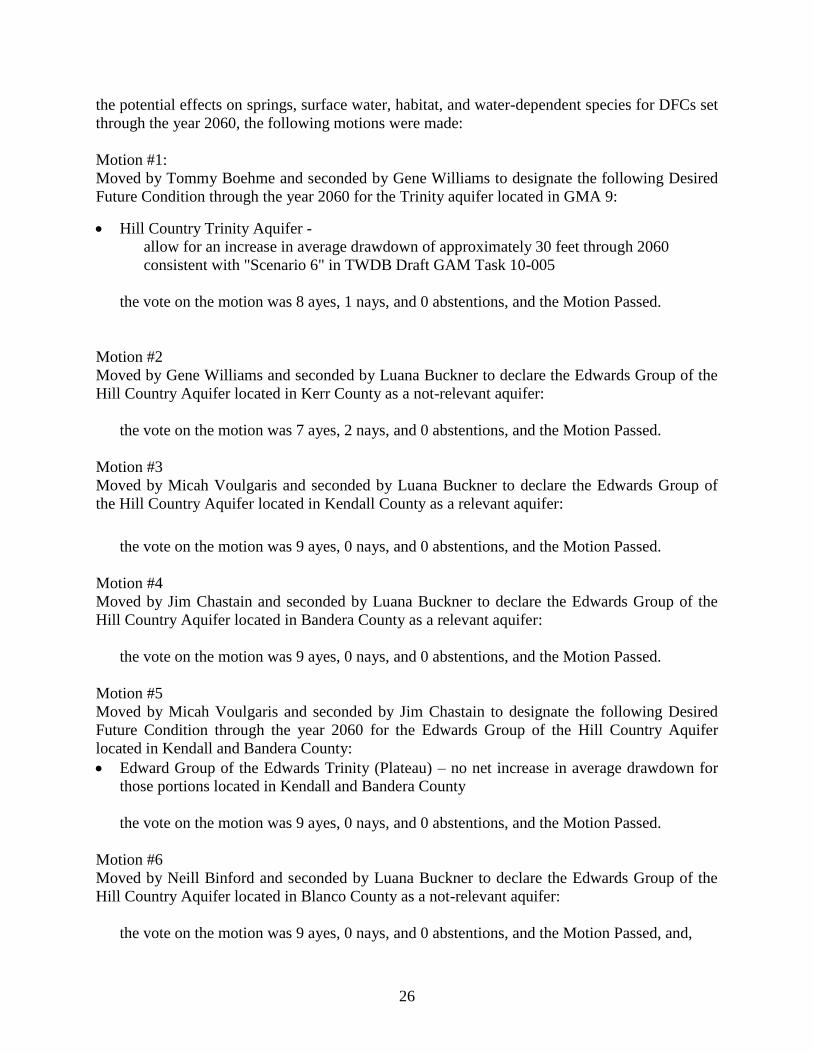
the potential effects on springs, surface water, habitat, and water-dependent species for DFCs set
through the year 2060, the following motions were made:
Motion #1:
Moved by Tommy Boehme and seconded by Gene Williams to designate the following Desired
Future Condition through the year 2060 for the Trinity aquifer located in GMA 9:
Hill Country Trinity Aquifer -
allow for an increase in average drawdown of approximately 30 feet through 2060
consistent with "Scenario 6" in TWDB Draft GAM Task 10-005
the vote on the motion was 8 ayes, 1 nays, and 0 abstentions, and the Motion Passed.
Motion #2
Moved by Gene Williams and seconded by Luana Buckner to declare the Edwards Group of the
Hill Country Aquifer located in Kerr County as a not-relevant aquifer:
the vote on the motion was 7 ayes, 2 nays, and 0 abstentions, and the Motion Passed.
Motion #3
Moved by Micah Voulgaris and seconded by Luana Buckner to declare the Edwards Group of
the Hill Country Aquifer located in Kendall County as a relevant aquifer:
the vote on the motion was 9 ayes, 0 nays, and 0 abstentions, and the Motion Passed.
Motion #4
Moved by Jim Chastain and seconded by Luana Buckner to declare the Edwards Group of the
Hill Country Aquifer located in Bandera County as a relevant aquifer:
the vote on the motion was 9 ayes, 0 nays, and 0 abstentions, and the Motion Passed.
Motion #5
Moved by Micah Voulgaris and seconded by Jim Chastain to designate the following Desired
Future Condition through the year 2060 for the Edwards Group of the Hill Country Aquifer
located in Kendall and Bandera County:
Edward Group of the Edwards Trinity (Plateau) – no net increase in average drawdown for
those portions located in Kendall and Bandera County
the vote on the motion was 9 ayes, 0 nays, and 0 abstentions, and the Motion Passed.
Motion #6
Moved by Neill Binford and seconded by Luana Buckner to declare the Edwards Group of the
Hill Country Aquifer located in Blanco County as a not-relevant aquifer:
the vote on the motion was 9 ayes, 0 nays, and 0 abstentions, and the Motion Passed, and,
27
Whereas, the above Motions and votes of each Committee Member have been recorded in the
Minutes of the July 26, 2010 GMA 9 Committee Meeting,
NOW THEREFORE BE IT RESOLVED, Groundwater Management Area 9 Committee
Members present and voting on July 26, 2010 do hereby document, record, and confirm the
above described Motions and votes.
Approved by consensus and signed on July 26, 2010 by the following Voting GMA 9 Committee
Members,
Neill Binford - President of the Blanco Pedernales GCD
Jim Chastain - President of the Bandera County River Authority and Groundwater Conservation
District
Tommy Boehme - President of the Medina County GCD
Jimmy Skipton - President of the Hays Trinity GCD
Brian Hunt - Designated Representative for the Barton Springs/Edwards Aquifer Conservation
District
Micah Voulgaris – General Manager and Designated Representative for the Cow Creek GCD
Jorge Gonzales – Vice President and Designated Representative for the Trinity Glen Rose GCD
Luana Buckner - Chairman of the Edwards Aquifer Authority
Gene Williams - Designated Representative for the Headwaters GCD
28
Appendix B – Estimated Historical Groundwater Use and 2012 State Water Plan Datasets: Trinity Glen Rose Groundwater Conservation District6
6 Data compiled and distributed to TGRGCD by TWDB, Stephen Allen, 09/21/15
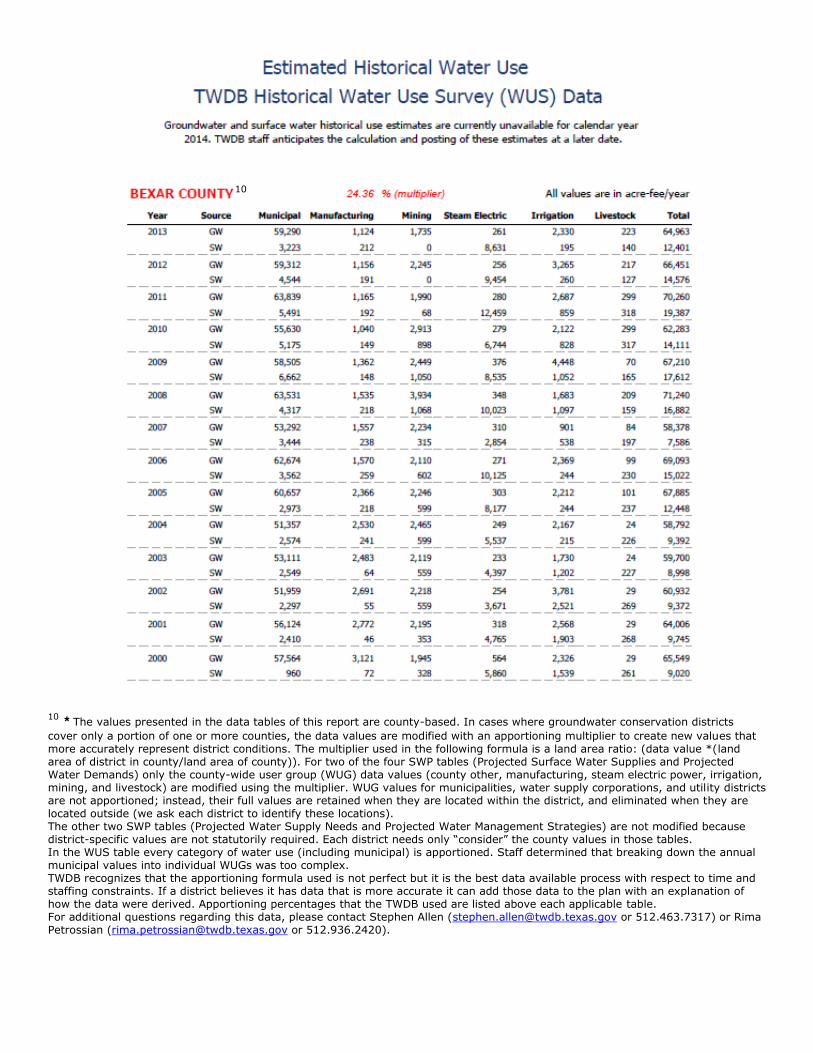
10 * The values presented in the data tables of this report are county-based. In cases where groundwater conservation districts
cover only a portion of one or more counties, the data values are modified with an apportioning multiplier to create new values that more accurately represent district conditions. The multiplier used in the following formula is a land area ratio: (data value *(land area of district in county/land area of county)). For two of the four SWP tables (Projected Surface Water Supplies and Projected Water Demands) only the county-wide user group (WUG) data values (county other, manufacturing, steam electric power, irrigation, mining, and livestock) are modified using the multiplier. WUG values for municipalities, water supply corporations, and utility districts are not apportioned; instead, their full values are retained when they are located within the district, and eliminated when they are located outside (we ask each district to identify these locations). The other two SWP tables (Projected Water Supply Needs and Projected Water Management Strategies) are not modified because district-specific values are not statutorily required. Each district needs only “consider” the county values in those tables. In the WUS table every category of water use (including municipal) is apportioned. Staff determined that breaking down the annual municipal values into individual WUGs was too complex. TWDB recognizes that the apportioning formula used is not perfect but it is the best data available process with respect to time and staffing constraints. If a district believes it has data that is more accurate it can add those data to the plan with an explanation of how the data were derived. Apportioning percentages that the TWDB used are listed above each applicable table. For additional questions regarding this data, please contact Stephen Allen ([email protected] or 512.463.7317) or Rima Petrossian ([email protected] or 512.936.2420).
10
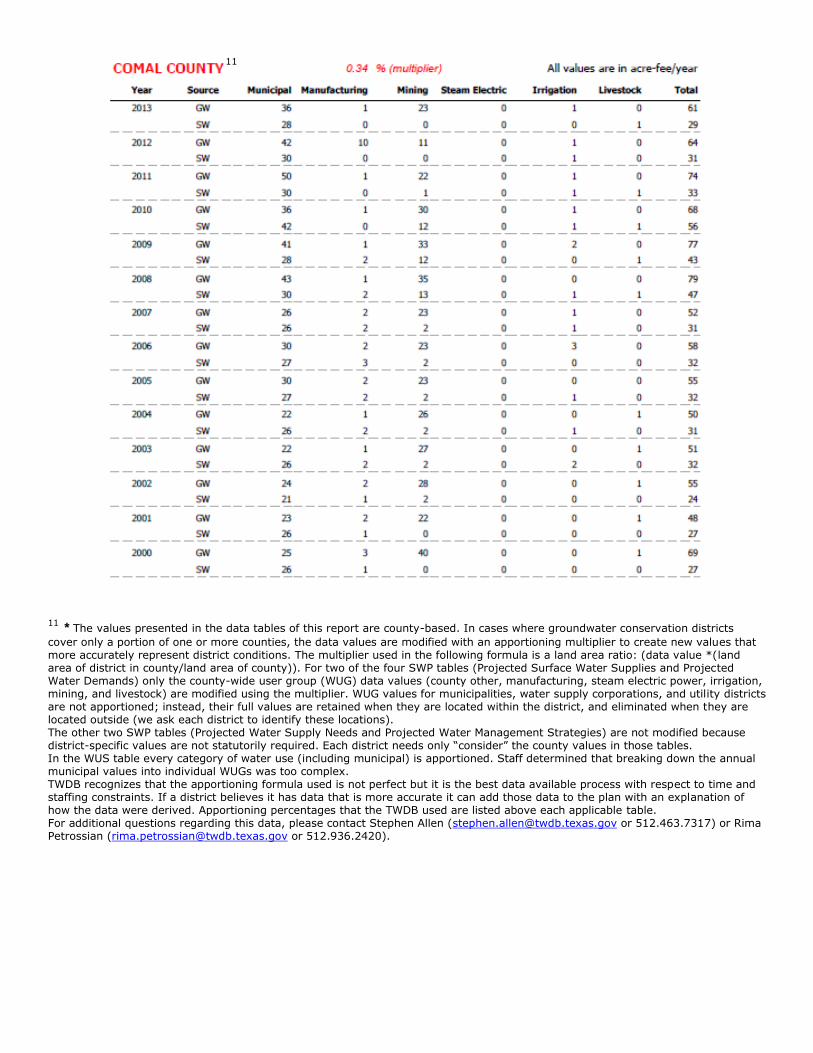
11 * The values presented in the data tables of this report are county-based. In cases where groundwater conservation districts
cover only a portion of one or more counties, the data values are modified with an apportioning multiplier to create new values that more accurately represent district conditions. The multiplier used in the following formula is a land area ratio: (data value *(land area of district in county/land area of county)). For two of the four SWP tables (Projected Surface Water Supplies and Projected Water Demands) only the county-wide user group (WUG) data values (county other, manufacturing, steam electric power, irrigation, mining, and livestock) are modified using the multiplier. WUG values for municipalities, water supply corporations, and utility districts are not apportioned; instead, their full values are retained when they are located within the district, and eliminated when they are located outside (we ask each district to identify these locations). The other two SWP tables (Projected Water Supply Needs and Projected Water Management Strategies) are not modified because district-specific values are not statutorily required. Each district needs only “consider” the county values in those tables. In the WUS table every category of water use (including municipal) is apportioned. Staff determined that breaking down the annual municipal values into individual WUGs was too complex. TWDB recognizes that the apportioning formula used is not perfect but it is the best data available process with respect to time and staffing constraints. If a district believes it has data that is more accurate it can add those data to the plan with an explanation of how the data were derived. Apportioning percentages that the TWDB used are listed above each applicable table. For additional questions regarding this data, please contact Stephen Allen ([email protected] or 512.463.7317) or Rima Petrossian ([email protected] or 512.936.2420).
11
31
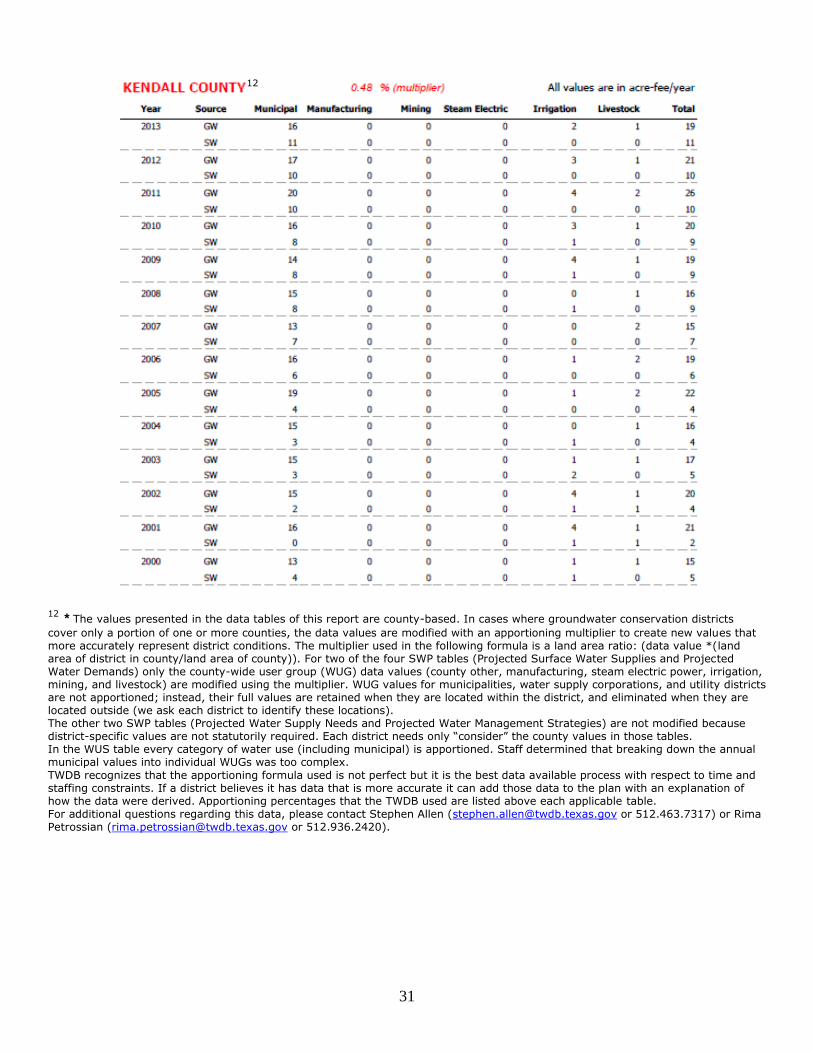
12 * The values presented in the data tables of this report are county-based. In cases where groundwater conservation districts
cover only a portion of one or more counties, the data values are modified with an apportioning multiplier to create new values that more accurately represent district conditions. The multiplier used in the following formula is a land area ratio: (data value *(land area of district in county/land area of county)). For two of the four SWP tables (Projected Surface Water Supplies and Projected Water Demands) only the county-wide user group (WUG) data values (county other, manufacturing, steam electric power, irrigation, mining, and livestock) are modified using the multiplier. WUG values for municipalities, water supply corporations, and utility districts are not apportioned; instead, their full values are retained when they are located within the district, and eliminated when they are located outside (we ask each district to identify these locations). The other two SWP tables (Projected Water Supply Needs and Projected Water Management Strategies) are not modified because district-specific values are not statutorily required. Each district needs only “consider” the county values in those tables. In the WUS table every category of water use (including municipal) is apportioned. Staff determined that breaking down the annual municipal values into individual WUGs was too complex.
TWDB recognizes that the apportioning formula used is not perfect but it is the best data available process with respect to time and staffing constraints. If a district believes it has data that is more accurate it can add those data to the plan with an explanation of how the data were derived. Apportioning percentages that the TWDB used are listed above each applicable table. For additional questions regarding this data, please contact Stephen Allen ([email protected] or 512.463.7317) or Rima Petrossian ([email protected] or 512.936.2420).
12
32
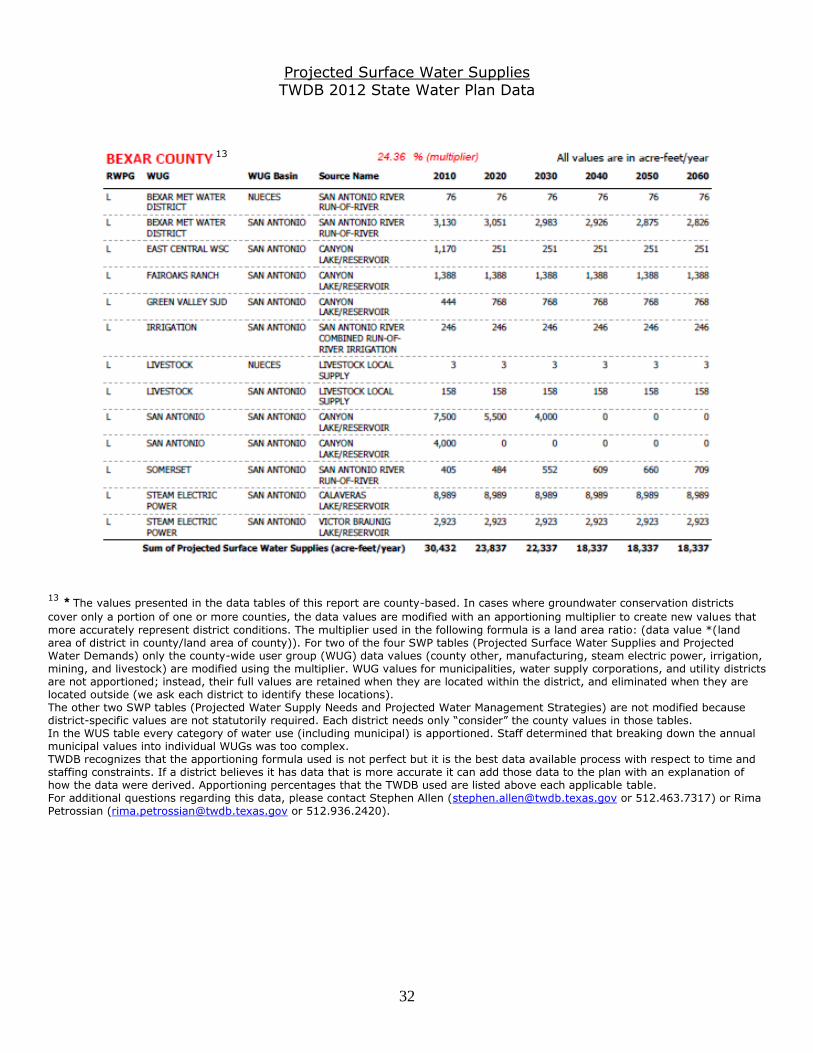
Projected Surface Water Supplies TWDB 2012 State Water Plan Data
13 * The values presented in the data tables of this report are county-based. In cases where groundwater conservation districts
cover only a portion of one or more counties, the data values are modified with an apportioning multiplier to create new values that
more accurately represent district conditions. The multiplier used in the following formula is a land area ratio: (data value *(land area of district in county/land area of county)). For two of the four SWP tables (Projected Surface Water Supplies and Projected Water Demands) only the county-wide user group (WUG) data values (county other, manufacturing, steam electric power, irrigation, mining, and livestock) are modified using the multiplier. WUG values for municipalities, water supply corporations, and utility districts are not apportioned; instead, their full values are retained when they are located within the district, and eliminated when they are located outside (we ask each district to identify these locations). The other two SWP tables (Projected Water Supply Needs and Projected Water Management Strategies) are not modified because district-specific values are not statutorily required. Each district needs only “consider” the county values in those tables. In the WUS table every category of water use (including municipal) is apportioned. Staff determined that breaking down the annual municipal values into individual WUGs was too complex. TWDB recognizes that the apportioning formula used is not perfect but it is the best data available process with respect to time and staffing constraints. If a district believes it has data that is more accurate it can add those data to the plan with an explanation of how the data were derived. Apportioning percentages that the TWDB used are listed above each applicable table. For additional questions regarding this data, please contact Stephen Allen ([email protected] or 512.463.7317) or Rima Petrossian ([email protected] or 512.936.2420).
13
33
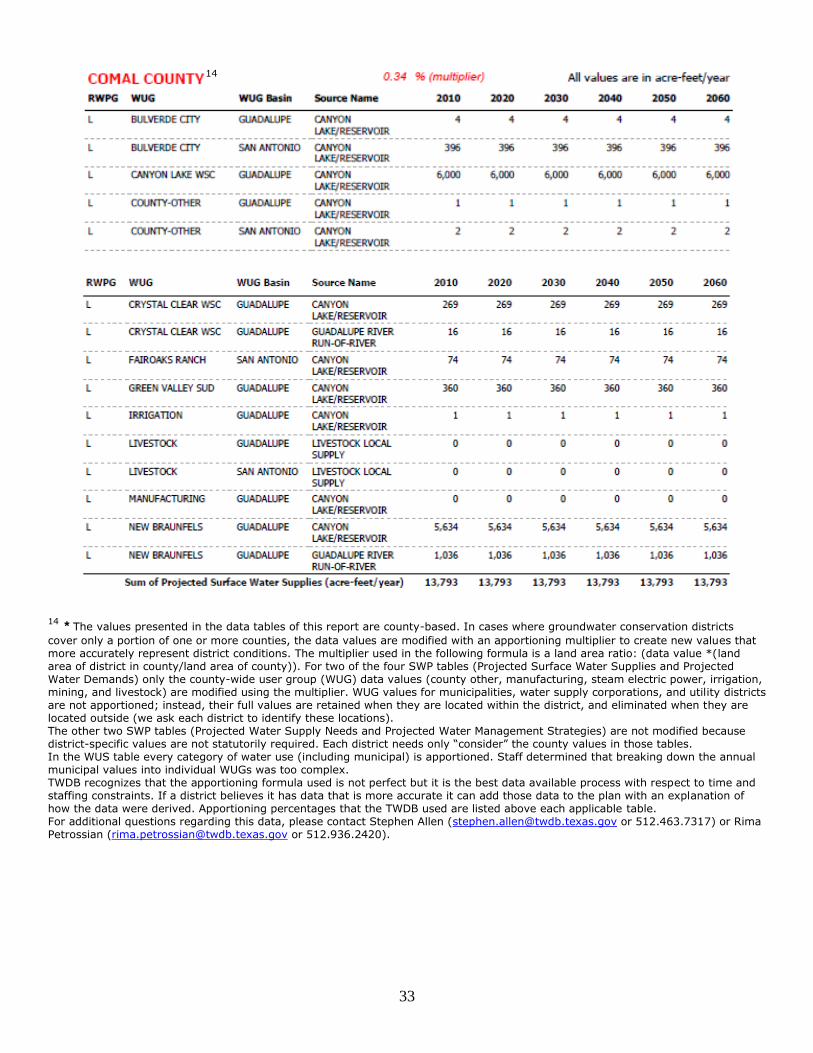
14 * The values presented in the data tables of this report are county-based. In cases where groundwater conservation districts
cover only a portion of one or more counties, the data values are modified with an apportioning multiplier to create new values that more accurately represent district conditions. The multiplier used in the following formula is a land area ratio: (data value *(land area of district in county/land area of county)). For two of the four SWP tables (Projected Surface Water Supplies and Projected Water Demands) only the county-wide user group (WUG) data values (county other, manufacturing, steam electric power, irrigation, mining, and livestock) are modified using the multiplier. WUG values for municipalities, water supply corporations, and utility districts are not apportioned; instead, their full values are retained when they are located within the district, and eliminated when they are located outside (we ask each district to identify these locations). The other two SWP tables (Projected Water Supply Needs and Projected Water Management Strategies) are not modified because district-specific values are not statutorily required. Each district needs only “consider” the county values in those tables. In the WUS table every category of water use (including municipal) is apportioned. Staff determined that breaking down the annual municipal values into individual WUGs was too complex. TWDB recognizes that the apportioning formula used is not perfect but it is the best data available process with respect to time and staffing constraints. If a district believes it has data that is more accurate it can add those data to the plan with an explanation of how the data were derived. Apportioning percentages that the TWDB used are listed above each applicable table. For additional questions regarding this data, please contact Stephen Allen ([email protected] or 512.463.7317) or Rima Petrossian ([email protected] or 512.936.2420).
14
34
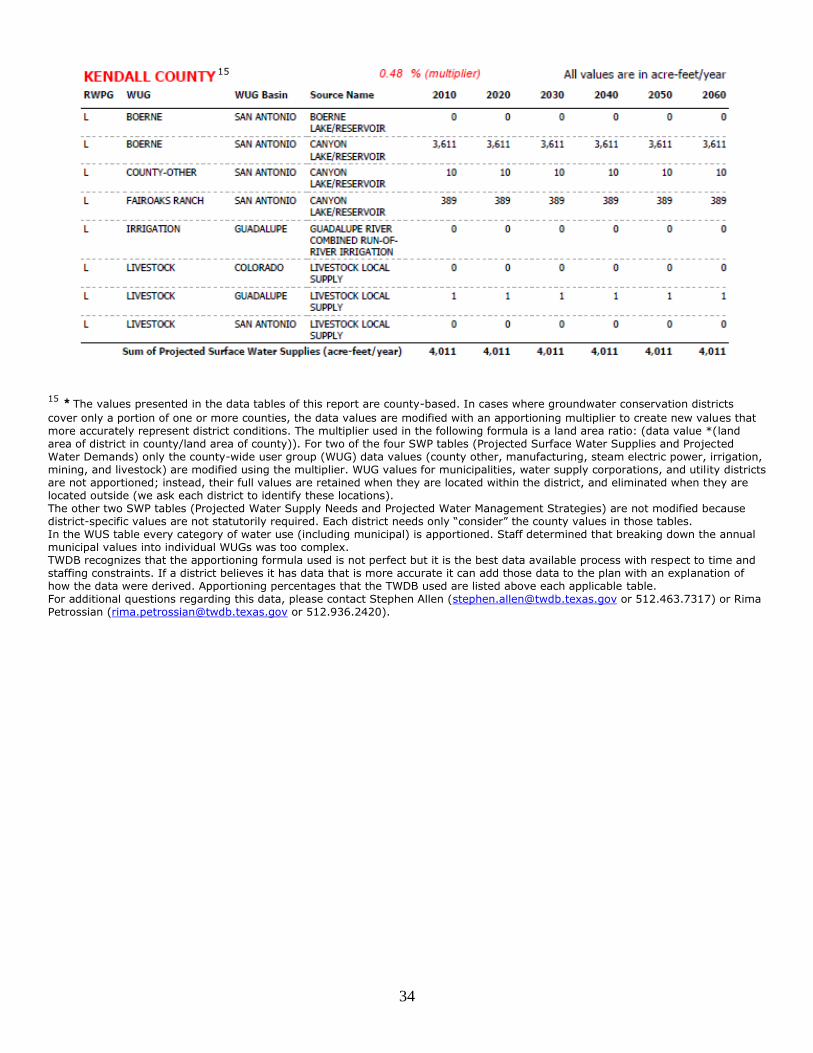
15 * The values presented in the data tables of this report are county-based. In cases where groundwater conservation districts
cover only a portion of one or more counties, the data values are modified with an apportioning multiplier to create new values that more accurately represent district conditions. The multiplier used in the following formula is a land area ratio: (data value *(land area of district in county/land area of county)). For two of the four SWP tables (Projected Surface Water Supplies and Projected Water Demands) only the county-wide user group (WUG) data values (county other, manufacturing, steam electric power, irrigation, mining, and livestock) are modified using the multiplier. WUG values for municipalities, water supply corporations, and utility districts are not apportioned; instead, their full values are retained when they are located within the district, and eliminated when they are located outside (we ask each district to identify these locations). The other two SWP tables (Projected Water Supply Needs and Projected Water Management Strategies) are not modified because district-specific values are not statutorily required. Each district needs only “consider” the county values in those tables. In the WUS table every category of water use (including municipal) is apportioned. Staff determined that breaking down the annual municipal values into individual WUGs was too complex. TWDB recognizes that the apportioning formula used is not perfect but it is the best data available process with respect to time and staffing constraints. If a district believes it has data that is more accurate it can add those data to the plan with an explanation of how the data were derived. Apportioning percentages that the TWDB used are listed above each applicable table. For additional questions regarding this data, please contact Stephen Allen ([email protected] or 512.463.7317) or Rima Petrossian ([email protected] or 512.936.2420).
15
35
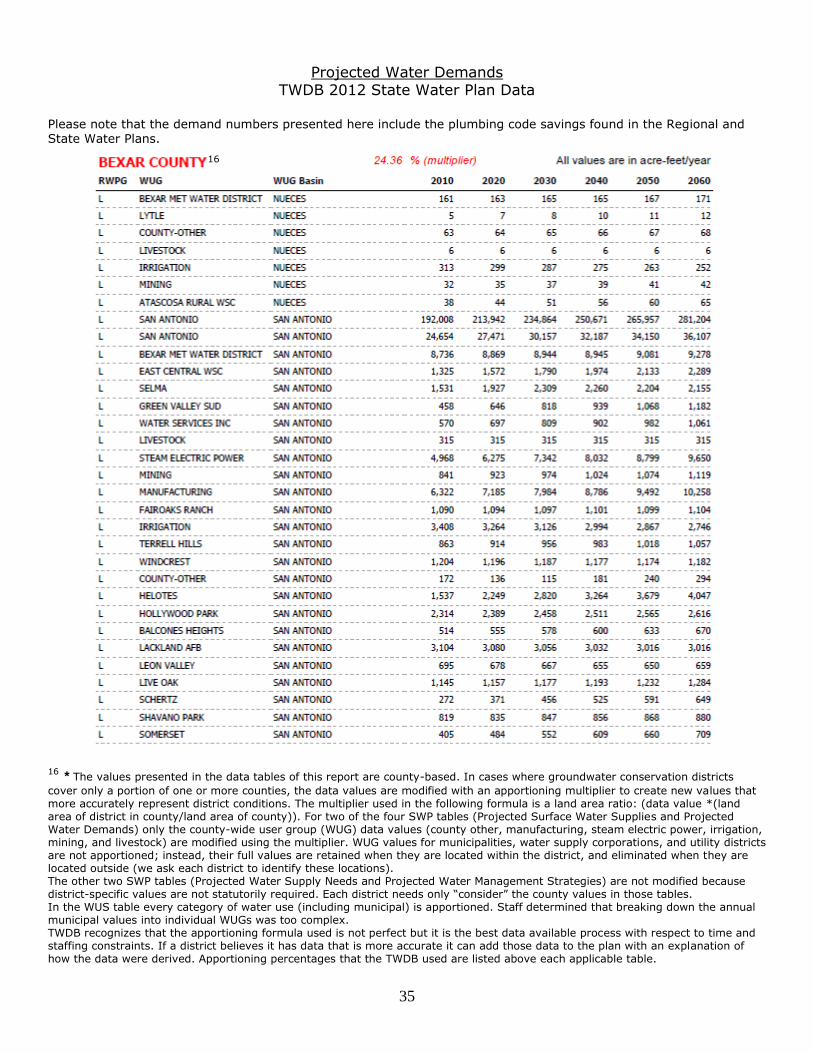
Projected Water Demands TWDB 2012 State Water Plan Data
Please note that the demand numbers presented here include the plumbing code savings found in the Regional and State Water Plans.
16 * The values presented in the data tables of this report are county-based. In cases where groundwater conservation districts
cover only a portion of one or more counties, the data values are modified with an apportioning multiplier to create new values that more accurately represent district conditions. The multiplier used in the following formula is a land area ratio: (data value *(land area of district in county/land area of county)). For two of the four SWP tables (Projected Surface Water Supplies and Projected Water Demands) only the county-wide user group (WUG) data values (county other, manufacturing, steam electric power, irrigation, mining, and livestock) are modified using the multiplier. WUG values for municipalities, water supply corporations, and utility districts are not apportioned; instead, their full values are retained when they are located within the district, and eliminated when they are located outside (we ask each district to identify these locations). The other two SWP tables (Projected Water Supply Needs and Projected Water Management Strategies) are not modified because district-specific values are not statutorily required. Each district needs only “consider” the county values in those tables. In the WUS table every category of water use (including municipal) is apportioned. Staff determined that breaking down the annual municipal values into individual WUGs was too complex. TWDB recognizes that the apportioning formula used is not perfect but it is the best data available process with respect to time and staffing constraints. If a district believes it has data that is more accurate it can add those data to the plan with an explanation of how the data were derived. Apportioning percentages that the TWDB used are listed above each applicable table.
16
36
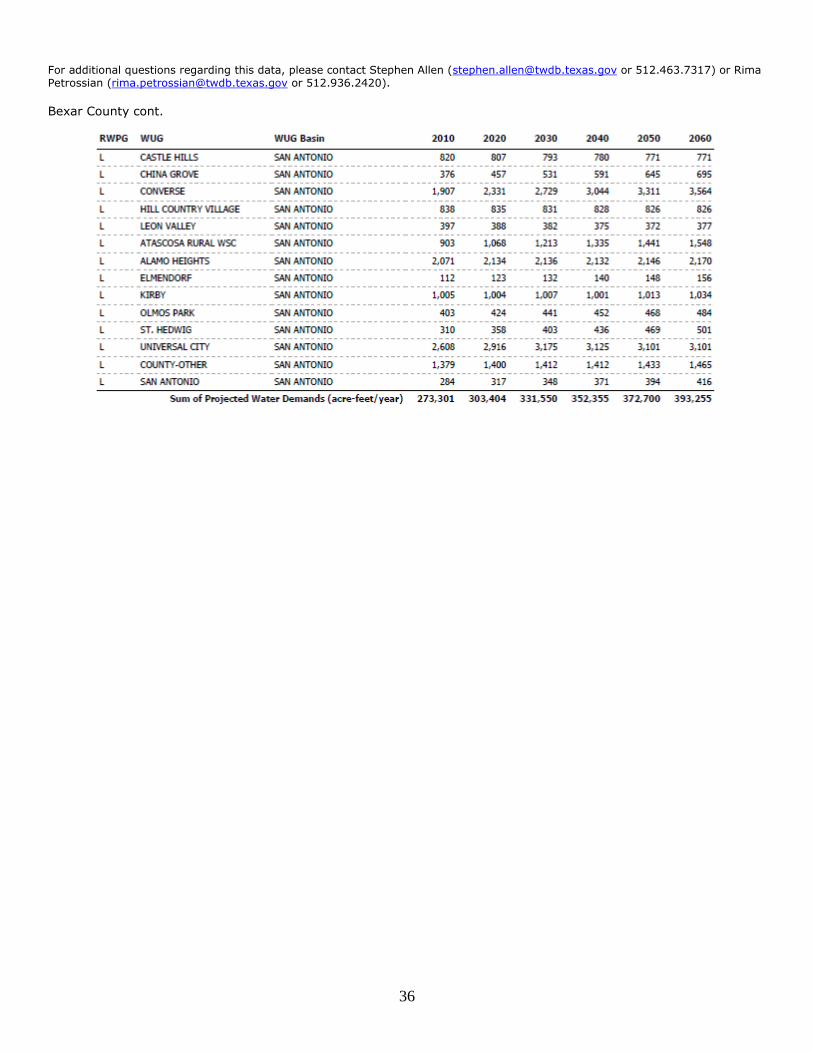
For additional questions regarding this data, please contact Stephen Allen ([email protected] or 512.463.7317) or Rima Petrossian ([email protected] or 512.936.2420).
Bexar County cont.
37
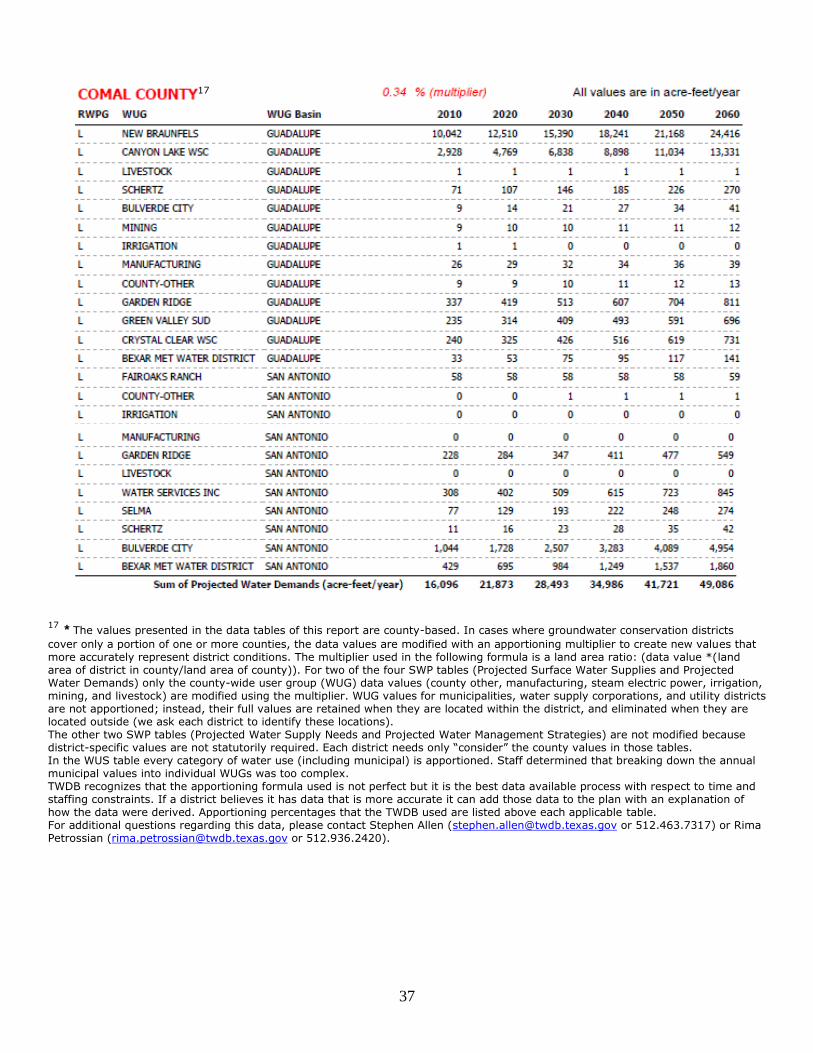
17 * The values presented in the data tables of this report are county-based. In cases where groundwater conservation districts
cover only a portion of one or more counties, the data values are modified with an apportioning multiplier to create new values that more accurately represent district conditions. The multiplier used in the following formula is a land area ratio: (data value *(land area of district in county/land area of county)). For two of the four SWP tables (Projected Surface Water Supplies and Projected Water Demands) only the county-wide user group (WUG) data values (county other, manufacturing, steam electric power, irrigation, mining, and livestock) are modified using the multiplier. WUG values for municipalities, water supply corporations, and utility districts are not apportioned; instead, their full values are retained when they are located within the district, and eliminated when they are located outside (we ask each district to identify these locations). The other two SWP tables (Projected Water Supply Needs and Projected Water Management Strategies) are not modified because district-specific values are not statutorily required. Each district needs only “consider” the county values in those tables. In the WUS table every category of water use (including municipal) is apportioned. Staff determined that breaking down the annual municipal values into individual WUGs was too complex. TWDB recognizes that the apportioning formula used is not perfect but it is the best data available process with respect to time and staffing constraints. If a district believes it has data that is more accurate it can add those data to the plan with an explanation of how the data were derived. Apportioning percentages that the TWDB used are listed above each applicable table. For additional questions regarding this data, please contact Stephen Allen ([email protected] or 512.463.7317) or Rima Petrossian ([email protected] or 512.936.2420).
17
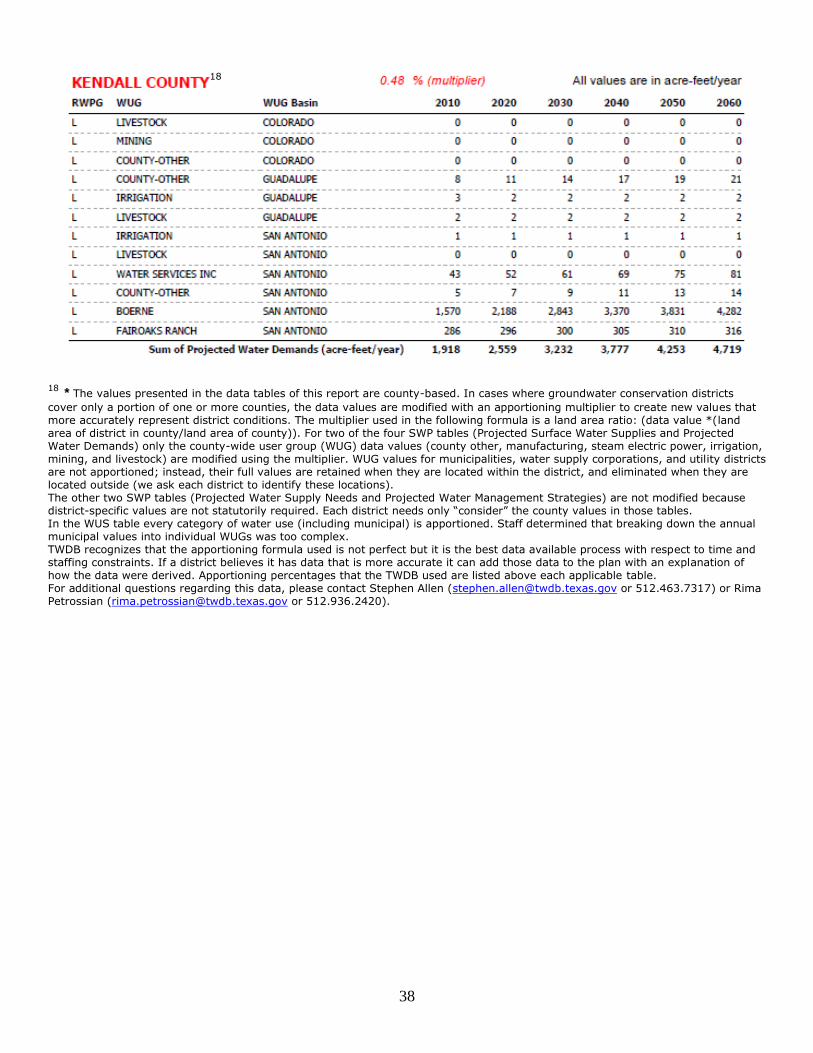
38
18 * The values presented in the data tables of this report are county-based. In cases where groundwater conservation districts
cover only a portion of one or more counties, the data values are modified with an apportioning multiplier to create new values that more accurately represent district conditions. The multiplier used in the following formula is a land area ratio: (data value *(land area of district in county/land area of county)). For two of the four SWP tables (Projected Surface Water Supplies and Projected Water Demands) only the county-wide user group (WUG) data values (county other, manufacturing, steam electric power, irrigation, mining, and livestock) are modified using the multiplier. WUG values for municipalities, water supply corporations, and utility districts are not apportioned; instead, their full values are retained when they are located within the district, and eliminated when they are located outside (we ask each district to identify these locations). The other two SWP tables (Projected Water Supply Needs and Projected Water Management Strategies) are not modified because district-specific values are not statutorily required. Each district needs only “consider” the county values in those tables. In the WUS table every category of water use (including municipal) is apportioned. Staff determined that breaking down the annual municipal values into individual WUGs was too complex. TWDB recognizes that the apportioning formula used is not perfect but it is the best data available process with respect to time and staffing constraints. If a district believes it has data that is more accurate it can add those data to the plan with an explanation of how the data were derived. Apportioning percentages that the TWDB used are listed above each applicable table. For additional questions regarding this data, please contact Stephen Allen ([email protected] or 512.463.7317) or Rima Petrossian ([email protected] or 512.936.2420).
18
39
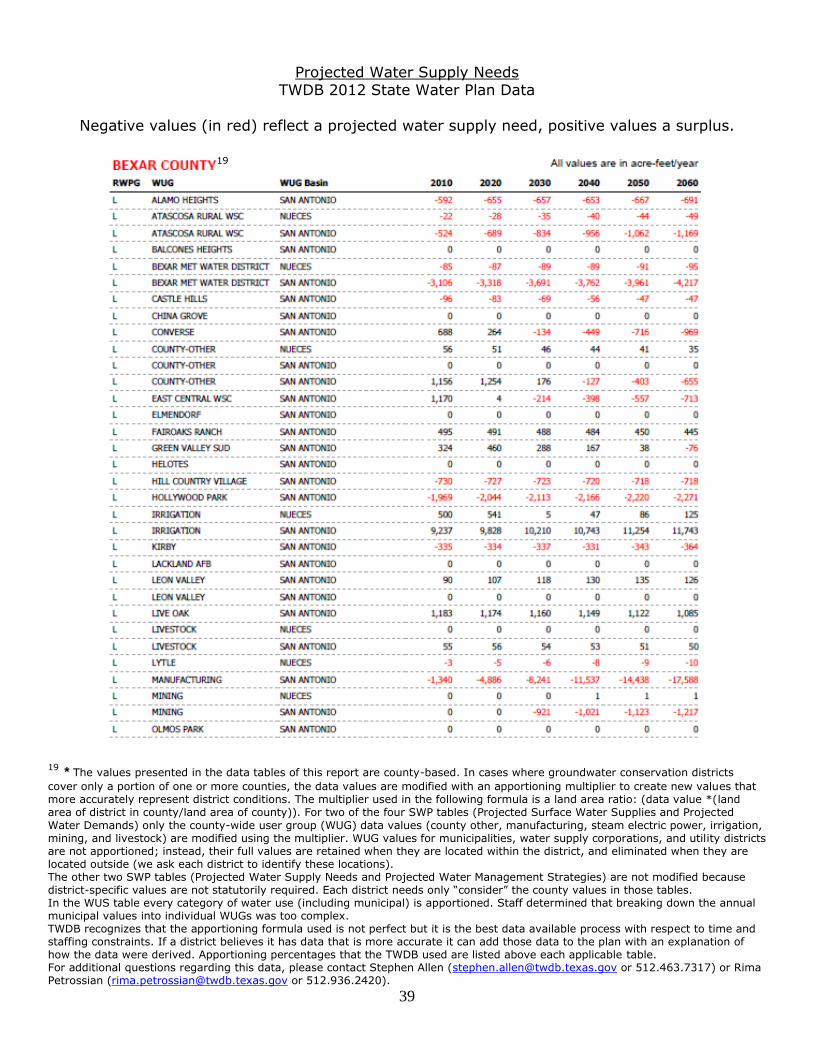
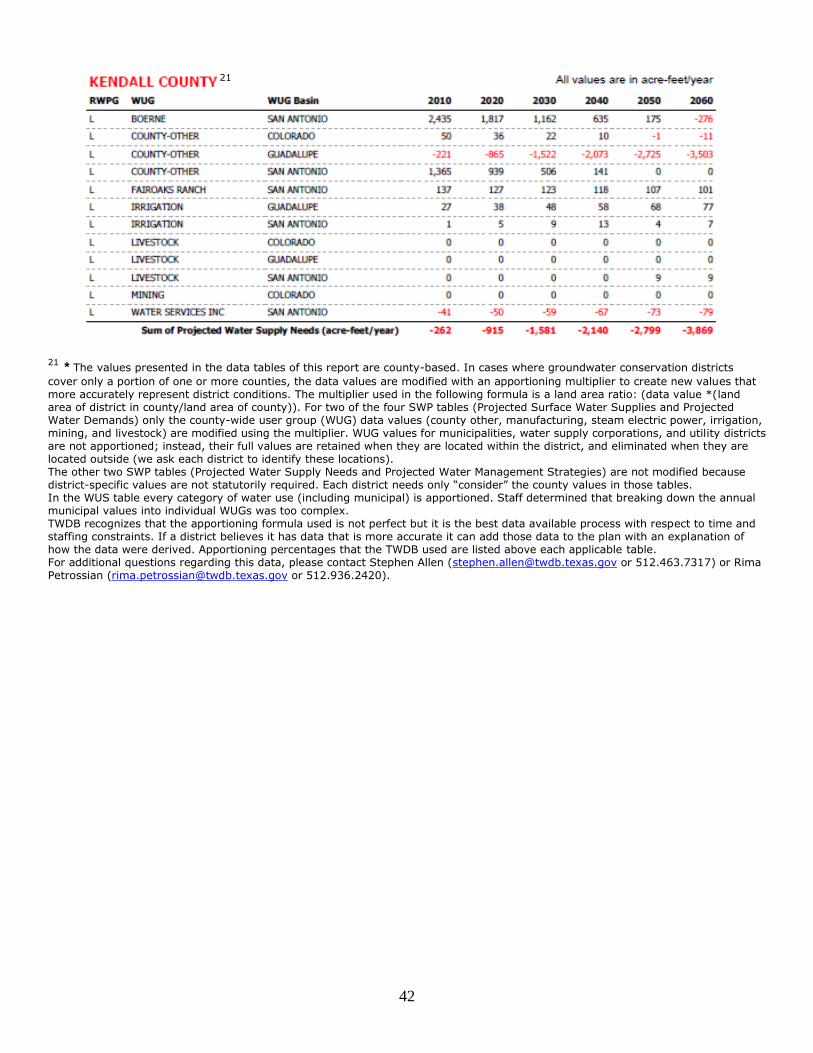
Projected Water Supply Needs TWDB 2012 State Water Plan Data
Negative values (in red) reflect a projected water supply need, positive values a surplus.
19 * The values presented in the data tables of this report are county-based. In cases where groundwater conservation districts
cover only a portion of one or more counties, the data values are modified with an apportioning multiplier to create new values that more accurately represent district conditions. The multiplier used in the following formula is a land area ratio: (data value *(land area of district in county/land area of county)). For two of the four SWP tables (Projected Surface Water Supplies and Projected
Water Demands) only the county-wide user group (WUG) data values (county other, manufacturing, steam electric power, irrigation, mining, and livestock) are modified using the multiplier. WUG values for municipalities, water supply corporations, and utility districts are not apportioned; instead, their full values are retained when they are located within the district, and eliminated when they are located outside (we ask each district to identify these locations). The other two SWP tables (Projected Water Supply Needs and Projected Water Management Strategies) are not modified because district-specific values are not statutorily required. Each district needs only “consider” the county values in those tables. In the WUS table every category of water use (including municipal) is apportioned. Staff determined that breaking down the annual municipal values into individual WUGs was too complex. TWDB recognizes that the apportioning formula used is not perfect but it is the best data available process with respect to time and staffing constraints. If a district believes it has data that is more accurate it can add those data to the plan with an explanation of how the data were derived. Apportioning percentages that the TWDB used are listed above each applicable table. For additional questions regarding this data, please contact Stephen Allen ([email protected] or 512.463.7317) or Rima Petrossian ([email protected] or 512.936.2420).
19
40
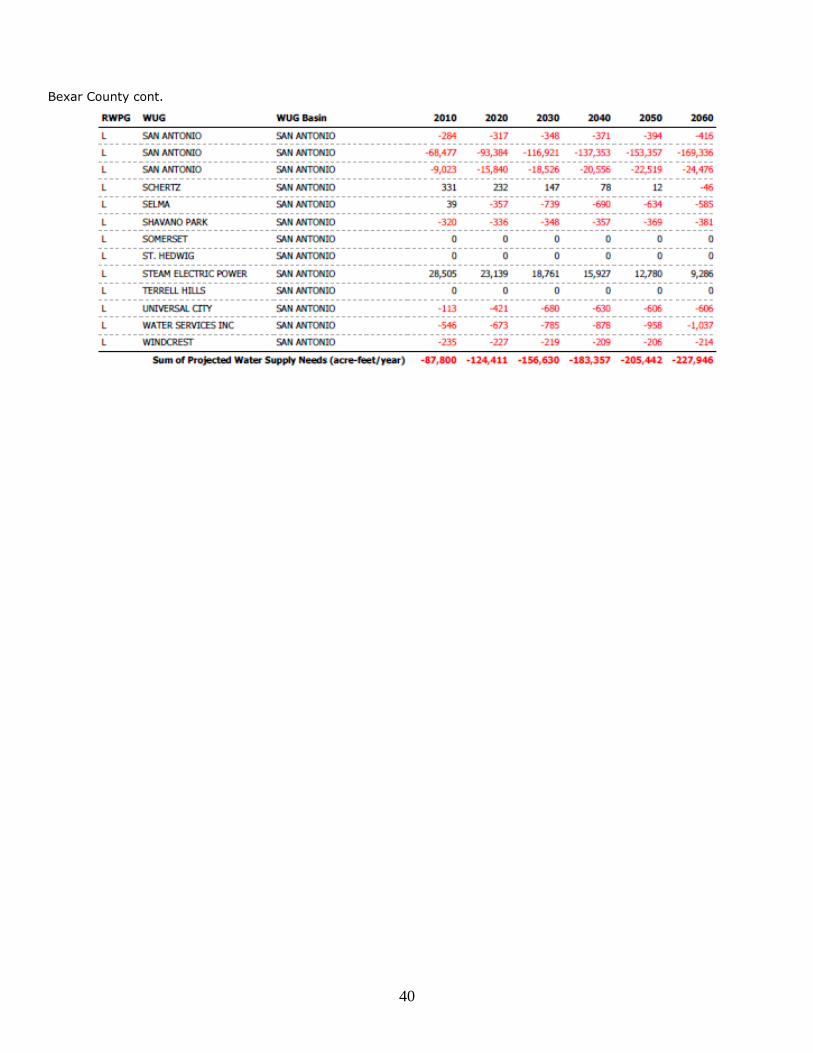
Bexar County cont.
41
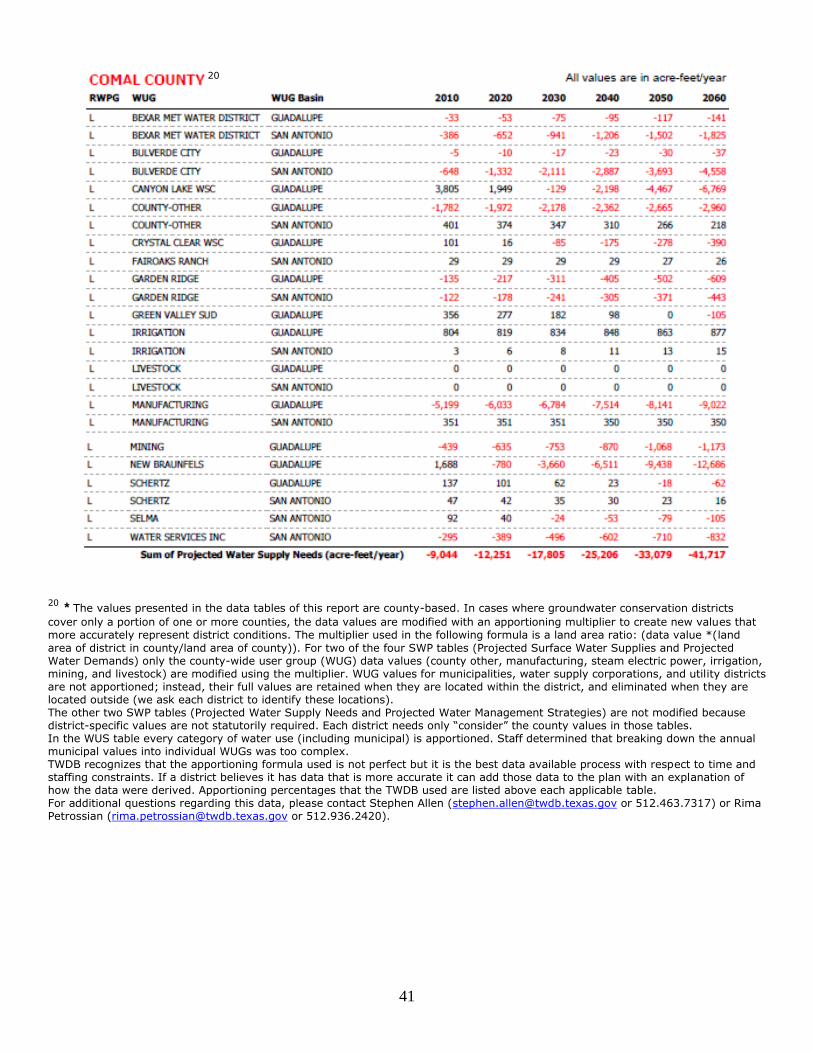
20 * The values presented in the data tables of this report are county-based. In cases where groundwater conservation districts
cover only a portion of one or more counties, the data values are modified with an apportioning multiplier to create new values that more accurately represent district conditions. The multiplier used in the following formula is a land area ratio: (data value *(land
area of district in county/land area of county)). For two of the four SWP tables (Projected Surface Water Supplies and Projected Water Demands) only the county-wide user group (WUG) data values (county other, manufacturing, steam electric power, irrigation, mining, and livestock) are modified using the multiplier. WUG values for municipalities, water supply corporations, and utility districts are not apportioned; instead, their full values are retained when they are located within the district, and eliminated when they are located outside (we ask each district to identify these locations). The other two SWP tables (Projected Water Supply Needs and Projected Water Management Strategies) are not modified because district-specific values are not statutorily required. Each district needs only “consider” the county values in those tables. In the WUS table every category of water use (including municipal) is apportioned. Staff determined that breaking down the annual municipal values into individual WUGs was too complex. TWDB recognizes that the apportioning formula used is not perfect but it is the best data available process with respect to time and staffing constraints. If a district believes it has data that is more accurate it can add those data to the plan with an explanation of how the data were derived. Apportioning percentages that the TWDB used are listed above each applicable table. For additional questions regarding this data, please contact Stephen Allen ([email protected] or 512.463.7317) or Rima Petrossian ([email protected] or 512.936.2420).
20
42
21 * The values presented in the data tables of this report are county-based. In cases where groundwater conservation districts
cover only a portion of one or more counties, the data values are modified with an apportioning multiplier to create new values that more accurately represent district conditions. The multiplier used in the following formula is a land area ratio: (data value *(land area of district in county/land area of county)). For two of the four SWP tables (Projected Surface Water Supplies and Projected Water Demands) only the county-wide user group (WUG) data values (county other, manufacturing, steam electric power, irrigation, mining, and livestock) are modified using the multiplier. WUG values for municipalities, water supply corporations, and utility districts are not apportioned; instead, their full values are retained when they are located within the district, and eliminated when they are located outside (we ask each district to identify these locations). The other two SWP tables (Projected Water Supply Needs and Projected Water Management Strategies) are not modified because district-specific values are not statutorily required. Each district needs only “consider” the county values in those tables. In the WUS table every category of water use (including municipal) is apportioned. Staff determined that breaking down the annual municipal values into individual WUGs was too complex. TWDB recognizes that the apportioning formula used is not perfect but it is the best data available process with respect to time and staffing constraints. If a district believes it has data that is more accurate it can add those data to the plan with an explanation of how the data were derived. Apportioning percentages that the TWDB used are listed above each applicable table. For additional questions regarding this data, please contact Stephen Allen ([email protected] or 512.463.7317) or Rima Petrossian ([email protected] or 512.936.2420).
21
43
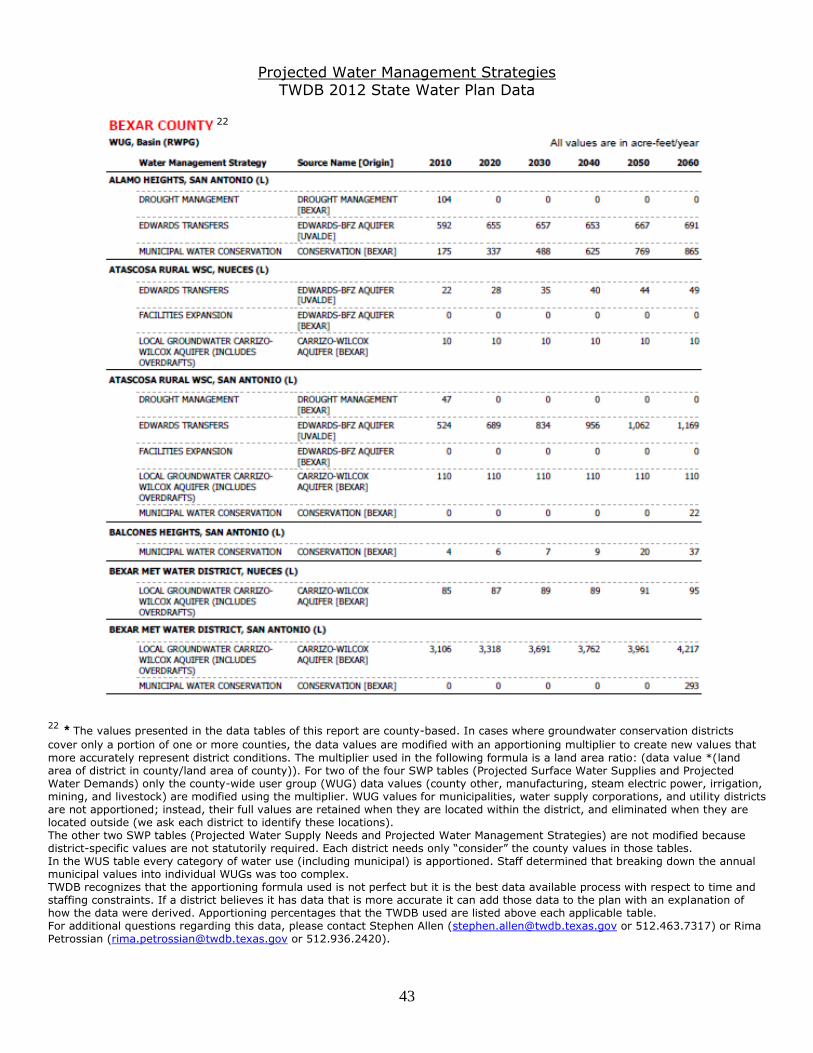
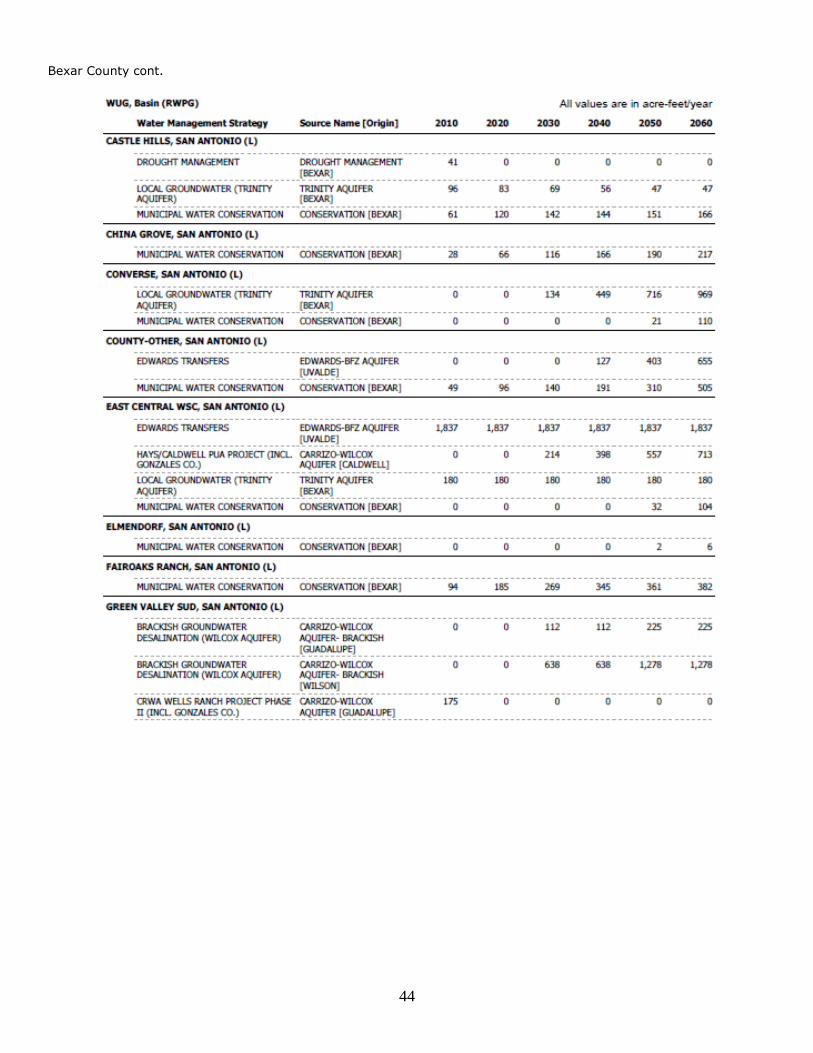
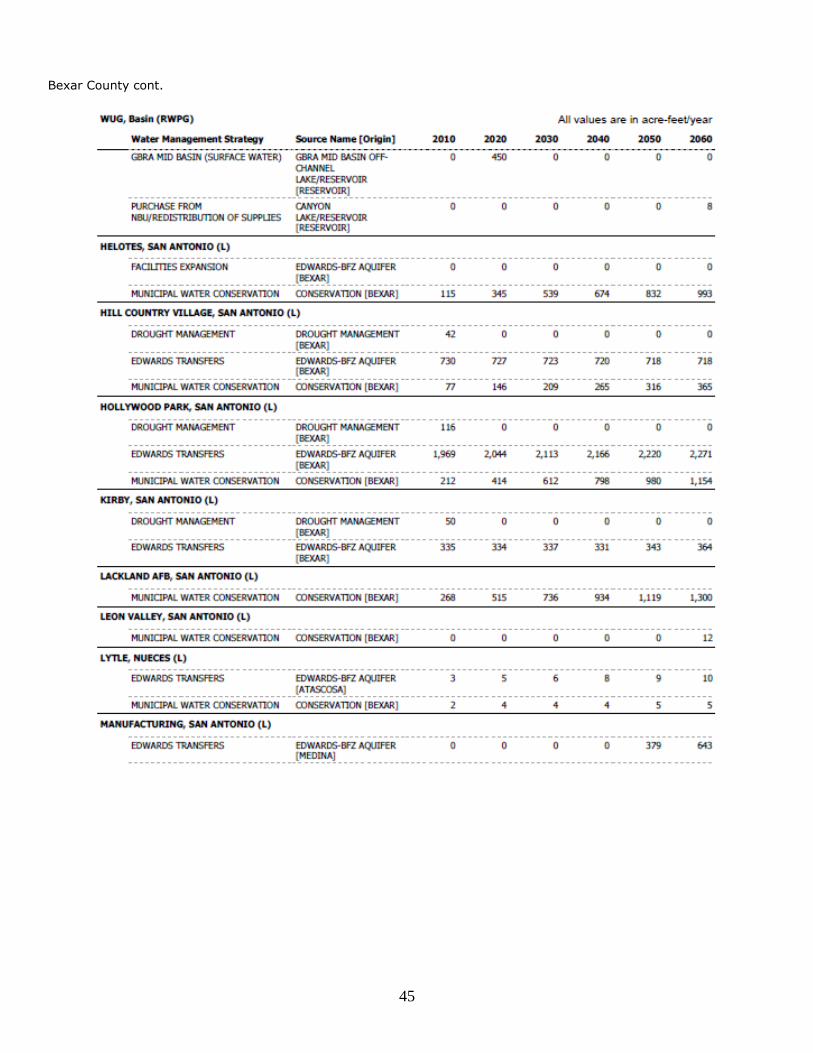
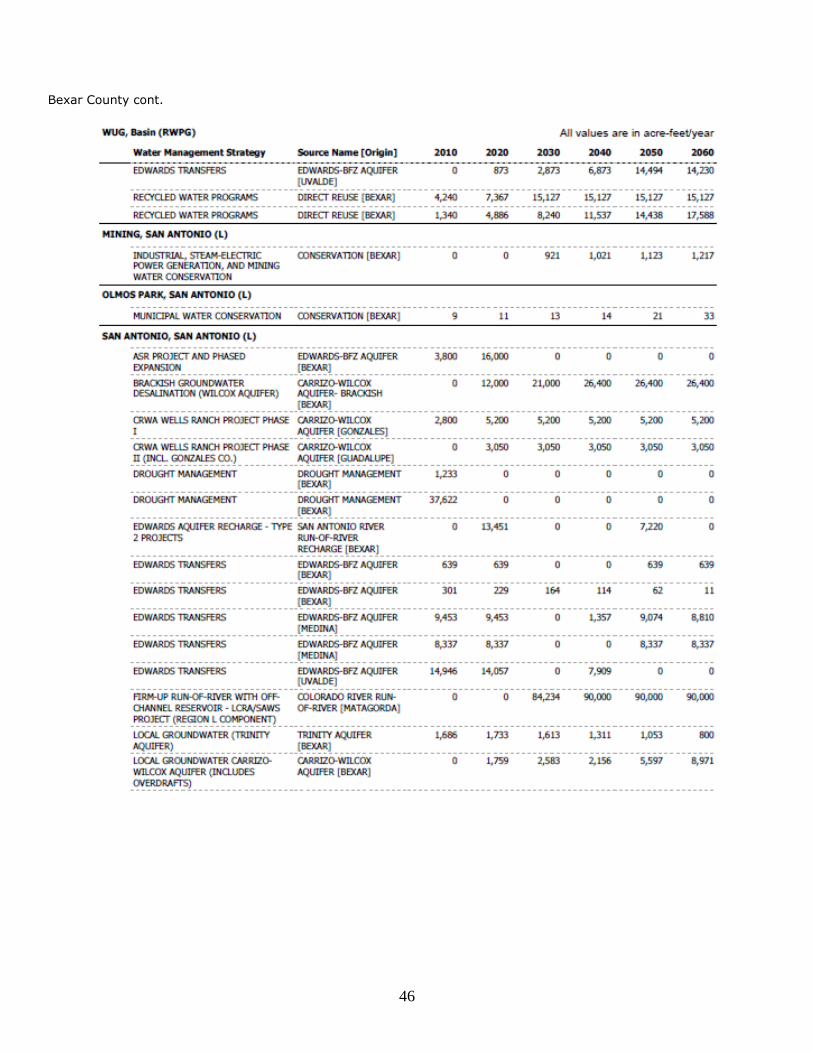
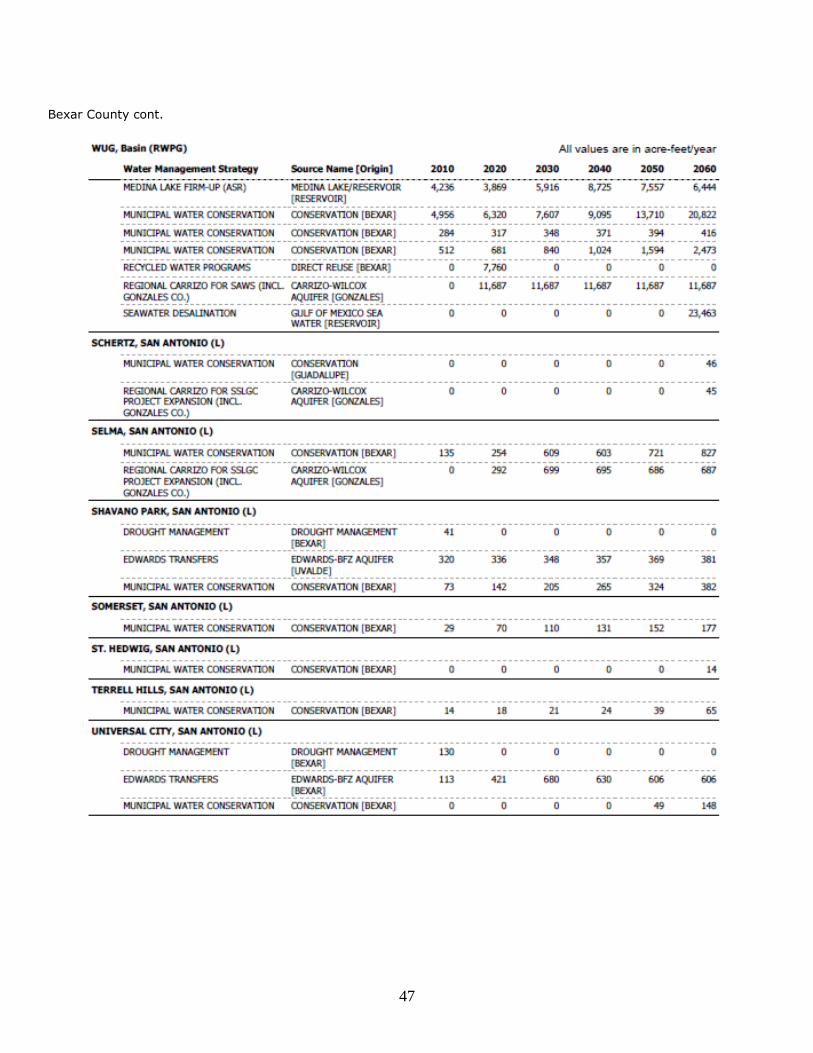
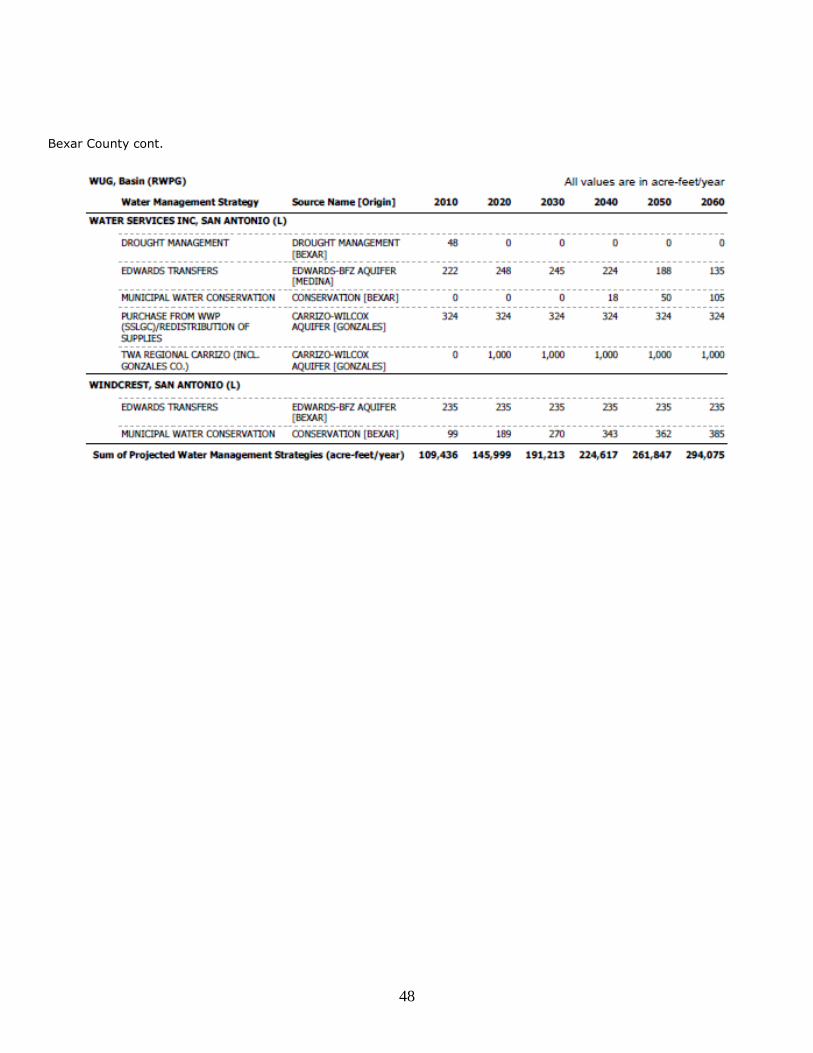
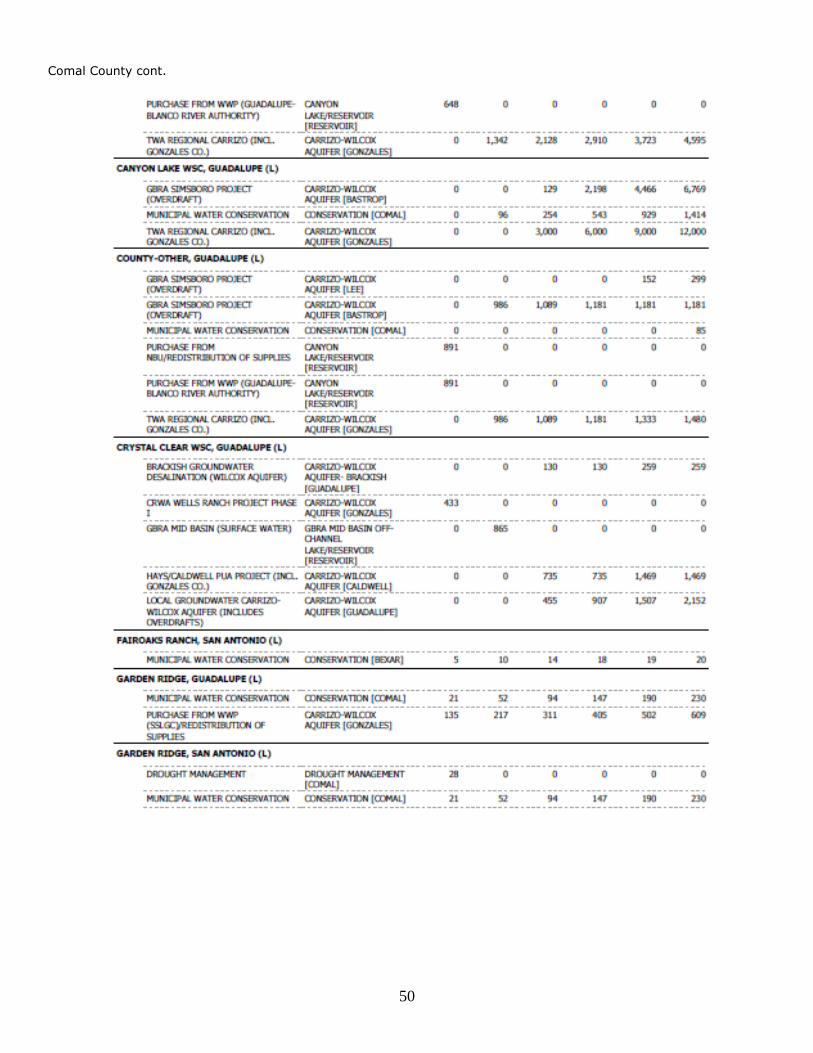
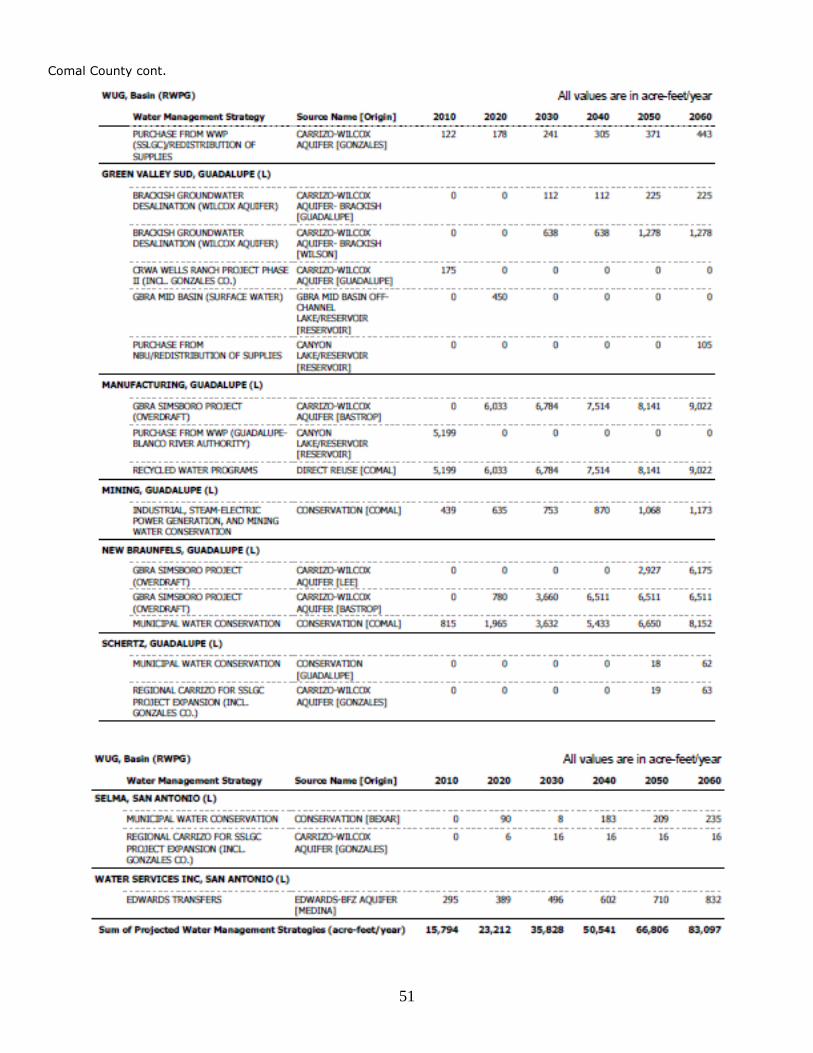
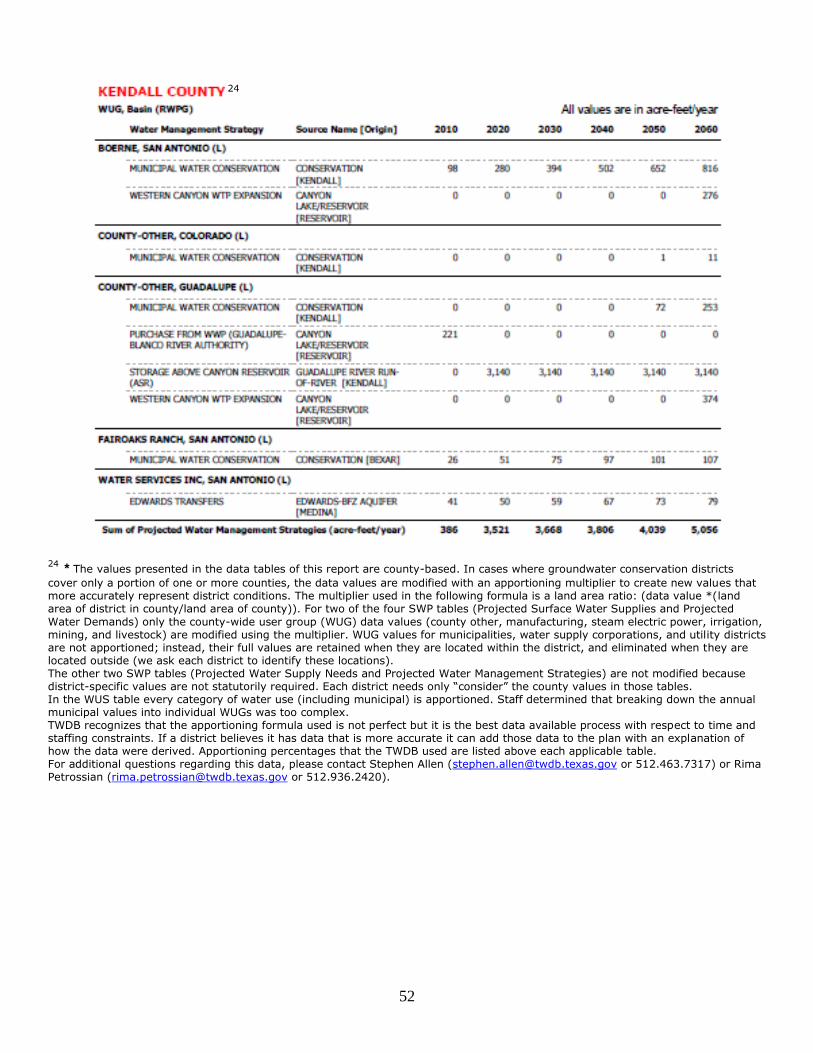
Projected Water Management Strategies TWDB 2012 State Water Plan Data
22 * The values presented in the data tables of this report are county-based. In cases where groundwater conservation districts
cover only a portion of one or more counties, the data values are modified with an apportioning multiplier to create new values that
more accurately represent district conditions. The multiplier used in the following formula is a land area ratio: (data value *(land area of district in county/land area of county)). For two of the four SWP tables (Projected Surface Water Supplies and Projected Water Demands) only the county-wide user group (WUG) data values (county other, manufacturing, steam electric power, irrigation, mining, and livestock) are modified using the multiplier. WUG values for municipalities, water supply corporations, and utility districts are not apportioned; instead, their full values are retained when they are located within the district, and eliminated when they are located outside (we ask each district to identify these locations). The other two SWP tables (Projected Water Supply Needs and Projected Water Management Strategies) are not modified because district-specific values are not statutorily required. Each district needs only “consider” the county values in those tables. In the WUS table every category of water use (including municipal) is apportioned. Staff determined that breaking down the annual municipal values into individual WUGs was too complex. TWDB recognizes that the apportioning formula used is not perfect but it is the best data available process with respect to time and staffing constraints. If a district believes it has data that is more accurate it can add those data to the plan with an explanation of how the data were derived. Apportioning percentages that the TWDB used are listed above each applicable table. For additional questions regarding this data, please contact Stephen Allen ([email protected] or 512.463.7317) or Rima Petrossian ([email protected] or 512.936.2420).
22
44
Bexar County cont.
45
Bexar County cont.
46
Bexar County cont.
47
Bexar County cont.
48
Bexar County cont.
49
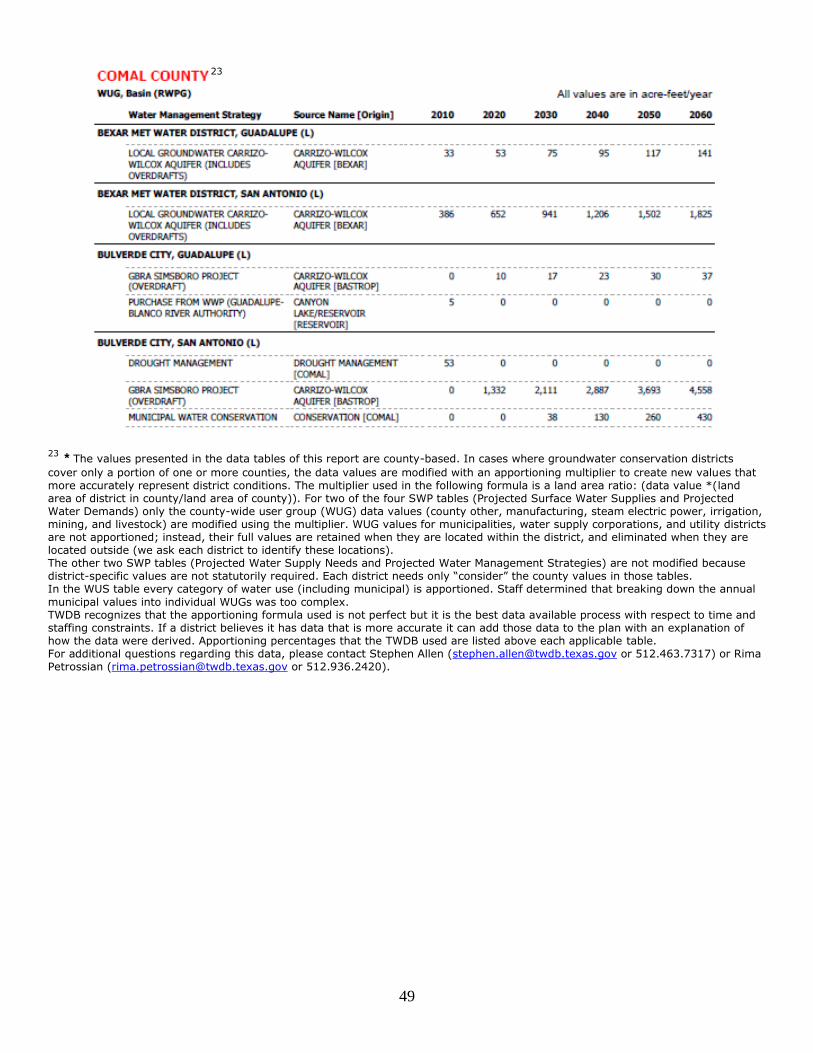
23 * The values presented in the data tables of this report are county-based. In cases where groundwater conservation districts
cover only a portion of one or more counties, the data values are modified with an apportioning multiplier to create new values that more accurately represent district conditions. The multiplier used in the following formula is a land area ratio: (data value *(land area of district in county/land area of county)). For two of the four SWP tables (Projected Surface Water Supplies and Projected Water Demands) only the county-wide user group (WUG) data values (county other, manufacturing, steam electric power, irrigation, mining, and livestock) are modified using the multiplier. WUG values for municipalities, water supply corporations, and utility districts are not apportioned; instead, their full values are retained when they are located within the district, and eliminated when they are located outside (we ask each district to identify these locations). The other two SWP tables (Projected Water Supply Needs and Projected Water Management Strategies) are not modified because district-specific values are not statutorily required. Each district needs only “consider” the county values in those tables. In the WUS table every category of water use (including municipal) is apportioned. Staff determined that breaking down the annual
municipal values into individual WUGs was too complex. TWDB recognizes that the apportioning formula used is not perfect but it is the best data available process with respect to time and staffing constraints. If a district believes it has data that is more accurate it can add those data to the plan with an explanation of how the data were derived. Apportioning percentages that the TWDB used are listed above each applicable table. For additional questions regarding this data, please contact Stephen Allen ([email protected] or 512.463.7317) or Rima Petrossian ([email protected] or 512.936.2420).
23
50
Comal County cont.
51
Comal County cont.
52
24 * The values presented in the data tables of this report are county-based. In cases where groundwater conservation districts
cover only a portion of one or more counties, the data values are modified with an apportioning multiplier to create new values that more accurately represent district conditions. The multiplier used in the following formula is a land area ratio: (data value *(land area of district in county/land area of county)). For two of the four SWP tables (Projected Surface Water Supplies and Projected
Water Demands) only the county-wide user group (WUG) data values (county other, manufacturing, steam electric power, irrigation, mining, and livestock) are modified using the multiplier. WUG values for municipalities, water supply corporations, and utility districts are not apportioned; instead, their full values are retained when they are located within the district, and eliminated when they are located outside (we ask each district to identify these locations). The other two SWP tables (Projected Water Supply Needs and Projected Water Management Strategies) are not modified because district-specific values are not statutorily required. Each district needs only “consider” the county values in those tables. In the WUS table every category of water use (including municipal) is apportioned. Staff determined that breaking down the annual municipal values into individual WUGs was too complex. TWDB recognizes that the apportioning formula used is not perfect but it is the best data available process with respect to time and staffing constraints. If a district believes it has data that is more accurate it can add those data to the plan with an explanation of how the data were derived. Apportioning percentages that the TWDB used are listed above each applicable table. For additional questions regarding this data, please contact Stephen Allen ([email protected] or 512.463.7317) or Rima Petrossian ([email protected] or 512.936.2420).
24
53
Appendix C – GAM Run 10-050 MAG version 2 (attached)
2
This page is intentionally blank
Report GAM Run 10-050 MAG Version 2
March 30, 2012
Page 3 of 10
3
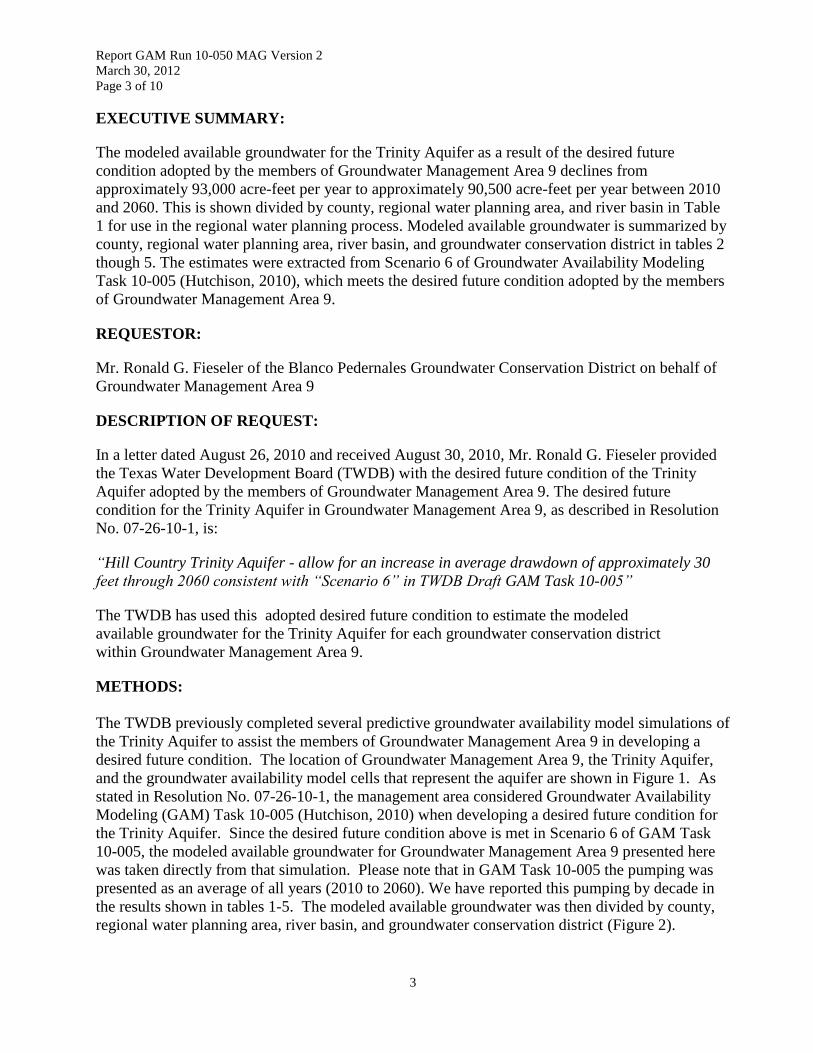
EXECUTIVE SUMMARY:
The modeled available groundwater for the Trinity Aquifer as a result of the desired future
condition adopted by the members of Groundwater Management Area 9 declines from
approximately 93,000 acre-feet per year to approximately 90,500 acre-feet per year between 2010
and 2060. This is shown divided by county, regional water planning area, and river basin in Table
1 for use in the regional water planning process. Modeled available groundwater is summarized by
county, regional water planning area, river basin, and groundwater conservation district in tables 2
though 5. The estimates were extracted from Scenario 6 of Groundwater Availability Modeling
Task 10-005 (Hutchison, 2010), which meets the desired future condition adopted by the members
of Groundwater Management Area 9.
REQUESTOR:
Mr. Ronald G. Fieseler of the Blanco Pedernales Groundwater Conservation District on behalf of
Groundwater Management Area 9
DESCRIPTION OF REQUEST:
In a letter dated August 26, 2010 and received August 30, 2010, Mr. Ronald G. Fieseler provided
the Texas Water Development Board (TWDB) with the desired future condition of the Trinity
Aquifer adopted by the members of Groundwater Management Area 9. The desired future
condition for the Trinity Aquifer in Groundwater Management Area 9, as described in Resolution
No. 07-26-10-1, is:
“Hill Country Trinity Aquifer - allow for an increase in average drawdown of approximately 30
feet through 2060 consistent with “Scenario 6” in TWDB Draft GAM Task 10-005”
The TWDB has used this adopted desired future condition to estimate the modeled
available groundwater for the Trinity Aquifer for each groundwater conservation district
within Groundwater Management Area 9.
METHODS:
The TWDB previously completed several predictive groundwater availability model simulations of
the Trinity Aquifer to assist the members of Groundwater Management Area 9 in developing a
desired future condition. The location of Groundwater Management Area 9, the Trinity Aquifer,
and the groundwater availability model cells that represent the aquifer are shown in Figure 1. As
stated in Resolution No. 07-26-10-1, the management area considered Groundwater Availability
Modeling (GAM) Task 10-005 (Hutchison, 2010) when developing a desired future condition for
the Trinity Aquifer. Since the desired future condition above is met in Scenario 6 of GAM Task
10-005, the modeled available groundwater for Groundwater Management Area 9 presented here
was taken directly from that simulation. Please note that in GAM Task 10-005 the pumping was
presented as an average of all years (2010 to 2060). We have reported this pumping by decade in
the results shown in tables 1-5. The modeled available groundwater was then divided by county,
regional water planning area, river basin, and groundwater conservation district (Figure 2).
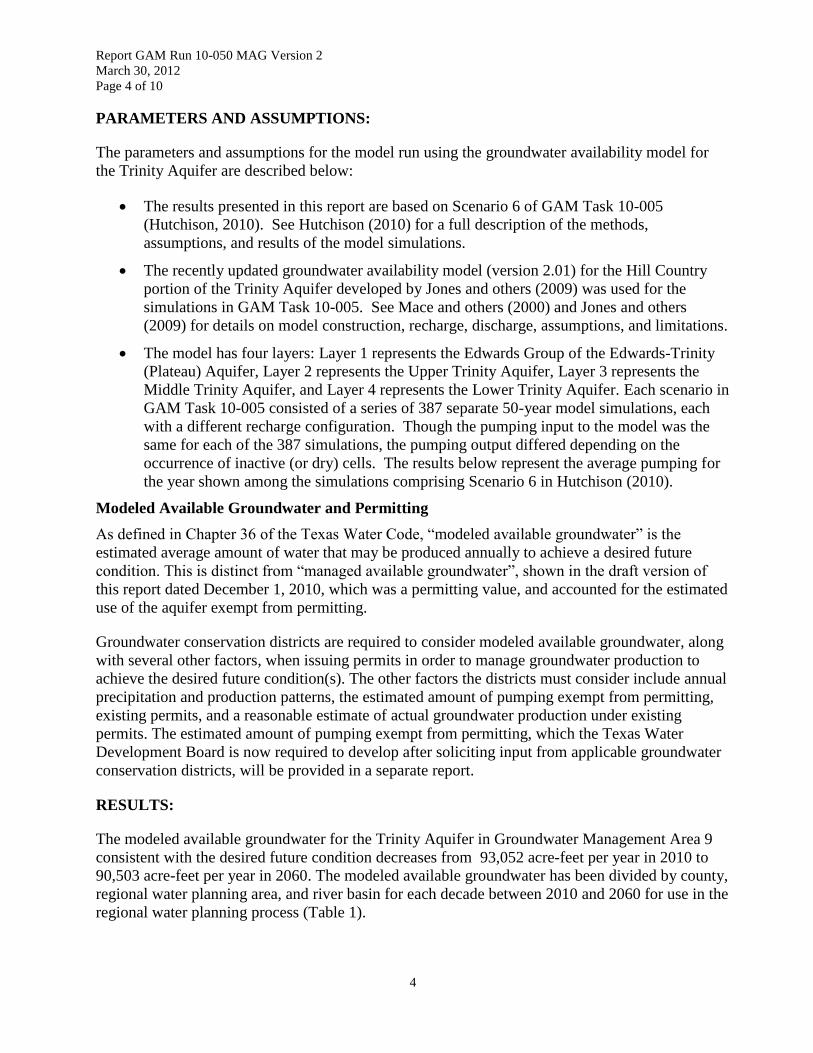
Report GAM Run 10-050 MAG Version 2
March 30, 2012
Page 4 of 10
4
PARAMETERS AND ASSUMPTIONS:
The parameters and assumptions for the model run using the groundwater availability model for
the Trinity Aquifer are described below:
The results presented in this report are based on Scenario 6 of GAM Task 10-005
(Hutchison, 2010). See Hutchison (2010) for a full description of the methods,
assumptions, and results of the model simulations.
The recently updated groundwater availability model (version 2.01) for the Hill Country
portion of the Trinity Aquifer developed by Jones and others (2009) was used for the
simulations in GAM Task 10-005. See Mace and others (2000) and Jones and others
(2009) for details on model construction, recharge, discharge, assumptions, and limitations.
The model has four layers: Layer 1 represents the Edwards Group of the Edwards-Trinity
(Plateau) Aquifer, Layer 2 represents the Upper Trinity Aquifer, Layer 3 represents the
Middle Trinity Aquifer, and Layer 4 represents the Lower Trinity Aquifer. Each scenario in
GAM Task 10-005 consisted of a series of 387 separate 50-year model simulations, each
with a different recharge configuration. Though the pumping input to the model was the
same for each of the 387 simulations, the pumping output differed depending on the
occurrence of inactive (or dry) cells. The results below represent the average pumping for
the year shown among the simulations comprising Scenario 6 in Hutchison (2010).
Modeled Available Groundwater and Permitting
As defined in Chapter 36 of the Texas Water Code, “modeled available groundwater” is the
estimated average amount of water that may be produced annually to achieve a desired future
condition. This is distinct from “managed available groundwater”, shown in the draft version of
this report dated December 1, 2010, which was a permitting value, and accounted for the estimated
use of the aquifer exempt from permitting.
Groundwater conservation districts are required to consider modeled available groundwater, along
with several other factors, when issuing permits in order to manage groundwater production to
achieve the desired future condition(s). The other factors the districts must consider include annual
precipitation and production patterns, the estimated amount of pumping exempt from permitting,
existing permits, and a reasonable estimate of actual groundwater production under existing
permits. The estimated amount of pumping exempt from permitting, which the Texas Water
Development Board is now required to develop after soliciting input from applicable groundwater
conservation districts, will be provided in a separate report.
RESULTS:
The modeled available groundwater for the Trinity Aquifer in Groundwater Management Area 9
consistent with the desired future condition decreases from 93,052 acre-feet per year in 2010 to
90,503 acre-feet per year in 2060. The modeled available groundwater has been divided by county,
regional water planning area, and river basin for each decade between 2010 and 2060 for use in the
regional water planning process (Table 1).
Report GAM Run 10-050 MAG Version 2
March 30, 2012
Page 5 of 10
5
The modeled available groundwater is also summarized by county, regional water planning area,
river basin, and groundwater conservation district as shown in tables 2, 3, 4, and 5, respectively. In
Table 5, note that modeled available groundwater is totaled for both groundwater conservation
district areas and areas without groundwater conservation districts.
REFERENCES:
Hutchison, William R., 2010, GAM Task 10-005, Texas Water Development Board GAM Task
10-005 Report, 13 p.
Jones, I.C., Anaya, R. and Wade, S., 2009, Groundwater Availability Model for the Hill Country
portion of the Trinity Aquifer System, Texas, Texas Water Development Board
unpublished report,193 p.
Mace, R.E., Chowdhury, A.H., Anaya, R., and Way, S-C., 2000, Groundwater availability of the
Trinity Aquifer, Hill Country Area, Texas—Numerical simulations through 2050: Texas
Water Development Board Report 353, 119 p.
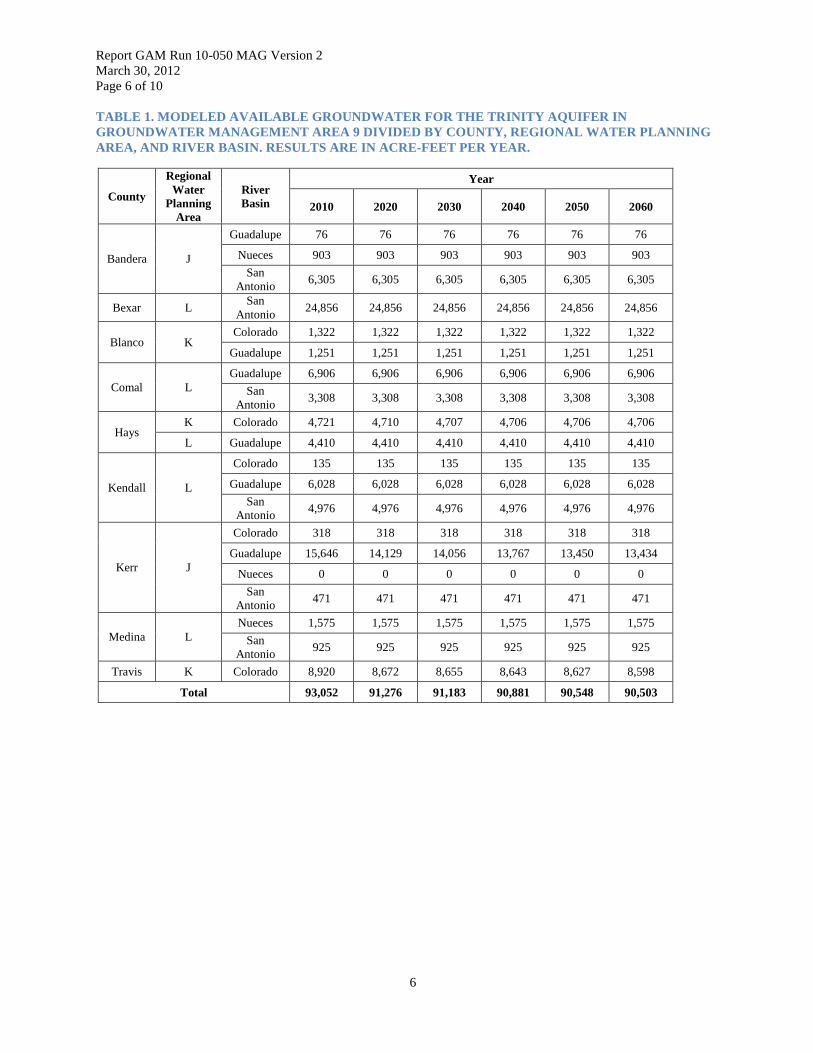
Report GAM Run 10-050 MAG Version 2
March 30, 2012
Page 6 of 10
6
TABLE 1. MODELED AVAILABLE GROUNDWATER FOR THE TRINITY AQUIFER IN
GROUNDWATER MANAGEMENT AREA 9 DIVIDED BY COUNTY, REGIONAL WATER PLANNING
AREA, AND RIVER BASIN. RESULTS ARE IN ACRE-FEET PER YEAR.
County
Regional
Water
Planning
Area
River
Basin
Year
2010 2020 2030 2040 2050 2060
Bandera J
Guadalupe 76 76 76 76 76 76
Nueces 903 903 903 903 903 903
San
Antonio 6,305 6,305 6,305 6,305 6,305 6,305
Bexar L San
Antonio 24,856 24,856 24,856 24,856 24,856 24,856
Blanco K Colorado 1,322 1,322 1,322 1,322 1,322 1,322
Guadalupe 1,251 1,251 1,251 1,251 1,251 1,251
Comal L
Guadalupe 6,906 6,906 6,906 6,906 6,906 6,906
San
Antonio 3,308 3,308 3,308 3,308 3,308 3,308
Hays K Colorado 4,721 4,710 4,707 4,706 4,706 4,706
L Guadalupe 4,410 4,410 4,410 4,410 4,410 4,410
Kendall L
Colorado 135 135 135 135 135 135
Guadalupe 6,028 6,028 6,028 6,028 6,028 6,028
San
Antonio 4,976 4,976 4,976 4,976 4,976 4,976
Kerr J
Colorado 318 318 318 318 318 318
Guadalupe 15,646 14,129 14,056 13,767 13,450 13,434
Nueces 0 0 0 0 0 0
San
Antonio 471 471 471 471 471 471
Medina L
Nueces 1,575 1,575 1,575 1,575 1,575 1,575
San
Antonio 925 925 925 925 925 925
Travis K Colorado 8,920 8,672 8,655 8,643 8,627 8,598
Total 93,052 91,276 91,183 90,881 90,548 90,503
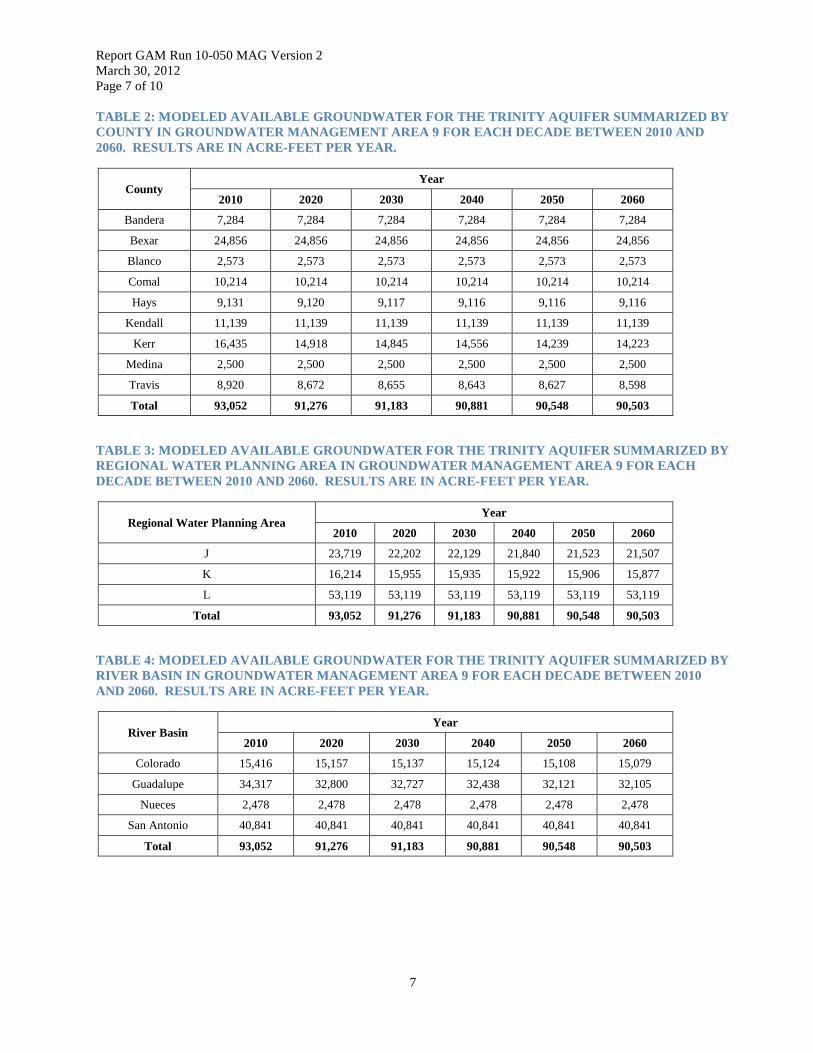
Report GAM Run 10-050 MAG Version 2
March 30, 2012
Page 7 of 10
7
TABLE 2: MODELED AVAILABLE GROUNDWATER FOR THE TRINITY AQUIFER SUMMARIZED BY
COUNTY IN GROUNDWATER MANAGEMENT AREA 9 FOR EACH DECADE BETWEEN 2010 AND
2060. RESULTS ARE IN ACRE-FEET PER YEAR.
County Year
2010 2020 2030 2040 2050 2060
Bandera 7,284 7,284 7,284 7,284 7,284 7,284
Bexar 24,856 24,856 24,856 24,856 24,856 24,856
Blanco 2,573 2,573 2,573 2,573 2,573 2,573
Comal 10,214 10,214 10,214 10,214 10,214 10,214
Hays 9,131 9,120 9,117 9,116 9,116 9,116
Kendall 11,139 11,139 11,139 11,139 11,139 11,139
Kerr 16,435 14,918 14,845 14,556 14,239 14,223
Medina 2,500 2,500 2,500 2,500 2,500 2,500
Travis 8,920 8,672 8,655 8,643 8,627 8,598
Total 93,052 91,276 91,183 90,881 90,548 90,503
TABLE 3: MODELED AVAILABLE GROUNDWATER FOR THE TRINITY AQUIFER SUMMARIZED BY
REGIONAL WATER PLANNING AREA IN GROUNDWATER MANAGEMENT AREA 9 FOR EACH
DECADE BETWEEN 2010 AND 2060. RESULTS ARE IN ACRE-FEET PER YEAR.
Regional Water Planning Area Year
2010 2020 2030 2040 2050 2060
J 23,719 22,202 22,129 21,840 21,523 21,507
K 16,214 15,955 15,935 15,922 15,906 15,877
L 53,119 53,119 53,119 53,119 53,119 53,119
Total 93,052 91,276 91,183 90,881 90,548 90,503
TABLE 4: MODELED AVAILABLE GROUNDWATER FOR THE TRINITY AQUIFER SUMMARIZED BY
RIVER BASIN IN GROUNDWATER MANAGEMENT AREA 9 FOR EACH DECADE BETWEEN 2010
AND 2060. RESULTS ARE IN ACRE-FEET PER YEAR.
River Basin Year
2010 2020 2030 2040 2050 2060
Colorado 15,416 15,157 15,137 15,124 15,108 15,079
Guadalupe 34,317 32,800 32,727 32,438 32,121 32,105
Nueces 2,478 2,478 2,478 2,478 2,478 2,478
San Antonio 40,841 40,841 40,841 40,841 40,841 40,841
Total 93,052 91,276 91,183 90,881 90,548 90,503
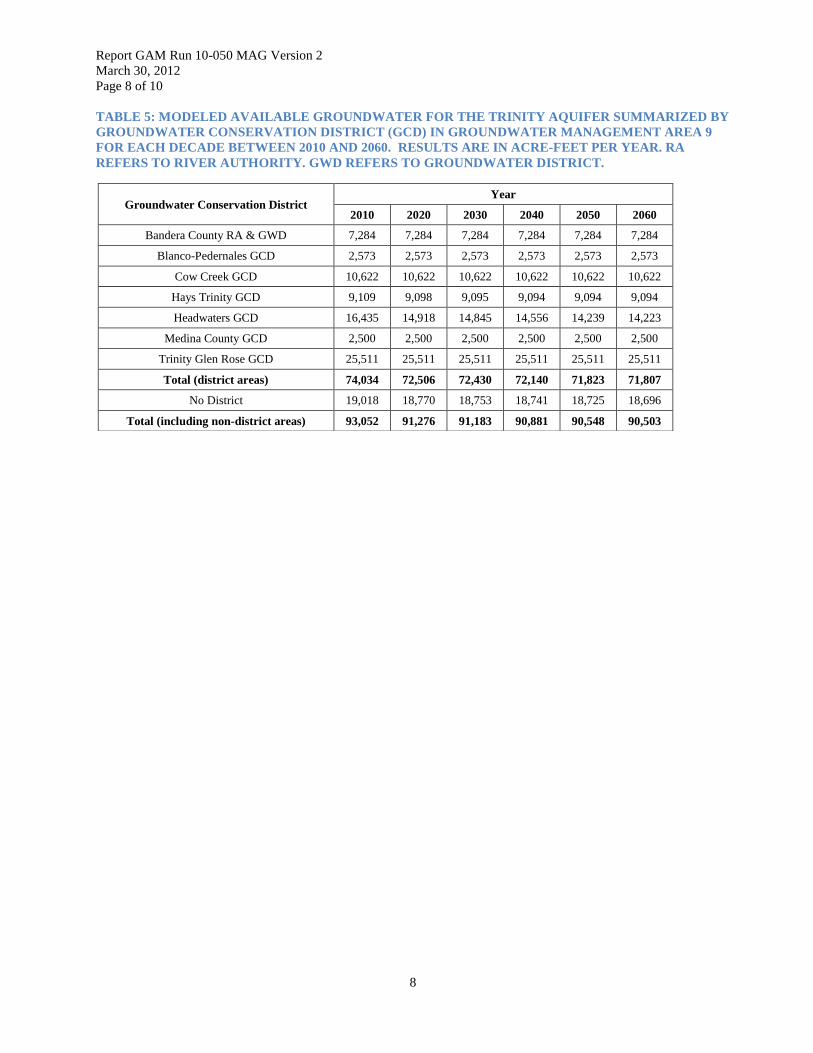
Report GAM Run 10-050 MAG Version 2
March 30, 2012
Page 8 of 10
8
TABLE 5: MODELED AVAILABLE GROUNDWATER FOR THE TRINITY AQUIFER SUMMARIZED BY
GROUNDWATER CONSERVATION DISTRICT (GCD) IN GROUNDWATER MANAGEMENT AREA 9
FOR EACH DECADE BETWEEN 2010 AND 2060. RESULTS ARE IN ACRE-FEET PER YEAR. RA
REFERS TO RIVER AUTHORITY. GWD REFERS TO GROUNDWATER DISTRICT.
Groundwater Conservation District Year
2010 2020 2030 2040 2050 2060
Bandera County RA & GWD 7,284 7,284 7,284 7,284 7,284 7,284
Blanco-Pedernales GCD 2,573 2,573 2,573 2,573 2,573 2,573
Cow Creek GCD 10,622 10,622 10,622 10,622 10,622 10,622
Hays Trinity GCD 9,109 9,098 9,095 9,094 9,094 9,094
Headwaters GCD 16,435 14,918 14,845 14,556 14,239 14,223
Medina County GCD 2,500 2,500 2,500 2,500 2,500 2,500
Trinity Glen Rose GCD 25,511 25,511 25,511 25,511 25,511 25,511
Total (district areas) 74,034 72,506 72,430 72,140 71,823 71,807
No District 19,018 18,770 18,753 18,741 18,725 18,696
Total (including non-district areas) 93,052 91,276 91,183 90,881 90,548 90,503
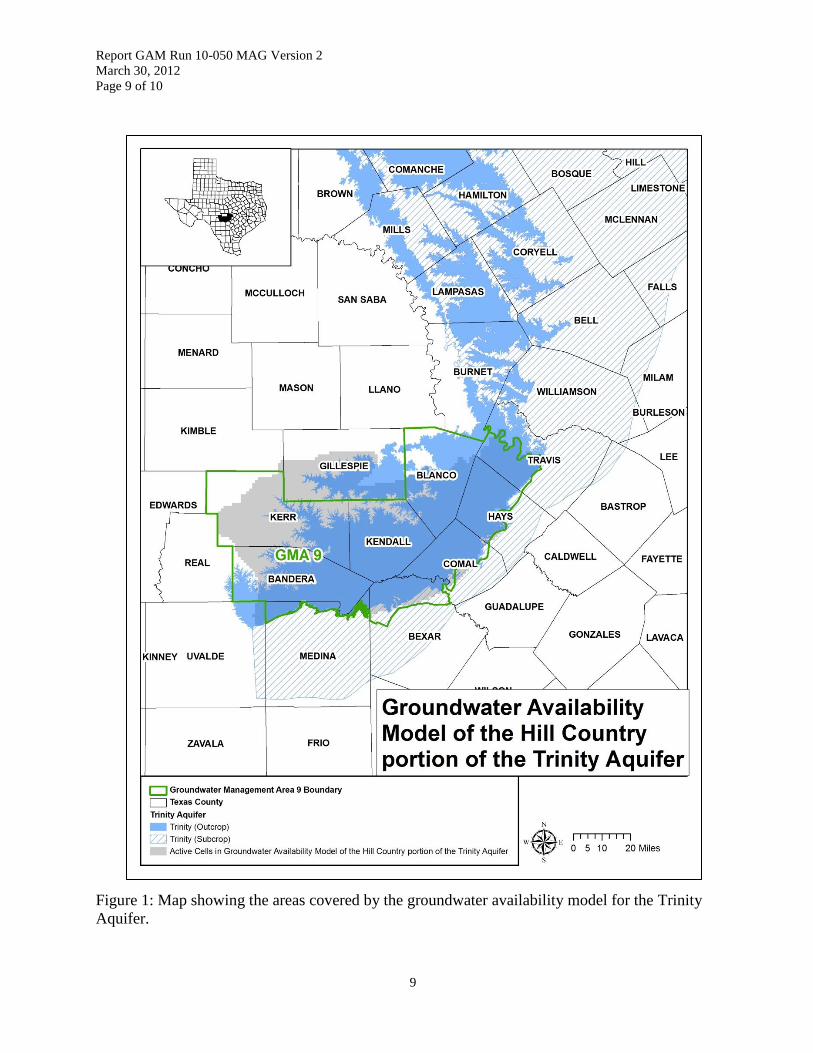
Report GAM Run 10-050 MAG Version 2
March 30, 2012
Page 9 of 10
9
Figure 1: Map showing the areas covered by the groundwater availability model for the Trinity
Aquifer.
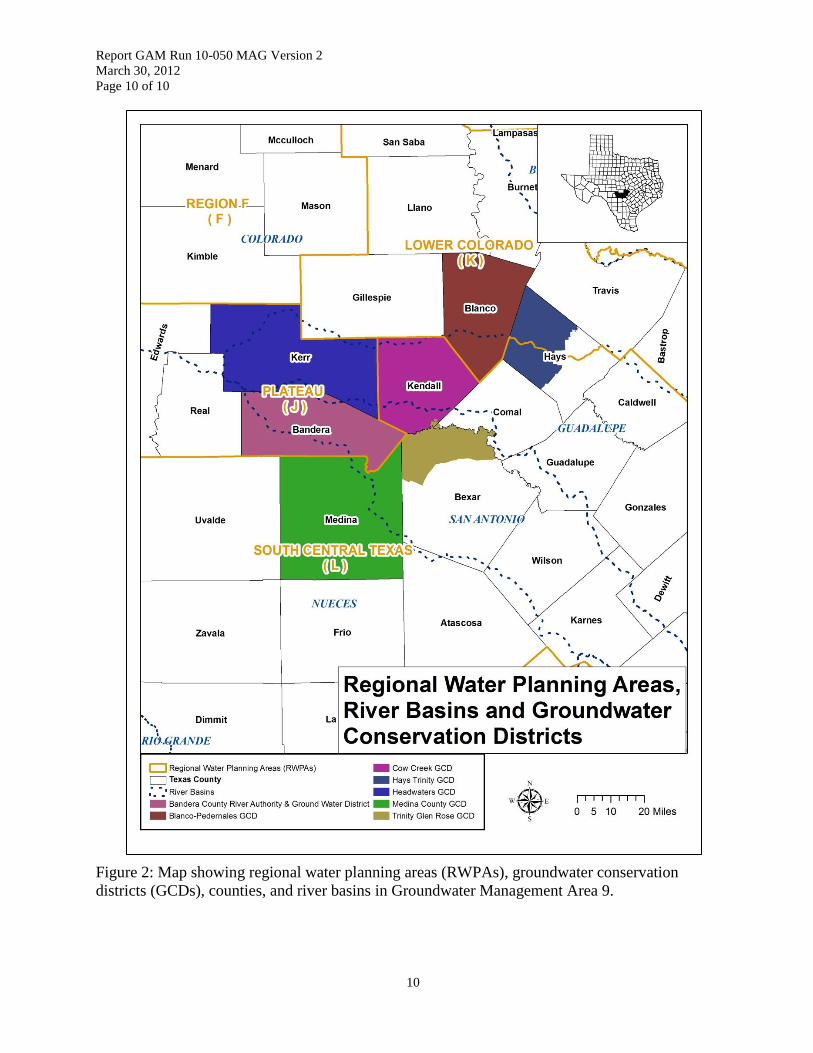
Report GAM Run 10-050 MAG Version 2
March 30, 2012
Page 10 of 10
10
Figure 2: Map showing regional water planning areas (RWPAs), groundwater conservation
districts (GCDs), counties, and river basins in Groundwater Management Area 9.

54
Appendix D – GAM Run 15-001 (attached)

This page is intentionally blank

GAM RUN 15-001: TRINITY GLEN ROSE
GROUNDWATER CONSERVATION DISTRICT
MANAGEMENT PLAN by Shirley C. Wade, Ph.D., P.G.
Texas Water Development Board Groundwater Resources Division
Groundwater Availability Modeling Section (512) 936-0883
February 17, 2015
EXECUTIVE SUMMARY:
Texas State Water Code, Section 36.1071, Subsection (h) (Texas Water Code, 2011),
states that, in developing its groundwater management plan, a groundwater
conservation district shall use groundwater availability modeling information provided
by the executive administrator of the Texas Water Development Board (TWDB) in
conjunction with any available site-specific information provided by the district for
review and comment to the executive administrator. Information derived from
groundwater availability models that shall be included in the groundwater
management plan includes:
the annual amount of recharge from precipitation to the groundwater
resources within the district, if any;
for each aquifer within the district, the annual volume of water that
discharges from the aquifer to springs and any surface water bodies,
including lakes, streams, and rivers; and
the annual volume of flow into and out of the district within each aquifer
and between aquifers in the district.
This report—Part 2 of a two-part package of information from the TWDB to the Trinity
Glen Rose Groundwater Conservation District—fulfills the requirements noted above.
Part 1 of the two-part package is the Estimated Historical Water Use/State Water Plan
data report. The District will receive this data report from the TWDB Groundwater
Technical Assistance Section. Questions about the data report can be directed to Mr.
Stephen Allen, [email protected], (512) 463-7317.
GAM Run 15-001: Trinity Glen Rose Groundwater Conservation District Management Plan February 17, 2015 Page 5 of 10
The groundwater management plan for the Trinity Glen Rose Groundwater
Conservation District should be adopted by the district on or before September 15,
2015 and submitted to the executive administrator of the TWDB on or before October
15, 2015. The current management plan for the Trinity Glen Rose Groundwater
Conservation District expires on December 14, 2015.
This report discusses the methods, assumptions, and results from a model run using
the groundwater availability model for the Hill Country portion of the Trinity Aquifer
System (Jones and others, 2009). Please note that the Edwards (Balcones Fault Zone)
Aquifer occurs within the boundaries of the Trinity Glen Rose Groundwater
Conservation District but is excluded from this report because the Trinity Glen Rose
Groundwater Conservation District does not have jurisdiction over that aquifer. This
model run replaces the results of GAM Run 09-032 (Aschenbach, 2010). The
groundwater district boundaries have changed since 2010 and GAM Run 15-001 meets
current standards set after the release of GAM Run 09-032. In addition, groundwater
flow between the Trinity Aquifer System and the Edwards (Balcones Fault Zone)
Aquifer was not reported in GAM Run 09-032.
Table 1 summarizes the groundwater availability model data required by statute, and
Figure 1 shows the area of the model from which the values in Table 1 were
extracted. If after review of the figure, the Trinity Glen Rose Groundwater
Conservation District determines that the district boundaries used in the assessment
do not reflect current conditions, please notify the TWDB at your earliest
convenience.
The Trinity Aquifer underlies the Edwards (Balcones Fault Zone) Aquifer in the
southeast parts of the Trinity Glen Rose Groundwater Conservation District (Figure 1).
However, that part of the Trinity Aquifer is not included in the groundwater
availability model for the Hill Country portion of the Trinity Aquifer System.
Information for the Trinity Aquifer underlying the Edwards (Balcones Fault Zone)
Aquifer is being provided separately from the Groundwater Technical Assistance
Section of the TWDB.
METHODS:
In accordance with the provisions of the Texas State Water Code, Section 36.1071,
Subsection (h), the groundwater availability model for the Hill Country portion of the
Trinity Aquifer System (Jones and others, 2009) was run for this analysis. Trinity Glen
Rose Groundwater Conservation District water budgets were extracted for the
historical model period (1980 through 1997) using ZONEBUDGET Version 3.01
(Harbaugh, 2009). The average annual water budget values for recharge, discharge to
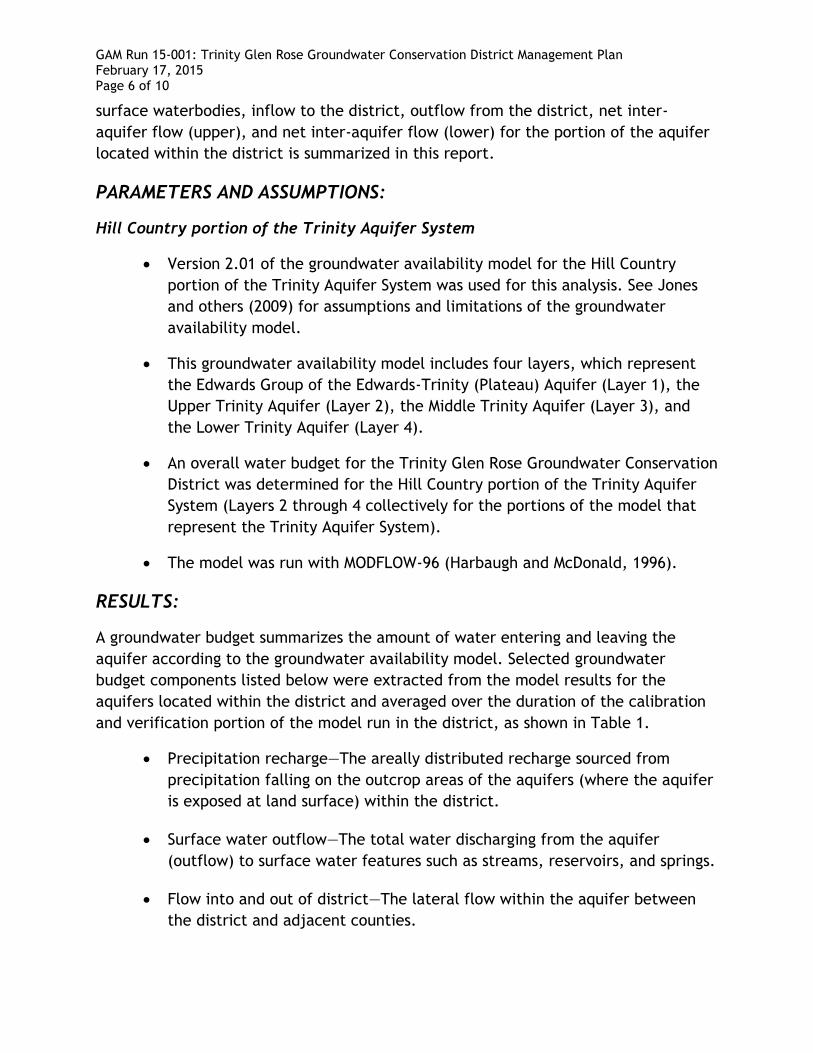
GAM Run 15-001: Trinity Glen Rose Groundwater Conservation District Management Plan February 17, 2015 Page 6 of 10
surface waterbodies, inflow to the district, outflow from the district, net inter-
aquifer flow (upper), and net inter-aquifer flow (lower) for the portion of the aquifer
located within the district is summarized in this report.
PARAMETERS AND ASSUMPTIONS:
Hill Country portion of the Trinity Aquifer System
Version 2.01 of the groundwater availability model for the Hill Country
portion of the Trinity Aquifer System was used for this analysis. See Jones
and others (2009) for assumptions and limitations of the groundwater
availability model.
This groundwater availability model includes four layers, which represent
the Edwards Group of the Edwards-Trinity (Plateau) Aquifer (Layer 1), the
Upper Trinity Aquifer (Layer 2), the Middle Trinity Aquifer (Layer 3), and
the Lower Trinity Aquifer (Layer 4).
An overall water budget for the Trinity Glen Rose Groundwater Conservation
District was determined for the Hill Country portion of the Trinity Aquifer
System (Layers 2 through 4 collectively for the portions of the model that
represent the Trinity Aquifer System).
The model was run with MODFLOW-96 (Harbaugh and McDonald, 1996).
RESULTS:
A groundwater budget summarizes the amount of water entering and leaving the
aquifer according to the groundwater availability model. Selected groundwater
budget components listed below were extracted from the model results for the
aquifers located within the district and averaged over the duration of the calibration
and verification portion of the model run in the district, as shown in Table 1.
Precipitation recharge—The areally distributed recharge sourced from
precipitation falling on the outcrop areas of the aquifers (where the aquifer
is exposed at land surface) within the district.
Surface water outflow—The total water discharging from the aquifer
(outflow) to surface water features such as streams, reservoirs, and springs.
Flow into and out of district—The lateral flow within the aquifer between
the district and adjacent counties.
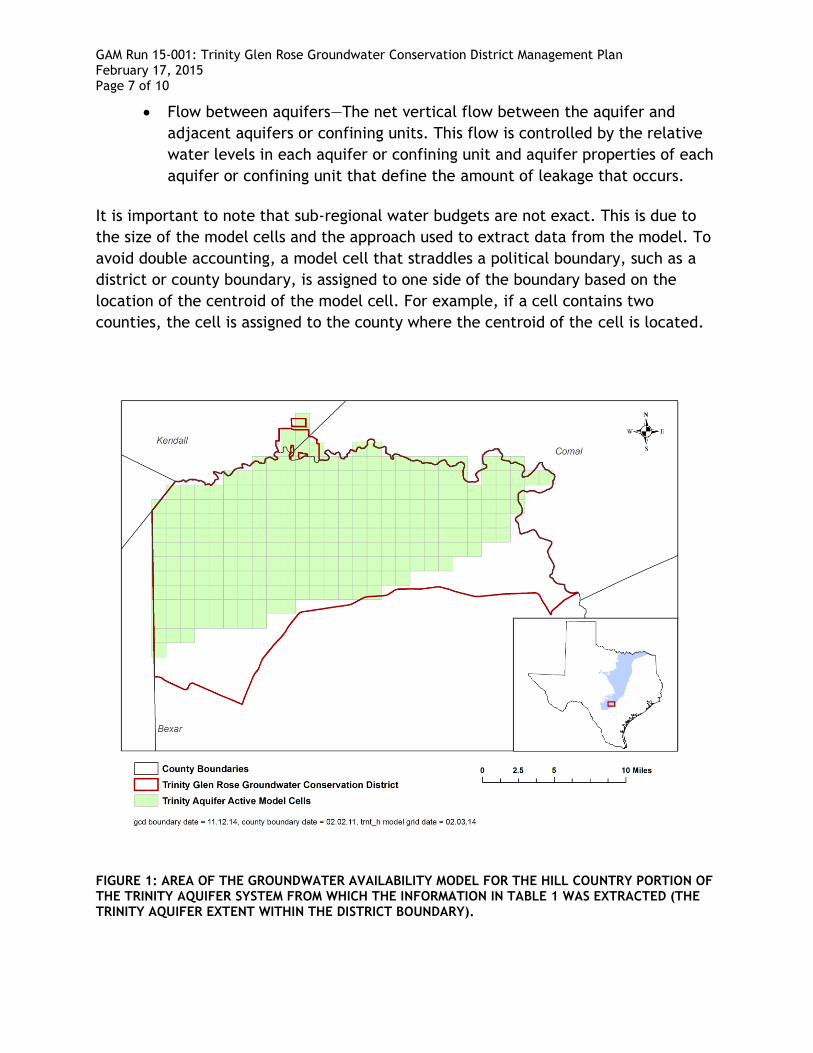
GAM Run 15-001: Trinity Glen Rose Groundwater Conservation District Management Plan February 17, 2015 Page 7 of 10
Flow between aquifers—The net vertical flow between the aquifer and
adjacent aquifers or confining units. This flow is controlled by the relative
water levels in each aquifer or confining unit and aquifer properties of each
aquifer or confining unit that define the amount of leakage that occurs.
It is important to note that sub-regional water budgets are not exact. This is due to
the size of the model cells and the approach used to extract data from the model. To
avoid double accounting, a model cell that straddles a political boundary, such as a
district or county boundary, is assigned to one side of the boundary based on the
location of the centroid of the model cell. For example, if a cell contains two
counties, the cell is assigned to the county where the centroid of the cell is located.
FIGURE 1: AREA OF THE GROUNDWATER AVAILABILITY MODEL FOR THE HILL COUNTRY PORTION OF THE TRINITY AQUIFER SYSTEM FROM WHICH THE INFORMATION IN TABLE 1 WAS EXTRACTED (THE TRINITY AQUIFER EXTENT WITHIN THE DISTRICT BOUNDARY).
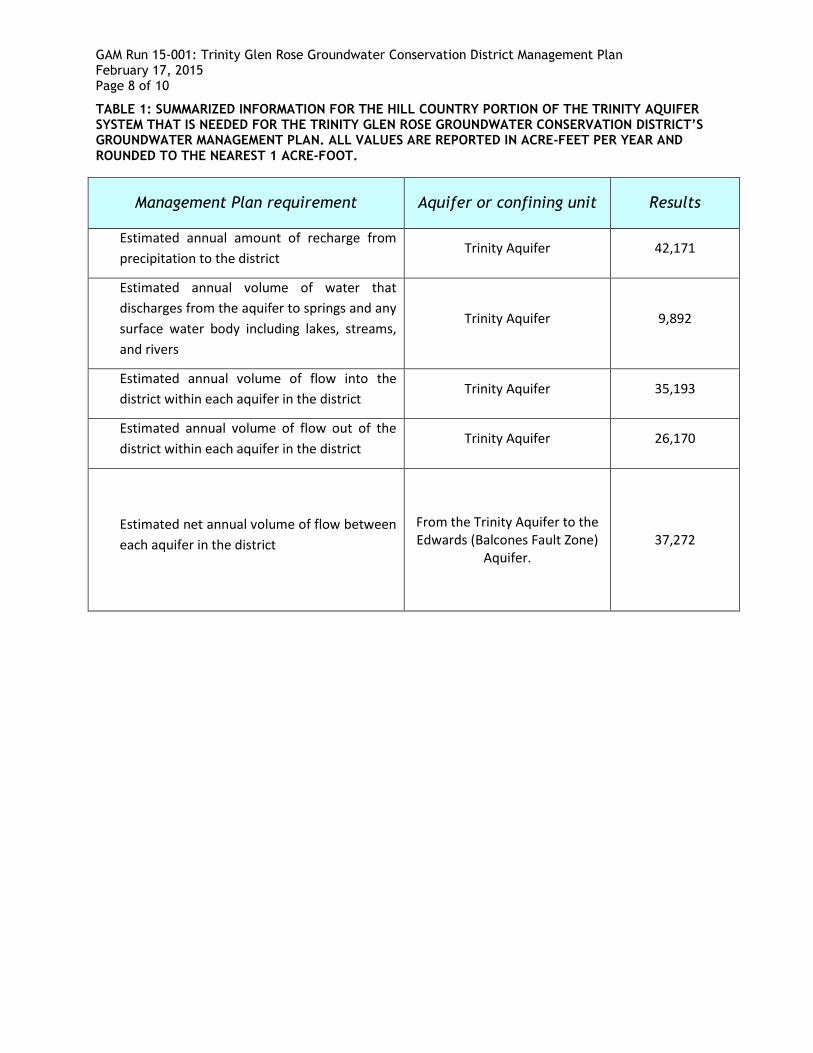
GAM Run 15-001: Trinity Glen Rose Groundwater Conservation District Management Plan February 17, 2015 Page 8 of 10
TABLE 1: SUMMARIZED INFORMATION FOR THE HILL COUNTRY PORTION OF THE TRINITY AQUIFER SYSTEM THAT IS NEEDED FOR THE TRINITY GLEN ROSE GROUNDWATER CONSERVATION DISTRICT’S GROUNDWATER MANAGEMENT PLAN. ALL VALUES ARE REPORTED IN ACRE-FEET PER YEAR AND
ROUNDED TO THE NEAREST 1 ACRE-FOOT.
Management Plan requirement Aquifer or confining unit Results
Estimated annual amount of recharge from
precipitation to the district Trinity Aquifer 42,171
Estimated annual volume of water that
discharges from the aquifer to springs and any
surface water body including lakes, streams,
and rivers
Trinity Aquifer 9,892
Estimated annual volume of flow into the
district within each aquifer in the district Trinity Aquifer 35,193
Estimated annual volume of flow out of the
district within each aquifer in the district Trinity Aquifer 26,170
Estimated net annual volume of flow between
each aquifer in the district
From the Trinity Aquifer to the Edwards (Balcones Fault Zone)
Aquifer. 37,272
GAM Run 15-001: Trinity Glen Rose Groundwater Conservation District Management Plan February 17, 2015 Page 9 of 10
LIMITATIONS:
The groundwater model(s) used in completing this analysis is the best available
scientific tool that can be used to meet the stated objective(s). To the extent that
this analysis will be used for planning purposes and/or regulatory purposes related to
pumping in the past and into the future, it is important to recognize the assumptions
and limitations associated with the use of the results. In reviewing the use of models
in environmental regulatory decision making, the National Research Council (2007)
noted:
“Models will always be constrained by computational limitations, assumptions, and knowledge gaps. They can best be viewed as tools to help inform decisions rather than as machines to generate truth or make decisions. Scientific advances will never make it possible to build a perfect model that accounts for every aspect of reality or to prove that a given model is correct in all respects for a particular regulatory application. These characteristics make evaluation of a regulatory model more complex than solely a comparison of measurement data with model results.”
A key aspect of using the groundwater model to evaluate historic groundwater flow
conditions includes the assumptions about the location in the aquifer where historic
pumping was placed. Understanding the amount and location of historic pumping is as
important as evaluating the volume of groundwater flow into and out of the district,
between aquifers within the district (as applicable), interactions with surface water
(as applicable), recharge to the aquifer system (as applicable), and other metrics that
describe the impacts of that pumping. In addition, assumptions regarding
precipitation, recharge, and interaction with streams are specific to particular
historic time periods.
Because the application of the groundwater models was designed to address regional
scale questions, the results are most effective on a regional scale. The TWDB makes
no warranties or representations related to the actual conditions of any aquifer at a
particular location or at a particular time.
It is important for groundwater conservation districts to monitor groundwater
pumping and overall conditions of the aquifer. Because of the limitations of the
groundwater model and the assumptions in this analysis, it is important that the
groundwater conservation districts work with the TWDB to refine this analysis in the
future given the reality of how the aquifer responds to the actual amount and
location of pumping now and in the future. Historic precipitation patterns also need
to be placed in context as future climatic conditions, such as dry and wet year
precipitation patterns, may differ and affect groundwater flow conditions.
GAM Run 15-001: Trinity Glen Rose Groundwater Conservation District Management Plan February 17, 2015 Page 10 of 10
REFERENCES:
Aschenbach, E. M., 2010, GAM Run 09-032: Texas Water Development Board, GAM Run 09-032 Report, 7 p., http://www.twdb.texas.gov/groundwater/docs/GAMruns/GR09-32.pdf.
Harbaugh, A. W., 2009, Zonebudget Version 3.01, A computer program for computing subregional water budgets for MODFLOW ground-water flow models, U.S. Geological Survey Groundwater Software.
Harbaugh, A. W., and McDonald, M. G., 1996, User’s documentation for MODFLOW-96, an update to the U.S. Geological Survey modular finite-difference groundwater-water flow model: U.S. Geological Survey Open-File Report 96-485, 56 p.
Jones, Ian. C., Anaya, R. and Wade, S., 2009, Groundwater Availability Model for the Hill County Portion of the Aquifer System, Texas: Numerical Simulations through 1999- Model Report, 196 p., http://www.twdb.texas.gov/groundwater/models/gam/trnt_h/TRNT_H_2009_Update_Model_Report.pdf.
National Research Council, 2007, Models in Environmental Regulatory Decision Making Committee on Models in the Regulatory Decision Process, National Academies Press, Washington D.C., 287 p., http://www.nap.edu/catalog.php?record_id=11972.
Texas Water Code, 2011, http://www.statutes.legis.state.tx.us/docs/WA/pdf/WA.36.pdf