trends in remittances to latin america and the caribbean ... · trends in remittances to latin...
TRANSCRIPT

Trends in Remittances to Latin America and the Caribbean in 2014
by Manuel Orozco,
Laura Porras and
Julia Yansura
Inter-American Dialogue
February 24th, 2015

2
AN INITIATIVE OF
3
AN INITIATIVE OF
Contents Introduction .................................................................................................................................................. 4
Trends in Remittances to Latin America and the Caribbean in 2014 ........................................................... 5
Factors Driving Remittance Growth: The US Labor Market...................................................................... 6
Factors Driving Remittance Growth: Migratory Trends............................................................................ 7
Additional Drivers of Remittance Growth: Remittance-Sending Behaviors ............................................. 9
Country Analyses: Cuba, Panama, Spain and Mexico ................................................................................. 10
The Cuban question: will remittances increase under the new status quo? ......................................... 10
Is Panama acting as a middle man? ........................................................................................................ 12
Will Spain’s remittances rebound in 2015? ............................................................................................ 13
Mexico and its Migration Trends ............................................................................................................ 14
4
AN INITIATIVE OF
Introduction Remittances constitute a major economic force in Latin America and the Caribbean, where they are estimated to have grown 4% in 2014, reaching at least $62.3 billion in 2014. In light of this growth, remittance trends, such as growth above 7% for Mexico and changes in policy toward Cuba, have important implications for national development in Latin America and the Caribbean.
Many households in the region rely on remittances, along with a few other sources of income, to help cover expenses related to food, housing, education, and health. That remittances enable them to cover these important areas is no doubt positive. It is also important to consider how remittances can build prosperity among households and communities throughout the region. Part of the answer lies in access to usable, reliable, and affordable remittance and financial services.
Key findings of this report include:
The 2014 growth in remittances to Latin American and the Caribbean was substantial but uneven: Mexico, along with most Central American and Caribbean countries, saw growth, while South American countries did not.
Growth is driven by the improving US labor market, new migration patterns, and changes in migrants’ frequencies and methods of sending money home.
2015 will be impacted by growth in remittances from the US and re-establishment of higher migration flows. Spain’s economic growth will also play a relevant role. The impact of immigration and bilateral policies will gain importance in new ways.
At the end of the article, you will find country analyses for Cuba, Panama, Spain, and Mexico:
The Cuban question: will remittances increase under the new status quo? Is Panama acting as a middle man? Will Spain’s remittances rebound in 2015? Mexico and its migration trends
5
AN INITIATIVE OF
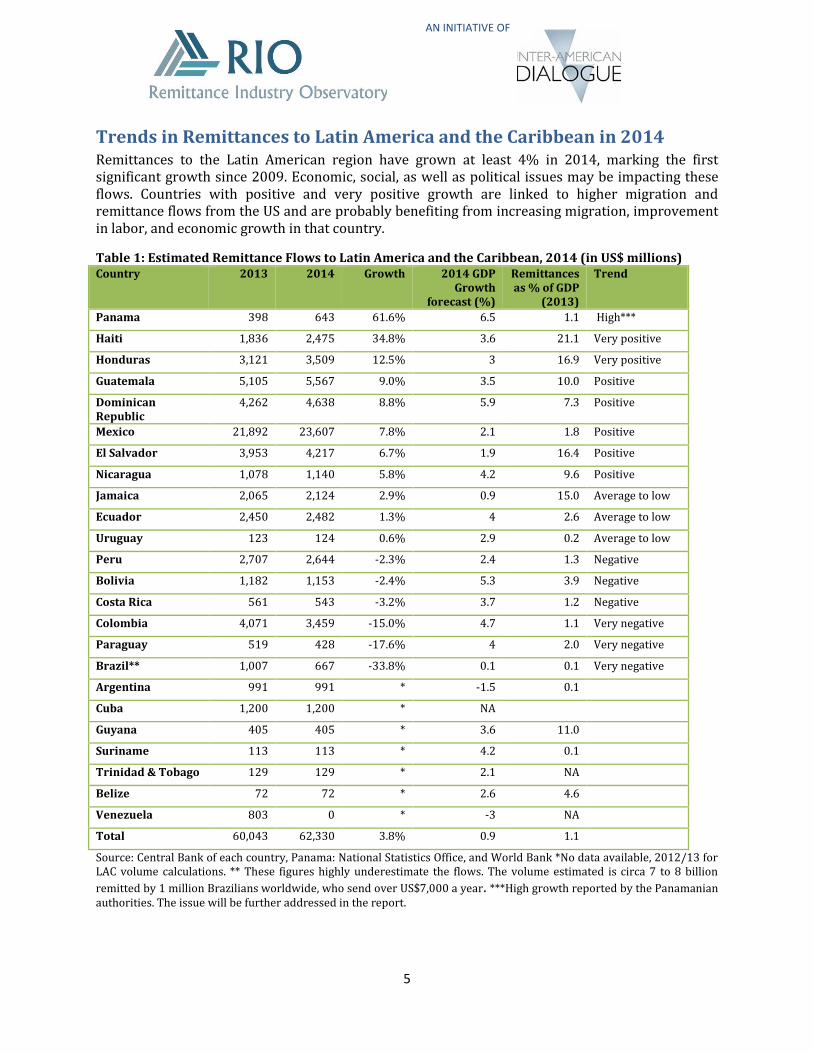
Trends in Remittances to Latin America and the Caribbean in 2014 Remittances to the Latin American region have grown at least 4% in 2014, marking the first significant growth since 2009. Economic, social, as well as political issues may be impacting these flows. Countries with positive and very positive growth are linked to higher migration and remittance flows from the US and are probably benefiting from increasing migration, improvement in labor, and economic growth in that country.
Table 1: Estimated Remittance Flows to Latin America and the Caribbean, 2014 (in US$ millions) Country 2013 2014 Growth 2014 GDP
Growth forecast (%)
Remittances as % of GDP
(2013)
Trend
Panama 398 643 61.6% 6.5 1.1 High***
Haiti 1,836 2,475 34.8% 3.6 21.1 Very positive
Honduras 3,121 3,509 12.5% 3 16.9 Very positive
Guatemala 5,105 5,567 9.0% 3.5 10.0 Positive
Dominican Republic
4,262 4,638 8.8% 5.9 7.3 Positive
Mexico 21,892 23,607 7.8% 2.1 1.8 Positive
El Salvador 3,953 4,217 6.7% 1.9 16.4 Positive
Nicaragua 1,078 1,140 5.8% 4.2 9.6 Positive
Jamaica 2,065 2,124 2.9% 0.9 15.0 Average to low
Ecuador 2,450 2,482 1.3% 4 2.6 Average to low
Uruguay 123 124 0.6% 2.9 0.2 Average to low
Peru 2,707 2,644 -2.3% 2.4 1.3 Negative
Bolivia 1,182 1,153 -2.4% 5.3 3.9 Negative
Costa Rica 561 543 -3.2% 3.7 1.2 Negative
Colombia 4,071 3,459 -15.0% 4.7 1.1 Very negative
Paraguay 519 428 -17.6% 4 2.0 Very negative
Brazil** 1,007 667 -33.8% 0.1 0.1 Very negative
Argentina 991 991 * -1.5 0.1
Cuba 1,200 1,200 * NA
Guyana 405 405 * 3.6 11.0
Suriname 113 113 * 4.2 0.1
Trinidad & Tobago 129 129 * 2.1 NA
Belize 72 72 * 2.6 4.6
Venezuela 803 0 * -3 NA
Total 60,043 62,330 3.8% 0.9 1.1
Source: Central Bank of each country, Panama: National Statistics Office, and World Bank *No data available, 2012/13 for LAC volume calculations. ** These figures highly underestimate the flows. The volume estimated is circa 7 to 8 billion
remitted by 1 million Brazilians worldwide, who send over US$7,000 a year. ***High growth reported by the Panamanian authorities. The issue will be further addressed in the report.
6
AN INITIATIVE OF
The growth levels for each country above reflect the unique circumstances of migrants’ home and host countries. No single factor can explain the recovery in remittances that many countries in the region are experiencing. Rather, a number of factors have interacted and contributed to higher levels of sending in 2014. These factors include employment, new migration patterns, and the frequency and method of sending.
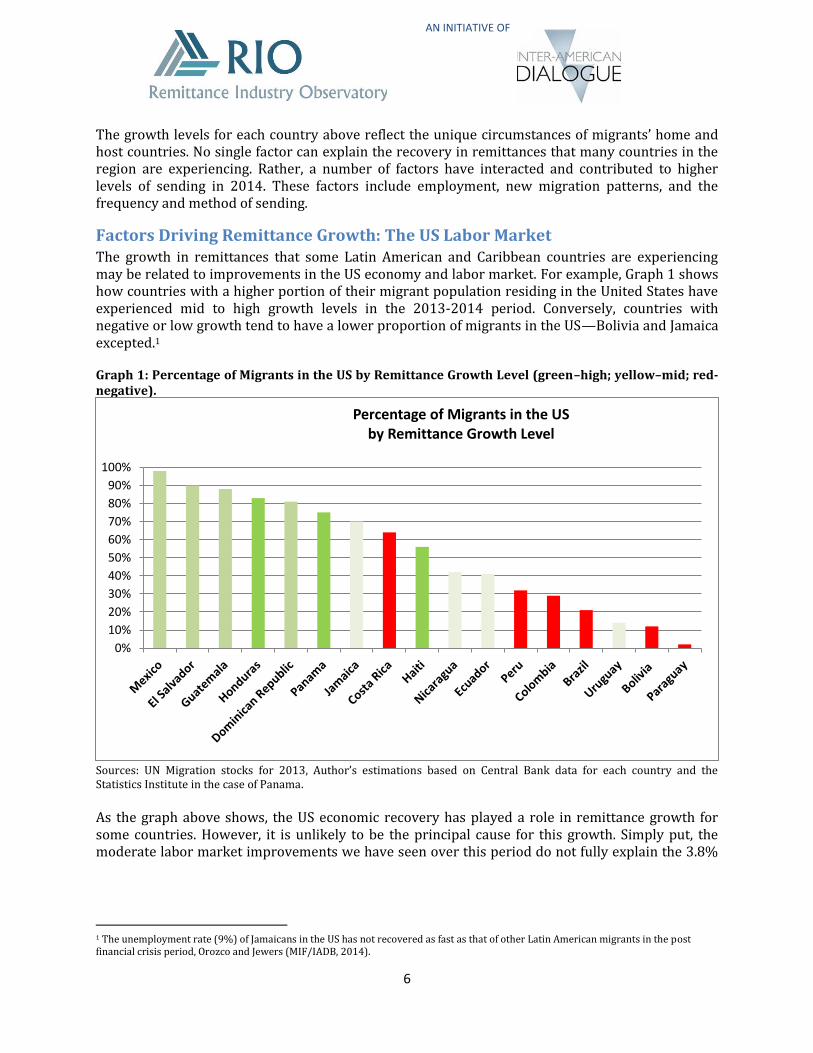
Factors Driving Remittance Growth: The US Labor Market The growth in remittances that some Latin American and Caribbean countries are experiencing may be related to improvements in the US economy and labor market. For example, Graph 1 shows how countries with a higher portion of their migrant population residing in the United States have experienced mid to high growth levels in the 2013-2014 period. Conversely, countries with negative or low growth tend to have a lower proportion of migrants in the US—Bolivia and Jamaica excepted.1
Graph 1: Percentage of Migrants in the US by Remittance Growth Level (green–high; yellow–mid; red-negative).
Sources: UN Migration stocks for 2013, Author’s estimations based on Central Bank data for each country and the Statistics Institute in the case of Panama. As the graph above shows, the US economic recovery has played a role in remittance growth for some countries. However, it is unlikely to be the principal cause for this growth. Simply put, the moderate labor market improvements we have seen over this period do not fully explain the 3.8%
1 The unemployment rate (9%) of Jamaicans in the US has not recovered as fast as that of other Latin American migrants in the post financial crisis period, Orozco and Jewers (MIF/IADB, 2014).
0%
10%
20%
30%
40%
50%
60%
70%
80%
90%
100%
Percentage of Migrants in the US by Remittance Growth Level
7
AN INITIATIVE OF
growth that is expected for the region in 2014, and especially that of those growing in higher proportions (i.e. Mexico, Haiti, and most of Central America).2
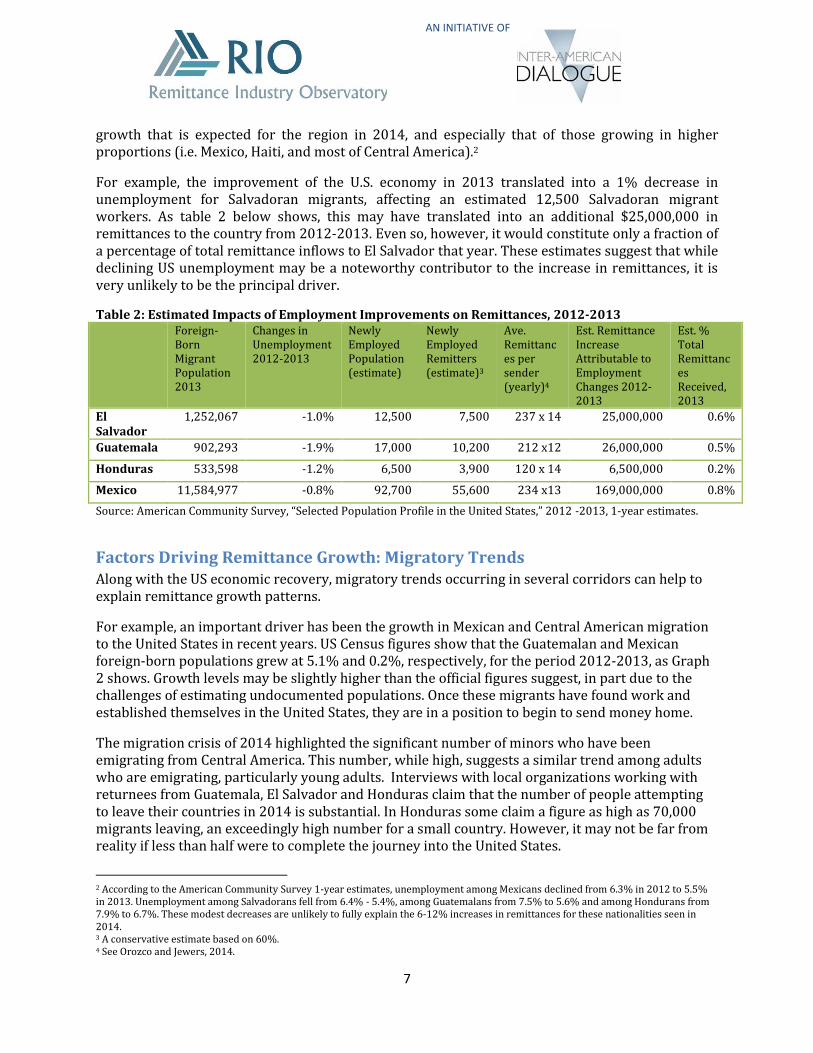
For example, the improvement of the U.S. economy in 2013 translated into a 1% decrease in unemployment for Salvadoran migrants, affecting an estimated 12,500 Salvadoran migrant workers. As table 2 below shows, this may have translated into an additional $25,000,000 in remittances to the country from 2012-2013. Even so, however, it would constitute only a fraction of a percentage of total remittance inflows to El Salvador that year. These estimates suggest that while declining US unemployment may be a noteworthy contributor to the increase in remittances, it is very unlikely to be the principal driver.
Table 2: Estimated Impacts of Employment Improvements on Remittances, 2012-2013 Foreign-
Born Migrant Population 2013
Changes in Unemployment 2012-2013
Newly Employed Population (estimate)
Newly Employed Remitters (estimate)3
Ave. Remittances per sender (yearly)4
Est. Remittance Increase Attributable to Employment Changes 2012-2013
Est. % Total Remittances Received, 2013
El Salvador
1,252,067 -1.0% 12,500 7,500 237 x 14 25,000,000 0.6%
Guatemala 902,293 -1.9% 17,000 10,200 212 x12 26,000,000 0.5%
Honduras 533,598 -1.2% 6,500 3,900 120 x 14 6,500,000 0.2%
Mexico 11,584,977 -0.8% 92,700 55,600 234 x13 169,000,000 0.8%
Source: American Community Survey, “Selected Population Profile in the United States,” 2012 -2013, 1-year estimates.
Factors Driving Remittance Growth: Migratory Trends Along with the US economic recovery, migratory trends occurring in several corridors can help to explain remittance growth patterns.
For example, an important driver has been the growth in Mexican and Central American migration to the United States in recent years. US Census figures show that the Guatemalan and Mexican foreign-born populations grew at 5.1% and 0.2%, respectively, for the period 2012-2013, as Graph 2 shows. Growth levels may be slightly higher than the official figures suggest, in part due to the challenges of estimating undocumented populations. Once these migrants have found work and established themselves in the United States, they are in a position to begin to send money home.
The migration crisis of 2014 highlighted the significant number of minors who have been emigrating from Central America. This number, while high, suggests a similar trend among adults who are emigrating, particularly young adults. Interviews with local organizations working with returnees from Guatemala, El Salvador and Honduras claim that the number of people attempting to leave their countries in 2014 is substantial. In Honduras some claim a figure as high as 70,000 migrants leaving, an exceedingly high number for a small country. However, it may not be far from reality if less than half were to complete the journey into the United States.
2 According to the American Community Survey 1-year estimates, unemployment among Mexicans declined from 6.3% in 2012 to 5.5% in 2013. Unemployment among Salvadorans fell from 6.4% - 5.4%, among Guatemalans from 7.5% to 5.6% and among Hondurans from 7.9% to 6.7%. These modest decreases are unlikely to fully explain the 6-12% increases in remittances for these nationalities seen in 2014. 3 A conservative estimate based on 60%. 4 See Orozco and Jewers, 2014.

8
AN INITIATIVE OF
More importantly, the intention to emigrate is very strong. For example, a survey of Salvadorians in El Salvador conducted in July 2014 found that 32% of households knew of someone who had left El Salvador in the past 12 months, and 25% were thinking of leaving the country themselves.5
Graph 2: Growth in Selected Foreign-Born Populations in the United States, 2008-2013
Source: American Community Survey 2013, 1-year estimates.
The following table details the impacts of this population growth on remittances.
Table 3: Migrant Population Growth 2012-2013 and New Remitters
Population
2012
Population 2013
Population growth (#)
Estimated new remitters6
Estimated new remittances7
Mexican-born population in US
11,563,374 11,584,977 21,603 12,960 US$39,500,0008
Guatemalan-born population in US
858,530 902,293 43,763 26,260 US$66,800,0009
Source: American Community Survey, “Selected Population Profile in the United States,” 2012 -2013, 1-year estimates.
It is also important to consider whether a higher percent of Mexican migrants may be sending money than before. Historically, about 60% of Mexican migrants have remitted, but in light of stricter border controls, it is possible that seasonal labor migrants are delaying their return home to Mexico and remitting money rather than returning with cash. An increase from 60 to 65%, for example, would have significant impacts on overall remittance volumes and would help to explain the overall increases that have been seen in 2013-2014. Trends in Mexican remittances are discussed in greater detail in the final section of the report.
5 Household survey of Salvadorans in El Salvador, sample size 1008, carried out by Borge & Associados, July 2014. 6 Based on estimate of 60%. 7 Estimate based on recent survey data showing Mexicans remit on average $234 13 times a year and Guatemalans send on average $212 12 times a year. 8 This estimate is based on an average of $234 per remittance x13 remittances a year x 12,960 new remitters =39,500,000 9 This estimate is based on an average of $ 212 per remittance x12 remittances a year x 26,260 new remitters = 66,800,000
-8.00%
-6.00%
-4.00%
-2.00%
0.00%
2.00%
4.00%
6.00%
8.00%
2010 - 2011 2011 - 2012 2012 - 2013
El Salvador
Guatemala
Honduras
Mexico

9
AN INITIATIVE OF
South-South migration trends are also playing an important role in remittance growth trends. In the case of Colombia, for example, negative growth is probably influenced by the difficulties of sending remittances from Venezuela,10 where 43% of Colombian migrants reside.11
Additional Drivers of Remittance Growth: Remittance-Sending Behaviors The overall increase in remittances to the region has also been driven in part by migrants’ frequency and methods of sending money home. As the table below shows, immigrants are remitting more often, while average amounts have not changed significantly, translating into market growth. The trend to remit more often is, of course, also related to the two variables mentioned above: improvements in the US economy and migration patterns.
Table 4: Average Amount and Number of Transfers, 2009-2013 Comparison
Average Amount Sent Average Number of Transfers per Year 2009 2013 2009 2013
$205 $212 12 Transfers 15 Transfers
3% growth
7% growth
Source: Orozco and Jewers (2014).
Another important consideration is the client base willing and able to use technology for remittances. By 2013, more immigrants were prepared to switch remittance methods than in 2010, particularly through online services or mobile banking. In 2010, just 4% of respondents indicated using the internet to check their bank accounts or send money, compared to 12% in 2013. Higher internet access, which increased from 30% in 2006 to 70% in 2013, facilitates this behavior. Ownership of smartphones has also increased to 45% in 2013.12
On the receiving side, a similar trend may be emerging: a recent study of Salvadorans in El Salvador found that remittance recipients had higher access to mobile phones when compared to the total population.13 An increasing willingness to use technology-driven remitting methods may be facilitating the increased frequency of sending that was mentioned in Table 4.
In light of the recovery of remittances to many countries in the region, it is important to consider their relationship to development and the policies and strategies that can be used to deepen their development impact.
As has been discussed, growth in remittances to Latin America and the Caribbean has been driven by the improving US labor market, new migration patterns, and changes in migrants’ frequencies and methods in sending.
The following section delves into specific country case studies for Cuba, Panama. Spain, and Mexico.
10 See, for example, http://www.eltiempo.com/mundo/latinoamerica/envio-de-remesas-desde-venezuela-/14499495 11 UN Migration stocks for 2013. 12 Orozco and Jewers, 2014. 13 Survey of 1010 Salvadorans in 68 municipalities of El Salvador, July 21 – 27, 2014.

10
AN INITIATIVE OF
Country Analyses: Cuba, Panama, Spain and Mexico
The Cuban question: will remittances increase under the new status quo?
The recent diplomatic exchanges between the United States and Cuba bring to light thousands of questions about the future of Cuba. One important aspect to consider is the liberalization of certain financial restrictions, including remittances. In particular, we may see an impact on remittance sending patterns and the modernization of payments.
The impact of remittances at the national and household level Currently, less than 60% of Cuban migrants remit, at an average of US$1,250 a year. However, the economic stimulus from this opening, as well as the incentive to reconnect, may generate growth in remittance transfers.
This growth can be estimated based on the minimum propensity to remit and the average amounts that migrants in the United States send to Latin America and the Caribbean.14 Although the growth in the propensity to remit and in transaction size may in fact be larger, this can serve as a modest benchmark of what is to come. In turn, growth in remittances from the U.S. by the end of 2016 could double: considering that 15% more people would remit, and at least two thirds of all senders would send US$2,400, the average remitted to other Caribbean countries, the result would yield a projected increase in remittances of one billion dollars annually.
Table 5: US-Cuba Remittances: Current Context and Potential for Growth Actual Potential Estimated
Cuban remitters 594,000 702,000 702,000
Percent migrant adults remitting 55% 65% -
Annual average $1,250 $2,400 [66% send US$2400; 33% US$1250]
Annual volume from the U.S. $770,000,000 $1,747,200,000 $ 1,401,543,000
Source: Orozco, Manuel. Based on surveys carried out in 2005, 2010 and 2013.
This increase will create growth in disposable income among households that receive remittances and will generate greater consumption, savings and investment. Currently, the remittance dependency among Cuban recipients is 60% out of a total income of around $2,000. An increase in remittances will generate a strong demand for foods and daily household items, in turn stimulating economic productivity and international trade.
However, the impact of growth in remittances may also be seen in savings and investment. More than 70% of remittance recipient households have a stock of savings of around $700, the vast majority of which is informal, or outside the formal banking system – this may amount to $2.8 billion. With an increase in remittances, the number of people with liquid savings would also increase.
With regards to investment, a study carried out in 2010 and 2013 found consistently that 30% of Cuban remittance recipients want to invest in a business.15 Of these, more than half said they
14
Currently, only Mexicans send in a lower percentage than other groups (65%) and people from the Caribbean send an average amount
($2,400). 15 2013 survey of Cubans in Cuba about the economic reform, and their interest in investing in a business.

11
AN INITIATIVE OF
expected to receive financing from their family in the United States. This suggests that around 5% of those who send money also may finance a family business in Cuba.
The projected increase in remitters would mean that between 25,000-35,000 new and already existing businesses would receive around $7,500 in financing, reaching a total of US$250,000,000 for micro-businesses in Cuba. Ever since the reforms passed, there has been talk of investment opportunities in Cuba, and many Cubans in Cuba have commented on the increase in business. The majority of this trade is in services for both local and international (tourist) markets, and according to some Cuban economists, there is still room for growth.
Modernization of payments The liberalization of US financial restrictions will have a direct effect on the modernization of payment systems in Cuba, accelerating the development of more efficient systems such as electronic transfers (via internet, mobile phone, or card). This modernization, which is already slowly underway, will mean greater investment in larger numbers of payment points, including point of sales terminals, expansion of internet and ATMs, and the bancarization of merchants for the transactional public. Most importantly, the interconnectivity with the United States will open doors for commercial businesses, such as the tourism industry, which will increase transactions and commissions.
Currently there are 8 banks and 14 non-banking financial institutions in the country, with fewer than 500 ATMs (compared to 3,000 ATMs in the Dominican Republic). The financial system is relatively weak, with global loan portfolio of 2 billion in Cuban pesos. At most, between production and consumption, and with little financial access, 20% of people have bank accounts.
With this financial opening, there are opportunities to increase commercial and financial transactions with US credit cards. This means that businesses will be able to increase their activities abroad with Cuba, and the US will be able to sell more to Cuba. Cubans will have more options for sending money, not only the option to send what is needed, but also to consider various methods of sending that are more efficient and low-cost, and make it easier to send more money. The result will be a process of modernization in the Cuban economy through increasingly low-cost payment methods.
The modernization of payment methods in a country is important because reduces the time it takes to carry out settlements of commercial obligations. Those who send remittances will be able to consider using various companies and directly promote Cuban financial inclusion. Recipient households will be able to receive money at a bank or into a bank account, which may promote bankarization. They will also have the option to use debit cards, which will stimulate the use of card-based transactions in Cuba. One important effect of this is that clients will have the opportunity to build a credit history and be eligible for commercial loans.
12
AN INITIATIVE OF
Some of the changes in US legislation regarding transfers to Cuba included16:
- Cap amounts for remittances changed from $500 to $2,000 per quarter, and amounts carried by travelers to US$10,000 - Sending money: opened the possibility of sending remittances “to support the development of private businesses, including
small farms” and to “facilitate non-immigrant travel by an individual in Cuba to the United States under circumstances where humanitarian need is demonstrated, including illness or other medical emergency.” Investment prohibition stands,
though. - U.S.-registered brokers or dealers in securities and U.S.-registered money transmitters will be permitted to process
authorized remittances to Cuba without having to apply for a specific license; “payment forwarding services and noncommercial organizations acting on behalf of donors, that wish to provide services in connection with the collection
or forwarding of remittances”17 still need a specific authorization from OFAC. - All licensed remittance forwarders, including depository institutions that forward remittances, are required to collect
information beyond that required for other corridors, and comply with additional with legislation, such as ensuring Government and political party members are not among recipients.
- Direct correspondent accounts in Cuban financial institutions are still not authorized; testing arrangements regarding these types of accounts are authorized.
Is Panama acting as a middle man?
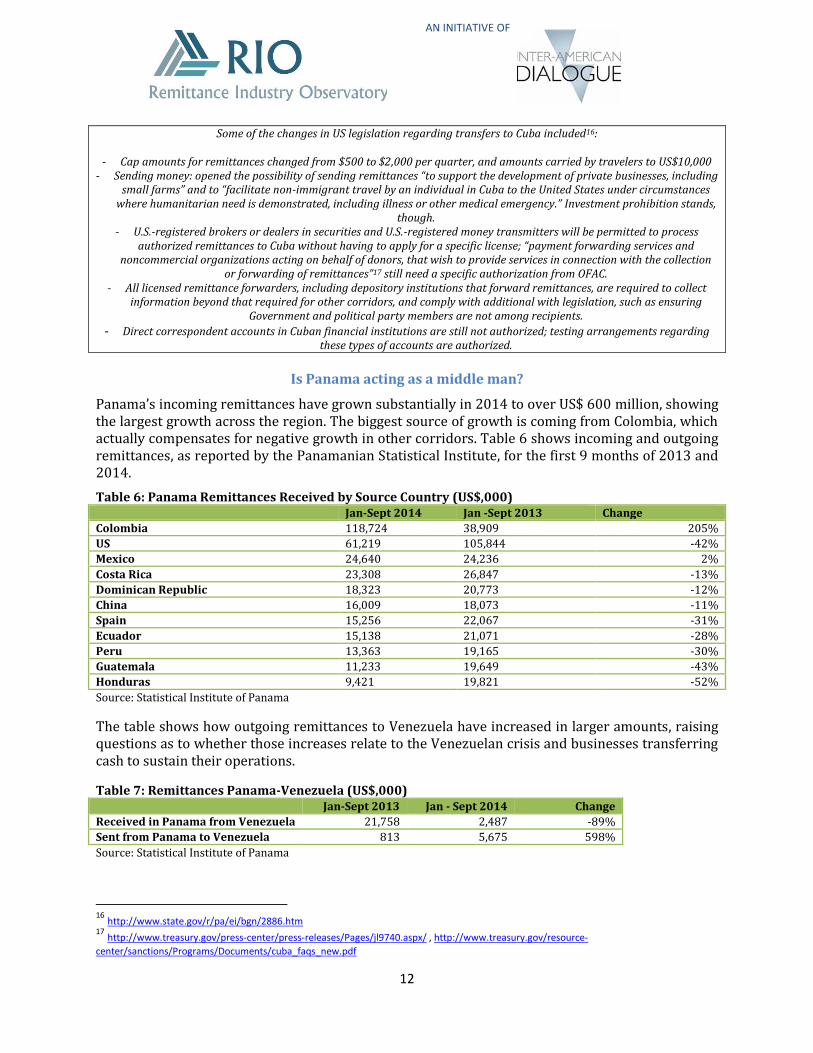
Panama’s incoming remittances have grown substantially in 2014 to over US$ 600 million, showing the largest growth across the region. The biggest source of growth is coming from Colombia, which actually compensates for negative growth in other corridors. Table 6 shows incoming and outgoing remittances, as reported by the Panamanian Statistical Institute, for the first 9 months of 2013 and 2014.
Table 6: Panama Remittances Received by Source Country (US$,000) Jan-Sept 2014 Jan -Sept 2013 Change
Colombia 118,724 38,909 205%
US 61,219 105,844 -42%
Mexico 24,640 24,236 2%
Costa Rica 23,308 26,847 -13%
Dominican Republic 18,323 20,773 -12%
China 16,009 18,073 -11%
Spain 15,256 22,067 -31%
Ecuador 15,138 21,071 -28%
Peru 13,363 19,165 -30%
Guatemala 11,233 19,649 -43%
Honduras 9,421 19,821 -52%
Source: Statistical Institute of Panama
The table shows how outgoing remittances to Venezuela have increased in larger amounts, raising questions as to whether those increases relate to the Venezuelan crisis and businesses transferring cash to sustain their operations.
Table 7: Remittances Panama-Venezuela (US$,000) Jan-Sept 2013 Jan - Sept 2014 Change
Received in Panama from Venezuela 21,758 2,487 -89%
Sent from Panama to Venezuela 813 5,675 598%
Source: Statistical Institute of Panama
16
http://www.state.gov/r/pa/ei/bgn/2886.htm 17
http://www.treasury.gov/press-center/press-releases/Pages/jl9740.aspx/ , http://www.treasury.gov/resource-
center/sanctions/Programs/Documents/cuba_faqs_new.pdf
13
AN INITIATIVE OF
Will Spain’s remittances rebound in 2015?
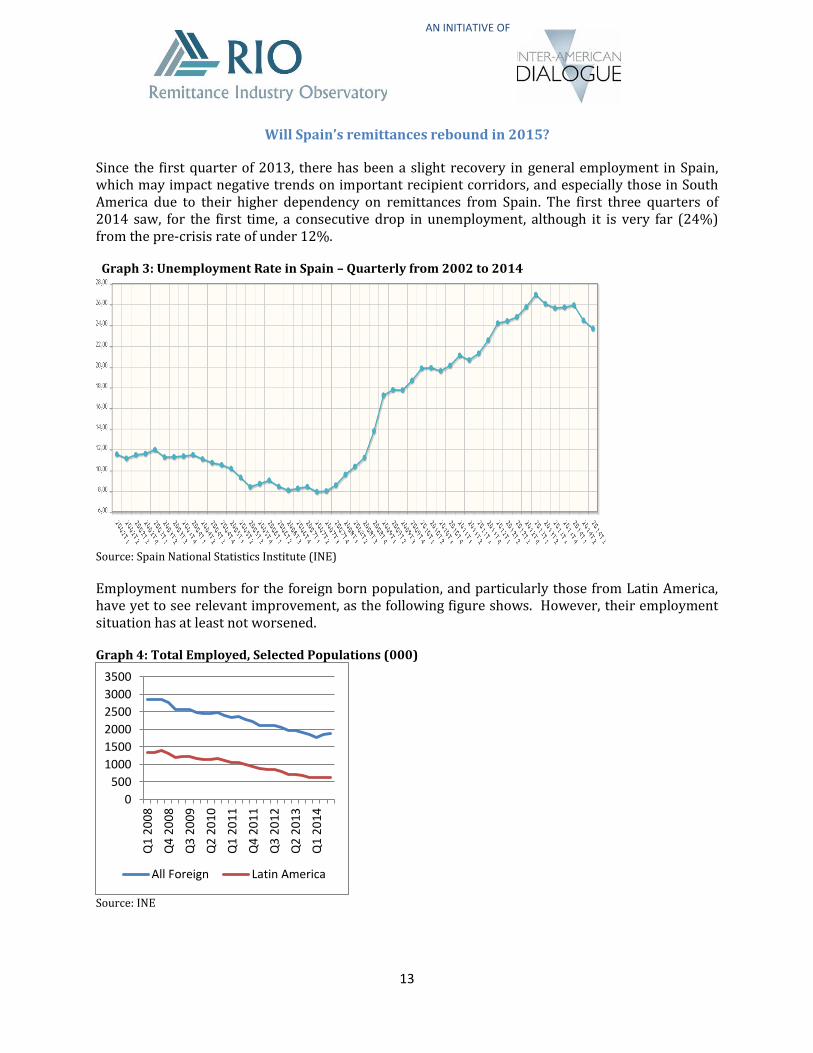
Since the first quarter of 2013, there has been a slight recovery in general employment in Spain, which may impact negative trends on important recipient corridors, and especially those in South America due to their higher dependency on remittances from Spain. The first three quarters of 2014 saw, for the first time, a consecutive drop in unemployment, although it is very far (24%) from the pre-crisis rate of under 12%.
Graph 3: Unemployment Rate in Spain – Quarterly from 2002 to 2014
Source: Spain National Statistics Institute (INE)
Employment numbers for the foreign born population, and particularly those from Latin America, have yet to see relevant improvement, as the following figure shows. However, their employment situation has at least not worsened.
Graph 4: Total Employed, Selected Populations (000)
Source: INE
0
500
1000
1500
2000
2500
3000
3500
Q1
20
08
Q4
20
08
Q3
20
09
Q2
20
10
Q1
20
11
Q4
20
11
Q3
20
12
Q2
20
13
Q1
20
14
All Foreign Latin America
14
AN INITIATIVE OF
Mexico and its Migration Trends
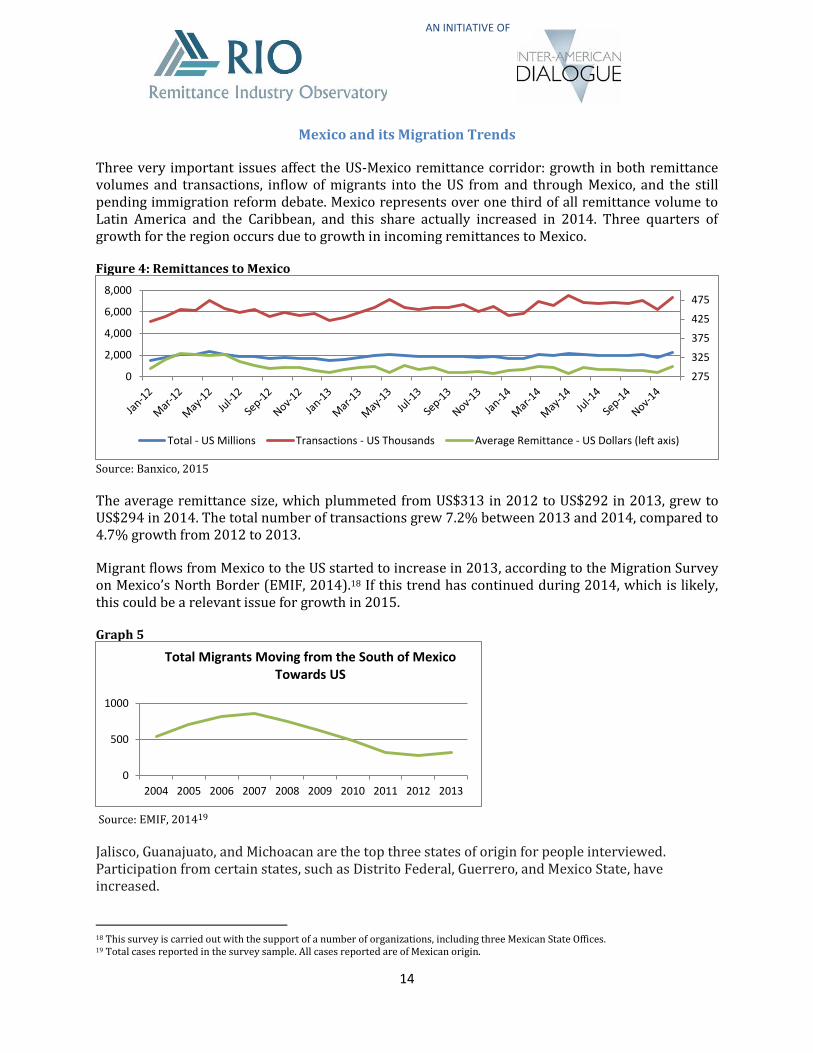
Three very important issues affect the US-Mexico remittance corridor: growth in both remittance volumes and transactions, inflow of migrants into the US from and through Mexico, and the still pending immigration reform debate. Mexico represents over one third of all remittance volume to Latin America and the Caribbean, and this share actually increased in 2014. Three quarters of growth for the region occurs due to growth in incoming remittances to Mexico.
Figure 4: Remittances to Mexico
Source: Banxico, 2015
The average remittance size, which plummeted from US$313 in 2012 to US$292 in 2013, grew to US$294 in 2014. The total number of transactions grew 7.2% between 2013 and 2014, compared to 4.7% growth from 2012 to 2013.
Migrant flows from Mexico to the US started to increase in 2013, according to the Migration Survey on Mexico’s North Border (EMIF, 2014).18 If this trend has continued during 2014, which is likely, this could be a relevant issue for growth in 2015.
Graph 5
Source: EMIF, 201419
Jalisco, Guanajuato, and Michoacan are the top three states of origin for people interviewed. Participation from certain states, such as Distrito Federal, Guerrero, and Mexico State, have increased.
18 This survey is carried out with the support of a number of organizations, including three Mexican State Offices. 19 Total cases reported in the survey sample. All cases reported are of Mexican origin.
275
325
375
425
475
0
2,000
4,000
6,000
8,000
Total - US Millions Transactions - US Thousands Average Remittance - US Dollars (left axis)
0
500
1000
2004 2005 2006 2007 2008 2009 2010 2011 2012 2013
Total Migrants Moving from the South of Mexico Towards US