trends in infrastructure in latin america - world bank · trends in infrastructure in latin...
TRANSCRIPT

Trends in Infrastructure in Latin America, 1980-2001
César Calderón * Central Bank of Chile
Luis Servén *
The World Bank
Abstract There is widespread concern across Latin America that the provision of infrastructure services has suffered as a consequence of the retrenchment of the public sector and the insufficient response of the private sector to the opening up of infrastructure industries to private participation in most countries. This paper documents the recent trends in infrastructure stocks and infrastructure investment in major Latin American economies. Using an updated dataset constructed for this task, the paper describes the evolution of the quantity and quality of infrastructure assets – power, transport, telecommunications – as well as the investment expenditures of the public and private sectors. The paper finds that Latin America lags behind the international norm in terms of infrastructure quantity and quality, and there is little evidence that the gap may be closing – except in the telecommunications sector. Furthermore, overall infrastructure investment has fallen, as a combined result of the retrenchment of public investment and the limited response of the private sector, which has been mostly confined to the telecommunications industry. However, there is considerable disparity across countries. On the whole the data show that the countries most successful in attracting large volumes of private investment (Chile, Colombia, Bolivia) are precisely those where public investment has remained high. JEL Classification: H54, O54 Keywords: Infrastructure Assets, Fiscal Retrenchment, Latin America ________________________________________________________________________ * We are grateful to Marianne Fay, Danny Leipziger and Guillermo Perry for helpful comments and discussions on an earlier draft, and to Patricia Macchi for excellent research assistance. Any remaining errors are our own. The views expressed in this paper are only ours and do not represent those of the Central Bank of Chile or the World Bank.
Pub
lic D
iscl
osur
e A
utho
rized
Pub
lic D
iscl
osur
e A
utho
rized
Pub
lic D
iscl
osur
e A
utho
rized
Pub
lic D
iscl
osur
e A
utho
rized
Pub
lic D
iscl
osur
e A
utho
rized
Pub
lic D
iscl
osur
e A
utho
rized
Pub
lic D
iscl
osur
e A
utho
rized
Pub
lic D
iscl
osur
e A
utho
rized

1. Introduction
There is widespread concern across Latin America that the provision of infrastructure services has suffered as a consequence of the retrenchment of the public sector under the pressures of fiscal discipline, and the insufficient response of the private sector to the opening up of infrastructure industries to private participation in most countries.
A recent empirical analysis of infrastructure trends in the region (Calderón,
Easterly and Servén 2003) provided a first assessment of the patterns of infrastructure stocks and their accumulation in major countries in the region, largely confirming those concerns. The study found a wide gap in infrastructure provision between Latin America and other regions, and a decline in infrastructure investment in several countries -- with the telecommunications sector as the only exception – following the fiscal retrenchment and the opening up of infrastructure to private activity since the late 1980s.
Those findings were based on a large dataset on infrastructure stocks and investment flows assembled for the research. The dataset collected information on infrastructure assets and their quality for a large sample of countries, as well as infrastructure investment flows for major Latin American countries, over the period 1980-97.1 This paper builds on that work to document the recent trends in infrastructure assets and their quality, infrastructure investment, and patterns of private and public sector participation across countries and infrastructure sectors in Latin America. The paper is based on an extension of the earlier data until 2000-2001. A companion paper uses the updated data to assess the contribution of infrastructure to growth and income equality in Latin America.2
The scope of the update has been largely determined by the availability of information, and hence reflects the limitations of the latter. For this reason, some of the findings summarized below have to be viewed as highly preliminary.
The rest of the paper is organized as follows. Section 2 reviews the trends in the quantity and quality of infrastructure in Latin America. Section 3 turns to the trends in infrastructure investment. Section 4 provides some concluding remarks. The appendix gives details on the sources of the investment data described in the main text. The main sources of the infrastructure quantity and quality data are described in Calderón, Easterly and Servén (2003).
1 The database is available at http://wbln1018.worldbank.org/LAC/LAC.nsf/ECADocByUnid/9A886DFD517053AB85256D440002B206?Opendocument 2 Calderón and Servén (2004)
2

2. Trends in the quantity and quality of infrastructure
We start by reviewing the main trends in the availability and quality of infrastructure over the last two decades. We focus on 19 major Latin American and Caribbean countries, excluding the smaller Caribbean economies because their data availability is more limited, and also to avoid influencing the region-wide statistics with too many observations from small island economies. In some cases, however, constraints posed by data availability force us to limit the analysis to a narrower set of Latin American countries.
To place Latin America’s trends in context, we use a comparative perspective. We
use two sets of comparator countries. The first one comprises the seven East Asian Miracle economies. These are Hong Kong (China), Indonesia, Korea, Malaysia, Singapore, Taiwan, and Thailand. The second comparator is the entire set of middle-income developing economies for which information is available; this includes a total of 64 countries.3 Further, we also assess the progress of these developing regions in terms of infrastructure indicators vis-à-vis the 21 industrial economies of the OECD4.
Of course, regional differences in infrastructure trends may partly reflect the
differences across regions in key infrastructure drivers (e.g., geographic and demographic factors, per capita income).5 It is not trivial to assess this hypothesis, however, since some of those drivers (notably income levels) are themselves affected by infrastructure trends. Although we do not explore the issue of causality here, below we review major trends in measures of infrastructure corrected for changes in those key drivers. In Calderón and Servén (2003, 2004) we pursue rigorously the statistical identification of the exogenous component of observed infrastructure trends in order to establish their impact on income and growth.
We focus first on the comparative performance in terms of infrastructure stocks,
and then review indicators of infrastructure quality.
2.1 Infrastructure stocks Telecommunications -- Figure 2.1 shows the evolution of several telecommunications capacity indicators over the last two decades. In each case we show the regional median. Panel (a) presents the number of main telephone lines per worker. It is apparent from the graph that Latin America has trailed the other regions in terms of the growth in phone lines per worker. In 1980, Latin America was roughly on par with other middle income developing countries, and trailed East Asia by a relatively small margin. By 2001, however, Latin America had fallen behind the norm of middle-income developing
3 We use middle-income economies rather than all developing countries because most Latin American countries belong to the former category. Like with the Latin American economies, we exclude countries whose total population is less than half a million. 4 OECD is defined here excluding Korea and Mexico. 5 See Canning (1998).
3

countries, and its number of main phone lines per worker was roughly one-fourth of that of East Asia, which was approaching parity with industrial countries.
Figure 2.1(b) presents the same information for total phone lines, including mobile phones. The pattern is roughly similar to that of the preceding figure, although over 1995-2001 the rapid expansion of mobile lines seems to have allowed an incipient catch-up of Latin America with the rest of middle-income countries.
A more accurate measure of the availability of phone services is the connection capacity of local exchanges, portrayed in Figure 2.1(c). However, information on this measure is more limited, and does not extend to all the countries in the preceding graphs. Nevertheless, the pattern is similar to that in panel (a) above: in 1980, there was a modest lag of Latin America vis-à-vis East Asia, and virtual parity with middle income developing countries; by 2001, Latin America falls short of the middle-income median and places far behind the East Asia norm.
Finally, panel (d) of Figure 2.1 provides a comparative perspective on the number of Internet hosts per worker. The trends in this new telecommunications technology are not different from those found in older ones: Latin America, as well as middle income developing economies, lag far behind East Asia (let alone industrial economies) along this dimension too.
0
200
400
600
800
1,000
1,200
1,400
1980 1985 1990 1995 2001
Figure 2.1a. Telephone Main Lines, Medians by Region (lines per 1,000 workers)
LAC (19) EAP7 (7) MIDDLE (64) IND (21)
4

0
500
1,000
1,500
2,000
2,500
3,000
1980 1985 1990 1995 2001
Figure 2.1b. Total Telephone Lines, Medians by Region (lines per 1,000 workers)
LAC (19) EAP7 (7) MIDDLE (64) IND (21)
0
200
400
600
800
1,000
1,200
1,400
1980 1985 1990 1995 2001
Figure 2.1c. Local Connection Capacity, Medians by Region(connection capacity of local exchange per 1,000 workers)
LAC EAP7 MIDDLE IND
5

0
20
40
60
80
100
120
1994 1996 1998 2000 2001
Figure 2.1d. Internet Hosts, Medians by Region(hosts per 1,000 workers)
LAC (19) EAP7 (7) MIDDLE (64) IND (21)
0 100 200 300 400 500 600 700 800 900 1000
NIC
HND
PRY
BOL
GTM
PER
SLV
DOM
ECU
LAC19 median
VEN
PAN
MEX
JAM
COL
BRA
ARG
CHL
CRI
URY
EAP7 median
Figure 2.2. Telephone Main Lines by Country(lines per 1,000 workers)
20011980
6

Behind these region-wide statistics, there is a wide range of variation across Latin American countries. The case of main phone lines is shown in Figure 2.2. At one end, a few countries (Uruguay, Costa Rica, Chile, Argentina) were almost on par with East Asia in terms of main phone lines per worker in 2001. At the other end, a number of smaller, lower-income economies (Nicaragua, Honduras, Paraguay) remained far below the East Asia median, and even the Latin American median. Among the countries shown, Chile was the one having experienced the fastest growth in telecommunications capacity since 1980, while Panama had the slowest. Power – Figure 2.3 shows the trends in power generation capacity per worker. Along this dimension, Latin America has lagged behind not only East Asia, but also the rest of middle-income developing economies. There is little sign of improvement along this dimension – indeed the region’s lag relative to middle income countries developed in the 1990s, while that relative to East Asia has widened considerably in the last five years.
0.0
0.5
1.0
1.5
2.0
2.5
3.0
3.5
4.0
1980 1985 1990 1995 2001
Figure 2.3. Electricity Generating Capacity, Medians by Region(megawatts per 1,000 workers)
LAC (19) EAP7 (7) MIDDLE (64) IND (21)
Like with telecommunications, there is considerable variation across Latin America in power generation capacity per worker. Figure 2.4 shows that in 2001 Paraguay ranked far ahead of the rest of the region; this is due to the huge size of the Itaipú hydroelectric project. Venezuela, Argentina and Chile ranked next, while the Central American economies (except Costa Rica) and Bolivia placed at the bottom. Over the period under consideration, Nicaragua and Peru showed virtually no change in power generation capacity per worker, while Chile had (apart from Paraguay) the fastest growth.
7

0 0.5 1 1.5 2 2.5 3 3
NIC
BOL
HND
GTM
SLV
PER
ECU
COL
DOM
BRA
LAC19 median
MEX
JAM
PAN
CRI
URY
CHL
ARG
VEN
EAP7 median
PRY
Figure 2.4. Electricity Generating Capacity by Country(megawatts per 1,000 workers)
20011980
.5
Transport – We examine the trends in surface transport networks. Unlike with power and telecommunications, in this case we normalize the measures of network density by geographic area, to adjust for the wide disparities in country size present in our cross-country sample.6 Nevertheless, below we also comment on the results under the alternative normalization in terms of the labor force.
Figure 2.5(a) depicts the trends in the total length of the road network.7 There is a huge gap between industrial and developing countries along this dimension, and it has widened in the late 1990s Among the three developing regions shown, Latin America was ahead of the rest in 1980, but by 2001 its road density had barely grown and as a consequence it fell below that of middle-income countries, and even further below East Asia’s.8
Paved roads provide an alternative measure of transport networks. Figure 2.5(b) shows the median length of the paved road network for the country groups under consideration. Like with total roads, the gap between industrial and developing countries in terms of paved road length is huge. However, in this case Latin America has lagged behind the other regions since 1980, unlike in the case of total road length, and the gap 6 For this exercise, we exclude Singapore and Hong-Kong from the set of East Asian comparator countries, in view of the particular physical characteristics (small area and very high population density) of both city-states. 7 A preferable indicator would be the length of the network in lane-km equivalent. Unfortunately, such measure is not widely available. 8 If we look instead at roads normalized by the labor force (rather than area, as done in the text), the relative trends across regions are the same as those shown in the graph, although in terms of levels they rank differently, with Latin America ahead of East Asia, although by a margin that shrinks over time.
8

vis-à-vis East Asia and middle-income developing countries has widened steadily over the last two decades.
0.0
0.2
0.4
0.6
0.8
1.0
1.2
1.4
1980 1985 1990 1995 2001
Figure2.5a. Total Road Length, Medians by Region (km per area)
LAC (19) EAP5 (5) MIDDLE (53) IND (21)
0.0
0.2
0.4
0.6
0.8
1.0
1.2
1.4
1980 1985 1990 1995 2001
Figure 2.5b. Paved Road Length, Medians by Region (km per area)
LAC (19) EAP5 (5) MIDDLE (53) IND (21)
9

0.0
0.2
0.4
0.6
0.8
1.0
1.2
1.4
1980 1985 1990 1995 2001
Figure 2.5c. Road plus Railway Length, Medians by Region (km per area)
LAC (19) EAP5 (5) MIDDLE (53) IND (21)
Finally, combining roads and railways we can obtain a broader picture of the
surface transport network. Figure 2.5(c) shows the regional medians of total road plus railway length. The time and regional patterns in the figure are virtually identical to those in Figure 2.5(a), which simply reflects the dominant role of roads over that of railways in most countries considered.
Figure 2.6 shows the wide variation in the density of the road network across Latin America.9 The road network is particularly large in a few smaller countries, with Jamaica and Costa Rica at the top. These are also the two countries having experienced the biggest expansion of the road network over the period of analysis. In contrast, El Salvador and Guatemala show slight declines -- possibly related to the civil conflicts they suffered during this period. We should note also that, if the size of the road network were measured instead relative to the labor force, the regional leaders would be Costa Rica and Brazil. Under such alternative view, all of the region’s countries would have seen a decline in the size of their road network over 1980-2001, while East Asia would still have experienced an expansion.
10
9 The density of the paved road network and the total surface transport network (road + railway) display a similarly wide variation across countries. To save space, we do not present the corresponding graphs here.

0 0.2 0.4 0.6 0.8 1 1.2 1.4 1.6 1.8
BOL
URY
PER
PRY
ARG
COL
CHL
VEN
HND
GTM
LAC19 median
NIC
ECU
PAN
MEX
EAP5 median
BRA
DOM
SLV
CRI
JAM
Figure 2.6. Road Length by Country(km per area)
20011980
Water – Finally, we examine the regional trends in access to safe water. We use the percentage of population with access to safe water, including treated surface water and untreated but uncontaminated water such as from springs, sanitary wells, and protected boreholes. The underlying data are taken from the World Bank’s World Development indicators, as documented by Fay and Yepes (2003), complemented with national sources. However, the availability of data is more limited than for the other infrastructure assets. Figure 2.7 offers a cross-regional perspective on the proportion of the population with access to safe water. Industrial countries enjoy universal access since 1990, while all three developing regions shown have increased their access over the last decade but still fall short of full coverage. The figure shows that Latin America has made some progress along this dimension, but continues to lag behind the other regions.
Across Latin America, the percentage of population with access to safe water rose in the overwhelming majority of countries, and quite significantly in some cases (Ecuador, Bolivia and El Salvador). However, a few countries (e.g., Colombia) saw instead a decline.
11

0%
10%
20%
30%
40%
50%
60%
70%
80%
90%
100%
EAP7 (6) LAC (21) MIDDLE (48) IND (22)
Figure 2.7. Safe Drinking Water by Region(% of population with access)
91-95 96-00
Source: Fay and Yepes (2003), World Bank and United Nations.
30% 40% 50% 60% 70% 80% 90% 100%
JAM
NIC
ARG
GTM
SLV
ECU
BOL
DOM
PER
COL
HND
LAC median
BRA
PRY
VEN
PAN
TTO
EAP6 median
CHL
MEX
URY
CRI
Figure 2.8. Safe Drinking Water by Country(% of population with access)
96-0091-95
Source: Fay and Yepes (2003), World Bank and United Nations.
12

Adjusted infrastructure stocks – As already noted, much of the variation in infrastructure stocks across countries may be related to differences in countries’ geographic and demographic characteristics. It is also associated with countries’ different levels of economic development. The cross-regional comparisons shown above implicitly take some of these factors into account, to the extent that they focus on infrastructure stocks normalized by the labor force (or, in the case of transport networks, by country area) and include specifically the group of middle-income developing countries among the relevant comparators for Latin America.
We now take a more systematic approach and examine the trends in infrastructure stocks across countries after adjusting for the effect of country-specific characteristics. We do this in two stages. First we construct adjusted infrastructure stocks, defined by the residuals from projecting observed stocks on indicators of country size and demographic characteristics.10 Then we examine the relationship between these adjusted stocks and per capita GDP, as a summary measure of the association between infrastructure endowments and levels of development.11
To construct the adjusted infrastructure measures, we regress the (log) infrastructure stocks per worker (per km2, in the case of transport) on the (log) labor force, the urbanization ratio (i.e., the percentage of urban population in the total) and the (log) country area; this set of explanatory variables is similar to that employed by Canning (1998).12 For simplicity we use a linear specification; however, adding to the set of regressors the squared values of the various explanatory variables causes only minor changes in the results.
The regressions are performed on annual data for the period 1980-2000 covering 104 countries.13 In general, the fit of the regressions is quite satisfactory, and the R2 exceed .70 in all cases. Rather than describing the parameter estimates, which are of no direct interest, we just note that on the whole they reflect a significant positive association of infrastructure stocks with the (log) size of the labor force and the degree of ulrbanization, and a negative association with total country area – except in the case of power generating capacity, for which the latter association is not significant. 10 This is analogous to the practice of defining countries’ adjusted trade openness as the residual from regressing total external trade as a ratio to GDP on variables capturing country size and geographic characteristics. Such procedure has become commonplace in empirical growth studies. 11 The observed empirical association between infrastructure and income levels may reflect causality from the former to the latter (reflecting the aggregate production function, for example) or the reverse (reflecting a positive income elasticity of the demand for infrastructure services) or both at the same time. Without further identifying information, it is not possible to disentangle the various forces at work. 12 The main difference is that Canning uses total population instead of the labor force. In practice, this turns out to be of little consequence. Fay and Yepes (2003) use a similar set of variables in their empirical analysis of infrastructure needs. 13 We limit the sample to countries with population above 500,000 possessing complete data over the 21-year period. Due to the scarcity of data, we do not perform this exercise for the indicator of water access.
13

The figures below plot the adjusted infrastructure stocks, given by the residuals from these regressions, against per capita GDP. For each infrastructure asset, we show the adjusted data for 1980 and 2000; for clarity, only the Latin American countries are shown. The solid line in each figure captures the (full-sample) relation between adjusted infrastructure stocks and per capita income, which in all cases has a significantly positive slope, and will be taken to represent the ‘international norm’. In addition, we also plot one-standard deviation bands around it.
14

Figure 2.9. Adjusted Main Lines per worker(Relative to international norm, logs)
(a) 1980
VENURY
SLV
PRY
PER
PAN
NICMEX
JAM
HND GTM
ECU
DOM
CRI
COL
CHL
BRA
BOL
ARG
-2.0
-1.5
-1.0
-0.5
0.0
0.5
1.0
1.5
2.0
6 7 8 9 10
Log per capita GDP
(b) 2000
ARG
BOL
BRA CHL
COL
CRI
DOM
ECU
GTM
HND
JAM
MEXNIC
PAN
PER
PRYSLV
URY
VEN
-2.0
-1.5
-1.0
-0.5
0.0
0.5
1.0
1.5
2.0
6 7 8 9 10
Log per capita GDP
11
11
Figure 2.9 plots the adjusted measure of telephone density, in terms of main phone lines, for the nineteen Latin American countries in the sample. In 1980, only seven mostly small economies, led by Costa Rica and Panama, had telephone density above the
15
international norm – as measured by geographic and demographic infrastructure correlates and per capita income levels. By 2000, two more countries (El Salvador and Jamaica) were above such norm, while the rest, including most of the region’s larger economies, remained short of it. The latter group includes Uruguay, which in spite of being the region’s leader in terms of total number of main lines (see Figure 2.2 above) still has less telephone density than could be expected given its geographic and demographic features and per capita income levels.
On the whole, however, the graph suggests a partial catch-up of Latin America with the international norm over the last two decades.14 This might seem at odds with the increasing lag suggested by the raw phone density data shown earlier (Figure 2.1a above). The implication is that much of that lag can be attributed to the differential evolution of demographic and economic variables across world regions over the period of analysis.
Figure 2.10 presents similar information for power generation capacity. Unlike with phone density, in this case there is no clear indication of catch-up over time. Most Latin American countries place below the international norm both in 1980 and 2000, and by such yardstick the number of under-performing countries actually rose between the two dates shown. By 2000, only a few Central American economies, plus Paraguay (on account of the Itaipú dam) exceeded the international norm. At the other end, some major countries like Brazil and Peru appear to have fallen further behind over the last two decades.
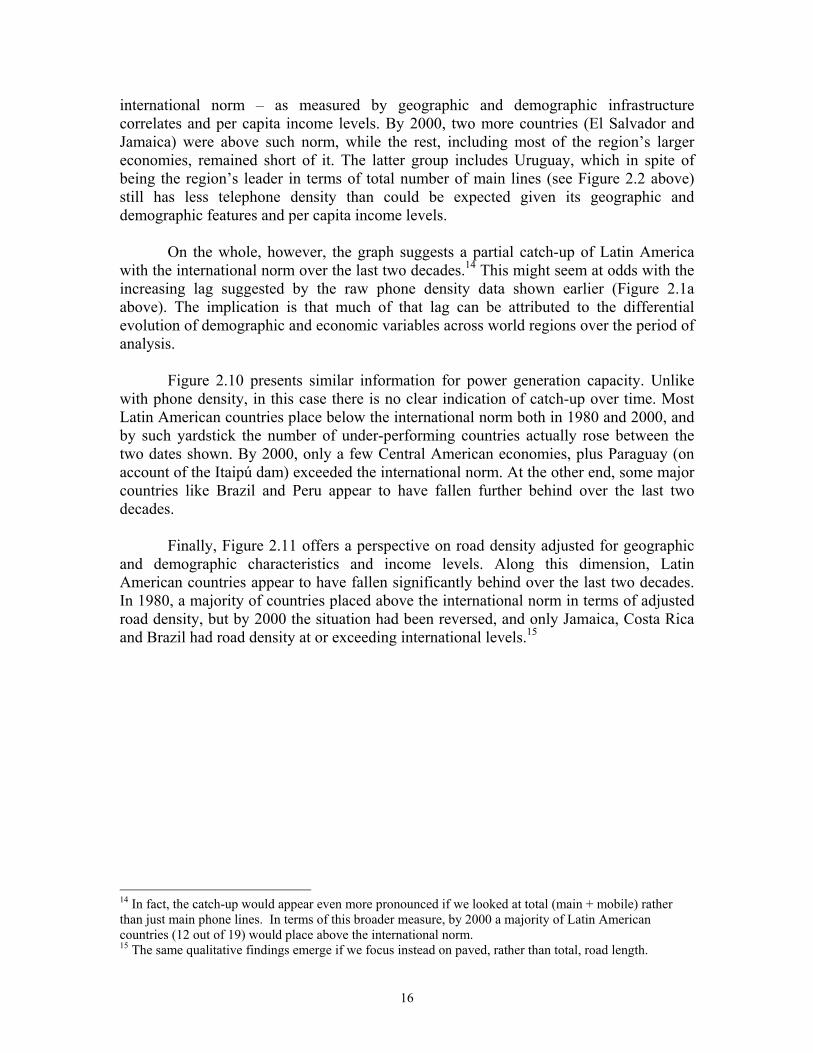
Finally, Figure 2.11 offers a perspective on road density adjusted for geographic and demographic characteristics and income levels. Along this dimension, Latin American countries appear to have fallen significantly behind over the last two decades. In 1980, a majority of countries placed above the international norm in terms of adjusted road density, but by 2000 the situation had been reversed, and only Jamaica, Costa Rica and Brazil had road density at or exceeding international levels.15
14 In fact, the catch-up would appear even more pronounced if we looked at total (main + mobile) rather than just main phone lines. In terms of this broader measure, by 2000 a majority of Latin American countries (12 out of 19) would place above the international norm. 15 The same qualitative findings emerge if we focus instead on paved, rather than total, road length.
16

Figure 2.10. Adjusted Electricity Generation Capacity per worker(Relative to international norm, logs)
(a) 1980
VEN
URY
SLVPRY
PER
PAN
NIC
MEX
JAM
HNDGTMECUDOM
CRI
COL
CHL
BRA
BOL
ARG
-2.0
-1.5
-1.0
-0.5
0.0
0.5
1.0
1.5
2.0
6 7 8 9 10
Log per capita GDP
(a) 2000
ARGBOL
BRA
CHLCOL
CRI
DOMECU
GTM
HND
JAM
MEXNIC
PAN
PER
PRY
SLV
URY
VEN
-2.0
-1.5
-1.0
-0.5
0.0
0.5
1.0
1.5
2.0
6 7 8 9 10
Log per capita GDP
11
11
17
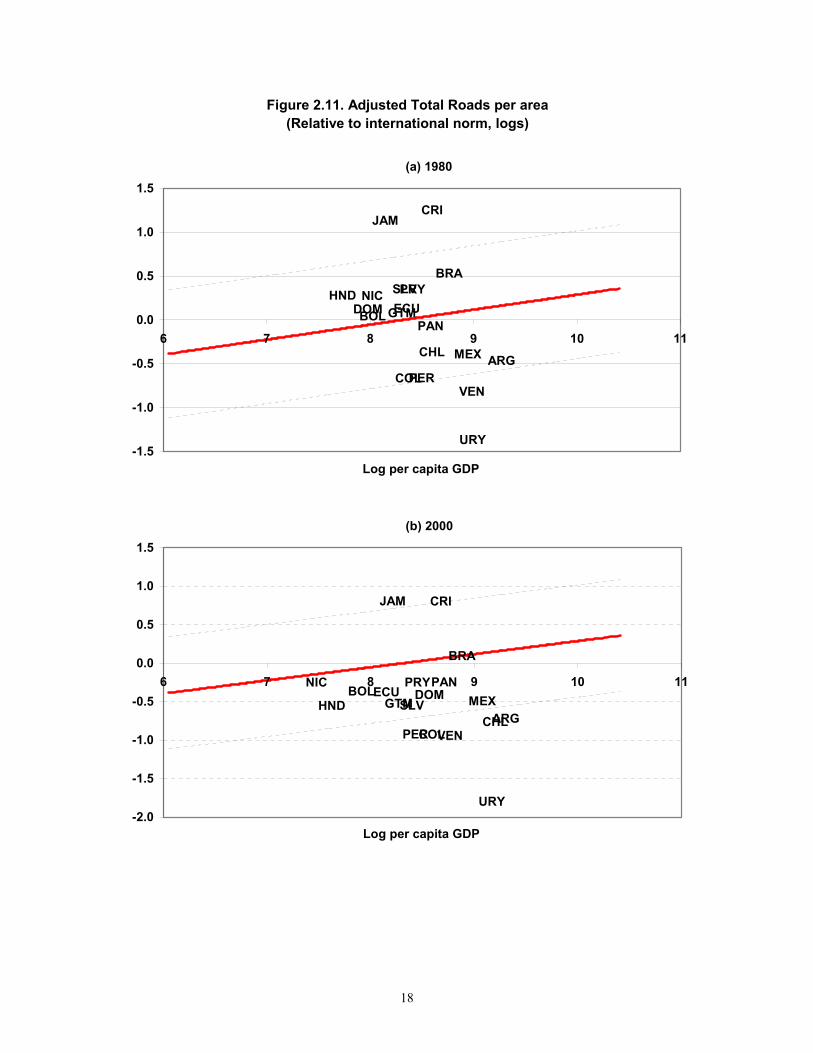
Figure 2.11. Adjusted Total Roads per area(Relative to international norm, logs)
(a) 1980
VEN
URY
SLVPRY
PER
PAN
NIC
MEX
JAM
HNDGTMECUDOM
CRI
COL
CHL
BRA
BOL
ARG
-1.5
-1.0
-0.5
0.0
0.5
1.0
1.5
6 7 8 9 10
Log per capita GDP
(b) 2000
ARG
BOL
BRA
CHLCOL
CRI
DOMECUGTMHND
JAM
MEXNIC PAN
PER
PRY
SLV
URY
VEN
-2.0
-1.5
-1.0
-0.5
0.0
0.5
1.0
1.5
6 7 8 9 10
Log per capita GDP
11
11
18

2.2 Infrastructure quality
Information on the quality of infrastructure is unfortunately much more limited than that on its quantity. This is particularly problematic in the case of telecommunications. Cross-country data on the telecommunications quality indicator that on conceptual grounds should be most informative – the frequency of telephone faults -- are so sparse as to render them useless. Instead we opt for showing data on the waiting time for installation of main lines, which in theory is a measure of excess demand, but in practice shows a significant positive correlation (around 0.30 according to Calderón and Servén 2004) with the theoretically-preferable measure over the reduced sample for which the latter is available. Information on waiting times can be collected for a fairly large sample of country-year pairs.
In the cases of power and transport, the situation is better, and we have fairly
abundant data on two widely-used (albeit far from perfect) measures of quality – the percentage of power losses and the proportion of paved roads in the total.
It is worth noting that these infrastructure quality indicators show a high
correlation with the infrastructure quantity indicators reviewed above. In a large panel data set, Calderón and Servén (2004) find sector-wise correlation coefficients (e.g., between power generation capacity and power losses, or between road density and road quality) around 0.5, significantly different from zero at any reasonable significance level. The implication is that more abundant infrastructure typically comes along with better infrastructure – or, in other words, much of the variation in infrastructure quality is likely captured by the variation in its quantity.
An alternative to the ‘objective’ quality proxies just described is the use of
subjective assessments of infrastructure quality, which in recent years have become available from international surveys of business conditions. Unfortunately, the time-series dimension of such data is very limited (or even nil), due to the fact that the relevant survey questions often change over time, and their cross-country coverage is somewhat restricted too. Nevertheless, we shall review some subjective quality indicators below.
Telecommunications – Figure 2.12 shows the evolution of the waiting time (in years) for installation of main telephone lines. Along this dimension, Latin America’s progress over the last two decades was spectacular, as the median waiting time was reduced from six months in 1980 to a few days by 2001. Among middle income countries, the median waiting time showed a similarly sharp decline, while in East Asia it had been completely eliminated by 1990.
19

0.00
0.05
0.10
0.15
0.20
0.25
0.30
0.35
0.40
0.45
0.50
1980 1985 1990 1995 2001
Figure 2.12. Telephone Mainlines, Waiting Time (years)
LAC (13) EAP7 (7) MIDDLE (32) IND (17)
Power – The percentage of transmission and distribution losses relative to total output offers a rough measure of the efficiency of the power sector. However, it is important to keep in mind that observed power losses include both ‘technical’ losses, reflective of the quality of the power grid -- and pilferage (i.e. power theft), and unfortunately there is virtually no information on the relative importance of the two.
With this caveat, Figure 2.13 offers a comparative perspective over the period of analysis. In contrast with the declining trends in East Asia and industrial countries, Latin America’s power losses showed a severe deterioration in the 1980s and 90s, although the process appears to have peaked in 1995 and by 2001 there was an incipient reversion.
20

0
2
4
6
8
10
12
14
16
18
20
1980 1985 1990 1995 2000
Figure 2.13. Power Losses, Medians by Region(percentage of power output)
LAC (19) EAP7 (7) MIDDLE (44) IND (21)
Figure 2.14 shows that the deterioration in the performance of the power sector,
as reflected by power losses, affected the majority of Latin American countries – 13 out of the 19 shown. It was particularly marked in Nicaragua (where power losses represented an astounding 30 percent of output in 2000) and Guatemala. In these two countries, anecdotal information suggests that a significant fraction of the losses may reflect power theft. In contrast, Chile and Jamaica achieved major improvements over the last two decades.
21

0 5 10 15 20 25 30
PRY
CHL
EAP7 median
JAM
PER
ARG
SLV
MEX
CUB
BOL
BRA
LAC19 median
URY
HND
PAN
ECU
COL
VEN
GTM
DOM
NIC
Figure 2.14. Power Losses by Country(percentage of power output)
20001980
Transport – The only quality indicator widely available for this sector is the percentage of paved roads in the total road network, which is depicted in Figure 2.15. In the year 2001, less than 20 percent of the road network was paved in the typical Latin American country, although the proportion has risen steadily over the last two decades. By this (admittedly imperfect) measure, the quality of the road network continues to lag behind that found among middle-income countries, and even further behind that of East Asia, which is close to the industrial-country norm.
Across Latin American countries, disparities in road quality are extremely large. At one end, 70 percent of the road network is paved in the Dominican Republic and Jamaica. At the other end, only 10 percent or less is paved in Brazil, Bolivia and Paraguay. Over the period of analysis, paved roads expanded more quickly than unpaved roads in almost all countries shown (Figure 2.16).
22

0.0
0.1
0.2
0.3
0.4
0.5
0.6
0.7
0.8
0.9
1.0
1980 1985 1990 1995 2001
Figure 2.15. Total Paved Roads, Medians by Region(percentage of total roads)
LAC (19) EAP5 (5) MIDDLE (43) IND (21)
0 0.1 0.2 0.3 0.4 0.5 0.6 0.7 0.8
BRA
BOL
PRY
NIC
PER
COL
ECU
CHL
SLV
HND
LAC19 median
CRI
ARG
URY
MEX
VEN
GTM
PAN
JAM
EAP5 median
DOM
Figure 2.16. Paved Road Length by Country(percentage of total road length)
20011980
Subjective infrastructure quality indicators – These are available from recent issues of the World Competitiveness Report and cover an expanding country sample. Rather than quality alone, they tend to capture perceptions on both the quality of infrastructure
23

services and their availability – which we should expect to be closely related to the volume of infrastructure stocks.
Given the short time series dimension of these data, below we focus only on the cross-country dimension, using data for the year 2000. The sample coverage of Latin America, as well as that of middle income countries, is somewhat limited, and hence the regional medians shown below have to be taken with some caution.
Figure 2.17 summarizes perceptions regarding the overall quality of infrastructure across world regions, with higher bars denoting higher quality. It is clear from the figure that Latin America lags behind East Asia and the group of middle-income countries – as well as industrial countries.
0
1
2
3
4
5
6
LAC (11) EAP7 (7) MIDDLE (27) IND (24)
Figure 2.17. Overall Infrastructure QualityMedians by region and income level, 2000
Question: The quality of the infrastructure is among the best in the world (1=strongly disagree; 7 =strongly agree).Source: World Competitiveness Report.
The perceived reliability of telephones is shown in Figure 2.18. Across countries, this subjective indicator shows a negative correlation (-.30) with the objective measure of quality discussed earlier (the frequency of phone faults), although the sample for which both are available includes only 27 countries. Surprisingly, here regional rankings appear to be reversed, in the sense that industrial countries lag behind all other country groups shown, and Latin America ranks second only to East Asia in terms of telephone service quality.
24

0
1
2
3
4
5
6
7
LAC (11) EAP7 (7) MIDDLE (27) IND (24)
Figure 2.18. Telephones ReliableMedians by region and income level, 2000
Question: Telephone lines have ample capacity and are highly reliable (1=strongly disagree; 7 =strongly agree).Source: World Competitiveness Report.
Figure 2.19 turns to perceptions regarding the reliability of power. The subjective
index shows a significant negative correlation (-.50, with a standard error of .14) with the percentage of power losses. In this case, however, the coverage of Latin America is limited to only seven countries. Nevertheless, the results are qualitatively similar to those found when using power losses as quality proxy: in both cases Latin America places last among the country groups shown. Finally, Figure 2.20 shows the perceived quality of the road network. The cross-country correlation of the subjective index with the objective measure used above – the percentage of roads paved – equals 0.53, with a standard error of .14. In accordance with this significant positive association, the regional perspective yields a similar verdict in both cases: Latin America lags behind the other country groups shown in the graph.
25

0
1
2
3
4
5
6
7
LAC (7) EAP7 (7) MIDDLE (21) IND (24)
Figure 2.19. Power Supply Medians by region and income level, 1998
Question: Your country has sufficient power generation capacity (1=strongly disagree; 7 =strongly agree). Source: World Competitiveness Report.
0
1
2
3
4
5
6
LAC (11) EAP7 (7) MIDDLE (27) IND (24)
Figure 2.20. Road Infrastructure Quality Medians by region and income level, 2000
Question: Roads are extensive and well maintained (1=strongly disagree; 7 =strongly agree). Source: World Competitiveness Report.
26

3. Trends in infrastructure investment We next review the trends in infrastructure investment in major Latin American economies. We focus on seven countries for which the requisite data could be collected. The list includes the region’s six biggest economies (Argentina, Brazil, Chile, Colombia, Mexico and Peru) as well as Bolivia.16 To ensure comparability across countries, we focus on four core infrastructure sectors: telecommunications, power, land transportation and water. Thus we exclude the petroleum sector, which in some of the region’s countries attracts large volumes of investment, as well as ports and airports, for which consistent data across countries could not be collected.
For each country, we used a variety of national sources, summarized in the appendix.17 Regarding public investment, an effort was made to capture the expenditures of different levels of government as well as those of public enterprises. However, the available sources do not always make this possible – they often omit investment by local authorities altogether, while in other cases they do not clarify the extent to which investment by other subnational levels of government is captured by the data. For this reason, the figures reported below have to be taken with some caution. 18
Keeping this caveat in mind, Figure 3.1 offers a comparative perspective on the
performance of infrastructure investment across Latin America’s major economies. The top panel depicts the trajectory of total infrastructure investment – defined to include surface transport (i.e., roads and railways), power, telecommunications and water – relative to GDP. The graph confirms the salient facts already noted by Calderón, Easterly and Servén (2003). In the 1990s, the volume of infrastructure investment shows considerable variation across countries. Second, in most countries infrastructure investment experienced a decline around the mid 1980s, although in some cases (e.g., Peru) the fall showed an incipient reversion in the late 1990s. Third, Colombia and Chile
16 While we also collected information on Ecuador and Venezuela, in these cases the data posed problems concerning the magnitude of the reported investment figures and the consistency of the recent data with earlier information. For this reason, we opt for not reporting them here. 17 In addition to these sources, for some countries we also used a number of internal World Bank documents. 18 In those cases where information on local-government investment was available we were able to assess its relative magnitude vis-à-vis total public investment. In Bolivia, for example, larger municipalities rely on concession contracts or public enterprises, while smaller ones run their own water systems. Santa Cruz is the only metropolitan city reporting municipal expenditure on water provision. More generally, expenditure on water provision as a share of municipal budgets in Bolivia has decreased from 7.9 percent in 1997 to 4.8 percent in 2000 (about 6.9 percent of total public investment in water in 2000). In the case of Mexico, the spending of local governments in the water sector as a percentage of total public spending in the sector has recently doubled from 6.5 percent in 1998-2000 to 13 percent in 2001-02. These figures are significant but, relative to national aggregates, far from overwhelming. While we cannot extrapolate them to other countries and/or sectors, they suggest that omission of investment by local bodies should not have an overly distorting impact on nation-wide investment totals.
27

are exceptions to this rule: they witnessed a substantial infrastructure investment expansion over the last decade.
Panel (b) of Figure 3.1 depicts the time path of public infrastructure investment as percent of GDP. In all but one of the countries shown, public infrastructure investment declined sharply in the late 1980s. The only exception is Colombia, where the decline was very slight and on average public investment levels remained roughly unchanged (albeit with major fluctuations) throughout the period. At the end of the 1990s, public investment appears to show an incipient rise in Chile.
The evolution of private infrastructure investment is depicted in Figure 3.1 (c). In five of the six countries shown private investment took off in the late 1980s or early 1990s. The exception is Brazil, where infrastructure investment of the private sector hovered around 1 percent of GDP over the last two decades and only shows an incipient takeoff after 1995. Among the other countries, Chile exhibits the earliest, and largest, rise in private investment. Only Colombia shows private investment levels of a comparable magnitude, although with a slight decline at the end of the 1990s. In contrast, in Argentina and Mexico private investment stagnated in the second half of the 1990s.
Table 3.1 provides a regional overview of infrastructure investment, by sector of origin (public and private) and destination. In addition to the six large economies shown above, the table also includes Bolivia. The table compares the early 1980s with the most recent years. Between those two periods, total infrastructure investment fell in the large countries (Argentina, Brazil and Mexico) and rose in the smaller ones – Chile, Colombia, Peru and Bolivia. Region-wide, total infrastructure investment declined by around 1.5 percent of the aggregate GDP of the countries under analysis.
Behind these totals, the table also shows that public investment declined in every one of the countries listed, by an amount in excess of 2 percent of GDP – except for Peru and Colombia, where the fall was more modest. In contrast, private investment rose in all countries except Brazil, where it remained roughly unchanged. The rise in private investment was particularly marked in some of the smaller economies – particularly Chile and Bolivia. It is worth noting that these are also the countries where public investment has remained at relatively high levels.
The breakdown of these trends by infrastructure sector also deserves comment. In
most countries, investment in power and transport fell, and the decline was particularly marked in the former. The only exception was Chile (and, in the case of power, also Colombia). In contrast, investment in the telecommunications sector rose in all seven countries in the table. This in turn reflects the different patterns of public and private investment across sectors. While there is some diversity across countries, in general public investment fell more markedly in the power and transport sectors, while the increase in private investment was concentrated in the telecommunications sector. Indeed, outside telecommunications private sector involvement remains relatively modest, with the only exceptions of Chile and, in the case of power, Bolivia and Colombia too.
28

Figure 3.1. Infrastructure Investment in Major Countries (percent of GDP)
(a) Total Investment
0%1%2%3%4%5%6%7%8%
1980
1981
1982
1983
1984
1985
1986
1987
1988
1989
1990
1991
1992
1993
1994
1995
1996
1997
1998
1999
2000
2001
(b) Public Investment
0%
1%
2%
3%
4%
5%
6%
1980
1981
1982
1983
1984
1985
1986
1987
1988
1989
1990
1991
1992
1993
1994
1995
1996
1997
1998
1999
2000
2001
(c) Private Investment
0%
1%
2%
3%
4%
5%
1980
1981
1982
1983
1984
1985
1986
1987
1988
1989
1990
1991
1992
1993
1994
1995
1996
1997
1998
1999
2000
2001
ARG BRA CHL COL MEX PER
29

Tabl
e 3.
1In
fras
truc
ture
Inve
stm
ent i
n La
tin A
mer
ica,
198
0-20
01(a
s pe
rcen
tage
of G
DP)
Tele
com
mun
icat
ions
Pow
erLa
nd T
rans
port
atio
n 1/
Tota
l Inf
rast
ruct
ure
2/C
ount
ryPe
riod
Tota
lPu
blic
Priv
ate
Tota
lPu
blic
Priv
ate
Tota
lPu
blic
Priv
ate
Tota
lPu
blic
Priv
ate
Argentina
1980-85
0.33%
0.33%
0.00%
1.57%
1.57%
0.00%
0.84%
0.84%
0.00%
2.96%
2.96%
0.00%
1996-01
0.53%
0.00%
0.53%
0.40%
0.03%
0.36%
0.32%
0.15%
0.17%
1.45%
0.22%
1.24%
Change
0.20%
-0.33%
0.53%
-1.18%
-1.54%
0.36%
-0.51%
-0.69%
0.17%
-1.51%
-2.74%
1.24%
Brazil
1980-85
0.69%
0.32%
0.37%
3.32%
2.53%
0.79%
0.84%
0.47%
0.37%
5.17%
3.64%
1.53%
1996-01
1.16%
0.30%
0.86%
0.76%
0.37%
0.39%
0.14%
0.04%
0.10%
2.39%
1.02%
1.37%
Change
0.47%
-0.01%
0.49%
-2.56%
-2.16%
-0.40%
-0.70%
-0.43%
-0.27%
-2.78%
-2.62%
-0.16%
Chile
1980-85
0.41%
0.41%
0.00%
1.59%
1.59%
0.00%
1.01%
1.01%
0.00%
3.24%
3.24%
0.00%
1996-01
1.42%
0.00%
1.42%
1.78%
0.34%
1.44%
1.96%
1.00%
0.96%
5.58%
1.72%
3.86%
Change
1.01%
-0.41%
1.42%
0.20%
-1.24%
1.44%
0.95%
-0.01%
0.96%
2.34%
-1.52%
3.86%
Colombia
1980-85
0.36%
0.36%
0.00%
2.32%
2.32%
0.00%
0.99%
0.99%
0.00%
3.85%
3.85%
0.00%
1996-01
1.25%
0.58%
0.67%
3.32%
1.91%
1.41%
0.89%
0.69%
0.21%
5.76%
3.48%
2.28%
Change
0.89%
0.22%
0.67%
1.00%
-0.41%
1.41%
-0.09%
-0.30%
0.21%
1.91%
-0.37%
2.28%
Mexico
1980-85
0.24%
0.24%
0.00%
0.49%
0.49%
0.00%
1.54%
1.54%
0.00%
2.45%
2.45%
0.00%
1996-01
0.73%
0.03%
0.70%
0.11%
0.11%
0.00%
0.34%
0.08%
0.27%
1.24%
0.27%
0.98%
Change
0.49%
-0.21%
0.70%
-0.38%
-0.38%
0.00%
-1.19%
-1.46%
0.27%
-1.21%
-2.18%
0.98%
Peru
1980-85
0.31%
0.31%
0.00%
1.29%
1.28%
0.01%
0.33%
0.30%
0.03%
1.98%
1.94%
0.04%
1996-01
1.07%
0.24%
0.83%
0.94%
0.32%
0.63%
0.25%
0.12%
0.13%
2.28%
0.68%
1.60%
Change
0.76%
-0.07%
0.83%
-0.35%
-0.96%
0.61%
-0.08%
-0.19%
0.11%
0.30%
-1.26%
1.56%
Bolivia
1980-85
0.89%
0.70%
0.19%
1.90%
1.75%
0.14%
2.81%
2.40%
0.41%
5.79%
5.04%
0.76%
1996-01
1.74%
0.00%
1.74%
1.75%
0.22%
1.53%
2.78%
2.61%
0.17%
7.28%
2.93%
4.35%
Change
0.85%
-0.70%
1.55%
-0.15%
-1.53%
1.39%
-0.03%
0.21%
-0.24%
1.49%
-2.11%
3.60%
Wei
ghte
d Av
g.19
80-8
50.
45%
0.30
%0.
15%
1.95
%1.
64%
0.31
%1.
06%
0.91
%0.
15%
3.71
%3.
10%
0.61
%(b
y G
DP)
1996
-01
0.94
%0.
17%
0.77
%0.
71%
0.31
%0.
37%
0.36
%0.
16%
0.20
%2.
24%
0.83
%1.
41%
Cha
nge
0.50
%-0
.13%
0.62
%-1
.25%
-1.3
3%0.
06%
-0.6
9%-0
.74%
0.05
%-1
.46%
-2.2
7%0.
80%
1/ L
and
Tran
spor
tatio
n in
clud
es in
vest
men
t in
road
s an
d ra
ilway
s.2/
Tot
al in
vest
men
t in
infra
stru
ctur
e in
clud
es te
leco
mm
unic
atio
ns, p
ower
, roa
ds, r
ailw
ays,
and
wat
er. I
n Ar
gent
ina,
it in
clud
es a
lso
the
gas
sect
or.
30

Figure 3.2 provides additional detail on the trends in region-wide infrastructure investment over the last two decades. Panel (a) plots aggregate investment as well as its disaggregation by sector of origin. The sharp decline in public investment that started at the end of the 1980s has been offset only partially by rising private investment, and as a result aggregate investment remains today 1.5 percentage points of region-wide GDP below the levels of the 1980s. Panels (b) and (c) show that investment in power and transport has followed a similar time pattern.
In contrast, panel (d) shows that investment in the telecommunications sector has
behaved in a radically different manner: the (modest) decline in public investment was more than offset by booming private investment, and as a result the ratio of aggregate investment in the sector to region-wide GDP has more than doubled over the period of analysis. Finally, panel (e) depict the trends in investment in the water sector. In spite of incipient private participation, here the public sector still retains a dominant position. The trend decline in public investment appears to have bottomed out in the mid 1990s, and after that year total investment in the sector has shown a modest recovery, although it still remains below the levels of the 1980s.
Figures 3.3 through 3.9 provide the sector disaggregation of total, public and private investment for each of the economies under consideration. Most conform to the region-wide trends summarized above. The most remarkable exception is Chile (Figure 3.5), where investment appears to be on the rise in every one of the infrastructure sectors considered. It can be seen from the bottom panel of the figure that this is largely the result of active private sector involvement, with the exception of water, where public investment has increased recently. In Peru (Figure 3.8) the private sector has also taken the lead in most industries (again with the exception of water), but after 1998-99 private investment seems to be on the decline, and overall investment levels remain quite low Finally, Bolivia (Figure 3.9) shows the unusual feature of a very active public sector role in transport investment, which is presently at record-high levels.
31
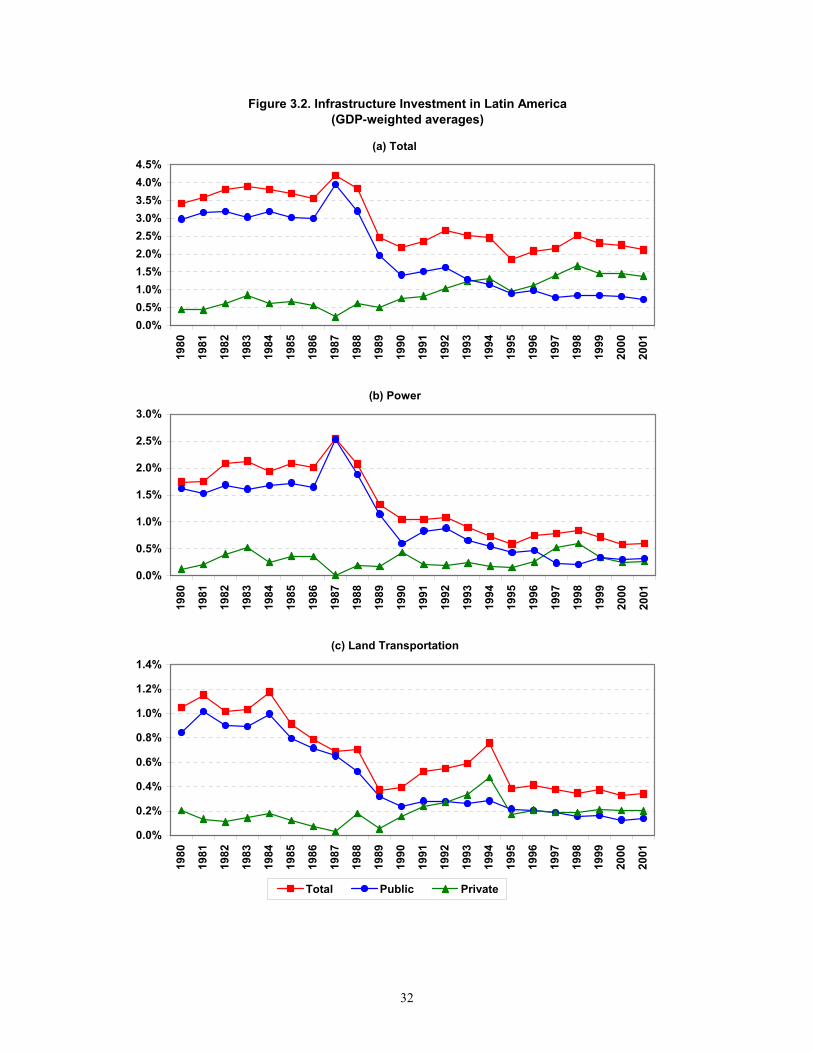
Figure 3.2. Infrastructure Investment in Latin America(GDP-weighted averages)
(a) Total
0.0%0.5%1.0%1.5%2.0%2.5%3.0%3.5%4.0%4.5%
1980
1981
1982
1983
1984
1985
1986
1987
1988
1989
1990
1991
1992
1993
1994
1995
1996
1997
1998
1999
2000
2001
(b) Power
0.0%
0.5%
1.0%
1.5%
2.0%
2.5%
3.0%
1980
1981
1982
1983
1984
1985
1986
1987
1988
1989
1990
1991
1992
1993
1994
1995
1996
1997
1998
1999
2000
2001
(c) Land Transportation
0.0%
0.2%
0.4%
0.6%
0.8%
1.0%
1.2%
1.4%
1980
1981
1982
1983
1984
1985
1986
1987
1988
1989
1990
1991
1992
1993
1994
1995
1996
1997
1998
1999
2000
2001
Total Public Private
32

Figure 3.2 (cont.)
(d) Telecommunications
0.0%
0.2%
0.4%
0.6%
0.8%
1.0%
1.2%19
80
1981
1982
1983
1984
1985
1986
1987
1988
1989
1990
1991
1992
1993
1994
1995
1996
1997
1998
1999
2000
2001
(e) Water
0.00%
0.05%
0.10%
0.15%
0.20%
0.25%
0.30%
1980
1981
1982
1983
1984
1985
1986
1987
1988
1989
1990
1991
1992
1993
1994
1995
1996
1997
1998
1999
2000
2001
Total Public Private
33

Figure 3.3. Argentina
(a) Total Investment
0.0%
0.5%
1.0%
1.5%
2.0%
2.5%19
80
1981
1982
1983
1984
1985
1986
1987
1988
1989
1990
1991
1992
1993
1994
1995
1996
1997
1998
1999
2000
2001
(c) Private Investment
0.0%
0.2%
0.4%
0.6%
0.8%
1.0%
1980
1981
1982
1983
1984
1985
1986
1987
1988
1989
1990
1991
1992
1993
1994
1995
1996
1997
1998
1999
2000
2001
Land Transportation Power Water Telecommunications
(b) Public Investment
0.0%
0.5%
1.0%
1.5%
2.0%
2.5%
1980
1981
1982
1983
1984
1985
1986
1987
1988
1989
1990
1991
1992
1993
1994
1995
1996
1997
1998
1999
2000
2001
34

Figure 3.4. Brazil
(a) Total Investment
0.0%0.5%1.0%1.5%2.0%2.5%3.0%3.5%4.0%4.5%
1980
1981
1982
1983
1984
1985
1986
1987
1988
1989
1990
1991
1992
1993
1994
1995
1996
1997
1998
1999
2000
2001
(c) Private Investment
0.0%0.2%0.4%0.6%0.8%1.0%1.2%1.4%1.6%
1980
1981
1982
1983
1984
1985
1986
1987
1988
1989
1990
1991
1992
1993
1994
1995
1996
1997
1998
1999
2000
2001
Land Transportation Power Water Telecommunications
(b) Public Investment
0.0%0.5%1.0%1.5%2.0%2.5%3.0%3.5%4.0%
1980
1981
1982
1983
1984
1985
1986
1987
1988
1989
1990
1991
1992
1993
1994
1995
1996
1997
1998
1999
2000
2001
35

Figure 3.5. Chile
(a) Total Investment
0.0%
0.5%
1.0%
1.5%
2.0%
2.5%
3.0%19
80
1981
1982
1983
1984
1985
1986
1987
1988
1989
1990
1991
1992
1993
1994
1995
1996
1997
1998
1999
2000
2001
(c) Private Investment
0.0%
0.4%
0.8%
1.2%
1.6%
2.0%
1980
1981
1982
1983
1984
1985
1986
1987
1988
1989
1990
1991
1992
1993
1994
1995
1996
1997
1998
1999
2000
2001
Land Transportation Power Water Telecommunications
(b) Public Investment
0.0%
0.5%
1.0%
1.5%
2.0%
2.5%
3.0%
1980
1981
1982
1983
1984
1985
1986
1987
1988
1989
1990
1991
1992
1993
1994
1995
1996
1997
1998
1999
2000
2001
36

Figure 3.6. Colombia
(a) Total Investment
0%
1%
2%
3%
4%
5%19
80
1981
1982
1983
1984
1985
1986
1987
1988
1989
1990
1991
1992
1993
1994
1995
1996
1997
1998
1999
2000
2001
(c) Private Investment
0.0%
0.3%
0.6%
0.9%
1.2%
1.5%
1.8%
2.1%
1980
1981
1982
1983
1984
1985
1986
1987
1988
1989
1990
1991
1992
1993
1994
1995
1996
1997
1998
1999
2000
2001
Land Transportation Power Water Telecommunications
(b) Public Investment
0.0%0.5%1.0%1.5%2.0%2.5%3.0%3.5%4.0%
1980
1981
1982
1983
1984
1985
1986
1987
1988
1989
1990
1991
1992
1993
1994
1995
1996
1997
1998
1999
2000
2001
37

Figure 3.7. Mexico
(a) Total Investment
0.0%
0.4%
0.8%
1.2%
1.6%
2.0%19
80
1981
1982
1983
1984
1985
1986
1987
1988
1989
1990
1991
1992
1993
1994
1995
1996
1997
1998
1999
2000
2001
(c) Private Investment
0.0%
0.2%
0.4%
0.6%
0.8%
1.0%
1.2%
1.4%
1980
1981
1982
1983
1984
1985
1986
1987
1988
1989
1990
1991
1992
1993
1994
1995
1996
1997
1998
1999
2000
2001
Land Transportation Power Water Telecommunications
(b) Public Investment
0.0%
0.4%
0.8%
1.2%
1.6%
2.0%
1980
1981
1982
1983
1984
1985
1986
1987
1988
1989
1990
1991
1992
1993
1994
1995
1996
1997
1998
1999
2000
2001
38

Figure 3.8. Peru
(a) Total Investment
0.0%
0.4%
0.8%
1.2%
1.6%
2.0%19
80
1981
1982
1983
1984
1985
1986
1987
1988
1989
1990
1991
1992
1993
1994
1995
1996
1997
1998
1999
2000
2001
(c) Private Investment
0.0%
0.2%
0.4%
0.6%
0.8%
1.0%
1.2%
1.4%
1980
1981
1982
1983
1984
1985
1986
1987
1988
1989
1990
1991
1992
1993
1994
1995
1996
1997
1998
1999
2000
2001
Land Transportation Power Water Telecommunications
(b) Public Investment
0.0%
0.4%
0.8%
1.2%
1.6%
2.0%
1980
1981
1982
1983
1984
1985
1986
1987
1988
1989
1990
1991
1992
1993
1994
1995
1996
1997
1998
1999
2000
2001
39

Figure 3.9. Bolivia
(a) Total Investment
0.0%
0.5%
1.0%
1.5%
2.0%
2.5%
3.0%
3.5%19
80
1981
1982
1983
1984
1985
1986
1987
1988
1989
1990
1991
1992
1993
1994
1995
1996
1997
1998
1999
2000
2001
(c) Private Investment
0.0%
0.5%
1.0%
1.5%
2.0%
2.5%
3.0%
1980
1981
1982
1983
1984
1985
1986
1987
1988
1989
1990
1991
1992
1993
1994
1995
1996
1997
1998
1999
2000
2001
Land Transportation Power Water Telecommunications
(b) Public Investment
0.0%
0.5%
1.0%
1.5%
2.0%
2.5%
3.0%
3.5%
1980
1981
1982
1983
1984
1985
1986
1987
1988
1989
1990
1991
1992
1993
1994
1995
1996
1997
1998
1999
2000
2001
40

Operations and maintenance – So far we have focused on investment expenditures, but O&M spending plays a critical role in determining the useful life of infrastructure assets. There is a perception among many observers that O&M has been squeezed along with investment, but unfortunately little information is available to asses this claim.
Some fragmentary information could be obtained for some selected countries in the case of roads. For example, in Argentina O&M spending in highways has represented approximately 45 percent of total investment spending in highways in the 1990s – roughly equivalent to some 0.1 percent of GDP -- with 29% attributed to the public sector.19 In Chile, O&M spending in the transport sector (including surface transport, ports and airports) represented 33% of total investment spending for the 1998-2001 period – some 0.4 percent of GDP.20 Finally, in Bolivia 20% of public investment in roads (around 0.35 percent of GDP) was dedicated to the maintenance (routine, periodic or emergency repairs) of the national road network.21
How do these figures compare with the O&M needs posed by existing asset
stocks ? A very rough estimate of the latter can be constructed using the data on asset depreciation rates and unit costs of infrastructure investment reported by Fay and Yepes (2003). In the case of transport, their figures refer to paved roads, and hence we use the paved road stock in the calculation. Proceeding in this way, we conclude that O&M needs for paved roads would represent around 0.20 percent of GDP in Argentina, 0.33 percent in Chile and 0.34 percent in Bolivia. At least in the case of Argentina, this would suggest that observed O&M spending falls well short of its required level – although these calculations have to be taken with a big grain of salt. 4. Concluding comments This paper documents the recent trends in infrastructure stocks and infrastructure investment in major Latin American economies. Using an updated dataset constructed for this task, the paper describes the evolution of the quantity and quality of various kinds of infrastructure assets – power, transport, telecommunications – as well as the investment expenditures of the public and private sectors. On the whole, the recent information confirms the main findings from earlier work (Calderón, Easterly and Servén 2003). Regarding infrastructure stocks and their quality, along most dimensions Latin America lags behind not only the successful East Asian economies, but in many cases also the middle-income developing-country norm. Latin America’s lag persists even when observed stocks are adjusted to remove the effect of cross-country differences in the evolution of key infrastructure covariates, such as geographic and demographic characteristics and income levels.
19 The source is the Dirección Nacional de Vialidad (DNV). 20 As reported by the Ministry of Public Works. 21 Servicio Nacional de Caminos (SNC)
41

Furthermore, there is no obvious evidence that the gap between Latin America and other regions may be closing. In the case of transport, for example, the situation appears to be the opposite. However, the telecommunications sector seems to be an exception, in the sense that (adjusted) stocks meet or exceed the international norm in an increasing number of Latin American countries, and quality indicators also show a marked catch-up to the international norm. Regarding infrastructure investment, the recent data confirm earlier trends. Overall infrastructure investment remains depressed in the larger countries, and this is the combined result of the retrenchment of public investment and the limited response of the private sector, which has been mostly confined to the telecommunications industry. There is considerable disparity across countries, however, and in particular Chile has displayed an upward trend in all infrastructure sectors examined. But this is the exception rather than the rule, and on the whole the data show that the countries most successful in attracting large volumes of private investment (Chile, Colombia, Bolivia) are precisely those where public investment has remained high.
42

References Calderón, C., W. Easterly, and L. Servén (2003): Latin America’s Infrastructure in the
Era of Macroeconomic Crises. In: Easterly, W., Servén, L., eds., The Limits of Stabilization: Infrastructure, Public Deficits, and Growth in Latin America. Stanford University Press and the World Bank, pp. 21-94.
Calderón, C., and L. Servén (2003): The Output Cost of Latin America’s Infrastructure
Gap. In: Easterly, W., Servén, L., eds., The Limits of Stabilization: Infrastructure, Public Deficits, and Growth in Latin America. Stanford University Press and the World Bank, pp. 95-118.
Calderón, C., and L. Servén (2004): The effects of infrastructure development on growth
and income distribution. Unpublished manuscript. Canning, D. (1998): A Database of World Stocks of Infrastructure, 1950-95. The World
Bank Economic Review 12, 529-547. Easterly, W., and L. Servén (2003): The limits of stabilization: infrastructure, public
deficits and growth in Latin America. Stanford University Press. Fay, M., and T. Yepes (2003): Investing in Infrastructure: What is Needed from 2000 to
2010? The World Bank Working Paper 3102, July.
43

Appendix
Investment in Infrastructure in Major Latin American Countries
Description of the Database We complement the data on physical infrastructure capital with measures of private and public investment in infrastructure. We focus on seven major Latin American economies. Our data set consists of annual figures of private and public infrastructure investment in sectors such as telecommunications, power, gas, roads, railroads, and water. The data spans the period 1980-2001. References In order to gather annual data on public and private infrastructure, we looked at a large list of references. This includes yearbooks from international organizations, and national sources. Among the latter, we looked at general government investment plans, balance sheets of state-owned enterprises, and so on. Here we provide in detail our list of references.
GENERAL SOURCES OF INFORMATION Economic Commission for Latin America and the Caribbean. Statistical Yearbook for
Latin America and the Caribbean. Santiago de Chile, CEPAL International Road Federation. World Road Statistics, Various Years. Geneva,
Switzerland: IRF. International Telecommunications Union. World Telecommunication Development
Report, Various years. Geneva, Switzerland: ITU. United Nations. Energy Statistics Yearbook. New York, NY: United Nations World Bank, 2002. Private Participation in Infrastructure: Trends in Developing
Countries in 1990-2001. Washington, DC: The World Bank.
ARGENTINA Public investment coverage General Government. Includes investment by Public Federal Offices such as Dirección Nacional de Vialidad (Roads), Secretaría de Energía (Power) and Secretaría de Comunicaciones (Telecoms). It also accounts for investment at the provincial level. (Regional figures in power are consolidated by the Secretariat of Energy, that depends upon the Ministry of Economy).
44

General Information Fundación de Investigaciones Económicas Latinoamericanas (1992). Capital de
Infraestructura en la Argentina: Gestión Pública, Privatización y Productividad. Buenos Aires, Argentina.
Fundación de Investigaciones Económicas Latinoamericanas (1996). La Programación de la Inversión Pública en la Argentina. Buenos Aires, Argentina.
Secretaria de Hacienda, “Cuenta de Inversion 1994-97.” Buenos Aires, Sub-Secretaria del Presupuesto.
References on Infrastructure Sectors Adrián Romero, C., 1998. Regulación e Inversiones en el Sector Eléctrico Argentino.
CEPAL Serie Reformas Económicas 5. Celani, M., 1998. Determinantes de la Inversión en Telecomunicaciones en Argentina.
CEPAL. Delgado, R., 1998. Inversiones en Infraestructura Vial: La Experiencia Argentina.
CEPAL Serie Reformas Económicas 6. Dirección Nacional de Vialidad. Anuario Vial. Buenos Aires, Argentina: Ministerio de
Infraestructura y Vivienda. See webpage: http://www.vialidad.gov.ar Galiani, S., Gertler, P., Schargrodsky, E., Sturzenegger, F., 2001. The Benefits and Costs
of Privatization in Argentina: A Microeconomic Analysis. Universidad de San Andrés, Mimeo, December.
Galiani, S., Gertler, P., Schargrodsky, E., 2002. Water for Life: The Impact of the Privatization of Water Services on Child Mortality. Universidad de San Andrés, Mimeo, December.
Secretaría de Comunicaciones. Estadísticas. Buenos Aires, Argentina: Comisión Nacional de Comunicaciones, Ministerio de Infraestructura y Vivienda. See webpage: http://www.secom.gov.ar/
Secretaría de Energía, 2001. Informe Decenal del Sector Eléctrico, 1991-2000. Various Years. Buenos Aires: Dirección Nacional de Prospectiva.
Secretaría de Energía. Informe del Sector Eléctrico, Various Years. Buenos Aires: Ministerio de Economía y Obras y Servicios Públicos.
Secretaria de Transporte, 2000. Compendio Estadístico del Sector Transporte en la Argentina. Buenos Aires, Argentina: Ministerio de Planificación Federal, Inversión Pública y Servicios.
Subsecretaría de Recursos Hídricos. Memoria de Gestión Enero-Diciembre, Various Years. Buenos Aires, Argentina: Ministerio de Economía y Obras y Servicios Públicos.
45

BOLIVIA Public investment coverage General Government and State-Owned enterprises. For water, also we have public investment figures from local governments (municipalidades). General Information Antelo, E., 2000. Políticas de Estabilización y de Reformas Estructurales en Bolivia a
partir de 1985. CEPAL Serie Reformas Económicas 62. Barja Daza, G., 1999. Las Reformas Estructurales Bolivianas y su Impacto sobre
Inversiones. CEPAL Serie Reformas Económicas 42. Instituto Nacional de Estadística. Bolivia en Cifras. Varios números. The World Bank. Bolivia: Public Expenditure Review. Washington, DC: The World
Bank. References on Infrastructure Sectors Barja Daza, G., 1999a. Inversión y Productividad en la Industria Boliviana de la
Electricidad. CEPAL Serie Reformas Económicas 15. Barja Daza, G., 1999b. Inversión y Productividad en la Industria Boliviana de
Telecomunicaciones. CEPAL Serie Reformas Económicas 16. Superintendencia de Electricidad. Informe de la Gestión del Sector Eléctrico: Inversiones.
La Paz, Bolivia. See webpage: http://www.superele.gob.bo/ Superintendencia de Telecommunicaciones. Memoria Anual, Various Years. See
webpage: http://www.sittel.gov.bo/
BRAZIL
Public investment coverage Federal Government, state governments and state-owned enterprises (as described by Ferreira and Malliagros, 1999). In the case of water, coverage of states’ investments may be limited. General Information Cavalcanti Ferreira, P., 1996. Investimento em Infra-estrutura no Brasil: Fatos Estilizados
e Relacoes de Longo Prazo. Pesquisa e Planejamento Economico, 26(2), August. Cavalcanti Ferreira, P.; Malliagros, T.G., 1998. Impactos Produtivos da Infra-estrutura no
Brasil: 1950-95". Pesquisa e Planejamento Economico, 28(2), August Cavalcanti Ferreira, P.; Malliagros, T.G., 1999. "Investimentos, Fontes de
Financiamiento e Evolucao do Setor de Infra-estrutura no Brasil: 1950-96". FGV EPGE Ensaios Economicos No. 346.
46

Coes, D.V., 1994. Macroeconomic Crises, Policies and Growth in Brazil, 1964-90. Washington, DC: The World Bank Comparative Macroeconomic Studies.
Rigolon, F.J.Z., 1998. O Investimento em Infra-estrutura e a retomada do crescimento economico sustentado. Pesquisa e Planejamento Economico, 28(1), April.
References on Infrastructure Sectors
Alves Jr., L.C., Almeida, D., 2001. Retorno Economico e Social do Investimento em
Distribuicao de Energia Eletrica e Quesotes Relacionadas ao seu Financiamento: 1995 a 2000. IX Seminario de Planejamento Economico Financiero do Setor Elétrico
Agência Nacional de Telecomunicações. Estatisticas. See webpage: http://www.anatel.gov.br/
BNDES, 1999a. Concessoes Rodoviarias no Brasil. Informe Infra-Estrutura No. 30, January
BNDES, 1999b. Ferrovias: Privatizacao e Regulacao. Informe Infra-Estrutura No. 34, May
BNDES, 2000. O Setor Elétrico. Informe Infra-Estrutura No. 53, December Da Costa Pinhel, A.C., 2000. Simulacao de uma Usina Termica a Gas no novo Contexto
do Setor Elétrico Brasileiro: Uma Análise Risco X Retorno. Thesis submitted to Post-Graduate Program on Engineering at Universidade Federal do Rio de Janeiro
Departamento de Transportes Ferroviarios. Anuário Estatístico das Ferrovias do Brasil, Various Years. See webpage: http://www.transportes.gov.br
Departamento de Transportes Ferroviarios. Investimentos e outras Inversões e Previsões dos Planos Trienais. See webpage: http://www.transportes.gov.br
Instituto Brasileiro de Geografía e Gestao. Sistema de Contas Nacionais, Various Years. Brasilia, Ministerio de Planejamento, Orcamento e Gestao.
Lizardo de Araújo, J., 2001. A Questao do Investimento no Setor Elétrico Brasileiro: Reforma e Crise. Nova Economia, Belo Horizonte, 11(1), July
Ministerio de Planejamento, Orcamento e Gestao. Estatísticas Orcamentarias, Various Years. See webpage: http://www.planejamento.gov.br/. Brazilia, Brazil.
Ministerio de Planejamento, Orcamento e Gestao. Estatísticas e Cojuntura, Various Years. Brazilia, Brazil.
Shaw, R., 2002. Creating Trust in Critical Network Infrastructures: The Case of Brazil. ITU Document CNI/06, May.
CHILE Public investment coverage General Government – including Central Government, State-Owned Enterprises and investment undertaken by the Regional Governments, specifically in Transportation (Roads, Railways) and Water consolidated by the Ministry of Public Works through its Sub-Secretariat of Transportation and the Dirección Nacional de Vialidad.
47

General Information Ministerio de Obras Públicas, 2000. Inversión en Infraestructura: Rol sobre el
Crecimiento, Desarrollo Económico y la Globalización. Santiago, Chile: Gobierno de Chile.
Ministerio de Obras Públicas, 2001. La Inversión en Infraestructura 1990-1999 y su Proyección 2000-2009. Santiago, Chile: Gobierno de Chile.
Moguillansky, G.. 1999. La Inversión en Chile: ¿El Fin de un Ciclo en Expansión?, Santiago, Chile: Fondo de Cultura Económica Chile S.A.
Moguillansky, G. and Bielschowsky, R., 2000. Inversión y Reformas Económicas en América Latina, Santiago, Chile: Fondo de Cultura Económica Chile S.A.
References on Infrastructure Sectors Banco Central de Chile. Anuario de Cuentas Nacionales 2002. Santiago de Chile, Banco
Central. Dirección de Vialidad. Memoria, Various years. Santiago de Chile, Ministerio de Obras
Públicas . Subsecretaría de Telecomunicaciones. Estadísticas del Sector de las Telecomunicaciones
en Chile, Various Issues. Santiago de Chile, Ministerio de Obras Públicas Subsecretaría de Telecomunicaciones. Informe de Gestión, various years. Santiago de
Chile, Ministerio de Obras Públicas. The World Bank, 2003. Water Services in Chile. Public Policy for the Private Sector
Note No. 25, March.
COLOMBIA
Public investment coverage General Government and State-Owned Enterprises. These figures include public investment at the national and regional level. They do not include investment by local governments, except for transport. Power figures are reported by agent participating in the National System of Transmission.22 Recently, public investment in telecoms has been mostly undertaken by Empresa de Teléfonos de Bogotá (ETB) and the group of Empresas Públicas de Medellín (EPM) —around 80% of total public investment since 2000 (Comisión de Regulación de Telecomunicaciones, 2002). General Information Departamento Administrativo Nacional de Estadística (DANE). Cuentas Nacionales:
Gastos en FBKF por sector institucional según finalidad 1973-95. Bogotá, Colombia.
22 Among the main agents, we have: Interconexión Eléctrica S.A., Transelca, S.A. E.S.P., Empresas Públicas de Medellín, and Empresa de Energía de Bogotá.
48

Departamento Nacional de Planeación, 2003. Plan Colombia: Balance 1999-2003. Bogotá, Colombia.
Note: We should notice that DANE data have been computed according to commitments
and not to cash flow basis. Additionally, depreciation of the existing stock has also been considered.
References on Infrastructure Sectors Comisión de Regulación de Telecomunicaciones, 2000. El Sector de las
Telecomunicaciones en Colombia en la Década de los 90’s. Bogotá, Colombia: Ministerio de Comunicaciones. See webpage: http://www.crt.gov.co/
Comisión de Regulación de Telecomunicaciones, 2002. El Sector de las Telecomunicaciones en Colombia 1998-2001. Bogotá, Colombia: Ministerio de Comunicaciones.
Departamento Nacional de Planeación. Ministerio de Transportes. El Transporte en Cifras 1970-96. Bogotá, Colombia:
Ministerio de Transportes. Ministerio de Transportes. El Transporte en Cifras 2000. Bogotá, Colombia: Ministerio
de Transportes. Unidad de Infraestructura y Energía. Sector de Energía: Competitividad del Sector.
Bogotá, Colombia: Departamento Nacional de Planeación. Unidad de Infraestructura y Energía. Sector de Energía: Documento Sectorial. Bogotá,
Colombia: Departamento Nacional de Planeación. Unidad de Infraestructura y Energía. Sector de Energía: Plan Colombia. Bogotá,
Colombia: Departamento Nacional de Planeación.
MEXICO
Public investment coverage Federal Government, States, State-Owned Enterprises, and para-State firms. For water, there is also a limited coverage of local government investment. General Information Banco de México, 1995. La Encuesta de Acervos, Depreciación y Formación de Capital.
México, DF: Banco de México. Presidencia del Gobierno. IV Informe del Gobierno: México 1988-98. México, DF:
Presidencia del Gobierno. Presidencia del Gobierno. V Informe del Gobierno: México 1989-99. México, DF:
Presidencia del Gobierno. Secretaría de Hacienda de México. Inversión Pública Federal por Entidad Federativa.
México, DF: Secretaría de Hacienda.
49

World Bank, 2004. México: Public Expenditure Review. Washington, DC: The World Bank.
References on Infrastructure Sectors Comisión Federal de Telecomunicaciones. Información sobre el Sector. México, DF:
Secretaría de Comunicaciones y Transporte. See webpage: http://www.cft.gob.mx/
Comisión Nacional del Agua. Estadísticas del Agua en México. México, DF: Secretaría de Medio Ambiente y Recursos Naturales. See webpage: http://www.cna.gob.mx/
Comisión Reguladora de Energía. Estadísticas. México, DF: Secretaría de Energía. See webpage: http://www.cre.gob.mx/
Secretaría de Comunicaciones y Transportes. Anuario Estadístico, Various Years. México, DF: Secretaría de Comunicaciones y Transporte.
PERU Public investment coverage General Government and State-Owned Enterprises. Reporting on all investment made by the public sector is centralized through the entities stated above. The figures do not include investment by local governments. General Information Banco Central de Reserva del Perú. Memoria Anual, Various Years. Lima, Perú: BCRP. CUANTO S.A. Perú en Números, Varios Números. Lima, Perú. Instituto Nacional de Estadística e Informática. Anuario Estadístico, Various Issues.
Lima, Perú: INEI. Instituto Peruano de Economía, 2003. La Brecha en Infraestructura: Servicios Públicos,
Productividad y Crecimiento en el Perú. Lima, Perú: Asociación de Empresas Privadas de Servicios Públicos (ADEPSEP).
References on Infrastructure Sectors Organismo Supervisor de Inversión Privada en Telecomunicaciones, 2002. El Proceso de
Apertura del Mercado de Telecomunicaciones. Estudios en Telecomunicaciones No. 10. Lima, Perú: OSIPTEL.
Organismo Supervisor de Inversión Privada en Telecomunicaciones, 2003. Compendio de Estadísticas de Telecomunicaciones en Perú, 1994-2002. Informe No. 025-GPR/2003. Lima, Perú: OSIPTEL.
Organismo Supervisor de la Inversión en Infraestructura de Transporte de Uso Público. Memoria Anual, Various Years. Lima, Perú: OSITRAN.
50

51
Ponce, F., Begazo, T., Tovar, C., Ponce de León, O., 2003. Procesos de Privatización y Apertura de las Telecomunicaciones en América Latina: Un Análisis Comparativo. Informe No. 001-GPR/2003. Lima, Perú: OSIPTEL
Subsector Eléctrico, 2002. Principales Indicadores del Año 2002. Lima, Perú: Dirección General de Electricidad, Ministerio de Energía y Minas