trends in flood stages: contrasting results from the mississippi and rhine river systems
TRANSCRIPT
Journal of Hydrology (2006) 331, 554–566
ava i lab le at www.sc iencedi rec t . com
journal homepage: www.elsevier .com/ locate / jhydro l
Trends in flood stages: Contrasting results fromthe Mississippi and Rhine River systems
Nicholas Pinter a,*, Brian S. Ickes b, Joseph H. Wlosinski b,Rienk R. van der Ploeg c
a Geology Department, Southern Illinois University, Carbondale, IL 62901-4324, USAb Upper Midwest Environmental Sciences Center, 2630 Fanta Reed Road, La Crosse, WI 54603, USAc Institute fur Bodenkunde, Universitat Hannover, Herrenhaeuser Str. 2, 30419 Hannover, Germany
Received 1 September 2005; received in revised form 24 April 2006; accepted 2 June 2006
Summary An obstacle to testing human impacts on flooding is that anthropogenic and naturalhydrologic changes occur simultaneously and are often indistinguishable. We attempted to iso-late the impacts of overlapping mechanisms on flooding by analyzing 73–188 years of stagemeasurements from the Mississippi River system and the German Rhine. Although typicallyunder-utilized in hydrologic analysis, stage data document the cumulative impacts of bothupstream changes such and climate and land use as well as modifications of the river channeland floodplain. Analysis of trends in peak stages and flood frequencies shows contrasting resultson the Mississippi and Rhine: increasing trends at most Mississippi stations, but no significanttrends at most Rhine stations. On the Mississippi and its tributaries, statistically significantchanges in peak stages and peak-stage frequencies were identified at 10 of 14 stations, withall but one exhibiting increased flooding. On the Rhine River, systematic change occurred atonly 1 of 8 stations analyzed. On both river systems, channel and floodplain modifications dom-inated net hydrologic response, overwhelming the effects of climate change, land-use shifts,and dam construction. Specific-gage analysis, which isolates the impacts of instream river mod-ifications, documented declining flow conveyance at all stations where flood levels and fre-quencies increased. Increased flooding at the Mississippi River sites appears to be driven bythe history of aggressive channel engineering, in particular channel constriction to increasenavigation depths. In contrast, navigation infrastructure on the Rhine has not substantiallydegraded the river’s capacity to efficiently convey flood flows.ª 2006 Elsevier B.V. All rights reserved.
KEYWORDSFlooding;Channelization;Hydrology;Rhine River;Mississippi River
0d
7
022-1694/$ - see front matter ª 2006 Elsevier B.V. All rights reserved.oi:10.1016/j.jhydrol.2006.06.013
* Corresponding author. Tel.: +1 618 453 7375; fax: +1 618 453393.E-mail address: [email protected] (N. Pinter).
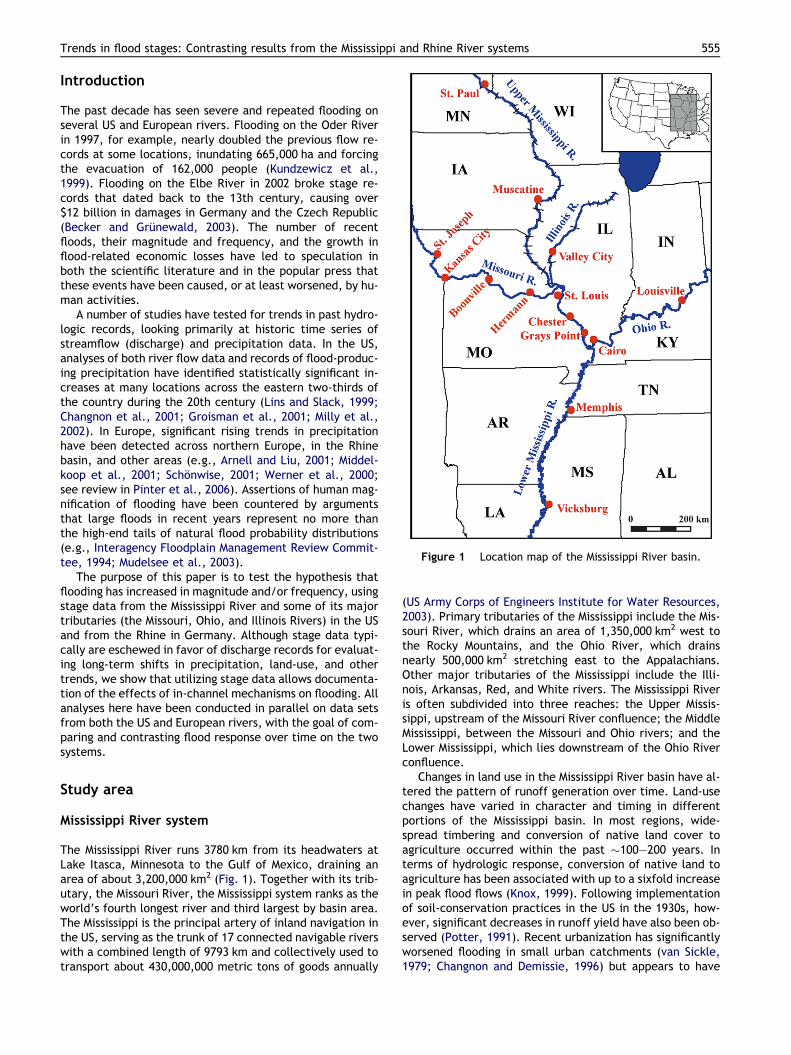
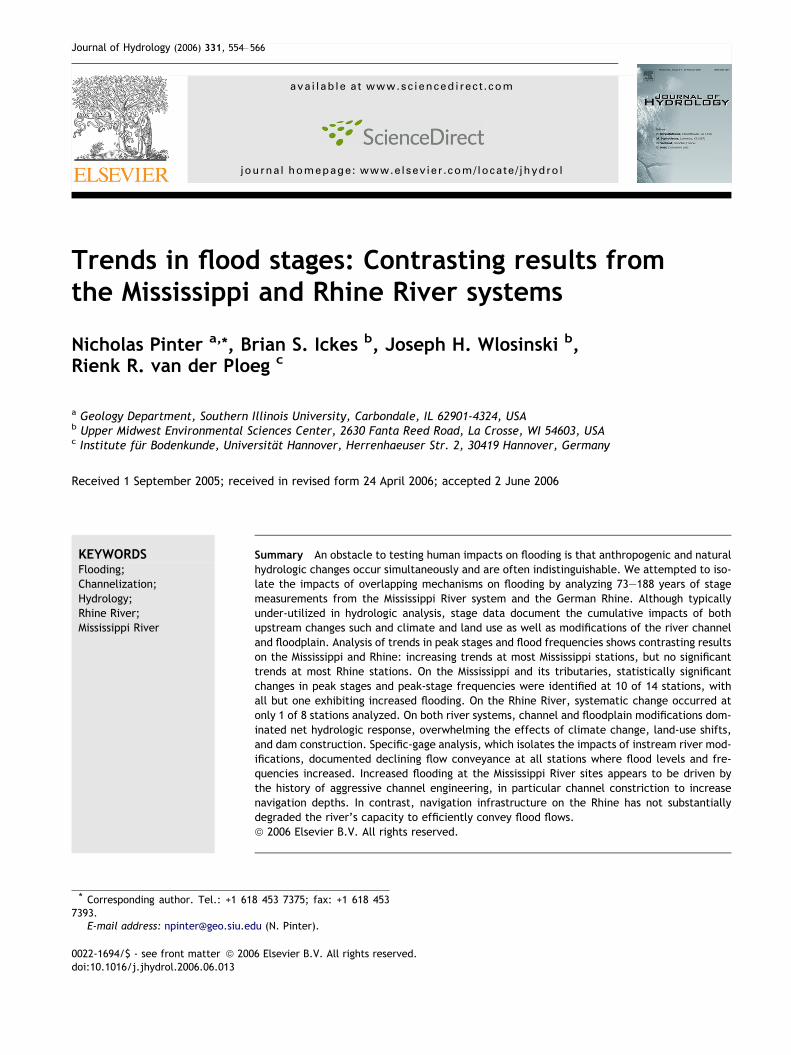
Figure 1 Location map of the Mississippi River basin.
Trends in flood stages: Contrasting results from the Mississippi and Rhine River systems 555
Introduction
The past decade has seen severe and repeated flooding onseveral US and European rivers. Flooding on the Oder Riverin 1997, for example, nearly doubled the previous flow re-cords at some locations, inundating 665,000 ha and forcingthe evacuation of 162,000 people (Kundzewicz et al.,1999). Flooding on the Elbe River in 2002 broke stage re-cords that dated back to the 13th century, causing over$12 billion in damages in Germany and the Czech Republic(Becker and Grunewald, 2003). The number of recentfloods, their magnitude and frequency, and the growth inflood-related economic losses have led to speculation inboth the scientific literature and in the popular press thatthese events have been caused, or at least worsened, by hu-man activities.
A number of studies have tested for trends in past hydro-logic records, looking primarily at historic time series ofstreamflow (discharge) and precipitation data. In the US,analyses of both river flow data and records of flood-produc-ing precipitation have identified statistically significant in-creases at many locations across the eastern two-thirds ofthe country during the 20th century (Lins and Slack, 1999;Changnon et al., 2001; Groisman et al., 2001; Milly et al.,2002). In Europe, significant rising trends in precipitationhave been detected across northern Europe, in the Rhinebasin, and other areas (e.g., Arnell and Liu, 2001; Middel-koop et al., 2001; Schonwise, 2001; Werner et al., 2000;see review in Pinter et al., 2006). Assertions of human mag-nification of flooding have been countered by argumentsthat large floods in recent years represent no more thanthe high-end tails of natural flood probability distributions(e.g., Interagency Floodplain Management Review Commit-tee, 1994; Mudelsee et al., 2003).
The purpose of this paper is to test the hypothesis thatflooding has increased in magnitude and/or frequency, usingstage data from the Mississippi River and some of its majortributaries (the Missouri, Ohio, and Illinois Rivers) in the USand from the Rhine in Germany. Although stage data typi-cally are eschewed in favor of discharge records for evaluat-ing long-term shifts in precipitation, land-use, and othertrends, we show that utilizing stage data allows documenta-tion of the effects of in-channel mechanisms on flooding. Allanalyses here have been conducted in parallel on data setsfrom both the US and European rivers, with the goal of com-paring and contrasting flood response over time on the twosystems.
Study area
Mississippi River system
The Mississippi River runs 3780 km from its headwaters atLake Itasca, Minnesota to the Gulf of Mexico, draining anarea of about 3,200,000 km2 (Fig. 1). Together with its trib-utary, the Missouri River, the Mississippi system ranks as theworld’s fourth longest river and third largest by basin area.The Mississippi is the principal artery of inland navigation inthe US, serving as the trunk of 17 connected navigable riverswith a combined length of 9793 km and collectively used totransport about 430,000,000 metric tons of goods annually
(US Army Corps of Engineers Institute for Water Resources,2003). Primary tributaries of the Mississippi include the Mis-souri River, which drains an area of 1,350,000 km2 west tothe Rocky Mountains, and the Ohio River, which drainsnearly 500,000 km2 stretching east to the Appalachians.Other major tributaries of the Mississippi include the Illi-nois, Arkansas, Red, and White rivers. The Mississippi Riveris often subdivided into three reaches: the Upper Missis-sippi, upstream of the Missouri River confluence; the MiddleMississippi, between the Missouri and Ohio rivers; and theLower Mississippi, which lies downstream of the Ohio Riverconfluence.
Changes in land use in the Mississippi River basin have al-tered the pattern of runoff generation over time. Land-usechanges have varied in character and timing in differentportions of the Mississippi basin. In most regions, wide-spread timbering and conversion of native land cover toagriculture occurred within the past �100–200 years. Interms of hydrologic response, conversion of native land toagriculture has been associated with up to a sixfold increasein peak flood flows (Knox, 1999). Following implementationof soil-conservation practices in the US in the 1930s, how-ever, significant decreases in runoff yield have also been ob-served (Potter, 1991). Recent urbanization has significantlyworsened flooding in small urban catchments (van Sickle,1979; Changnon and Demissie, 1996) but appears to have

556 N. Pinter et al.
had smaller impacts on rivers as large as the Mississippi andits major tributaries (ASCE, 1996).
The channel, banks, and floodplain of the Mississippihave been sweepingly modified during the past �100–200years. Through most of the 19th century and the beginningof the 20th, US federal government involvement on riverswas limited to navigation improvement. From the late19th century through the 20th century, construction to reg-ularize and deepen the shipping channel increased in inten-sity, extent, and degree of success. Navigation depths arenow guaranteed to a minimum of 3.7 m (12 feet) as far up-stream as the Mississippi-Ohio confluence and at least 2.7 m(9 ft) farther upstream on the Mississippi and on most of itsnavigable tributaries. From the initial limited focus on nav-igation improvement, the US government gradually assumedresponsibility for flood control through the early 20th cen-tury, particularly following severe flooding in 1927. On theLower Mississippi, levee lengths expanded from 160 km in1812 to 1600 km in 1855 (Changnon, 1998), and leveeheights grew from less than 1.5 m in the 18th and early19th centuries to more than 10 m above the banks today(Smith and Winkley, 1996). Along the Upper Mississippi, aslittle as 60 km of levees existed as late as 1891 (Stevenset al., 1976), but that number has increased to about13,000 km of levees today (Tobin, 1995).
Rhine River system
With a length of 1300 km and a basin area of 185,000 km2,the Rhine system (Fig. 2) is small relative to the Mississippi,but it is home to 50,000,000 inhabitants in 9 countries – a
Figure 2 Location map of the Rhine River basin.
population density over 10 times higher than that of the Mis-sissippi basin. The Rhine basin has a long history of changeswith potential significance to the occurrence and magni-tudes of floods. Population growth over the past 2000 yearsled to steady increases in agricultural acreage (Krahe,1999). During the Middle Ages, critical thresholds of popula-tion and land-use intensity were crossed in many areas ofcentral Europe, causing periods of widespread soil strippingfrom hillslopes and sedimentation in valley bottoms andstreams (Richter, 1998; Bork et al., 1998; Ennen et al.,1979). The responses of rivers to these long-term changesin land use and land cover are difficult to disentangle fromfluctuations in climate over the same time periods, but longhistorical records at many locations document large-scalevariations in flood frequencies over centennial time scales(Brazdil et al., 1999; Glade et al., 2001; Llasat and Barrien-dos, 2001). During the 20th century, urbanization and inten-sification of agriculture have both been linked to observedincreases in flood magnitudes (e.g., Koehler, 1992; vander Ploeg and Schweigert, 2001; Naef et al., 2002).
The Rhine River channel has been intensively modifiedduring its history. The Upper Rhine was channelized betweenBasel and Worms from about 1817 to 1890. Work concen-trated on channel simplification and straightening, withthe reach from Basel to Mannheim reduced in length from354 to 273 km (Silva et al., 2001). In Switzerland, regulationtook place between 1878 and 1890 (Gerhart, 1996). The Low-er Rhine, from Bonn downstream through The Netherlands,was channelized during the latter half of the 19th century,with expansion and extension of that work through the20th century (Havinga and Smits, 2000; Wetzel, 1996). Con-solidation and stabilization of the Rhine channel, combinedwith on-going construction of levees (dikes), reduced thefloodplain area between Cologne and the Dutch border from1800 to only 300 km2 at present (Lammersen et al., 2002).
Starting in the late 19th century, modification of theRhine was expanded beyond the original goals of flood con-trol and drainage to include facilitation of navigation. TheTreaty of Mannheim (Mannheimer Akte), signed in 1868, for-mally opened the Rhine to international commerce and ledto the steady expansion of traffic. The Rhine today is theprimary commercial river in Europe, carrying more than290,000,000 metric tons of cargo annually (Wetzel, 1996).On the Upper Rhine, the channel was deepened for boattraffic, mainly during the early 20th century, using groins(wing dams) which narrowed the channel to as little as80 m (Dister et al., 1990). Minimum navigation depths alongthe Rhine today range from 4.5 m to as little as 1.9 m (CHR,1993). The shallowest depths occur in the Middle Rhine, be-tween Bingen and Bonn, where the river flows through aconfined gorge cut through the Rhenish Slate Mountains.
Methods
We analyzed maximum annual stages and flood frequenciesfrom 14 measurement stations on the Mississippi, Missouri,Ohio, and Illinois Rivers in the United States and the 8long-term stations on the German Rhine (Table 1) Stagedata were assembled for locations along the Mississippi Riv-er and its major tributaries where at least 75 continuousyears of record were available. Discharge data were also

Table 1 Summary of gage locations and data
Gage River Mean max. flow (cm) Drainage area (km2) Stage data (dates) Discharge data (dates)
St. Paul Mississippi 312 95,312 1905–2002 1930–2002Muscatine Mississippi 1570 257,574 1900–2002 N.A.St. Louis Mississippi 5117 1,805,222 1861–2002 1861–2002Chester Mississippi 5437 1,835,266 1891–2002 1943–2002Grays Point Mississippi 5720 1,846,993 1878–2002 N.A.Memphis Mississippi 13,977 2,415,941 1892–2002 1933–2002Vicksburg Mississippi 19,924 2,953,881 1888–2002 1931–2002St. Joseph Missouri 1179 1,088,572 1900–2002 1931–2002Kansas City Missouri 1583 1,256,662 1898–2002 1928–2002Boonville Missouri 1732 1,299,397 1898–2002 1926–2002Hermann Missouri 2315 1,357,672 1898–2002 1931–2002Louisville Ohio 3288 236,129 1875–2002 1928–2002Cairo Ohio 7787 528,202 1872–2002 N.A.Valley City Illinois 639 69,264 1885–1999 N.A.
Maxau Rhine 3067 50,196 1889–2001 1921–2002Worms Rhine 3470 68,827 1890–2001 1936–2002Mainz Rhine 4108 98,206 1930–2002 1930–2002Kaub Rhine 4299 103,488 1856–2002 1930–2002Andernach Rhine 6299 139,549 1819–2002 1930–2002Cologne Rhine 6378 144,232 1816–2002 1900–2002Dusseldorf Rhine 6494 147,680 1872–2001 1930–2002Rees Rhine 6661 159,300 1814–2001 1814–2002
Trends in flood stages: Contrasting results from the Mississippi and Rhine River systems 557
collected for the subset of those sites where discharge hasbeen systematically measured. Data for the US rivers wereprovided by the US Geological Survey and by the US ArmyCorps of Engineers. Stage and discharge data were alsoassembled for locations along the Rhine River with at least50 years of record. The German data were provided bythe Global Runoff Data Center (GRDC) and the GermanyFederal Water Authority (Bundesanstalt fur Gewasserkunde[BfG]) in Koblenz, Germany.
All data were examined for continuity and quality. Stagedata at Rees date back to 1814, but because of a 12-yeargap beginning in 1842, only stages beginning in 1854 wereutilized. Similarly, discharges at Cologne date back to1816, but the 19th century values may be partially or fullyextrapolated from a later rating curve, so only dischargesbeginning in 1900 were utilized here. Additional informationwas provided by the BfG concerning datum shifts at theRhine River gages. Datum shifts were also noted for allthe US gages, so that all stage data were corrected to a uni-form vertical datum at every gage location. In addition, atall locations where discharge data were available, we testedfor any additional changes in stage datum by generatingtime series of stages for fixed discharge conditions (see‘‘Specific-gage analysis’’ below) and testing these time ser-ies for abrupt jumps. At Rees and at Worms, additional da-tum shifts were deduced from the source data (abruptjumps in daily stage and shifts in the rating curves, oftenin the first day of a new hydrologic year). Parallel stageand discharge records also were used to identify isolated er-rors in the stage data. Changes in stage between adjacentdays (oh) were compared with the corresponding changesin discharge (oQ), and if the absolute value of oh/oQ ex-ceeded a threshold value (5% on the US rivers; 20% on the
European rivers), then the data were examined manually.A higher threshold was used for the Rhine River because flowon the Rhine varies more rapidly than flow on the Mississippisystem. If a simple transcription error could be inferred,then that value was corrected; otherwise the value was ex-cluded from the analysis.
Trends in flood heights
Maximum annual stages over the period of record at eachlocation were analyzed using autoregressive least-squaresregression, ordinary least-squares regression, and moving-average time-series models (Table 2). At each gage, a nullhypothesis of ‘‘no trend’’ was tested. The null hypothesiswas rejected if a significant slope term was observed inthe regression results (P 6 0.05). In addition, for each timeseries, a Durbin–Watson test was performed to diagnose thepresence or absence of significant temporal autocorrela-tion. Autocorrelation, when present and unaccounted for,can bias estimates of the regression slope coefficient andcan result in incorrect inference (Zar, 1999). When signifi-cant temporal autocorrelation was present, an autoregres-sive model of the generalized form:
xt ¼ nþ /�1xðt� 1Þ þ /�2xðt� 2Þ þ � � � þ /�nxðt� nÞ þ e ð1Þwas applied to the time series to remove potential bias inslope terms of the results, where n is a constant (intercept);/1,/2,/3, . . .,/m are the autoregressive model parameters,and e is a random error component. Additionally, 5-year,10-year, and 20-year moving averages of the form:
y½i� ¼ 1
M
XM�1
j¼0x½iþ j� ð2Þ

Table 2 Trends in maximum annual stage (cm) over time at 14 long-term gaging stations on the Mississippi River system and 8stations on the Rhine River
River Station Model forma Slope coefficient Student’s t P Adj R2
Mississippi St. Paul AR1 0.006 0.03 0.973 0.008Mississippi Muscatine OLS 0.427 4.30 <0.001 0.146Mississippi St. Louis AR1 0.122 2.49 0.014 0.121Mississippi Chester AR1 0.732 3.83 <0.001 0.222Mississippi Grays AR1 0.640 4.51 <0.001 0.283Mississippi Memphis AR1 �0.274 �1.77 0.080 0.101Mississippi Vicksburg AR1 �0.366 �2.22 0.029 0.157Missouri St. Joseph AR2 0.427 3.61 <0.001 0.220Missouri Kansas City AR1 0.061 0.41 0.685 0.067Missouri Boonville AR1 0.671 4.12 <0.001 0.241Missouri Hermann AR1 0.701 4.26 <0.001 0.240Ohio Louisville OLS 0.030 0.19 0.849 �0.008Ohio Cairo AR1 0.244 2.11 0.037 0.109Illinois Valley City AR1 0.457 3.76 <0.001 0.184
Rhine Maxau OLS 1.201 5.55 <0.001 0.212Rhine Worms AR1 �0.240 �0.82 0.417 0.006Rhine Mainz OLS 0.691 1.25 0.215 0.008Rhine Kaub OLS 0.353 1.39 0.167 0.006Rhine Andernach OLS 0.633 1.73 0.087 0.015Rhine Cologne AR1 0.004 0.02 0.985 0.008Rhine Dusseldorf OLS �0.487 �1.45 0.149 0.009Rhine Rees AR1 �0.365 �1.57 0.119 0.010a This field describes the form of the regression model used to derive the relationship between maximum annual elevation and year; first
order autoregressive model (AR1), second order autoregressive model (AR2), ordinary least squares (OLS).
558 N. Pinter et al.
were applied to each time series to evaluate the presenceof long-term trends in maximum annual stage, where x[ ]is the input signal, y[ ] is the output signal, and M is the num-ber of years for which the moving average is calculated.
Trends in flood frequency
Trends in flood frequencies over time were examined usingv2 tests on two-way contingency tables (Fig. 3) in order toinfer changes in flood frequencies. Daily stage data wereanalyzed over the period of record for each of the 14 Missis-sippi system sites and the 8 Rhine stations. At each location,the stage time series was screened for the top 1% of stagerecordings. Any year that contained at least one value with-in that top 1% of daily stages was counted as a flood year;any year without one such value was counted as a non-flood
Flood Non-flood
First halfof record
Second halfof record
n11
n21
n12
n22
Figure 3 Example of a 2-way contingency table used in theflood frequency analysis. The number of flood and non-floodyears was tallied for the first half of the record (represented byn11 and n12, respectively), and the second half of the record(represented by n21 and n22, respectively) and recorded in a2 · 2 table for analysis.
year. Although the 1% threshold is physically arbitrary, itdiscriminated well between flood and non-flood years atall stations. For each station, the full period of record wasdivided equally in half. The number of flood and non-floodyears, as defined above, in each half of the time series weretallied and compiled into a two-way contingency table.Pearson’s v2 analysis (Agresti, 1996) was performed on eachof the 22 contingency tables to test a null hypothesis of ‘‘nodifference’’ in the frequency of flooding between periods.
Specific-gage analysis
Specific-gage analysis is a technique for identifying changesin stage time series for equal-discharge conditions. Unlikethe analyses above, which utilized raw stage values, spe-cific-gage analysis filters stages to identify changes ortrends over time with discharge held to a single and con-stant value of choice. We carried out specific-gage analysesfor all stations and for all years for which parallel stage anddischarge data were available. The data were separated byyear in order to create annual rating curves, and stage wasregressed against discharge for each year and for each gage.Second-order semi-log regressions produced the best fits forall gages and for almost all years. For any year for which ther2 of the regression was less than 0.95, we attempted to usean alternative model (generally either a third-order semi-log or a second-order linear relationship) if that model im-proved the goodness of fit above the 0.95 threshold. If nosuccessful alternative could be found, then that year ofdata was excluded from the analysis. The algebraic expres-

Trends in flood stages: Contrasting results from the Mississippi and Rhine River systems 559
sion of each regression model for each year was tabulated,along with the maximum and minimum measured dischargein that year. Next, one or more discharge values were se-lected, and the associated ‘‘specific stages’’ were calcu-lated using the rating relationships for all years over theduration of record. We allowed no extrapolation of the rat-ing curves, excluding all years in which the selected dis-charge was less than the measured minimum or greaterthan the measured maximum. For more details of this meth-odology, see Pinter et al. (2001) or Pinter and Heine (2005).
Results
Trends in flood stages
The hypothesis of ‘‘no trend’’ in the maximum annual stageover the period of record was rejected for 10 of the 14 USmeasurement stations, but for only 1 of the 8 Rhine stations(Table 2). For those stations where the null was rejected inthe US, all but Vicksburg had positive regression slope coef-ficients, suggesting that the maximum annual stages haveincreased over the period of record. At Vicksburg, therehas been a significant decline in the maximum annual stageover the period of record. At Maxau, there has been a signif-icant increase in maximum annual stages. For each gagingstation with a significant slope term in the model, the rateof increase or decrease can be interpreted as the value ofthe slope coefficient (Column 4 in Table 2). Fig. 4 shows run-ning-average maximum annual stages at selected stationswhere statistically significant positive trends (Fig. 4a) andnegative trends (Fig. 4b) were observed.
Trends in flood frequency
The null hypothesis of ‘‘no difference’’ in the analysis offlood frequencies was rejected for 10 of the 14 Mississippisystem stations and for 2 of the 8 Rhine stations (Table 3).Of the 10 US sites for which the null was rejected, 8 exhib-ited significantly more floods in the second half of the per-iod of record, and two exhibited significantly more floods inthe first half of the record. Of the 2 Rhine sites for which thenull was rejected, both exhibited significantly more floodsin the second half of the period of record. One of the statis-tics generated by this analytical approach is a parameterknown as a log-odds statistic. Reverse transformation ofthe log-odds statistic, and its associated 95% asymptoticconfidence intervals, is equivalent to the multiple of timesflooding is more likely to occur in one half of the data seriesthan in the other half. The log-odds statistic was calculatedfor each station where the null hypothesis of ‘‘no differ-ence’’ was rejected (Column 7 of Table 3).
Specific-gage analysis
Specific-stage plots were created for all gages and for alltime periods for which parallel stage and discharge datawere available. Selected specific-gage plots are shown inFig. 5. Each set of points represents the specific stages asso-ciated with a constant discharge, so that any shift in specificstage over time can be interpreted as a change or trend inthe rating relationship at the gaging location. The dominant
changes illustrated by specific-gage analysis of the RhineRiver gages are vertical shifts in the channel of the Rhine,mostly downward. Specific-stage changes for the smallestdischarges reflect bed incision or aggradation at or nearthe gaging location (Pinter and Heine, 2005). Small amountsof channel aggradation are documented at the most up-stream sites, at Maxau and at Speyer. At all of the sitesdownstream, the specific stages for the lowest dischargessuggest channel incision up to an average rate of over2 cm/year at Rees. At all of the sites along the Rhine show-ing incision, the specific stages suggest that channel degra-dation has occurred more slowly, or even slightly reversed,within the past 10–15 years.
Discussion
Mechanisms that can alter the magnitude or probability offlooding at a particular location along a river can be usefullysubdivided into ‘‘upstream factors’’ and ‘‘instream fac-tors’’ (Pinter et al., 2002). Upstream factors refer to pro-cesses that can increase or decrease the likelihood ofgenerating large flood flows (discharges) from the contribut-ing basin, whereas instream factors include processes withinthe channel-floodplain system itself that may alter thestage-discharge relationship of the reach of interest, there-by increasing or decreasing the water-surface elevationassociated with a given flood discharge. Peak stages arethe broadest possible measure of flood behavior over time.Any statistically significant peak-stage trends necessarily re-flect the combined effects of upstream and downstreamfactors, including any climate change, land-use shifts,and/or channel modification. In contrast, specific-gageanalysis focuses exclusively on instream changes, such asloss of flood conveyance capacity of the channel and flood-plain over time. Specific-gage analyses have been com-pleted previously on portions of the Mississippi River(Pinter et al., 2001), the Missouri River (Pinter and Heine,2005), and the Rhine River (Pinter et al., 2006), in orderto examine trends in conveyance capacity in response tovarious instream alterations of these rivers.
Trends in stages
On the Mississippi River and its tributaries, generalizedhypotheses of ‘‘no change’’ over time in flood heights andfrequencies were rejected at a large majority of the sta-tions analyzed. The threshold of rejection for these nullhypotheses, at 95% confidence, is highly conservative, andrejection of the null for this broad variety of flood parame-ters for so many stations demonstrates large and significantchanges in flood behavior on the Mississippi, Missouri, Ohio,and Illinois Rivers through the past century or longer.
At those US river stations where statistically significanttrends over time were documented, the direction of thosetrends was upward at virtually all locations and for all tests:9 of 10 for flood height (all except Vicksburg), and 8 of 10for frequency (all except Vicksburg and Memphis). Vicksburgand Memphis are located on the Lower Mississippi, wherethe river was straightened and shortened by a series ofmeander cutoffs during the late 1920s and the 1930s. Inthe vicinity of Vicksburg, the channel was shortened by
Stag
e (m
)
4.0
7.0
10.0
13.0
16.0
1900 1920 1940 1960 1980 2000
Max. annual stages5-year running average
10-year running average
Mississippi Riverat Chester, Illinois
Stag
e (m
)
7.0
6.0
8.0
9.0
10.0
1900 1920 1940 1960 1980 2000
Max. annual stages5-year running average
10-year running average
Mississippi Riverat Vicksburg, MS
Figure 4 Maximum annual stages and 5-year running averages at selected stations where the null hypothesis of ‘‘no trend’’ wasrejected and where the trends were upward (a) and downward (b) over time. On the US rivers, only Vicksburg illustrated astatistically significant downward trend; whereas on the European rivers, only Maxau illustrated an upward trend.
560 N. Pinter et al.
about 45% from 1929 to 1936, which increased the slope ofthe river and triggered incision of up to 3 m (Smith andWinkley, 1996). It is worth noting, however, that after inci-sion ceased at Vicksburg in the early 1940s, the specific-gage results (see discussion below) document subsequent in-creases in flood levels that have nearly equaled the short-term drop that followed the cutoffs.
On the River Rhine, the null hypothesis of ‘‘no differ-ence’’ was rejected at only 1 station (Maxau; Table 2) inthe test of maximum annual stages, and 2 stations in the
test of flood frequencies (Andernach and Maxau; Table 3).On the Rhine, the only consistent pattern of rising floodtrends occurred at Maxau, which is the long-term gage lo-cated farthest upstream on the German Rhine. Elsewhereon the Rhine, the other stations exhibit either no significantchange over the duration of record, or isolated hints ofshifts (e.g., a significant positive trend in frequencies butno other trends at Andernach). The specific-gage analysesillustrate how flood response at Maxau differs from theother Rhine sites (see discussion below).

Table 3 Trends in flood frequencies over time at 14 long-term gaging stations on the Mississippi River system and 8 on the RhineRiver
River Station Floods first half Floods second half X2 P Log odds 95% asymptotic CIE’s
Mississippi St. Paul 13 9 0.94 0.33 NS (NS, NS)Mississippi Muscatine 7 16 4.76 0.03 2.94 (1.77, 4.88)Mississippi St. Louis 10 25 8.53 0.004 3.32 (2.17, 5.06)Mississippi Chester 4 20 13.58 <0.001 7.22 (4.01, 13.02)Mississippi Grays 1 24 26.91 <0.001 39.16 (13.83, 110.92)Mississippi Memphis 14 5 4.95 0.03 0.30 (0.17, 0.53)Mississippi Vicksburg 11 1 9.50 0.002 0.07 (0.03, 0.21)Missouri St. Joseph 6 25 17.19 <0.001 7.37 (4.40, 12.36)Missouri Kansas City 12 14 0.26 0.61 NS (NS, NS)Missouri Boonville 8 27 16.02 <0.001 6.08 (3.78, 9.76)Missouri Hermann 7 28 19.51 <0.001 7.67 (4.69, 12.54)Ohio Louisville 27 27 0 1.00 NS (NS, NS)Ohio Cairo 11 18 2.31 0.13 NS (NS, NS)Illinois Valley City 4 13 5.78 0.02 3.40 (2.17, 7.32)
Rhine Maxau 22 37 8.06 0.005 3.01 (2.03, 4.56)Rhine Worms 31 28 0.32 0.570 NS (NS, NS)Rhine Mainz 18 20 0.12 0.73 NS (NS, NS)Rhine Kaub 29 40 3.37 0.07 NS (NS, NS)Rhine Andernach 22 39 9.05 0.003 2.98 (2.06, 4.30)Rhine Cologne 45 50 0.54 0.46 NS (NS, NS)Rhine Dusseldorf 33 30 0.28 0.60 NS (NS, NS)Rhine Rees 38 27 3.32 0.069 NS (NS, NS)
Trends in flood stages: Contrasting results from the Mississippi and Rhine River systems 561
Specific-gage trends
The results of the specific-gage results for both the Missis-sippi and Rhine sites can be most usefully discussed by com-paring them with the raw stage trends. At all sites for whichstatistically significant rising trends were documented, allof these sites exhibited strong upward trends in specificstages associated with flood flows (see Fig. 5a and c). Be-cause specific stages track water levels for equal flow con-ditions, upward trends in the specific stages imply loss offlood conveyance capacity due to in-stream changes only,excluding changes in the discharge probability distributiondue to upstream factors. Climate change or new upstreamreservoirs, for example, may alter the probability of a par-ticular discharge downstream, but the stage associated withsuch a fixed discharge (‘‘specific stage’’) is a direct result ofthe conveyance capacity of the local channel reach. Thusthe extremely close correlation between specific-stage in-creases and increases in net flood stages – which reflectall factors influencing flooding – suggests that in-channelforcing of flood behavior is the primary mechanism drivingobserved flood magnification. This in-channel forcing iswidespread on the Mississippi system sites, but at the Ger-man river sites analyzed, in-channel forcing occurs only atMaxau.
Similar to the results above, at sites for which statisti-cally significant falling stage trends were documented, spe-cific stages also decreased, at least for the low flows (e.g.,Fig. 5b). As previously discussed, decreasing specific stagesfor the lowest discharges typically indicate incision, forexample the �3 m of incision at Vicksburg in the 1930s.Downward trends for low flows may coincide with either
falling or rising specific stages for flood discharges at thesame locations and over the same time intervals. At Reeson the Rhine, specific stages for the highest dischargesessentially parallel the incision-driven drop at low flow. Incontrast, at all of the Middle Mississippi and Lower Missourisites, for example at Chester (Fig. 4a), dramatic losses inconveyance capacity have overwhelmed incision at thosesites, resulting in net increases for flood stages. This lossin flood conveyance capacity on the Mississippi and Missourihas been linked by a variety of evidence to flood-control andnavigation engineering of those rivers (e.g., Criss and Shock,2001; Pinter et al., 2001).
Specific-gage results across a range of discharge condi-tions also help to explain the variety of results along the Riv-er Rhine, from significant increases upstream at Maxau tohints of increases (generally not significant) from Mainz toAndernach, to neutral to falling trends for all sites down-stream. Fig. 6 illustrates the average slopes of specific-gagetrends for the full range of discharges at each gage. Incision(negative values for the lowest discharges) is seen at allsites except Maxau. At all stations, the specific-stage slopesincrease with increasing discharge, indicating some loss ofconveyance capacity relative to the aggrading (at Maxau)or degrading (at all the other Rhine sites) channel bed. Atthe incising locations, Andernach exhibits a conveyance lossthat exceeds the incision and results in a net positive slopefor the largest flows. Andernach is the one site on the Rhineother than Maxau where flood frequencies rose significantly.At the two most downstream sites, Dusseldorf and Rees, thespecific-gage slopes are strongly negative even at the high-est flows, a result that is reflected in the negative slopes inpeak flood levels (Column 4 in Table 2).

100
200
300
400
500
600
700
800
1000
1100
1200
Stag
e (c
m)
1920 1930 1940 1950 1960 1970 1980 1990 2000100
200
300
400
500
600
700
800
900
40003500
2000
2500
3000
1500
1000
500
(a) River Rhineat Maxau
Stag
e (c
m)
11.00010.000
8000
6000
4000
3000
2000
10001920 1930 1940 1950 1960 1970 1980 1990 20001860 1870 1880 1890 1900 1910
(b) R. Rhine at Rees
Stag
e (c
m)
1930 1940 1950 1960 1970 1980 1990 2000
0
200
400
600
800
1000
1200
1400
1600(d) Mississippi R. at Vicksburg
280
1100
2300
5100
200019901980197019601950194019300
200
400
600
800
1000(c) Missouri River
at St. Joseph 8500
396,000
226,000
170,000
113,000
57,000
283,000
Figure 5 Specific-gage plots for: (a) Maxau (Rhine R.), (b) Rees (Rhine R.), (c) St. Joseph (Missouri R.), and (d) Vicksburg(Mississippi R.). These locations are shown because they illustrate representative results including both rising trends and fallingtrends for both the US and German rivers. Each group of points shown at each site indicates the stages associated with a fixed andprecise discharge condition. Increases in these ‘‘specific stages,’’ either from one year to the next or gradual trends over time,indicate a loss of conveyance capacity within the river system for that particular discharge. Decreases in specific stages over timeindicate increased conveyance capacity, such as additional cross-sectional area due to channel incision.
562 N. Pinter et al.
Comparison of results from the Mississippi andRhine River systems
Although both the Rhine and Mississippi Rivers have beenheavily modified for navigation and other uses during thepast 100–200 years, empirical trends in flood levels and fre-quencies are very different on the two river systems: sys-tematically rising trends on the Mississippi and its
tributaries, with no such systematic pattern on the Rhine.The reason for this difference may lie in contrasting engi-neering strategies. Minimum navigation depths on the Rhinevary substantially in accordance with the natural limitationsof the channel, as little as just 1.9 m along the MiddleRhine, downstream of Mainz. In contrast, the Mississippi Riv-er channel has been engineered and dredged to maintainminimum depths of at least 3.4–4.0 m (11–13 ft; St. Paul

-2
0 0.25 0.5 0.75 1 1.25 1.5
-1.5
-1
-0.5
0
0.5
1
Q / Qmax
Rees
Düsseldorf
Cologne
Andernach
Kaub
Mainz
Worms
Maxau
Spec
ific
-gag
e sl
ope
(cm
/yea
r)
Figure 6 Synthesis of all specific-gage results for stations on the River Rhine. Vertical axis shows the average trend-line slope ofspecific stages over time (calculated over the longest possible duration; see below) for a series of different discharge conditions.Discharges (horizontal axis) are shown as a ratio to the mean annual maximum flow at each gaging station, which allows for bettercomparison of different sites. Specific stages are calculated only for flows that were actually measured in each year (i.e., noextrapolation), so that trends for the highest and lowest flows are based on fewer data. Slopes are shown for the full range ofdischarges at each station for which the number of annual specific stages exceed 50% of the duration of record. Specific-stage trendslopes greater than zero indicate rising stages for that flow; negative slopes indicate falling stages. All stations except Maxau haveexperienced net incision over the duration of record (negative slope for the smallest flows), and specific-stage slopes at all stationsincrease with increasing discharge, indicating progressive loss of conveyance capacity relative to the baseflow conditions.
Trends in flood stages: Contrasting results from the Mississippi and Rhine River systems 563
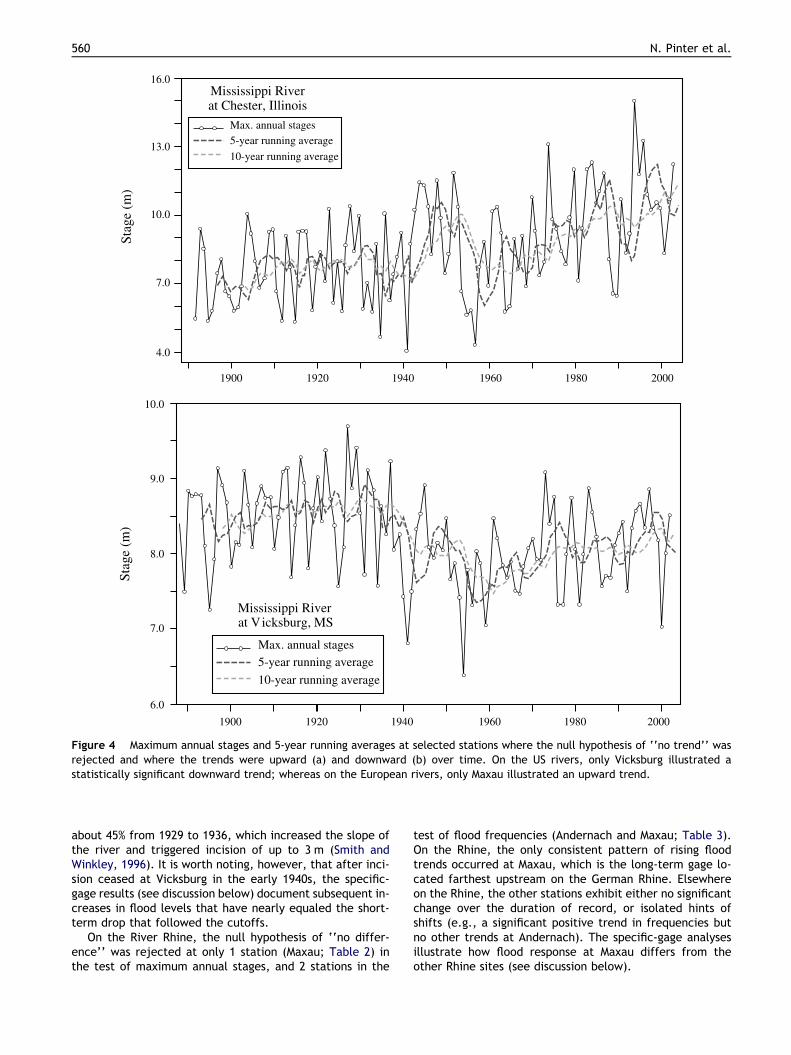
District, US Army Corps of Engineers, 2001). As a result oflimitations in depth and width, navigation on much of theGerman Rhine is in vessels (Fig. 7b) that are a fraction ofthe size of the largest multi-hull motor tows that run onthe Mississippi River system (Fig. 7a). The deeper navigationdepths that are required by the much larger and deeper-draft vessels on the US rivers are maintained by proportion-ally larger wing dams and other engineering structures(Fig. 7c and d). We suggest that the less aggressive regula-tion of the Rhine River appears to have allowed additional‘‘degrees of freedom’’ in the engineering design, so thatmaintenance of the shipping channel has not required signif-icant degradation of the river’s capacity to efficiently con-vey flood flows.
Overlapping influences
The result above is consistent with previous studies suggest-ing significant hydrologic impacts of river engineering struc-tures and activities (e.g., Criss and Shock, 2001; Pinter andHeine, 2005). The trends in raw flood stages presented hererepresent the cumulative effects of several overlappingmechanisms, including channel modifications as well as pre-cipitation shifts, land-use changes, dam construction, leveeconstruction on the floodplain, and channel incision. Long-
term increases in flood-causing precipitation have beenseen on both on the Rhine (e.g., Engel, 1997; Schonwise,2001; Pinter et al., 2006) and on the Mississippi system(e.g., Olsen et al., 1999; Groisman et al., 2001). At almostall measurement stations on both rivers, incision driven bychannel constriction and/or upstream sediment storage isshown to have resulted in lower water levels for small dis-charges. At the same time, levee construction on the flood-plains of the Rhine as well as the Mississippi River and itstributaries has been shown to increase flood levels associ-ated with the largest flood flows (e.g., Plate, 2001; Pinter,2005). All of these other effects are documented on boththe Rhine and Mississippi systems – although further re-search is needed to better quantify the magnitudes of pre-cipitation trends and flood magnification due to levees –so that that none of these other mechanisms provides a sat-isfactory explanation for the sharp contrast in net floodtrends between the Mississippi and Rhine stations.
Trends over time in peak stages are the result of a com-plex interplay of overlapping causal mechanisms (Fig. 8).Because stages reflect the combined effects of both in-stream and upstream changes, rising or falling trends stagesmay coincide with any condition (rising, falling, or nodetectable trend) in specific stages at the same location.For example, on the Lower Rhine at Dusseldorf and Rees,
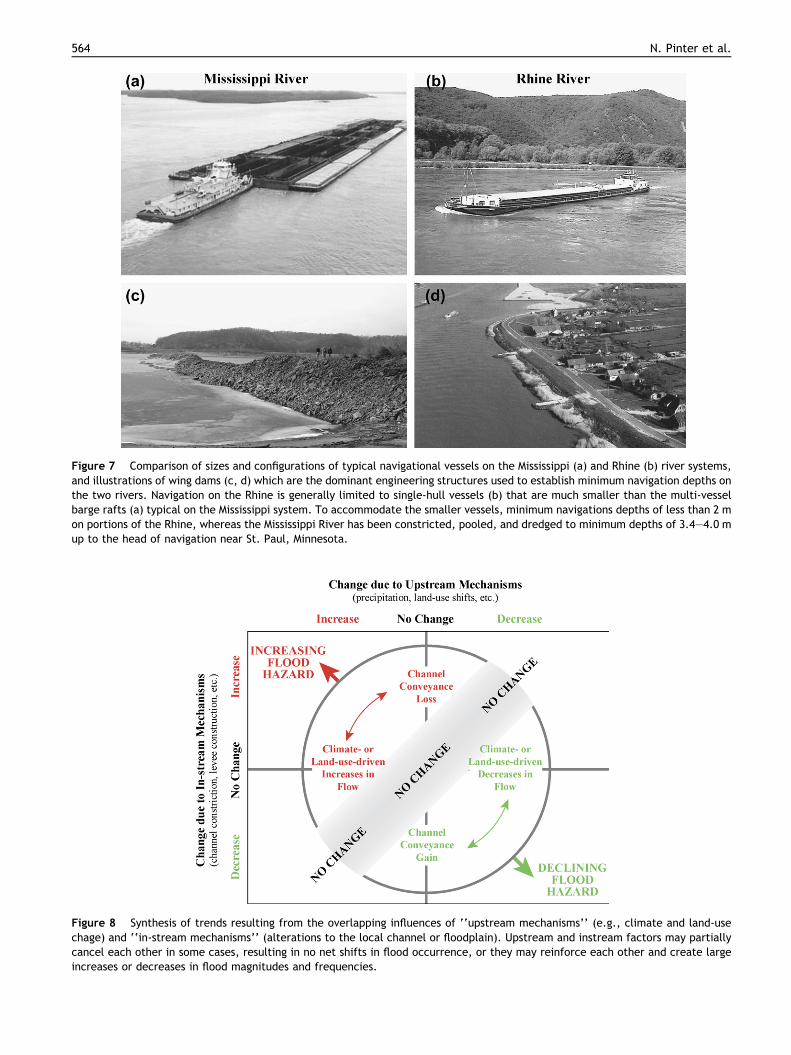
Figure 7 Comparison of sizes and configurations of typical navigational vessels on the Mississippi (a) and Rhine (b) river systems,and illustrations of wing dams (c, d) which are the dominant engineering structures used to establish minimum navigation depths onthe two rivers. Navigation on the Rhine is generally limited to single-hull vessels (b) that are much smaller than the multi-vesselbarge rafts (a) typical on the Mississippi system. To accommodate the smaller vessels, minimum navigations depths of less than 2 mon portions of the Rhine, whereas the Mississippi River has been constricted, pooled, and dredged to minimum depths of 3.4–4.0 mup to the head of navigation near St. Paul, Minnesota.
Figure 8 Synthesis of trends resulting from the overlapping influences of ‘‘upstream mechanisms’’ (e.g., climate and land-usechage) and ‘‘in-stream mechanisms’’ (alterations to the local channel or floodplain). Upstream and instream factors may partiallycancel each other in some cases, resulting in no net shifts in flood occurrence, or they may reinforce each other and create largeincreases or decreases in flood magnitudes and frequencies.
564 N. Pinter et al.
Trends in flood stages: Contrasting results from the Mississippi and Rhine River systems 565
specific stages for most flows trended downward over theduration of record, but peak magnitudes and flood frequen-cies have remained unchanged. Looking at both river sys-tems, all sites for which statistically significant risingtrends were documented exhibited strong upward trendsin specific stages for flood flows. Similarly, all sites forwhich statistically significant falling stage trends were doc-umented exhibited decreases in specific stages for some orall flow conditions. In-channel mechanisms appear to havedriven most of the detectable changes in flood hazard onthe rivers analyzed here.
Conclusions
Time series of daily stage data from the Rhine River andfrom the Mississippi River system in the US were tested forstatistically significant trends over time. Maximum annualstages showed changes significant at the 95% confidence le-vel at 10 of the 14 US measurement stations, including risingtrends at 9 of those sites and a falling trend at just one site(Vicksburg). On the Rhine River, significant trends in peakstages were observed at only 1 of the 8 measurement sta-tions, a rising trend at Maxau. Similarly, flood frequenciesshowed statistically significant changes at 10 of the US riverlocations (rising at all except Vicksburg and Memphis),whereas significant changes on the German rivers were ob-served at just 2 sites (at Maxau and Andernach; both risingtrends). In summary, using highly conservative statisticalthresholds, significant increases in flood levels and frequen-cies can be documented at the majority of US sites ana-lyzed. In contrast, only one site on the Rhine, at Maxau,exhibited a systematic pattern of increases.
This contrast in flood trends on the Mississippi river sys-tem versus the Rhine River is connected, we suggest here,to the more intensive engineering design of the Mississippiriver system navigation channel. Specific-gage resultsshowed declining flow conveyance at all stations in boththe US and Germany where significant increases in peakstages and flood frequencies occurred. The close correlationbetween specific-stage increases and increases in net floodstages suggests that instream changes have been the domi-nant control on the flood magnification at the sites analyzedhere. The effects of upstream changes such as climate andland use can be discerned at several locations, but the muchclearer and stronger signal at least to date appears to befrom river engineering and other historical modificationsof the river channels. We suggest that the more industrialdesign of the shipping channel on the Mississippi and its ma-jor tributaries, along with on-going levee construction anddevelopment of the associated floodplains, appear to havecompromised the US rivers’ capacity to efficiently conveyflood flows.
Acknowledgements
We dedicate this paper to the memory of Rienk van derPloeg – scholar, colleague, and friend – who passed awayon September 4, 2005 after a long illness. This researchwas carried out with support from the US National ScienceFoundation and a grant in research and writing from the
John D. and Catherine T. MacArthur Foundation. Data wereprovided by the US Geological Survey, the Global RunoffData Center, and the Bundesanstalt fur Gewasserkunde.
References
Agresti, A., 1996. An Introduction to Categorical Data Analysis. JohnWiley & Sons Inc., New York, p. 290.
American Society of Civil Engineers, 1996. Handbook of Hydrology,second ed.ASCE Manuals and Reports on Engineering Practice 28American Society of Civil Engineers, New York.
Arnell, N., Liu, C., 2001. Hydrology and water resources. In:McCarthy, J.J., Canziani, O.F., Leary, N.A., Dokken, D.J.,White, K.S. (Eds.), Climate Change 2001: Impacts, Adaptations,and Vulnerability: Contributions of Working Group II to the ThirdAssessment Report of the Intergovernmental Panel on ClimateChange. Cambridge University Press, Cambridge, UK.
Becker, A., Grunewald, U., 2003. Flood risk in central Europe.Science 300, 1099.
Bork, H-R., Bork, H., Dalchow, C., Faust, B., Piorr, H-P., Schatz, T.,1998. Landschaftsentwicklung in Mitteleuropa: Wirkungen desMenschen auf Landschaften. Klett-Perthes, Stuttgart, Germany.
Brazdil, R., Glasner, R., Pfister, C., Dobrovolny, P., Antoine, J-M.,Barriendos, M., Camuffo, D., Deutch, M., Enzi, S., Guidoboni, E.,Kotyza, O., Sanchez Rodrigo, F., 1999. Flood events of selectedEuropean rivers in the sixteenth century. Climate Change 43,239–285.
Changnon, S.A., 1998. The historical struggle with floods on theMississippi River Basin: impacts of recent floods and lessons forfuture flood management and policy. Water Int. 23, 263–271.
Changnon, S.A., Demissie, M., 1996. Detection of changes instreamflow and floods resulting from climate fluctuations andland use-drainage changes. Climatic Change 32, 411–421.
Changnon, S.A., Kunkel, K.E., Andsager, K., 2001. Causes for recordhigh flood losses in the central United States. Water Int. 26,223–230.
Commission for the Hydrology of the Rhine Basin (CHR), 1993. DerRhein under der Einwirkung des Menschen: Ausbau, Schiffahrt,Wasserwirtschaft, CHR-Report No. I-11, International Commis-sion for the Hydrology of the Rhine Basin: Lelystad, TheNetherlands, p. 260.
Criss, R.E., Shock, E.L., 2001. Flood enhancement through floodcontrol. Geology 29, 875–878.
Dister, E., Gomer, D., Obrdlik, P., Petermann, P., Schneider, E.,1990. Water management and ecological perspectives of theUpper Rhine’s floodplains. Regul. Rivers: Res. Manage. 5, 1–15.
Engel, H., 1997. The flood events 1993/1994 and 1995 in the RhineRiver Basin: Causes and developments. In: G.H. Leavesley, H.F.Lins, F. Nobilis, R.S. Parker, V.R. Schneider, F.H.M. van de Ven(Eds.), Destructive Water: Water-Caused Natural Disasters–Their Abatement and Control, Proceedings of the ConferenceHeld At Anaheim, California in June 1996, International Associ-ation of Hydrological Sciences, Publication 239, InternationalAssociation of Hydrological Sciences, Wallingford, UK.
Ennen, E., Walter, J., Janssen, W., 1979. Deutsche Agrargeschichtevom Neolithikum bis zur Scwelle des Industriezeitalters, Wis-senschafliche Paperbacks 12, Social- und Wirtschaftsgeschichte.Franz Steiner Verlag, Wiesbaden.
Gerhart, H., 1996. The River Rhine: anthropogenic impact on therunoff regime. In: The River Rhine – Development and Manage-ment, Deutsches IHP/OHP-Nationalkomitee, Sonderheft 9. Bund-esanstalt fur Gewasserkunde, Koblenz, Germany, pp. 27–36.
Glade, T., Albini, P., Frances, F., 2001. An introduction to the useof historical data in natural hazards assessments. In: Glade, T.,Albini, P., Frances, F. (Eds.), The Use of Historical Data inNatural Hazards Assessments. Kluwer Academic Publishers,Dordrecht, pp. xvii–xxv.

566 N. Pinter et al.
Groisman, P.Y., Knight, R.W., Karl, T.R., 2001. Heavy precipita-tion and high streamflow in the contiguous United States:trends in the twentieth century. Bull. Am. Meteorol. Soc. 82,219–246.
Havinga, H., Smits, A.J.M., 2000. River management along theRhine: a retrospective view. In: Smits, A.J.M., Nienhuis, P.H.,Leuven, R.S.E.W. (Eds.), New Approaches to River Management.Backhuys Publishers, Leiden, The Netherlands, pp. 15–32.
Interagency Floodplain Management Review Committee, 1994.Sharing the Challenge: Floodplain Management into the 21stCentury. US Government Printing Office, Washington, DC.
Knox, J.C., 1999. Long-term episodic changes in magnitudes andfrequencies of floods in the Upper Mississippi river valley. In:Browne, A.G., Quine, T.A. (Eds.), Fluvial Processes and Envi-ronmental Change. John Wiley & Sons, London, pp. 255–282.
Koehler, H., 1992. Auswirkungen verschiedener anthropogenerVeranderungen auf die Hochwasserab-flusse im Oberrhein-Geb-iet. Wasser und Boden 1, 11–15.
Krahe, P., 1999. Climate variability and extreme floods on theLower and Middle River Rhine since the Middle Ages. In: P.Balabanis, A. Bronstert, R. Casale, P. Samuels (Eds.), Riba-mod: River Basin Modelling, Management, and Flood Mitiga-tion: Concerted Action, Proceedings of the Final Workshop,25–27 February, 1998, Wallingford UK, European Commission,Hydrological and Hydrogeological Risks, EUR 18287, pp. 83–102.
Kundzewicz, Z.W., Szamalek, K., Kowalczak, P., 1999. The greatflood of 1997 in Poland. Hydrol. Sci.: J. Sci. Hydrol. 44, 855–870.
Lammersen, R., Engel, H., van de Langemheen, W., Buiteveld, H.,2002. Impact of river training and retention on flood peaks alongthe Rhine. J. Hydrol. 267, 115–124.
Lins, H.F., Slack, J.R., 1999. Streamflow trends in the UnitedStates. Geophys. Res. Lett. 26, 227–230.
Llasat, M.-C., Barriendos, M., 2001. Availability and potential ofhistorical flood series in the Iberian Peninsula (14–20th centu-ries). In: Glade, T., Albini, P., Frances, F. (Eds.), The Use ofHistorical Data in Natural Hazards Assessments. Kluwer Aca-demic Publishers, Dordrecht, The Netherlands, pp. 131–140.
Middelkoop, H., Daamen, K., Gellens, D., Grabs, W., Kwadijk,J.C.J., Lang, H., Parmet, B.W.A.H., Schadler, B., Schulla, J.,Wilke, K., 2001. Impact of climate change on hydrologicalregimes and water resources management in the Rhine basin.Climatic Change 49, 105–128.
Milly, P.C.D., Wetherald, R.T., Dunne, K.A., Delworth, T.L., 2002.Increasing risk of great floods in a changing climate. Nature 415,514–517.
Mudelsee, M., Borngen, M., Tetzlaff, G., Grunewald, U., 2003. Noupward trends in the occurrence of extreme floods in centralEurope. Nature 425, 166–169.
Naef, F., Scherrer, S., Weiler, M., 2002. A process based assessmentof the potential to reduce flood runoff by land use change. J.Hydrol. 267, 74–79.
Olsen, J.R., Stedinger, J.R., Matalas, N.C., Stakhiv, E.Z., 1999.Climate variability and flood frequency estimation for the UpperMississippi and Lower Missouri rivers. J. Am. Water Resour.Assoc. 35, 1509–1523.
Pinter, N., 2005. Policy Forum: Floodplain encroachment since the1993 flood. Science 308, 207–208.
Pinter, N., Heine, R.A., 2005. Hydrodynamic and morphodynamicresponse to river engineering documented by fixed-dischargeanalysis, Lower Missouri River, USA. J. Hydrol. 302, 70–91.
Pinter, N., Thomas, R., Wlosinski, J.H., 2001. Flood-hazard assess-ment on dynamic rivers. Eos: Trans. Am. Geophys. Union 82 (31),333–339.
Pinter, N., Thomas, R., Wlosinski, J.H., 2002. Reply to US Army Corpsof Engineers comment on assessing flood hazard on dynamicrivers. Eos: Trans. Am. Geophys. Union 83 (36), 397–398.
Pinter, N., van der Ploeg, R.R., Schweigert, P., Hoefer, G., 2006.Flood magnification on the River Rhine. Hydrol. Process. 20,147–164.
Plate, E., 2001. Management strategies for the development of theUpper Rhine. Water Int. 26 (1), 51–61.
Potter, K.W., 1991. Hydrological impacts of changing land man-agement practices in a moderate-sized agricultural catchment.Water Resour. Res. 27, 845–855.
Richter, G., 1998. Bodenerosion: Analyse und Bilanz eines Umwelt-problems. Wissenschaftliche Buchgesellschaft, Darmstadt, Ger-many, p. 264.
Schonwise, C-D., 2001. Observed long-term precipitation trends inCentral Europe and some preliminary remarks on change inextremes. In: P. Krahe, D. Herpertz (Eds.), Generation ofHydrometeorological Reference Conditions for the Assessmentof Flood Hazard in Large River Basins: Papers Presented at theInternational Workshop Held on March 6 and 7, 2001 in Koblenz,CHR-Report I-20, International Commission for the Hydrology ofthe Rhine Basin: Lelystad, The Netherlands, pp. 81–87.
Silva, W., Klijn, F., Dijkman, J., 2001. Room for the Rhine Branchesin the Netherlands, Rijksinstituut voor Integraal Zoetwaterbeh-eer en Afvalwaterbehandeling: Lelystad, The Netherlands.
Smith, L.M., Winkley, B.R., 1996. The response of the LowerMississippi River to river engineering. Eng. Geol. 45, 433–455.
St. Paul District, US Army Corps of Engineers, 2001. ChannelMaintenance Management Plan, St. Paul District, US Army Corpsof Engineers, St. Paul, Minnesota.
Stevens, M.A., Schumm, S.A., Simons, D.B., 1976. Geomorphicstudy of Pool 25 in the Upper Mississippi River. In: Rivers ‘76:Proceedings of the Symposium on Inland Waterways for Naviga-tion, Flood Control and Water Diversions, August 10–12, 1976,Fort Collins, Colorado. American Society of Civil Engineers, NewYork, pp. 1655–1679.
Tobin, G.A., 1995. The levee love affair: a stormy relationship?Water Resour. Bull. 31, 359–367.
US Army Corps of Engineers, Institute for Water Resources, 2003.Waterborne Commerce of the United States; Part 2 – Waterwaysand Harbors, Gulf Coast, Mississippi River System, and Antilles,Report IWR-WCUS-03-2, US Army Corps of Engineers Institute forWater Resources, Alexandria, VA.
van der Ploeg, R.R., Schweigert, P., 2001. Elbe river flood peaks andpostwar agricultural land use in East Germany. Naturwissens-chaften 88, 522–525.
van Sickle, D.R., 1979. Effects of urbanization on streams. In:Whipple, W. (Ed.), Water Problems of Urbanizing Areas. Amer-ican Society of Civil Engineers, New York, pp. 259–270.
Werner, P.C., Gerstengarbe, F-W., Fraedrich, K., Oesterle, H.,2000. Recent climate change in the North Atlantic/Europeansector. Int. J. Climatol. 20, 463–471.
Wetzel, V., 1996. The River Rhine – navigation and water power,engineering works, economical and ecological aspects, manage-ment. In: The River Rhine – Development and Management,Deutsches IHP/OHP-Nationalkomitee, Sonderheft 9. Bundesan-stalt fur Gewasserkunde, Koblenz, Germany, pp. 63–77.
Zar, J.H., 1999. Biostatistical Analysis, fourth ed. Prentice Hall,Upper Saddle River, NJ, p. 661.