trends in compensation and benefits strategies
TRANSCRIPT
TRENDS IN COMPENSATION AND BENEFITS STRATEGIES
Richard Sperling and Larry Hicks
Richard Sperling is a senior consultant with the Hay Group in Chicago. He works with clients to support improved business results by developing appropriate re ward strategies, designing compensation program architectures and processes, and effectively implementing and managing compensation programs. email: richard-sperling @ haygroup. com. Larry Hicks is a senior consultant with the Hay Group in Chicago. He has 12 years of benefits consulting experience with emphasis on managed-care and health-benefits issues. He is fhe author of four books on health-care cost management including Health Care Cost Management: Solutions for Employers, Health Care Alternatives, and Managing Health Care Costs. email: larry- hicks @ haygroup. com.
hat makes organizations win in the marketplace? What turns people into winners? Answers to these questions W are the underpinnings of strategy. They help organiza-
tions craft battle plans, determine the kinds of people they need and how to reward those people in a way that makes them want to devote their lives to making the strategy work. That is why rewards are a fundamental part of creating competitive advantage. And that is why organizations have no time to waste before they determine how their compensation and benefits strategies are going to help the company win. It is all about alignment. It is not about having different programs or even the same programs as competitors. It is all about coming up with strategies that work for the organization.
Reward programs need to be considered not as a succession of separate compensation and benefit plans but as an integrated whole. People turn strategy into action, but it takes a great deal of effort to translate strategy into something people can relate to. The right approach involves full integration of all reward and recogni- tion programs within human resources and business-manage- ment processes.
Competitive advantage will go to those organizations that not only change but that also execute their strategies more quickly and more effectively. Managing strategy execution requires clear vi- sion of what is needed to support the business strategy as well as the implementation priorities to close the gap. Reward systems are only part of the solution. Only when reward strategies are part of an integrated HR system will change occur quickly and effectively.
MARKET TRENDS AND TRAPS When trying to get a read on the market trends in compensation
and benefits, there is a temptation to simply follow the crowd. Current trends may not be the best route for an organization to develop a competitive advantage. Remember that reward pro-
CCC 0745-7790/98/2502085-15 0 1998 John Wiley & Sons, Inc.
Employment Relaiions Today Summer 1998 85
Richard Sperling and Larry Hicks
grams are not the sole driver of competitive advantage. Within the HR circle alone, many other factors must come into play, includ- ing recruitment, selection, training, and ongoing development. The trick is to learn how to read all the trends and then to determine which are appropriate for a particular organization and how they can be implemented.
Be Wary of “Variable” Traps Looking first at cash compensation, take as an example what
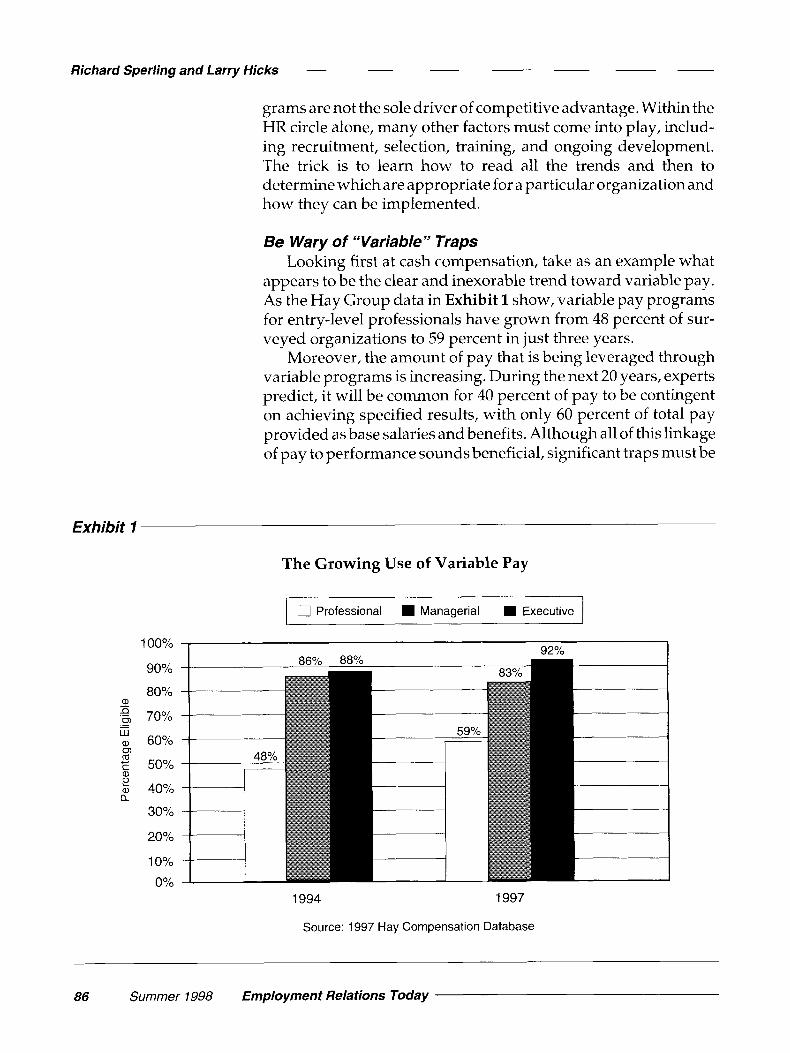
appears to be the clear and inexorable trend toward variable pay. As the Hay Group data in Exhibit 1 show, variable pay programs for entry-level professionals have grown from 48 percent of sur- veyed organizations to 59 percent in just three years.
Moreover, the amount of pay that is being leveraged through variable programs is increasing. During the next 20 years, experts predict, it will be common for 40 percent of pay to be contingent on achieving specified results, with only 60 percent of total pay provided as base salaries and benefits. Although all of this linkage of pay to performance sounds beneficial, significant traps must be
Exhibit 1
The Growing Use of Variable Pay
~~ 1 0 Professional I Managerial I Executive 1
a,
m W
- 0 .- - a, 0, m C a,
a, a
c
2
1 00%
90%
80%
70%
60%
50%
40%
30%
20%
10%
0% 1994 1997
Source: 1997 Hay Compensation Database
86 Summer 1998 Employment Relations Today
Trends in Compensation and Benefits Strategies
Variable pay programs should not attempt to control activity, but rather provide directional signals.
avoided. If the connection between pay and performance is not kept direct and strong, variable programs may end up costing an organization more than traditional pay programs, without suffi- cient return on the added investment.
For example, if employee incentives are based only on indi- vidual targets, bonuses can be paid in years when the overall performance of the organization does not warrant added reward (that is, the business as a whole did not make a profit or achieve other performance goals). In the other direction, variable pay programs can hurt performance whenunattainable targets are set, no payouts are given, and the workforce quickly becomes demor- alized and demotivated.
Perhaps the most pervasive trap with variable pay occurs when, after several years of steadily increasing payouts, an entitle- ment mentality sets in throughout the organization. Workforces can come to expect and rely on performance payouts in the same way they used to expect automatic annual salary increases. As the percentage of leveraged pay has increased and payouts have become larger and more regular in a period of sustained prosper- ity, organizations in which such an expectation has become en- trenched could have severe difficulties in the future should eco- nomic momentum begin to wane.
The best way to avoid the pitfalls of variable programs, through good times and bad, is to ensure that communication about performance objectives and the reasons for payouts is as clear as possible. Variable pay programs work only when they help clarify individual roles and priorities in the workforce. Employees must clearly understand, through the messages sent by variable pay components, what they are expected to accomplish, and how. Variable pay programs should not attempt to control activity, but rather provide the directional signals that keep all employees on the paths that lead to the specific objectives of the performance plan, be it continuous improvement, zero-defects production quality, increased sales, sustained profitability, new skills for individuals or teams, or another goal.
PAY IS JUST THE START IN HIRING AND RETAINING KEY EMPLOYEES
Again, however, the motivational aspects of pay programs, variable or otherwise, should be viewed as just one component of larger HR objectives. For example, in these prosperous times, retention of key contributors has resurfaced as a key issue. Higher profits have led organizations to be more aggressive about ex- panding their horizons, which in turn has made them more active in trying to recruit top talent away from competitors, or even from
Employment Relations Today Summer 1998 87
Richard Sperling and Larry Hicks
Poor retention of key employees can hurt organizations in many ways.
unrelated companies and fields. Beyond the high-tech fields that get most of the attention, retention issues are also surfacing for other positions because unemployment is as low as it has been in a long time. The best people, no matter what their profession, are discovering that they can easily hop to higher-paying jobs, or jobs that offer better benefits, or jobs that they see as offering better working conditions.
Poor retention of key employees can hurt organizations in many ways. First, there are the obvious costs of turnover; recruit- ing and retraining can cost as much as 50 percent to 100 percent of an employee’s annual pay, and even more if relocations are involved. Even more critically, nothing can threaten customer satisfaction as quickly and directly as the loss of key employees.
As with pay, the key to implementing successful retention strategies is flexibility. Here, too, one size cannot fit all. Many companies are now finding that direct compensation, in the form of retention bonuses, is proving effective. Traditionally applied in downsizing situations to ease the jitters of key employees when layoffs are prevalent, this time-tested tool is proving just as effective in good times to reduce the ”jumpiness” of people who may be tempted by what seem to be greener pastures.
Often termed “longevity pay” in these situations, the retention bonuses are designed to allow special payments for employees who opt to stay at an organization and who continue to demon- strate satisfactory or above-average performance. Paid annually, the amount of the bonus is usually tied to tenure. And, while this type of program is most prevalent for information technology positions and other ”hot skills” jobs, it can be applied to virtually all fields or types of organizations. The keys, from an administra- tive standpoint, are again tied to basic HR management prin- ciples: Selective application that will maximize the impact of the bonuses, suppress “why not me?” expectations throughout the organization, and, of course, keep a rein on the program’s ex- pense.
Nonpay “Keepers” Retention strategies, of course, do not have to be restricted to
pay. Today, as the social pendulum has swung away from the “intense” 1980s into a period where much more of a premium is now being placed on family values and ”quality” nonwork time, ”psychic income” issues tied to worklife and homelife have be- come equally critical and, in some cases, even more important than pay and benefits to many workers. The greatly enhanced work-at-home virtual office capabilities made possible by advanc- ing technology are also rapidly hastening this trend.
88 Summer 1998 Employment Relations Today
~ Trends in Compensation and Benefits Strategies
Organizations that ignore the value of nonpay programs that appeal to today’s workers will quickly find themselves at the bottom of the list when good workers are comparing the compa- nies they would like to work for. The list of programs that fall into the nonpay category is getting longer all the time; it can include areas such as flextime, job-sharing, compressed work weeks, telecommunications policies, child and elder care, adoption ben- efits, sabbaticals, and subsidized education and tuition reim- bursement programs that help valued employees expand their skills and knowledge.
WHAT DO HR PRACTITIONERS SAY? As part of the 1997 Hay Fall Reward Conference Series, the
Hay Group surveyed 151 HR professionals concerning the exter- nal business issues they are facing, the HR initiatives they have adopted, and the reward programs they have put into place. This section describes what people are really doing and what seems to work.
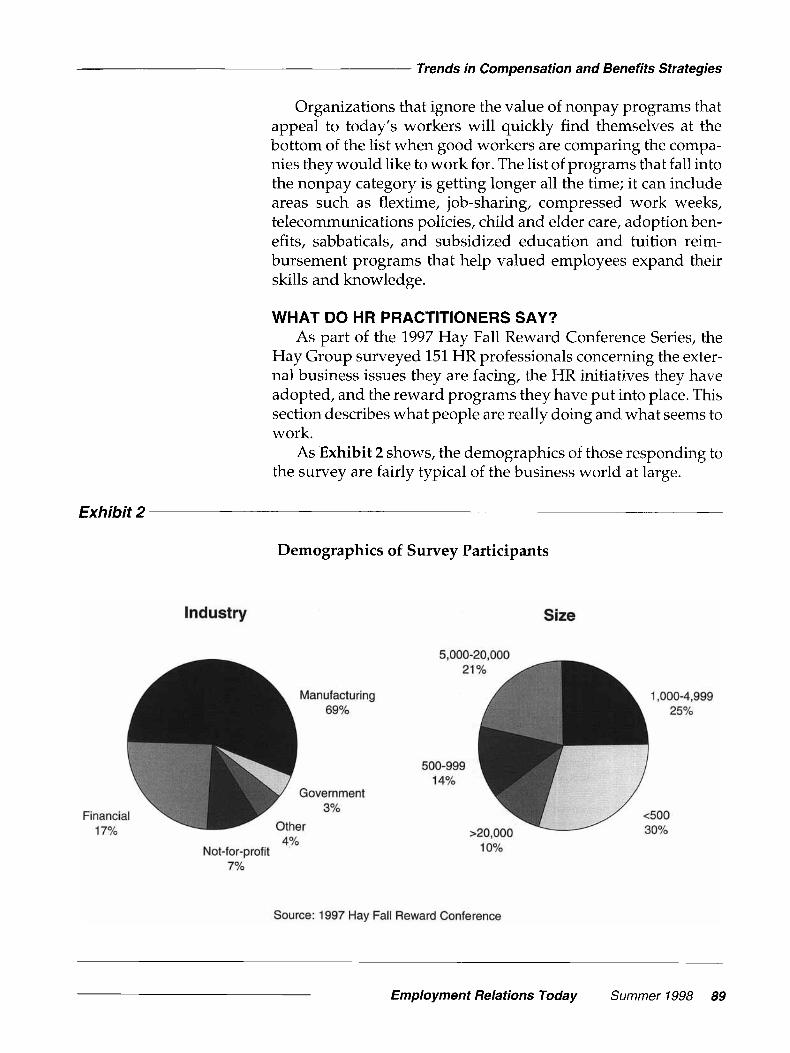
As Exhibit 2 shows, the demographics of those responding to the survey are fairly typical of the business world at large.
Exhibit 2
Demographics of Survey Participants
Source: 1997 Hay Fall Reward Conference
Employment Relations Today Summer 1998 89
Richard Sperling and Larry Hicks
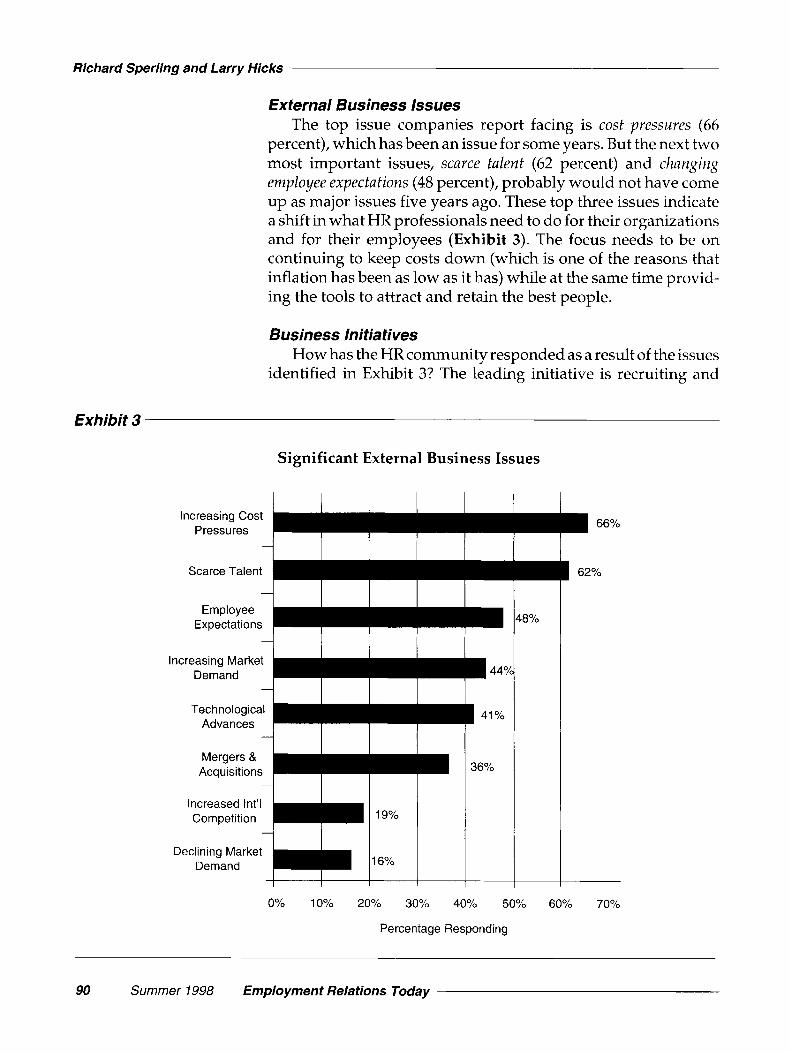
External Business Issues The top issue companies report facing is cost pressures (66
percent), which has been an issue for some years. But the next two most important issues, scarce talent (62 percent) and chrzngiizg employee expectations (48 percent), probably would not have come up as major issues five years ago. These top three issues indicate a shift in what HR professionals need to do for their organizations and for their employees (Exhibit 3). The focus needs to be on continuing to keep costs down (which is one of the reasons that inflation has been as low as it has) while at the same time provid- ing the tools to attract and retain the best people.
Business Initiatives How has the HR community responded as a result of the issues
identified in Exhibit 3? The leading initiative is recruiting and
Exhibit 3
Significant External Business Issues
Scarce Talent
Increasing Market
Increased Int’l
Declining Market
48%
H 4 4 %
I 41%
36%
66%
1 62%
0% 10% 20% 30% 40% 50% 60% 70%
Percentage Responding
90 Summer 1998 Employment Relations Today
Trends in Compensation and Benefits Strategies
Recruiting & Retaining
Gauging Customer Satisfaction
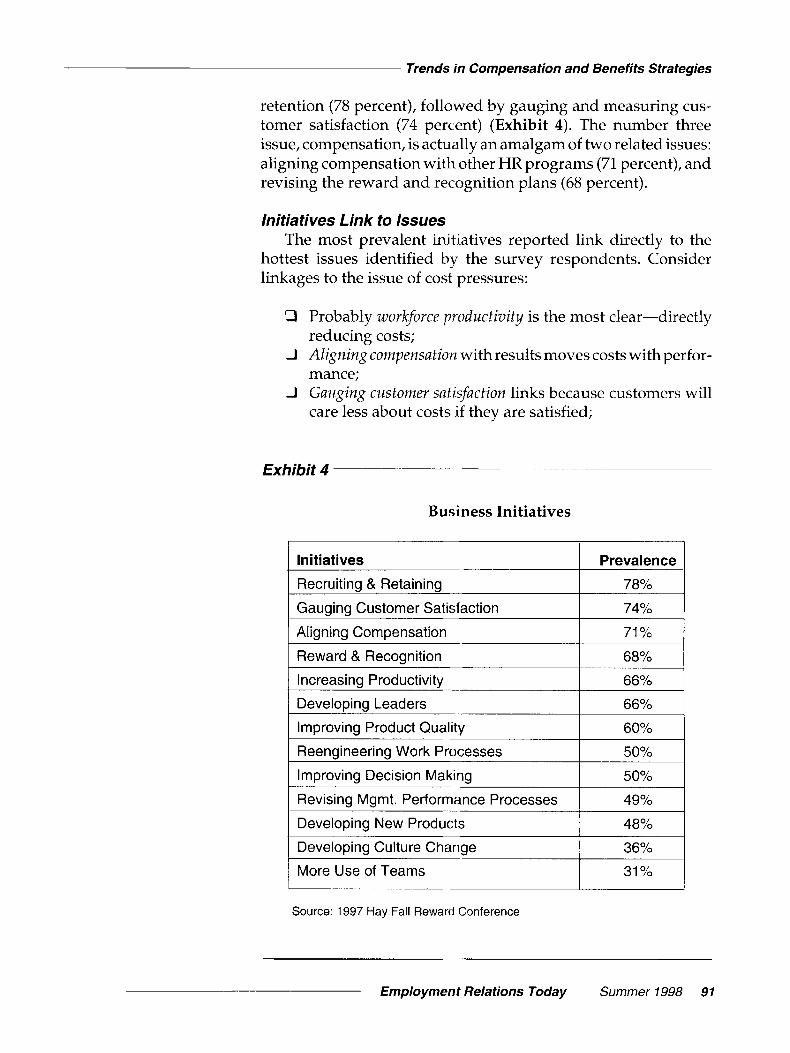
retention (78 percent), followed by gauging and measuring cus- tomer satisfaction (74 percent) (Exhibit 4). The number three issue, compensation, is actually an amalgam of two related issues: aligning compensation with other HR programs (71 percent), and revising the reward and recognition plans (68 percent).
7 8 '/o
74%
Initiatives Link to Issues The most prevalent initiatives reported link directly to the
hottest issues identified by the survey respondents. Consider linkages to the issue of cost pressures:
Aligning Compensation
Reward & Recognition
0
0
0
71 %
68%
Probably WorkfOrce productivity is the most clear-directly reducing costs; Aligning compensation with results moves costs with perfor- mance; Gauging customer sat isfaction links because customers will care less about costs if they are satisfied;
Increasing Productivity
Developing Leaders
Improving Product Quality
Exhibit 4
6 6 '/o
66%
60%
Business Initiatives
Reengineering Work Processes
Improving Decision Making
Initiatives I Prevalence I
5 0 '/o
50%
I Revising Mgmt. Performance Processes 1 49% 1 I Developing New Products I 48% 1 I Developing Culture Change I 36% I 1 More Use of Teams I 31% 1 Source: 1997 Hay Fall Reward Conference
Employment Relations Today Summer 1998 91
Richard Sperling and Larry Hicks
0 Developing leaders addresses cost pressures because all re- sponses to issues begin with leadership; and
0 Recruiting and retmtioiz initiatives avoid recruiting, train- ing, and transition costs.
These same initiatives clearly address the issues of scarce
Exhibit 5 fi
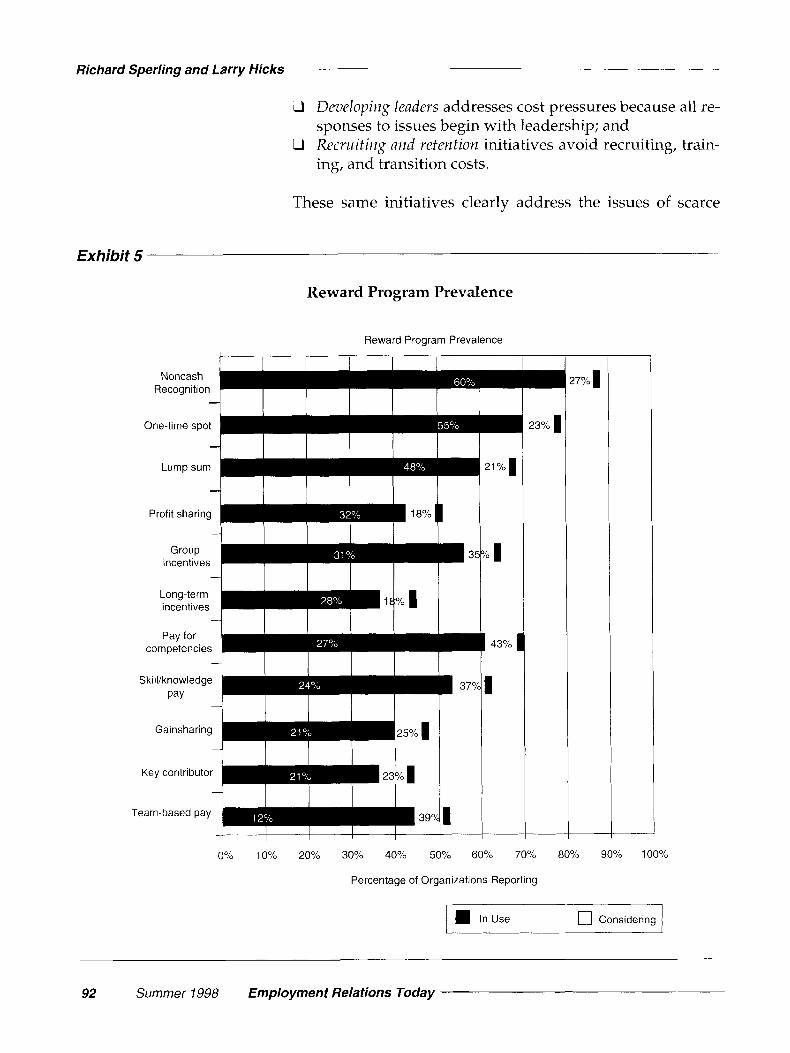
Reward Program Prevalence
Reward Program Prevalence
t I I I I I I I Noncash
Recognitlon I I I I I I I
Key contributor
-r--
Tearn-bascd pay
0% 10% 20% 30% 40% 50% 60% 70% 80% 90% 100%
Percentage of Organizations Reporting
1-m In Use 0 Considering I
92 Summer 1998 Employment Relations Today ~
Trends in Compensation and Benefits Strategies
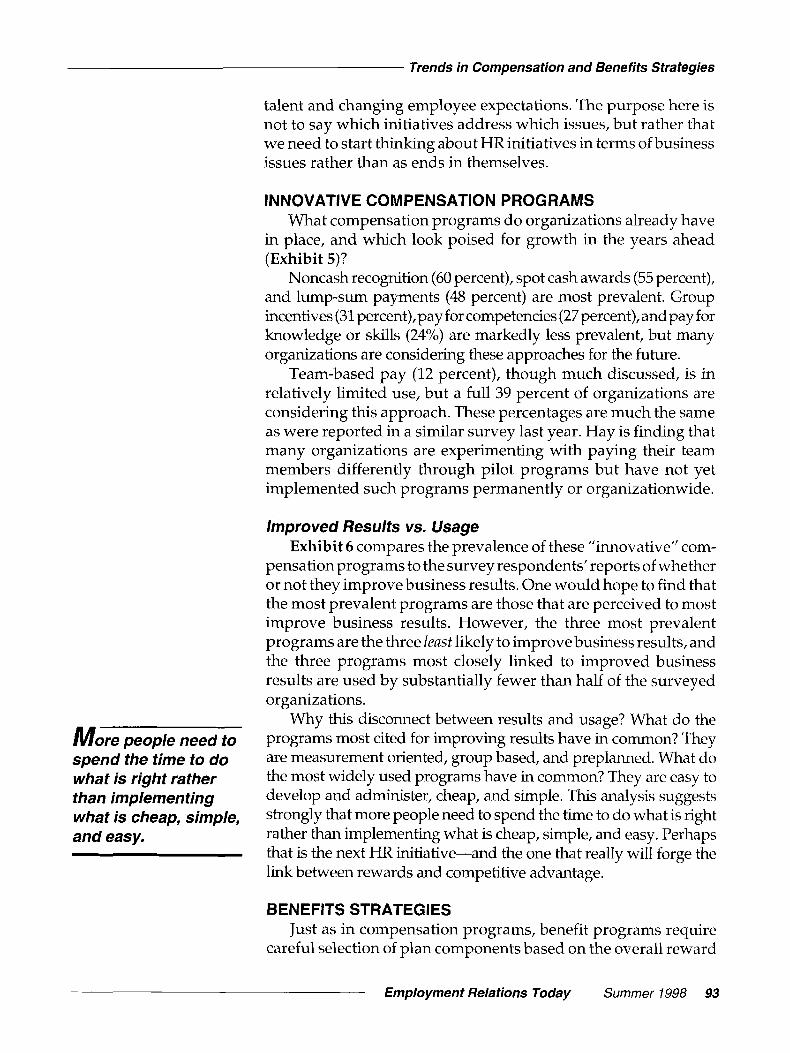
M o r e people need io spend the time to do what is right rather than implementing what is cheap, simple, and easy.
talent and changing employee expectations. The purpose here is not to say which initiatives address which issues, but rather that we need to start thinking about HR initiatives in terms of business issues rather than as ends in themselves.
INNOVATIVE COMPENSATION PROGRAMS What compensation programs do organizations already have
in place, and which look poised for growth in the years ahead (Exhibit 5)?
Noncash recognition (60 percent), spot cash awards (55 percent), and lump-sum payments (48 percent) are most prevalent. Group incentives (31 percent), pay for competencies (27percent), and pay for knowledge or skills (24%) are markedly less prevalent, but many organizations are considering these approaches for the future.
Team-based pay (12 percent), though much discussed, is in relatively limited use, but a full 39 percent of organizations are considering this approach. These percentages are much the same as were reported in a similar survey last year. Hay is finding that many organizations are experimenting with paying their team members differently through pilot programs but have not yet implemented such programs permanently or organizationwide.
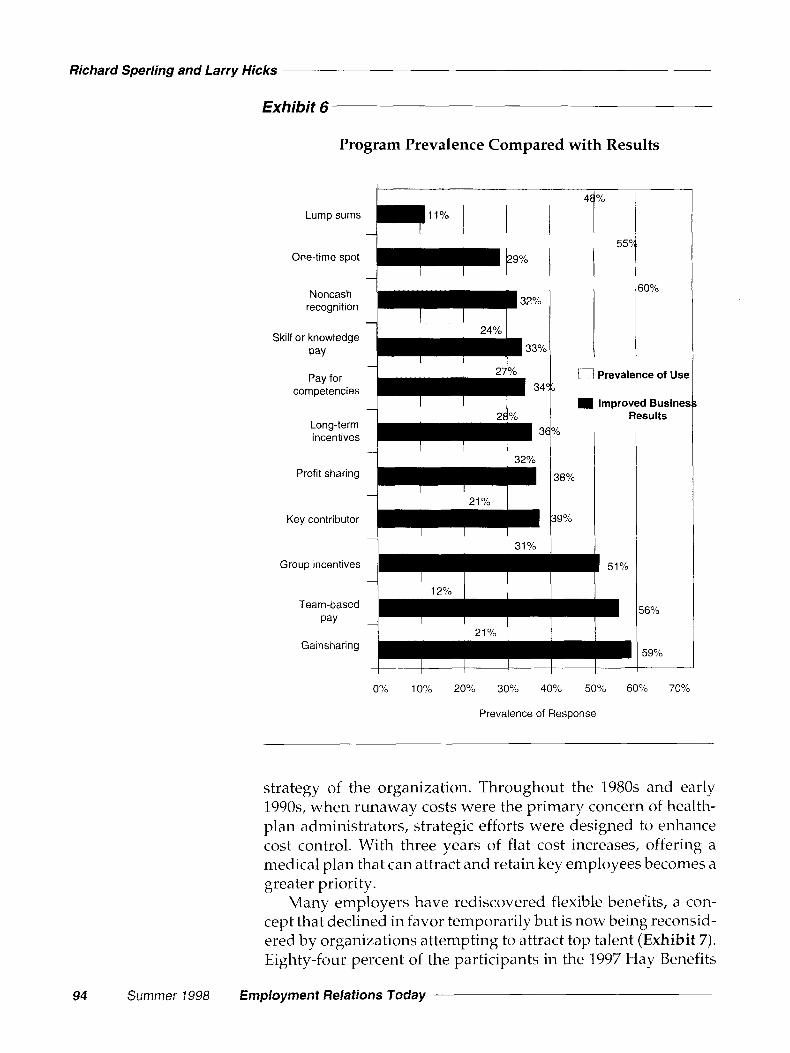
Improved Results vs. Usage Exhibit 6 compares the prevalence of these ”innovative” com-
pensation programs to the survey respondents’ reports of whether or not they improve business results. One would hope to find that the most prevalent programs are those that are perceived to most improve business results. However, the three most prevalent programs are the three least likely to improve business results, and the three programs most closely linked to improved business results are used by substantially fewer than half of the surveyed organizations.
Why this disconnect between results and usage? What do the programs most cited for improving results have in common? They are measurement oriented, group based, and preplanned. What do the most widely used programs have in common? They are easy to develop and administer, cheap, and simple. This analysis suggests strongly that more people need to spend the time to do what is right rather than implementing what is cheap, simple, and easy. Perhaps that is the next HR initiative-and the one that really will forge the llnk between rewards and competitive advantage.
BENEFITS STRATEGIES Just as in compensation programs, benefit programs require
careful selection of plan components based on the overall reward
Employment Relations Today Summer 1998 93
Richard Sperling and Larry Hicks
Exhibit 6
Noncash recognition
Skill or knowledge Pay
Pay for
-
-
competencies -
Long-term incentives
Program Prevalence Compared with Results
32%
24%
33% I I
2 Yo I 34
2 Yo 31
I I I
4$% I
- I I I 32%
Profit sharing
One-time spot i p i I ""1
38% -
Key contributor -
6
I I 21 Yo
39% I I I
31%
60%
i7 Prevalence of usc
Improved Busine Results
I 1 I I I
56%
59%
0% 10% 20% 30% 40% 50% 60% 70%
Prevalence of Response
strategy of the organization. Throughout the 1980s and early 1990s, when runaway costs were the primary concern of health- plan administrators, strategic efforts were designed to enhance cost control. With three years of flat cost increases, offering a medical plan that can attract and retain key employees becomes a greater priority.
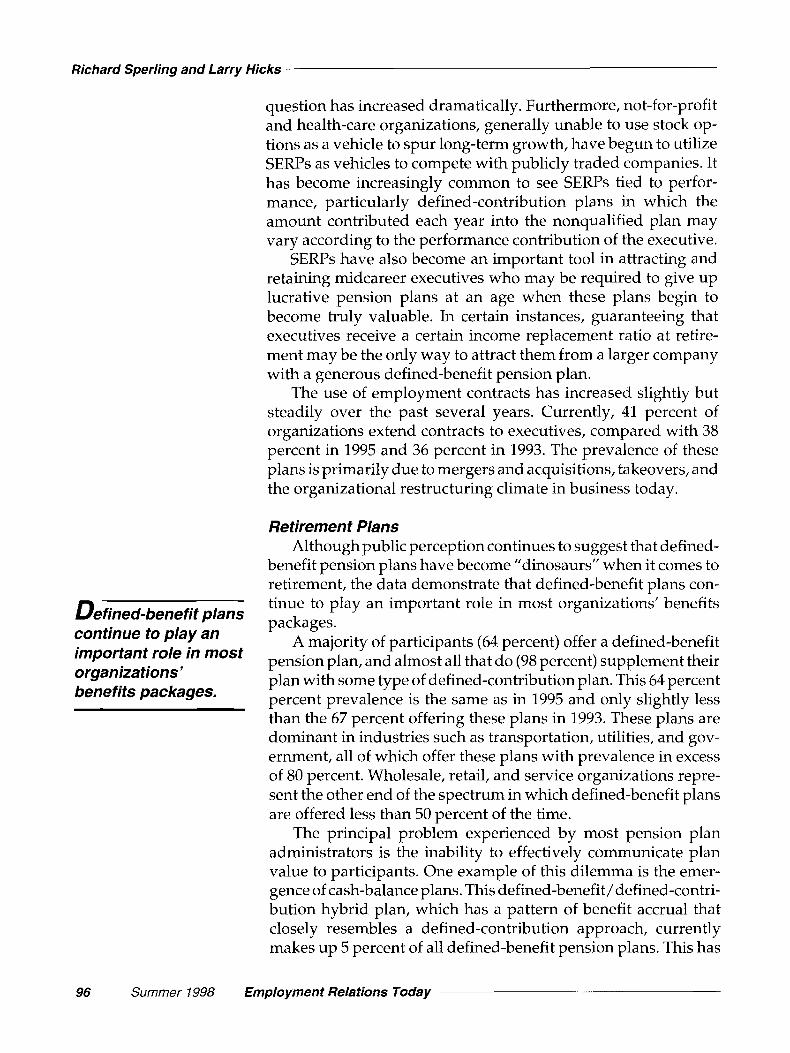
Many employers have rediscovered flexible benefits, a con- cept that declined in favor temporarily but is now being reconsid- ered by organizations attempting to attract top talent (Exhibit 7). Eighty-four percent of the participants in the 1997 Hay Benefits
94 Summer 1998 Employment Relations Today
Trends in Compensation and Benefits Strategies
Report offer some form of flexible benefits. Most of these organi- zations provide flexible spending accounts, but a growing num- ber of firms are investigating full cafeteria plans as a more appro- priate approach to today’s increasingly diverse workforce. Be- cause the medical plan is generally the most expensive of all plan components offered by employers, it becomes a key consideration in offering flexible benefit plans. Employees may be given the choice of opting out of medical plans in order to free up flexible credits to be allocated to other benefits or taken out as cash. In addition, multiple plan options can be provided that allow em- ployees to decide how much managed care they want and what price they are willing to pay for unlimited freedom of choice.
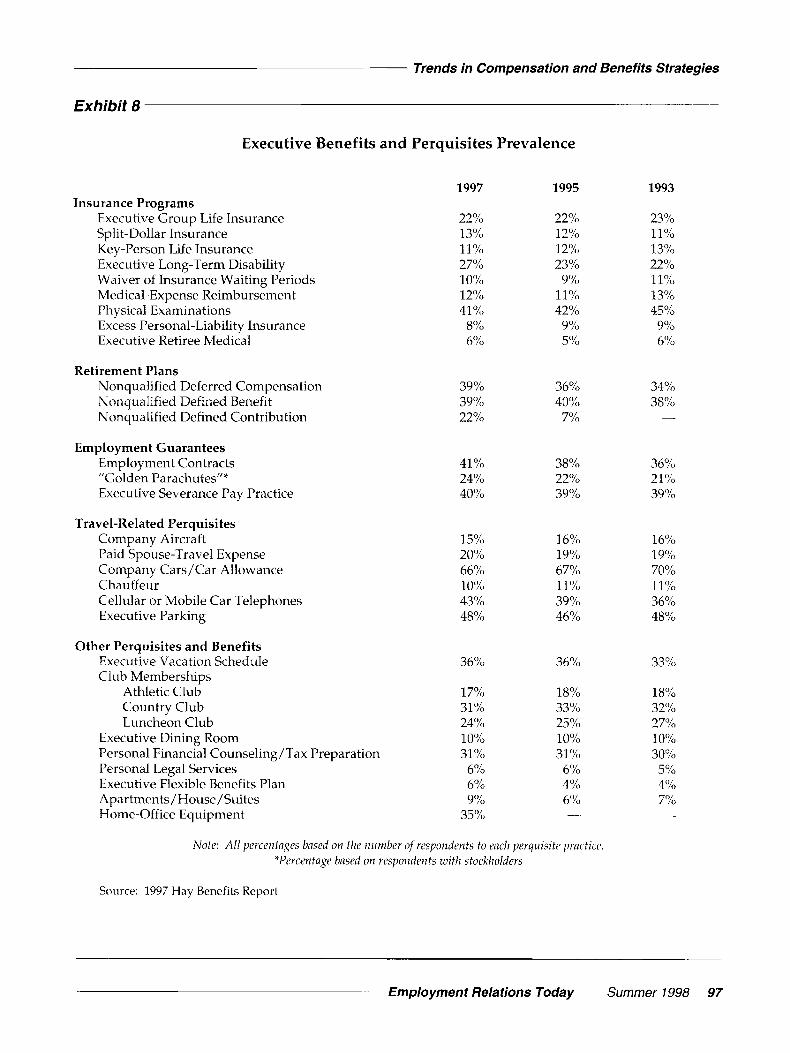
Executive Benefits In the area of executive benefits, two trends define the issues
that employers face. The first is the use of nonqualified plans to provide replacement income to executives whose compensation is over the IRS limit of $160,000 in 1998. The second is the use of employment contracts to provide security to executives in a time of unprecedented merger and acquisition activity (Exhibit 8).
Nonqualified retirement plans, generally referred to as SERPs (supplemental executive retirement plans), have grown in popu- larity fueled by several factors. First, with changes in income based on variable pay, and with more executives receiving incen- tive compensation in a robust economy, many additional execu- tives have exceeded the $160,000 pay limit. Also, because the vast majority of organizations offering SERPs include base pay and bonus income, the number of individuals facing the IRS limit
Exhibit 7
Prevalence of Flexible Benefits Programs
1997 1995 1993 Flexible Benefits Program 84% 81% 76% Flexible Spending Account 82% 76% 73%
Health-Care Premiums 84% 81% 85% Unreimbursed Medical
Expenses 82% 79% 73% Dependent-Care Expenses 89% 88% 81%
Full Cafeteria Plan 21% 21% 18%
Source: 1997 Hay Benefits Report
Employment Relations Today Summer 1998 95
Richard Sperling and Larry Hicks -
question has increased dramatically. Furthermore, not-for-profit and health-care organizations, generally unable to use stock op- tions as a vehicle to spur long-term growth, have begun to utilize SERPs as vehicles to compete with publicly traded companies. It has become increasingly common to see SERPs tied to perfor- mance, particularly defined-contribution plans in which the amount contributed each year into the nonqualified plan may vary according to the performance contribution of the executive.
SERPs have also become an important tool in attracting and retaining midcareer executives who may be required to give up lucrative pension plans at an age when these plans begin to become truly valuable. In certain instances, guaranteeing that executives receive a certain income replacement ratio at retire- ment may be the only way to attract them from a larger company with a generous defined-benefit pension plan.
The use of employment contracts has increased slightly but steadily over the past several years. Currently, 41 percent of organizations extend contracts to executives, compared with 38 percent in 1995 and 36 percent in 1993. The prevalence of these plans is primarily due to mergers and acquisitions, takeovers, and the organizational restructuring climate in business today.
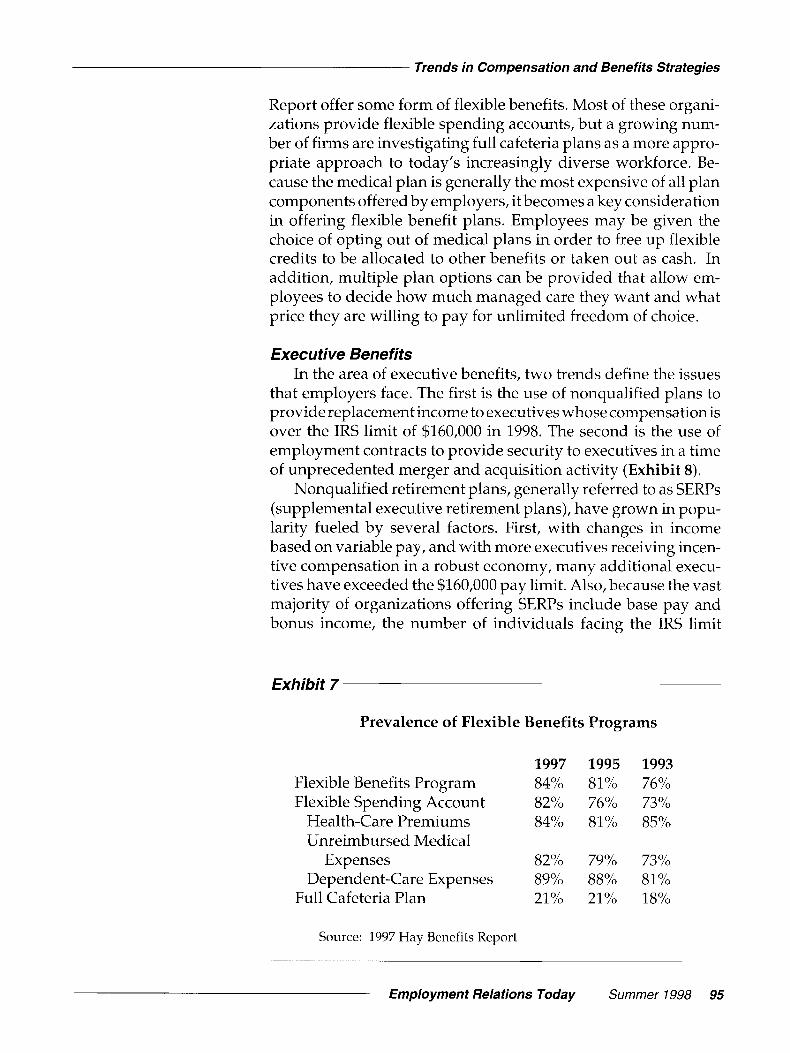
Retirement Plans Although public perception continues to suggest that defined-
benefit pension plans have become “dinosaurs” when it comes to retirement, the data demonstrate that defined-benefit plans con- tinue to play an important role in most organizations’ benefits
A majority of participants (64 percent) offer a defined-benefit pension plan, and almost all that do (98 percent) supplement their plan with some type of defined-contribution plan. This 64 percent percent prevalence is the same as in 1995 and only slightly less than the 67 percent offering these plans in 1993. These plans are dominant in industries such as transportation, utilities, and gov- ernment, all of which offer these plans with prevalence in excess of 80 percent. Wholesale, retail, and service organizations repre- sent the other end of the spectrum in which defined-benefit plans are offered less than 50 percent of the time.
The principal problem experienced by most pension plan administrators is the inability to effectively communicate plan value to participants. One example of this dilemma is the emer- gence of cash-balance plans. This defined-benefit/ defined-contri- bution hybrid plan, which has a pattern of benefit accrual that closely resembles a defined-contribution approach, currently makes up 5 percent of all defined-benefit pension plans. This has
Defined-benefit plans packages. continue to play an important in organizations ’ benefits packages.
96 Summer 1998 Empfoyment Relations Today
Trends in Compensation and Benefits Strategies
Exhibit 8
Executive Benefits and Perquisites Prevalence
Insurance Programs Executive Group Life Insurance Split-Dollar Insurance Key-Person Life Insurance Executive Long-Term Disability Waiver of Insurance Waiting Periods Medical-Expense Reimbursement Physical Examinations Excess Personal-Liability Insurance Executive Retiree Medical
Retirement Plans Nonqualified Deferred Compensation Nonqualified Defined Benefit Nonqualified Defined Contribution
Employment Guarantees Employment Contracts "Golden Parachutes"* Executive Severance Pay Practice
Travel-Related Perquisites Company Aircraft Paid Spouse-Travel Expense Company Cars/Car Allowance Chauffeur Cellular or Mobile Car Telephones Executive Parking
Other Perquisites and Benefits Executive Vacation Schedule Club Memberships
Athletic Club Country Club Luncheon Club
Executive Dining Room Personal Financial Counseling /Tax Preparation Personal Legal Services Executive Flexible Benefits Plan Apartments / House/Suites Home-Office Equipment
1997
22% 13% 11% 27% 10% 12% 41%)
8% 6%
39% 39% 22%
41% 24% 40%
15% 20% 66% 10% 43% 4 8 Yo
36%
17Y" 31% 24% 10% 31% 6% 6% 9%
35%)
1995
22% 12% 12% 23%
9% 1 1 %I
42% 9% 5%
36% 40%
7%
38% 22% 39%
7 6%) 19% 67% 1 1 %" 39% 46%
36%
18% 33% 25"/0 10% 31 Yo
6% 4% 6% -
Note: All percentages based on the iiiimber of respondents to eacli perquisite practice. *Percentage based on respondents with stockliolders
Source: 1997 Hay Benefits Report
1993
2 3 '/o 11% 13% 22% 11% 13% 45%
9"o 6%
34% 38% -
36%) 2 1 O/O 39%
16%) 19% 70%) 11?0 36% 4 8 "/o
33%
18% 32% 27% 10% 30%) 5 Yo
4% 7%) -
Employment Relations Today Summer 1998 97
Richard Sperling and Larry Hicks
risen from only a 1 percent prevalence in 1991. Those turning to this plan find that employees can understand the plan better even though actual plan value may be lower than a predecessor tradi- tional defined-benefit pension plan.
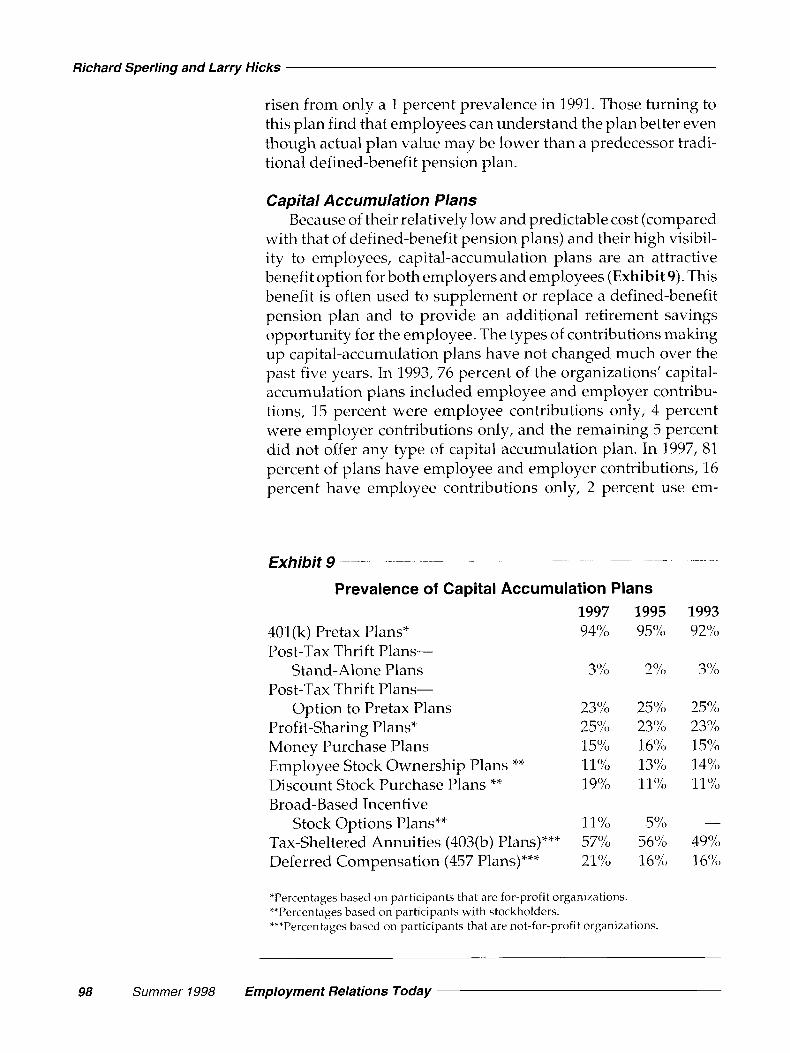
Capital Accumulation Plans Because of their relatively low and predictable cost (compared
with that of defined-benefit pension plans) and their high visibil- ity to employees, capital-accumulation plans are an attractive benefit option for both employers and employees (Exhibit 9). This benefit is often used to supplement or replace a defined-benefit pension plan and to provide an additional retirement savings opportunity for the employee. The types of contributions making up capital-accumulation plans have not changed much over the past five years. In 1993, 76 percent of the organizations' capital- accumulation plans included employee and employer contribu- tions, 15 percent were employee contributions only, 4 percent were employer contributions only, and the remaining 5 percent did not offer any type of capital accumulation plan. In 1997, 81 percent of plans have employee and employer contributions, 16 percent have employee contributions only, 2 percent use em-
~ Exhibit 9 ~ - _ . ~~ -~ -~
Prevalence of Capital Accumulation Plans
401 (k) Pretax Plans* Post-Tax Thrift Plans-
Post-Tax Thrift Plans-
Profit-sharing Plans* Money Purchase Plans Employee Stock Ownership Plans ** Discount Stock Purchase Plans ** Broad- Based Tncentive
Tax-Sheltered Annuities (403(b) Plans)*** Deferred Compensation (457 Plans)***
Stand-Alone Plans
Option to Pretax Plans
Stock Options Plans**
1997 94%
3%
23% 25"/o 15"/0 11% 19"/0
11% 57% 2 1 Yo
1995 95%
2%)
25% 23"o 16% 13% 11%
5 O/"
5 6 Yo
16%
*Percentages based on participants that are for-profit organizations. **Percentages based on participants with stockholders. ***Percentages based on participants that are not-for-profit organizations.
98 Summer 1998 Employment Relations Today
1993 92%
3%
25%) 23% 1 5 O/o
14%) 11%
-
49% 16%)
Trends in Compensation and Benefits Strategies
From a philosophical standpoint, employers are anxious to involve their employees in investment decisions in order to . . . actively engage employees in their benefit plans.
ployer contributions only, and the remaining 1 percent do not offer a capital-accumulation plan.
These trends suggest the continuation of a shared participa- tion between employers and employees regarding retirement investment. From a philosophical standpoint, employers are anx- ious to involve their employees in investment decisions in order to enhance understanding of plan value and to actively engage employees in their benefit plans. Capital-accumulation plans that feature both employer and employee contributions have become popular because both parties share risk and reward and this helps create bonds that go beyond the scope of the retirement plan.
The notion of employers and employees sharing in risk is indicative of the general trend regarding employee benefits in the late 1990s. As organizations shift away from more traditional, functional cultures to cultures requiring them to be immediately responsive to the market, benefit plans change to reflect that relationship. Plans that provide for immediate needs, provide portability, and stress flexibility and individual choice have made tremendous strides and will continue to do so in the future.
CONCLUSION Perhaps the most significant thing we are seeing, in both cash
compensation and benefits, is the growth of a design cycle that no longer produces programs in search of applications. The "new" cycle begins with business issues, identifies and develops HR initiatives to respond to the issues, and then builds and imple- ments programs to achieve the initiatives.
Beginning with business issues is an integral part of the shift in what HRprofessionalsneed to (and can) do for their organizations and their employees. HRneeds to find ways to support and enable the achievement of business results. We need to understand how reward programs contribute to the achievement of business re- sults. This is a question that HR has not often examined in the past, but it is key for the movement of HR into a strategic role in the organization. +
Employment Relations Today Summer 1998 99