treatment of slaughterhouse effluent using an anaerobic filter
TRANSCRIPT
Treatment of slaughterhouse effluent using an anaerobic filter
J. T. HARRISON City qf Regina, Regina, Sr~sk.. Cannrla S4P 3C8
T. VIRARAGHAVAN Fr~at l ty of Ertgineering, Uttiversitjj of Reginn, Reginn, Sr~sk.. Crlt~adrl S4S OA2
A N D
H. SOMMERSTAD Environrr~ent Cunnrlrl, Regina, Sask. , Crlnarlrl S4P 3R4
Received April 9 , 1990
Revised manuscript accepted September 17, 1990
A pilot-scale study was conducted to evaluate the treatment performance of an upflow anaerobic filter (AF) on a slaughter- house effluent. The effluent flow rate through the A F was changed for seven treatment trials, and performance was evaluated by the amount of COD removed. The COD removals ranged between 37% and 77% and wcre related to the reciprocal of the hydraulic retention time, in accordance with the Young and McCarty empirical model. The COD renlovals in this study were less in comparison to other similar A F studies, and factors attributed to this included low solids retention time and reac- tor design. The average removals of total coliforms, fecal coliforms, fecal streptococci, and standard plate count densities through the A F were 29%, 18%, 95%, and 65% respectively. The average methane content of the biogas was 71 %. The methane yields ranged between 0.19 and 0.23 (m7 STPIkg COD removed). Tracer results showed that effluent flow through the A F was predominately completely mixed.
Key words: anaerobic filter, slaughterhouse effluent, media, indicator microorganisn~s, treatment, methane.
Une Ctude pilote a CtC rCalisCe afin d'Cvaluer la performance d'un filtre anaerobie (FA) dans le traitement de I'effluent d'un abattoir. Sept essais ont CtC rCalisCs i diverses vitesses d'ecoulement i travers le filtre. La performance a CtC CvaluCe en fonc- tion de la quantitC d'oxygkne CliminCe (DCO). Les quantitCs CliminCes variaient entrc 37% et 77%; ces valeurs Ctaicnt inversement proportionnelles au temps d e sCjour hydraulique, conformCment au modkle empirique de Young et McCarthy. Dans cette Ctude, les eliminations de DOC Ctaient infkrieures i celles obtenues dans d'autres Ctudes. Cette situation est attribu- able au court temps de sejour des solides et i la conception du reacteur. Les pourcentages d'ilimination des coliformes totaux, des coliformes fecaux, des streptocoques fCcaux et des dCnombrements sur plaque par le filtre anaCrobie Ctaicnt respective- ment de 29%, 18%, 95% et 65%. La teneur moyenne de mCthane dans le biogaz Ctait de 7 1 %. Les quantitCs de mCthane produites variaient entre 0,19 et 0,23 m7 PTNIkg de DOC elimine. Les rCsultats au gaz t r apn t indiquent quc I'6coulement de I'effluent par le filtre anaCrobie Ctait totalement mClangC.
Mots clks : filtre anaCrobie, effluent d'abattoir, microorganismes indicateurs, traitement, mCthane. [Traduit par la rCdaction]
Can. 1. Civ. Eng. 18, 436-445 (1991)
1. Introduction
Anaerobic digestion has been used since the beginning of this century for the stabilization of sludges produced by muni- cipal wastewater treatment plants. During the last 20 years, new anaerobic processes have been developed that use longer solid retention times and shorter hydraulic retention times in comparison to the conventional anaerobic digestion process used in municipal wastewater treatment. This development has increased the application of the anaerobic process in the treat- ment of industrial wastewaters.
The first of these new anaerobic processes was the upflow anaerobic filter (AF) introduced by Young and McCarty (1968) for the treatment of low-strength soluble wastewaters. Their AF consisted of a bed of rocks (media) which was kept sub- merged in a closed vessel by the upflow of wastewater intro- duced across the bottom of the vessel. Unlike the conventional anaerobic digestion process, biological solids in this AF were attached to the media or trapped in the interstices of the media. The solids were not transported out with the effluent. There-
NOTE: Written discussion of this paper is welcomed and will be received by the Editor until October 3 1, 1991 (address inside front cover).
fore, the hydraulic retention time (HRT) and solids retention time (SRT) of the AF were independent of each other, in con- trast to the conventional anaerobic digestion process. As a result, HRT could be lowered to reduce reactor volume, while SRT could be raised to increase the organic loading through the filter and to minimize the washout of biological solids. Since its inception, the anaerobic filter and other fixed-film processes have been successfully applied to a variety of indus- trial wastewaters with soluble chemical oxygen demand between 2000 and 20 000 mg/L (Young and Yang 1989). The chemical oxygen demand (COD) concentration of slaughterhouse efflu- ents generally fall within or below the low end of this range when good blood recovery and grease removal methods are practiced.
As municipal sewer-use bylaws become more stringent or where municipal treatment is unavailable, treatment of slaugh- terhouse effluents by the upflow AF process may be a feasible alternative to other treatment options.
The main objective of this study was to assess the per- formance of a pilot-scale anaerobic filter (AF) in removing chemical and bacteriological constituents from a slaughter- house effluent. The COD removal data were applied to an empirical model (Young and McCarty 1968) and compared
Pr~nled in Canada / Imprim6 au Canada
Can
. J. C
iv. E
ng. D
ownl
oade
d fr
om w
ww
.nrc
rese
arch
pres
s.co
m b
y U
nive
rsity
of
Wes
tern
Ont
ario
on
11/1
2/14
For
pers
onal
use
onl
y.
HARRISON Er AL.
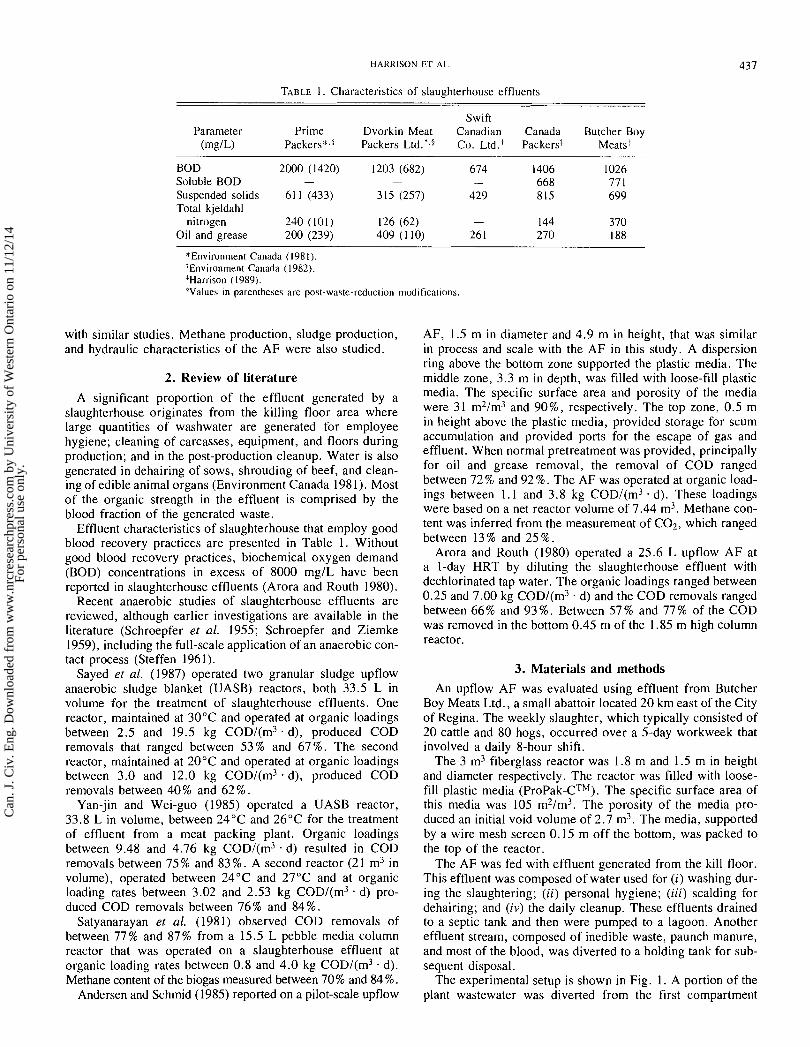
TABLE I. Characteristics of slaughterhouse effluents
Swift Parameter Prime Dvorkin Meat Canadian Canada Butcher Boy
(mg/L) P a c k e r s * . V a c k e r s Ltd.*.g Co. Ltd.+ Packerst Meats'
BOD 2000 (1420) 1203 (682) 674 1406 1026 Soluble BOD - - - 668 77 1 Suspended solids 61 1 (433) 315 (257) 429 815 699 Total kjeldahl
nitrogen 240 (101) 126 (62) - 144 370 Oil and grease 200 (239) 409 (1 10) 26 1 270 188
*Environment Canada (198 I ) . 'Environment Canada (1982). *Harrison (1989). PValues in parentheses are post-waste-reduction modifications.
with similar studies. Methane production, sludge production, and hydraulic characteristics of the A F were also studied.
2. Review of literature
A significant proportion of the effluent generated by a slaughterhouse originates from the killing floor area where large quantities of washwater are generated for employee hygiene; cleaning of carcasses, equipment, and floors during production; and in the post-production cleanup. Water is also generated in dehairing of sows, shrouding of beef, and clean- ing of edible animal organs (Environment Canada 198 1). Most of the organic strength in the effluent is comprised by the blood fraction of the generated waste.
Effluent characteristics of slaughterhouse that employ good blood recovery practices are presented in Table 1. Without good blood recovery practices, biochemical oxygen demand (BOD) concentrations in excess of 8000 mg/L have been reported in slaughterhouse effluents (Arora and Routh 1980).
Recent anaerobic studies of slaughterhouse effluents are reviewed, although earlier investigations are available in the literature (Schroepfer er al. 1955; Schroepfer and Ziemke 1959), including the full-scale application of an anaerobic con- tact process ( ~ t e f f e n 196 1).
Sayed et al. (1987) operated two granular sludge upflow anaerobic sludge blanket (UASB) reactors, both 33.5 L in volume for the treatment of slaughterhouse effluents. One reactor, maintained at 30°C and operated at organic loadings between 2 . 5 and 19.5 kg COD/(m3 . d), produced C O D removals that ranged between 53% and 67%. The second reactor, maintained at 20°C and operated at organic loadings between 3 . 0 and 12.0 kg COD/(m3. d) , produced COD removals between 40% and 62 % .
Yan-jin and Wei-guo (1985) operated a UASB reactor, 33.8 L in volume, between 24°C and 26°C for the treatment of effluent from a meat packing plant. Organic loadings between 9.48 and 4.76 kg COD/(m3 . d) resulted in C O D removals between 7 5 % and 83 % . A second reactor (2 1 m3 in volume), operated between 24°C and 27°C and at organic loading rates between 3.02 and 2.53 kg COD/(m3 . d) pro- duced C O D removals between 76% and 84%.
Satyanarayan et al. (1981) observed C O D removals of between 77% and 87% from a 15.5 L pebble media column reactor that was operated on a slaughterhouse effluent at organic loading rates between 0 .8 and 4 . 0 kg COD/(m3 . d). Methane content of the biogas measured between 70% and 84%.
Andersen and Schmid (1985) reported on a pilot-scale upflow
AF, 1.5 m in diameter and 4.9 m in height, that was similar in process and scale with the A F in this study. A dispersion ring above the bottom zone supported the plastic media. The middle zone, 3.3 m in depth, was filled with loose-fill plastic media. The specific surface area and porosity of the media were 31 m2/m3 and 9 0 % , respectively. The top zone, 0 .5 m in height above the plastic media, provided storage for scum accumulation and provided ports for the escape of gas and effluent. When normal pretreatment was provided, principally for oil and grease removal, the removal of C O D ranged between 72 % and 92 % . T h e A F was operated at organic load- ings between 1.1 and 3.8 kg COD/(m3 . d). These loadings were based on a net reactor volume of 7.44 m3. Methane con- tent was inferred from the measurement of C 0 2 , which ranged between 13% and 25%.
Arora and Routh (1980) operated a 25.6 L upflow A F at a I-day HRT by diluting the slaughterhouse effluent with dechlorinated tap water. The organic loadings ranged between 0.25 and 7.00 kg COD/(m3 . d) and the C O D removals ranged between 66% and 9 3 % . Between 57 % and 77% of the C O D was removed in the bottom 0.45 m of the 1.85 m high column reactor.
3. Materials and methods An upflow A F was evaluated using effluent from Butcher
Boy Meats Ltd., a small abattoir located 2 0 km east of the City of Regina. The weekly slaughter, which typically consisted of 2 0 cattle and 8 0 hogs, occurred over a 5-day workweek that involved a daily 8-hour shift.
The 3 m3 fiberglass reactor was 1.8 m and 1.5 m in height and diameter respectively. The reactor was filled with loose- fill plastic media ( P r ~ P a k - c ' ~ ~ ) . The specific surface area of this media was 105 m2/m3. The porosity of the media pro- duced an initial void volume of 2 .7 m3. T h e media, supported by a wire mesh screen 0.15 m off the bottom, was packed to the top of the reactor.
The A F was fed with effluent generated from the kill floor. This effluent was composed of water used for (i) washing dur- ing the slaughtering; (ii) personal hygiene; (iii) scalding for dehairing; and ( iv) the daily cleanup. These effluents drained to a septic tank and then were pumped to a lagoon. Another effluent stream, composed of inedible waste, paunch manure, and most of the blood, was diverted to a holding tank for sub- sequent disposal.
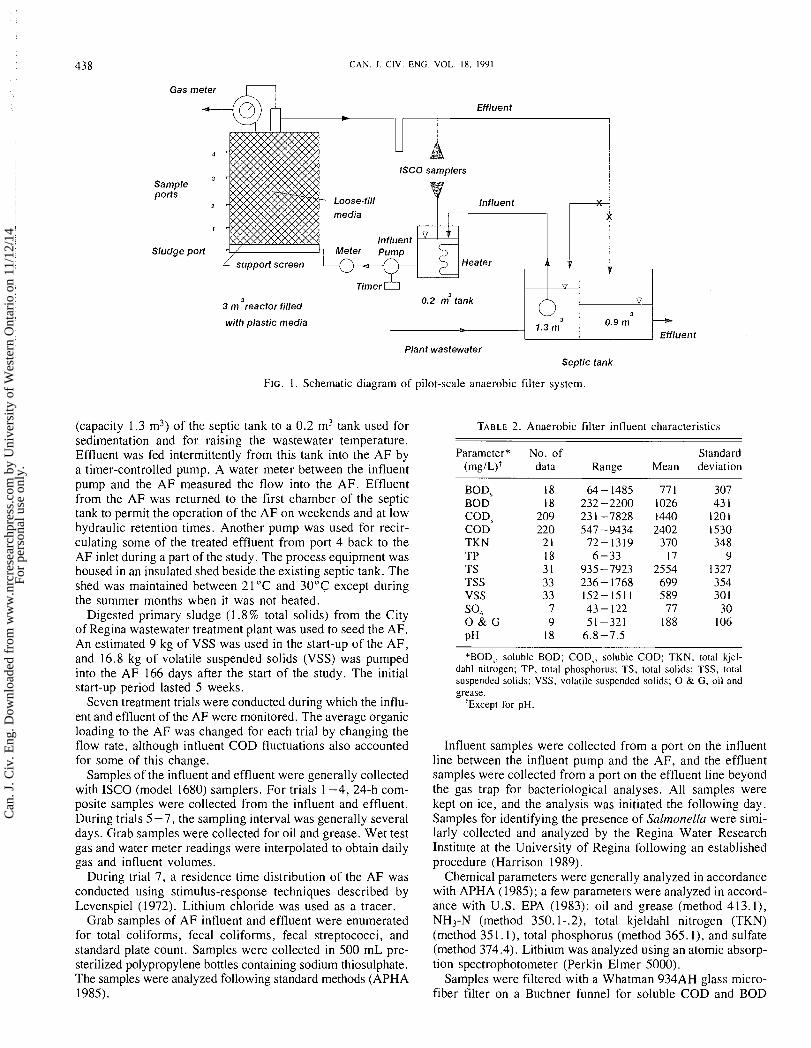
The experimental setup is shown in Fig. 1. A portion of the plant wastewater was diverted from the first compartment
Can
. J. C
iv. E
ng. D
ownl
oade
d fr
om w
ww
.nrc
rese
arch
pres
s.co
m b
y U
nive
rsity
of
Wes
tern
Ont
ario
on
11/1
2/14
For
pers
onal
use
onl
y.
C A N . I. CIV. ENG. VOL. 18. 1991
Gas meter
Effluent
I I I I
Sample ports
Sludge port 4 /
1 support screen
ISCO samplers
T' Influent media 1 7
Influent Meter Pump
Heater
I
3 m 3reactor filled 0.2 m3 tank
with plastic media 3
1.3 m 0.9 m- Effluent
Plant wastewater Septic tank
FIG. 1. Schematic diagram of pilot-scale anaerobic filter system
(capacity 1.3 m3) of the septic tank to a 0.2 m3 tank used for sedimentation and for raising the wastewater temperature. Effluent was fed intermittently from this tank into the AF by a timer-controlled pump. A water meter between the influent pump and the AF measured the flow into the AF. Effluent from the AF was returned to the first chamber of the septic tank to permit the operation of the AF on weekends and at low hydraulic retention times. Another pump was used for recir- culating some of the treated effluent from port 4 back to the AF inlet during a part of the study. The process equipment was housed in an insulated shed beside the existing septic tank. The shed was maintained between 21 "C and 30°C except during the summer months when it was not heated.
Digested primary sludge (1.8% total solids) from the City of Regina wastewater treatment plant was used to seed the AF. An estimated 9 kg of VSS was used in the start-up of the AF, and 16.8 kg of volatile suspended solids (VSS) was pumped into the AF 166 days after the start of the study. The initial start-up period lasted 5 weeks.
Seven treatment trials were conducted during which the influ- ent and effluent of the AF were monitored. The average organic loading to the AF was changed for each trial by changing the flow rate, although influent COD fluctuations also accounted for some of this change.
Samples of the influkt and effluent were generally collected with ISCO (model 1680) samplers. For trials 1-4, 24-h com- posite samples were collected from the influent and effluent. During trials 5 -7, the sampling interval was generally several days. Grab samples were collected for oil and grease. Wet test gas and water meter readings were interpolated to obtain daily gas and influent volumes.
During trial 7 , a residence time distribution of the AF was conducted using stimulus-response techniques described by Levenmiel (1972). Lithium chloride was used as a tracer.
Grab'samples df AF influent and effluent were enumerated for total coliforms, fecal coliforms, fecal streptococci, and standard plate count. Samples were collected in 500 mL pre- sterilized polypropylene bottles containing sodium thiosulphate. The samples were analyzed following standard methods (APHA 1985).
TABLE 2. Anaerobic filter influent characteristics
Parameter* No. of Standard (mg/Ut data Range Mean deviation
BOD, BOD COD, COD TKN TP TS TSS VSS SO4 0 & G pH
*BOD,, soluble BOD; COD,, soluble COD; TKN, total kjel- dahl nitrogen; TP, total phosphorus; TS, total solids; TSS, total suspended solids; VSS, volatile suspended solids; 0 Br G, oil and grease.
+Except for pH.
Influent samples were collected from a port on the influent line between the influent pump and the AF, and the effluent samples were collected from a port on the effluent line beyond the gas trap for bacteriological analyses. All samples were kept on ice, and the analysis was initiated the following day. Samples for identifying the presence of Salmonella were simi- larly collected and analyzed by the Regina Water Research Institute at the University of Regina following an established procedure (Harrison 1989).
Chemical parameters were generally analyzed in accordance with APHA (1985); a few parameters were analyzed in accord- ance with U.S. EPA (1983): oil and grease (method 413.1), NH3-N (method 350.1-.2), total kjeldahl nitrogen (TKN) (method 35 1. l) , total phosphorus (method 365. I), and sulfate (method 374.4). Lithium was analyzed using an atomic absorp- tion spectrophotometer (Perkin Elmer 5000).
Samples were filtered with a Whatman 934AH glass micro- fiber filter on a Buchner funnel for soluble COD and BOD
Can
. J. C
iv. E
ng. D
ownl
oade
d fr
om w
ww
.nrc
rese
arch
pres
s.co
m b
y U
nive
rsity
of
Wes
tern
Ont
ario
on
11/1
2/14
For
pers
onal
use
onl
y.
HARRISON ET AL.
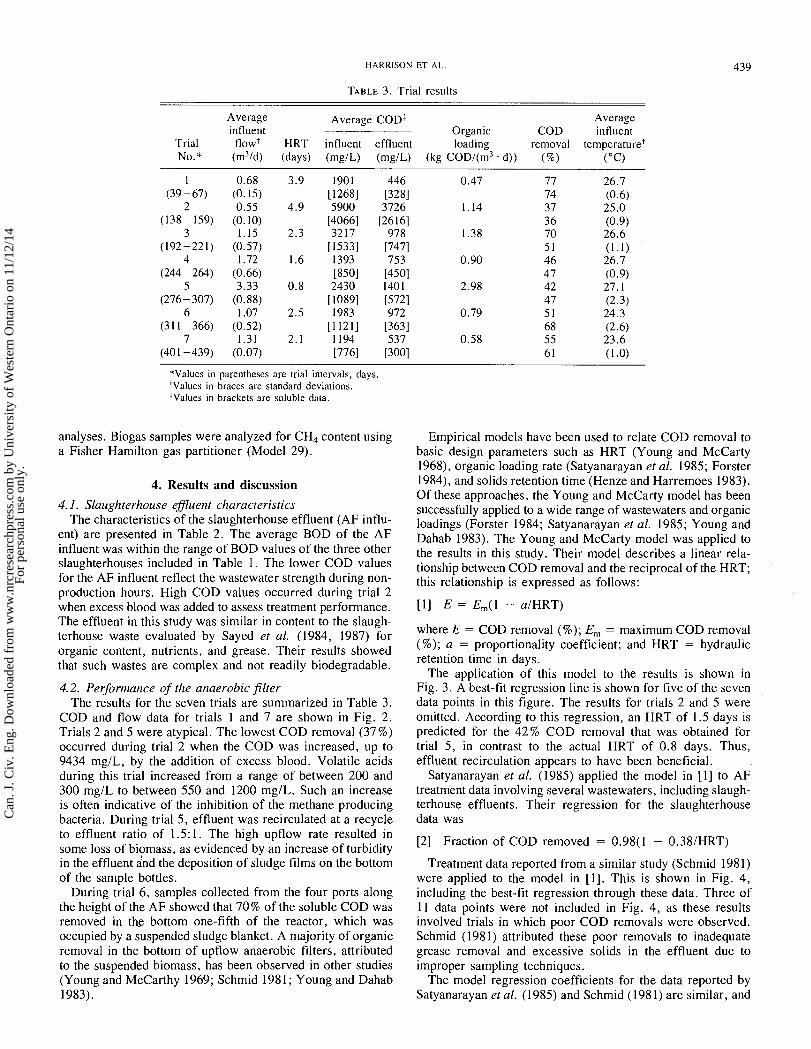
TABLE 3. Trial results
Average Average CODf Average influent Organic COD influent
Trial flowt HRT influent effluent loading removal temperaturei No.* (m3/d) (days) (mg/L) (mg/L) (kg COD/(m3 . dl) (%) ( " 0
*Values in parentheses are trial intervals, days. 'Values in braces are standard deviations. !Values in brackets are soluble data.
analyses. Biogas samples were analyzed for CH4 content using a Fisher Hamilton gas partitioner (Model 29).
4. Results and discussion
4.1. Slaughterhouse efluent characteristics The characteristics of the slaughterhouse effluent (AF influ-
ent) are presented in Table 2. The average BOD of the AF influent was within the range of BOD values of the three other slaughterhouses included in Table 1. The lower COD values for the AF influent reflect the wastewater strength during non- production hours. High COD values occurred during trial 2 when excess blood was added to assess treatment ~erformance. The effluent in this study was similar in content to the slaugh- terhouse waste evaluated by Sayed et al. (1984, 1987) for organic content, nutrients, and grease. Their results showed that such wastes are complex and not readily biodegradable.
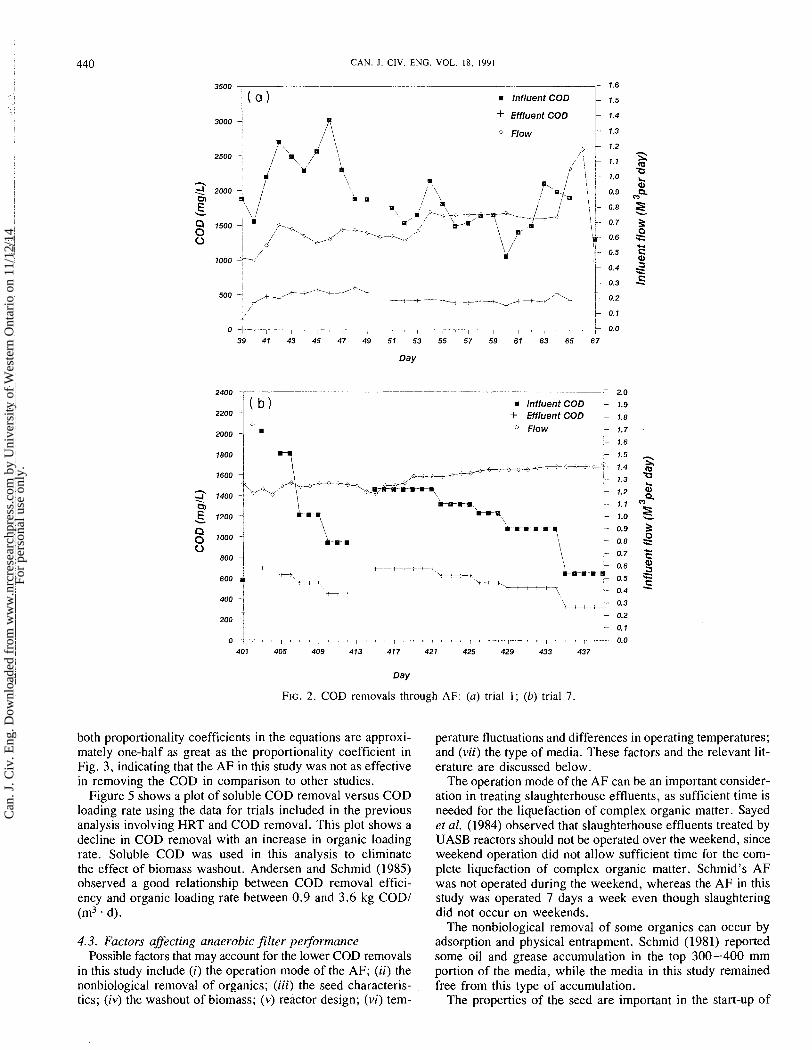
4.2. Pe$ormance of the anaerobic filter The results for the seven trials are summarized in Table 3.
COD and flow data for trials 1 and 7 are shown in Fig. 2. Trials 2 and 5 were atypical. The lowest COD removal (37%) occurred during trial 2 when the COD was increased, up to 9434 mg/L, by the addition of excess blood. Volatile acids during this trial increased from a range of between 200 and 300 mg/L to between 550 and 1200 mg1L. Such an increase is often indicative of the inhibition of the methane producing bacteria. During trial 5 , effluent was recirculated at a recycle to effluent ratio of 1.5: 1 . The high upflow rate resulted in some loss of biomass, as evidenced by an increase of turbidity in the effluent and the deposition of sludge films on the bottom of the sample bottles.
During trial 6 , samples collected from the four ports along the height of the AF showed that 70% of the soluble COD was removed in the bottom one-fifth of the reactor, which was occupied by a suspended sludge blanket. A majority of organic removal in the bottom of upflow anaerobic filters, attributed to the suspended biomass, has been observed in other studies (Young and McCarthy 1969; Schmid 198 1 ; Young and Dahab 1983).
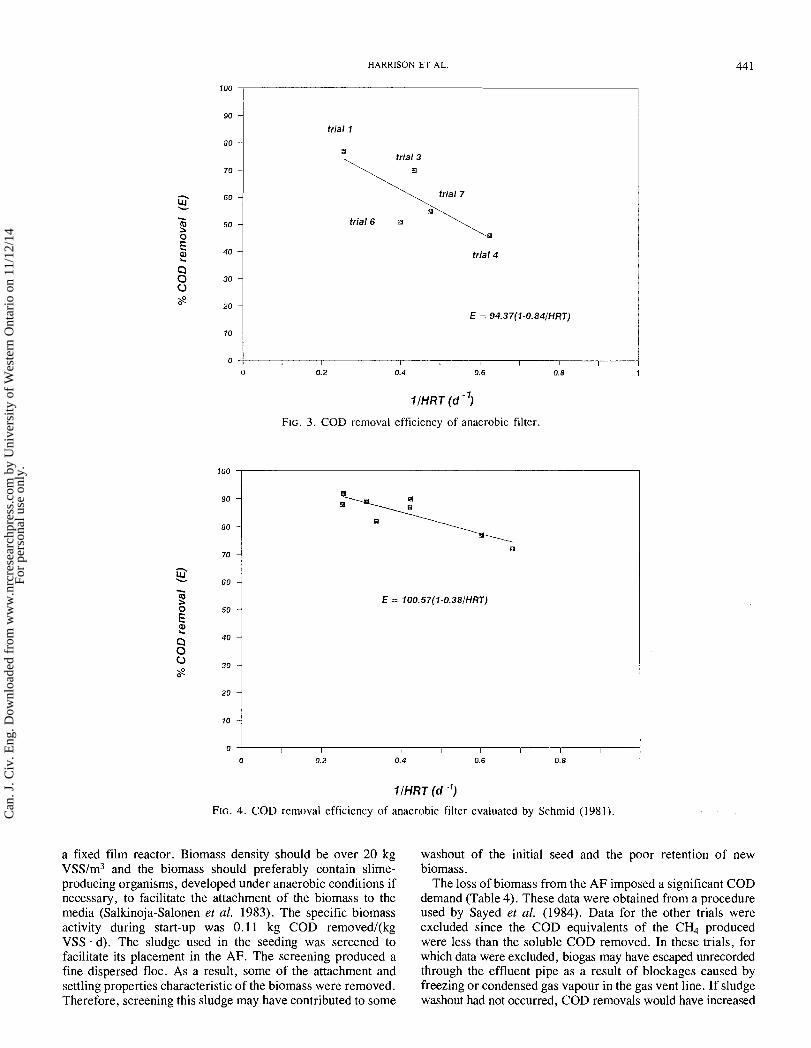
Empirical models have been used to relate COD removal to basic design parameters such as HRT (Young and McCarty 1968), organic loading rate (Satyanarayan et al. 1985; Forster 1984), and solids retention time (Henze and Harremoes 1983). Of these approaches, the Young and McCarty model has been successfully applied to a wide range of wastewaters and organic loadings (Forster 1984; Satyanarayan et al. 1985; Young and Dahab 1983). The Young and McCarty model was applied to the results in this study. Their model describes a linear rela- tionship between COD removal and the reciprocal of the HRT; this relationship is expressed as follows:
where E = COD removal (%); Em = maximum COD removal (%); a = proportionality coefficient; and HRT = hydraulic retention time in days.
The application of this model to the results is shown in Fig. 3. A best-fit regression line is shown for five of the seven data points in this figure. The results for trials 2 and 5 were omitted. According to this regression, an HRT of 1.5 days is predicted for the 42% COD removal that was obtained for trial 5, in contrast to the actual HRT of 0.8 days. Thus, effluent recirculation appears to have been beneficial.
Satyanarayan et al. (1985) applied the model in [I] to AF treatment data involving several wastewaters, including slaugh- terhouse effluents. Their regression for the slaughterhouse data was
[2] Fraction of COD removed = 0.98(1 - 0.38lHRT)
Treatment data reported from a similar study (Schmid 1981) were applied to the model in [I]. This is shown in Fig. 4, including the best-fit regression through these data. Three of 11 data points were not included in Fig. 4, as these results involved trials in which poor COD removals were observed. Schmid (1981) attributed these poor removals to inadequate grease removal and excessive solids in the effluent due to improper sampling techniques.
The model regression coefficients for the data reported by Satyanarayan eral. (1985) and Schmid (1981) are similar, and
Can
. J. C
iv. E
ng. D
ownl
oade
d fr
om w
ww
.nrc
rese
arch
pres
s.co
m b
y U
nive
rsity
of
Wes
tern
Ont
ario
on
11/1
2/14
For
pers
onal
use
onl
y.
440 CAN. J. CIV. ENG. VOL. 18, 1991
- -- -- - 1.6
Influent COD 1.5
3000 + Effluent COD 1: 1.4
I ? Flow 1- 13
A
rn Influent COD + Effluent COD O Flow
I .
FIG. 2. COD removals through AF: (a ) trial 1 ; (b) trial 7 .
both proportionality coefficients in the equations are approxi- mately one-half as great as the proportionality coefficient in Fig. 3, indicating that the AF in this study was not as effective in removing the COD in comparison to other studies.
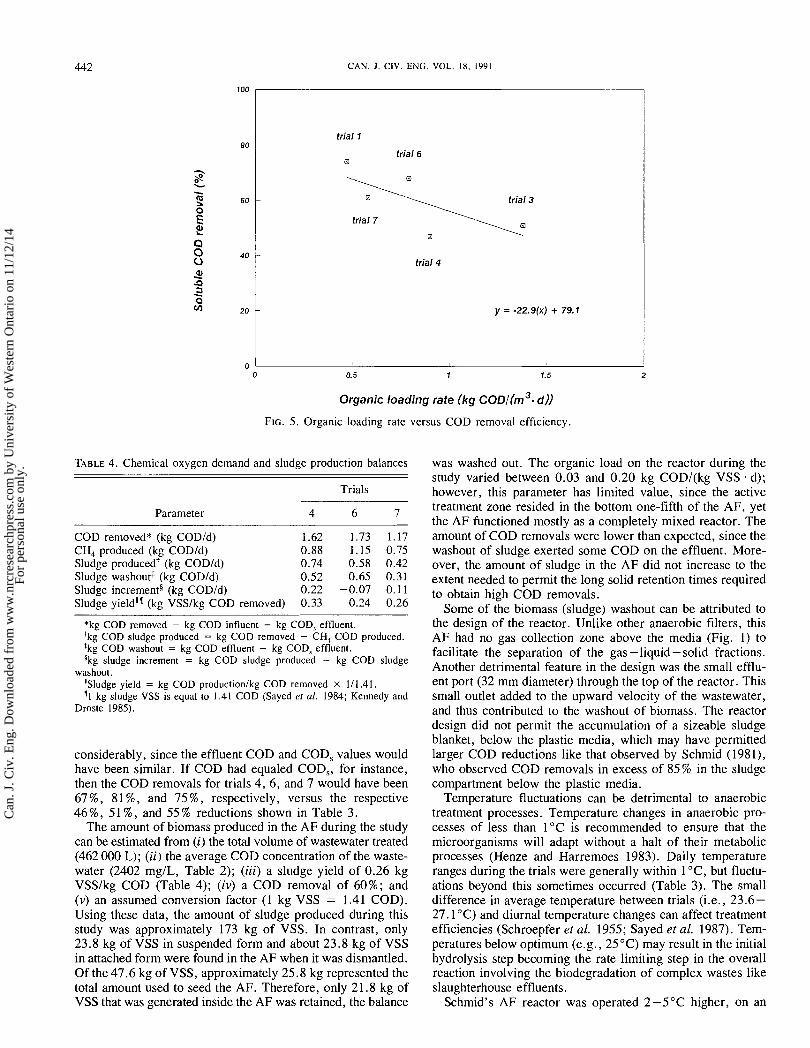
Figure 5 shows a plot of soluble COD removal versus COD loading rate using the data for trials included in the previous analysis involving HRT and COD removal. This plot shows a decline in COD removal with an increase in organic loading rate. Soluble COD was used in this analysis to eliminate the effect of biomass washout. Andersen and Schmid (1985) observed a good relationship between COD removal effici- ency and organic loading rate between 0.9 and 3.6 kg COD/ (m3 . d).
4.3. Factors affecting anaerobic filter performance Possible factors that may account for the lower COD removals
in this study include ( i ) the operation mode of the AF; (ii) the nonbiological removal of organics; (iii) the seed characteris- tics; (iv) the washout of biomass; (v ) reactor design; (vi) tem-
perature fluctuations and differences in operating temperatures; and (vii) the type of media. These factors and the relevant lit- erature are discussed below.
The operation mode of the AF can be an important consider- ation in treating slaughterhouse effluents, as sufficient time is needed for the liquefaction of complex organic matter. Sayed et al. (1984) observed that slaughterhouse effluents treated by UASB reactors should not be operated over the weekend, since weekend operation did not allow sufficient time for the com- plete liquefaction of complex organic matter. Schmid's AF was not operated during the weekend, whereas the AF in this study was operated 7 days a week even though slaughtering did not occur on weekends.
The nonbiological removal of some organics can occur by adsorption and physical entrapment. Schmid (1981) reported some oil and grease accumulation in the top 300-400 mm portion of the media, while the media in this study remained free from this type of accumulation.
The properties of the seed are important in the start-up of
Can
. J. C
iv. E
ng. D
ownl
oade
d fr
om w
ww
.nrc
rese
arch
pres
s.co
m b
y U
nive
rsity
of
Wes
tern
Ont
ario
on
11/1
2/14
For
pers
onal
use
onl
y.
HARRISON ET A L
"1 trial I
a trial 3
trial 7
trial 6 3
rn
trial 4
FIG. 3. COD removal efficiency of anaerobic filter.
1 IHRT (d .')
FIG. 4. COD removal efficiency of anaerobic filter evaluated by Schmid (1981).
a fixed film reactor. Biomass density should be over 20 kg VSS/m3 and the biomass should preferably contain slime- producing organisms, developed under anaerobic conditions if necessary, to facilitate the attachment of the biomass to the media (Salkinoja-Salonen et al. 1983). The specific biomass activity during start-up was 0.11 kg COD removed/(kg VSS . d). The sludge used in the seeding was screened to facilitate its placement in the AF. The screening produced a fine dispersed floc. As a result, some of the attachment and settling properties characteristic of the biomass were removed. Therefore, screening this sludge may have contributed to some
washout of the initial seed and the poor retention of new biomass.
The loss of biomass from the AF imposed a significant COD demand (Table 4). These data were obtained from a procedure used by Sayed et al. (1984). Data for the other trials were excluded since the COD equivalents of the CH4 produced were less than the soluble COD removed. In these trials, for which data were excluded, biogas may have escaped unrecorded through the effluent pipe as a result of blockages caused by freezing or condensed gas vapour in the gas vent line. If sludge washout had not occurred, COD removals would have increased
Can
. J. C
iv. E
ng. D
ownl
oade
d fr
om w
ww
.nrc
rese
arch
pres
s.co
m b
y U
nive
rsity
of
Wes
tern
Ont
ario
on
11/1
2/14
For
pers
onal
use
onl
y.
C A N . J . CIV. ENG. VOL. 18. 1991
trial 1
trial 6
trial 3
trial 7
trial 4
y = -22 .9 (~ ) + 79.1
Organic loading rate (kg COD/(^^. d))
FIG. 5. Organic loading rate versus COD removal efficiency.
TABLE 4. Chemical oxygen demand and sludge production balances
Trials
Parameter 4 6 7
COD removed* (kg CODId) 1.62 1.73 1.17 CH, produced (kg CODId) 0.88 1.15 0.75 Sludge producedt (kg CODId) 0.74 0.58 0.42 Sludge washout* (kg CODId) 0.52 0.65 0.31 Sludge increments (kg CODId) 0.22 -0.07 0.1 1 Sludge (kg VSSIkg COD removed) 0.33 0.24 0.26
*kg COD removed = kg COD influent - kg COD, effluent. +kg COD sludge produced = kg COD removed - CH, COD produced. *kg COD washout = kg COD effluent - kg COD, effluent. %kg sludge increment = kg COD sludge produced - kg COD sludge
washout. 'Sludge yield = kg COD productionlkg COD removed x 111.41. 'I kg sludge VSS is equal to 1.41 COD (Sayed et al. 1984; Kennedy and
Droste 1985).
considerably, since the effluent COD and COD, values would have been similar. If COD had equaled COD,, for instance, then the COD removals for trials 4, 6, and 7 would have been 67%, 81 %, and 75%, respectively, versus the respective 46%, 5 1 %, and 55 % reductions shown in Table 3.
The amount of biomass produced in the AF during the study can be estimated from (i) the total volume of wastewater treated (462 000 L); (ii) the average COD concentration of the waste- water (2402 mgIL, Table 2); (iii) a sludge yield of 0.26 kg VSSIkg COD (Table 4); (iv) a COD removal of 60%; and (v) an assumed conversion factor (1 kg VSS = 1.41 COD). Using these data, the amount of sludge produced during this study was approximately 173 kg of VSS. In contrast, only 23.8 kg of VSS in suspended form and about 23.8 kg of VSS in attached form were found in the AF when it was dismantled. Of the 47.6 kg of VSS, approximately 25.8 kg represented the total amount used to seed the AF. Therefore, only 21.8 kg of VSS that was generated inside the AF was retained, the balance
was washed out. The organic load on the reactor during the study varied between 0.03 and 0.20 kg COD/(kg VSS . d); however, this parameter has limited value, since the active treatment zone resided in the bottom one-fifth of the AF, yet the AF functioned mostly as a completely mixed reactor. The amount of COD removals were lower than expected, since the washout of sludge exerted some COD on the effluent. More- over, the amount of sludge in the AF did not increase to the extent needed to permit the long solid retention times required to obtain high COD removals.
Some of the biomass (sludge) washout can be attributed to the design of the reactor. Unlike other anaerobic filters, this AF had no gas collection zone above the media (Fig. 1) to facilitate the separation of the gas-liquid-solid fractions. Another detrimental feature in the design was the small efflu- ent port (32 mm diameter) through the top of the reactor. This small outlet added to the upward velocity of the wastewater, and thus contributed to the washout of biomass. The reactor design did not permit the accumulation of a sizeable sludge blanket, below the plastic media, which may have permitted larger COD reductions like that observed by Schmid (1981), who observed COD removals in excess of 85% in the sludge compartment below the plastic media.
Temperature fluctuations can be detrimental to anaerobic treatment processes. Temperature changes in anaerobic pro- cesses of less than 1°C is recommended to ensure that the microorganisms will adapt without a halt of their metabolic processes (Henze and Harremoes 1983). Daily temperature ranges during the trials were generally within 1 "C, but fluctu- ations beyond this sometimes occurred (Table 3). The small difference in average temperature between trials (i.e., 23.6- 27.1 "C) and diurnal temperature changes can affect treatment efficiencies (Schroepfer et al. 1955; Sayed et al. 1987). Tem- peratures below optimum (e.g., 25°C) may result in the initial hydrolysis step becoming the rate limiting step in the overall reaction involving the biodegradation of complex wastes like slaughterhouse effluents.
Schmid's AF reactor was operated 2-5°C higher, on an
Can
. J. C
iv. E
ng. D
ownl
oade
d fr
om w
ww
.nrc
rese
arch
pres
s.co
m b
y U
nive
rsity
of
Wes
tern
Ont
ario
on
11/1
2/14
For
pers
onal
use
onl
y.
HARRISON ET AL.
Theoretical HRT 52.9 hrs
Actual HRT 49.7 hrs
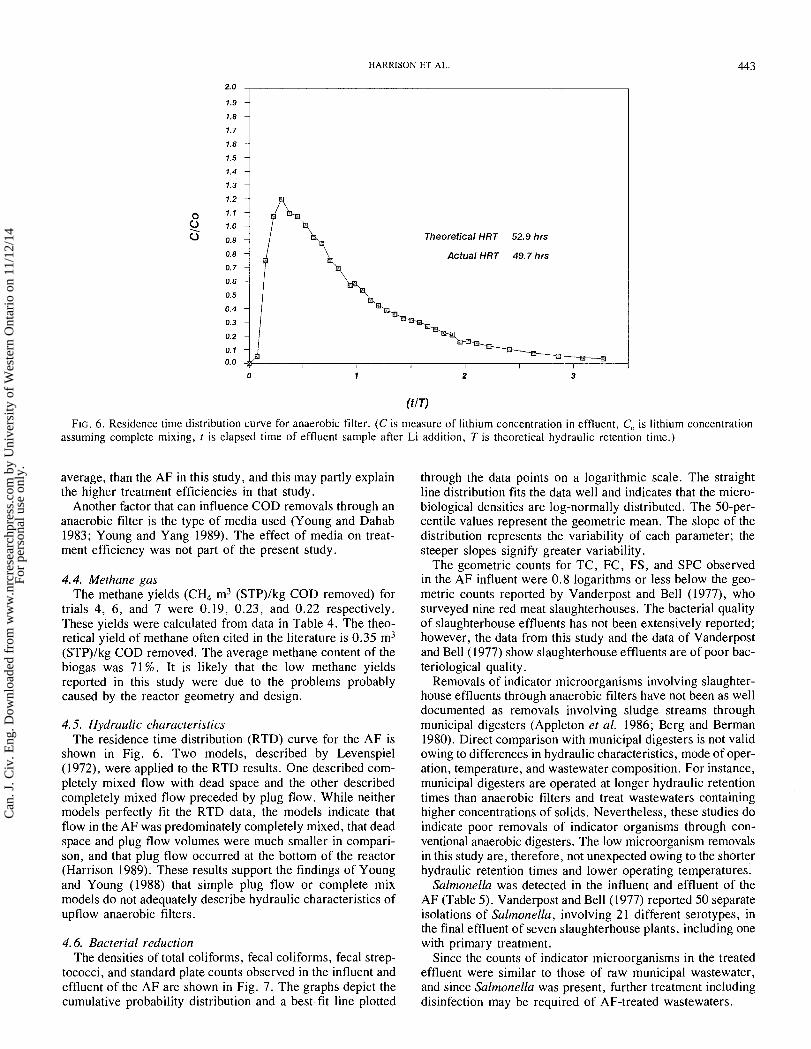
FIG. 6. Residence time distribution curve for anaerobic filter. (C is measure of lithium concentration in effluent, C,, is lithium concentration assuming complete mixing, t is elapsed time of effluent sample after Li addition, T is theoretical hydraulic retention time.)
average, than the AF in this study, and this may partly explain the higher treatment efficiencies in that study.
Another factor that can influence COD removals through an anaerobic filter is the type of media used (Young and Dahab 1983; Young and Yang 1989). The effect of media on treat- ment efficiency was not part of the present study.
4.4. Methane gas The methane yields (CH, m3 (STP)/kg COD removed) for
trials 4, 6, and 7 were 0.19, 0.23, and 0.22 respectively. These yields were calculated from data in Table 4. The theo- retical yield of methane often cited in the literature is 0.35 m3 (STP)/kg COD removed. The average methane content of the biogas was 71 %. It is likely that the low methane yields reported in this study were due to the problems probably caused by the reactor geometry and design.
4.5. Hydraulic characteristics The residence time distribution (RTD) curve for the AF is
shown in Fig. 6. Two models, described by Levenspiel (1972), were applied to the RTD results. One described com- pletely mixed flow with dead space and the other described completely mixed flow preceded by plug flow. While neither models perfectly fit the RTD data, the models indicate that flow in the AF was predominately completely mixed, that dead space and plug flow volumes were much smaller in compari- son, and that plug flow occurred at the bottom of the reactor (Harrison 1989). These results support the findings of Young and Young (1988) that simple plug flow or complete mix models do not adequately describe hydraulic characteristics of upflow anaerobic filters.
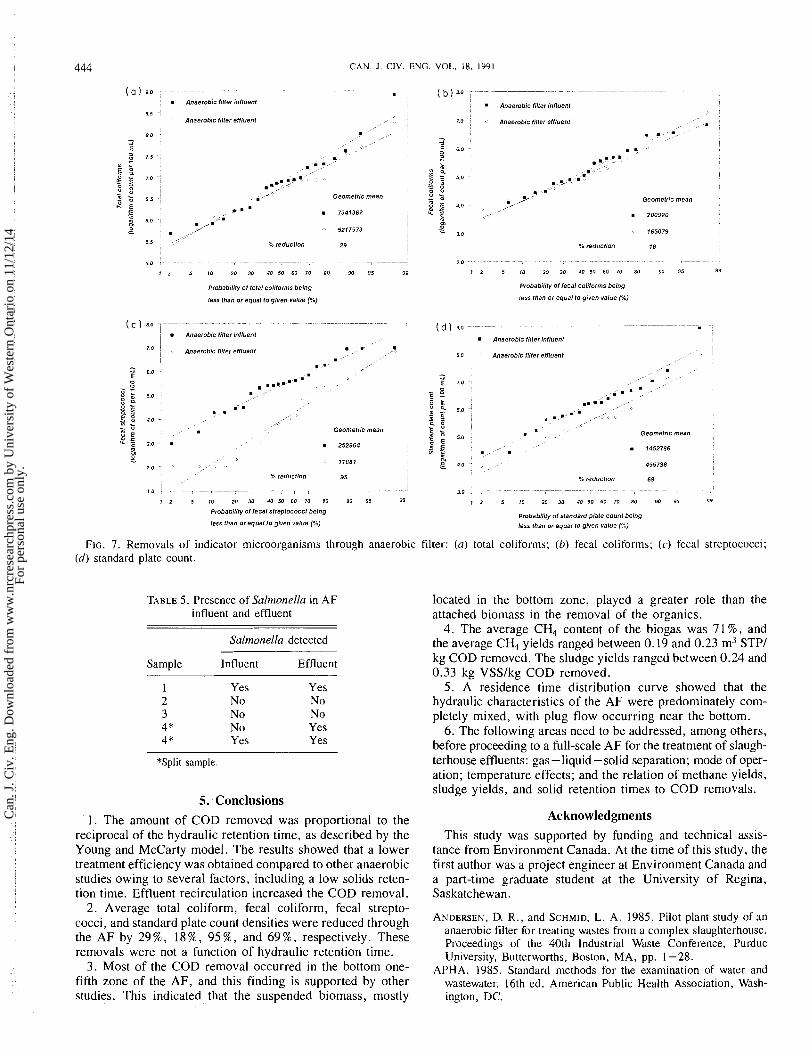
4.6. Bacterial reduction The densities of total coliforms, fecal coliforms, fecal strep-
tococci, and standard plate counts observed in the influent and effluent of the AF are shown in Fig. 7. The graphs depict the cumulative probability distribution and a best-fit line plotted
through the data points on a logarithmic scale. The straight line distribution fits the data well and indicates that the micro- biological densities are log-normally distributed. The 50-per- centile values represent the geometric mean. The slope of the distribution represents the variability of each parameter; the steeper slopes signify greater variability.
The geometric counts for TC, FC, FS, and SPC observed in the AF influent were 0.8 logarithms or less below the geo- metric counts reported by Vanderpost and Bell (1977), who surveyed nine red meat slaughterhouses. The bacterial quality of slaughterhouse effluents has not been extensively reported; however, the data from this study and the data of Vanderpost and Bell (1977) show slaughterhouse effluents are of poor bac- teriological quality.
Removals of indicator microorganisms involving slaughter- house effluents through anaerobic filters have not been as well documented as removals involving sludge streams through municipal digesters (Appleton et al. 1986; Berg and Berman 1980). Direct comparison with municipal digesters is not valid owing to differences in hydraulic characteristics, mode of oper- ation, temperature, and wastewater composition. For instance, municipal digesters are operated at longer hydraulic retention times than anaerobic filters and treat wastewaters containing higher concentrations of solids. Nevertheless, these studies do indicate poor removals of indicator organisms through con- ventional anaerobic digesters. The low microorganism removals in this study are, therefore, not unexpected owing to the shorter hydraulic retention times and lower operating temperatures.
Salmonella was detected in the influent and effluent of the AF (Table 5). Vanderpost and Bell (1977) reported 50 separate isolations of Salmonella, involving 21 different serotypes, in the final effluent of seven slaughterhouse plants, including one with primary treatment.
Since the counts of indicator microorganisms in the treated effluent were similar to those of raw municipal wastewater, and since Salmonella was present, further treatment including disinfection may be required of AF-treated wastewaters.
Can
. J. C
iv. E
ng. D
ownl
oade
d fr
om w
ww
.nrc
rese
arch
pres
s.co
m b
y U
nive
rsity
of
Wes
tern
Ont
ario
on
11/1
2/14
For
pers
onal
use
onl
y.
CAN. J. CIV. ENG. VOL. 18. 1991
( a ) 90 - - - - -
m Anaerobic liter lnfluenl
8 5
Anserobnc frtter effluent
Geometric mean
m 7341362
5217573
Anaerobic filter effluent
Geometrtc mean
m 200920
I 0
1 Z 6 10 20 30 40 50 60 70 80 10 95 99
Prababilily of total coliforms being Probability of fecal coliforms being
less lhan or equal to given value (%) jess than or equal to given value (?&)
( d l 90 m Anaerobic fllter 8nfluenl
Anaerobrc filter effluent 8 0 Anaerobic fllter effluenl
- E 7 0 D
z : 2 a
SO a - B 5 P 0
Geometrrc mean 2 2 a 0 5 0
Geomelnc mean
;; ", C m 1452786
2 40 =.
30
1 2 5 I0 20 30 40 50 60 10 90 00 95 98 1 2 5 10 20 30 40 50 60 70 80 00 95 99
Probabil!ly of fecal streplococci being Probabitrly of standard plate count berng
less than or equal lo given value (4s) less lhan or equal to given value (%)
FIG. 7. Renlovals of indicator nlicroorganisms through anaerobic filter: (a ) total colifor~l~s; (0) fecal coliforms; ( c ) fecal streptococci; (d ) standard plate count.
TABLE 5. Presence of Salrnonella in AF influent and effluent
Salmonella detected
Sample Influent Effluent
1 Yes Yes 2 No No 3 No No 4 * No Yes 4 * Yes Yes
*Split sample
5. Conclusions 1. The amount of COD removed was proportional to the
reciprocal of the hydraulic retention time, as described by the Young and McCarty model. The results showed that a lower treatment efficiency was obtained compared to other anaerobic studies owing to several factors, including a low solids reten- tion time. Eftluent recirculation increased the COD removal.
located in the bottom zone, played a greater role than the attached biomass in the removal of the organics.
4. The average CH4 content of the biogas was 7 1 %, and the average CH4 yields ranged between 0.19 and 0.23 m3 STPI kg COD removed. The sludge yields ranged between 0.24 and 0.33 kg VSSIkg COD removed.
5. A residence time distribution curve showed that the hydraulic characteristics of the AF were predominately com- pletely mixed, with plug flow occurring near the bottom.
6. The following areas need to be addressed, among others, before proceeding to a full-scale AF for the treatment of slaugh- terhouse effluents: gas - liquid - solid separation; mode of oper- ation; temperature effects; and the relation of methane yields, sludge yields, and solid retention times to COD removals.
Acknowledgments This study was supported by funding and technical assis-
tance from Environment Canada. At the time of this study, the first author was a project engineer at Environment Canada and a part-time graduate student at the University of Regina, Saskatchewan.
2. Average total coliform, fecal coliform, fecal strepto- cocci, and standard plate count densities were reduced through ANDERSEN, D. R., and SCHMID, L. A. 1985. Pilot plant study of an
anaerobic filter for treatlng wastes from a complex slaughterhouse. the AF by 29%, I*%, 95%, and 69%, These Proceedings of the 40th Industrial Waste Conference, Purdue removals were not a function of hydraulic retention time. University, Butterworths, Boston, MA, pp. 1-28.
3. the in the One- APHA. 1985. Standard methods for the examinat~on of water and fifth zone of the AF, and this finding is supported by other wastewater. 16th ed. American Public Health Association, Wash- studies. This indicated that the suspended biomass, mostly ington, DC.
Can
. J. C
iv. E
ng. D
ownl
oade
d fr
om w
ww
.nrc
rese
arch
pres
s.co
m b
y U
nive
rsity
of
Wes
tern
Ont
ario
on
11/1
2/14
For
pers
onal
use
onl
y.
HARRISON ET AL. 445
APPLETON, A. R., LEONG, C. J., and VENOSA, A. D. 1986. Pathogen and indicator organism destruction by the dual digestion system. Journal of the Water Pollution Control Federation, 58(10): 992- 999.
ARORA, H. C., and ROUTH, T. 1980. Treatment of slaughterhouse effluents by anaerobic contact filter. Indian Association of Water Pollution Control Technical Annual, VI and VII, pp. 67-79.
BERG, G., and BERMAN, D. 1980. Destruction by anaerobic mesophil- lic and thermophillic digestion of viruses and indicator bacteria indigenous to domestic sludges. Applied and Environmental Micro- biology, 39(2): 36 1 - 368.
ENVIRONMENT CANADA. 1981. Water and waste management in the Canadian meat and poultry processing industry. A report submitted by Stanley Associates Engineering Ltd. and Dearborn Environ- mental Consulting Services. Report No. EPS 3-WP-81-3, Environ- mental Protection Service, Environment Canada, Ottawa, Ont.
1982. Evaluation of the Lectro Clear electrocoagulation process for meat packing wastewater treatment. A report submitted by Western Industrial Laboratories Limited. Report No. EPS 4-WP-82- I, Envi- ronmental Protection Service, Environment Canada, Ottawa, Ont.
FORSTER, C. G. 1984. The potential of anaerobic digestion for treating liquid wastes. Water Pollution Control, 83(4): 484 -490.
HARRISON, J. T. 1989. Slaughterhouse effluent treatment using an anaerobic filter. M.Sc. thesis, University of Regina, Regina, Sask.
HENZE, M., and HARREMOES, P. 1983. Anaerobic treatment of wastewater in fixed film reactors - a literature review. Water Science and Technology, 15: 1 - 10 1.
KENNEDY, K. J., and DROSTE, R. L. 1985. Startup of anaerobic down- flow stationary fixed film (DSFF) reactors. Biotechnology and Bioengineering, 29: 1 152 - 1 165.
LEVENSPIEL, 0, 1972. Chemical reaction engineering. 2nd ed. John Wiley and Sons, New York, NY.
SALKINOJA-SALONEN, M. S., NYNS, E. J., SUTTON, P. M., VAN DEN
BERG, L., and WHEATLEY, A. D. 1983. Starting-up of an anaerobic fixed-film reactor. Water Science and Technology, 15: 305 -308.
SATYANARAYAN, S., KAUL, S. N., DESHPANDE, C. V., BADRINATH, S. D., GADKARI, S. K., and DESHPANDE, V. P. 1985. Evaluation of kinetic parameters for various wastewaters using anaerobic fixed film fixed bed reactor. Indian Association of Water Pollution Con- trol Technical Annual, XII, pp. 8- 17.
SATYANARAYAN, S., MAKHIJANI, S. D., WATE, S. R., and SUBRAH- MANYAM, P. V. R. 1981. Slaughterhouse wastewater - a potential energy source. Proceedings of the International Seminar of Women Engineers and Scientists, Bombay, India.
SAYED, S., DE ZEEUW, W., and LETTINGA, G. 1984. Anaerobic treat- ment of slaughterhouse waste using a flocculant sludge UASB reac- tor. Agricultural Wastes, 2: 197-226.
SAYED, S., VAN CAMPEN, L., and LETTINGA, G. 1987. Anaerobic treatment of slaughterhouse waste using a granular sludge UASB reactor. Biological Wastes, 21: 1 1 -28.
SCHMID, L. A. 1981. Pilot study of an anaerobic filter for pretreat- ment of packinghouse wastewater. M.Sc. thesis, University of Nebraska-Lincoln, Lincoln, NE.
SCHROEPFER, G. J., and ZIEMKE, N. R. 1959. Development of the anaerobic contact process: I. pilot plant investigations and eco- nomics. Sewage and Industrial Wastes, 31(2): 164- 190.
SCHROEPFER, G. J., FULLEN, W. J., JOHNSON, A. S., ZIEMKE, N. R., and ANDERSON, J. J. 1955. The anaerobic contact process as applied to packinghouse wastes. Sewage and Industrial Wastes, 27(4): 460-486.
STEFFEN, A. J. 1961. Operating experiences in anaerobic treatment of packinghouse wastes. Proceedings of the 3rd Research Confer- ence, American Meat Institute, Chicago, IL.
U.S. EPA. 1983. Methods for chemical analysis of water and wastes. EPA-60014-79-020 (revised), United States Environmental Protec- tion Agency, Cincinnati, OH.
VANDERPOST, J. M., and BELL, J. B. 1977. Bacteriological investiga- tion of Alberta meat-packing plant wastes with emphasis on Salmon- ella isolation. Applied and Environmental Microbiology, 33(3): 538-545.
YAN-JIN, Z., and WEI-GUO, W. 1985. A study of meat packing plant wastewater treatment with upflow anaerobic sludge blanket process. Proceedings of the Fourth International Symposium on Anaerobic Digestion, Guangzhou, China.
YOUNG, J. C., and DAHAB, M. F. 1983. Effect of media design on the performance of fixed-bed anaerobic reactors. Water Science Tech- nology, 15: 369-383.
YOUNG, J. C., and MCCARTY, P. L. 1968. The anaerobic filter for waste treatment. Technical Report No. 87, Department of Civil Engineering, Stanford University, Stanford, CA.
1969. The anaerobic filter for waste treatment. Journal of the Water Pollution Control Federation, 41(5): R160-R 173.
YOUNG, C. Y., and YANG, B. S. 1989. Design considerations for full- scale anaerobic filters. Journal of the Water Pollution Control Fed- eration, 61(9): 1576- 1587.
YOUNG, H. W., and YOUNG, J. C. 1988. Hydraulic characteristics of upflow anaerobic filters. Journal of Environmental Engineering, 114(3): 62 1 -637.
Can
. J. C
iv. E
ng. D
ownl
oade
d fr
om w
ww
.nrc
rese
arch
pres
s.co
m b
y U
nive
rsity
of
Wes
tern
Ont
ario
on
11/1
2/14
For
pers
onal
use
onl
y.