traverse knowledge base article interactive views...
TRANSCRIPT
TRAVERSE Knowledge Base Article Interactive Views Tutorial
Page 2
This document describes the intended features and technology for TRAVERSE 11 as of November, 2016.
Features and technology are subject to change and there is no guarantee that any particular feature or
technology described in this presentation will be present in this or subsequent versions of TRAVERSE.
November 2016
©Copyright 2016 Open Systems Holdings Corp. All rights reserved. OPEN SYSTEMS and TRAVERSE are registered trademarks of Open Systems Holdings Corp. All other marks are trademarks or registered trademarks of their respective holders.

TRAVERSE Knowledge Base Article Interactive Views Tutorial
Page 3
Contents
Introduction .................................................................................................................................................. 4
Parts of an Interactive View .......................................................................................................................... 5
Using the Data Filter ..................................................................................................................................... 6
Filter Conditionals ..................................................................................................................................... 6
Using And .................................................................................................................................................. 7
Using OR .................................................................................................................................................... 7
Grouping Data ............................................................................................................................................... 8
Group Data by a Single Column ................................................................................................................ 8
Group Data by Multiple Columns ............................................................................................................. 9
Organizing Data in Ascending and Descending Order .............................................................................. 9
Customizing Column Display ....................................................................................................................... 10
Filter Data by Selection ............................................................................................................................... 11
Show All Entries with a Blank Value ........................................................................................................ 11
Show All Entries that are Not Blank ........................................................................................................ 11
Show All Entries with a Selected Value ................................................................................................... 12
Create a Custom Selection Filter ............................................................................................................. 12
Named Views .............................................................................................................................................. 14
Save Named View ................................................................................................................................... 14
Edit Views ................................................................................................................................................ 14
Delete Named Views ............................................................................................................................... 15
Open a Named View ............................................................................................................................... 15
Print or Export a Report .............................................................................................................................. 16
Print the Report Data .............................................................................................................................. 16
Export the Report Data ........................................................................................................................... 16
TRAVERSE Knowledge Base Article Interactive Views Tutorial
Page 4
Introduction
TRAVERSE Interactive Views display information in an interactive format. These highly-configurable data
screens allow you to sort, group, and output information according to your unique needs. An interactive
view is like an inquiry screen you can customize to show the information you want to see.
TRAVERSE Knowledge Base Article Interactive Views Tutorial
Page 5
Parts of an Interactive View
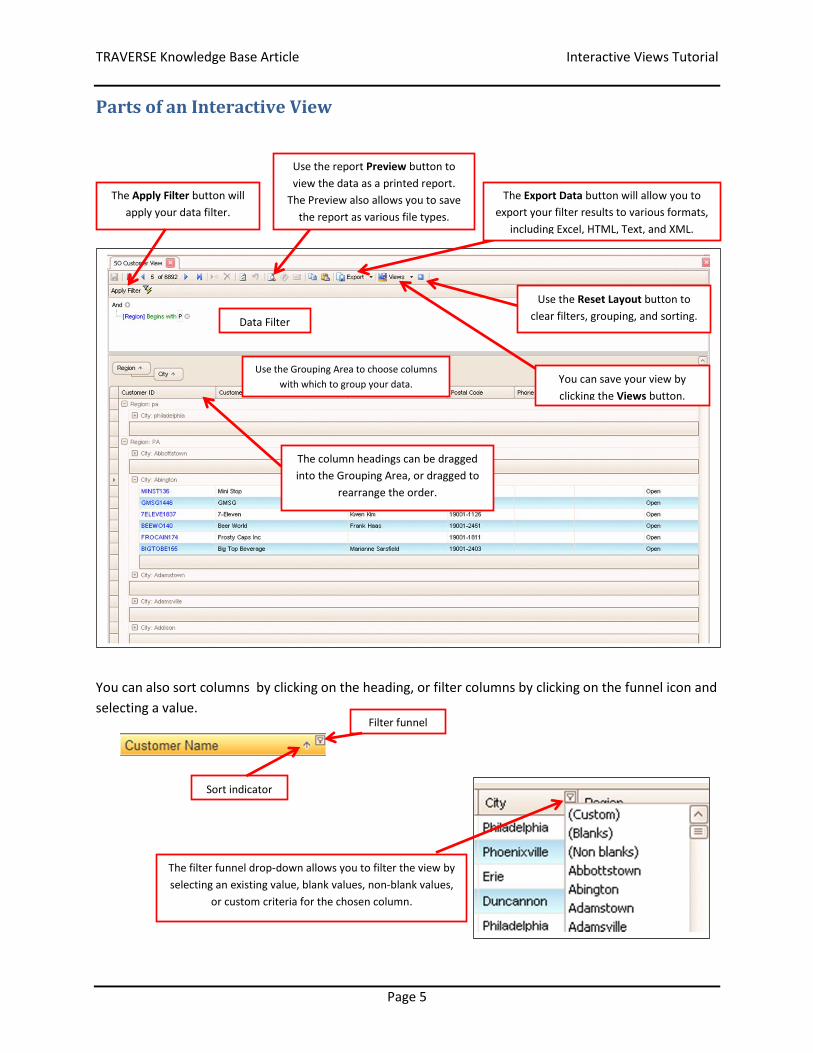
You can also sort columns by clicking on the heading, or filter columns by clicking on the funnel icon and
selecting a value.
You can save your view by
clicking the Views button.
Use the Grouping Area to choose columns
with which to group your data.
The column headings can be dragged
into the Grouping Area, or dragged to
rearrange the order.
Data Filter
Use the Reset Layout button to
clear filters, grouping, and sorting.
The Apply Filter button will
apply your data filter.
The Export Data button will allow you to
export your filter results to various formats,
including Excel, HTML, Text, and XML.
Use the report Preview button to
view the data as a printed report.
The Preview also allows you to save
the report as various file types.
Sort indicator
Filter funnel
The filter funnel drop-down allows you to filter the view by
selecting an existing value, blank values, non-blank values,
or custom criteria for the chosen column.
TRAVERSE Knowledge Base Article Interactive Views Tutorial
Page 6
Using the Data Filter
Use the Data Filter to reduce the amount of data that needs to be pulled to your workstation. This is
important when there is a large amount of data available to reduce network traffic and speed up the
retrieval of data.
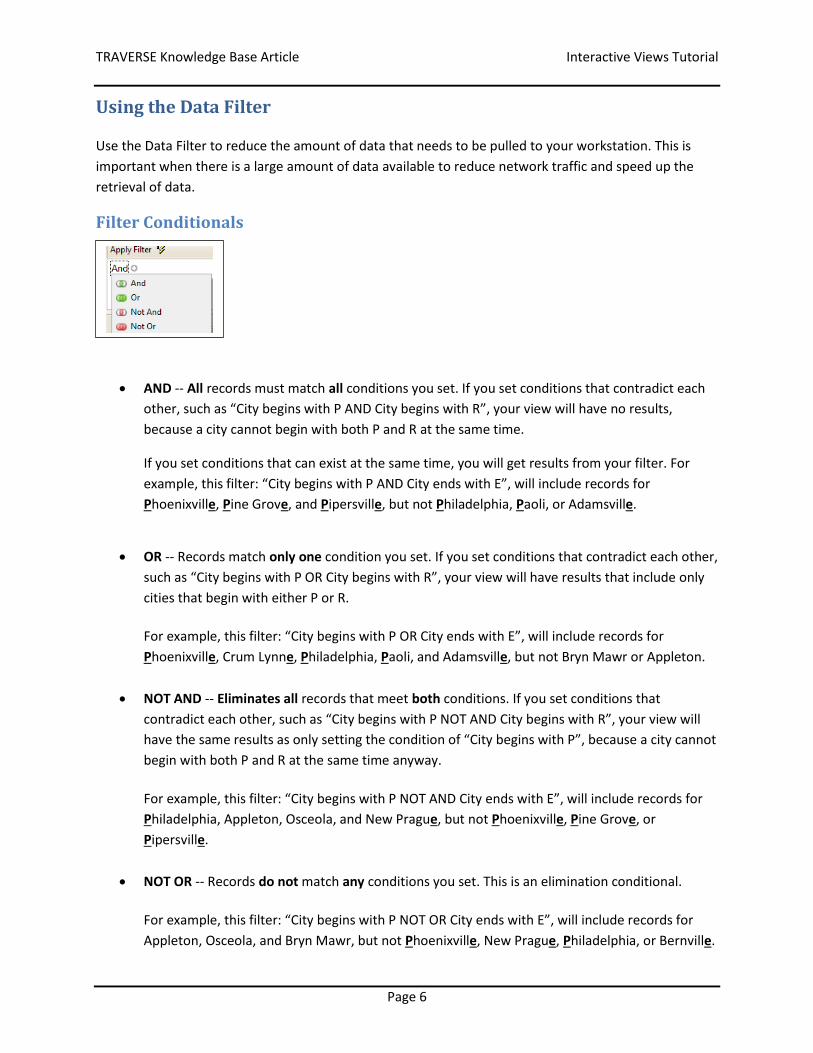
Filter Conditionals
AND -- All records must match all conditions you set. If you set conditions that contradict each
other, such as “City begins with P AND City begins with R”, your view will have no results,
because a city cannot begin with both P and R at the same time.
If you set conditions that can exist at the same time, you will get results from your filter. For
example, this filter: “City begins with P AND City ends with E”, will include records for
Phoenixville, Pine Grove, and Pipersville, but not Philadelphia, Paoli, or Adamsville.
OR -- Records match only one condition you set. If you set conditions that contradict each other,
such as “City begins with P OR City begins with R”, your view will have results that include only
cities that begin with either P or R.
For example, this filter: “City begins with P OR City ends with E”, will include records for
Phoenixville, Crum Lynne, Philadelphia, Paoli, and Adamsville, but not Bryn Mawr or Appleton.
NOT AND -- Eliminates all records that meet both conditions. If you set conditions that
contradict each other, such as “City begins with P NOT AND City begins with R”, your view will
have the same results as only setting the condition of “City begins with P”, because a city cannot
begin with both P and R at the same time anyway.
For example, this filter: “City begins with P NOT AND City ends with E”, will include records for
Philadelphia, Appleton, Osceola, and New Prague, but not Phoenixville, Pine Grove, or
Pipersville.
NOT OR -- Records do not match any conditions you set. This is an elimination conditional.
For example, this filter: “City begins with P NOT OR City ends with E”, will include records for
Appleton, Osceola, and Bryn Mawr, but not Phoenixville, New Prague, Philadelphia, or Bernville.
TRAVERSE Knowledge Base Article Interactive Views Tutorial
Page 7
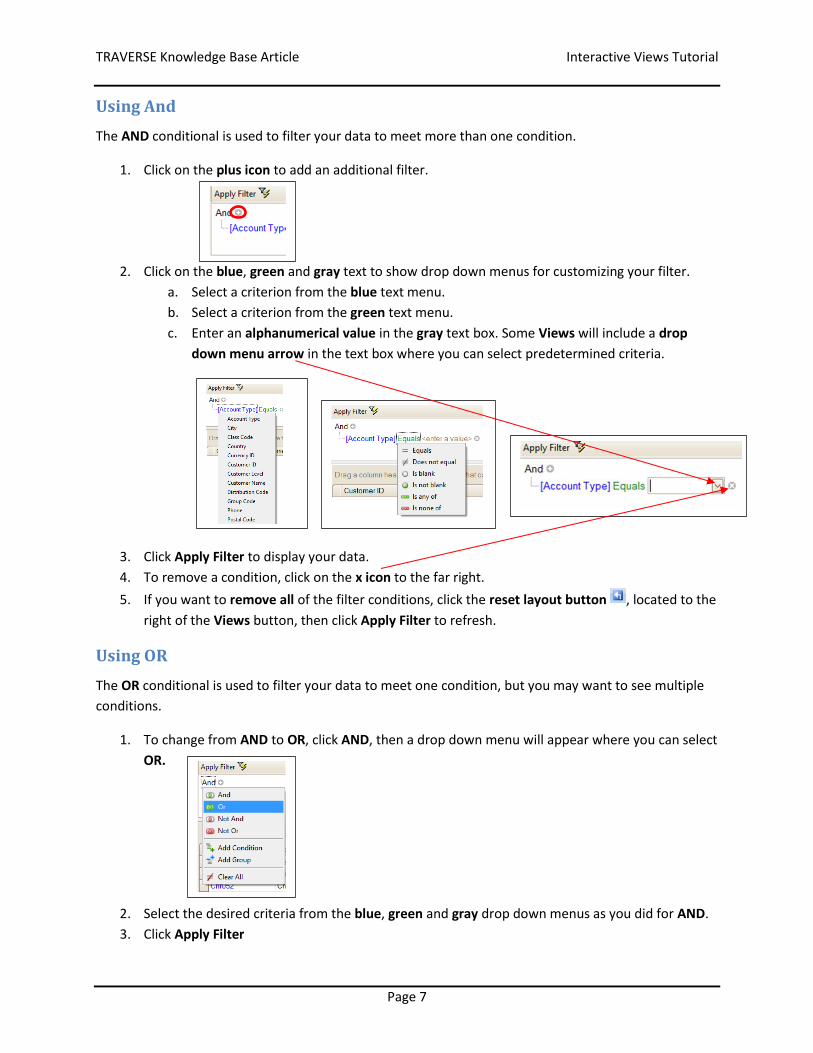
Using And
The AND conditional is used to filter your data to meet more than one condition.
1. Click on the plus icon to add an additional filter.
2. Click on the blue, green and gray text to show drop down menus for customizing your filter.
a. Select a criterion from the blue text menu.
b. Select a criterion from the green text menu.
c. Enter an alphanumerical value in the gray text box. Some Views will include a drop
down menu arrow in the text box where you can select predetermined criteria.
3. Click Apply Filter to display your data.
4. To remove a condition, click on the x icon to the far right.
5. If you want to remove all of the filter conditions, click the reset layout button , located to the
right of the Views button, then click Apply Filter to refresh.
Using OR
The OR conditional is used to filter your data to meet one condition, but you may want to see multiple
conditions.
1. To change from AND to OR, click AND, then a drop down menu will appear where you can select
OR.
2. Select the desired criteria from the blue, green and gray drop down menus as you did for AND.
3. Click Apply Filter
TRAVERSE Knowledge Base Article Interactive Views Tutorial
Page 8
Grouping Data
Group the data by column to change how the information is organized.
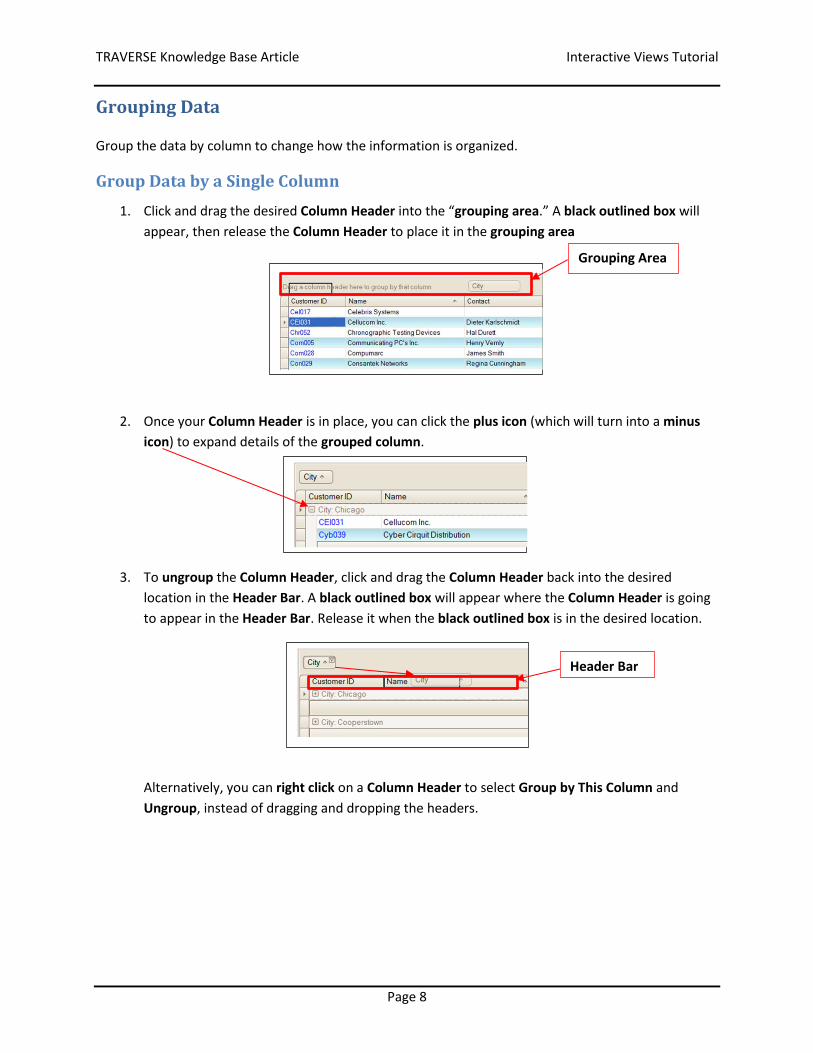
Group Data by a Single Column
1. Click and drag the desired Column Header into the “grouping area.” A black outlined box will
appear, then release the Column Header to place it in the grouping area
2. Once your Column Header is in place, you can click the plus icon (which will turn into a minus
icon) to expand details of the grouped column.
3. To ungroup the Column Header, click and drag the Column Header back into the desired
location in the Header Bar. A black outlined box will appear where the Column Header is going
to appear in the Header Bar. Release it when the black outlined box is in the desired location.
Alternatively, you can right click on a Column Header to select Group by This Column and
Ungroup, instead of dragging and dropping the headers.
Grouping Area
Header Bar
TRAVERSE Knowledge Base Article Interactive Views Tutorial
Page 9
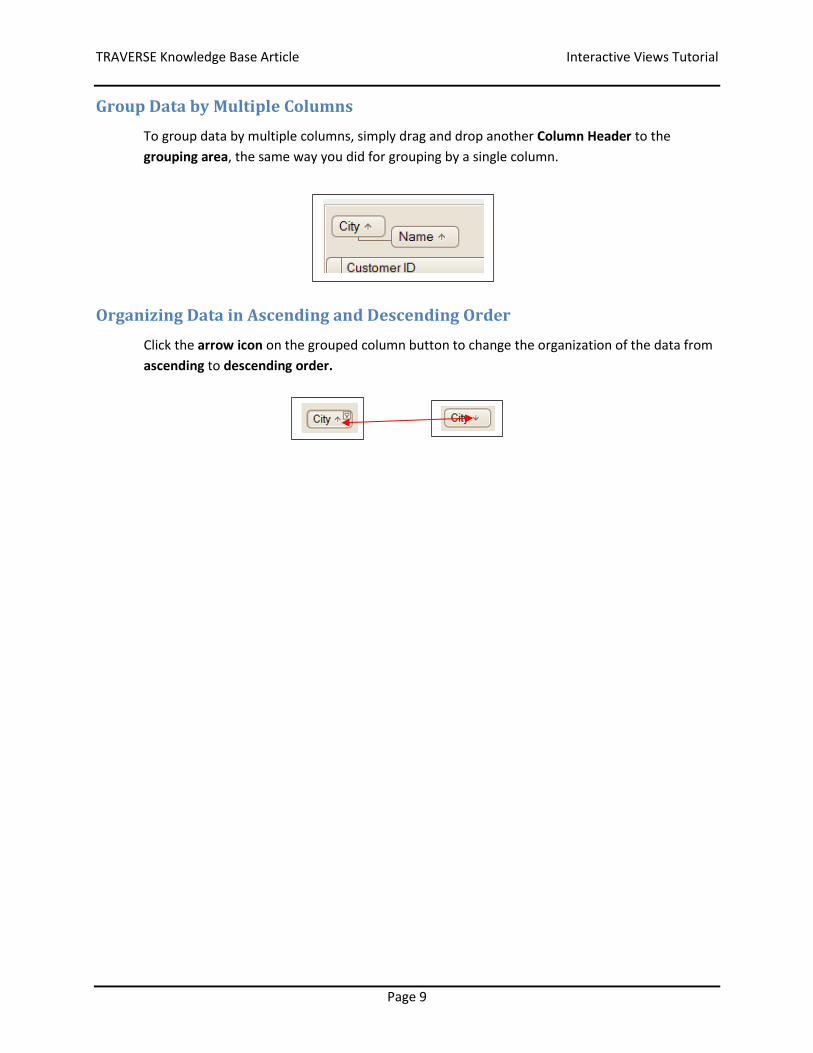
Group Data by Multiple Columns
To group data by multiple columns, simply drag and drop another Column Header to the
grouping area, the same way you did for grouping by a single column.
Organizing Data in Ascending and Descending Order
Click the arrow icon on the grouped column button to change the organization of the data from
ascending to descending order.
TRAVERSE Knowledge Base Article Interactive Views Tutorial
Page 10
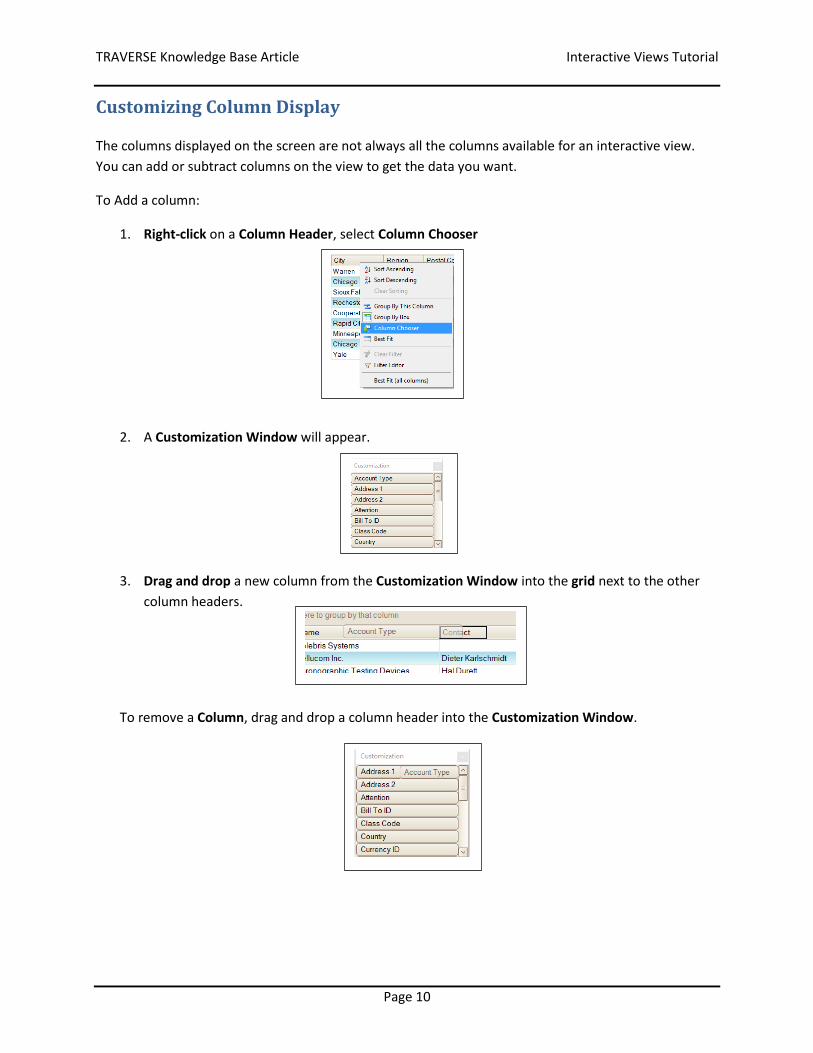
Customizing Column Display
The columns displayed on the screen are not always all the columns available for an interactive view.
You can add or subtract columns on the view to get the data you want.
To Add a column:
1. Right-click on a Column Header, select Column Chooser
2. A Customization Window will appear.
3. Drag and drop a new column from the Customization Window into the grid next to the other
column headers.
To remove a Column, drag and drop a column header into the Customization Window.
TRAVERSE Knowledge Base Article Interactive Views Tutorial
Page 11
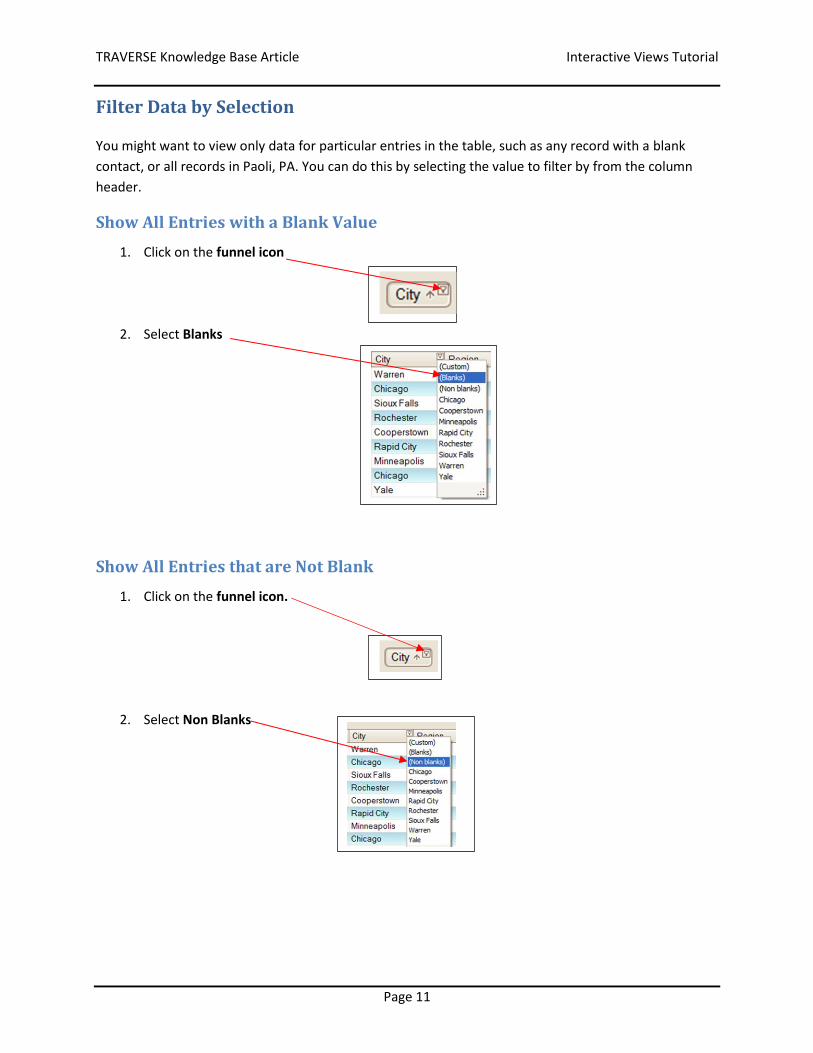
Filter Data by Selection
You might want to view only data for particular entries in the table, such as any record with a blank
contact, or all records in Paoli, PA. You can do this by selecting the value to filter by from the column
header.
Show All Entries with a Blank Value
1. Click on the funnel icon
2. Select Blanks
Show All Entries that are Not Blank
1. Click on the funnel icon.
2. Select Non Blanks
TRAVERSE Knowledge Base Article Interactive Views Tutorial
Page 12
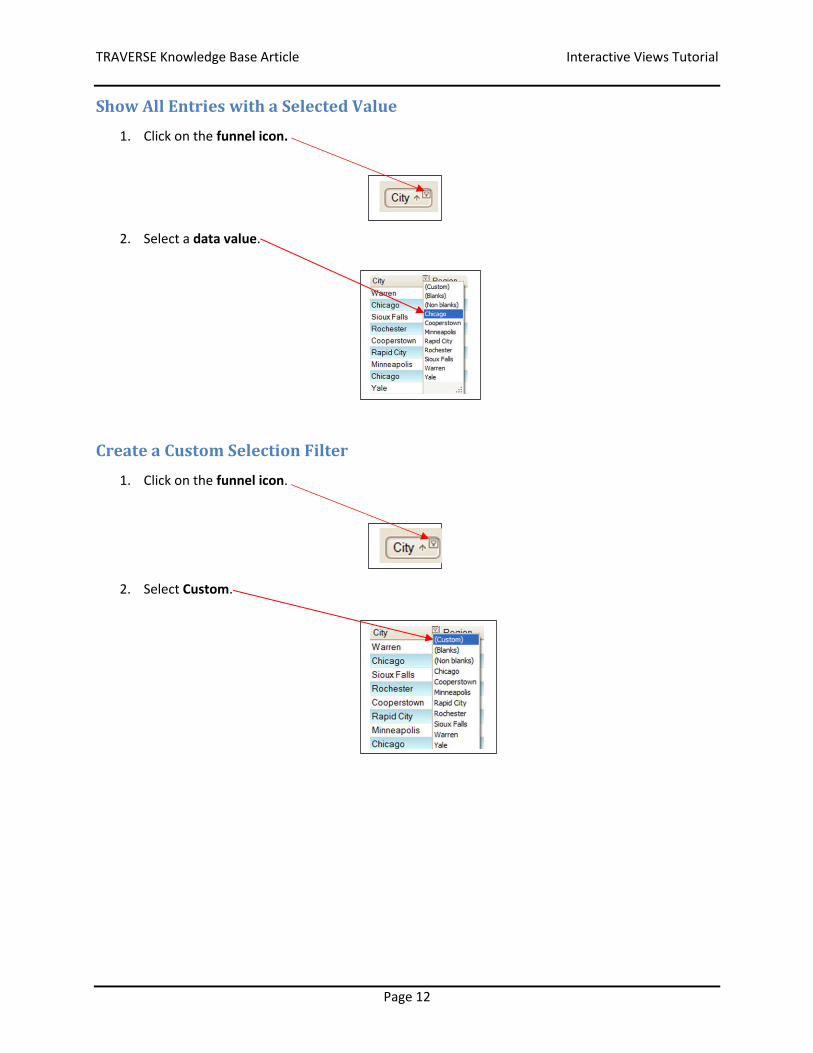
Show All Entries with a Selected Value
1. Click on the funnel icon.
2. Select a data value.
Create a Custom Selection Filter
1. Click on the funnel icon.
2. Select Custom.
TRAVERSE Knowledge Base Article Interactive Views Tutorial
Page 13
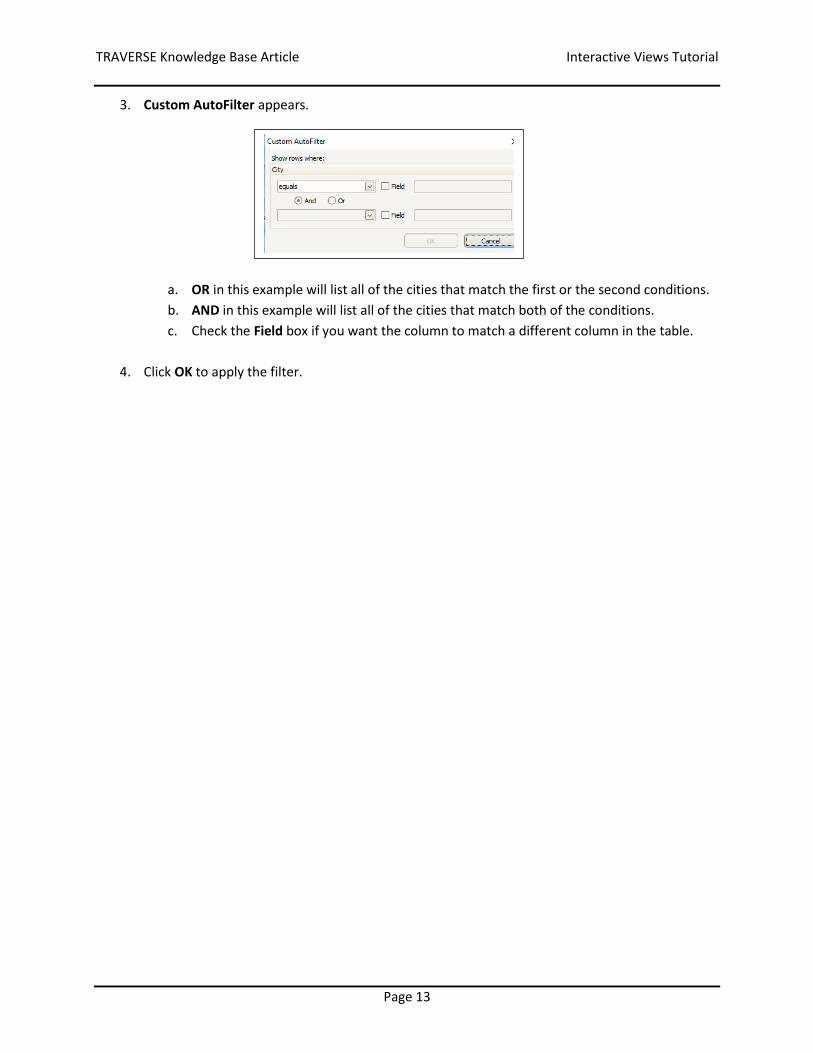
3. Custom AutoFilter appears.
a. OR in this example will list all of the cities that match the first or the second conditions.
b. AND in this example will list all of the cities that match both of the conditions.
c. Check the Field box if you want the column to match a different column in the table.
4. Click OK to apply the filter.
TRAVERSE Knowledge Base Article Interactive Views Tutorial
Page 14
Named Views
When you have an interactive view set up with the criteria you want, and would like to save that view
for future use, you can create a named view.
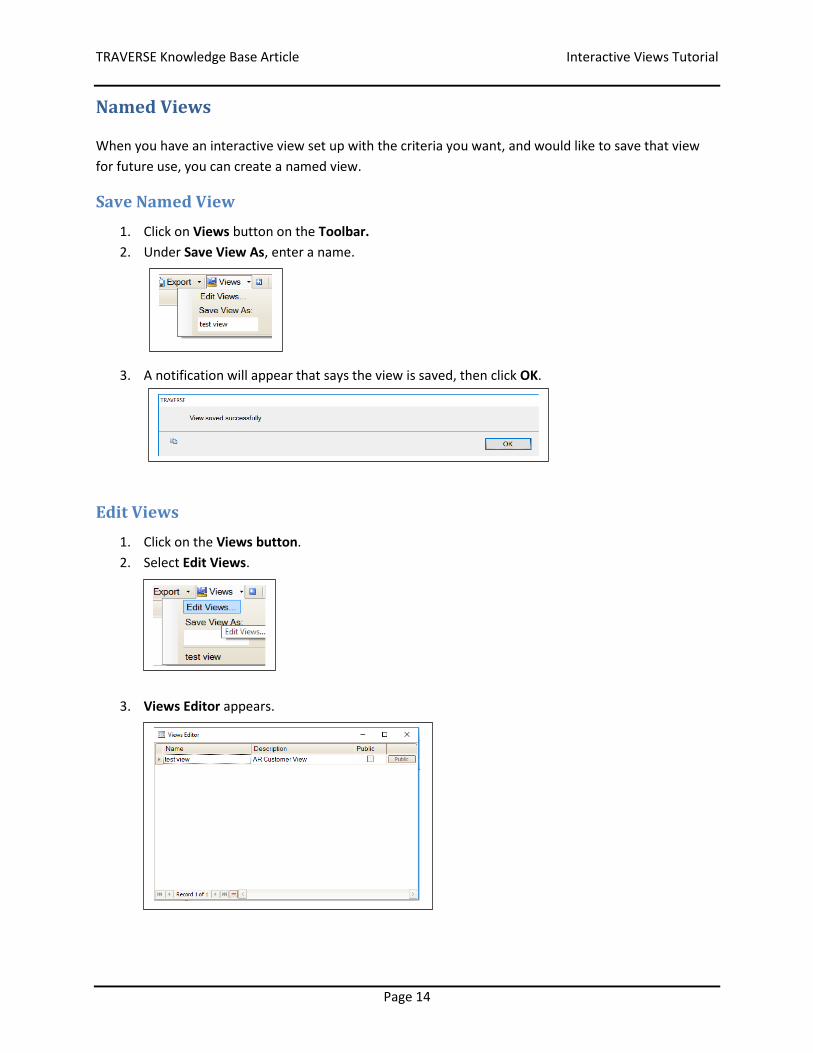
Save Named View
1. Click on Views button on the Toolbar.
2. Under Save View As, enter a name.
3. A notification will appear that says the view is saved, then click OK.
Edit Views
1. Click on the Views button.
2. Select Edit Views.
3. Views Editor appears.
TRAVERSE Knowledge Base Article Interactive Views Tutorial
Page 15
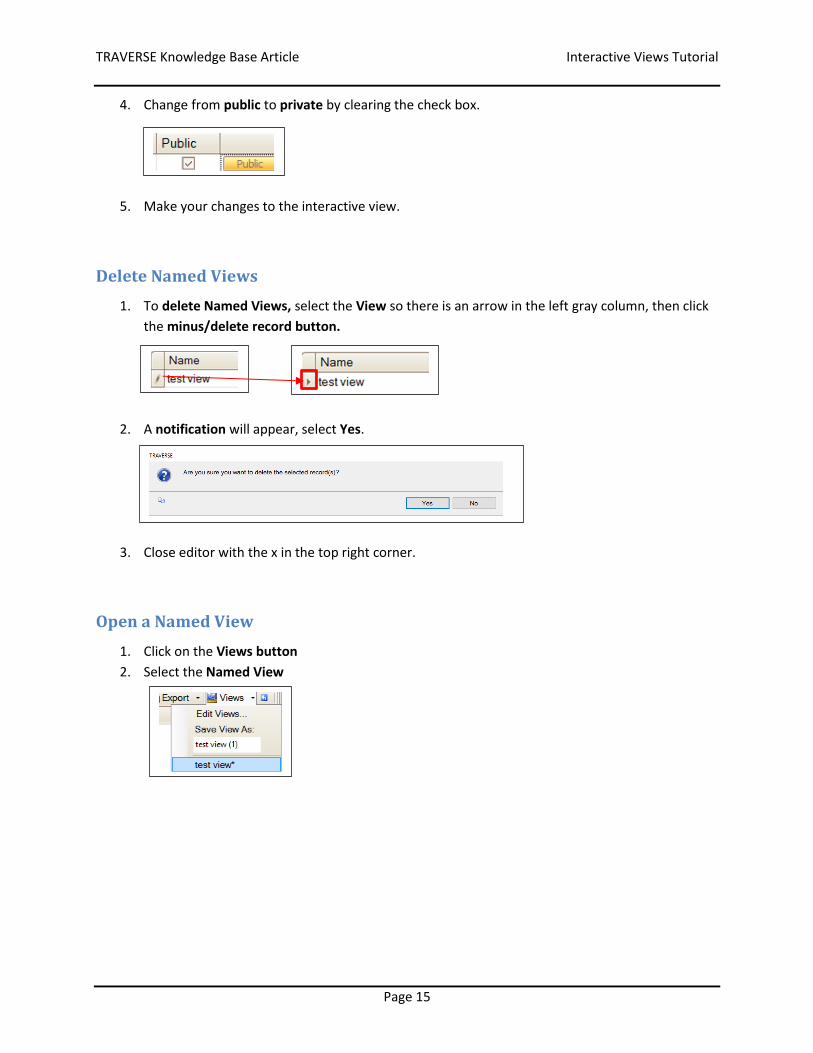
4. Change from public to private by clearing the check box.
5. Make your changes to the interactive view.
Delete Named Views
1. To delete Named Views, select the View so there is an arrow in the left gray column, then click
the minus/delete record button.
2. A notification will appear, select Yes.
3. Close editor with the x in the top right corner.
Open a Named View
1. Click on the Views button
2. Select the Named View
TRAVERSE Knowledge Base Article Interactive Views Tutorial
Page 16
Print or Export a Report
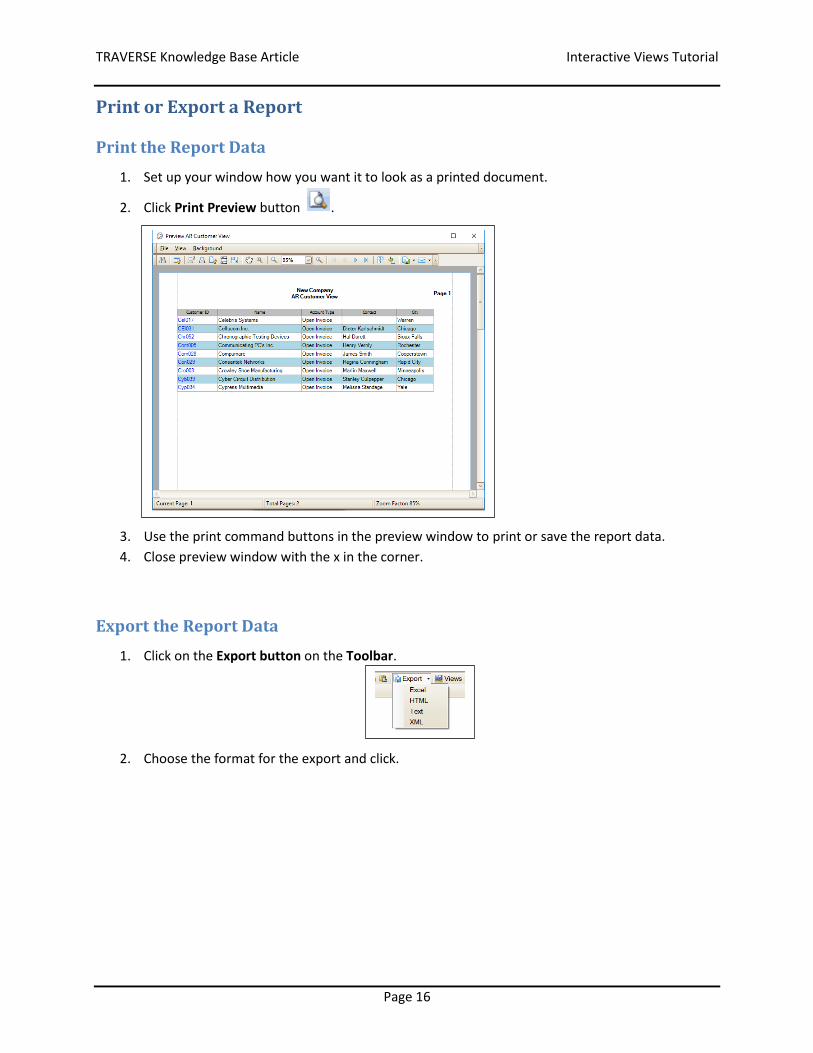
Print the Report Data
1. Set up your window how you want it to look as a printed document.
2. Click Print Preview button .
3. Use the print command buttons in the preview window to print or save the report data.
4. Close preview window with the x in the corner.
Export the Report Data
1. Click on the Export button on the Toolbar.
2. Choose the format for the export and click.