transportation - new york...
TRANSCRIPT
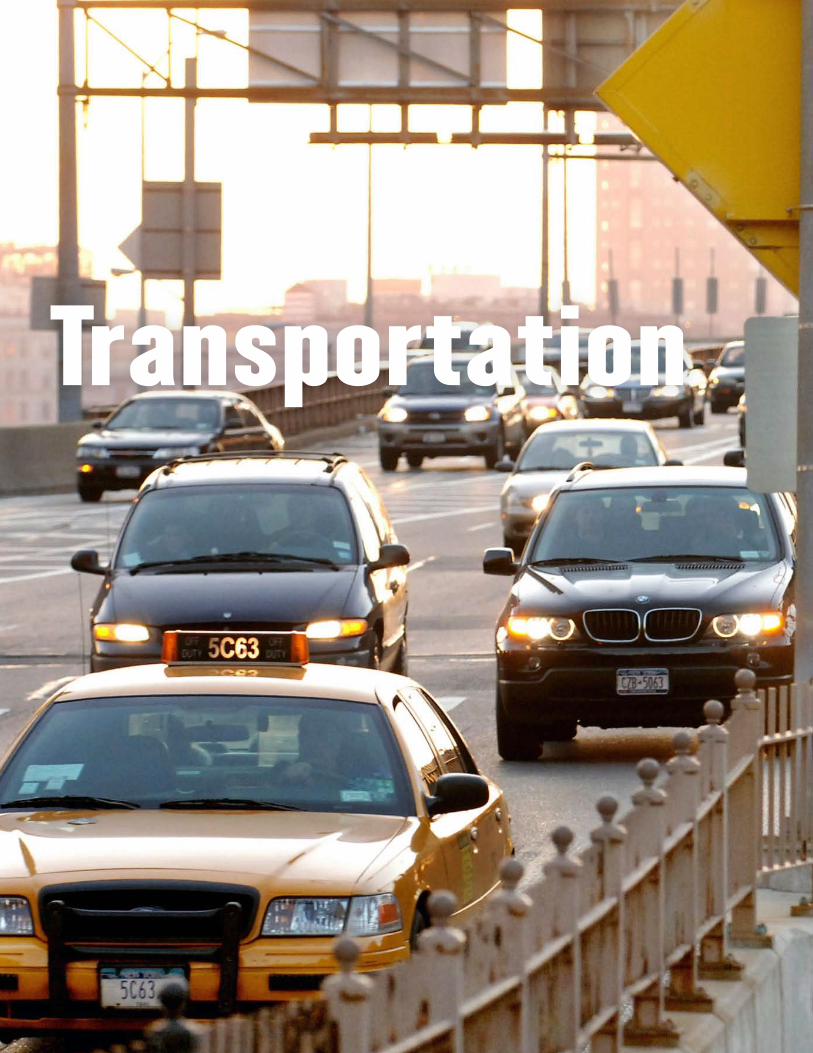
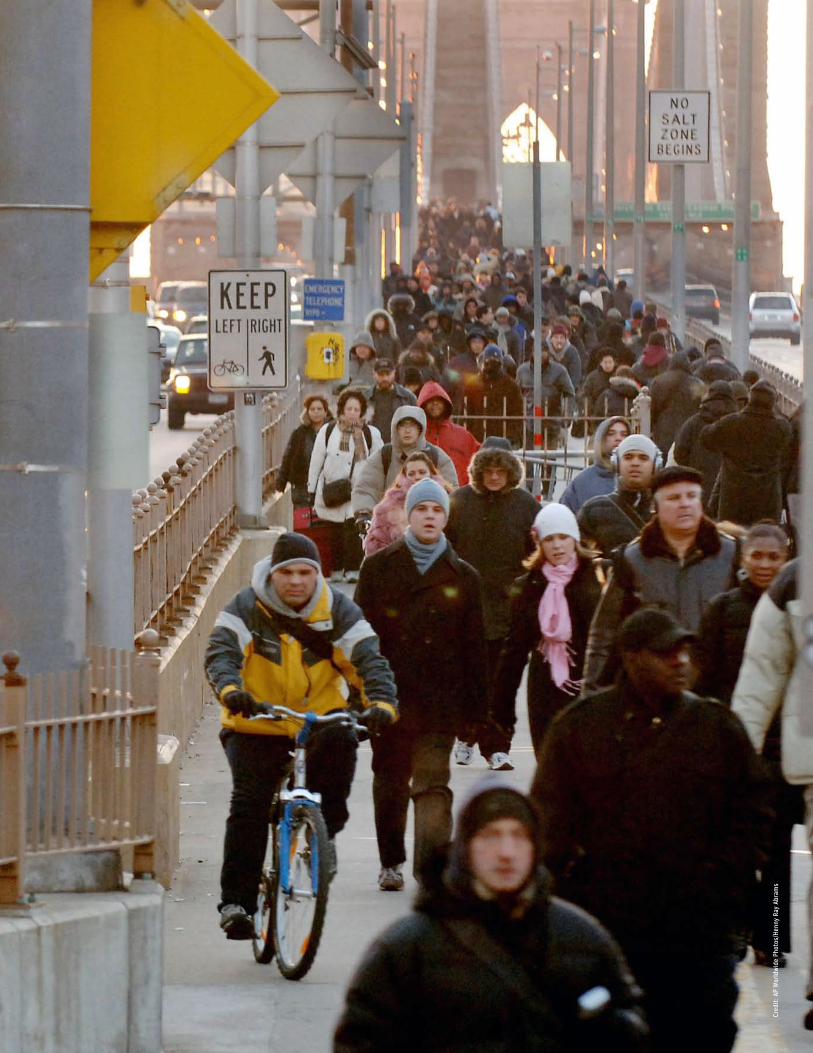
Transportation
Cred
it: A
P W
orld
wid
e Ph
otos
/Hen
ny R
ay A
bram
s
Transportation

Together we canImprove and expand sustainable transportation infrastructure and options
Reduce congestion on our roads, bridges, and at our airports
Maintain and improve the physical condition of our roads and transit system
89A GREENER, GREATER NEW YORK PLANYC
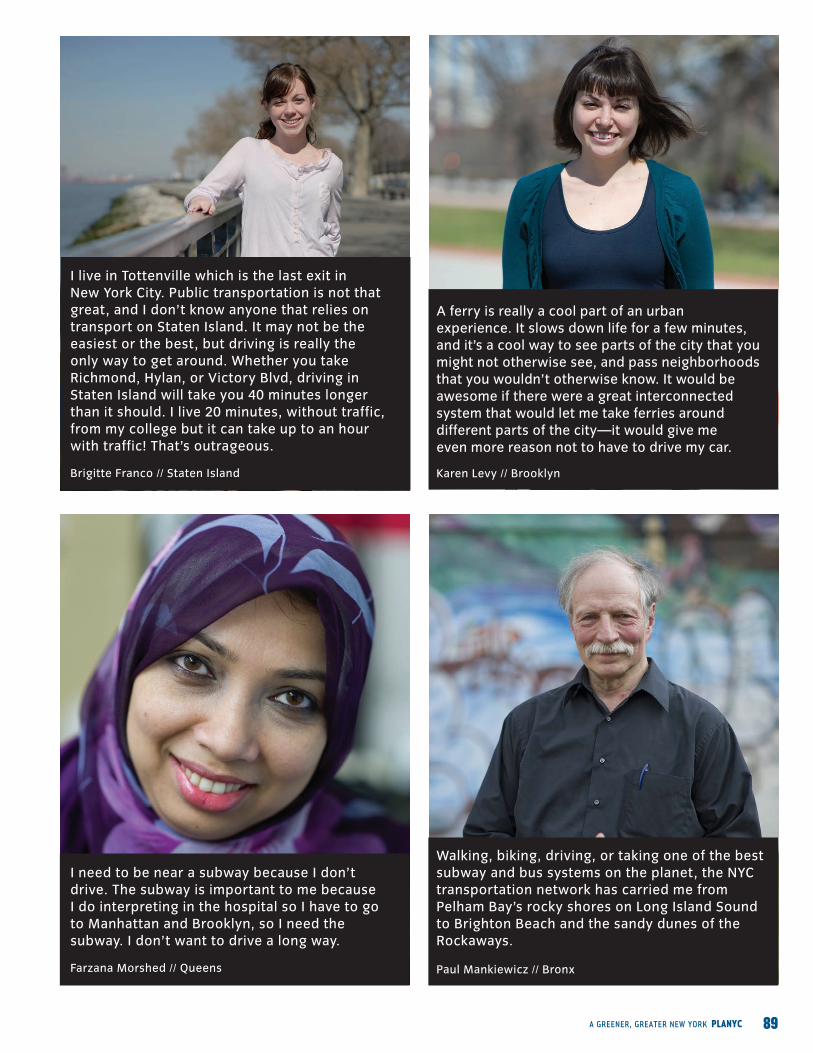
Karen Levy // Brooklyn
Paul Mankiewicz // Bronx
Brigitte Franco // Staten Island
I live in Tottenville which is the last exit in New York City. Public transportation is not that great, and I don’t know anyone that relies on transport on Staten Island. It may not be the easiest or the best, but driving is really the only way to get around. Whether you take Richmond, Hylan, or Victory Blvd, driving in Staten Island will take you 40 minutes longer than it should. I live 20 minutes, without traffic, from my college but it can take up to an hour with traffic! That’s outrageous.
A ferry is really a cool part of an urban experience. It slows down life for a few minutes, and it’s a cool way to see parts of the city that you might not otherwise see, and pass neighborhoods that you wouldn’t otherwise know. It would be awesome if there were a great interconnected system that would let me take ferries around different parts of the city—it would give me even more reason not to have to drive my car.
I need to be near a subway because I don’t drive. The subway is important to me because I do interpreting in the hospital so I have to go to Manhattan and Brooklyn, so I need the subway. I don’t want to drive a long way.
Walking, biking, driving, or taking one of the best subway and bus systems on the planet, the NYC transportation network has carried me from Pelham Bay’s rocky shores on Long Island Sound to Brighton Beach and the sandy dunes of the Rockaways.
Farzana Morshed // Queens

90 TRANSPORTATION
Transportation systems shape a city’s growth and prosperity. New York City has benefited from billions of dollars of past investments in our bridges, tunnels, roads and subways. Those investments connected New York to the world and channeled development throughout the five boroughs. The shape and reach of our transpor-tation system helped determine how and where we live and work today.
To support a vibrant economy now and for the future, we must demonstrate a similar commit-ment and maintain and expand our transpor-tation assets. We must also actively manage our infrastructure to its highest return on investment. Our strategies must focus on our key transportation needs: handling increased demand from population and job growth; opti-mizing the speed, safety, reliability and comfort across modes; and managing the flow of goods into, out of, and around our city.
New York City’s transportation network—our roads, bridges, tunnels, subways, commuter rails, buses, taxis, sidewalks, airports, train sta-tions, and ferries—moves more people and goods than any other system in the country. The system performs remarkably well, considering the sheer number of people and tons of things being moved and the myriad of federal, regional, state, local, and private sector transportation agencies and entities involved. But in many ways, we still face significant challenges.
Many New Yorkers have long, unreliable, or crowded commutes. Our transit system faces large budget shortfalls. Our ability to add capac-ity is limited. The cost of distributing freight is high compared to other cities. And our passen-ger and freight gateways to the rest of the nation and world are not worthy of a global city.
Failing to address these issues imposes a cost on all New Yorkers. The Partnership for New York City estimates that traffic congestion, including reduced productivity, increased shipping times, and pollution-related health problems, costs the New York region more than $13 billion per year.
In addition to capacity constraints, our infra-structure is also aging. At a time when transpor-tation investment by state and federal govern-ments is declining, we must find ways to invest in maintenance to keep the network reliable. While we are working with state, federal, and regional agencies for a comprehensive solution, we will continue to take innovative incremental steps to improve the portions of the transportation net-work directly under the City’s jurisdiction.
Even in the face of chronic budget shortfalls, we have shown we can find new ways to keep the network reliable and increase the performance of its assets.
Through innovative strategies we have strength-ened and expanded transportation choices throughout the city. We partnered with the Metropolitan Transportation Authority (MTA) to launch the first bus rapid transit lines—Select Bus Service (SBS). The city’s bike network has nearly doubled. We made it easier and safer to walk with the Safe Routes to Transit, Safe Routes to Schools, and Safe Streets for Seniors programs. Projects like Green Light for Midtown have simplified traffic patterns, improved pedes-trian safety, and created new public plazas throughout the city.
To reduce congestion, we installed more than 4,500 Muni-Meters, increasing capacity for curb-side parking. We launched Park Smart, a pilot program that promotes parking turnover in busy commercial areas. The City and the MTA also secured state approval to continue using red light cameras to enforce traffic laws and install cameras on buses to ticket drivers who block dedicated bus lanes.
We used one-time federal stimulus funding stra-tegically to begin 31 major repair projects on our transportation network, including upgrades to the St. George Ferry Terminal in Staten Island and rehabilitation of the Brooklyn Bridge.
Expand sustainable transportation
choices and ensure the reliability and high quality of our
transportation network
Transportation
91A GREENER, GREATER NEW YORK PLANYC
150
140
130
120
110
100
90
1997
1996
1995
1994
1993
2002
2001
2000
1999
1998
2007
2006
2005
2004
2003
2009
2008
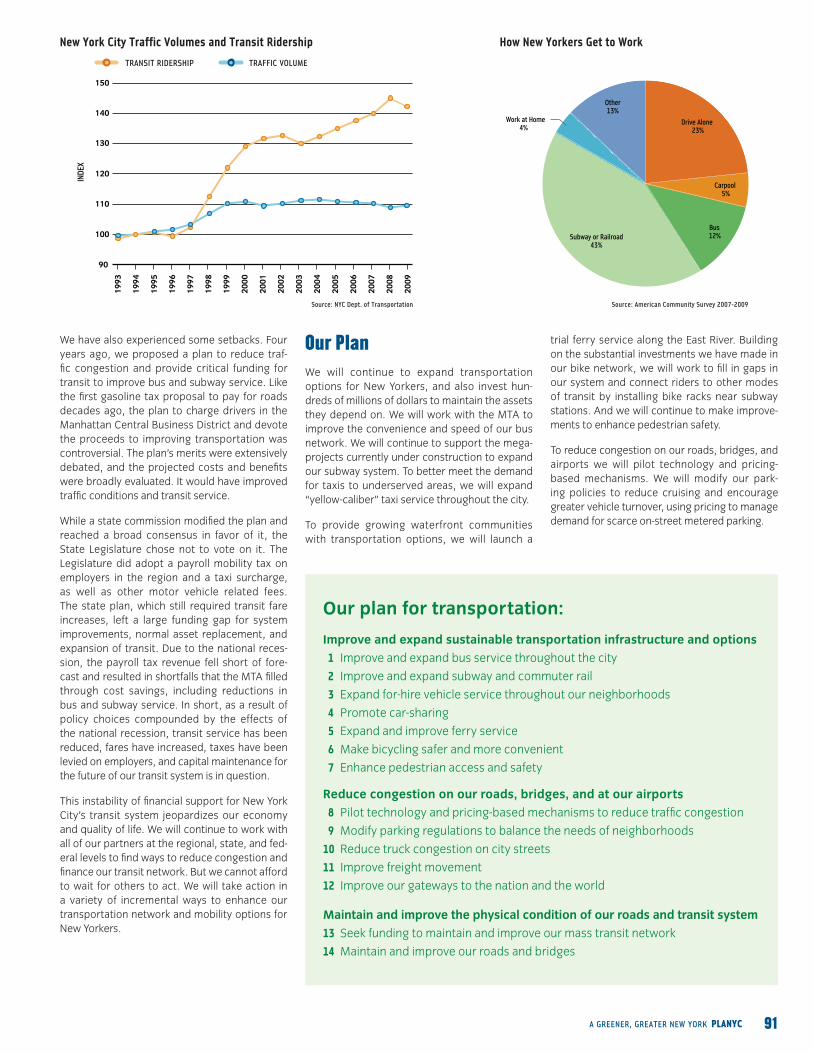
TRAFFIC VOLUMETRANSIT RIDERSHIP
Source: NYC Dept. of Transportation Source: American Community Survey 2007-2009
New York City Traffic Volumes and Transit Ridership How New Yorkers Get to Work
We have also experienced some setbacks. Four years ago, we proposed a plan to reduce traf-fic congestion and provide critical funding for transit to improve bus and subway service. Like the first gasoline tax proposal to pay for roads decades ago, the plan to charge drivers in the Manhattan Central Business District and devote the proceeds to improving transportation was controversial. The plan’s merits were extensively debated, and the projected costs and benefits were broadly evaluated. It would have improved traffic conditions and transit service.
While a state commission modified the plan and reached a broad consensus in favor of it, the State Legislature chose not to vote on it. The Legislature did adopt a payroll mobility tax on employers in the region and a taxi surcharge, as well as other motor vehicle related fees. The state plan, which still required transit fare increases, left a large funding gap for system improvements, normal asset replacement, and expansion of transit. Due to the national reces-sion, the payroll tax revenue fell short of fore-cast and resulted in shortfalls that the MTA filled through cost savings, including reductions in bus and subway service. In short, as a result of policy choices compounded by the effects of the national recession, transit service has been reduced, fares have increased, taxes have been levied on employers, and capital maintenance for the future of our transit system is in question.
This instability of financial support for New York City’s transit system jeopardizes our economy and quality of life. We will continue to work with all of our partners at the regional, state, and fed-eral levels to find ways to reduce congestion and finance our transit network. But we cannot afford to wait for others to act. We will take action in a variety of incremental ways to enhance our transportation network and mobility options for New Yorkers.
Our plan for transportation:
Improve and expand sustainable transportation infrastructure and options
1 Improve and expand bus service throughout the city
2 Improve and expand subway and commuter rail
3 Expand for-hire vehicle service throughout our neighborhoods
4 Promote car-sharing
5 Expand and improve ferry service
6 Make bicycling safer and more convenient
7 Enhance pedestrian access and safety
Reduce congestion on our roads, bridges, and at our airports
8 Pilot technology and pricing-based mechanisms to reduce traffic congestion
9 Modify parking regulations to balance the needs of neighborhoods
10 Reduce truck congestion on city streets
11 Improve freight movement
12 Improve our gateways to the nation and the world
Maintain and improve the physical condition of our roads and transit system
13 Seek funding to maintain and improve our mass transit network
14 Maintain and improve our roads and bridges
Our PlanWe will continue to expand transportation options for New Yorkers, and also invest hun-dreds of millions of dollars to maintain the assets they depend on. We will work with the MTA to improve the convenience and speed of our bus network. We will continue to support the mega-projects currently under construction to expand our subway system. To better meet the demand for taxis to underserved areas, we will expand “yellow-caliber” taxi service throughout the city.
To provide growing waterfront communities with transportation options, we will launch a
trial ferry service along the East River. Building on the substantial investments we have made in our bike network, we will work to fill in gaps in our system and connect riders to other modes of transit by installing bike racks near subway stations. And we will continue to make improve-ments to enhance pedestrian safety.
To reduce congestion on our roads, bridges, and airports we will pilot technology and pricing-based mechanisms. We will modify our park-ing policies to reduce cruising and encourage greater vehicle turnover, using pricing to manage demand for scarce on-street metered parking.
92 TRANSPORTATION
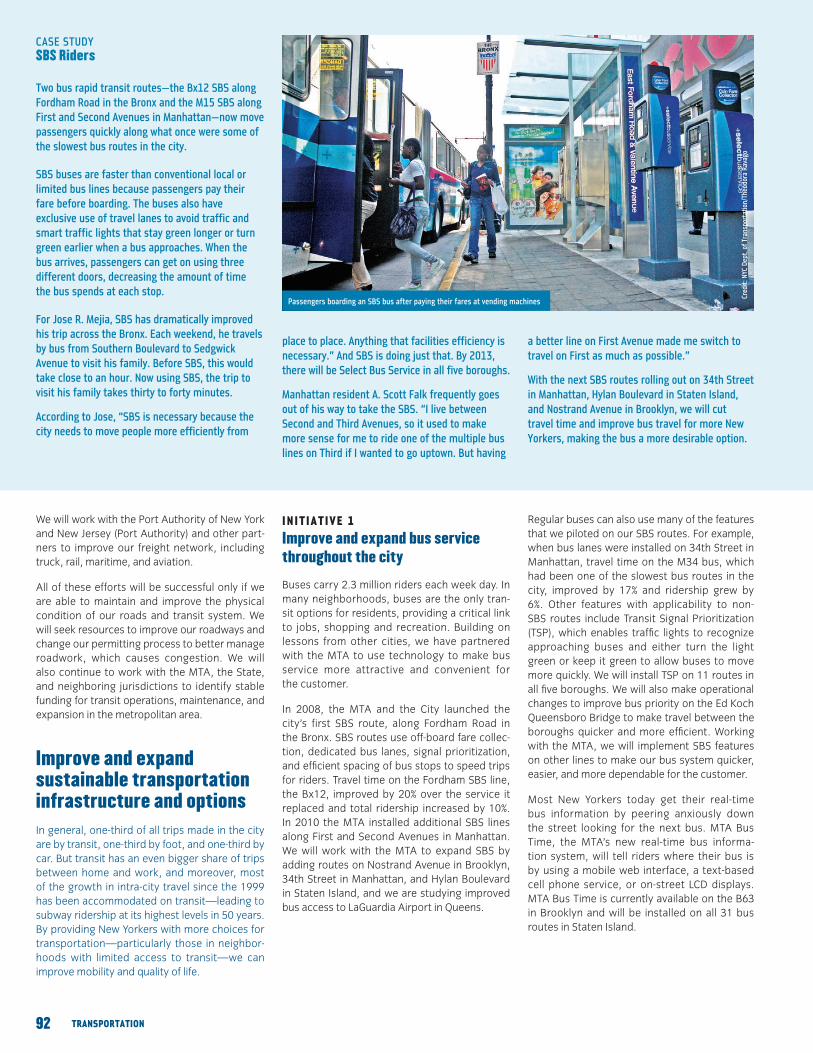
Passengers boarding an SBS bus after paying their fares at vending machines
IN IT IAT IVE 1
Improve and expand bus service throughout the city
Buses carry 2.3 million riders each week day. In many neighborhoods, buses are the only tran-sit options for residents, providing a critical link to jobs, shopping and recreation. Building on lessons from other cities, we have partnered with the MTA to use technology to make bus service more attractive and convenient for the customer.
In 2008, the MTA and the City launched the city’s first SBS route, along Fordham Road in the Bronx. SBS routes use off-board fare collec-tion, dedicated bus lanes, signal prioritization, and efficient spacing of bus stops to speed trips for riders. Travel time on the Fordham SBS line, the Bx12, improved by 20% over the service it replaced and total ridership increased by 10%. In 2010 the MTA installed additional SBS lines along First and Second Avenues in Manhattan. We will work with the MTA to expand SBS by adding routes on Nostrand Avenue in Brooklyn, 34th Street in Manhattan, and Hylan Boulevard in Staten Island, and we are studying improved bus access to LaGuardia Airport in Queens.
We will work with the Port Authority of New York and New Jersey (Port Authority) and other part-ners to improve our freight network, including truck, rail, maritime, and aviation.
All of these efforts will be successful only if we are able to maintain and improve the physical condition of our roads and transit system. We will seek resources to improve our roadways and change our permitting process to better manage roadwork, which causes congestion. We will also continue to work with the MTA, the State, and neighboring jurisdictions to identify stable funding for transit operations, maintenance, and expansion in the metropolitan area.
Improve and expand sustainable transportation infrastructure and optionsIn general, one-third of all trips made in the city are by transit, one-third by foot, and one-third by car. But transit has an even bigger share of trips between home and work, and moreover, most of the growth in intra-city travel since the 1999 has been accommodated on transit—leading to subway ridership at its highest levels in 50 years. By providing New Yorkers with more choices for transportation—particularly those in neighbor-hoods with limited access to transit—we can improve mobility and quality of life.
CASE STUDY SBS Riders
Two bus rapid transit routes—the Bx12 SBS along Fordham Road in the Bronx and the M15 SBS along First and Second Avenues in Manhattan—now move passengers quickly along what once were some of the slowest bus routes in the city.
SBS buses are faster than conventional local or limited bus lines because passengers pay their fare before boarding. The buses also have exclusive use of travel lanes to avoid traffic and smart traffic lights that stay green longer or turn green earlier when a bus approaches. When the bus arrives, passengers can get on using three different doors, decreasing the amount of time the bus spends at each stop.
For jose R. Mejia, SBS has dramatically improved his trip across the Bronx. Each weekend, he travels by bus from Southern Boulevard to Sedgwick Avenue to visit his family. Before SBS, this would take close to an hour. Now using SBS, the trip to visit his family takes thirty to forty minutes.
According to jose, “SBS is necessary because the city needs to move people more efficiently from
place to place. Anything that facilities efficiency is necessary.” And SBS is doing just that. By 2013, there will be Select Bus Service in all five boroughs.
Manhattan resident A. Scott Falk frequently goes out of his way to take the SBS. “I live between Second and Third Avenues, so it used to make more sense for me to ride one of the multiple bus lines on Third if I wanted to go uptown. But having
a better line on First Avenue made me switch to travel on First as much as possible.”
With the next SBS routes rolling out on 34th Street in Manhattan, Hylan Boulevard in Staten Island, and Nostrand Avenue in Brooklyn, we will cut travel time and improve bus travel for more New Yorkers, making the bus a more desirable option.
Regular buses can also use many of the features that we piloted on our SBS routes. For example, when bus lanes were installed on 34th Street in Manhattan, travel time on the M34 bus, which had been one of the slowest bus routes in the city, improved by 17% and ridership grew by 6%. Other features with applicability to non-SBS routes include Transit Signal Prioritization (TSP), which enables traffic lights to recognize approaching buses and either turn the light green or keep it green to allow buses to move more quickly. We will install TSP on 11 routes in all five boroughs. We will also make operational changes to improve bus priority on the Ed Koch Queensboro Bridge to make travel between the boroughs quicker and more efficient. Working with the MTA, we will implement SBS features on other lines to make our bus system quicker, easier, and more dependable for the customer.
Most New Yorkers today get their real-time bus information by peering anxiously down the street looking for the next bus. MTA Bus Time, the MTA’s new real-time bus informa-tion system, will tell riders where their bus is by using a mobile web interface, a text-based cell phone service, or on-street LCD displays. MTA Bus Time is currently available on the B63 in Brooklyn and will be installed on all 31 bus routes in Staten Island.
Cred
it: N
YC D
ept.
of T
rans
port
atio
n/Th
eodo
ra R
avag
o

93A GREENER, GREATER NEW YORK PLANYC
Cred
it: P
at C
ashi
n, M
etro
polit
an T
rans
port
atio
n Au
thor
ity
Construction crews building the tunnels for the Second Avenue subway
IN IT IAT IVE 2
Improve and expand subway and commuter rail
To meet our current and future needs, the MTA is undertaking three mega-projects that rep-resent the largest expansion of the New York regional transportation network in more than seven decades.
Construction of the Number 7 Line extension to the Hudson Yards on the Far West Side of Man-hattan is well underway and expected to be completed in 2013. The 7,000-foot, two-track extension will bring the Number 7 line from its current terminus at Times Square, along 41st Street to 11th Avenue and then south to 34th Street, linking Far West Midtown and Flushing. The City has funded this extension by issuing bonds against the expected appreciation in tax revenues resulting from the redevelopment of West Side property, which will be induced by the presence of the subway.
The MTA is constructing Phase 1 of the Second Avenue Subway. When Phase 1 is completed, the Q Line will run on the Second Avenue Line between 63rd Street and 96th Street. This new capacity will relieve the most crowded segment of the Lexington Avenue Line, which currently carries about 1.3 million riders a day (more than the Boston and Chicago subway systems com-bined). Phase 1 is expected to be completed in 2016 and is projected to carry 213,000 riders on opening day.
The East Side Access project will bring Long Island Rail Road (LIRR) service to Grand Central Terminal by 2016. This will increase the LIRR’s capacity into Manhattan, reduce overcrowding on the LIRR between Jamaica and Penn Station, and provide Queens and Long Island residents with direct access to Manhattan’s East Side. When complete, East Side Access will serve approximately 160,000 customers a day.
We are also exploring areas, such as the North Shore of Staten Island, where coordinated trans-portation improvements could dramatically improve the quality of life for current and future residents, business owners, and visitors to the working waterfront. The North Shore is one of the major maritime employment hubs in the region. We will complete an analysis of potential short-term improvements, focused on the area’s major east-west connector streets and problem-atic intersections. In anticipation of findings from the MTA North Shore Right-of-Way Alternatives Analysis, we will also investigate minor reloca-tions of the former rail right-of-way to support future transit use, to facilitate maritime business, and to improve waterfront access.
Despite significant population growth and economic expansion, no new rail tunnel has been built under the Hudson River in a century. Expanding trans-Hudson rail capacity is a critical regional economic development and sustainabil-ity priority. With Penn Station already at capacity and population projected to grow on both sides of the Hudson River, we are committed to work-ing with our state and federal partners to iden-tify cost-effective opportunities for additional capacity in the bi-state corridor that is so vital to both states and the nation.
IN IT IAT IVE 3
Expand for-hire vehicle service throughout our neighborhoods
Taxis and car services are an important part of our public transportation system. They move over 1.2 million people every day—meaning New York taxis and for-hire car services carry more passengers than most public transit sys-tems in the country other than the MTA, Los Angeles Metro, and Chicago Transit Authority. Taxis and car services are operated by private entrepreneurs and regulated by the City, which authorizes service providers and sets the rules under which they operate.
A 2007 survey of yellow taxi passengers revealed that 66% of riders believed that taxis helped them live without a car. Ninety-seven percent of non-car owning households in Northern Manhattan, Brooklyn, the Bronx, and Queens reported that they had used a car or taxi in the month prior to participating in a 2009 survey. Taxis and car ser-vices serve this important need.
But trying to find a taxi outside lower and central Manhattan is difficult unless you’re at an airport. Ninety-four percent of all taxi trips originate in Manhattan, while 80% of city residents live in Brooklyn, Queens, the Bronx, and Staten Island. Demand for cab service in those boroughs and northern Manhattan is now met by dial-in, radio-dispatched car services rather than taxis.
Under the current City code, it is illegal for car services to pick up passengers who hail them on the street. As a result, New Yorkers who hail car services have to take their chances with a mix of unlicensed and licensed livery vehicles operating contrary to their licenses.
Hiring an unlicensed, unregulated car service is risky. Passengers who hail liveries cannot be certain that they are getting into a vehicle driven by a licensed operator with proper insurance. Fares are variable, and haggling is common. Although the City recently passed rules that have improved passengers’ ability to distinguish a licensed livery vehicle from an unlicensed vehi-cle, passengers continue to unknowingly enter unlicensed vehicles.
We will expand “yellow-caliber” taxi service to neighborhoods beyond lower and central Man-hattan by licensing additional vehicles which would provide street hail service in those areas which are currently underserved. By updating our regulations to more accurately serve the demand which exists today, we can provide New Yorkers with more options that enable them to more easily live without owning a car.
IN IT IAT IVE 4
Promote car-sharing
Only 54% of New York City households own a car. Among car owners, many use their cars relatively infrequently yet want or need the flex-ibility of having access to a car for shopping, family visits, or recreation. Keeping a car in the city can be expensive, and finding a place to park can be difficult.
Giving people more alternatives to the fixed expense of car ownership makes economic and environmental sense. Car-sharing is an efficient and convenient option for people who use a car
94 TRANSPORTATION
Cred
it: A
P W
orld
wide
Pho
tos/
Adam
Rou
ntre
e
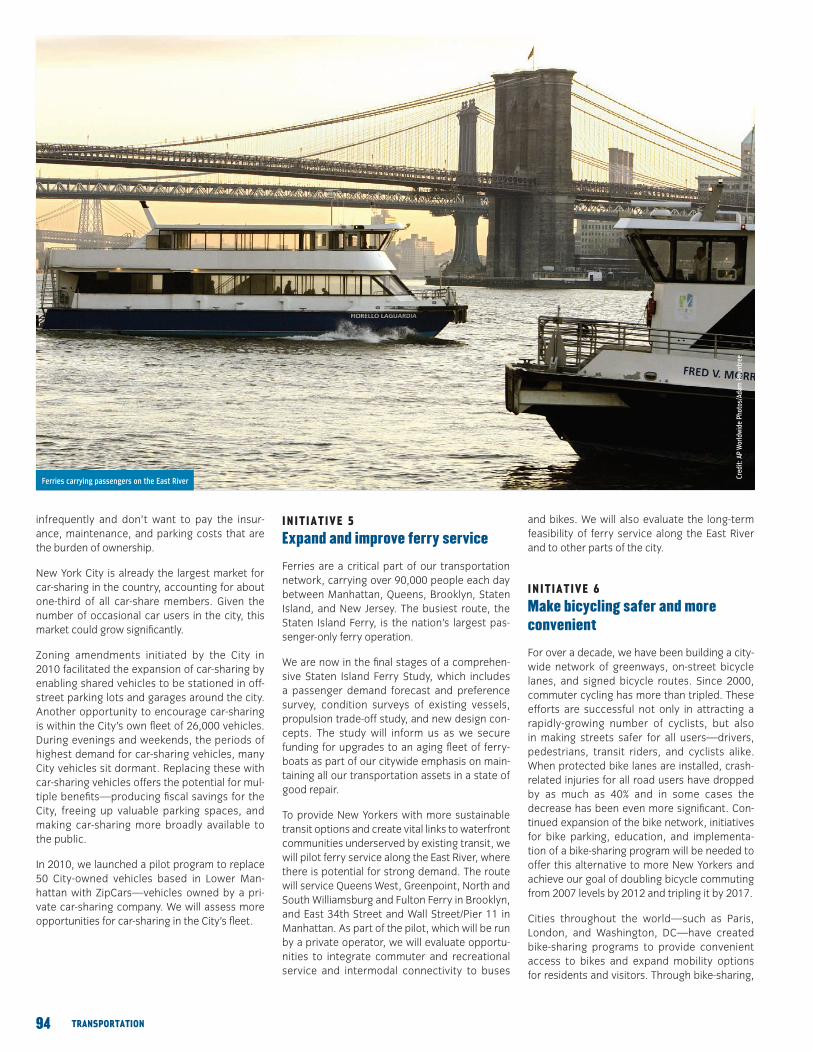
Ferries carrying passengers on the East River
infrequently and don’t want to pay the insur-ance, maintenance, and parking costs that are the burden of ownership.
New York City is already the largest market for car-sharing in the country, accounting for about one-third of all car-share members. Given the number of occasional car users in the city, this market could grow significantly.
Zoning amendments initiated by the City in 2010 facilitated the expansion of car-sharing by enabling shared vehicles to be stationed in off-street parking lots and garages around the city. Another opportunity to encourage car-sharing is within the City’s own fleet of 26,000 vehicles. During evenings and weekends, the periods of highest demand for car-sharing vehicles, many City vehicles sit dormant. Replacing these with car-sharing vehicles offers the potential for mul-tiple benefits—producing fiscal savings for the City, freeing up valuable parking spaces, and making car-sharing more broadly available to the public.
In 2010, we launched a pilot program to replace 50 City-owned vehicles based in Lower Man-hattan with ZipCars—vehicles owned by a pri-vate car-sharing company. We will assess more opportunities for car-sharing in the City’s fleet.
IN IT IAT IVE 5
Expand and improve ferry service
Ferries are a critical part of our transportation network, carrying over 90,000 people each day between Manhattan, Queens, Brooklyn, Staten Island, and New Jersey. The busiest route, the Staten Island Ferry, is the nation’s largest pas-senger-only ferry operation.
We are now in the final stages of a comprehen-sive Staten Island Ferry Study, which includes a passenger demand forecast and preference survey, condition surveys of existing vessels, propulsion trade-off study, and new design con-cepts. The study will inform us as we secure funding for upgrades to an aging fleet of ferry-boats as part of our citywide emphasis on main-taining all our transportation assets in a state of good repair.
To provide New Yorkers with more sustainable transit options and create vital links to waterfront communities underserved by existing transit, we will pilot ferry service along the East River, where there is potential for strong demand. The route will service Queens West, Greenpoint, North and South Williamsburg and Fulton Ferry in Brooklyn, and East 34th Street and Wall Street/Pier 11 in Manhattan. As part of the pilot, which will be run by a private operator, we will evaluate opportu-nities to integrate commuter and recreational service and intermodal connectivity to buses
and bikes. We will also evaluate the long-term feasibility of ferry service along the East River and to other parts of the city.
IN IT IAT IVE 6
Make bicycling safer and more convenient
For over a decade, we have been building a city-wide network of greenways, on-street bicycle lanes, and signed bicycle routes. Since 2000, commuter cycling has more than tripled. These efforts are successful not only in attracting a rapidly-growing number of cyclists, but also in making streets safer for all users—drivers, pedestrians, transit riders, and cyclists alike. When protected bike lanes are installed, crash-related injuries for all road users have dropped by as much as 40% and in some cases the decrease has been even more significant. Con-tinued expansion of the bike network, initiatives for bike parking, education, and implementa-tion of a bike-sharing program will be needed to offer this alternative to more New Yorkers and achieve our goal of doubling bicycle commuting from 2007 levels by 2012 and tripling it by 2017.
Cities throughout the world—such as Paris, London, and Washington, DC—have created bike-sharing programs to provide convenient access to bikes and expand mobility options for residents and visitors. Through bike-sharing,

95A GREENER, GREATER NEW YORK PLANYC
Cred
it: T
rans
port
for L
ondo
n 20
11
Bikes ready for use at a bike-sharing kiosk in London
CASE STUDY Bike-Sharing: Barclays Cycle Hire in London, England
London, like over 100 cities around the world, uses a bike-sharing program to provide more choices for short trips. In a bike share program, bikes can be picked up and dropped off at kiosks located throughout the city near street corners, parks, or train stations, businesses, shops or parks. Users pay a low annual or short-term access fee, and can then take unlimited 30-minute trips per day. After 30-minutes users are assessed a small fee. Bicycles are available 24 hours a day—especially useful when transit service is running on reduced or late-night schedules.
London’s program, the Barclays Cycle Hire, makes 6,000 bicycles available at 400 locations. Bicycles are located every few blocks throughout Inner London and the program will expand eastward for a total of 8,000 bicycles in time for the 2012 London Olympic Games. The London program and cycle super-highway bike lane routes are sponsored by Barclays Bank for an estimated $40.4 million (£25 million) over the next five years.
Barclays Cycle Hire charges an access fee of $73 (£45) for an annual membership. Visitors or those interested in short-term memberships can choose
the 24-hour option for $1.60 (£1.00) or the 7-day pass for $8.00 (£5.00). Since the program started in july 2010, 95% of trips have been less than 30 minutes—with bicyclists only paying the one-time access fee. Bike-sharing in London has been very successful—over 1.5 million trips were made on the bikes in the program’s first three months of operation. Only 12 bicycles have been stolen.
Bike-sharing makes it easy to get around and eliminates the need to find bike parking. Users can take a bike from one kiosk and drop it off at another. New York, like London, is a dense, multi-modal city, and New Yorkers and visitors alike would benefit from travelling across the city on two wheels. By 2012, New Yorkers will be able to get an annual membership to a bike-sharing program for less than the cost of a monthly MetroCard.
bicycles are made available to riders at kiosks for a small fee. When Paris installed its bike-sharing program, cycling quadrupled in one year. Bike-sharing will enable New Yorkers and visitors to check out bikes for short trips for a nominal cost, or for free if the trip is fewer than 30 minutes. We will partner with a third-party operator to estab-lish a robust bike-sharing program in the city.
IN IT IAT IVE 7
Enhance pedestrian access and safety
Most New Yorkers are pedestrians at some point in their day—whether walking to school, to the corner store, or to the subway. A safe and acces-sible pedestrian realm is a building block of a sustainable transportation system.
We have made significant strides to reduce traf-fic fatalities and improve pedestrian safety over the last four years. In fact, 2009 was the safest year on record for pedestrians in New York City, as traffic fatalities were down 35% from 2001. Despite this progress, pedestrians still accounted for over half of all traffic fatalities from 2005 to 2009.
To enhance pedestrian safety, we will install pedestrian countdown signals at 1,500 intersec-tions across the city. These signals help pedestri-ans cross the street safely by counting down the
number of seconds remaining before a flashing “Don’t Walk” signal turns solid. To reduce conflict between vehicles accessing parking garages in areas with high pedestrian activity, we will adopt new guidelines for public garages that promote pedestrian safety.
In 2007, we targeted a series of sites across the city to alleviate sidewalk congestion and improve the pedestrian experience near subway stops and schools and at bus stops under ele-vated subway platforms. We will implement nine additional “Bus Stops Under the Els” projects to address the unique safety and visibility issues at these stops. We will also make walking to school safer for children by implementing 32 Safe Routes to Schools projects. The Safe Routes to Schools program enhances school safety patrols, reduces traffic speeds, and improves crosswalks and sidewalks.
Finally, we will complement these safety advances with improvements that make the city more accessible to walkers. Even the savviest New Yorkers can get disoriented, especially in unfamiliar neighborhoods. A recent study found 9% of New Yorkers (and 27% of visitors) had been lost in the week previous to taking the survey. We will partner with neighborhoods from across the city to design a standardized pedestrian wayfinding system for New York, making all of the city’s neighborhoods accessible to natives and visitors alike.
Reduce congestion on our roads, bridges, and at our airportsCongestion costs our region more than $13 bil-lion a year in lost economic output, and contrib-utes to poor air quality. This price tag impacts every New Yorker in the form of our commuting time and delayed deliveries. Our regional air-ports, which are among the busiest airports in the U.S., are also among the most congested, increasing costs for businesses and consumers.
As our population continues to grow, we must take steps to manage demand and make our roads, bridges, and airports operate more effi-ciently. Managing demand can derive more effi-cient use from our limited transportation capac-ity. Tools like pricing and intelligent transporta-tion systems technology enable us to better manage physically constrained assets by encour-aging drivers to shift their trips away from the most congested travel times. Parking pricing is another opportunity to change driving patterns and optimize utilization of a finite physical space.

96 TRANSPORTATION
Cred
it: A
P W
orld
wide
Pho
tos/
Rich
ard
Drew
Automobile congestion in Midtown, Manhattan
CASE STUDY Roosevelt Island
In the middle of the East River between Manhattan and Queens, Roosevelt Island has long been a laboratory of transportation innovation. In 1969, the Master Plan for Roosevelt Island called for a car-free neighbor-hood. While the two-mile long island is no longer car-free, the legacy of innovation continues as the Roosevelt Island Operating Corporation (RIOC) actively promotes sustain-able transportation practices.
One of the island’s most iconic features is its aerial tramway that connects it to Manhattan. An estimated 2 million people ride the tram every year. Riders of the clean and efficient cable-propelled transit system enjoy spectacu-lar panoramic views. Some of the best waterfront views can also be seen from the island’s bike paths, and efforts to facilitate bike sharing are being planned.
In addition to maintaining the tramway, RIOC has successfully partnered with the New York State Energy and Research Development Authority (NYSERDA) and New York Power Authority (NYPA) to use hybrid-electric buses. They are building upon that program by installing electric vehicle charging stations and employing smart parking technologies. The public can now board a fleet of hybrid-electric buses that use ultra-low-sulfur fuel to get around the island. Using ultra-low-sulfur fuel reduces the emission of dangerous particulate matter by 90%, nitrogen oxide by 40%, and greenhouse gases by 30%.
To encourage use of electric vehicles, RIOC is installing charging stations at the centralized parking facility. This project is critical to building the infrastructure needed to support electric vehicles. Electric vehicles can reduce the levels of emissions associated with the use of conventional gasoline-fueled vehicles.
RIOC is also experimenting with smart parking technology to better manage the limited number of on-street parking spaces. Sensors embedded in the street will relay occupancy information to dynamic street signs or mobile applications. Drivers will be directed to available spaces instead of driving around looking for a parking space. By reducing the amount of time drivers spend looking for parking spaces, RIOC is creating streets with less congestion and improved air quality.
By implementing these ideas, Roosevelt Island is continuing its legacy as a site of transporta-tion innovation.
IN IT IAT IVE 8
Pilot technology and pricing-based mechanisms to reduce traffic congestion
In our densely developed city, there are clear physical limitations to our ability to expand our road network. We must find ways to make more efficient, effective use of the infrastructure we have. Experiences from cities around the world suggest that pricing strategies are among the most cost-effective means of promoting mobility within a capacity-constrained system.
A major cause of traffic congestion on neigh-borhood retail streets is cars cruising for an on-street parking space—or double-parking when drivers can’t find a space. To address this prob-lem, we launched Park Smart, a parking program designed to encourage turnover of parking spaces by charging higher rates during the hours of peak demand. In three neighborhoods—Greenwich Village, the Upper East Side, and Park Slope—Park Smart encourages drivers to park for a shorter period of time, making parking spaces available to more drivers. We will expand this program to three new neighborhoods, and make it even more effective by combining it with innovative strategies to manage curbside load-ing in these areas, thus making the most efficient use of scarce curb space.
Over the last four years, the City has replaced over 11,500 single space parking meters with 2,986 multi-space Muni-Meters, providing debit and credit card payment options and creating more space on the sidewalks. We will install 4,500 additional Muni-Meters throughout the city to replace 51,800 older single-space meters, expanding these benefits to additional neighborhoods.
We will also continue to deploy innovative Intel-ligent Transportation Systems (ITS) technology to improve the safety and performance of our existing street network by improving signal
timing, and reducing traffic congestion in key areas of the city. ITS uses real-time information about roadway conditions to help manage traf-fic signals and optimize performance.
IN IT IAT IVE 9
Modify parking regulations to balance the needs of neighborhoods
Zoning regulations dictate the amount of off-street parking spaces that must or can be built in new residential and commercial developments. Like other cities that came of age before the era of the automobile, many parts of New York City were built around subways and streetcars, not the automobile. In fact, parking spaces in resi-dential buildings were prohibited until 1938 in New York City. Off-street parking requirements were not enacted until 1950; therefore, much of the housing stock was built without consider-ation for residential parking.
Setting parking requirements involves balanc-ing the demand for parking with the effects of car ownership and use. While traditional zoning requirements are intended to ensure parking supply meets household demand for car owner-ship, requiring too much parking to be built in a dense city like New York can encourage driv-ing, contribute to congestion, and unnecessarily raise the cost of new development. As density and transit availability varies across the city, the parking balance must be struck for each neigh-borhood; there is no one-size-fits-all rule.
In many neighborhoods in Manhattan, develop-ments are not required to provide parking for residents, and most new surface parking lots are prohibited. Public parking garages in these areas are only allowed by special permit. In 1995, we expanded these parking regulations beyond these communities—known as the Man-hattan Core—to include Long Island City.
97A GREENER, GREATER NEW YORK PLANYC
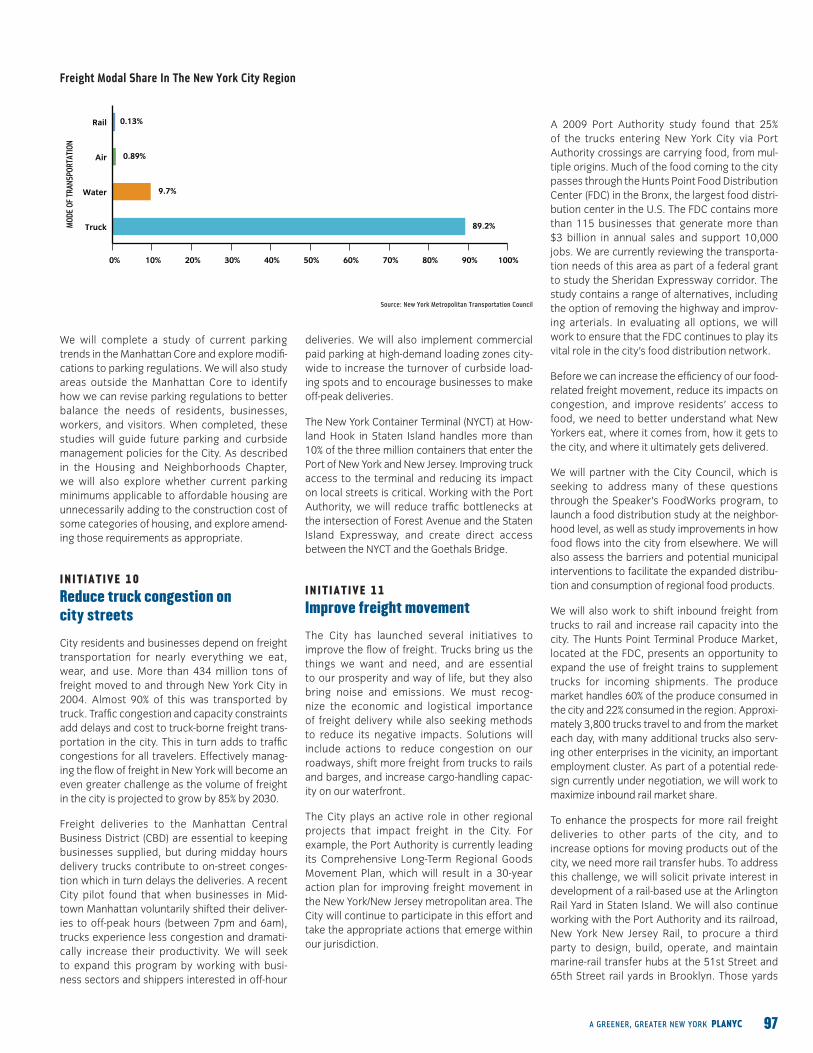
89.2%
9.7%
0.89%
0.13%
0% 10% 20% 30% 40% 50% 60% 70% 80% 90% 100%
Truck
Water
Air
Rail
Source: New York Metropolitan Transportation Council
Freight Modal Share In The New York City Region
We will complete a study of current parking trends in the Manhattan Core and explore modifi-cations to parking regulations. We will also study areas outside the Manhattan Core to identify how we can revise parking regulations to better balance the needs of residents, businesses, workers, and visitors. When completed, these studies will guide future parking and curbside management policies for the City. As described in the Housing and Neighborhoods Chapter, we will also explore whether current parking minimums applicable to affordable housing are unnecessarily adding to the construction cost of some categories of housing, and explore amend-ing those requirements as appropriate.
IN IT IAT IVE 10
Reduce truck congestion on city streets
City residents and businesses depend on freight transportation for nearly everything we eat, wear, and use. More than 434 million tons of freight moved to and through New York City in 2004. Almost 90% of this was transported by truck. Traffic congestion and capacity constraints add delays and cost to truck-borne freight trans-portation in the city. This in turn adds to traffic congestions for all travelers. Effectively manag-ing the flow of freight in New York will become an even greater challenge as the volume of freight in the city is projected to grow by 85% by 2030.
Freight deliveries to the Manhattan Central Business District (CBD) are essential to keeping businesses supplied, but during midday hours delivery trucks contribute to on-street conges-tion which in turn delays the deliveries. A recent City pilot found that when businesses in Mid-town Manhattan voluntarily shifted their deliver-ies to off-peak hours (between 7pm and 6am), trucks experience less congestion and dramati-cally increase their productivity. We will seek to expand this program by working with busi-ness sectors and shippers interested in off-hour
deliveries. We will also implement commercial paid parking at high-demand loading zones city-wide to increase the turnover of curbside load-ing spots and to encourage businesses to make off-peak deliveries.
The New York Container Terminal (NYCT) at How-land Hook in Staten Island handles more than 10% of the three million containers that enter the Port of New York and New Jersey. Improving truck access to the terminal and reducing its impact on local streets is critical. Working with the Port Authority, we will reduce traffic bottlenecks at the intersection of Forest Avenue and the Staten Island Expressway, and create direct access between the NYCT and the Goethals Bridge.
IN IT IAT IVE 11
Improve freight movement
The City has launched several initiatives to improve the flow of freight. Trucks bring us the things we want and need, and are essential to our prosperity and way of life, but they also bring noise and emissions. We must recog-nize the economic and logistical importance of freight delivery while also seeking methods to reduce its negative impacts. Solutions will include actions to reduce congestion on our roadways, shift more freight from trucks to rails and barges, and increase cargo-handling capac-ity on our waterfront.
The City plays an active role in other regional projects that impact freight in the City. For example, the Port Authority is currently leading its Comprehensive Long-Term Regional Goods Movement Plan, which will result in a 30-year action plan for improving freight movement in the New York/New Jersey metropolitan area. The City will continue to participate in this effort and take the appropriate actions that emerge within our jurisdiction.
A 2009 Port Authority study found that 25% of the trucks entering New York City via Port Authority crossings are carrying food, from mul-tiple origins. Much of the food coming to the city passes through the Hunts Point Food Distribution Center (FDC) in the Bronx, the largest food distri-bution center in the U.S. The FDC contains more than 115 businesses that generate more than $3 billion in annual sales and support 10,000 jobs. We are currently reviewing the transporta-tion needs of this area as part of a federal grant to study the Sheridan Expressway corridor. The study contains a range of alternatives, including the option of removing the highway and improv-ing arterials. In evaluating all options, we will work to ensure that the FDC continues to play its vital role in the city’s food distribution network.
Before we can increase the efficiency of our food-related freight movement, reduce its impacts on congestion, and improve residents’ access to food, we need to better understand what New Yorkers eat, where it comes from, how it gets to the city, and where it ultimately gets delivered.
We will partner with the City Council, which is seeking to address many of these questions through the Speaker’s FoodWorks program, to launch a food distribution study at the neighbor-hood level, as well as study improvements in how food flows into the city from elsewhere. We will also assess the barriers and potential municipal interventions to facilitate the expanded distribu-tion and consumption of regional food products.
We will also work to shift inbound freight from trucks to rail and increase rail capacity into the city. The Hunts Point Terminal Produce Market, located at the FDC, presents an opportunity to expand the use of freight trains to supplement trucks for incoming shipments. The produce market handles 60% of the produce consumed in the city and 22% consumed in the region. Approxi-mately 3,800 trucks travel to and from the market each day, with many additional trucks also serv-ing other enterprises in the vicinity, an important employment cluster. As part of a potential rede-sign currently under negotiation, we will work to maximize inbound rail market share.
To enhance the prospects for more rail freight deliveries to other parts of the city, and to increase options for moving products out of the city, we need more rail transfer hubs. To address this challenge, we will solicit private interest in development of a rail-based use at the Arlington Rail Yard in Staten Island. We will also continue working with the Port Authority and its railroad, New York New Jersey Rail, to procure a third party to design, build, operate, and maintain marine-rail transfer hubs at the 51st Street and 65th Street rail yards in Brooklyn. Those yards

98 TRANSPORTATION
Rail Map
are adjacent to the docks for the railroad’s rail-car-on-barge operation, the shortest-distance waterborne route for rail freight between Long Island, Brooklyn and Queens and gateways to the rest of the U.S. in New Jersey.
Freight access between Brooklyn and Queens and points west of the Hudson River is also extremely important to our economy. Yet many of the crossings are constrained, particularly for rail freight. The Port Authority is manag-ing the Environmental Impact Statement for the Cross Harbor Freight Program, which will evaluate policy and infrastructure alternatives to enhance freight connections between New Jersey and various parts of the city, and includes consideration of a rail and/or truck tunnel under New York Harbor. The City will remain engaged in that effort.
We will also increase rail and waterborne freight deliveries at the South Brooklyn Marine Terminal. The City will invest more than $90 million, to be matched by $60 million in private investment, to return the facility to a state of good repair. This will create 300 new jobs and allow ships and barges to deliver vehicles, construction materials, and unprocessed metal, glass and plastic to and from the facility. Because water transportation is six times more efficient than trucking in terms of tons per gallon of fuel burned, port deliveries will be more cost effective for shippers.
Since trucks are by far the dominant means of delivering goods to New York City, we also will work with the State and other regional agen-cies to improve operations and infrastructure of the arterial highways in the five boroughs and to manage on-street truck routes for improved safety and efficiency. We will continue efforts with partner agencies to coordinate truck per-mitting, enforcement, and routing initiatives in the metropolitan area.
IN IT IAT IVE 12
Improve our gateways to the nation and the world
A dynamic city like New York depends increas-ingly on its connections to other places. Our future as a center of commerce and tourism as well as our own lifestyle depends on our ability to move people and goods to and from destina-tions across the nation and around the globe. While we have direct responsibility for many transportation assets within the city, we must also be vitally concerned about those transpor-tation facilities and services owned by other government or private entities that connect us to the other places where we do business. We should not be satisfied until the day when some-
one stepping off an airplane or intercity train in New York City feels like he or she has arrived at an airport or train station suitable for a world-class city.
New York City sits nearly at the midpoint of the Northeast Corridor, the most promising poten-tial high-speed passenger rail line in the U.S. This federal initiative involves states along the Atlan-tic seaboard as well as Amtrak. Additionally, New York State has undertaken strong commit-ments to improve the important Empire Corri-dor rail line linking New York City with important upstate cities like Syracuse and Buffalo. We will work with our federal and state delegations to maximize the planning and construction dollars that flow to our region in support of these impor-tant projects, and will continue to work directly with Amtrak and other state and federal entities to improve those long-distance passenger rail facilities within our city boundaries.
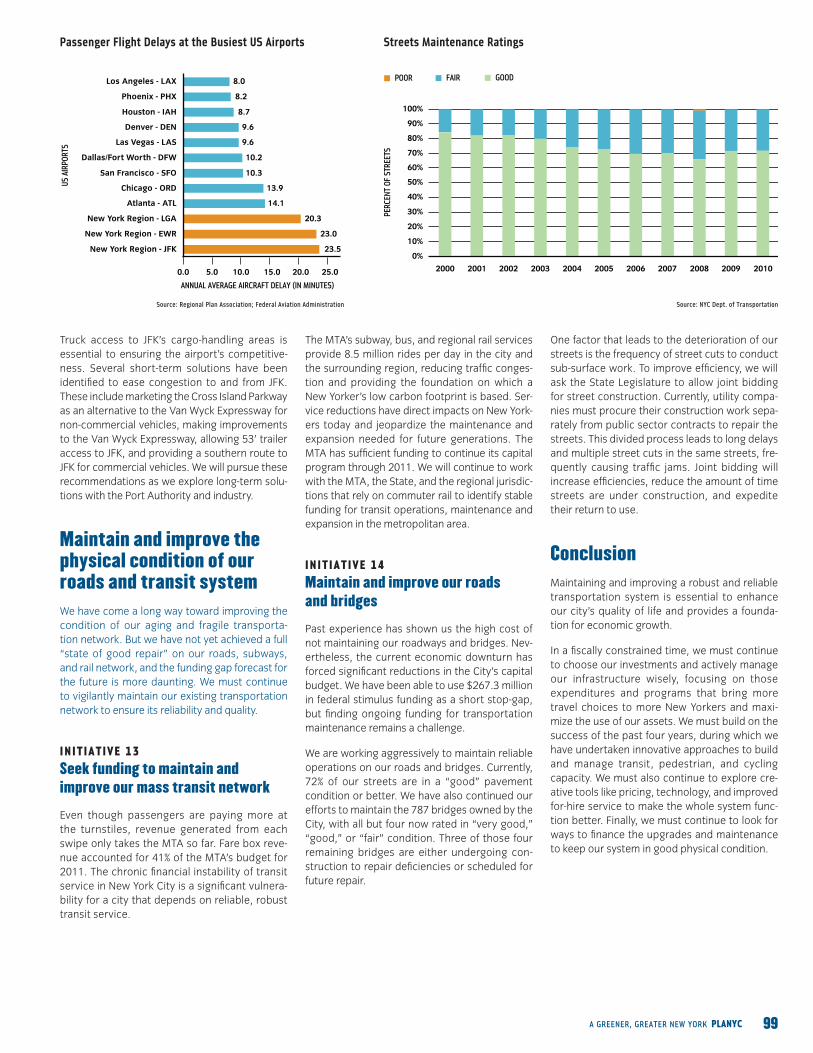
The three regional airports that serve the city—John F. Kennedy International Airport (JFK), LaGuardia Airport (LGA), and Newark Liberty International Airport (EWR)—are among the bus-iest and most congested airports in the nation. Together they handled 104 million passengers and 2.3 million tons of cargo in 2010, collec-tively leading the nation, but they rank near the bottom for on-time departures. Because New York area airports are major domestic hubs
as well as international gateways, delays here have national implications because they ripple through the national system.
To reduce delays and expand capacity in the airspace system, the City will encourage the Federal Aviation Administration (FAA) and the airline industry to implement next-generation (NextGen) air traffic control technology in our region, upgrading from radar-based technology to a satellite-based system.
JFK also lacks available modern logistics facilities for freight businesses. While JFK handles 57% of the region’s air cargo, growth of this critical industry faces challenges. In 2009, JFK’s cargo volume dropped 21% from 2008 levels, com-pared to an average volume loss of 10% at the top 50 largest airports. This downward trend results in economic losses to the region, as major national distribution centers and airlines have moved operations to other areas where they face less congestion and lower costs.
In partnership with the Port Authority, we will launch a comprehensive study of the JFK air cargo industry. The study will quantify cargo market conditions and trends, identify the specific costs and benefits of doing business at JFK, and iden-tify opportunities for infrastructure, financing, and development programs that will benefit New York-based importers and exporters who depend on competitive access to global markets.
99A GREENER, GREATER NEW YORK PLANYC
100%
90%
80%
70%
60%
50%
40%
30%
20%
10%
0%
20102009200820072006200520042003200220012000
New York Region - JFK
New York Region - EWR
New York Region - LGA
Atlanta - ATL
Chicago - ORD
San Francisco - SFO
Dallas/Fort Worth - DFW
Las Vegas - LAS
Denver - DEN
Houston - IAH
Phoenix - PHX
Los Angeles - LAX
15.0 20.0 25.010.05.00.0
23.5
23.0
20.3
14.1
13.9
10.3
10.2
9.6
9.6
8.7
8.2
8.0
Passenger Flight Delays at the Busiest US Airports
Source: Regional Plan Association; Federal Aviation Administration
Streets Maintenance Ratings
Source: NYC Dept. of Transportation
Truck access to JFK’s cargo-handling areas is essential to ensuring the airport’s competitive-ness. Several short-term solutions have been identified to ease congestion to and from JFK. These include marketing the Cross Island Parkway as an alternative to the Van Wyck Expressway for non-commercial vehicles, making improvements to the Van Wyck Expressway, allowing 53’ trailer access to JFK, and providing a southern route to JFK for commercial vehicles. We will pursue these recommendations as we explore long-term solu-tions with the Port Authority and industry.
Maintain and improve the physical condition of our roads and transit systemWe have come a long way toward improving the condition of our aging and fragile transporta-tion network. But we have not yet achieved a full “state of good repair” on our roads, subways, and rail network, and the funding gap forecast for the future is more daunting. We must continue to vigilantly maintain our existing transportation network to ensure its reliability and quality.
IN IT IAT IVE 13
Seek funding to maintain and improve our mass transit network
Even though passengers are paying more at the turnstiles, revenue generated from each swipe only takes the MTA so far. Fare box reve-nue accounted for 41% of the MTA’s budget for 2011. The chronic financial instability of transit service in New York City is a significant vulnera-bility for a city that depends on reliable, robust transit service.
The MTA’s subway, bus, and regional rail services provide 8.5 million rides per day in the city and the surrounding region, reducing traffic conges-tion and providing the foundation on which a New Yorker’s low carbon footprint is based. Ser-vice reductions have direct impacts on New York-ers today and jeopardize the maintenance and expansion needed for future generations. The MTA has sufficient funding to continue its capital program through 2011. We will continue to work with the MTA, the State, and the regional jurisdic-tions that rely on commuter rail to identify stable funding for transit operations, maintenance and expansion in the metropolitan area.
IN IT IAT IVE 14
Maintain and improve our roads and bridges
Past experience has shown us the high cost of not maintaining our roadways and bridges. Nev-ertheless, the current economic downturn has forced significant reductions in the City’s capital budget. We have been able to use $267.3 million in federal stimulus funding as a short stop-gap, but finding ongoing funding for transportation maintenance remains a challenge.
We are working aggressively to maintain reliable operations on our roads and bridges. Currently, 72% of our streets are in a “good” pavement condition or better. We have also continued our efforts to maintain the 787 bridges owned by the City, with all but four now rated in “very good,” “good,” or “fair” condition. Three of those four remaining bridges are either undergoing con-struction to repair deficiencies or scheduled for future repair.
One factor that leads to the deterioration of our streets is the frequency of street cuts to conduct sub-surface work. To improve efficiency, we will ask the State Legislature to allow joint bidding for street construction. Currently, utility compa-nies must procure their construction work sepa-rately from public sector contracts to repair the streets. This divided process leads to long delays and multiple street cuts in the same streets, fre-quently causing traffic jams. Joint bidding will increase efficiencies, reduce the amount of time streets are under construction, and expedite their return to use.
ConclusionMaintaining and improving a robust and reliable transportation system is essential to enhance our city’s quality of life and provides a founda-tion for economic growth.
In a fiscally constrained time, we must continue to choose our investments and actively manage our infrastructure wisely, focusing on those expenditures and programs that bring more travel choices to more New Yorkers and maxi-mize the use of our assets. We must build on the success of the past four years, during which we have undertaken innovative approaches to build and manage transit, pedestrian, and cycling capacity. We must also continue to explore cre-ative tools like pricing, technology, and improved for-hire service to make the whole system func-tion better. Finally, we must continue to look for ways to finance the upgrades and maintenance to keep our system in good physical condition.