transportation, globalization and international trade
TRANSCRIPT

Transportation, Globalization and International Trade

Maritime Routes and Strategic Locations
SuezHormuz
PanamaMalacca
Magellan
Good Hope
Gibraltar
Bab el-Mandab

Shipping Lanes and Strategic Passages in Pacific Asia
Hormuz
Malacca
Sunda
Lombok
Makassar
China
India
Tsugaru
Sout
h C
hina
Sea
Pacific Ocean
Indian Ocean
Japan
Indonesia
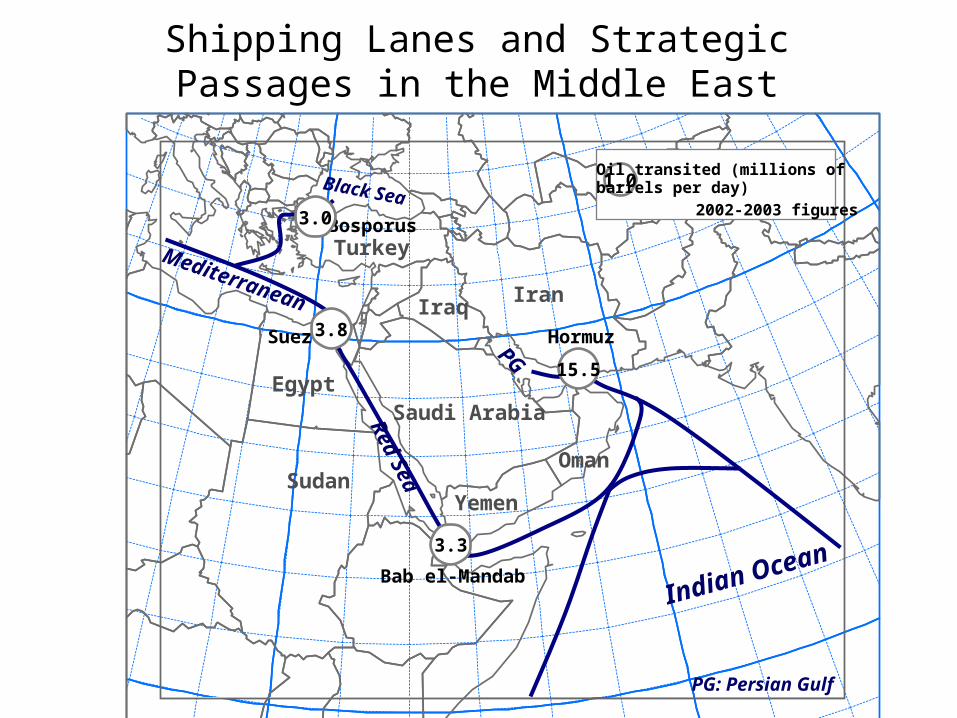
Shipping Lanes and Strategic Passages in the Middle East
IranIraq
Saudi ArabiaEgypt
Turkey
Indian Ocean
Hormuz
Bosporus
Bab el-Mandab
Suez
Oman
Yemen
Red Sea
PG
PG: Persian Gulf
15.5
3.3
3.8
3.0
1.0Oil transited (millions ofbarrels per day)Black Sea
2002-2003 figures
Mediterranean
Sudan

Economic Rationale of Trade
Without Trade
• Small national markets.• Limited economies of scale.• High prices and near monopoly.• Limited product diversity.• Different standards.
With Trade
• Increased competition.• Economies of scale.• Specialization.• Lower prices.• Interdependencies.
Cou
ntr
y 1
Cou
ntr
y 3
Cou
ntry
2C
ou
ntry
4

Major Global Trade Routes, 1400-1800
Mexico Havana
PeruBrazil
West Africa
WesternEurope
Manila
PacificOcean
PacificOcean
IndianOcean
East Africa
IndiaChina
Southeast Asia
Baltic
Hormuz
Aden
Aceh
North America Central Asia
Canton
Malacca
Caribbean
AtlanticOcean
Trade Route
Dominant Capital Flow

Levels of Economic Integration
Free trade between members: NAFTA, Mercosur, ASEAN (partial)
Free Trade
Common external tariffsCustoms Union
Factors of production move freely between members
Common Market
Common currency, harmonized tax rates, common monetary and fiscal policy: EU (partial)
Economic Union
Common governmentPoliticalUnion
Leve
l of i
nteg
ratio
n
Complexity

a
b
c
d
e
f
g
h a
b
cd
ef
g
h
G1
G2
Independent Nations Interdependent Groupsof Nations
Economic Integration and Interdependencies

Average Tariffs after the Uruguay Round (%)
0 10 20 30 40 50 60 70
All industrial products
Textiles & clothing
Mineral products
Transport equipment
Fish & fish products
Leather, footwear & travel goods
Chemical & photographic supplies
Electrical machinery
Other manufactured articles
Wood, paper & furniture
Nonelectrical machinery
Metals
Reduction
Tariff

Average Customs Clearance Time (days)
0 5 10 15 20 25 30
United States
Germany
Netherlands
China
Hong Kong
Malaysia
Singapore
Thailand
Taiwan
Brazil
India
Russia
Mexico
Sea FCLSea LCLAir
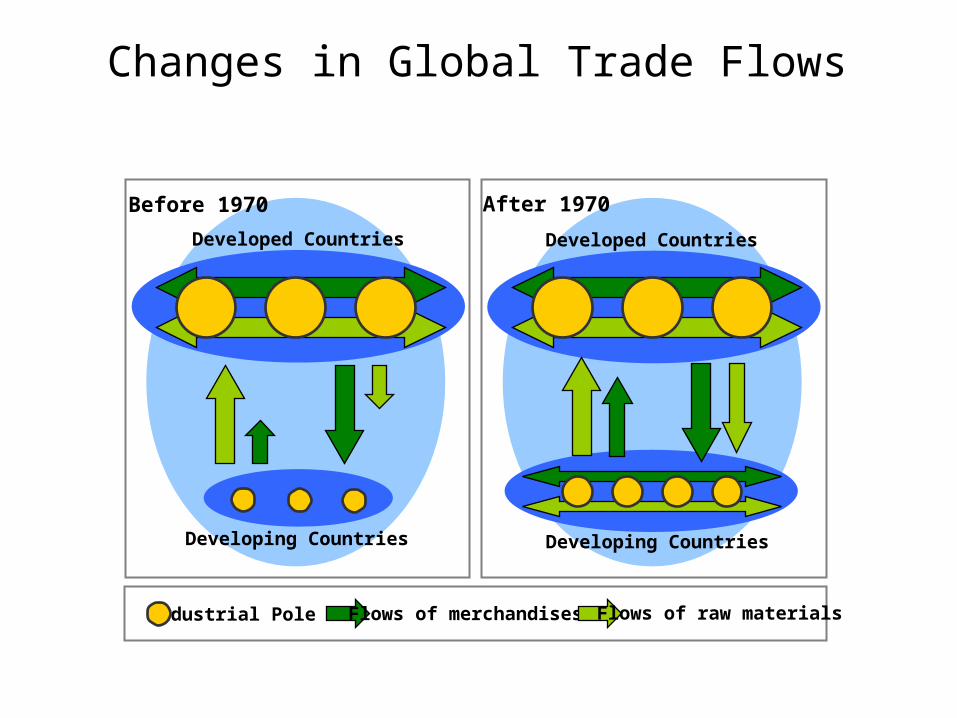
Changes in Global Trade Flows
Industrial Pole
Before 1970 After 1970
Developed Countries
Developing Countries
Developed Countries
Developing Countries
Flows of merchandises Flows of raw materials

Impacts of Integration Processes on Networks and FlowsN
etw
ork
Flow
s
Before Integration After Integration
International border

International Trade, 1998 (in billions of dollars and in % of exports)
EU
145,3(16,2 %)
91,5 (10,2 %)NAFTA
(51,5 %)
East Asia213.2 (23,3) %
(35.2 %)
(62,7 %)
205,6(9,4 %)
144,6(15,8 %)
98,4(4,5 %)
461,9
1371,2
322,0

World Exports of Merchandise, 1950-2003
00.5
11.5
22.5
33.5
44.5
55.5
66.5
7
1950
1953
1956
1959
1962
1965
1968
1971
1974
1977
1980
1983
1986
1989
1992
1995
1998
2001
Valu
e (T
rilli
ons
of $
US)
0
2
4
6
8
10
12
14
16
Shar
e of
Wor
ld G
DP
(%)
Value
Share
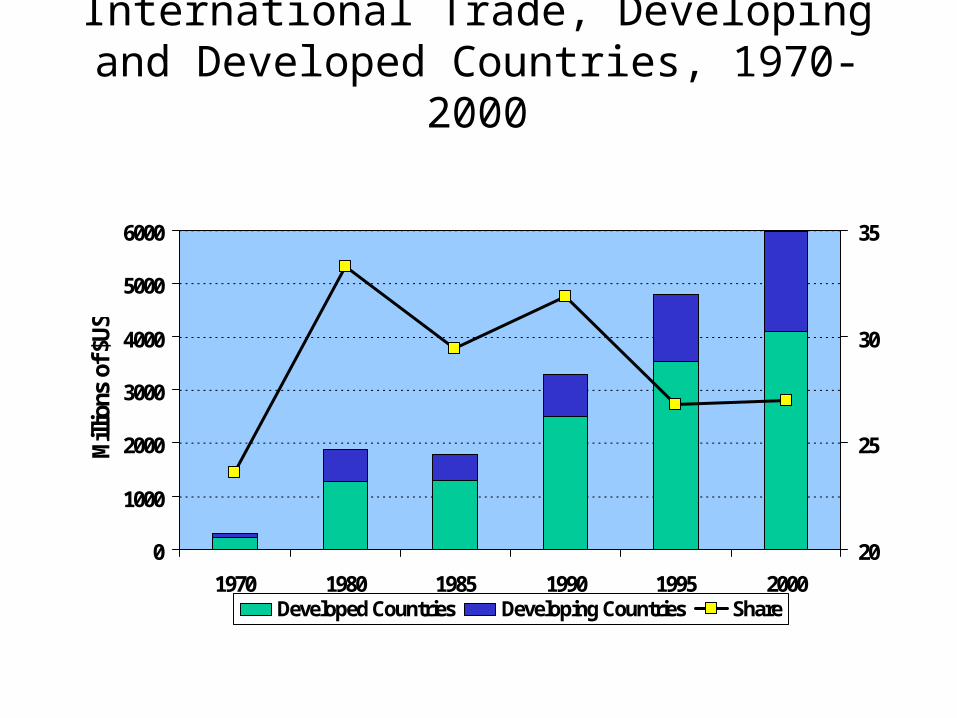
International Trade, Developing and Developed Countries, 1970-2000
0
1000
2000
3000
4000
5000
6000
1970 1980 1985 1990 1995 2000
Mill
ions
of $
US
20
25
30
35
Developed Countries Developing Countries Share

Changes in the Value World’s Merchandise Trade, Production and GDP, 1950-2002 (in %)
-10
-5
0
5
10
15
20
25
30
1950
1953
1956
1959
1962
1965
1968
1971
1974
1977
1980
1983
1986
1989
1992
1995
1998
2001
Total Merchandise Trade
World GDP
World Merchandise Production

Global Exports of Merchandise, 1963-2000
0%
20%
40%
60%
80%
100%
1963 1975 1990 1994 2000
Manufactured productsMineral productsAgricultural products

Merchandise Exports per Continent (in billions of US$), 1980-2000
0
1000
2000
3000
4000
5000
6000
7000
1980 1985 1990 1995 2000
Asia
Middle East
Africa
Eastern Europe
Western Europe
Latin America
North America

Merchandise Exports per Continent (in %), 1980-2000
0%
10%
20%
30%
40%
50%
60%
70%
80%
90%
100%
1980 1985 1990 1995 2000
Asia
Middle East
Africa
Eastern Europe
Western Europe
Latin America
North America

World’s Leading Exporters and Importers, 2003
0 200 400 600 800
Germany
United States
Japan
China
France
United Kingdom
Netherlands
Italy
Canada
Belgium
0 500 1000 1500
United States
Germany
China
United Kingdom
France
Japan
Italy
Netherlands
Canada
Belgium

World’s 10 Largest Exporters and Importers, 2002
0 200 400 600 800 1000 1200
United States
Germany
Japan
France
China
United Kingdom
Canada
Italy
Netherlands
Hong Kong, China
Billions of $US
ImportsExports

World’s 10 Largest Exporters and Importers, 2003
0 200 400 600 800 1000 1200 1400
Germany
United States
Japan
China
France
United Kingdom
Netherlands
Italy
Canada
Belgium Imports
Exports

Trade as Share of GDP, 1998
Less than 20%
20% to 40%
40% to 60%
60% to 100%
100% to 150%
More than 150%
Not Available

Share of World Goods Exports, Selected Countries, 1950-2002
0.0%
2.0%
4.0%
6.0%
8.0%
10.0%
12.0%
14.0%
16.0%
18.0%
20.0%
1950
1952
1954
1956
1958
1960
1962
1964
1966
1968
1970
1972
1974
1976
1978
1980
1982
1984
1986
1988
1990
1992
1994
1996
1998
2000
2002
United StatesJapanGermanyP.R. ChinaSaudi Arabia

Total Freight Costs for Imports in World Trade (% of Total Costs)
0 2 4 6 8 10 12 14
Word
Developed Countries
Developing Countries
Africa
America
Asia
Europe
Oceania
2000
1990

Value of Chinese Exports and Received FDI, 1983-2002 (Billions of $US)
0
50
100
150
200
250
300
35019
83
1984
1985
1986
1987
1988
1989
1990
1991
1992
1993
1994
1995
1996
1997
1998
1999
2000
2001
2002
Expo
rts
0
5
10
15
20
25
30
35
40
45
50
FDI
Exports
FDI

Trade by Ocean, 1995
0% 20% 40% 60% 80% 100%
1990
1995Pacific
Atlantic
Other

Major Economic Blocs, 2000
NAFTA
Andean Pact
Mecosur
Caricom
EFTA
EU
Europe's Associates
ASEAN

Trade by Major Economic Bloc
0 5 10 15 20 25 30
Intra AFTA
Intra EU
Intra NAFTA
EU-NAFTA
NAFTA-EU
Percentage
1995
1990

Share of Containerized Cargo in Global Trade, 1980-2000
0
100
200
300
400
500
600
700
800
1980 1985 1990 1995 2000
Mill
ion
tons
Containerized Cargo Other General Cargo

A B
Rail
Origin Destination
Transport Chain
Maritime Road
International Trade
Transshipment
International Trade and Transportation Chains
A B
Composition Decomposition
Trade barrier
Customs

Modal Shares of U.S.-NAFTA-Partner Merchandise Trade by Value and Weight, 2000
0
10
20
30
40
50
60
70
Truck Rail Pipeline Air Water Other andunknown
Value
Weight

Concept 3
Commodity Chains and Freight Transport

Elements of an Economic System
Economic System
Consumption (demand)
Production(supply)
Manufacturing
Regulation
Circulation Distribution
Labor
Land Capital
Production factors

London
New YorkLos Angeles
Singapore
Hong Kong
Tokyo
Telecommunications
Space
Time
Hin
terla
nd
Stock Market Opening Period
Global Financial Centers

The World’s 20 Largest Corporations by Market Value, 2003 ($US millions)
0 50,000 100,000 150,000 200,000 250,000 300,000
Microsoft
General Electric
Exxon Mobil
Wal-Mart Stores
Pfizer
Citigroup
Johnson & Johnson
Royal Dutch/ Shell
BP
IBM
Ameri. Int. Group
Merck
Vodafone
Proctor & Gamble
Intel
GlaxoSmithKline
Novartis
Bank of America
NTT DoCoMo
Coca Cola

Industrial Agglomeration and Transportation
AgglomeratedDiffused

Modal Profile of Freight Transportation, United States
Mode Value Volume Service Distance
Truck Moderate to high Loads of less than 50,000 lbs.
On-time performance above 90%.
Driver can go 500 miles per day. 2/3 of tonnage carried over less than 100 miles.
Rail Moderate to low Multiple car loads. No weight restrictions.
4 to 7 days delivery time. 60 to 85% on-time performance.
Average haul length between 600 and 800 miles.
Intermodal Moderate to high No weight restrictions. 3 days for cross country. On-time performance between truck and rail.
Average haul between 700 and 1,500 miles.
Air High Small. Most loads less than 100 lbs.
Normally overnight or second day.
More than 1,300 miles.
Inland Water Moderate to low Bulk shipments. Varies according to segment. Competitive with rail.
Between 250 and 1,600 miles.
Coastal Water Moderate to low Containers, general freight and bulk shipments.
Function of distance. Between 2 to 5 days.
Between 500 and 2,000 miles.
International Water
High to low Mainly containers and bulk shipments.
7 to 10 days trans-Atlantic and trans-Pacific routes.
More than 2,600 miles.
Pipeline Low Bulk shipment of liquids and gazes.
According to demand. 0 to 20 mph.
825 miles average distance for crude oil.

National
International
Circ
ula
tion
International National
Mar
ket
Transport Chain
Parts and rawmaterials
Manufacturingand assembly Distribution
Commodity Chain
International National International National
Mar
ket
Sou
rcin
gS
tag
e

Producer and Buyer-driven Commodity Chains
Manufacturers DistributorsRetailers and
Dealers
Producer-driven
Domestic and foreign subsidiaries and subcontractors
Buyer-driven
Factories
Traders
OverseasBuyers
BrandedManufacturers
Retailers
BrandedMarketers
International National

Product Life Cycle
Sal
es
Stage 1 Stage 2 Stage 3
Monopoly Competition
Research anddevelopment
Maturity Decline
First competitors Mass production
Innovating firm
Competitors
Growth
Stage 4
PromotionIdeaDecline ofproduction

Production Systems and Types of Transported Freight
Raw materials Semi-finished products Manufactured goods
Extraction
TransferProcessing
Intra-industrial linkages
ManufacturingRetailing
Distribution

Changes in the Value of World’s Trade per Type of Merchandise, 1950-2002 (in %)
-30
-20
-10
0
10
20
30
40
50
60
1950
1953
1956
1959
1962
1965
1968
1971
1974
1977
1980
1983
1986
1989
1992
1995
1998
2001
Agricultural Trade
Mining Trade
Manufactures

Global Merchandises Exports by Product, 1990-2000 (in % of value)
0 2 4 6 8 10 12 14 16 18 20
Other machinery and transport equ.
Office and telecommunication equ.
Fuels
Automotive products
Chemicals
Food
Other semi-manufactures
Clothing
Textiles
Iron and steel
Raw food materials
Non-ferrous metals
Ores and other minerals2000
1990

Geographical Growth of a Multinational Corporation
Center
Nation
Other N
ation
TariffB
asic EnterprisePe
netr
atio
n of
a N
atio
nal M
arke
tPenetration of Foreign M
arketsM
ultin
atio
nal C
orpo
ratio
n
1 2
3 4
FactoryDistribution center
Representative

Centralized Production R
egio
nal P
rodu
ctio
nR
egional Specialization Vert
ical
Inte
grat
ion
Country A Country B
Country C Country D
Global Production Networks

Inbound Truck Traffic by US Port of Entry, 1997
Laredo
El PasoOtay Mesa
Blair
Detroit
Port Huron Buffalo

Market Share by Freight Transport Mode, Western Europe, 1980-2000 (in ton-km)
0%
10%
20%
30%
40%
50%
60%
70%
80%
90%
100%
1980 1985 1990 1995 2000
Inland Waterways
Road
Rail

Market Share by Freight Transport Mode, United States, 1980-2000 (in ton-miles)
0%
10%
20%
30%
40%
50%
60%
70%
80%
90%
100%
1980 1985 1990 1995 1999
Water
Truck
Rail

Fordist and Post-Fordist Corporate Structure
Characteristics Fordism Post-Fordism
Organization Pyramidal Networked
Focus Supply Demand
Style Structured Flexible
Reach Regional / National Global
Resources Physical Assets Information / Knowledge
Production Mode Mass Production Mass Customization
Production Structure Self-Sufficiency Alliances
Inventories Months Hours
Production Cycle Time Weeks / Months Days
Information Weekly Real-Time
Product Life Cycle Years Months
Quality Affordable Best Zero-Defect

Fordism Post-Fordism
Raw
mate
rials
an
d p
art
sM
an
ufa
ctu
rin
gS
ale
s a
nd
dis
trib
uti
on
Fluxes in a Fordist and Post-Fordist Production System

Producer-Driven and Buyer-Driven Global Commodity Chains
Producer-Driven Commodity Chains Buyer-Driven Commodity Chains
Drivers of Global Commodity Chains
Industrial Capital Commercial Capital
Core Competencies Research & Development; Production Design; Marketing
Barriers to Entry Economies of Scale Economies of Scope
Economic Sectors Consumer Durables; Intermediate Goods; Capital Goods
Consumer Nondurables
Typical Industries Automobiles; Computers; Aircraft Apparel; Footwear; Toys
Ownership of Manufacturing Firms
Transnational Firms Local Firms, predominantly in developing countries
Main Network Links Investment-based Trade-based
Predominant Network Structure Vertical Horizontal
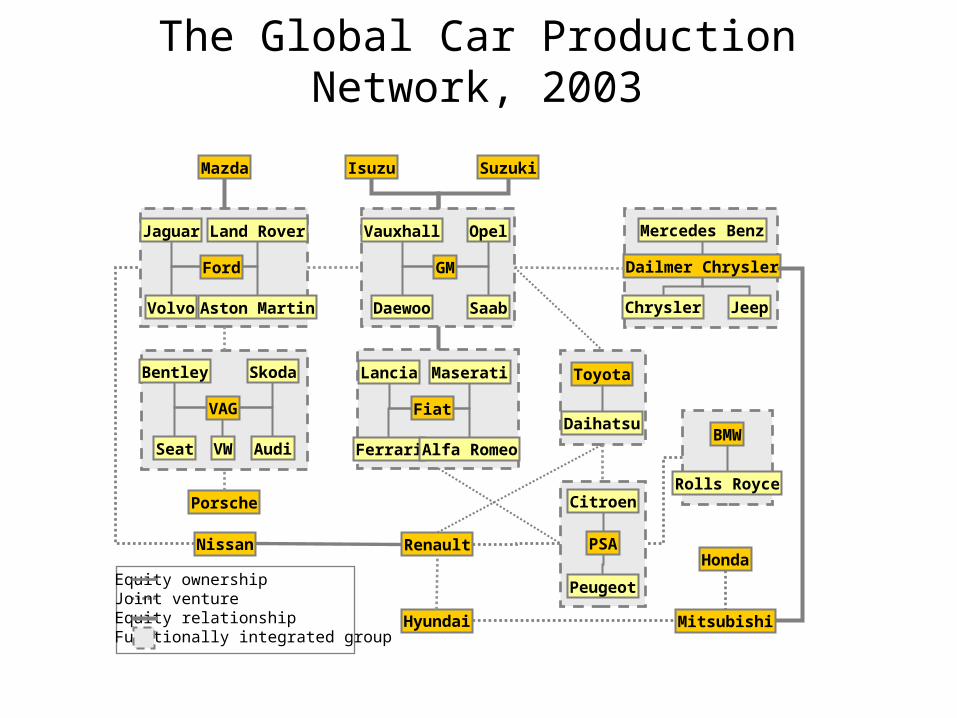
The Global Car Production Network, 2003
Ford
Jaguar Land Rover
Volvo Aston Martin
Mazda Isuzu Suzuki
GM
Vauxhall Opel
Daewoo Saab
VAG
Bentley Skoda
Seat AudiVW
Dailmer Chrysler
Mercedes Benz
Chrysler Jeep
Fiat
Lancia Maserati
Ferrari Alfa Romeo
Toyota
Daihatsu
Porsche
Nissan Renault
Hyundai
PSA
Peugeot
Citroen
BMW
Rolls Royce
Mitsubishi
HondaEquity ownershipJoint ventureEquity relationshipFunctionally integrated group

The Automobile Supply Chain
Supplyingindustries
Steel and other metals
Rubber
Electronics
Plastic
Glass
Textiles
Bodies
Components
Engines and transmissions
Final Assembly
Manufacture and stamping of body
panels
Body assembling and painting
Manufacture of mechanical and electrical components (wheels, tires, seats, breaking
systems, windshields, exhausts, etc.)
Forging and casting of engine and transmission
components
Machining and assembly of engines and transmissions
Consumer market

Cereals Supply Chain
Farm
Wood Pulp Mfg
Processing Facility
Packaging
Label Mfg
Converter Distributor Store
Packaged Cereal
Packaged Cereal
Grain
Wood Pulp
Paperboard
LabelsWood Pulp
Cereal
Distribution and Retailing
ManufacturingExtraction

Concept 4
Logistics

Logistics Operations
Demand
Transportation
Stock
Managem
ent Purchas
e Ord
ers
Proce
ssing
Handling Packaging
Purc
hase
Sales
ProductionScheduling
Warehousing

Logistics and Integrated Transport Demand
Logistics(Integrated Demand)
Materials Management
Physical Distribution
Ind
uced
Dem
an
d
Deriv
ed
Dem
an
d

Value-Added Functions of Logistics
Production
Location
Time
ControlLogistics

Changes in the Relative Importance of Logistical Functions in Distribution Systems
0% 20% 40% 60% 80% 100%
Supply Driven
Demand Driven
Inventory
Transport System
Information System

From Push to Pull Logistics
Supplier Supplier Supplier
Manufacturer
Customer
Distributor
Supplier Supplier Supplier Supplier
Supplier Supplier Supplier
Manufacturer
Distributor
Customer
3PL
Returns / Recycling Point-of-sale data
Freight flow
Push Pull

Fragmentation of the Production System and the Logistics Industry
Inputs Outputs
FactoryRegion A
Region A
Region B
Region C
Logistics
Conventional Emerging
Distribution

Benefits of Demand-Driven Supply Systems
Inventory turnover Working capital
Cause Consequence
Customer service Net income
Labor productivity Operating expenses
Capacity utilization Return on assets
Logistics costs Operating expenses

Total Logistics Costs Function
Costs
Shipment Size
P+T
TLC
C
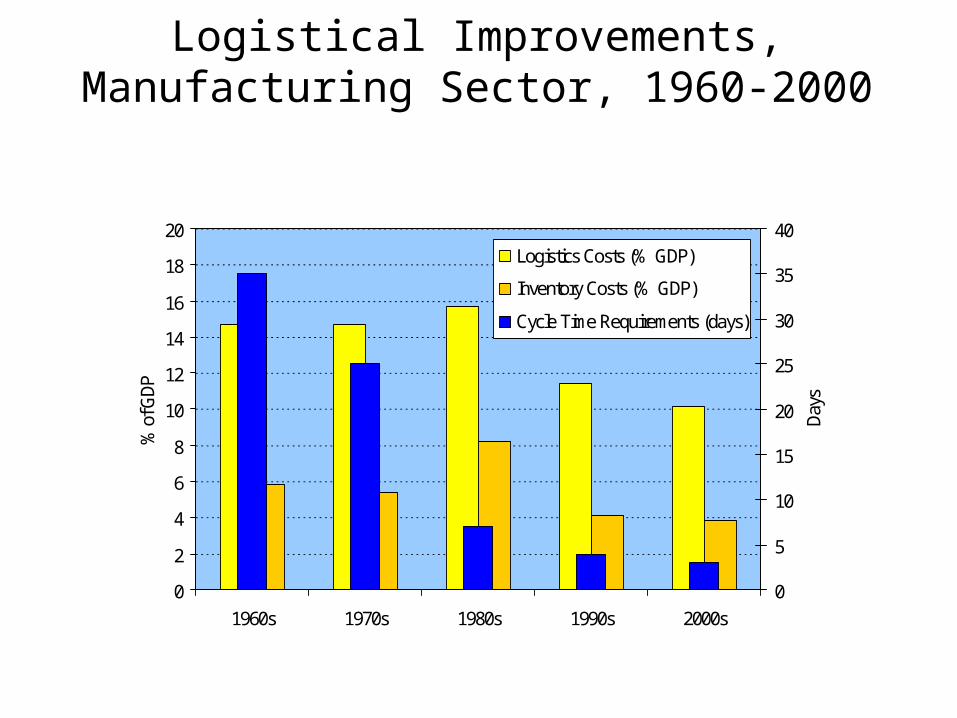
Logistical Improvements, Manufacturing Sector, 1960-2000
0
2
4
6
8
10
12
14
16
18
20
1960s 1970s 1980s 1990s 2000s
% o
f GDP
0
5
10
15
20
25
30
35
40
Days
Logistics Costs (% GDP)
Inventory Costs (% GDP)
Cycle Time Requirements (days)

Worldwide Logistics Costs
39%
27%
24%
6%4%
Transportation
Warehousing
Inventory Carrying
Order Processing
Administration

Logistics Costs and Economic Development
Agriculture Mining Industry Services Information
Log
isti
cs C
osts
/ G
NP
Economic Development
United StatesJapan
Singapore
Argentina
Kenya
Brazil Poland
Ukraine
Belgium
Canada

Average Order Lead Times of European Manufacturers, Wholesalers, and Retailers
0
5
10
15
20
25
30
1985 1990 1995 2000 2005
Day
s

Logistics Costs, United States, 1980-2000 (in billions of $)
0
200
400
600
800
1000
1200
1980 1985 1990 1995 2000
Administrative Costs
Transportation Costs
Inventory Carrying Costs

% of Products Shipped for “Just-in-Time” Manufacturing
05
101520253035404550
1990 1994 1996 1998 2000

Product Life Cycle of a Television, 1960-1996
0
2
4
6
8
10
12
1960 1980 1990 1996
Year
s
Low
Medium
High
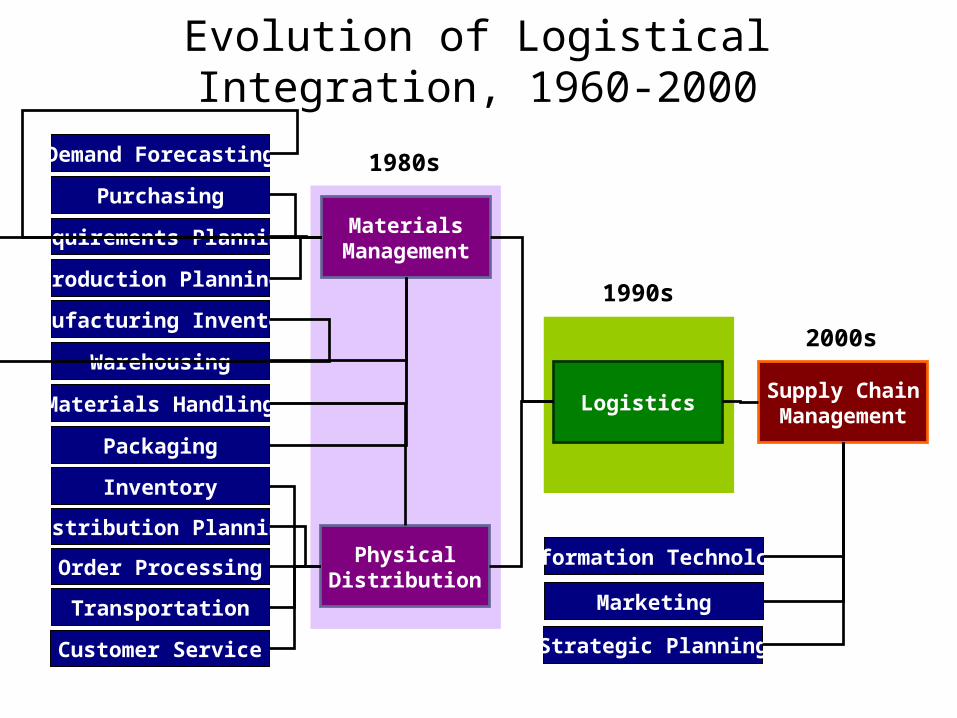
Evolution of Logistical Integration, 1960-2000
Demand Forecasting
Purchasing
Requirements Planning
Production Planning
Manufacturing Inventory
Warehousing
Materials Handling
Packaging
Inventory
Distribution Planning
Order Processing
Transportation
Customer Service Strategic Planning
MaterialsManagement
PhysicalDistribution
LogisticsSupply ChainManagement
Information Technology
Marketing
1980s
1990s
2000s

Taxonomy of Logistics Decisions
Level Description
Logistics structures
Numbers, locations and capacity of factories, warehouses and terminals
Pattern of trading links
Commercial decisions on sourcing, sub-contracting and distribution. Freight network linking a company and its trading partners
Scheduling of product flow
Programming of production and distribution operations translate trading into discrete freight flows. Adherence to a just-in-time (JIT) regime usually requires frequent delivery of small orders
Management of transport resources
Within the framework defined by decisions at the previous three levels, transport managers still have discretion over the use of transport resources.

Conventional and Contemporary Arrangement of Goods Flow
Raw Materials & Parts Manufacturing Distribution
RawMaterials
Storage NationalDistribution
RegionalStorage
LocalDistribution
Retailers
Supply Chain Management
RawMaterials
DistributionCenter
RetailersManufacturing
Cu
sto
mers
Cu
sto
mers
Conventional
Contemporary
Material flow (delivery)
Information flow (order)
Core component

Forward and Reverse Distribution
Con
su
mers
Producers Distributors
CollectorsRecyclers
Forward ChannelReverse Channel
Su
pp
liers

Globalization of Consumption
Nodes and Freight Distribution
Production
Consumption
Local GlobalDistribution Scale
Dis
trib
utio
n Sc
ope
Globalization of Production
DC Global Distribution
Manufacturing
Retailing
Regional Distribution

Cross-Docking
Suppliers
Customers
Receiving
Shipping
SortingDC

Freight Distribution and Network Strategies
A
BPoint-to-Point
A
BCorridor
A
BHub-and-Spoke
A
BFixed Routing
A
BFlexible Routing
Transshipment node
Route node
Network node
Unserviced node
Route
Alternativeroute

Cargo Rotation
Inland location withImports >> exports
Export flows
Import flows
Empties
Inland location withExports >> imports
Port
A
B

Complexity of the Supply Chain
FactoryDistribution center
Representative
National
International
National Supply Chain Multinational Supply ChainSimple Complex
High-throughputDC

National Semiconductors, Supply Chain, 1993-2001
")")
") ")
")
!(
!(!(
!(
!(
#*
#*#*
#*#*
#*
!(
!(!(
!(
!(
#*
#*#*
#*#*
#*
")
!(
!(
!(
!(
!(
Regional Distribution Centers (1993)
Global Distribution Center (2001)
Wafer Fabrication Assembly & Testing Distribution Center
Singapore
Portland
Salt Lake City
Santa Clara
Arlington
Greenock
Swindon
Midget Haemek
Tokyo
Hong Kong
Cebu
Bangkok
Penang
MalaccaToa Payoh

The Logistics of Mitsui & Co.
Distribution System
MitsuiProduction Sales
Needs• Increase production efficiency.• Reduce distribution costs.
Services• Offer and develop a logistical distribution system.
Needs• Reduce inventory costs.• Offer better services to customers.
Logistical center• Supervisions of orders and the inventory.• Consolidation of deliveries.
Producer
Producer
Producer
Customer
Customer
Customer
Orders Orders
Information fluxesFreight fluxes

15 Largest Owners of Warehouses, North America, 2000 (in millions of square feet)
0 10 20 30 40 50 60 70
United Parcel Service
Exel
General Motors
GATX Logistics
Supervalu
Sysco
AmeriCold Logistics
Fleming Co.
Tibbett & Britten Group
Target Stores
W.W. Grainger Inc.
Kenco Logistics Services
Standard Corp.
NFI
USCO Logistics

Ten Largest Global Logistics Service Providers, 1998
0 5 10 15 20 25 30 35 40 45 50
GEODIS
Schenker
TNT Post Group
Deutsche Bahn Cargo
NFC/Exel
Kuhne & Nagel
Danzas
Maersk Moeller
Panalpina
Deutsche Post FrachtEmployees (thousands)
Revenue (Billion $US)

Logistics and E-commerce
Retailer
Supply chain
E-Retailer
Customers Customers
Supply chain
Warehousing
Warehousing
Tra
dit
ion
al Log
isti
cs
E-L
og
istic
s

Shifts of Logistical Operations in the Internet economy
Traditional logistics E-logistics
Orders Predictable Variable
Order cycle time Weekly Daily or hourly
Customer Strategic Broader base
Customer service Reactive, rigid Responsive, flexible
Replenishment Scheduled Real-time
Distribution model Supply-driven (push) Demand-driven (pull)
Demand Stable, consistent More cyclical
Shipment type Bulk Smaller lots
Destinations Concentrated More dispersion
Warehouse reconfiguration Weekly or monthly Continual, rules-based
International trade compliance Manual Automated