(translation of the 2011annual report approved in italian, …€¦ · · 2017-02-03letter to our...
TRANSCRIPT
2011 ANNUAL REPORT
(Translation of the 2011 Annual report approved in Italian,solely for the convenience of international readers)
2011Annual Report
4 Table of contents
TABLE OF CONTENTS
Letter to our Shareholders . . . . . . . . . . . . . . . . . . . . . . . . . . . . . . . . . . . . . . . . . . . . . . . . . . . . . . . . . . . . . . . . . . . . . . . . . 9Company’s data . . . . . . . . . . . . . . . . . . . . . . . . . . . . . . . . . . . . . . . . . . . . . . . . . . . . . . . . . . . . . . . . . . . . . . . . . . . . . . . . . . . 10Corporate Governance bodies . . . . . . . . . . . . . . . . . . . . . . . . . . . . . . . . . . . . . . . . . . . . . . . . . . . . . . . . . . . . . . . . . . . . . . . 11TOD’S Group . . . . . . . . . . . . . . . . . . . . . . . . . . . . . . . . . . . . . . . . . . . . . . . . . . . . . . . . . . . . . . . . . . . . . . . . . . . . . . . . . . . . 12Group’s organizational chart . . . . . . . . . . . . . . . . . . . . . . . . . . . . . . . . . . . . . . . . . . . . . . . . . . . . . . . . . . . . . . . . . . . . . . . . . 13Distribution network as of December 31st 2011 . . . . . . . . . . . . . . . . . . . . . . . . . . . . . . . . . . . . . . . . . . . . . . . . . . . . . . . . . 14Key consolidated financial figures . . . . . . . . . . . . . . . . . . . . . . . . . . . . . . . . . . . . . . . . . . . . . . . . . . . . . . . . . . . . . . . . . . . . . 15Highlights of results . . . . . . . . . . . . . . . . . . . . . . . . . . . . . . . . . . . . . . . . . . . . . . . . . . . . . . . . . . . . . . . . . . . . . . . . . . . . . . . . 16
TOD’S Group - Consolidated Financial Statements as at December 31st 2011
Report on operationsIntroduction . . . . . . . . . . . . . . . . . . . . . . . . . . . . . . . . . . . . . . . . . . . . . . . . . . . . . . . . . . . . . . . . . . . . . . . . . . . . . . 29Alternative indicators of performances . . . . . . . . . . . . . . . . . . . . . . . . . . . . . . . . . . . . . . . . . . . . . . . . . . . . . . . . 29Group’s activity . . . . . . . . . . . . . . . . . . . . . . . . . . . . . . . . . . . . . . . . . . . . . . . . . . . . . . . . . . . . . . . . . . . . . . . . . . . 29Group’s brands . . . . . . . . . . . . . . . . . . . . . . . . . . . . . . . . . . . . . . . . . . . . . . . . . . . . . . . . . . . . . . . . . . . . . . . . . . . 30Organizational structure of the Group. . . . . . . . . . . . . . . . . . . . . . . . . . . . . . . . . . . . . . . . . . . . . . . . . . . . . . . . . 31Foreign currency markets . . . . . . . . . . . . . . . . . . . . . . . . . . . . . . . . . . . . . . . . . . . . . . . . . . . . . . . . . . . . . . . . . . . 31Main events and operations during the period . . . . . . . . . . . . . . . . . . . . . . . . . . . . . . . . . . . . . . . . . . . . . . . . . . . 31The Group’s results in 2011 . . . . . . . . . . . . . . . . . . . . . . . . . . . . . . . . . . . . . . . . . . . . . . . . . . . . . . . . . . . . . . . . . 32Research and development . . . . . . . . . . . . . . . . . . . . . . . . . . . . . . . . . . . . . . . . . . . . . . . . . . . . . . . . . . . . . . . . . . 38Reconciliation of the result for the period and net equity of the Group withthe analogous values of the Parent Company. . . . . . . . . . . . . . . . . . . . . . . . . . . . . . . . . . . . . . . . . . . . . . . . . . . . 39Corporate Governance . . . . . . . . . . . . . . . . . . . . . . . . . . . . . . . . . . . . . . . . . . . . . . . . . . . . . . . . . . . . . . . . . . . . . 39Significant events occurring after the end of the period . . . . . . . . . . . . . . . . . . . . . . . . . . . . . . . . . . . . . . . . . . . 41Business outlook . . . . . . . . . . . . . . . . . . . . . . . . . . . . . . . . . . . . . . . . . . . . . . . . . . . . . . . . . . . . . . . . . . . . . . . . . . 41Approval of Financial Statements . . . . . . . . . . . . . . . . . . . . . . . . . . . . . . . . . . . . . . . . . . . . . . . . . . . . . . . . . . . . . 41
Financial StatementsConsolidated Profit & Loss . . . . . . . . . . . . . . . . . . . . . . . . . . . . . . . . . . . . . . . . . . . . . . . . . . . . . . . . . . . . . . . . . . 44Consolidated Comprehensive Income . . . . . . . . . . . . . . . . . . . . . . . . . . . . . . . . . . . . . . . . . . . . . . . . . . . . . . . . . 45Consolidated Statement of Financial position. . . . . . . . . . . . . . . . . . . . . . . . . . . . . . . . . . . . . . . . . . . . . . . . . . . . 46Consolidated Statement of Cash Flows . . . . . . . . . . . . . . . . . . . . . . . . . . . . . . . . . . . . . . . . . . . . . . . . . . . . . . . . 48Consolidated Statement of changes in equity. . . . . . . . . . . . . . . . . . . . . . . . . . . . . . . . . . . . . . . . . . . . . . . . . . . . 49
Supplementary notes1. General notes. . . . . . . . . . . . . . . . . . . . . . . . . . . . . . . . . . . . . . . . . . . . . . . . . . . . . . . . . . . . . . . . . . . . . . . . . 522. Financial statements formats: choice of form and classification principles . . . . . . . . . . . . . . . . . . . . . . . . . . 523. Highlights of the accounting standards . . . . . . . . . . . . . . . . . . . . . . . . . . . . . . . . . . . . . . . . . . . . . . . . . . . . . 524. Segment reporting . . . . . . . . . . . . . . . . . . . . . . . . . . . . . . . . . . . . . . . . . . . . . . . . . . . . . . . . . . . . . . . . . . . . . 605. Dividends . . . . . . . . . . . . . . . . . . . . . . . . . . . . . . . . . . . . . . . . . . . . . . . . . . . . . . . . . . . . . . . . . . . . . . . . . . . . 626. Earnings per share . . . . . . . . . . . . . . . . . . . . . . . . . . . . . . . . . . . . . . . . . . . . . . . . . . . . . . . . . . . . . . . . . . . . . 627. Assets held for sale . . . . . . . . . . . . . . . . . . . . . . . . . . . . . . . . . . . . . . . . . . . . . . . . . . . . . . . . . . . . . . . . . . . . 638. Assets with indefinite useful life. . . . . . . . . . . . . . . . . . . . . . . . . . . . . . . . . . . . . . . . . . . . . . . . . . . . . . . . . . . 639. Key money and Other intangible assets with definite useful life. . . . . . . . . . . . . . . . . . . . . . . . . . . . . . . . . . 6410. Tangible fixed assets . . . . . . . . . . . . . . . . . . . . . . . . . . . . . . . . . . . . . . . . . . . . . . . . . . . . . . . . . . . . . . . . . . . . 6411. Impairment losses . . . . . . . . . . . . . . . . . . . . . . . . . . . . . . . . . . . . . . . . . . . . . . . . . . . . . . . . . . . . . . . . . . . . . 6512. Investment property . . . . . . . . . . . . . . . . . . . . . . . . . . . . . . . . . . . . . . . . . . . . . . . . . . . . . . . . . . . . . . . . . . . 6613. Equity investments . . . . . . . . . . . . . . . . . . . . . . . . . . . . . . . . . . . . . . . . . . . . . . . . . . . . . . . . . . . . . . . . . . . . . 6614. Inventories . . . . . . . . . . . . . . . . . . . . . . . . . . . . . . . . . . . . . . . . . . . . . . . . . . . . . . . . . . . . . . . . . . . . . . . . . . . 6815. Other current assets . . . . . . . . . . . . . . . . . . . . . . . . . . . . . . . . . . . . . . . . . . . . . . . . . . . . . . . . . . . . . . . . . . . 6816. Equity attributable to the Group. . . . . . . . . . . . . . . . . . . . . . . . . . . . . . . . . . . . . . . . . . . . . . . . . . . . . . . . . . 6917. Financial liabilities . . . . . . . . . . . . . . . . . . . . . . . . . . . . . . . . . . . . . . . . . . . . . . . . . . . . . . . . . . . . . . . . . . . . . . 7018. Other non current liabilities . . . . . . . . . . . . . . . . . . . . . . . . . . . . . . . . . . . . . . . . . . . . . . . . . . . . . . . . . . . . . 7119. Derivative financial instruments. . . . . . . . . . . . . . . . . . . . . . . . . . . . . . . . . . . . . . . . . . . . . . . . . . . . . . . . . . . 7120 Hedging of financial risks (IFRS 7) . . . . . . . . . . . . . . . . . . . . . . . . . . . . . . . . . . . . . . . . . . . . . . . . . . . . . . . . . 7221. Deferred tax assets and liabilities . . . . . . . . . . . . . . . . . . . . . . . . . . . . . . . . . . . . . . . . . . . . . . . . . . . . . . . . . 7522. Other current liabilities . . . . . . . . . . . . . . . . . . . . . . . . . . . . . . . . . . . . . . . . . . . . . . . . . . . . . . . . . . . . . . . . . 7623. Provisions and potential liabilities and assets . . . . . . . . . . . . . . . . . . . . . . . . . . . . . . . . . . . . . . . . . . . . . . . . 7624. Reserves for employees. . . . . . . . . . . . . . . . . . . . . . . . . . . . . . . . . . . . . . . . . . . . . . . . . . . . . . . . . . . . . . . . . 7725. Transactions with related parties. . . . . . . . . . . . . . . . . . . . . . . . . . . . . . . . . . . . . . . . . . . . . . . . . . . . . . . . . . 7826. Personnel costs . . . . . . . . . . . . . . . . . . . . . . . . . . . . . . . . . . . . . . . . . . . . . . . . . . . . . . . . . . . . . . . . . . . . . . . 81
27. Financial income and expenses . . . . . . . . . . . . . . . . . . . . . . . . . . . . . . . . . . . . . . . . . . . . . . . . . . . . . . . . . . . 8128. Income taxes . . . . . . . . . . . . . . . . . . . . . . . . . . . . . . . . . . . . . . . . . . . . . . . . . . . . . . . . . . . . . . . . . . . . . . . . . 81
Report of Independent Auditors . . . . . . . . . . . . . . . . . . . . . . . . . . . . . . . . . . . . . . . . . . . . . . . . . . . . . . . . . . . . . . . . . . 86
TOD'S S.p.A. - IAS/IFRS Annual Report as of December 31st 2011
Report on operationsIntroduction . . . . . . . . . . . . . . . . . . . . . . . . . . . . . . . . . . . . . . . . . . . . . . . . . . . . . . . . . . . . . . . . . . . . . . . . . . . . . . 91Alternative indicators of performances . . . . . . . . . . . . . . . . . . . . . . . . . . . . . . . . . . . . . . . . . . . . . . . . . . . . . . . . 91Operating performances . . . . . . . . . . . . . . . . . . . . . . . . . . . . . . . . . . . . . . . . . . . . . . . . . . . . . . . . . . . . . . . . . . . . 91Research and development . . . . . . . . . . . . . . . . . . . . . . . . . . . . . . . . . . . . . . . . . . . . . . . . . . . . . . . . . . . . . . . . . . 95Information on Share Capital . . . . . . . . . . . . . . . . . . . . . . . . . . . . . . . . . . . . . . . . . . . . . . . . . . . . . . . . . . . . . . . . 95Corporate Governance . . . . . . . . . . . . . . . . . . . . . . . . . . . . . . . . . . . . . . . . . . . . . . . . . . . . . . . . . . . . . . . . . . . . . 95Management and coordination activities. . . . . . . . . . . . . . . . . . . . . . . . . . . . . . . . . . . . . . . . . . . . . . . . . . . . . . . . 97Significant events occurring after the end of the fiscal year . . . . . . . . . . . . . . . . . . . . . . . . . . . . . . . . . . . . . . . . . 98Business outlook . . . . . . . . . . . . . . . . . . . . . . . . . . . . . . . . . . . . . . . . . . . . . . . . . . . . . . . . . . . . . . . . . . . . . . . . . . 98Motion for allocation of the profit for the year . . . . . . . . . . . . . . . . . . . . . . . . . . . . . . . . . . . . . . . . . . . . . . . . . . 98
Financial StatementsProfit & Loss . . . . . . . . . . . . . . . . . . . . . . . . . . . . . . . . . . . . . . . . . . . . . . . . . . . . . . . . . . . . . . . . . . . . . . . . . . . . . 102Comprehensive Income. . . . . . . . . . . . . . . . . . . . . . . . . . . . . . . . . . . . . . . . . . . . . . . . . . . . . . . . . . . . . . . . . . . . . 103Statement of Financial Position . . . . . . . . . . . . . . . . . . . . . . . . . . . . . . . . . . . . . . . . . . . . . . . . . . . . . . . . . . . . . . . 104Statement of Cash flow . . . . . . . . . . . . . . . . . . . . . . . . . . . . . . . . . . . . . . . . . . . . . . . . . . . . . . . . . . . . . . . . . . . . . 106Statement of changes in equity . . . . . . . . . . . . . . . . . . . . . . . . . . . . . . . . . . . . . . . . . . . . . . . . . . . . . . . . . . . . . . . 107
Supplementary notes1. General notes. . . . . . . . . . . . . . . . . . . . . . . . . . . . . . . . . . . . . . . . . . . . . . . . . . . . . . . . . . . . . . . . . . . . . . . . . 1102. Financial statements format: choice of form and classification principles. . . . . . . . . . . . . . . . . . . . . . . . . . . 1103. Highlights of the accounting standards . . . . . . . . . . . . . . . . . . . . . . . . . . . . . . . . . . . . . . . . . . . . . . . . . . . . . 1104. Dividends . . . . . . . . . . . . . . . . . . . . . . . . . . . . . . . . . . . . . . . . . . . . . . . . . . . . . . . . . . . . . . . . . . . . . . . . . . . . 1175. Earnings per share . . . . . . . . . . . . . . . . . . . . . . . . . . . . . . . . . . . . . . . . . . . . . . . . . . . . . . . . . . . . . . . . . . . . . 1176. Assets with indefinite useful life. . . . . . . . . . . . . . . . . . . . . . . . . . . . . . . . . . . . . . . . . . . . . . . . . . . . . . . . . . . 1187. Other assets. . . . . . . . . . . . . . . . . . . . . . . . . . . . . . . . . . . . . . . . . . . . . . . . . . . . . . . . . . . . . . . . . . . . . . . . . . 1188. Tangible assets . . . . . . . . . . . . . . . . . . . . . . . . . . . . . . . . . . . . . . . . . . . . . . . . . . . . . . . . . . . . . . . . . . . . . . . . 1199. Impairment losses . . . . . . . . . . . . . . . . . . . . . . . . . . . . . . . . . . . . . . . . . . . . . . . . . . . . . . . . . . . . . . . . . . . . . 11910. Investment property . . . . . . . . . . . . . . . . . . . . . . . . . . . . . . . . . . . . . . . . . . . . . . . . . . . . . . . . . . . . . . . . . . . 12011. Investments in subsidiaries, joint ventures and associated companies . . . . . . . . . . . . . . . . . . . . . . . . . . . . . 12012. Inventories . . . . . . . . . . . . . . . . . . . . . . . . . . . . . . . . . . . . . . . . . . . . . . . . . . . . . . . . . . . . . . . . . . . . . . . . . . . 12113. Other current assets . . . . . . . . . . . . . . . . . . . . . . . . . . . . . . . . . . . . . . . . . . . . . . . . . . . . . . . . . . . . . . . . . . . 12214. Financial assets . . . . . . . . . . . . . . . . . . . . . . . . . . . . . . . . . . . . . . . . . . . . . . . . . . . . . . . . . . . . . . . . . . . . . . . . 12315. Shareholders’ equity. . . . . . . . . . . . . . . . . . . . . . . . . . . . . . . . . . . . . . . . . . . . . . . . . . . . . . . . . . . . . . . . . . . . 12316. Bank overdraft and financing . . . . . . . . . . . . . . . . . . . . . . . . . . . . . . . . . . . . . . . . . . . . . . . . . . . . . . . . . . . . . 12417. Other non current liabilities . . . . . . . . . . . . . . . . . . . . . . . . . . . . . . . . . . . . . . . . . . . . . . . . . . . . . . . . . . . . . 12518 Derivative financial instruments. . . . . . . . . . . . . . . . . . . . . . . . . . . . . . . . . . . . . . . . . . . . . . . . . . . . . . . . . . . 12519. Hedging of financial risks . . . . . . . . . . . . . . . . . . . . . . . . . . . . . . . . . . . . . . . . . . . . . . . . . . . . . . . . . . . . . . . . 12620. Deferred tax assets and liabilities . . . . . . . . . . . . . . . . . . . . . . . . . . . . . . . . . . . . . . . . . . . . . . . . . . . . . . . . . 12821. Other current liabilities . . . . . . . . . . . . . . . . . . . . . . . . . . . . . . . . . . . . . . . . . . . . . . . . . . . . . . . . . . . . . . . . . 12922. Provisions and potential liabilities and assets . . . . . . . . . . . . . . . . . . . . . . . . . . . . . . . . . . . . . . . . . . . . . . . . 13023. Reserves for employees. . . . . . . . . . . . . . . . . . . . . . . . . . . . . . . . . . . . . . . . . . . . . . . . . . . . . . . . . . . . . . . . . 13124. Transactions with related parties. . . . . . . . . . . . . . . . . . . . . . . . . . . . . . . . . . . . . . . . . . . . . . . . . . . . . . . . . . 13225. Personnel costs . . . . . . . . . . . . . . . . . . . . . . . . . . . . . . . . . . . . . . . . . . . . . . . . . . . . . . . . . . . . . . . . . . . . . . . 13526. Financial income and expenses . . . . . . . . . . . . . . . . . . . . . . . . . . . . . . . . . . . . . . . . . . . . . . . . . . . . . . . . . . . 13627. Income from subsidiaries . . . . . . . . . . . . . . . . . . . . . . . . . . . . . . . . . . . . . . . . . . . . . . . . . . . . . . . . . . . . . . . . 13628. Income taxes . . . . . . . . . . . . . . . . . . . . . . . . . . . . . . . . . . . . . . . . . . . . . . . . . . . . . . . . . . . . . . . . . . . . . . . . . 13629. Independent Auditors compensation. . . . . . . . . . . . . . . . . . . . . . . . . . . . . . . . . . . . . . . . . . . . . . . . . . . . . . . 13730. Certification of the Separate Financial Statements of TOD’S S.p.A. and the Consolidated
Financial Statements of the TOD’S Group pursuant to Article 81-ter of Consob Regulationno. 11971 of May 14th, 1999, as amended . . . . . . . . . . . . . . . . . . . . . . . . . . . . . . . . . . . . . . . . . . . . . . . . . . . 138
Report of the Board of Statutory Auditors. . . . . . . . . . . . . . . . . . . . . . . . . . . . . . . . . . . . . . . . . . . . . . . . . . . . . . . . . . 142
Report of Independent Auditors . . . . . . . . . . . . . . . . . . . . . . . . . . . . . . . . . . . . . . . . . . . . . . . . . . . . . . . . . . . . . . . . . . 145
2011Annual Report
5 Table of contents

2011Annual report
Diego DellaValleChairman and Chief Executive Officer
2011Annual Report
9 Letter to our Shareholders
Letter to our Shareholders
Dear Shareholders,
I’m pleased to comment excellent results for our Group also this year, which are even more significant if we consid-er that they were achieved in particularly difficult times for the market. The double-digit growth in sales has been ac-companied by a considerable improvement in operating profitability and, even more importantly, in the net profits.
These results confirm that our business model is successful and that our growth strategy, which combines thedevelopment of revenues and profits, is valid and effective.
In the course of the year, each trademark continued to develop on the basis of its guidelines for growth, both ge-ographically and in terms of product categories, maintaining a selective distribution policy, aiming to preservingits exclusive positioning.Excellent results were achieved in the USA and Asia, the markets with the greatest growth potential at the pres-ent time, in which Tod’s has a particularly high brand awareness.
Our Group has a well developed international distribution network, with flagship stores in the most prestigiousshopping streets of the world. This year, as in the past, we continued to invest in the extension and modernisa-tion of the network. Our new store opening policy this year focused on the Chinese market, which offers thegreatest potential for growth and in which the Group had 41 directly operated stores at the end of December.
In our firm, which is leader in one of the major districts for luxury shoes and leather goods of the world, the crafts-manship of the made in Italy lives together with a highly efficient logistic structure; therefore we are confident tohave all the production capacity necessary to face the future growth of turnover, while keeping the same top qual-ity levels. Our skilled personnel has also the task to train new young employees and to teach team our values ofcraftsmanship, quality and passion for details.
Our client are loyal to our products, which are more and more appreciated for their highest quality and recog-nisability, and their nature to be timeless icons, not linked to fashion trends. To purchase our products is the re-alization of a dream, but also an investment.
In 2011, we set up an agreement with the Ministry for the Cultural Affairs and the Supervisor for central Rome’sarchaeological area, to became the sole sponsor for the restructuring works on the Coliseum, with a total com-mittment of 25 million Euros, spread during the duration of the works. Tod’s also became a Permanent FoundingMember of the La Scala Theatre Foundation of Milan, for which it will pay out a sum of 5.2 million Euros to sup-port the activities of the theatre.Tod’s, which is one of the most prestigious names in Italian made products, believes that it is its duty, as well asan honour, to contribute to the image of two of the most famous symbols of Italy in the eyes of the world.
The Group has also confirmed its sound financial situation, high quality receivables, a solidly positive cash balanceand a strong cashflow. Once again this year, we increased the dividend, confirming a significant and stable payout,which guarantees a very interesting return for the shareholders, while, at the same time, ensuring that the Groupretains all the resources it needs to drive its growth.
As always, I wish to express my sincere thanks to all the Group employees for their commitment and dedication,to you, the shareholders, for the confidence you have shown in the company, and to all our customers for theirappreciation of the very high quality of our products.
Kindest regards,Diego DellaValleChairman of the Board of Directors
2011Annual Report
10 Company’s data
Company’s data
Registered office
TOD’S S.p.A.Via Filippo DellaValle, 163811 Sant’Elpidio a Mare (Fermo) - ItalyTel. +39 0734 8661
Legal dataParent company
Share capital resolved euro 61,218,802Share capital subscribed and paid euro 61,218,802Fiscal Code and registration number on Company Register of Court of Fermo: 01113570442Registered with the Chamber of Commerce of Fermo under n. 114030 R.E.A.
Offices and Showrooms Dusseldorf - Kaistrasse, 2Hong Kong - Three Pacific Place, 1 Queen’s Road EastLondon - Old Bond Street, 16Milan - CorsoVenezia, 30Milan -Via Savona, 56Milan -Via Serbelloni 1-4Milan -Via della Spiga, 22NewYork - 450,West 15th StreetParis - Rue Royale, 20Seoul - 89-10, Cheongdam-dong, Kangnam-kuShanghai - 1717 Nanjing West Road,Wheelock Square 45/FTokyo - Omotesando Building, 5-1-5 Jingumae
Production facilities Comunanza (AP) -Via Merloni, 7Comunanza (AP) -Via S. Maria, 2-4-6Sant’Elpidio a Mare (FM) -Via Filippo DellaValle, 1Bagno a Ripoli, Loc.Vallina (FI) -Via del Roseto, 60Bagno a Ripoli, Loc.Vallina (FI) -Via del Roseto, 50Tolentino (MC) -Via Sacharov 41/43
2011Annual Report
11 Corporate Governance bodies
Corporate Governance bodies
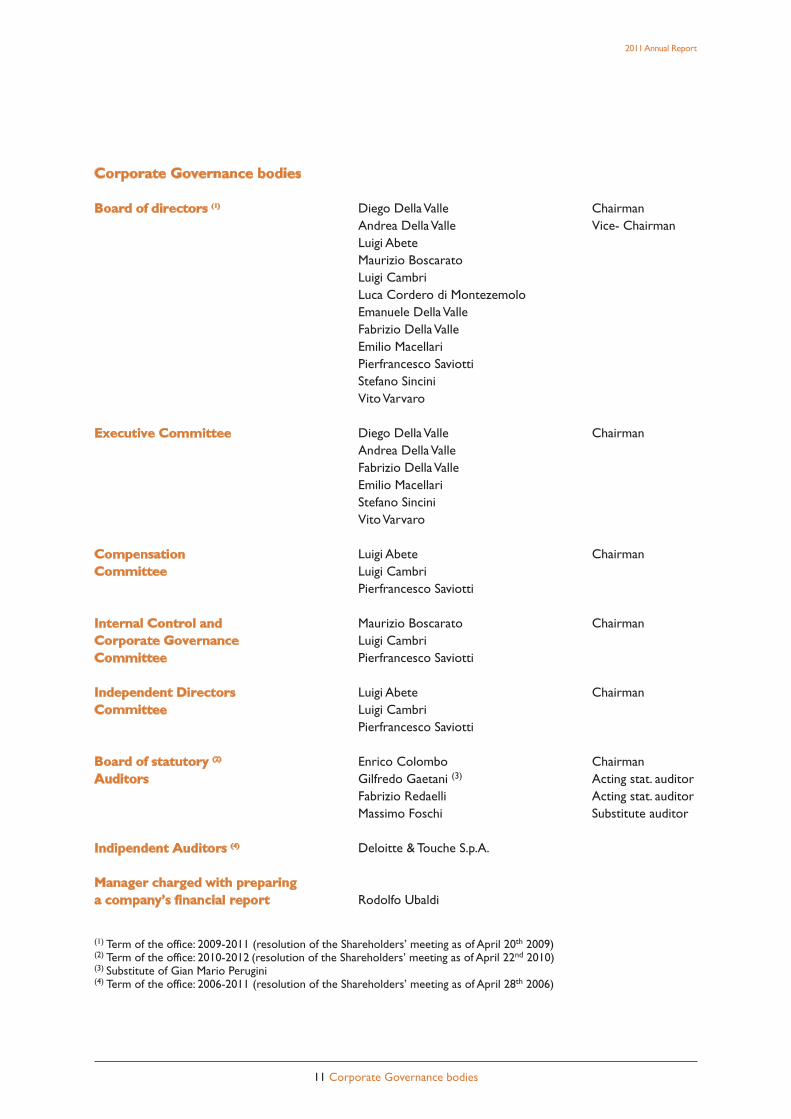
Board of directors (1) Diego DellaValle ChairmanAndrea DellaValle Vice- ChairmanLuigi AbeteMaurizio BoscaratoLuigi CambriLuca Cordero di MontezemoloEmanuele DellaValleFabrizio DellaValleEmilio MacellariPierfrancesco SaviottiStefano SinciniVitoVarvaro
Executive Committee Diego DellaValle ChairmanAndrea DellaValleFabrizio DellaValleEmilio MacellariStefano SinciniVitoVarvaro
Compensation Luigi Abete ChairmanCommittee Luigi Cambri
Pierfrancesco Saviotti
Internal Control and Maurizio Boscarato ChairmanCorporate Governance Luigi CambriCommittee Pierfrancesco Saviotti
Independent Directors Luigi Abete ChairmanCommittee Luigi Cambri
Pierfrancesco Saviotti
Board of statutory (2) Enrico Colombo ChairmanAuditors Gilfredo Gaetani (3) Acting stat. auditor
Fabrizio Redaelli Acting stat. auditorMassimo Foschi Substitute auditor
Indipendent Auditors (4) Deloitte & Touche S.p.A.
Manager charged with preparinga company’s financial report Rodolfo Ubaldi
(1) Term of the office: 2009-2011 (resolution of the Shareholders’ meeting as of April 20th 2009)(2) Term of the office: 2010-2012 (resolution of the Shareholders’ meeting as of April 22nd 2010)(3) Substitute of Gian Mario Perugini(4) Term of the office: 2006-2011 (resolution of the Shareholders’ meeting as of April 28th 2006)
2011Annual Report
12 Composition of the Group
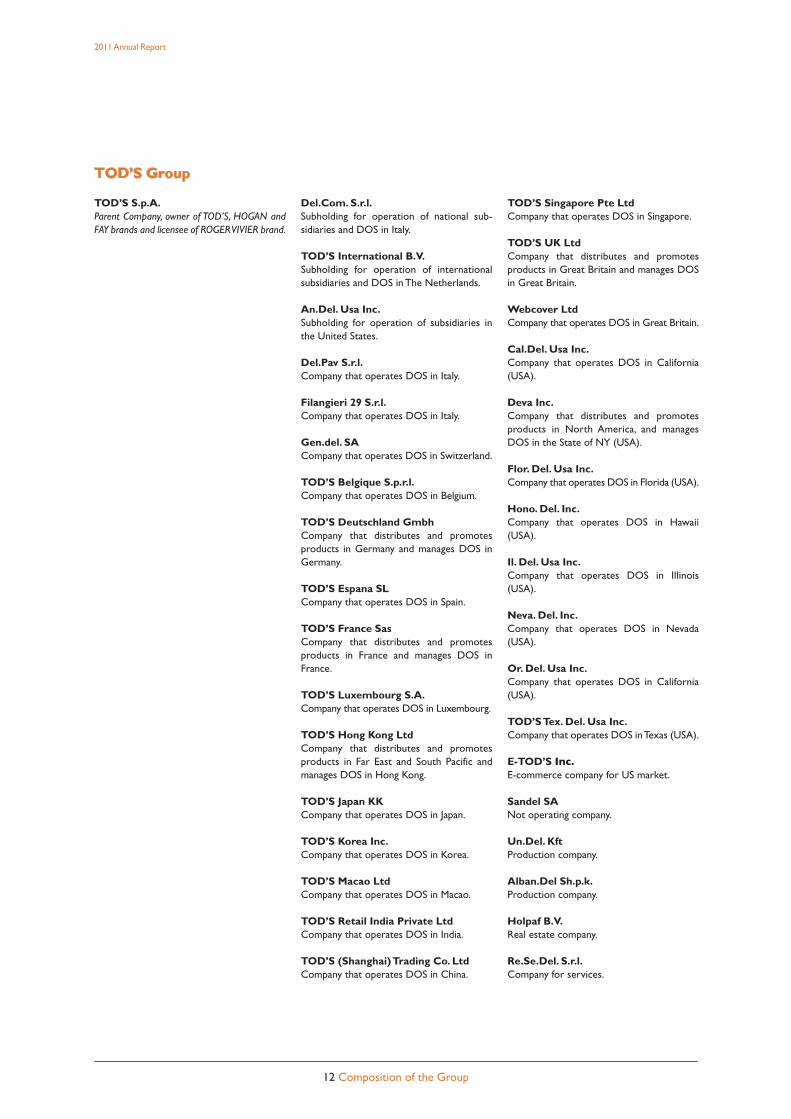
TOD’S S.p.A.Parent Company, owner of TOD’S, HOGAN andFAY brands and licensee of ROGERVIVIER brand.
Del.Com. S.r.l.Subholding for operation of national sub-sidiaries and DOS in Italy.
TOD’S International B.V.Subholding for operation of internationalsubsidiaries and DOS in The Netherlands.
An.Del. Usa Inc.Subholding for operation of subsidiaries inthe United States.
Del.Pav S.r.l.Company that operates DOS in Italy.
Filangieri 29 S.r.l.Company that operates DOS in Italy.
Gen.del. SACompany that operates DOS in Switzerland.
TOD’S Belgique S.p.r.l.Company that operates DOS in Belgium.
TOD’S Deutschland GmbhCompany that distributes and promotesproducts in Germany and manages DOS inGermany.
TOD’S Espana SLCompany that operates DOS in Spain.
TOD’S France SasCompany that distributes and promotesproducts in France and manages DOS inFrance.
TOD’S Luxembourg S.A.Company that operates DOS in Luxembourg.
TOD’S Hong Kong LtdCompany that distributes and promotesproducts in Far East and South Pacific andmanages DOS in Hong Kong.
TOD’S Japan KKCompany that operates DOS in Japan.
TOD’S Korea Inc.Company that operates DOS in Korea.
TOD’S Macao LtdCompany that operates DOS in Macao.
TOD’S Retail India Private LtdCompany that operates DOS in India.
TOD’S (Shanghai)Trading Co. LtdCompany that operates DOS in China.
TOD’S Singapore Pte LtdCompany that operates DOS in Singapore.
TOD’S UK LtdCompany that distributes and promotesproducts in Great Britain and manages DOSin Great Britain.
Webcover LtdCompany that operates DOS in Great Britain.
Cal.Del. Usa Inc.Company that operates DOS in California(USA).
Deva Inc.Company that distributes and promotesproducts in North America, and managesDOS in the State of NY (USA).
Flor. Del. Usa Inc.Company that operates DOS in Florida (USA).
Hono. Del. Inc.Company that operates DOS in Hawaii(USA).
Il. Del. Usa Inc.Company that operates DOS in Illinois(USA).
Neva. Del. Inc.Company that operates DOS in Nevada(USA).
Or. Del. Usa Inc.Company that operates DOS in California(USA).
TOD’STex. Del. Usa Inc.Company that operates DOS inTexas (USA).
E-TOD’S Inc.E-commerce company for US market.
Sandel SANot operating company.
Un.Del. KftProduction company.
Alban.Del Sh.p.k.Production company.
Holpaf B.V.Real estate company.
Re.Se.Del. S.r.l.Company for services.
TOD’S Group
2011Annual Report
13 Composition of the Group
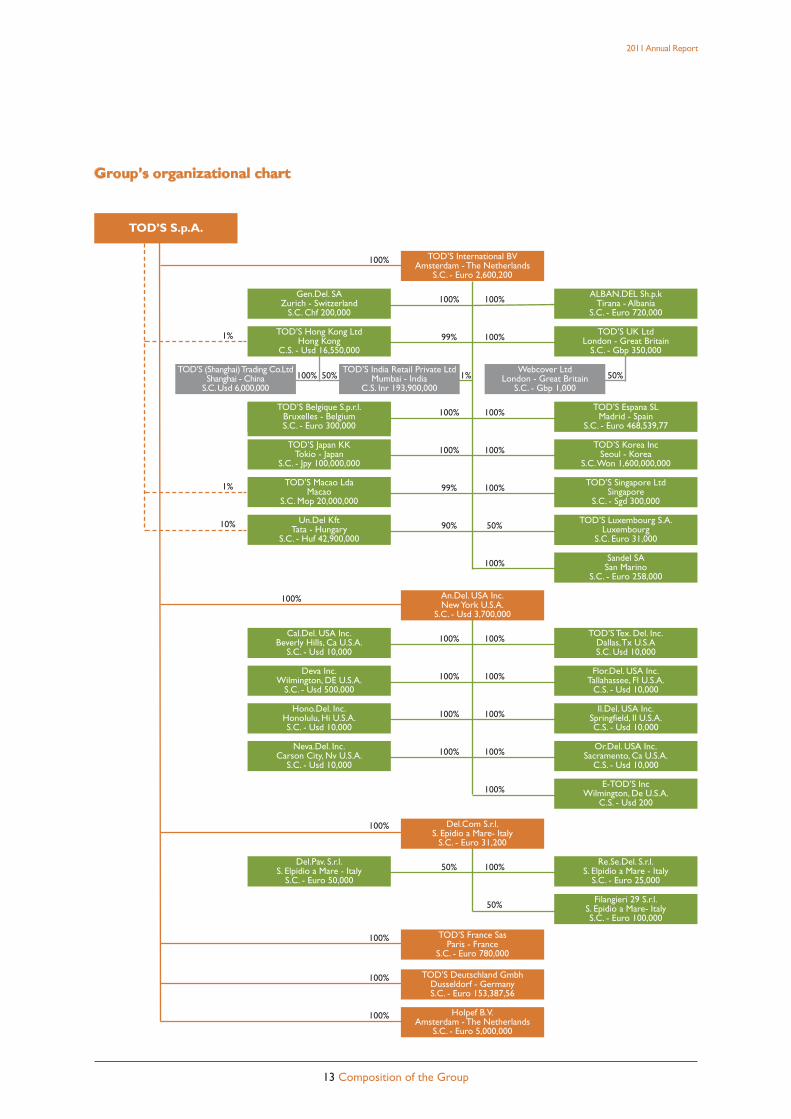
Group’s organizational chart
TOD’S S.p.A.
Gen.Del. SAZurich - Switzerland
S.C. Chf 200,000
TOD’S Belgique S.p.r.l.Bruxelles - BelgiumS.C. - Euro 300,000
TOD’S Japan KKTokio - Japan
S.C. - Jpy 100,000,000
TOD’S Macao LdaMacao
S.C. Mop 20,000,000
Un.Del KftTata - Hungary
S.C. - Huf 42,900,000
Cal.Del. USA Inc.Beverly Hills, Ca U.S.A.
S.C. - Usd 10,000
Deva Inc.Wilmington, DE U.S.A.
S.C. - Usd 500,000
Hono.Del. Inc.Honolulu, Hi U.S.A.S.C. - Usd 10,000
Neva.Del. Inc.Carson City, Nv U.S.A.
S.C. - Usd 10,000
Del.Pav. S.r.l.S. Elpidio a Mare - Italy
S.C. - Euro 50,000
TOD’S Espana SLMadrid - Spain
S.C. - Euro 468,539,77
TOD’S Korea IncSeoul - Korea
S.C.Won 1,600,000,000
TOD’S Singapore LtdSingapore
S.C. - Sgd 300,000
TOD’S Luxembourg S.A.Luxembourg
S.C. Euro 31,000
Sandel SASan Marino
S.C. - Euro 258,000
TOD’S Tex. Del. Inc.Dallas,Tx U.S.AS.C. Usd 10,000
Flor.Del. USA Inc.Tallahassee, Fl U.S.A.
C.S. - Usd 10,000
Il.Del. USA Inc.Springfield, Il U.S.A.C.S. - Usd 10,000
Or.Del. USA Inc.Sacramento, Ca U.S.A.
C.S. - Usd 10,000
Re.Se.Del. S.r.l.S. Elpidio a Mare - Italy
S.C. - Euro 25,000
Filangieri 29 S.r.l.S. Epidio a Mare- ItalyS.C. - Euro 100,000
TOD’S International BVAmsterdam - The Netherlands
S.C. - Euro 2,600,200
TOD’S Deutschland GmbhDusseldorf - GermanyS.C. - Euro 153,387,56
Holpef B.V.Amsterdam - The Netherlands
S.C. - Euro 5,000,000
ALBAN.DEL Sh.p.kTirana - Albania
S.C. - Euro 720,000
TOD’S India Retail Private LtdMumbai - India
C.S. Inr 193,900,000
An.Del. USA Inc.NewYork U.S.A.
S.C. - Usd 3,700,000
Del.Com S.r.l.S. Epidio a Mare- Italy
S.C. - Euro 31,200
100%
99%
100%
100%
99%
90%
1%
1%
10%
100%
100%
100%
100%
E-TOD’S IncWilmington, De U.S.A.
C.S. - Usd 200100%
50%
100%
100%
100%
100%
100%
50%
100%
100%
100%
100%
100%
100%
50%
100%
TOD’S France SasParis - France
S.C. - Euro 780,000
100%
100%
100%
100%
TOD’S (Shanghai)Trading Co.LtdShanghai - China
S.C.Usd 6,000,000
TOD’S UK LtdLondon - Great Britain
S.C. - Gbp 350,000
TOD’S Hong Kong LtdHong Kong
C.S. - Usd 16,550,000
100% 50% 1%Webcover Ltd
London - Great BritainS.C. - Gbp 1,000
50%
100%
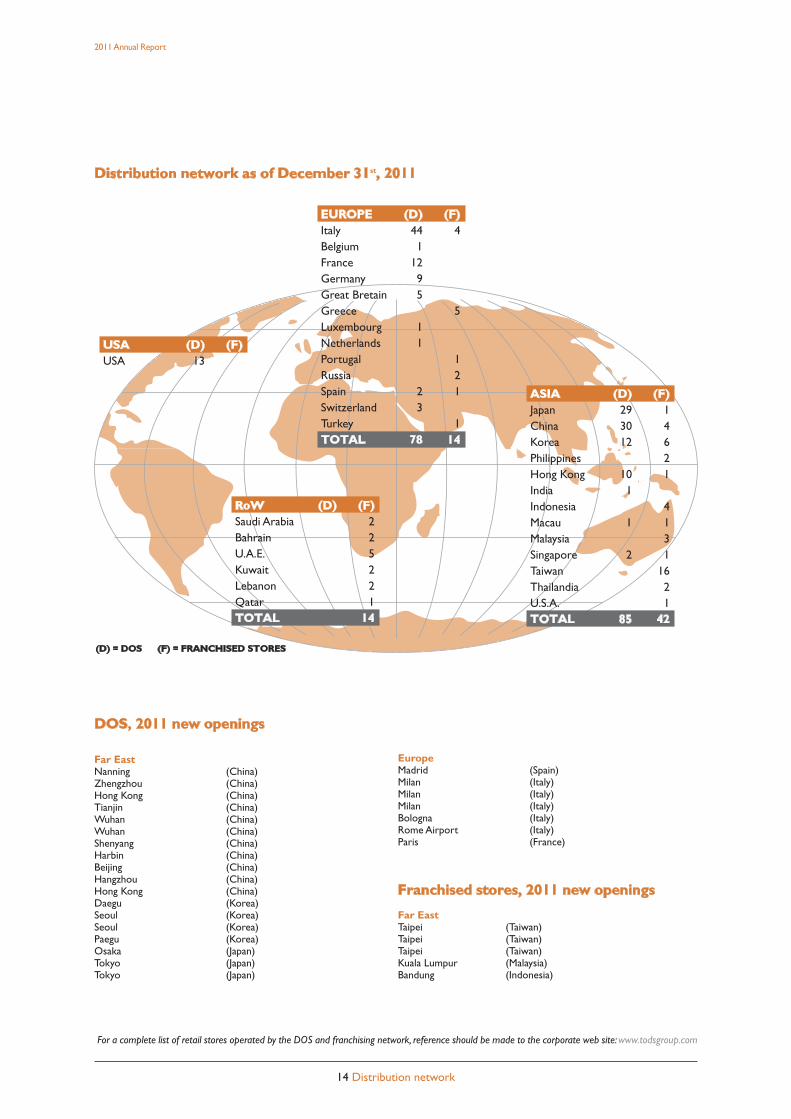
Distribution network as of December 31st, 2011
2011Annual Report
14 Distribution network
DOS, 2011 new openings
Far EastNanning (China)Zhengzhou (China)Hong Kong (China)Tianjin (China)Wuhan (China)Wuhan (China)Shenyang (China)Harbin (China)Beijing (China)Hangzhou (China)Hong Kong (China)Daegu (Korea)Seoul (Korea)Seoul (Korea)Paegu (Korea)Osaka (Japan)Tokyo (Japan)Tokyo (Japan)
EuropeMadrid (Spain)Milan (Italy)Milan (Italy)Milan (Italy)Bologna (Italy)Rome Airport (Italy)Paris (France)
Franchised stores, 2011 new openings
Far EastTaipei (Taiwan)Taipei (Taiwan)Taipei (Taiwan)Kuala Lumpur (Malaysia)Bandung (Indonesia)
For a complete list of retail stores operated by the DOS and franchising network, reference should be made to the corporate web site:www.todsgroup.com
EUROPE (D) (F)Italy 44 4Belgium 1France 12Germany 9Great Bretain 5Greece 5Luxembourg 1Netherlands 1Portugal 1Russia 2Spain 2 1Switzerland 3Turkey 1TOTAL 78 14
RoW (D) (F)Saudi Arabia 2Bahrain 2U.A.E. 5Kuwait 2Lebanon 2Qatar 1TOTAL 14
ASIA (D) (F)Japan 29 1China 30 4Korea 12 6Philippines 2Hong Kong 10 1India 1Indonesia 4Macau 1 1Malaysia 3Singapore 2 1Taiwan 16Thailandia 2U.S.A. 1TOTAL 85 42
USA (D) (F)USA 13
(D) = DOS (F) = FRANCHISED STORES
2011Annual Report
15 Key consolidated financial figures
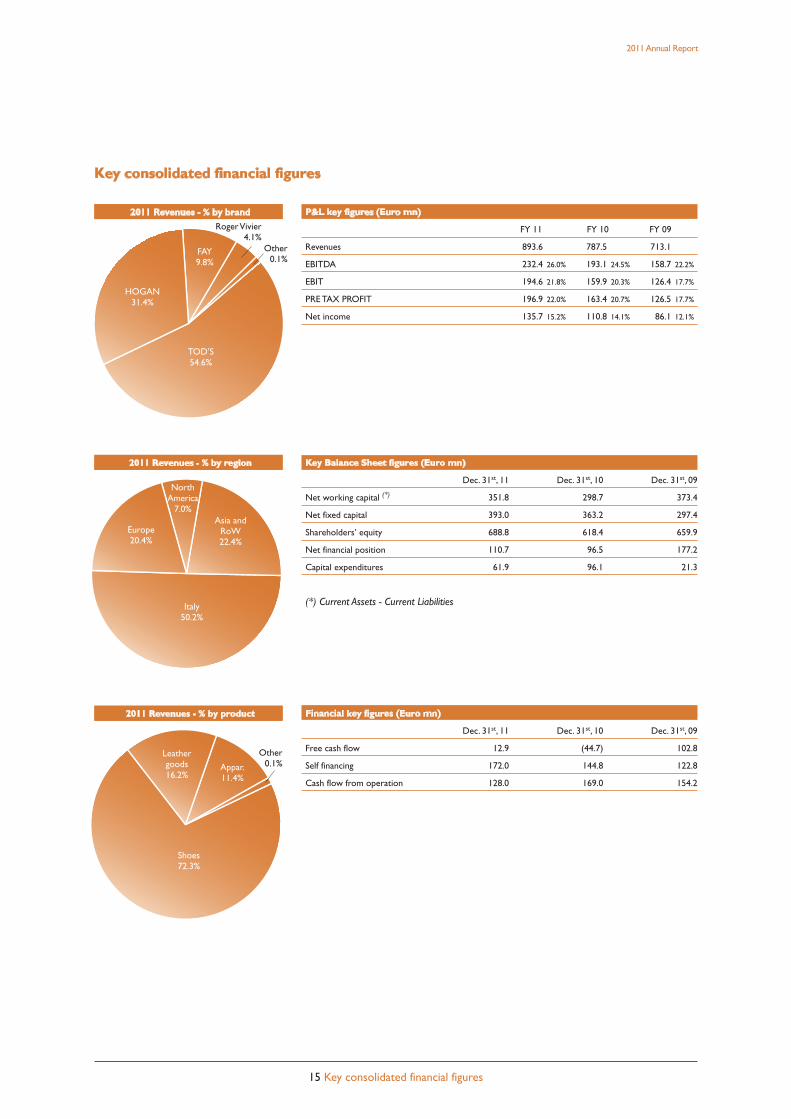
Key consolidated financial figures
P&L key figures (Euro mn)
FY 11 FY 10 FY 09
Revenues 893.6 787.5 713.1
EBITDA 232.4 26.0% 193.1 24.5% 158.7 22.2%
EBIT 194.6 21.8% 159.9 20.3% 126.4 17.7%
PRE TAX PROFIT 196.9 22.0% 163.4 20.7% 126.5 17.7%
Net income 135.7 15.2% 110.8 14.1% 86.1 12.1%
Key Balance Sheet figures (Euro mn)
Dec. 31st, 11 Dec. 31st, 10 Dec. 31st, 09
Net working capital (*) 351.8 298.7 373.4
Net fixed capital 393.0 363.2 297.4
Shareholders’ equity 688.8 618.4 659.9
Net financial position 110.7 96.5 177.2
Capital expenditures 61.9 96.1 21.3
(*) Current Assets - Current Liabilities
Financial key figures (Euro mn)
Dec. 31st, 11 Dec. 31st, 10 Dec. 31st, 09
Free cash flow 12.9 (44.7) 102.8
Self financing 172.0 144.8 122.8
Cash flow from operation 128.0 169.0 154.2
2011 Revenues - % by brand
2011 Revenues - % by region
2011 Revenues - % by product
TOD’S54.6%
HOGAN31.4%
FAY9.8%
RogerVivier4.1%
Europe20.4%
NorthAmerica
7.0%Asia and
RoW22.4%
Italy50.2%
Leathergoods16.2%
Appar.11.4%
Shoes72.3%
Other0.1%
Other0.1%
2011Annual Report
16 Highlights of results
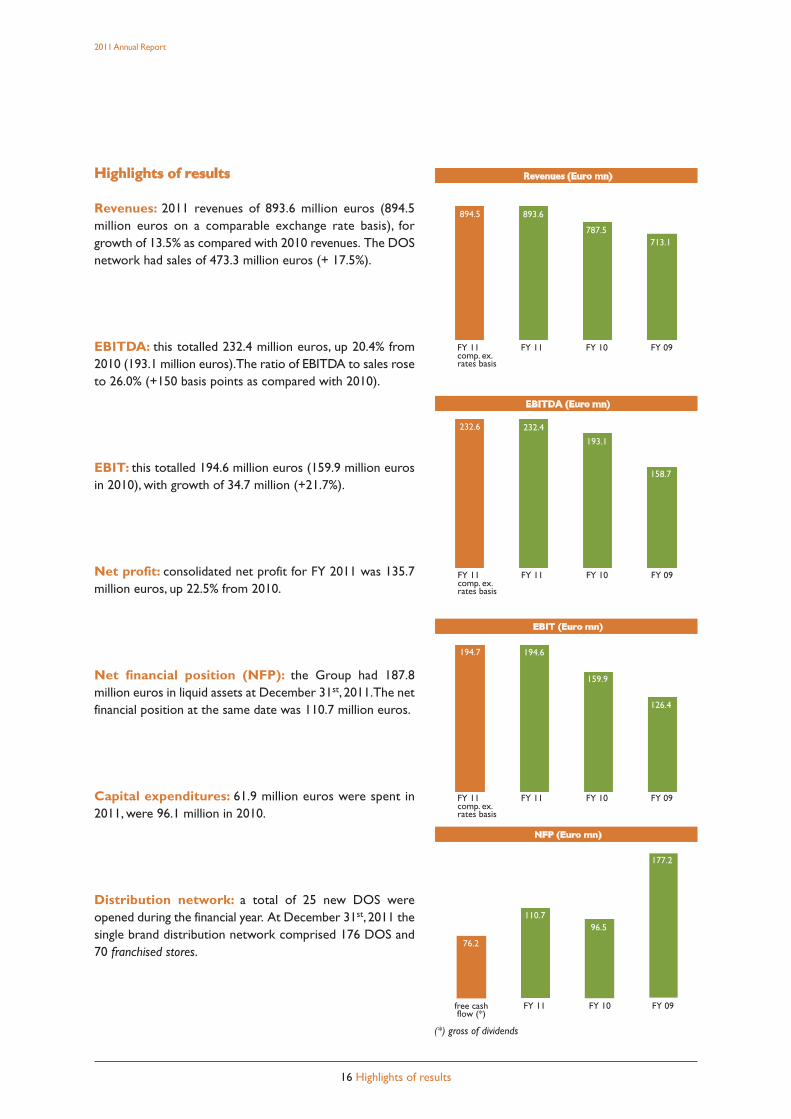
Highlights of results
Revenues: 2011 revenues of 893.6 million euros (894.5million euros on a comparable exchange rate basis), forgrowth of 13.5% as compared with 2010 revenues. The DOSnetwork had sales of 473.3 million euros (+ 17.5%).
EBITDA: this totalled 232.4 million euros, up 20.4% from2010 (193.1 million euros).The ratio of EBITDA to sales roseto 26.0% (+150 basis points as compared with 2010).
EBIT: this totalled 194.6 million euros (159.9 million eurosin 2010), with growth of 34.7 million (+21.7%).
Net profit: consolidated net profit for FY 2011 was 135.7million euros, up 22.5% from 2010.
Net financial position (NFP): the Group had 187.8million euros in liquid assets at December 31st, 2011.The netfinancial position at the same date was 110.7 million euros.
Capital expenditures: 61.9 million euros were spent in2011, were 96.1 million in 2010.
Distribution network: a total of 25 new DOS wereopened during the financial year. At December 31st, 2011 thesingle brand distribution network comprised 176 DOS and70 franchised stores.
Revenues (Euro mn)
FY 11 FY 11 FY 10 FY 09comp. ex.rates basis
893.6894.5
787.5713.1
EBITDA (Euro mn)
FY 11 FY 11 FY 10 FY 09comp. ex.rates basis
232.4232.6
193.1
158.7
EBIT (Euro mn)
FY 11 FY 11 FY 10 FY 09comp. ex.rates basis
194.6194.7
159.9
126.4
NFP (Euro mn)
free cash FY 11 FY 10 FY 09flow (*)
110.7
76.2
96.5
177.2
(*) gross of dividends
2011Annual Report
17 Highlights of results
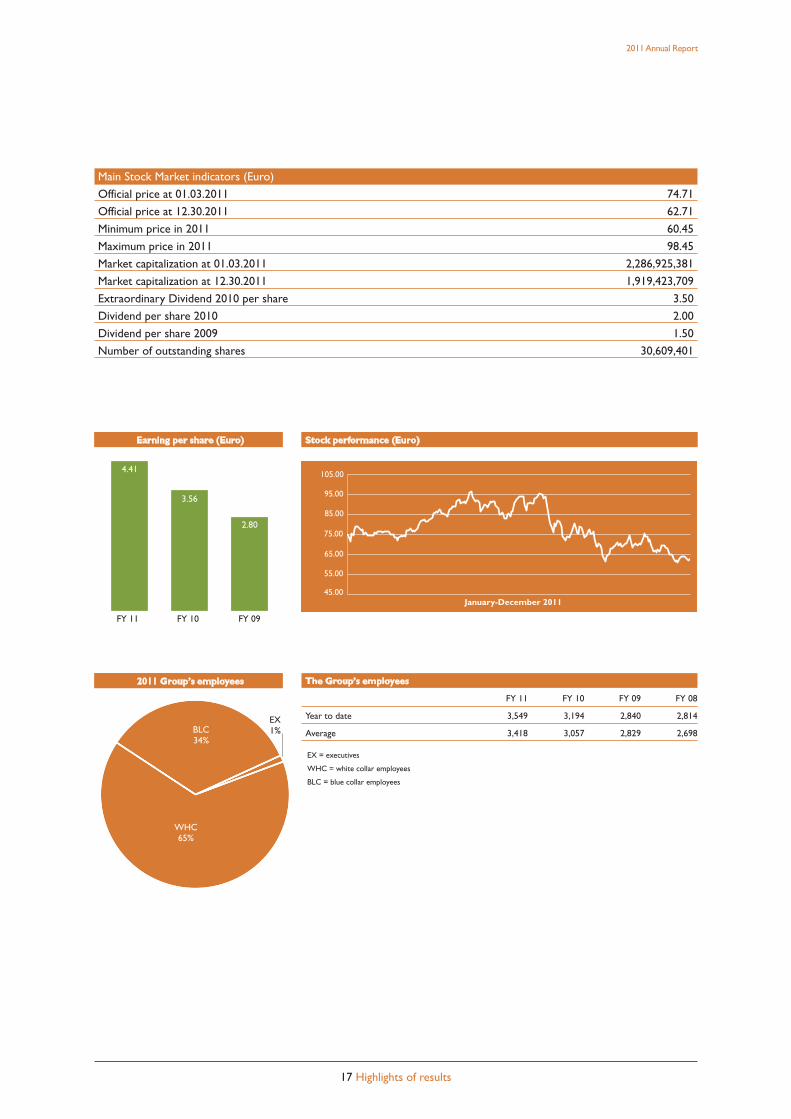
The Group’s employees
FY 11 FY 10 FY 09 FY 08
Year to date 3,549 3,194 2,840 2,814
Average 3,418 3,057 2,829 2,698
EX = executives
WHC = white collar employees
BLC = blue collar employees
Earning per share (Euro) Stock performance (Euro)
FY 11 FY 10 FY 09
3.56
4.41
2.80
2011 Group’s employees
BLC34%
WHC65%
EX1%
Main Stock Market indicators (Euro)
Official price at 01.03.2011 74.71
Official price at 12.30.2011 62.71
Minimum price in 2011 60.45
Maximum price in 2011 98.45
Market capitalization at 01.03.2011 2,286,925,381
Market capitalization at 12.30.2011 1,919,423,709
Extraordinary Dividend 2010 per share 3.50
Dividend per share 2010 2.00
Dividend per share 2009 1.50
Number of outstanding shares 30,609,401
45.00
55.00
65.00
75.00
85.00
95.00
105.00
January-December 2011

[THIS PAGE HAS BEEN INTENTIONALLY LEFT BLANK]
18 2011 Annual Report
HOGAN.COM

TOD’S GROUP – CONSOLIDATED FINANCIAL STATEMENTSAS AT DECEMBER 31ST 2011

REPORT ON OPERATIONS
Group2011Annual Report
29 Report on operations
Introduction
The Report of the Board of Directors on Operations is based on the TOD’S Group Consolidated FinancialStatements at December 31st, 2011, prepared in accordance with IAS/IFRS (International Accounting Standards –IAS, and International Financial Reporting Standards – IFRS) issued by the IASB and approved by the EuropeanUnion at the same date. IAS/IFRS refers also to all revised International Accounting Standards (IAS) and all interpre-tative documents issued by the IFRIC (International Financial Reporting Interpretations Committee), previously nomi-nated Standing Interpretations Committee (SIC).The Consolidated Financial Statements have been prepared on the assumption that the Group can operate as agoing concern.The Group believes that there are no asset, liability, financial or organizational indicators of mate-rial uncertainties, as defined in paragraph 25 of IAS 1 on business continuity.The Report on Operations must be read together with the Financial Statements and Notes to the FinancialStatements,which are an integral part of the 2011 ConsolidatedAnnual Report.The Report on Operations also in-cludes the additional information required by CONSOB,pursuant to the orders issued in implementation ofArticle9 of Legislative Decree 38/2005 (Resolutions 15519 and 15520 of July 27th, 2006 and memorandum DEM/6064293of July 28th, 2006, as well as all subsequent notices containing provisions regarding financial disclosures.
Alternative indicators of performances
In order to strip the effects of changes in exchange rates with respect to the average values for the previous yearfrom the results for the 2011 financial year, the typical economic reference indicators (Revenues,EBITDA and EBIT)have been recalculated by applying the average exchange rates for 2010, rendering them fully comparable withthose for the previous reference period. Note that on the one hand, these principles for measurement of busi-ness performance represent a key to interpretation of results not envisaged in IFRSs, and on the other hand, mustnot be considered as substitutes for what is set out in those standards.
Group’s activity
The TOD’S Group operates in the luxury sector under its proprietary brands (TOD’S, HOGAN and FAY) and li-censed brands (ROGERVIVIER). It actively creates, produces and distributes shoes, leather goods and accessories,and apparel.The firm’s mission is to offer global customers top-quality products that satisfy their functional re-quirements and aspirations.
Development of production. The Group’s production structure is based on complete control of the productionprocess, from creation of the collections to production and then distribution of the products.This approach isconsidered key to assuring the prestige of its brands.Shoes and leather goods are produced in Group-owned plants,with partial outsourcing to specialized workshops.All of these outsourcers are located in areas with a strong tradition of shoe and leather good production.Thispreference reflects the fact that an extremely high standard of professional quality is required to make these items,with a significantly high level of added value contributed to the final product by manual work.The Group relies exclusively on selected specialized outsourcers, which enables it to exploit their respective spe-cializations in crafting the individual products sold as part of the apparel line.
Distribution structure. The prestige of the Group’s brands and the high degree of specialization necessary tooffer the respective products to customers entails distribution through a network of similarly specialized stores.Accordingly, the Group relies principally on three channels:DOS (directly operated stores), franchised retail stores,and a series of selected, independent multibrand stores.The Group’s strategy is focused on development of the DOS and franchising networks, given that these channelsoffer greater control and more faithful transmission of the individual brands. It is also clear that, in particular mar-
Group2011Annual Report
30 Report on operations
ket situations, distribution through independent multibrand stores is more efficient.This channel is of key impor-tance to the Group.
Group’s brands
The Tod’s brand is known for shoes and luxury leather goods, with styles that have become icons of modern liv-ing;Tod’s is known in the luxury goods sector as a symbol of the perfect combination of tradition, quality andmodernity. Each product is hand-crafted with highly-skilled techniques, intended, after laborious reworking, to be-come an exclusive, recognisable, modern and practical object. Some styles, like the Driving Shoe and the D bag,are cherished by celebrities and ordinary people worldwide, and have become icons and forerunners of a new con-cept of elegance, for both women and men.
Begun in the 80s with shoe collections for women, men and children, the Hogan brand now also crafts variousleather goods items.The Hogan brand is distinctive for high quality, functionality and design. Every product stemsfrom a highly skilled design technique and is created using quality materials with a particular passion for detailsand a search for perfection.Hogan products are the highest expression of a “new luxury” lifestyle.Hogan is meantfor someone who cherishes the type of luxury associated with product excellence, innovative original design andconsummate practicality.The Traditional and the Interactive shoe styles endure as continuing “best sellers”.
FAY is a brand created in the mid 80s with a product range of high quality casual wear.The brand is known for itsquality craftsmanship, for the excellence of its materials, a meticulous attention to craft details and its high function-ality without sacrificing style and quality. FAY products are wearable everywhere: from the stadium to the office, inurban areas and in the countryside.The line, which has seasonal men’s, women’s and junior’s collections, focuses onclassic evergreen styles, continuously modified and refreshed with innovative and recognisably eye-catching design.
The Fabergé of shoes, and creator of the first stiletto heel in the 1950’s, Roger Vivier designed extravagant andluxuriously decorated shoes that he described as being “sculptures.” The artistic heritage and excellent tradition-al roots of theVivier fashion house have been revived through acquisition of the brand by Diego DellaValle.Underthe management of Creative Director Bruno Frisoni,Vivier’s work and vision endure. New chapters are added tothis unique life story every year, which goes beyond expertise in the craft of shoe making to include handbags,small leather goods, jewellery and sunglasses.
Group2011Annual Report
31 Report on operations
Organizational structure of the Group
The Group’s organisational configuration rotates around TOD’S S.p.A. that is at the heart of the Group’s organi-sation, its parent company that owns the TOD’S, HOGAN and FAY brands, holds the licenses of the ROGERVIVIER, and manages the Group’s production and distribution.Through a series of sub-holdings, the organisationis rounded out by a series of commercial companies that are delegated complete responsibility for retail distri-bution through the DOS network.Certain of them, strategically located on international markets, are assigned ma-jor roles in product distribution, marketing and promotion, and public relations processes along the “value chain”,while simultaneously guaranteeing the uniform image that Group brands must have worldwide.
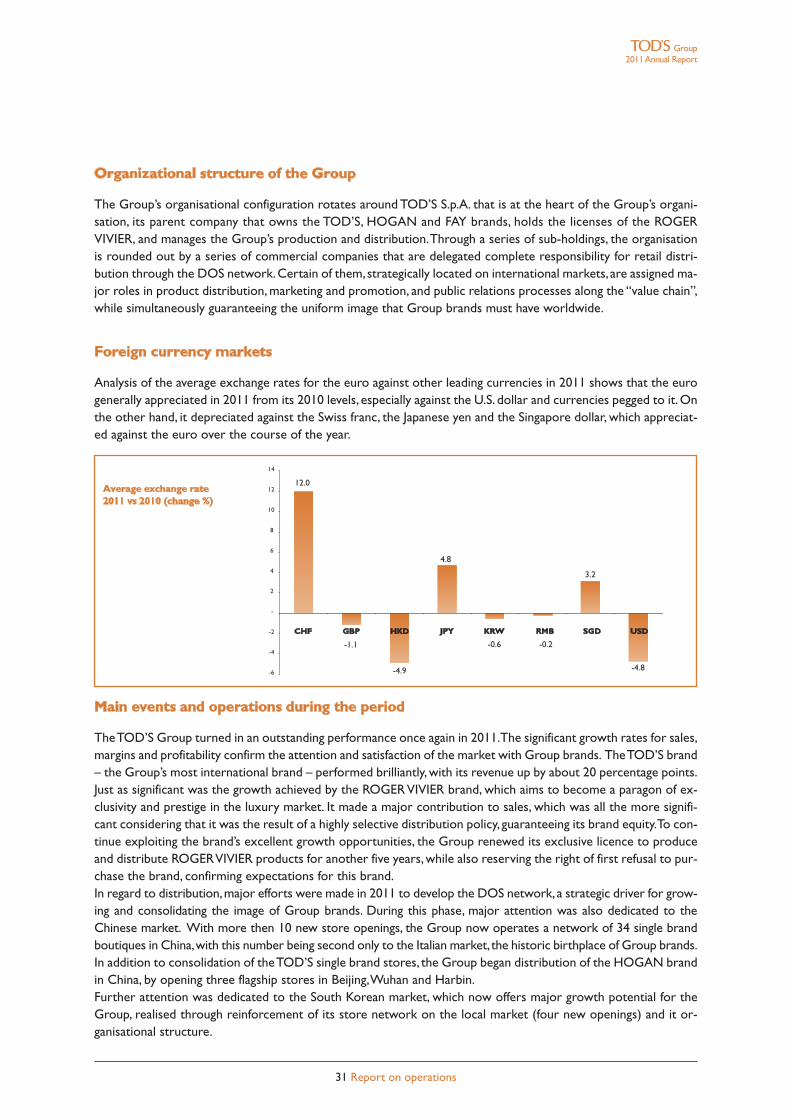
Foreign currency markets
Analysis of the average exchange rates for the euro against other leading currencies in 2011 shows that the eurogenerally appreciated in 2011 from its 2010 levels, especially against the U.S. dollar and currencies pegged to it.Onthe other hand, it depreciated against the Swiss franc, the Japanese yen and the Singapore dollar, which appreciat-ed against the euro over the course of the year.
Main events and operations during the period
TheTOD’S Group turned in an outstanding performance once again in 2011.The significant growth rates for sales,margins and profitability confirm the attention and satisfaction of the market with Group brands. TheTOD’S brand– the Group’s most international brand – performed brilliantly,with its revenue up by about 20 percentage points.Just as significant was the growth achieved by the ROGERVIVIER brand, which aims to become a paragon of ex-clusivity and prestige in the luxury market. It made a major contribution to sales, which was all the more signifi-cant considering that it was the result of a highly selective distribution policy, guaranteeing its brand equity.To con-tinue exploiting the brand’s excellent growth opportunities, the Group renewed its exclusive licence to produceand distribute ROGERVIVIER products for another five years, while also reserving the right of first refusal to pur-chase the brand, confirming expectations for this brand.In regard to distribution,major efforts were made in 2011 to develop the DOS network, a strategic driver for grow-ing and consolidating the image of Group brands. During this phase, major attention was also dedicated to theChinese market. With more then 10 new store openings, the Group now operates a network of 34 single brandboutiques in China,with this number being second only to the Italian market, the historic birthplace of Group brands.In addition to consolidation of theTOD’S single brand stores, the Group began distribution of the HOGAN brandin China, by opening three flagship stores in Beijing,Wuhan and Harbin.Further attention was dedicated to the South Korean market, which now offers major growth potential for theGroup, realised through reinforcement of its store network on the local market (four new openings) and it or-ganisational structure.
-6
-4
-2
-
2
4
6
8
10
12
14
Average exchange rate2011 vs 2010 (change %)
GBP HKD JPY KRW RMB SGD USDCHF
12.0
-1.1
-4.9
4.8
-0.6 -0.2
3.2
-4.8

Group2011Annual Report
32 Report on operations
The second part of the year was marked by the launch of a project to set up an e-commerce platform.The “golive,” whose timing will vary from market to market, is scheduled to coincide with the Spring-Summer 2012 col-lection. In the first phase, it will involve the TOD’S brand on the United States market.The 2011 financial year was also characterised by the Group’s major commitment to social responsibility. Its twomost important initiatives were dedicated to the protection and promotion of Italian heritage.The first of these projects involved full financing, as sole sponsor, of urgent restoration work on the Coliseum.Following the agreement reached on January 21st, 2011 with the Ministry of Cultural Affairs and the SpecialArchaeological Service in Rome, the Group committed itself to pay 25 million euros for restoration of this mon-ument, which symbolises the history and culture of Italy.This commitment will be spread out over the entire du-ration of the restoration work.The Special Archaeological Service of Rome will remain responsible for planning(currently underway) and executing that work.Following a resolution by the General Meeting of the Fondazione Teatro alla Scala,TOD’S S.p.A. acquired the sta-tus of Permanent Founding Member of the Foundation on May 16th, 2011. By donating 5.2 million euros to theFoundation, to be paid over four years, the company manifested its intention to support the activity of this the-atre.The aim of this contribution is that La Scala continue affirming its enormous prestige and organisational ex-cellence around the world, and preserve its status as a global paragon of products “made in Italy”.
The Group’s results in 2011
The Group turned in an excellent performance in 2011 as measured by all leading economic indicators.The re-sults that it has achieved are even more important given the general volatility prevailing on the market and, aboveall, the extremely challenging basis of comparison for the Group,which unlike most of its peers in the luxury goodssector as a whole, has continued to grow, even after the crisis that exploded at the end of 2008.Revenues during the year grew by 106.1 million euros, from 787.5 million euros in 2010 (+13.5%) to 893.6 millioneuros in 2011.The foreign exchange effect did not have a particular significant impact on Group sales (894.5 mil-lion euros on a comparable exchange rate basis). Growth as measured by operating margins was even stronger.EBITDA and EBIT totalled 232.4 million euros and 194.6 million euros, respectively (FY 2010: EBITDA and EBITwere 193.1 million euros and 159.9 million euros, respectively), growing by more than 20 percentage points.Net profit rose sharply: consolidated net income was 135.7 million euros, up 22.5% from the 110.8 million eurosreported in FY 2010.
Euro 000’sMain economic indicators Year 11 Year 10 Change %Sales revenues 893,638 787,539 106,099 13.5EBITDA 232,417 193,059 39,358 20.4Deprec., amort., write-downs and advances (37,787) (33,115) (4,672) 14.1EBIT 194,630 159,944 34,686 21.7Pre-Tax 196,886 163,352 33,534 20.5Consolidated net profit 135,688 110,786 24,902 22.5
Foreign exchange impact on revenues 821Adjusted Sales revenues 894,459 787,539 106,920 13.6Foreign exchange impact on operating costs (590)Adjusted EBITDA 232,648 193,059 39,589 20.5Foreign exchange impact on deprec. & amort. (130)Adjusted EBIT 194,731 159,944 34,787 21.7
EBITDA % 26.0 24.5EBIT % 21.8 20.3Adjusted EBITDA % 26.0 24.5Adjusted EBIT % 21.8 20.3Tax rate % 31.1 32.2
Group2011Annual Report
33 Report on operations
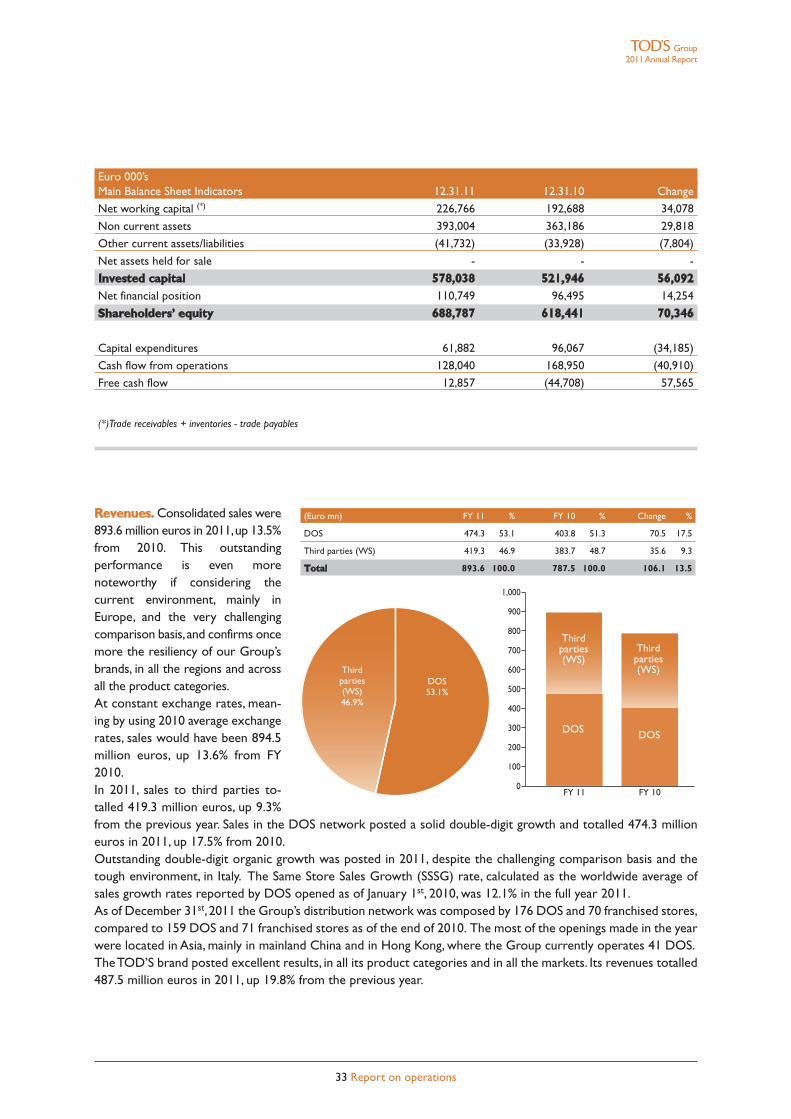
Euro 000’sMain Balance Sheet Indicators 12.31.11 12.31.10 Change
Net working capital (*) 226,766 192,688 34,078
Non current assets 393,004 363,186 29,818
Other current assets/liabilities (41,732) (33,928) (7,804)
Net assets held for sale - - -
Invested capital 578,038 521,946 56,092Net financial position 110,749 96,495 14,254
Shareholders’ equity 688,787 618,441 70,346
Capital expenditures 61,882 96,067 (34,185)
Cash flow from operations 128,040 168,950 (40,910)
Free cash flow 12,857 (44,708) 57,565
(*)Trade receivables + inventories - trade payables
Revenues. Consolidated sales were893.6 million euros in 2011,up 13.5%from 2010. This outstandingperformance is even morenoteworthy if considering thecurrent environment, mainly inEurope, and the very challengingcomparison basis,and confirms oncemore the resiliency of our Group’sbrands, in all the regions and acrossall the product categories.At constant exchange rates, mean-ing by using 2010 average exchangerates, sales would have been 894.5million euros, up 13.6% from FY2010.In 2011, sales to third parties to-talled 419.3 million euros, up 9.3%from the previous year. Sales in the DOS network posted a solid double-digit growth and totalled 474.3 millioneuros in 2011, up 17.5% from 2010.Outstanding double-digit organic growth was posted in 2011, despite the challenging comparison basis and thetough environment, in Italy. The Same Store Sales Growth (SSSG) rate, calculated as the worldwide average ofsales growth rates reported by DOS opened as of January 1st, 2010, was 12.1% in the full year 2011.As of December 31st, 2011 the Group’s distribution network was composed by 176 DOS and 70 franchised stores,compared to 159 DOS and 71 franchised stores as of the end of 2010. The most of the openings made in the yearwere located in Asia, mainly in mainland China and in Hong Kong, where the Group currently operates 41 DOS.TheTOD’S brand posted excellent results, in all its product categories and in all the markets. Its revenues totalled487.5 million euros in 2011, up 19.8% from the previous year.
100
200
300
400
500
600
700
900
FY 11 FY 10
800
1,000
0
(Euro mn) FY 11 % FY 10 % Change %
DOS 474.3 53.1 403.8 51.3 70.5 17.5
Third parties (WS) 419.3 46.9 383.7 48.7 35.6 9.3
Total 893.6 100.0 787.5 100.0 106.1 13.5
Thirdparties(WS)46.9%
Thirdparties(WS)
DOS DOS
Thirdparties(WS)
DOS53.1%
Group2011Annual Report
34 Report on operations
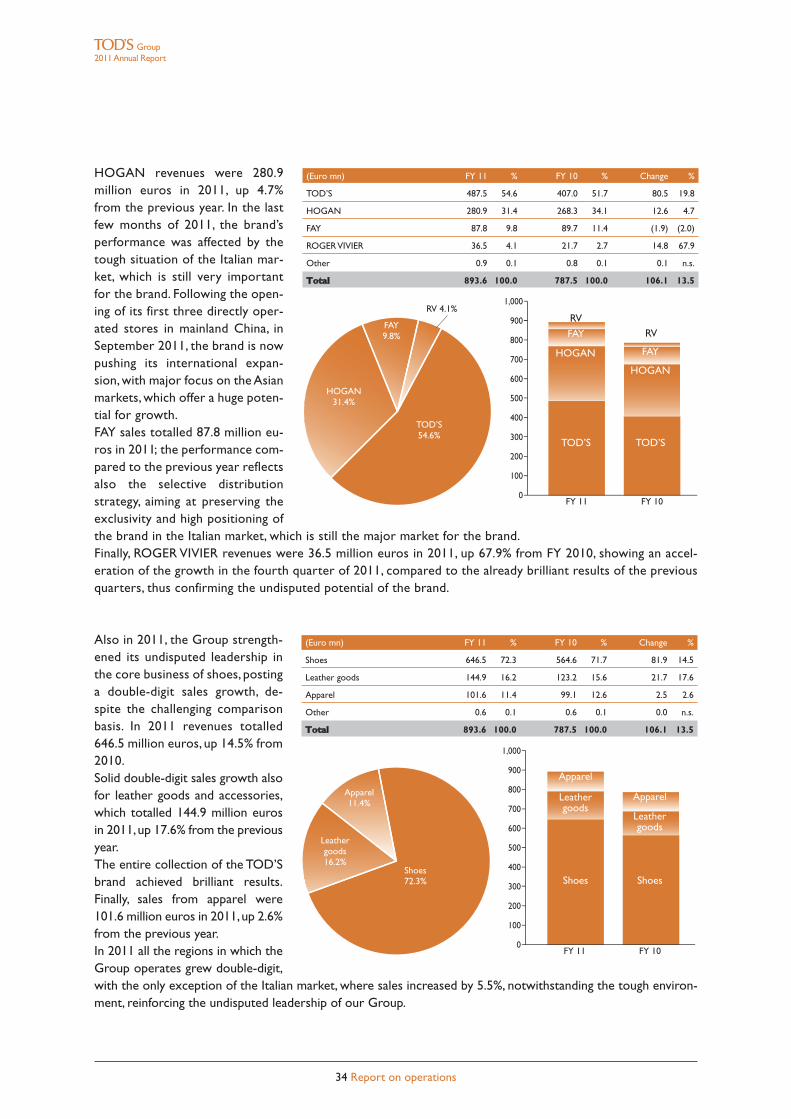
HOGAN revenues were 280.9million euros in 2011, up 4.7%from the previous year. In the lastfew months of 2011, the brand’sperformance was affected by thetough situation of the Italian mar-ket, which is still very importantfor the brand. Following the open-ing of its first three directly oper-ated stores in mainland China, inSeptember 2011, the brand is nowpushing its international expan-sion, with major focus on the Asianmarkets, which offer a huge poten-tial for growth.FAY sales totalled 87.8 million eu-ros in 2011; the performance com-pared to the previous year reflectsalso the selective distributionstrategy, aiming at preserving theexclusivity and high positioning ofthe brand in the Italian market, which is still the major market for the brand.Finally, ROGER VIVIER revenues were 36.5 million euros in 2011, up 67.9% from FY 2010, showing an accel-eration of the growth in the fourth quarter of 2011, compared to the already brilliant results of the previousquarters, thus confirming the undisputed potential of the brand.
Also in 2011, the Group strength-ened its undisputed leadership inthe core business of shoes, postinga double-digit sales growth, de-spite the challenging comparisonbasis. In 2011 revenues totalled646.5 million euros, up 14.5% from2010.Solid double-digit sales growth alsofor leather goods and accessories,which totalled 144.9 million eurosin 2011,up 17.6% from the previousyear.The entire collection of the TOD’Sbrand achieved brilliant results.Finally, sales from apparel were101.6 million euros in 2011,up 2.6%from the previous year.In 2011 all the regions in which theGroup operates grew double-digit,with the only exception of the Italian market, where sales increased by 5.5%, notwithstanding the tough environ-ment, reinforcing the undisputed leadership of our Group.
100
200
300
400
500
600
700
900
FY 11 FY 10
800
1,000
0
(Euro mn) FY 11 % FY 10 % Change %
TOD’S 487.5 54.6 407.0 51.7 80.5 19.8
HOGAN 280.9 31.4 268.3 34.1 12.6 4.7
FAY 87.8 9.8 89.7 11.4 (1.9) (2.0)
ROGERVIVIER 36.5 4.1 21.7 2.7 14.8 67.9
Other 0.9 0.1 0.8 0.1 0.1 n.s.
Total 893.6 100.0 787.5 100.0 106.1 13.5
TOD’S54.6%
HOGAN31.4%
FAY9.8%
RV 4.1%RV
HOGAN
TOD’S
FAY
FAY
HOGAN
TOD’S
RV
100
200
300
400
500
600
700
900
FY 11 FY 10
800
1,000
0
(Euro mn) FY 11 % FY 10 % Change %
Shoes 646.5 72.3 564.6 71.7 81.9 14.5
Leather goods 144.9 16.2 123.2 15.6 21.7 17.6
Apparel 101.6 11.4 99.1 12.6 2.5 2.6
Other 0.6 0.1 0.6 0.1 0.0 n.s.
Total 893.6 100.0 787.5 100.0 106.1 13.5
Apparel
Leathergoods
Shoes
Apparel
Leathergoods
Shoes
Apparel11.4%
Shoes72.3%
Leathergoods16.2%
Group2011Annual Report
35 Report on operations
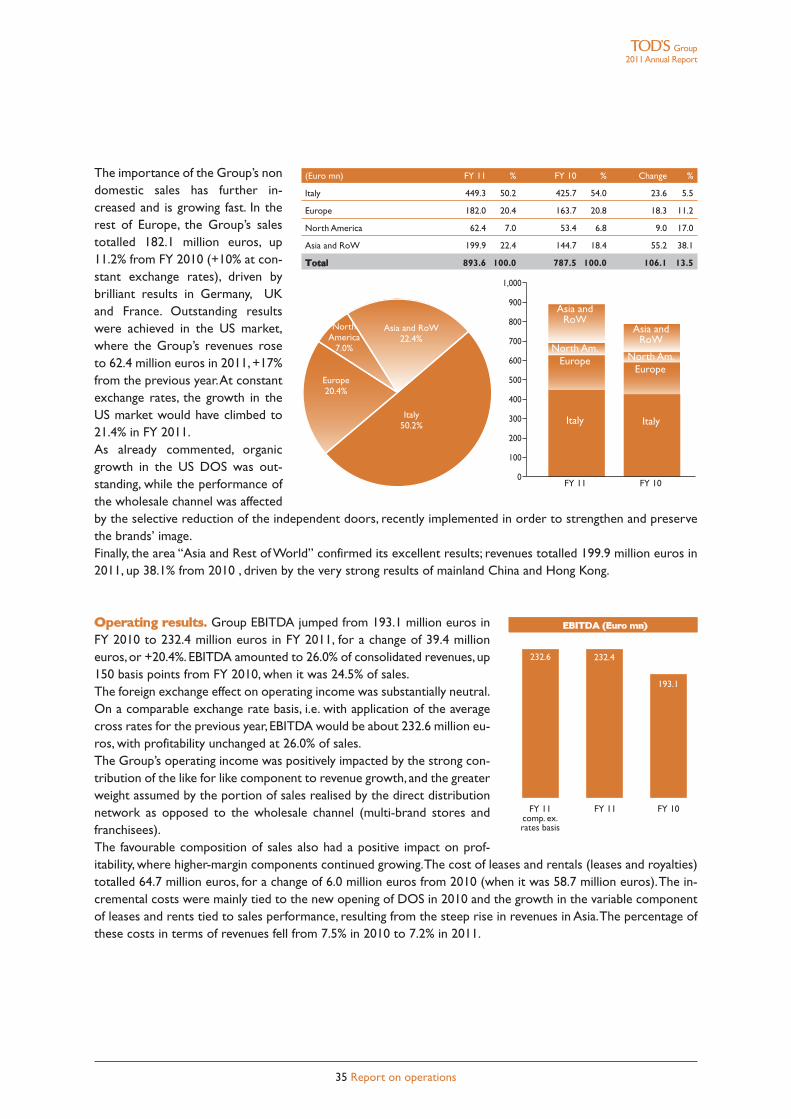
The importance of the Group’s nondomestic sales has further in-creased and is growing fast. In therest of Europe, the Group’s salestotalled 182.1 million euros, up11.2% from FY 2010 (+10% at con-stant exchange rates), driven bybrilliant results in Germany, UKand France. Outstanding resultswere achieved in the US market,where the Group’s revenues roseto 62.4 million euros in 2011, +17%from the previous year.At constantexchange rates, the growth in theUS market would have climbed to21.4% in FY 2011.As already commented, organicgrowth in the US DOS was out-standing, while the performance ofthe wholesale channel was affectedby the selective reduction of the independent doors, recently implemented in order to strengthen and preservethe brands’ image.Finally, the area “Asia and Rest of World” confirmed its excellent results; revenues totalled 199.9 million euros in2011, up 38.1% from 2010 , driven by the very strong results of mainland China and Hong Kong.
Operating results. Group EBITDA jumped from 193.1 million euros inFY 2010 to 232.4 million euros in FY 2011, for a change of 39.4 millioneuros,or +20.4%. EBITDA amounted to 26.0% of consolidated revenues, up150 basis points from FY 2010, when it was 24.5% of sales.The foreign exchange effect on operating income was substantially neutral.On a comparable exchange rate basis, i.e. with application of the averagecross rates for the previous year, EBITDA would be about 232.6 million eu-ros, with profitability unchanged at 26.0% of sales.The Group’s operating income was positively impacted by the strong con-tribution of the like for like component to revenue growth, and the greaterweight assumed by the portion of sales realised by the direct distributionnetwork as opposed to the wholesale channel (multi-brand stores andfranchisees).The favourable composition of sales also had a positive impact on prof-itability, where higher-margin components continued growing.The cost of leases and rentals (leases and royalties)totalled 64.7 million euros, for a change of 6.0 million euros from 2010 (when it was 58.7 million euros).The in-cremental costs were mainly tied to the new opening of DOS in 2010 and the growth in the variable componentof leases and rents tied to sales performance, resulting from the steep rise in revenues in Asia.The percentage ofthese costs in terms of revenues fell from 7.5% in 2010 to 7.2% in 2011.
100
200
300
400
500
600
700
900
FY 11 FY 10
800
1,000
0
(Euro mn) FY 11 % FY 10 % Change %
Italy 449.3 50.2 425.7 54.0 23.6 5.5
Europe 182.0 20.4 163.7 20.8 18.3 11.2
North America 62.4 7.0 53.4 6.8 9.0 17.0
Asia and RoW 199.9 22.4 144.7 18.4 55.2 38.1
Total 893.6 100.0 787.5 100.0 106.1 13.5
NorthAmerica
7.0%
Asia and RoW22.4%
Italy50.2%
Asia andRoW
North Am.Europe
Italy
Asia andRoW
North Am.Europe
Italy
Europe20.4%
EBITDA (Euro mn)
FY 11 FY 11 FY 10comp. ex.rates basis
232.6 232.4
193.1
Group2011Annual Report
36 Report on operations
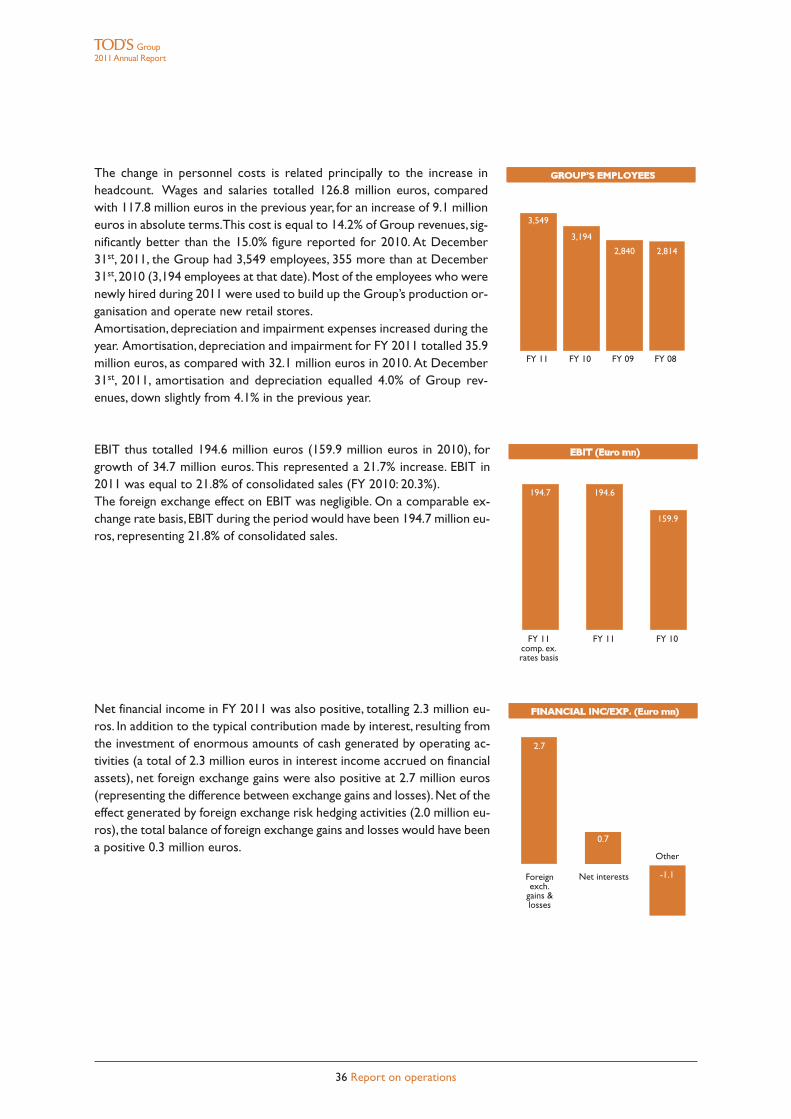
The change in personnel costs is related principally to the increase inheadcount. Wages and salaries totalled 126.8 million euros, comparedwith 117.8 million euros in the previous year, for an increase of 9.1 millioneuros in absolute terms.This cost is equal to 14.2% of Group revenues, sig-nificantly better than the 15.0% figure reported for 2010. At December31st, 2011, the Group had 3,549 employees, 355 more than at December31st, 2010 (3,194 employees at that date).Most of the employees who werenewly hired during 2011 were used to build up the Group’s production or-ganisation and operate new retail stores.Amortisation, depreciation and impairment expenses increased during theyear. Amortisation, depreciation and impairment for FY 2011 totalled 35.9million euros, as compared with 32.1 million euros in 2010. At December31st, 2011, amortisation and depreciation equalled 4.0% of Group rev-enues, down slightly from 4.1% in the previous year.
EBIT thus totalled 194.6 million euros (159.9 million euros in 2010), forgrowth of 34.7 million euros.This represented a 21.7% increase. EBIT in2011 was equal to 21.8% of consolidated sales (FY 2010: 20.3%).The foreign exchange effect on EBIT was negligible. On a comparable ex-change rate basis, EBIT during the period would have been 194.7 million eu-ros, representing 21.8% of consolidated sales.
Net financial income in FY 2011 was also positive, totalling 2.3 million eu-ros. In addition to the typical contribution made by interest, resulting fromthe investment of enormous amounts of cash generated by operating ac-tivities (a total of 2.3 million euros in interest income accrued on financialassets), net foreign exchange gains were also positive at 2.7 million euros(representing the difference between exchange gains and losses).Net of theeffect generated by foreign exchange risk hedging activities (2.0 million eu-ros), the total balance of foreign exchange gains and losses would have beena positive 0.3 million euros.
GROUP’S EMPLOYEES
FY 11 FY 10 FY 09 FY 08
3,549
3,194
2,840 2,814
EBIT (Euro mn)
FY 11 FY 11 FY 10comp. ex.rates basis
194.7
159.9
194.6
FINANCIAL INC/EXP. (Euro mn)
2.7
0.7
Foreignexch.
gains &losses
Net interests
Other
-1.1
Group2011Annual Report
37 Report on operations
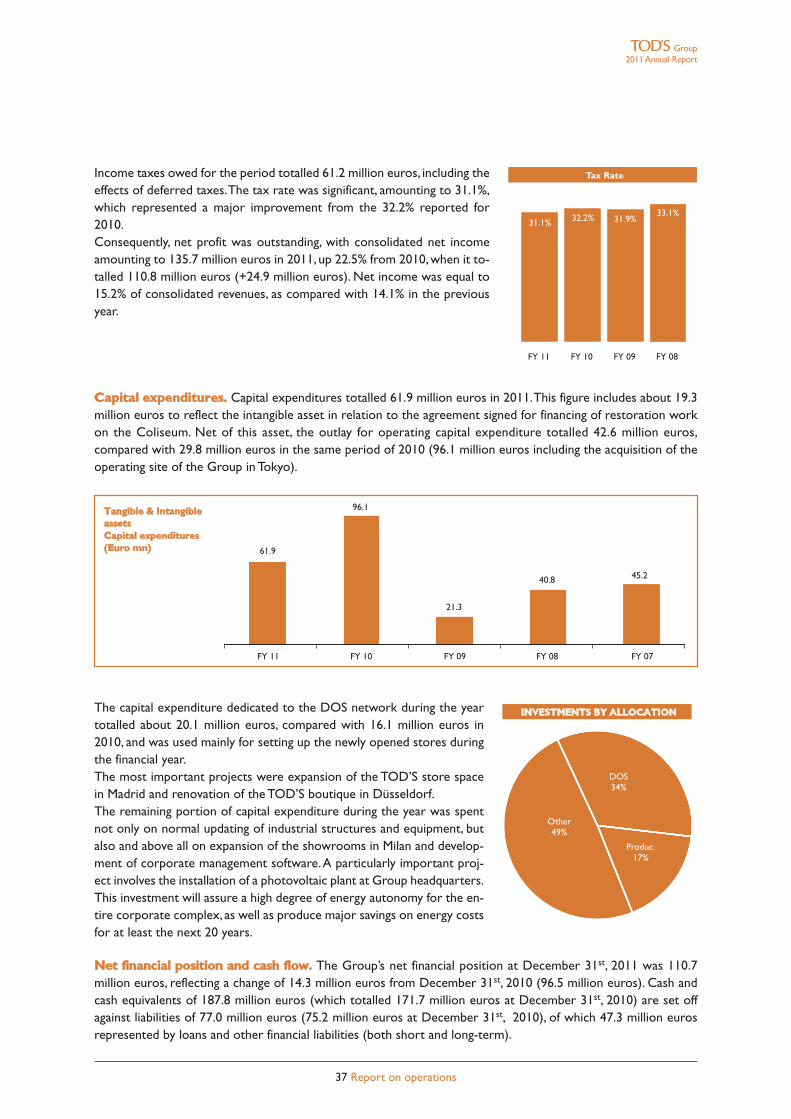
Income taxes owed for the period totalled 61.2 million euros, including theeffects of deferred taxes.The tax rate was significant, amounting to 31.1%,which represented a major improvement from the 32.2% reported for2010.Consequently, net profit was outstanding, with consolidated net incomeamounting to 135.7 million euros in 2011, up 22.5% from 2010, when it to-talled 110.8 million euros (+24.9 million euros). Net income was equal to15.2% of consolidated revenues, as compared with 14.1% in the previousyear.
Capital expenditures. Capital expenditures totalled 61.9 million euros in 2011.This figure includes about 19.3million euros to reflect the intangible asset in relation to the agreement signed for financing of restoration workon the Coliseum. Net of this asset, the outlay for operating capital expenditure totalled 42.6 million euros,compared with 29.8 million euros in the same period of 2010 (96.1 million euros including the acquisition of theoperating site of the Group in Tokyo).
The capital expenditure dedicated to the DOS network during the yeartotalled about 20.1 million euros, compared with 16.1 million euros in2010, and was used mainly for setting up the newly opened stores duringthe financial year.The most important projects were expansion of the TOD’S store spacein Madrid and renovation of the TOD’S boutique in Düsseldorf.The remaining portion of capital expenditure during the year was spentnot only on normal updating of industrial structures and equipment, butalso and above all on expansion of the showrooms in Milan and develop-ment of corporate management software.A particularly important proj-ect involves the installation of a photovoltaic plant at Group headquarters.This investment will assure a high degree of energy autonomy for the en-tire corporate complex, as well as produce major savings on energy costsfor at least the next 20 years.
Net financial position and cash flow. The Group’s net financial position at December 31st, 2011 was 110.7million euros, reflecting a change of 14.3 million euros from December 31st, 2010 (96.5 million euros). Cash andcash equivalents of 187.8 million euros (which totalled 171.7 million euros at December 31st, 2010) are set offagainst liabilities of 77.0 million euros (75.2 million euros at December 31st, 2010), of which 47.3 million eurosrepresented by loans and other financial liabilities (both short and long-term).
Tax Rate
FY 11 FY 10 FY 09 FY 08
31.1% 32.2% 31.9%33.1%
INVESTMENTS BY ALLOCATION
DOS34%
Produc.17%
Other49%
FY 11 FY 10 FY 09 FY 08 FY 07
61.9
96.1
21.3
40.8 45.2
Tangible & IntangibleassetsCapital expenditures(Euro mn)
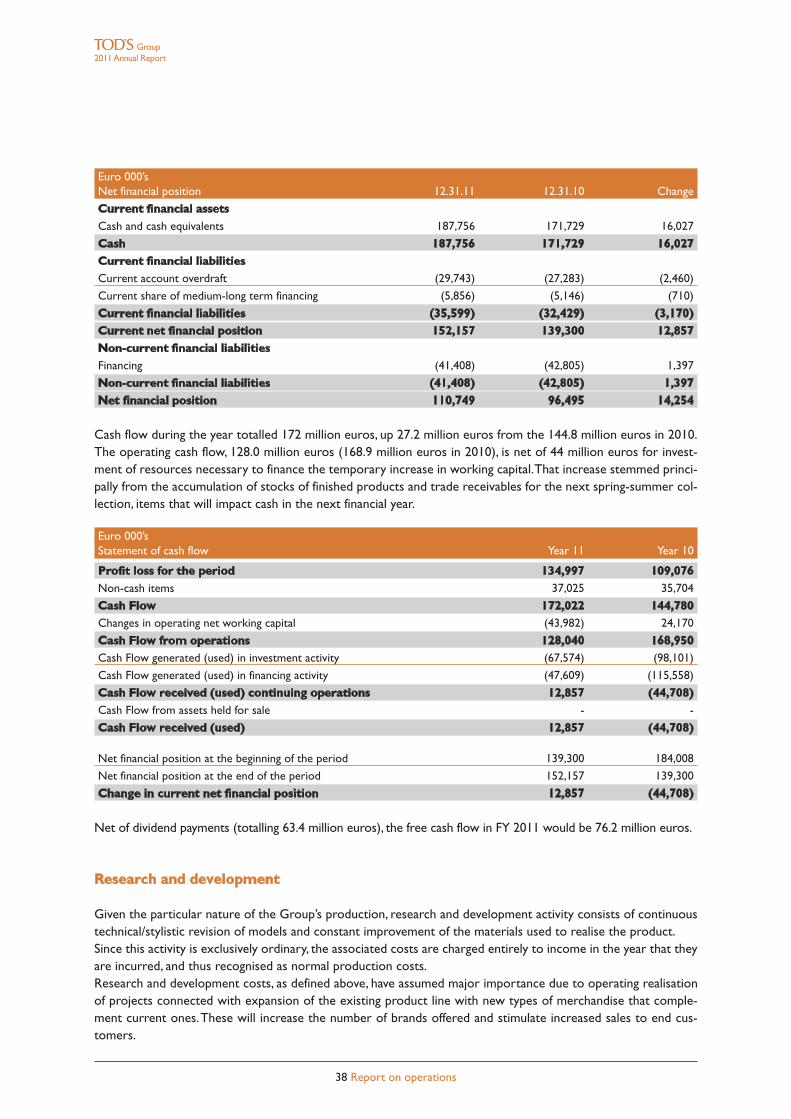
Euro 000’sNet financial position 12.31.11 12.31.10 Change
Current financial assetsCash and cash equivalents 187,756 171,729 16,027
Cash 187,756 171,729 16,027Current financial liabilitiesCurrent account overdraft (29,743) (27,283) (2,460)
Current share of medium-long term financing (5,856) (5,146) (710)
Current financial liabilities (35,599) (32,429) (3,170)Current net financial position 152,157 139,300 12,857Non-current financial liabilitiesFinancing (41,408) (42,805) 1,397
Non-current financial liabilities (41,408) (42,805) 1,397Net financial position 110,749 96,495 14,254
Cash flow during the year totalled 172 million euros, up 27.2 million euros from the 144.8 million euros in 2010.The operating cash flow, 128.0 million euros (168.9 million euros in 2010), is net of 44 million euros for invest-ment of resources necessary to finance the temporary increase in working capital.That increase stemmed princi-pally from the accumulation of stocks of finished products and trade receivables for the next spring-summer col-lection, items that will impact cash in the next financial year.
Euro 000’sStatement of cash flow Year 11 Year 10
Profit loss for the period 134,997 109,076Non-cash items 37,025 35,704
Cash Flow 172,022 144,780Changes in operating net working capital (43,982) 24,170
Cash Flow from operations 128,040 168,950Cash Flow generated (used) in investment activity (67,574) (98,101)
Cash Flow generated (used) in financing activity (47,609) (115,558)
Cash Flow received (used) continuing operations 12,857 (44,708)Cash Flow from assets held for sale - -
Cash Flow received (used) 12,857 (44,708)
Net financial position at the beginning of the period 139,300 184,008
Net financial position at the end of the period 152,157 139,300
Change in current net financial position 12,857 (44,708)
Net of dividend payments (totalling 63.4 million euros), the free cash flow in FY 2011 would be 76.2 million euros.
Research and development
Given the particular nature of the Group’s production, research and development activity consists of continuoustechnical/stylistic revision of models and constant improvement of the materials used to realise the product.Since this activity is exclusively ordinary, the associated costs are charged entirely to income in the year that theyare incurred, and thus recognised as normal production costs.Research and development costs, as defined above, have assumed major importance due to operating realisationof projects connected with expansion of the existing product line with new types of merchandise that comple-ment current ones.These will increase the number of brands offered and stimulate increased sales to end cus-tomers.
38 Report on operations
Group2011Annual Report
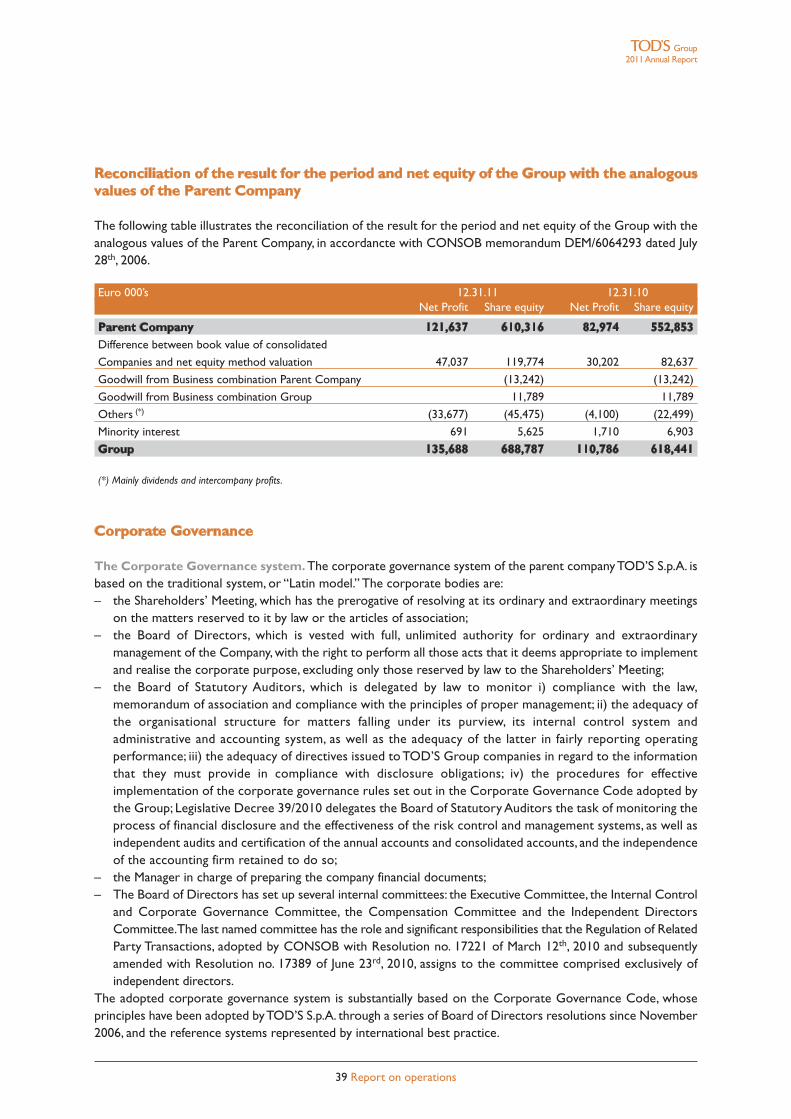
Reconciliation of the result for the period and net equity of the Group with the analogousvalues of the Parent Company
The following table illustrates the reconciliation of the result for the period and net equity of the Group with theanalogous values of the Parent Company, in accordancte with CONSOB memorandum DEM/6064293 dated July28th, 2006.
Euro 000’s 12.31.11 12.31.10Net Profit Share equity Net Profit Share equity
Parent Company 121,637 610,316 82,974 552,853Difference between book value of consolidated
Companies and net equity method valuation 47,037 119,774 30,202 82,637
Goodwill from Business combination Parent Company (13,242) (13,242)
Goodwill from Business combination Group 11,789 11,789
Others (*) (33,677) (45,475) (4,100) (22,499)
Minority interest 691 5,625 1,710 6,903
Group 135,688 688,787 110,786 618,441
(*) Mainly dividends and intercompany profits.
Corporate Governance
The Corporate Governance system. The corporate governance system of the parent companyTOD’S S.p.A. isbased on the traditional system, or “Latin model.” The corporate bodies are:– the Shareholders’ Meeting, which has the prerogative of resolving at its ordinary and extraordinary meetings
on the matters reserved to it by law or the articles of association;– the Board of Directors, which is vested with full, unlimited authority for ordinary and extraordinary
management of the Company, with the right to perform all those acts that it deems appropriate to implementand realise the corporate purpose, excluding only those reserved by law to the Shareholders’ Meeting;
– the Board of Statutory Auditors, which is delegated by law to monitor i) compliance with the law,memorandum of association and compliance with the principles of proper management; ii) the adequacy ofthe organisational structure for matters falling under its purview, its internal control system andadministrative and accounting system, as well as the adequacy of the latter in fairly reporting operatingperformance; iii) the adequacy of directives issued to TOD’S Group companies in regard to the informationthat they must provide in compliance with disclosure obligations; iv) the procedures for effectiveimplementation of the corporate governance rules set out in the Corporate Governance Code adopted bythe Group; Legislative Decree 39/2010 delegates the Board of Statutory Auditors the task of monitoring theprocess of financial disclosure and the effectiveness of the risk control and management systems, as well asindependent audits and certification of the annual accounts and consolidated accounts, and the independenceof the accounting firm retained to do so;
– the Manager in charge of preparing the company financial documents;– The Board of Directors has set up several internal committees: the Executive Committee, the Internal Control
and Corporate Governance Committee, the Compensation Committee and the Independent DirectorsCommittee.The last named committee has the role and significant responsibilities that the Regulation of RelatedParty Transactions, adopted by CONSOB with Resolution no. 17221 of March 12th, 2010 and subsequentlyamended with Resolution no. 17389 of June 23rd, 2010, assigns to the committee comprised exclusively ofindependent directors.
The adopted corporate governance system is substantially based on the Corporate Governance Code, whoseprinciples have been adopted byTOD’S S.p.A. through a series of Board of Directors resolutions since November2006, and the reference systems represented by international best practice.
39 Report on operations
Group2011Annual Report
Insofar as the term of the current Board of Directors will expire upon approval of the 2011 Annual Report, it wasdecided to delegate the new Board of Directors with the task of adopting the principles set out in the newCorporate Governance Code of Listed Italian Companies approved by Borsa Italiana S.p.A. in December 2011,which the issuers are asked to implement by the end of FY 2012. However, all those principles for which theCorporate Governance Code recommends adoption prior to the suggested deadline will still have to be appliedbeforehand.
Disclosure pursuant toArticle 123-bis of Legislative Decree 58/1998 (“TUF”).At its meeting on March 13th
2012, the Board of Directors of the parent company TOD’S S.p.A. approved the annual Report on CorporateGovernance and Shareholdings, which provides the disclosures mandated pursuant to Article 123-bis (1) of theConsolidated Law on Finance (T.U.F.).That report also analytically illustrates the corporate governance system ofTOD’S S.p.A., and it includes not only the information required under Article 123-bis (2) T.U.F., but also acomprehensive examination of the status of implementation of the corporate governance principles recommendedby the Corporate Governance Code in accordance with the “comply or explain” rule.The reader is referred to the Annual Corporate Governance and Shareholdings Report, which is available to thepublic together with this Report on Operations and accounting documentation. It may be consulted in the cor-porate section of the www.todsgroup.com website.
Disclosure pursuant to Article 123-ter of Legislative Decree 58/1998 (Consolidated Law on Finance -“TUF”). On March 13th, 2012, the Board of Directors ofTod’s S.p.A. approved, in compliance with Article 123-terof Legislative Decree 58 of February 24th, 1998 (the “Consolidated Finance Law” or “T.U.F.”), as amended, andArticle 84-ter of Consob Resolution no. 11971/99 (the “Issuers Regulation”), as amended, the RemunerationReport.The Report is composed of two sections:(i) the first is the policy ofTOD’S S.p.A. in regard to remuneration of the members of the Board of Directors, theGeneral Manager, and the executives with strategic responsibilities in regard to the 2012 financial year, as well asthe procedures used for adoption and implementation of this policy;(ii) the other is aimed at representing each of the items that compose remuneration, and describing the compen-sation paid in 2011 to members of the Board of Directors and Board of Statutory Auditors, the General Managerand the executives with strategic responsibilities;it will be submitted to the Shareholders’ Meeting called forApril 19th, 2012,which will be asked to resolve in favourof or against the first section with a non-binding resolution.The Remuneration Report is available at the registered office of the Company, at Borsa Italiana S.p.A. and on thecorporate website www.todsgroup.com.
Disclosure of Significant Companies outside the EU. TOD’S S.p.A., the parent company, directly or indirectlycontrols six companies that are incorporated and regulated pursuant to the laws of countries that do not belongto the European Union (“Significant Companies outside the EU,” as defined by Consob Resolution no.16191/2007,as amended).In reference to these companies, note that:– all of them prepare accounts used to prepare the consolidated financial statements.The balance sheet and
income statement of these entities are provided to shareholders of TOD’S S.p.A. at the times and in the waysenvisaged by applicable regulations;
– TOD’S S.p.A. has acquired the bylaws and composition and powers of the corporate bodies;– the Significant Companies outside the EU: i) provide the parent company’s independent auditor with information
that the latter needs to audit the annual and interim accounts of the parent; ii) have an administrative andaccounting system that is adequate for providing the management,Board of StatutoryAuditors and independentauditor of the parent company with the operating, financial position and earnings figures necessary for preparingthe consolidated financial statements.
In order to satisfy its own statutory obligations, the Board of Statutory Auditors of TOD’S S.p.A. has audited theadequacy of the administrative and accounting system regularly to provide the management and independent au-
40 Report on operations
Group2011Annual Report
ditor of TOD’S S.p.A. with the operating, financial position and earnings figures necessary for preparation of theconsolidated financial statements and the effective flow of information through meetings with the independent au-ditor and with the Financial Reporting Manager.
Disclosure pursuant to Consob Resolution no. 17221 of March 12th, 2010 (Related Parties Regulation). In2011 the Group did not conclude highly significant transactions with related parties or related party transactionsthat had a material impact on the assets, liabilities or net income of the Group, and there were no modificationsor developments in the transactions described in the 2010 Annual Report that had the same effects.All information regarding existing relations with related parties in 2011 are set out in the explanatory notes.
Significant events occurring after the end of the period
Effective January 1st, 2012, in view of integrating in its organisation a whole series of outsourced strategic mar-keting and promotion activities, the Group acquired, through the parent TOD’S S.p.A., 100% of the units ofFormapura S.r.l., an Italian company with which it had a collaboration relationship involving the aforementionedactivities for several years. In view of completing the integration process, and realising a more streamlined and func-tional structure in terms of assets, liabilities and earnings by simplifying the Group corporate structures, the boardsof directors of the respective entities resolved in favour of merger through takeover of Formapura S.r.l. byTOD’SS.p.A.
Business outlook
The FY 2011 results have confirmed the solidity of TOD’S Group fundamentals, and especially the strength ofbrands whose high quality and other aspects characterise Group products, guarantee constant appreciation by con-sumers of Group brands.On the basis of the foregoing, the strong start for the year under way,when the strong organic growth of the DOSnetwork continued (the SSSG figure is +6.8% for the first 10 weeks of the year), and the expansion plans for thesingle brand store network, it is reasonable to forecast that the Group may realise additional revenue and profitgrowth in 2012 .
Approval of Financial Statements
The consolidated financial statements of the TOD’S Group were approved by the Board of Directors on March13th, 2012.
Milan, March 13th, 2012The Chairman of the Board of Directors
Diego DellaValle
41 Report on operations
Group2011Annual Report
[THIS PAGE HAS BEEN INTENTIONALLY LEFT BLANK]
42 2011 Annual Report
FINANCIAL STATEMENTS
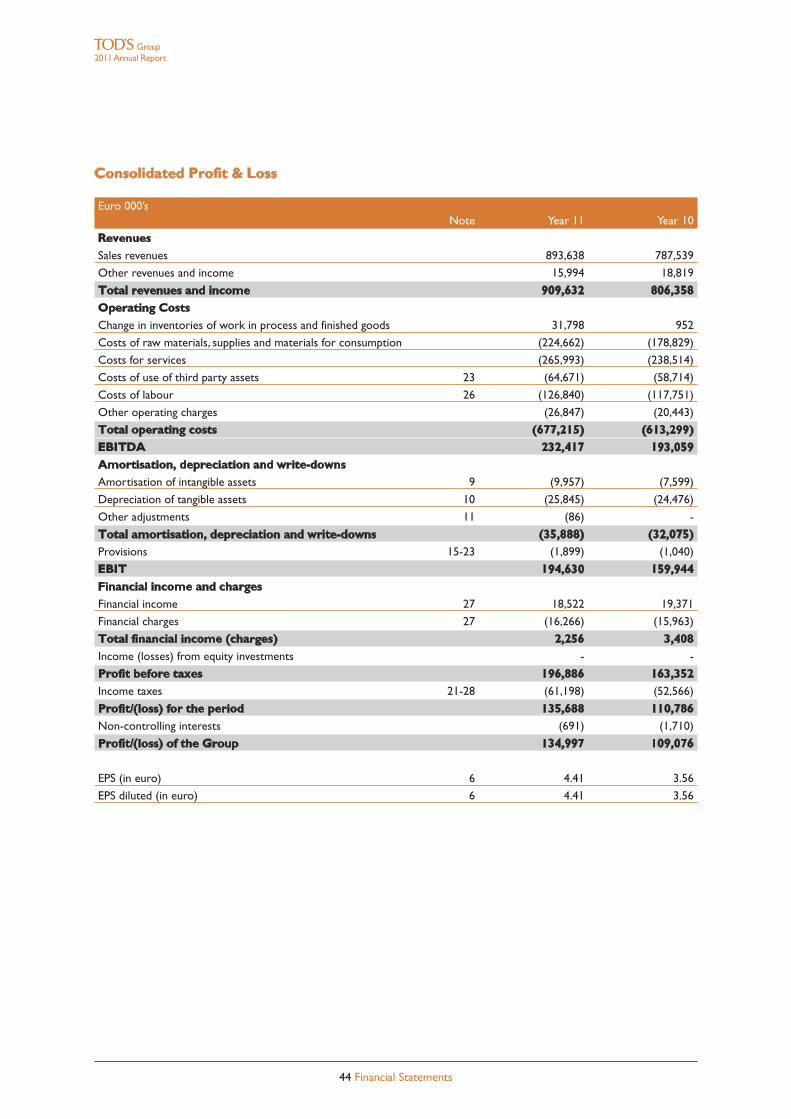
Consolidated Profit & Loss
Euro 000’sNote Year 11 Year 10
RevenuesSales revenues 893,638 787,539
Other revenues and income 15,994 18,819
Total revenues and income 909,632 806,358Operating CostsChange in inventories of work in process and finished goods 31,798 952
Costs of raw materials, supplies and materials for consumption (224,662) (178,829)
Costs for services (265,993) (238,514)
Costs of use of third party assets 23 (64,671) (58,714)
Costs of labour 26 (126,840) (117,751)
Other operating charges (26,847) (20,443)
Total operating costs (677,215) (613,299)EBITDA 232,417 193,059Amortisation, depreciation and write-downsAmortisation of intangible assets 9 (9,957) (7,599)
Depreciation of tangible assets 10 (25,845) (24,476)
Other adjustments 11 (86) -
Total amortisation, depreciation and write-downs (35,888) (32,075)Provisions 15-23 (1,899) (1,040)
EBIT 194,630 159,944Financial income and chargesFinancial income 27 18,522 19,371
Financial charges 27 (16,266) (15,963)
Total financial income (charges) 2,256 3,408Income (losses) from equity investments - -
Profit before taxes 196,886 163,352Income taxes 21-28 (61,198) (52,566)
Profit/(loss) for the period 135,688 110,786Non-controlling interests (691) (1,710)
Profit/(loss) of the Group 134,997 109,076
EPS (in euro) 6 4.41 3.56
EPS diluted (in euro) 6 4.41 3.56
44 Financial Statements
Group2011Annual Report
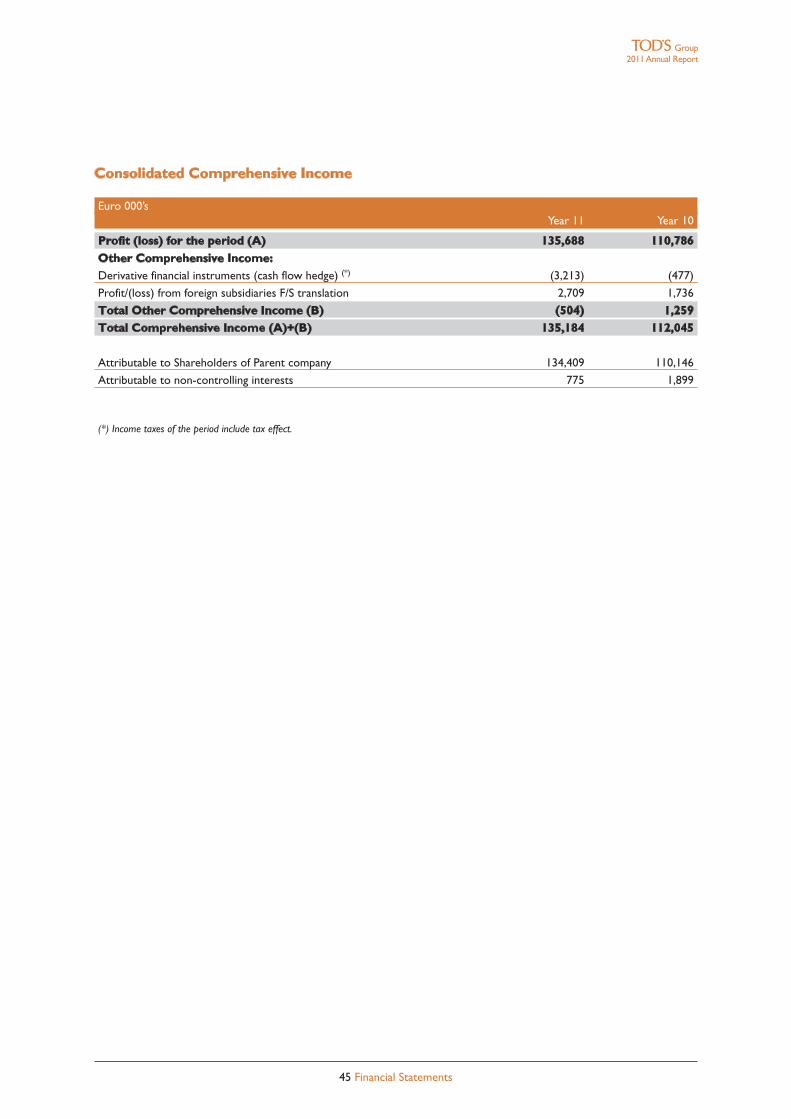
Consolidated Comprehensive Income
Euro 000’sYear 11 Year 10
Profit (loss) for the period (A) 135,688 110,786Other Comprehensive Income:Derivative financial instruments (cash flow hedge) (*) (3,213) (477)
Profit/(loss) from foreign subsidiaries F/S translation 2,709 1,736
Total Other Comprehensive Income (B) (504) 1,259Total Comprehensive Income (A)+(B) 135,184 112,045
Attributable to Shareholders of Parent company 134,409 110,146
Attributable to non-controlling interests 775 1,899
(*) Income taxes of the period include tax effect.
45 Financial Statements
Group2011Annual Report
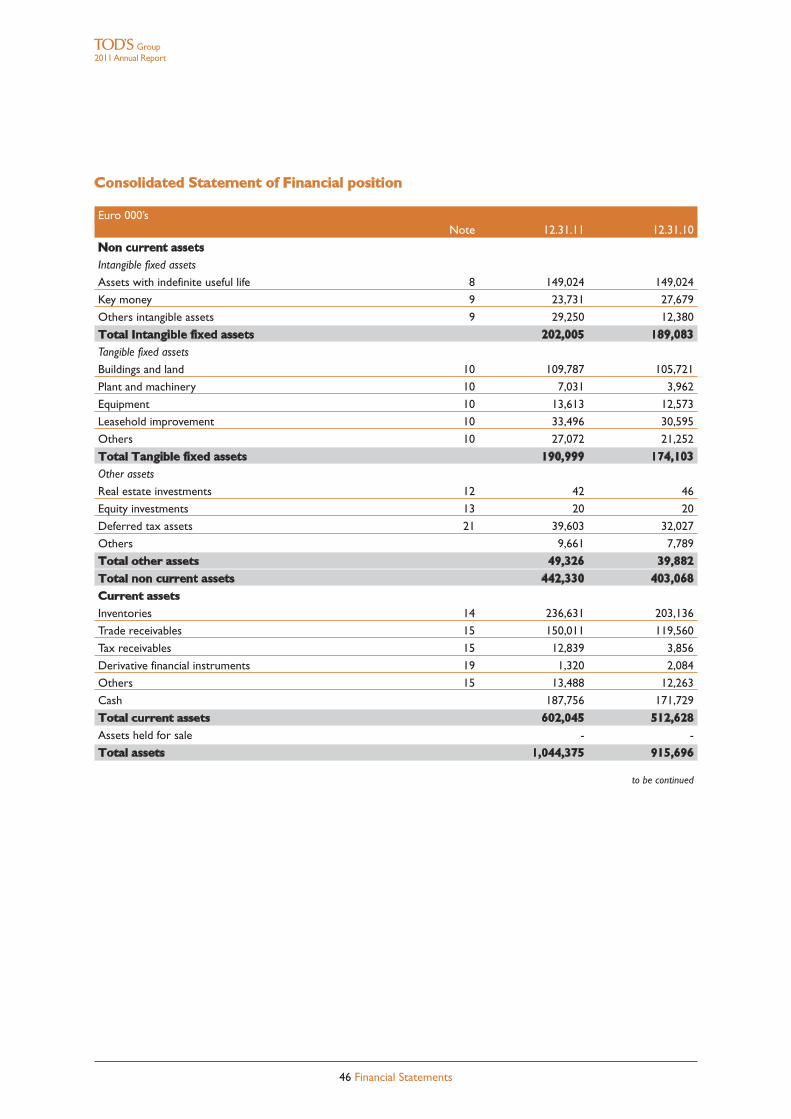
Consolidated Statement of Financial position
Euro 000’sNote 12.31.11 12.31.10
Non current assetsIntangible fixed assets
Assets with indefinite useful life 8 149,024 149,024
Key money 9 23,731 27,679
Others intangible assets 9 29,250 12,380
Total Intangible fixed assets 202,005 189,083Tangible fixed assets
Buildings and land 10 109,787 105,721
Plant and machinery 10 7,031 3,962
Equipment 10 13,613 12,573
Leasehold improvement 10 33,496 30,595
Others 10 27,072 21,252
Total Tangible fixed assets 190,999 174,103Other assets
Real estate investments 12 42 46
Equity investments 13 20 20
Deferred tax assets 21 39,603 32,027
Others 9,661 7,789
Total other assets 49,326 39,882Total non current assets 442,330 403,068Current assetsInventories 14 236,631 203,136
Trade receivables 15 150,011 119,560
Tax receivables 15 12,839 3,856
Derivative financial instruments 19 1,320 2,084
Others 15 13,488 12,263
Cash 187,756 171,729
Total current assets 602,045 512,628Assets held for sale - -
Total assets 1,044,375 915,696
to be continued
Group2011Annual Report
46 Financial Statements
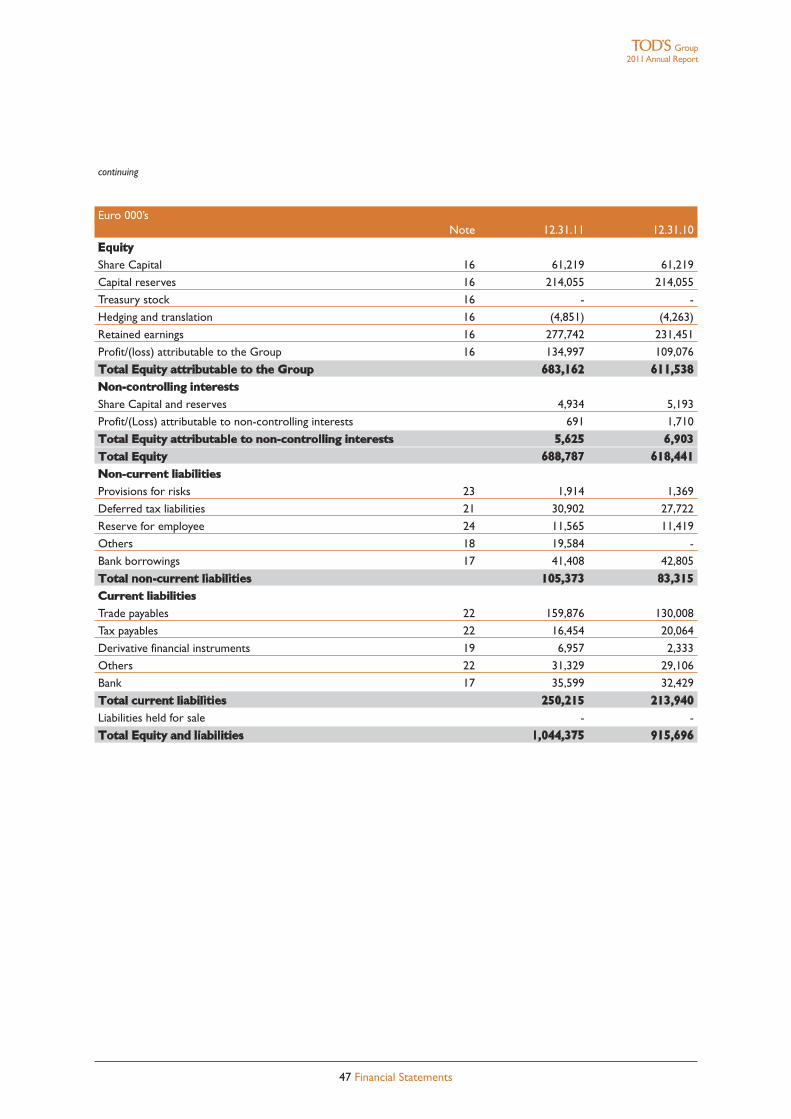
continuing
Euro 000’sNote 12.31.11 12.31.10
EquityShare Capital 16 61,219 61,219
Capital reserves 16 214,055 214,055
Treasury stock 16 - -
Hedging and translation 16 (4,851) (4,263)
Retained earnings 16 277,742 231,451
Profit/(loss) attributable to the Group 16 134,997 109,076
Total Equity attributable to the Group 683,162 611,538Non-controlling interestsShare Capital and reserves 4,934 5,193
Profit/(Loss) attributable to non-controlling interests 691 1,710
Total Equity attributable to non-controlling interests 5,625 6,903Total Equity 688,787 618,441Non-current liabilitiesProvisions for risks 23 1,914 1,369
Deferred tax liabilities 21 30,902 27,722
Reserve for employee 24 11,565 11,419
Others 18 19,584 -
Bank borrowings 17 41,408 42,805
Total non-current liabilities 105,373 83,315Current liabilitiesTrade payables 22 159,876 130,008
Tax payables 22 16,454 20,064
Derivative financial instruments 19 6,957 2,333
Others 22 31,329 29,106
Bank 17 35,599 32,429
Total current liabilities 250,215 213,940Liabilities held for sale - -
Total Equity and liabilities 1,044,375 915,696
Group2011Annual Report
47 Financial Statements
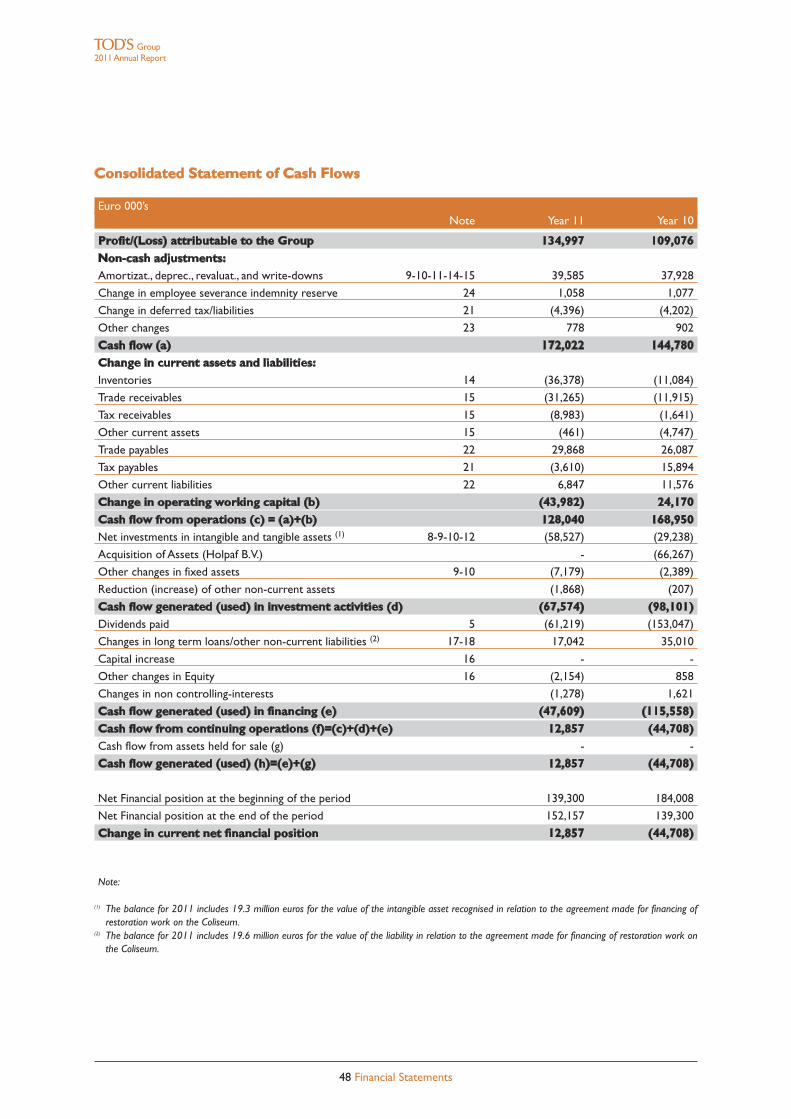
Consolidated Statement of Cash Flows
Euro 000’sNote Year 11 Year 10
Profit/(Loss) attributable to the Group 134,997 109,076Non-cash adjustments:Amortizat., deprec., revaluat., and write-downs 9-10-11-14-15 39,585 37,928
Change in employee severance indemnity reserve 24 1,058 1,077
Change in deferred tax/liabilities 21 (4,396) (4,202)
Other changes 23 778 902
Cash flow (a) 172,022 144,780Change in current assets and liabilities:Inventories 14 (36,378) (11,084)
Trade receivables 15 (31,265) (11,915)
Tax receivables 15 (8,983) (1,641)
Other current assets 15 (461) (4,747)
Trade payables 22 29,868 26,087
Tax payables 21 (3,610) 15,894
Other current liabilities 22 6,847 11,576
Change in operating working capital (b) (43,982) 24,170Cash flow from operations (c) = (a)+(b) 128,040 168,950Net investments in intangible and tangible assets (1) 8-9-10-12 (58,527) (29,238)
Acquisition of Assets (Holpaf B.V.) - (66,267)
Other changes in fixed assets 9-10 (7,179) (2,389)
Reduction (increase) of other non-current assets (1,868) (207)
Cash flow generated (used) in investment activities (d) (67,574) (98,101)Dividends paid 5 (61,219) (153,047)
Changes in long term loans/other non-current liabilities (2) 17-18 17,042 35,010
Capital increase 16 - -
Other changes in Equity 16 (2,154) 858
Changes in non controlling-interests (1,278) 1,621
Cash flow generated (used) in financing (e) (47,609) (115,558)Cash flow from continuing operations (f)=(c)+(d)+(e) 12,857 (44,708)Cash flow from assets held for sale (g) - -
Cash flow generated (used) (h)=(e)+(g) 12,857 (44,708)
Net Financial position at the beginning of the period 139,300 184,008
Net Financial position at the end of the period 152,157 139,300
Change in current net financial position 12,857 (44,708)
Note:
(1) The balance for 2011 includes 19.3 million euros for the value of the intangible asset recognised in relation to the agreement made for financing ofrestoration work on the Coliseum.
(2) The balance for 2011 includes 19.6 million euros for the value of the liability in relation to the agreement made for financing of restoration work onthe Coliseum.
48 Financial Statements
Group2011Annual Report
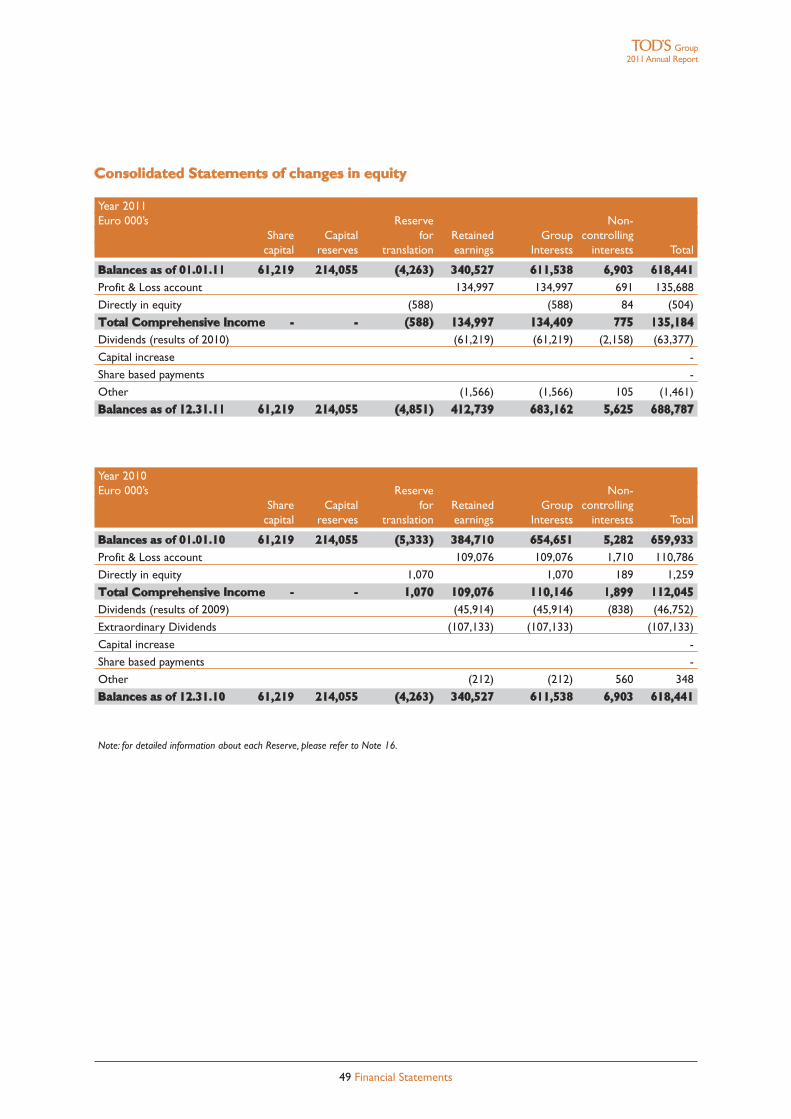
Consolidated Statements of changes in equity
Year 2011Euro 000’s Reserve Non-
Share Capital for Retained Group controllingcapital reserves translation earnings Interests interests Total
Balances as of 01.01.11 61,219 214,055 (4,263) 340,527 611,538 6,903 618,441Profit & Loss account 134,997 134,997 691 135,688
Directly in equity (588) (588) 84 (504)
Total Comprehensive Income - - (588) 134,997 134,409 775 135,184Dividends (results of 2010) (61,219) (61,219) (2,158) (63,377)
Capital increase -
Share based payments -
Other (1,566) (1,566) 105 (1,461)
Balances as of 12.31.11 61,219 214,055 (4,851) 412,739 683,162 5,625 688,787
Year 2010Euro 000’s Reserve Non-
Share Capital for Retained Group controllingcapital reserves translation earnings Interests interests Total
Balances as of 01.01.10 61,219 214,055 (5,333) 384,710 654,651 5,282 659,933Profit & Loss account 109,076 109,076 1,710 110,786
Directly in equity 1,070 1,070 189 1,259
Total Comprehensive Income - - 1,070 109,076 110,146 1,899 112,045Dividends (results of 2009) (45,914) (45,914) (838) (46,752)
Extraordinary Dividends (107,133) (107,133) (107,133)
Capital increase -
Share based payments -
Other (212) (212) 560 348
Balances as of 12.31.10 61,219 214,055 (4,263) 340,527 611,538 6,903 618,441
Note: for detailed information about each Reserve, please refer to Note 16.
49 Financial Statements
Group2011Annual Report
[THIS PAGE HAS BEEN INTENTIONALLY LEFT BLANK]
50 2011 Annual Report
SUPPLEMENTARY NOTES
1. General notes
The Notes to the Consolidated Financial Statements were prepared in accordance with IAS/IFRS and supple-mented by the additional information required by CONSOB and the orders it issued in implementation of Article9 of Legislative Decree 38/2005 (Resolutions 15519 and 15520 of July 27th, 2006 and memorandum DEM/6064293of July 28th, 2006, pursuant to Article 114(5) of the Consolidated Law on Finance-TUF),Article 78 of the IssuerRegulation, the EC document of November 2003 and, when applicable, the Italian Civil Code. Consistently withthe financial statements for the previous year, certain information is provided in the Report by the Board ofDirectors on Operations.The consolidated financial statements at December 31st, 2011 include the balance sheet and profit and loss ac-count of TOD’S S.p.A. and its Italian and foreign subsidiaries, which are jointly referred to as the TOD’S Group.The consolidated financial statements are prepared on the basis of draft Financial Statements at December 31st,2011 (January 1st – December 31st) approved by the respective boards of directors or, if there was no board ofdirectors, by the sole directors. Because the closing date of its fiscal year does not coincide with the referencedate of the consolidated financial statements,Tod’s India Retail Pte.Ltd was included on the basis of interim financialstatements for twelve months, referring to the date of the consolidated financial statements.The consolidated financial statements were approved by the Board of Directors of TOD’S S.p.A. on March 13th,2012.
2. Financial statements formats: choice of form and classification principles
For presentation of its operating income, assets and liabilities following transition to IFRS, the Group opted in favorof complete continuity of the balance sheet and profit and loss account formats envisaged for disclosures preparedpursuant to Italian GAAP in the presentation of its financial position.These financial statements, complemented asnecessary by the Report of the Board of Directors on Operations and the notes to the financial statements, are con-sidered to be those that provide the best organized representation of the Group’s financial position and income.More specifically, the balance sheet format shows current items separately from non-current items (both assetsand liabilities).On the profit and loss account, the format of representing revenues and costs by nature is followed,indicating the EBITDA and EBIT results as in the past, since they are considered representative indicators of com-pany performance.The “indirect” method is used for the statement of cash flows.
3. Highlights of the accounting standards
The consolidated financial statements are prepared in accordance with IAS/IFRS (International AccountingStandards-IAS, and International Financial Reporting Standards-IFRS) issued by the IASB, on the basis of the textpublished in the Official Journal of the European Union (OJEU). Furthermore, they are prepared on the basis ofhistoric costs, with the sole exception of derivative financial instruments, which are measured at fair value.
Accounting principles,amendments, interpretations applicable since January 1st,2011 with effects on theGroup Consolidated financial statements as at December 31st, 2011
þ IAS 24 Revised - Related parties disclosures: it has been clarified the definition of a related party and simplifieddisclosures for government-related entities.
Accounting principles, amendments, interpretations applicable since January 1st, 2011 not applyingin the Group Consolidated financial statements as at December 31st, 2011
þ IAS 34 Improvement - Interim financial reporting: it has been clarified the disclosure principle for significanttransactions on interim financial reporting.
Group2011Annual Report
52 Supplementary notes
þ IAS 1 Improvement - Presentation of financial statements: an entity, for each component of equity, may presentthe breakdown of other comprehensive income either in the statement of changes in equity or in the notesto the financial statements.
þ IFRS 1 Improvement - First time adoption: a first time adopter that changes its accounting policies or its use of IFRS1 exemptions after publishing a set of IAS 34 interim financial information should explain those changes andinclude the effects of such changes in its opening reconciliations within the first annual IFRS financial statements;the exemption to use a ‘deemed cost’ arising from a revaluation, is extended to revaluations occurred during theperiod covered by the first IFRS financial statements; entities subject to rate regulation are permitted to useprevious GAAP carrying amounts of property plant and equipment or intangible assets as deemed cost.
þ IFRS 7 Improvement, Amendment - Financial instruments disclosures: it has been clarified disclosures on thenature and extent of risks arising from financial instruments;
þ IFRIC 13 Improvement - Customer loyalty programs: it has been clarified the meaning of the term ‘fair value’ inthe context of measuring award credits under customer loyalty programs.
þ IFRIC 14 Amendment -The limit on a defined benefit asset,minimum funding requirements and their interaction:it has been clarified the conditions under which an asset could be recognized in the financial statements.
þ IFRIC 19 - Extinguishing financial liabilities with equity instruments: it has been clarified the accounting treatmentfor renegotiating the term of a financial liability fully o partially issuing equity instruments.
3.1 Subsidiaries. Subsidiaries include all entities in which theTOD’S Group has direct or indirect control overthe financial and operating policies of an entity in order to obtain benefits from its activity, as defined in IAS 27 –Consolidated and Separate Financial Statements.The financial statements of subsidiaries are included on the consolidated financial statements from the date whencontrol is acquired until such control terminates.Acquisitions of subsidiaries are recognizsed according to the cost method.The cost of a business combination isrepresented by the aggregate sum,at the acquisition date,of the fair values of the sold assets, the liabilities incurredor assumed, and the instruments representing capital issued in exchange for control of the acquired entity.The identifiable assets, liabilities, and potential liabilities of the acquired entity that satisfy the recognition criteriaenvisaged in IFRS 3 are recognised at their fair value on the date of purchase, with the exception of non-currentassets (or groups available to sale) that are classified as held for sale in accordance with IFRS 5.The portion of the acquisition cost that exceeds the fair value of the acquired net assets is recognised as good-will. If the acquisition cost is less than the fair value of the net assets of the acquired entity, the difference is recog-nised directly on the profit and loss account.Once control of an entity has been acquired, the transactions where the controlling entity acquires or transfersadditional non-controlling interests without altering control over the subsidiary are transactions with sharehold-ers and are thus recognised in equity.Subsidiaries are consolidated according to the line-by-line method from the date on which control is transferredto the Group. They are deconsolidated starting on the date when such control ceases.Intercompany transactions and the profits and losses generated by transactions between consolidated enterpris-es are eliminated from both the balance sheet and the profit and loss account.When necessary, the balance sheets and profit and loss accounts of the subsidiaries are adjusted in order to bringthe applied accounting policies in line with those used by the Group.
3.2 Minority interests. Minority interests in the capital and reserves of the subsidiaries are indicated undershareholders’ equity as “Minority interest”.The minority interest in the acquired business is initially determinedin an amount equal to their share of the fair value of the assets, liabilities and potential liabilities recorded on thedate of the original acquisition date and subsequently adjusted according to the changes in shareholders’ equity.Likewise, this account reflects the changes in minority interests and any losses allocable to them.
3.3 Transactions in foreign currency.i. Functional and reporting currency.All accounts recognised on the financial statements of the subsidiariesare measured by using the currency of the principal economic environment in which the entity operates (i.e. its
Group2011Annual Report
53 Supplementary notes
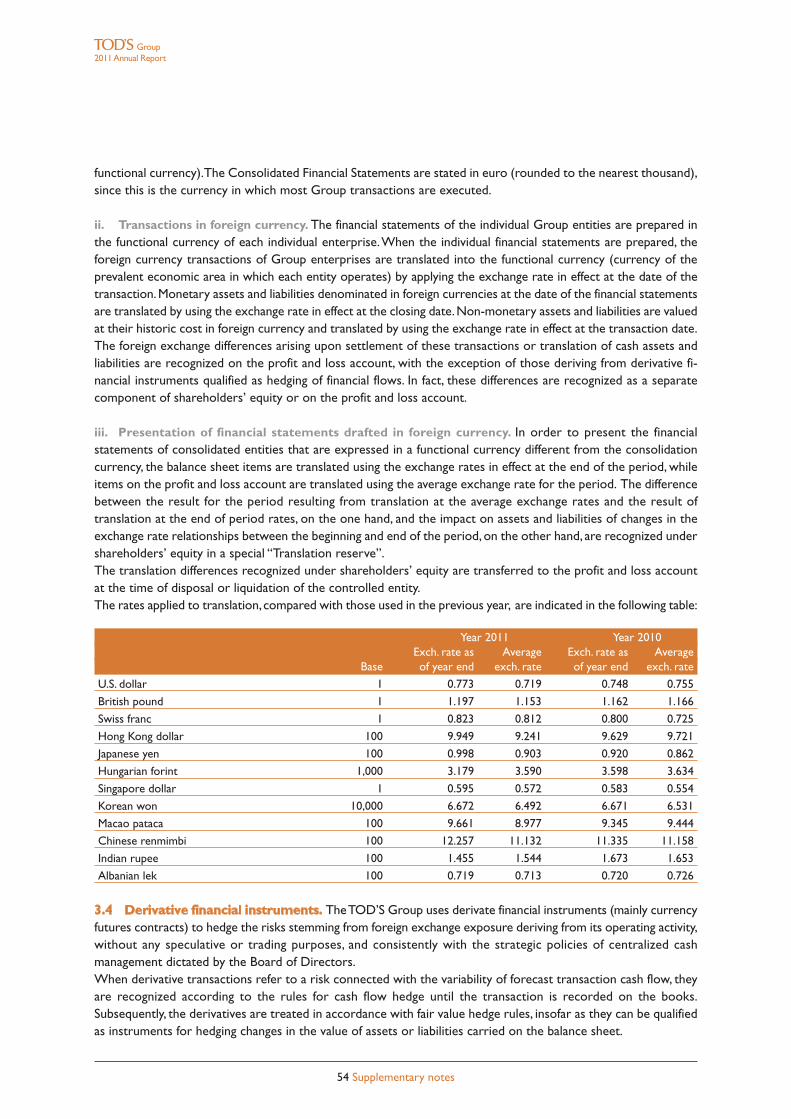
functional currency).The Consolidated Financial Statements are stated in euro (rounded to the nearest thousand),since this is the currency in which most Group transactions are executed.
ii. Transactions in foreign currency. The financial statements of the individual Group entities are prepared inthe functional currency of each individual enterprise.When the individual financial statements are prepared, theforeign currency transactions of Group enterprises are translated into the functional currency (currency of theprevalent economic area in which each entity operates) by applying the exchange rate in effect at the date of thetransaction.Monetary assets and liabilities denominated in foreign currencies at the date of the financial statementsare translated by using the exchange rate in effect at the closing date.Non-monetary assets and liabilities are valuedat their historic cost in foreign currency and translated by using the exchange rate in effect at the transaction date.The foreign exchange differences arising upon settlement of these transactions or translation of cash assets andliabilities are recognized on the profit and loss account, with the exception of those deriving from derivative fi-nancial instruments qualified as hedging of financial flows. In fact, these differences are recognized as a separatecomponent of shareholders’ equity or on the profit and loss account.
iii. Presentation of financial statements drafted in foreign currency. In order to present the financialstatements of consolidated entities that are expressed in a functional currency different from the consolidationcurrency, the balance sheet items are translated using the exchange rates in effect at the end of the period, whileitems on the profit and loss account are translated using the average exchange rate for the period. The differencebetween the result for the period resulting from translation at the average exchange rates and the result oftranslation at the end of period rates, on the one hand, and the impact on assets and liabilities of changes in theexchange rate relationships between the beginning and end of the period, on the other hand, are recognized undershareholders’ equity in a special “Translation reserve”.The translation differences recognized under shareholders’ equity are transferred to the profit and loss accountat the time of disposal or liquidation of the controlled entity.The rates applied to translation,compared with those used in the previous year, are indicated in the following table:
Year 2011 Year 2010Exch. rate as Average Exch. rate as Average
Base of year end exch. rate of year end exch. rate
U.S. dollar 1 0.773 0.719 0.748 0.755
British pound 1 1.197 1.153 1.162 1.166
Swiss franc 1 0.823 0.812 0.800 0.725
Hong Kong dollar 100 9.949 9.241 9.629 9.721
Japanese yen 100 0.998 0.903 0.920 0.862
Hungarian forint 1,000 3.179 3.590 3.598 3.634
Singapore dollar 1 0.595 0.572 0.583 0.554
Korean won 10,000 6.672 6.492 6.671 6.531
Macao pataca 100 9.661 8.977 9.345 9.444
Chinese renmimbi 100 12.257 11.132 11.335 11.158
Indian rupee 100 1.455 1.544 1.673 1.653
Albanian lek 100 0.719 0.713 0.720 0.726
3.4 Derivative financial instruments. TheTOD’S Group uses derivate financial instruments (mainly currencyfutures contracts) to hedge the risks stemming from foreign exchange exposure deriving from its operating activity,without any speculative or trading purposes, and consistently with the strategic policies of centralized cashmanagement dictated by the Board of Directors.When derivative transactions refer to a risk connected with the variability of forecast transaction cash flow, theyare recognized according to the rules for cash flow hedge until the transaction is recorded on the books.Subsequently, the derivatives are treated in accordance with fair value hedge rules, insofar as they can be qualifiedas instruments for hedging changes in the value of assets or liabilities carried on the balance sheet.
Group2011Annual Report
54 Supplementary notes
The hedge accounting method is used at every financial statement closing date.This method envisages posting de-rivatives on the balance sheet at their fair value. Posting of the changes in fair value varies according to the typeof hedging at the valuation date:• for derivatives that hedge forecast transactions (i.e. cash flow hedge), the changes are recognized in
shareholders’ equity,while the portion for the ineffective amount is recognized on the profit and loss account,under financial income and expenses;
• for derivatives that hedge receivables and payables recognized on the balance sheet (i.e. fair value hedge), thefair value differences are recognized entirely on the profit and loss account, adjusting operating margins.Furthermore, the value of the hedged item (receivables/payables) is adjusted for the change in value attributableto the hedged risk, using the item financial income and expenses as a contra-entry.
3.5 Intangible fixed assets.i. Goodwill. All business combinations are recognized by applying the acquisition method.Goodwill represents the portion of the cost paid for the acquisition that exceeds the Group’s interest in the fairvalue of the assets, liabilities, and identifiable potential liabilities of the subsidiary or jointly controlled entity at theacquisition date.If the Group’s interest in the fair value of assets, liabilities, and identifiable potential liabilities exceeds the cost ofthe acquisition (negative goodwill) after redetermination of these values, the excess is immediately recognized onthe profit and loss account.For acquisitions prior to January 1st, 2004, the date of transition to IAS/IFRS, goodwill retained the values recog-nized on the basis of the previous Italian GAAP, net of accumulated amortization up to the transition date.Goodwill is recognized on the financial statements at its cost adjusted for impairment losses. It is not subject toamortization, but the adequacy of the values is annually subjected to the impairment test, in accordance with therules set forth in the section Impairment losses.
ii. Trademarks.These are recognized according to the value of their cost and/or acquisition, net of accumulatedamortization at the date of transition to IAS/IFRS. TOD’S, HOGAN and FAY trademarks are classified as intangibilefixed assets with an indefinite useful life and thus are not amortized, insofar as:• they play a primary role in the Group’s strategy and are an essential driver thereof;• the corporate structure, construed as organized property, plant, and equipment, and organization itself in a
figurative sense, is closely correlated with and dependent on dissemination and development of the trademarkson the markets;
• the trademarks are proprietary, properly registered, and constantly protected pursuant to law, with optionsfor renewal of legal protection, upon expiration of the registration periods, that are not burdensome, easilyimplemented, and without external impediments;
• the products sold by the Group with these trademarks are not subject to particular technological obsolescence,which is characteristic of the luxury market in which the Group operates;on the contrary, they are consistentlyperceived by the market as being innovative in the national and/or international context characteristic of eachtrademark, they are distinguished by market positioning and notoriety that ensures their dominance of therespective market segments, being constantly associated and compared with benchmark brands;
• in the relative competitive context, it can be affirmed that the investments made for maintenance of thetrademarks are proportionately modest with respect to the large forecast cash flows.
The adequacy of the values is annually subjected to the impairment test, in accordance with the rules set forth inthe section Impairment losses.
iii. Research and development costs. The research costs for a project are charged fully to the profit and lossaccount of the period in which they are incurred.The development costs of an activity are instead capitalized if the technical and commercial feasibility of the rel-ative activity and economic return on the investment are certain and definite, and the Group has the intention andresources necessary to complete the development.
Group2011Annual Report
55 Supplementary notes
The capitalized costs include the costs for materials, labor, and an adequate portion of overhead costs.They arerecognized at cost, net of accumulated amortization and depreciation (see below) and impairment losses.
iv. Other intangible fixed assets. These are identifiable non-monetary intangible assets under the control ofthe company and capable of causing the Group to realize future economic benefits.They are initially recognized at their purchase cost, including expenses that are directly attributable to them dur-ing preparation of the asset for its intended purpose or production, if the conditions for capitalization of expens-es incurred for internally generated expenses are satisfied.The cost method is used for determining the value reported on subsequent statements, which entails posting theasset at its cost net of accumulated amortization and write-downs for impairment losses.
v. Subsequent capitalization. The costs incurred for these intangible fixed assets after purchase are capitalizedonly to the extent that they increase the future economic benefits of the specific asset they refer to. All the othercosts are charged to the profit and loss account in the fiscal year in which they are incurred.
vi. Amortization. Intangible fixed assets (excluding those with an indefinite useful life) are amortized on astraight-line basis over the period of their estimated useful life, starting from the time the assets are availablefor use.
3.6 Tangible assets.i. Property, plant, and equipment owned by the company. They are first recognized at their purchase costor at the cost recalculated at the date of transition to IFRS, including any directly attributable ancillary expenses.Following first-time recognition, these assets are reported net of their accumulated depreciation and impairmentlosses (i.e. in accordance with the cost model).For those assets whose depreciation must be calculated using the component approach, the portions of cost al-locable to the individual significant components characterized by a different useful life are determined. In this case,the value of land and buildings is kept separate, with only buildings being depreciated.
ii. Leasing. Lease agreements in which the Group assumes all the risks and benefits deriving from ownership ofthe asset are classified as finance leasing.The assets (real estate, plant and machinery) possessed pursuant to theseagreements are recorded under property, plant and equipment at the lesser of their fair value on the date theagreement was made, and the current value of the minimum payments owed for leasing, net of accumulateddepreciation and any impairment losses (according to the rules described in the section Impairment losses). Afinancial payable for the same amount is recognized instead under liabilities, while the component of interestexpenses for finance leasing payments is reported on the profit and loss account according to the effective interestmethod.
iii. Subsequent capitalizations. The costs incurred for property, plant and equipment after purchase arecapitalized only to the extent that they increase the future economic benefits of the asset. All the other costs arecharged to the profit and loss account in the fiscal year in which they are incurred.
iv. Real estate investments. Real estate investments are originally recognized at cost, and then recognized attheir cost as adjusted for accumulated depreciation and impairment losses.Depreciation is calculated on a systematic, straight-line basis according to the estimated useful life of thebuildings.
v. Depreciation. Property, plant and equipment were systematically depreciated at a steady rate according tothe depreciation schedules defined on the basis of their estimated useful life. Land is not depreciated. The principaldepreciation rates applied are as follows:
Group2011Annual Report
56 Supplementary notes
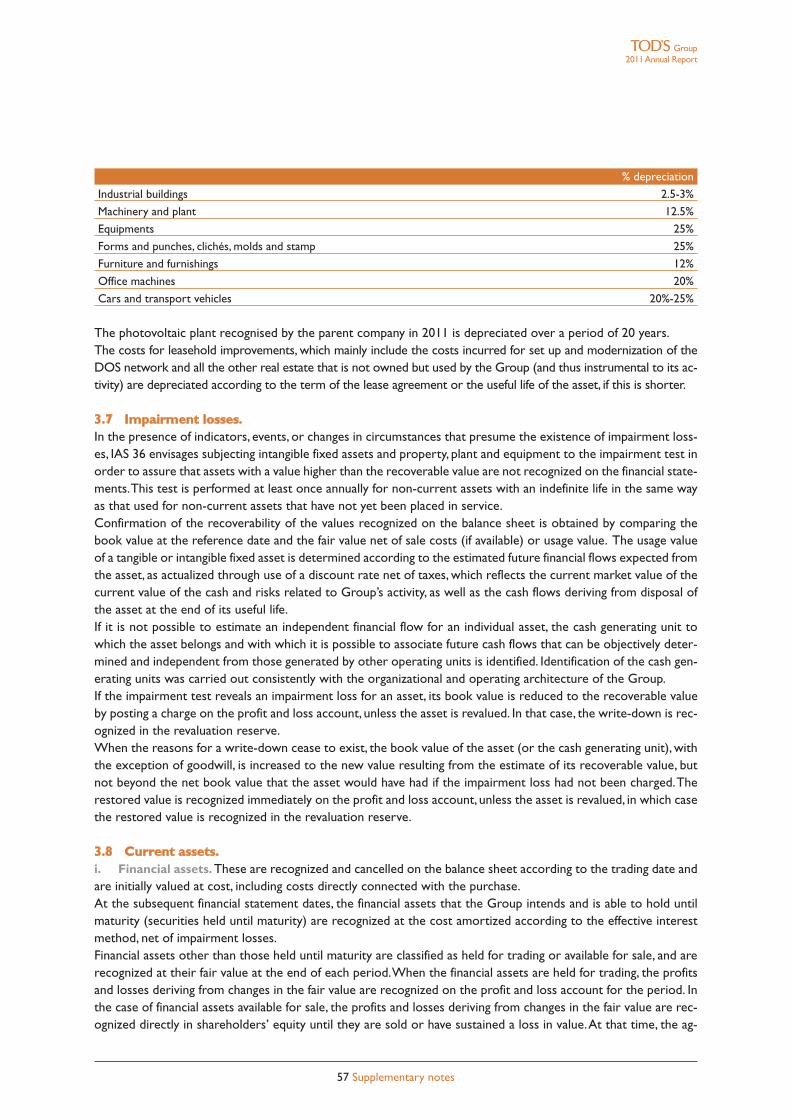
% depreciation
Industrial buildings 2.5-3%
Machinery and plant 12.5%
Equipments 25%
Forms and punches, clichés, molds and stamp 25%
Furniture and furnishings 12%
Office machines 20%
Cars and transport vehicles 20%-25%
The photovoltaic plant recognised by the parent company in 2011 is depreciated over a period of 20 years.The costs for leasehold improvements, which mainly include the costs incurred for set up and modernization of theDOS network and all the other real estate that is not owned but used by the Group (and thus instrumental to its ac-tivity) are depreciated according to the term of the lease agreement or the useful life of the asset, if this is shorter.
3.7 Impairment losses.In the presence of indicators, events, or changes in circumstances that presume the existence of impairment loss-es, IAS 36 envisages subjecting intangible fixed assets and property, plant and equipment to the impairment test inorder to assure that assets with a value higher than the recoverable value are not recognized on the financial state-ments.This test is performed at least once annually for non-current assets with an indefinite life in the same wayas that used for non-current assets that have not yet been placed in service.Confirmation of the recoverability of the values recognized on the balance sheet is obtained by comparing thebook value at the reference date and the fair value net of sale costs (if available) or usage value. The usage valueof a tangible or intangible fixed asset is determined according to the estimated future financial flows expected fromthe asset, as actualized through use of a discount rate net of taxes, which reflects the current market value of thecurrent value of the cash and risks related to Group’s activity, as well as the cash flows deriving from disposal ofthe asset at the end of its useful life.If it is not possible to estimate an independent financial flow for an individual asset, the cash generating unit towhich the asset belongs and with which it is possible to associate future cash flows that can be objectively deter-mined and independent from those generated by other operating units is identified. Identification of the cash gen-erating units was carried out consistently with the organizational and operating architecture of the Group.If the impairment test reveals an impairment loss for an asset, its book value is reduced to the recoverable valueby posting a charge on the profit and loss account, unless the asset is revalued. In that case, the write-down is rec-ognized in the revaluation reserve.When the reasons for a write-down cease to exist, the book value of the asset (or the cash generating unit), withthe exception of goodwill, is increased to the new value resulting from the estimate of its recoverable value, butnot beyond the net book value that the asset would have had if the impairment loss had not been charged.Therestored value is recognized immediately on the profit and loss account, unless the asset is revalued, in which casethe restored value is recognized in the revaluation reserve.
3.8 Current assets.i. Financial assets. These are recognized and cancelled on the balance sheet according to the trading date andare initially valued at cost, including costs directly connected with the purchase.At the subsequent financial statement dates, the financial assets that the Group intends and is able to hold untilmaturity (securities held until maturity) are recognized at the cost amortized according to the effective interestmethod, net of impairment losses.Financial assets other than those held until maturity are classified as held for trading or available for sale, and arerecognized at their fair value at the end of each period.When the financial assets are held for trading, the profitsand losses deriving from changes in the fair value are recognized on the profit and loss account for the period. Inthe case of financial assets available for sale, the profits and losses deriving from changes in the fair value are rec-ognized directly in shareholders’ equity until they are sold or have sustained a loss in value.At that time, the ag-
Group2011Annual Report
57 Supplementary notes
gregate profits or losses that were previously recognized in shareholders’ equity are recognized on the profit andloss account of the period.
ii. Inventories. These are recognized at the lower of purchase cost and their assumed disposal value. The netdisposal value represents the best estimate of the net sales price that can be realized through ordinary businessprocesses, net of any production costs not yet incurred and direct sales costs.The cost of inventories is based on the weighted average cost method. The production cost is determined by in-cluding all costs that are directly allocable to the products, regarding – for work in progress and/or semi-finishedproducts – the specific stage of the process that has been reached. The values that are thus obtained do not dif-fer appreciably from the current production costs referring to the same classes of assets.A special depreciation reserve is set aside for the portion of inventories that are no longer considered econom-ically useable, or with a presumed disposal value that is less than the cost recognized on the financial statements.
iii. Trade receivables and other receivables. These are valued and recognized on a prudent basis accordingto their presumed disposal value, by means of adjusting the face value with a specific allowance for doubtfulaccounts determined as follows:• receivables under litigation, with certain and precise evidence documenting the impossibility of collecting
them, have been analytically identified and then written down;• for other bad debts, prudent allowances for write-downs have been set aside, estimated on the basis of
information updated at the date of this document.
iv. Cash.This includes cash on hand, bank demand deposits, and financial investments with a maturity of no morethan three months.These assets are highly liquid, easily convertible into cash, and subject to a negligible risk ofchange in value.
v. Assets held for sale. Non-current assets are classified as held for sale when their carrying value will berecovered through disposal rather than through continuous use thereof. They are not amortised or depreciatedand are recognised at the lesser of their carrying and fair value, net of sales costs.
3.9 Benefits for employees.i. Defined contribution plans.The payments for eventual defined contribution plans are charged to the profitand loss account in the period that they are owed.
ii. Defined benefit plans.For defined benefit plans, the cost of the provided benefits is determined by using theprojected unit credit method, carrying out actuarial valuations at the end of every fiscal year.The accumulatedactuarial profits and losses not recognized at the beginning of the fiscal year are recognized only to the extent thatthey exceed 10% of the greater between the current volume of defined benefit plan liabilities of the Group andthe fair value of the assets of the program at that date.The cost of past work services is recognized immediatelyin the amount in which the benefits have already accrued or is otherwise amortized at a constant rate by theaverage period in which it is expected that the benefits will accrue.The liabilities for benefits paid out after termination of the employment relationship reported on the financialstatements represent the current value of liabilities for defined benefit plans adjusted to take into account the ac-tuarial profits and losses that were not recognized and the costs for past work services that were not recognized,and reduced by the fair value of the program assets.Any net assets resulting from this calculation are limited tothe value of the unreported actuarial losses and the cost for the past work services that were not recognized,plus the current value of any reimbursements and reductions in the future contributions to the plan.
iii. Share based payments.The payments based on shares are assessed at their fair value on the assignment date.This value is recognized on the profit and loss account on a straight-line basis throughout the period of accrualof the rights. This allocation is made on the basis of a management estimate of the stock options that will actuallyaccrue in favor of vested employees, considering the conditions for use thereof not based on their market value.The fair value is determined by using the binomial method. The useful life utilized in the model has been adjust-ed according to an estimate by management in order to take into account the effects of non-transferability of theoptions, restrictions on exercise thereof, and the assumed behavior of individuals.
Group2011Annual Report
58 Supplementary notes
3.10 Payables.i. Bank overdrafts and financing. Interest-bearing financing and bank overdrafts are recognized on the basisof the amounts collected, net of transaction costs, and subsequently valued at the amortized cost, using the effectiveinterest method.
ii. Trade payables and other payables. These are their face value.
3.11 Revenues recognition. Revenues are recognized on the profit and loss account when the significantrisks and benefits connected with ownership of the transferred assets are transferred to the buyer. In referenceto the principal types realized by the Group, revenues are recognized on the basis of the following principles:
i. Sales of goods - retail. The Group operates in the retail channel through its DOS network. Revenues arerecognised when the goods are delivered to customers. Sales are usually collected in the form of cash or throughcredit cards.
ii. Sales of goods - wholesale. The Group distributes products on the wholesale market. These revenues arerecognised when the goods are shipped and considering the estimated effects of returns at the end of the year.
iii. Provision of services. This income is recognised in proportion to the percentage of completion for theservice provided on the reference date.
iv. Royalties. These are recognised on the financial statements according to the principle of period allocation.
3.12 Financial income and expenses.These include all financial items recognized on the profit and loss account for the period, including interest ex-penses accrued on financial payables calculated by using the effective interest method (mainly current accountoverdrafts, medium-long term financing), foreign exchange gains and losses, gains and losses on derivative financialinstruments (according to the previously defined accounting principles), received dividends, the portion of inter-est expenses deriving from accounting treatment of assets held under finance leasing (IAS 17) and employee re-serves (IAS 19).Interest income and expenses are recognized on the profit and loss account for the period in which they are re-alized/incurred, with the exception of capitalized expenses (IAS 23).Dividend income contributes to the result for the period in which the Group accrues the right to receive the pay-ment.
3.13 Income taxes.The income taxes for the period include determination both of current taxes and deferred taxes.They are rec-ognized entirely on the profit and loss account and included in the result for the period, unless they are generat-ed by transactions recognized directly to shareholders’ equity during the current or another period. In this case,the relative deferred tax liabilities are also recognized under shareholders’ equity.Current taxes on taxable income for the period represent the tax burden determined by using the tax rates ineffect at the reference date and any adjustments to the tax payables calculated during previous periods. Deferredtax liabilities refer to the temporary differences between the book values of assets and liabilities on the balancesheets of consolidated companies and the associated values relevant for determination of taxable income.The tax liability of all temporary taxable differences, with the exception of liabilities deriving from initial recogni-tion of an asset or liability in a transaction other than a business combination that, at the time of the transaction,does not influence either the income (loss) reported on the financial statements or taxable income (tax loss).Deferred tax assets that derive from temporary deductible differences are recognized on the financial statementsonly to the extent that it is likely taxable income will be realized for which the temporary deductible differencecan be used. No allocation is envisaged if the deferred tax asset derives from business combinations, or from theinitial posting of an asset or liability in a transaction other than a business combination that, at the time of the trans-action, does not influence either the income (loss) reported on the financial statements or taxable income (taxloss).
Group2011Annual Report
59 Supplementary notes
The tax benefits resulting from tax losses are recognised on the financial statements in the period when thosebenefits are accrued, if it is likely that the Group’s entity which recognised the tax loss will have sufficient taxableincome before the right to use that benefit expires.The taxes in question (deferred tax assets and liabilities) aredetermined on the basis of a forecast of the assumed percentage weight of the taxes on the income of the fiscalyears in which the taxes will occur, taking into account the specific nature of taxability and deductibility.The effectof change in tax rates is recognized on the profit and loss account of the fiscal year in which this change takesplace.
3.14 Provisions.These are certain or probable liabilities that have not been determined at the date they occurred and in theamount of the economic resources to be used for fulfilling the obligation, but which can nonetheless be reliablyestimated.They are recognized on the balance sheet in the event of an existing obligation resulting from a pastevent, and it is likely that the Group will be asked to satisfy the obligation.If the effect is significant, and the date of the presumed discharge of the obligation can be estimated with sufficientreliability, the provisions are recognized on the balance sheet by actualizing future financial flows.The provisions that can be reasonably expected to be discharged twelve months after the reference date are clas-sified on the financial statements under non-current liabilities. Instead, the provisions for which the use of resourcescapable of generating economic benefits is expected to take place in less than twelve months after the referencedate are recognized as current liabilities.
3.15 Share capital.i. Share capital. The total value of shares issued by the parent company is recognized entirely undershareholders’ equity, as they are the instruments representing its capital.
ii. Treasury stock.The consideration paid for buy-back of share capital (treasury stock), including the expensesdirectly related to the transaction, is subtracted from shareholders’ equity. In particular, the par value of the sharesreduces the share capital, while the excess value is recognized as an adjustment to additional paid-in capital.
iii. Dividends. The allocation of dividends to persons possessing instruments representing share capital afterthe reference date of the financial statement is not recognized under financial liabilities on the same reference date.
3.16 Statement of cash flow.The statement of cash flows is drafted using the indirect method. The net financial flows of operating activity aredetermined by adjusting the result for the period of the effects deriving from change to net operating workingcapital, non-monetary items, and all the other effects connected with investment and financing activities.Cash at the beginning and end of the period represents the net-short-term financial position of the Group.
4. Segment reporting
The search for higher levels of operating efficiency has identified as key element for maximising profitability viathe condivision of a significant portion of service activities (first and foremost production), both at the central andperipheral levels; on the contrary, aggressive segmentation of the business appears uneconomical, under currentcircumstances.At the operating level, the Group’s organisation is based on an articulated matrix structure according to the dif-ferent functions/activities in the value chain, alternatively according to brand, product, channel and geographicalarea.The overall organisation envisages a unified strategic vision of the business.This type of organisation is reflected in the ways in which management monitors and strategically focuses theGroup’s activities.The Report of the Board of Directors includes operating information, including a breakdown of consolidated rev-enues by BRAND, CHANNEL, PRODUCT and REGION and INCOME STATEMENT for the business. Completeinformation is provided as follows.
Group2011Annual Report
60 Supplementary notes
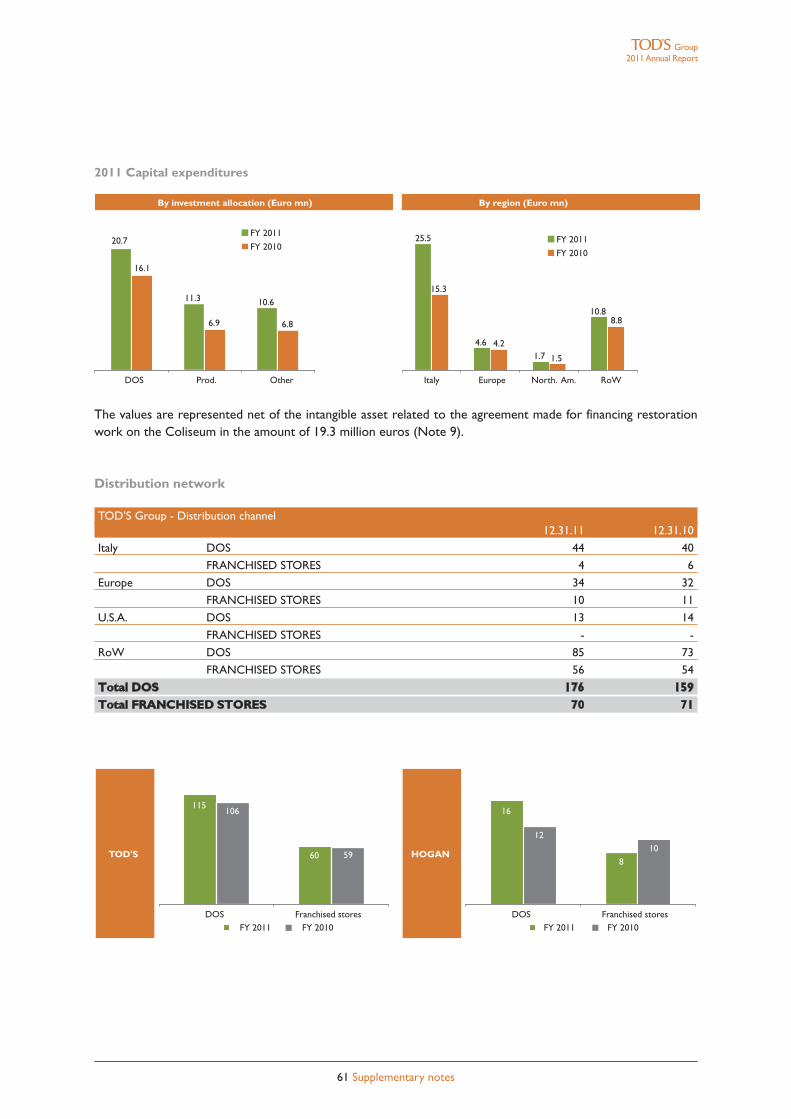
61 Supplementary notes
Group2011Annual Report
2011 Capital expenditures
The values are represented net of the intangible asset related to the agreement made for financing restorationwork on the Coliseum in the amount of 19.3 million euros (Note 9).
Distribution network
TOD’S Group - Distribution channel12.31.11 12.31.10
Italy DOS 44 40
FRANCHISED STORES 4 6
Europe DOS 34 32
FRANCHISED STORES 10 11
U.S.A. DOS 13 14
FRANCHISED STORES - -
RoW DOS 85 73
FRANCHISED STORES 56 54
Total DOS 176 159Total FRANCHISED STORES 70 71
By investment allocation (Euro mn) By region (Euro mn)
11.3 10.6
6.9 6.8
20.7
16.1
25.5
4.6
1.7
10.88.8
1.5
4.2
15.3
FY 2011
FY 2010FY 2011
FY 2010
DOS Prod. Other Italy Europe North. Am. RoW
TOD'S HOGAN
115
60
106
59
16
8
1210
DOS Franchised stores FY 2011 FY 2010
DOS Franchised stores FY 2011 FY 2010
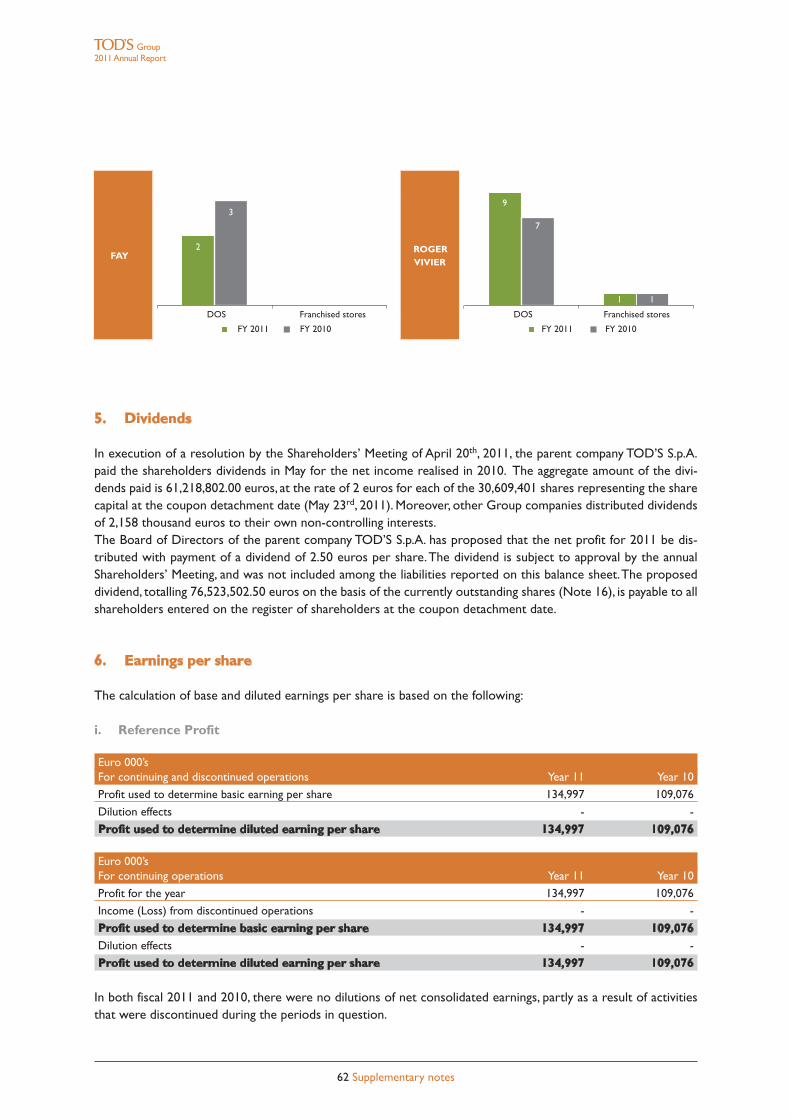
62 Supplementary notes
Group2011Annual Report
5. Dividends
In execution of a resolution by the Shareholders’ Meeting of April 20th, 2011, the parent company TOD’S S.p.A.paid the shareholders dividends in May for the net income realised in 2010. The aggregate amount of the divi-dends paid is 61,218,802.00 euros, at the rate of 2 euros for each of the 30,609,401 shares representing the sharecapital at the coupon detachment date (May 23rd, 2011). Moreover, other Group companies distributed dividendsof 2,158 thousand euros to their own non-controlling interests.The Board of Directors of the parent company TOD’S S.p.A. has proposed that the net profit for 2011 be dis-tributed with payment of a dividend of 2.50 euros per share.The dividend is subject to approval by the annualShareholders’ Meeting, and was not included among the liabilities reported on this balance sheet.The proposeddividend, totalling 76,523,502.50 euros on the basis of the currently outstanding shares (Note 16), is payable to allshareholders entered on the register of shareholders at the coupon detachment date.
6. Earnings per share
The calculation of base and diluted earnings per share is based on the following:
i. Reference Profit
Euro 000’sFor continuing and discontinued operations Year 11 Year 10
Profit used to determine basic earning per share 134,997 109,076
Dilution effects - -
Profit used to determine diluted earning per share 134,997 109,076
Euro 000’sFor continuing operations Year 11 Year 10
Profit for the year 134,997 109,076
Income (Loss) from discontinued operations - -
Profit used to determine basic earning per share 134,997 109,076Dilution effects - -
Profit used to determine diluted earning per share 134,997 109,076
In both fiscal 2011 and 2010, there were no dilutions of net consolidated earnings, partly as a result of activitiesthat were discontinued during the periods in question.
1
FAYROGERVIVIER
22
3
2
9
1
7
DOS Franchised stores
FY 2011 FY 2010
DOS Franchised stores
FY 2011 FY 2010
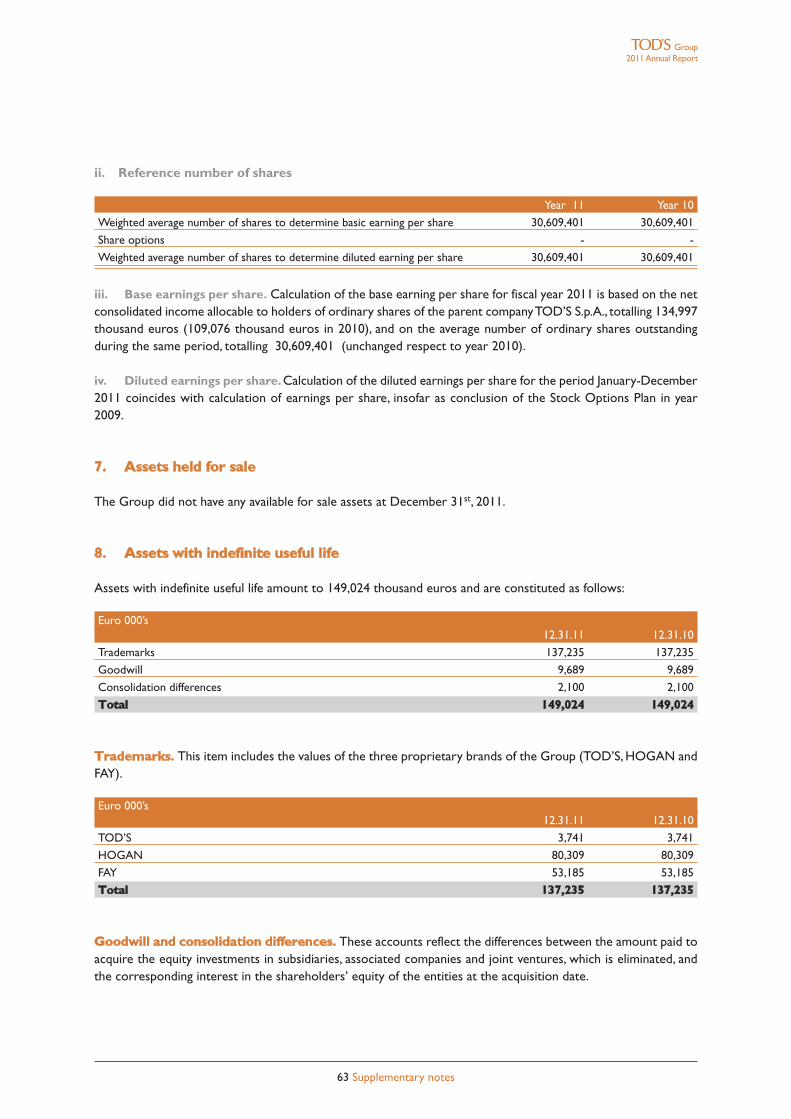
63 Supplementary notes
Group2011Annual Report
ii. Reference number of shares
Year 11 Year 10
Weighted average number of shares to determine basic earning per share 30,609,401 30,609,401
Share options - -
Weighted average number of shares to determine diluted earning per share 30,609,401 30,609,401
iii. Base earnings per share. Calculation of the base earning per share for fiscal year 2011 is based on the netconsolidated income allocable to holders of ordinary shares of the parent companyTOD’S S.p.A., totalling 134,997thousand euros (109,076 thousand euros in 2010), and on the average number of ordinary shares outstandingduring the same period, totalling 30,609,401 (unchanged respect to year 2010).
iv. Diluted earnings per share.Calculation of the diluted earnings per share for the period January-December2011 coincides with calculation of earnings per share, insofar as conclusion of the Stock Options Plan in year2009.
7. Assets held for sale
The Group did not have any available for sale assets at December 31st, 2011.
8. Assets with indefinite useful life
Assets with indefinite useful life amount to 149,024 thousand euros and are constituted as follows:
Euro 000’s12.31.11 12.31.10
Trademarks 137,235 137,235
Goodwill 9,689 9,689
Consolidation differences 2,100 2,100
Total 149,024 149,024
Trademarks. This item includes the values of the three proprietary brands of the Group (TOD’S, HOGAN andFAY).
Euro 000’s12.31.11 12.31.10
TOD’S 3,741 3,741
HOGAN 80,309 80,309
FAY 53,185 53,185
Total 137,235 137,235
Goodwill and consolidation differences. These accounts reflect the differences between the amount paid toacquire the equity investments in subsidiaries, associated companies and joint ventures, which is eliminated, andthe corresponding interest in the shareholders’ equity of the entities at the acquisition date.
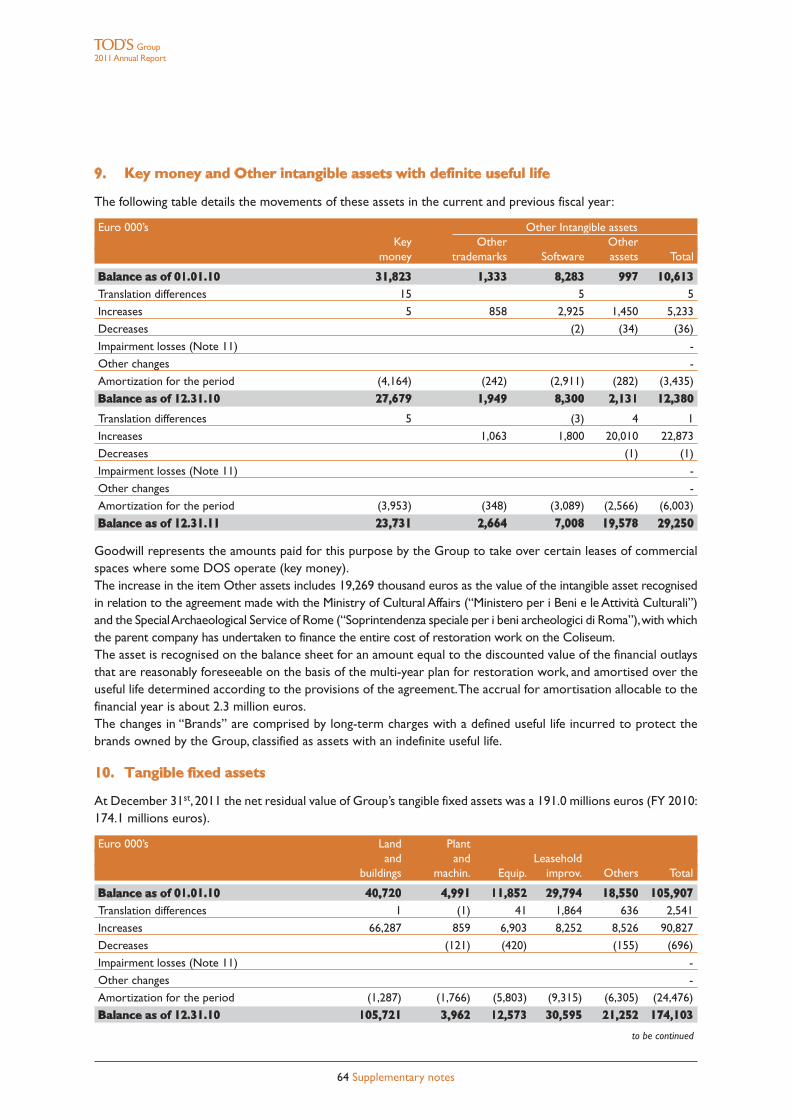
64 Supplementary notes
Group2011Annual Report
9. Key money and Other intangible assets with definite useful life
The following table details the movements of these assets in the current and previous fiscal year:
Euro 000’s Other Intangible assetsKey Other Other
money trademarks Software assets Total
Balance as of 01.01.10 31,823 1,333 8,283 997 10,613Translation differences 15 5 5
Increases 5 858 2,925 1,450 5,233
Decreases (2) (34) (36)
Impairment losses (Note 11) -
Other changes -
Amortization for the period (4,164) (242) (2,911) (282) (3,435)
Balance as of 12.31.10 27,679 1,949 8,300 2,131 12,380
Translation differences 5 (3) 4 1
Increases 1,063 1,800 20,010 22,873
Decreases (1) (1)
Impairment losses (Note 11) -
Other changes -
Amortization for the period (3,953) (348) (3,089) (2,566) (6,003)
Balance as of 12.31.11 23,731 2,664 7,008 19,578 29,250
Goodwill represents the amounts paid for this purpose by the Group to take over certain leases of commercialspaces where some DOS operate (key money).The increase in the item Other assets includes 19,269 thousand euros as the value of the intangible asset recognisedin relation to the agreement made with the Ministry of Cultural Affairs (“Ministero per i Beni e le Attività Culturali”)and the SpecialArchaeological Service of Rome (“Soprintendenza speciale per i beni archeologici di Roma”),with whichthe parent company has undertaken to finance the entire cost of restoration work on the Coliseum.The asset is recognised on the balance sheet for an amount equal to the discounted value of the financial outlaysthat are reasonably foreseeable on the basis of the multi-year plan for restoration work, and amortised over theuseful life determined according to the provisions of the agreement.The accrual for amortisation allocable to thefinancial year is about 2.3 million euros.The changes in “Brands” are comprised by long-term charges with a defined useful life incurred to protect thebrands owned by the Group, classified as assets with an indefinite useful life.
10. Tangible fixed assets
At December 31st, 2011 the net residual value of Group’s tangible fixed assets was a 191.0 millions euros (FY 2010:174.1 millions euros).
Euro 000’s Land Plantand and Leasehold
buildings machin. Equip. improv. Others Total
Balance as of 01.01.10 40,720 4,991 11,852 29,794 18,550 105,907Translation differences 1 (1) 41 1,864 636 2,541
Increases 66,287 859 6,903 8,252 8,526 90,827
Decreases (121) (420) (155) (696)
Impairment losses (Note 11) -
Other changes -
Amortization for the period (1,287) (1,766) (5,803) (9,315) (6,305) (24,476)
Balance as of 12.31.10 105,721 3,962 12,573 30,595 21,252 174,103
to be continued
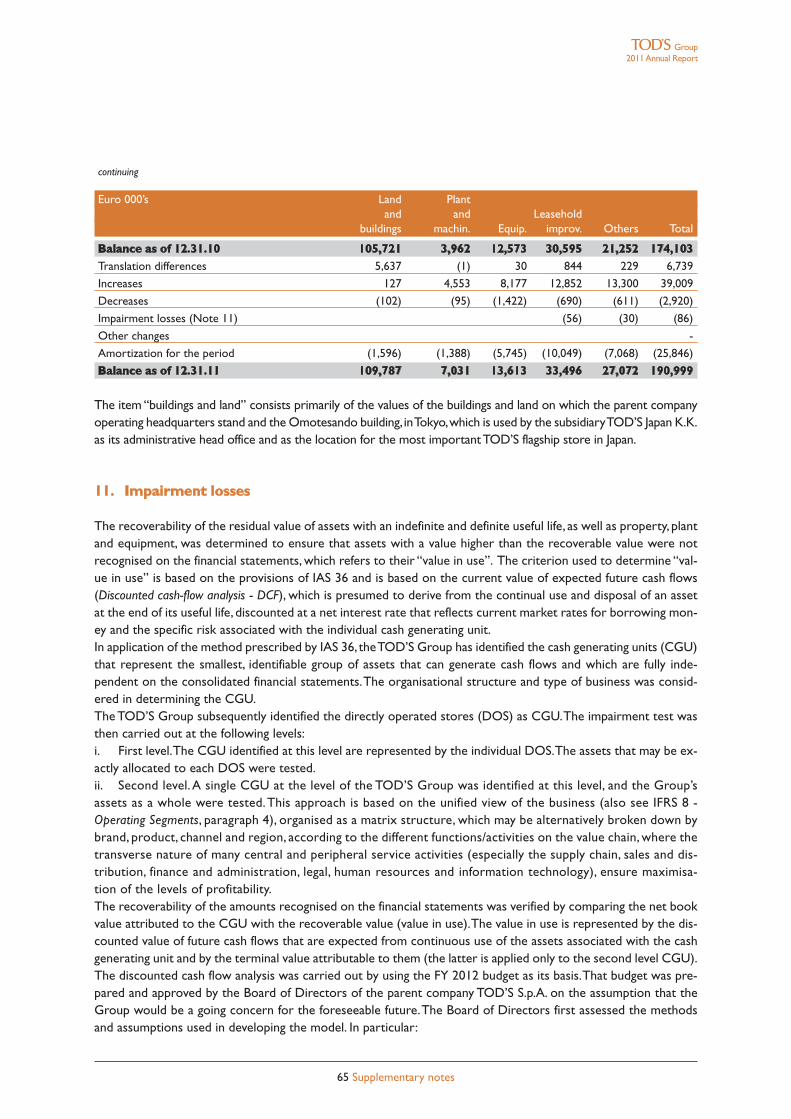
65 Supplementary notes
Group2011Annual Report
continuing
Euro 000’s Land Plantand and Leasehold
buildings machin. Equip. improv. Others Total
Balance as of 12.31.10 105,721 3,962 12,573 30,595 21,252 174,103Translation differences 5,637 (1) 30 844 229 6,739
Increases 127 4,553 8,177 12,852 13,300 39,009
Decreases (102) (95) (1,422) (690) (611) (2,920)
Impairment losses (Note 11) (56) (30) (86)
Other changes -
Amortization for the period (1,596) (1,388) (5,745) (10,049) (7,068) (25,846)
Balance as of 12.31.11 109,787 7,031 13,613 33,496 27,072 190,999
The item “buildings and land” consists primarily of the values of the buildings and land on which the parent companyoperating headquarters stand and the Omotesando building, inTokyo,which is used by the subsidiaryTOD’S Japan K.K.as its administrative head office and as the location for the most importantTOD’S flagship store in Japan.
11. Impairment losses
The recoverability of the residual value of assets with an indefinite and definite useful life, as well as property, plantand equipment, was determined to ensure that assets with a value higher than the recoverable value were notrecognised on the financial statements, which refers to their “value in use”. The criterion used to determine “val-ue in use” is based on the provisions of IAS 36 and is based on the current value of expected future cash flows(Discounted cash-flow analysis - DCF), which is presumed to derive from the continual use and disposal of an assetat the end of its useful life, discounted at a net interest rate that reflects current market rates for borrowing mon-ey and the specific risk associated with the individual cash generating unit.In application of the method prescribed by IAS 36, theTOD’S Group has identified the cash generating units (CGU)that represent the smallest, identifiable group of assets that can generate cash flows and which are fully inde-pendent on the consolidated financial statements.The organisational structure and type of business was consid-ered in determining the CGU.The TOD’S Group subsequently identified the directly operated stores (DOS) as CGU.The impairment test wasthen carried out at the following levels:i. First level.The CGU identified at this level are represented by the individual DOS.The assets that may be ex-actly allocated to each DOS were tested.ii. Second level.A single CGU at the level of the TOD’S Group was identified at this level, and the Group’sassets as a whole were tested.This approach is based on the unified view of the business (also see IFRS 8 -Operating Segments, paragraph 4), organised as a matrix structure, which may be alternatively broken down bybrand, product, channel and region, according to the different functions/activities on the value chain, where thetransverse nature of many central and peripheral service activities (especially the supply chain, sales and dis-tribution, finance and administration, legal, human resources and information technology), ensure maximisa-tion of the levels of profitability.The recoverability of the amounts recognised on the financial statements was verified by comparing the net bookvalue attributed to the CGU with the recoverable value (value in use).The value in use is represented by the dis-counted value of future cash flows that are expected from continuous use of the assets associated with the cashgenerating unit and by the terminal value attributable to them (the latter is applied only to the second level CGU).The discounted cash flow analysis was carried out by using the FY 2012 budget as its basis.That budget was pre-pared and approved by the Board of Directors of the parent company TOD’S S.p.A. on the assumption that theGroup would be a going concern for the foreseeable future.The Board of Directors first assessed the methodsand assumptions used in developing the model. In particular:
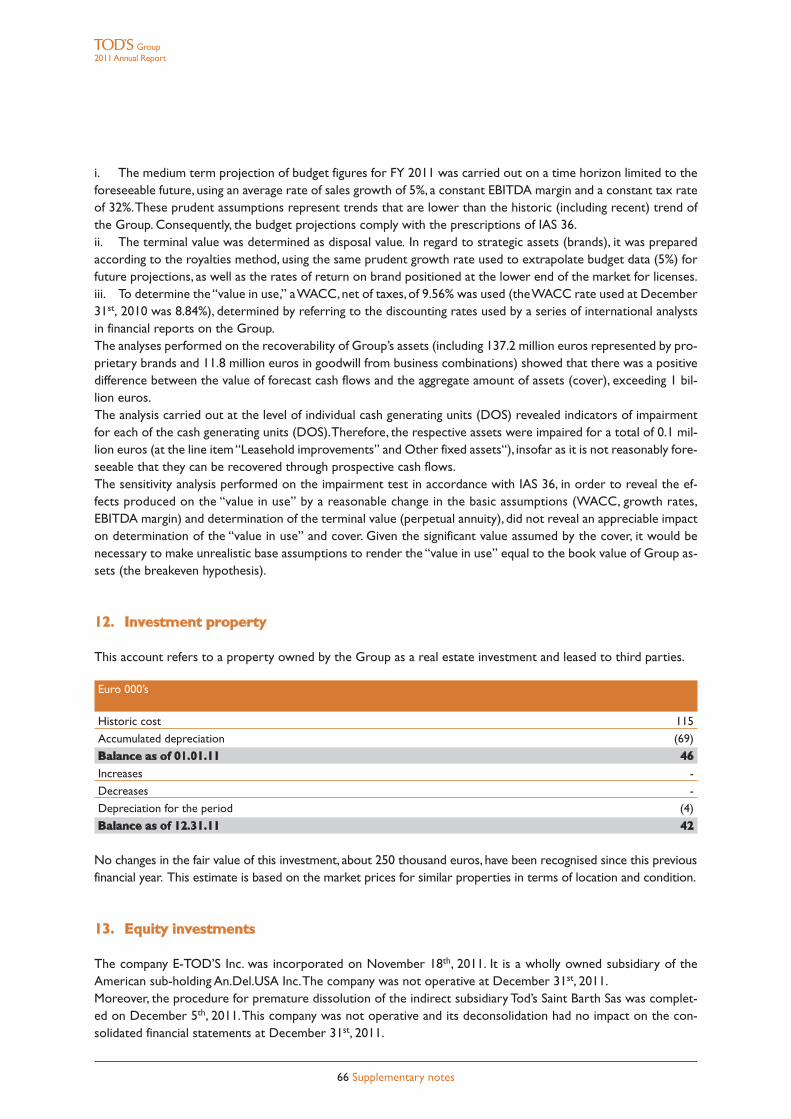
66 Supplementary notes
Group2011Annual Report
i. The medium term projection of budget figures for FY 2011 was carried out on a time horizon limited to theforeseeable future, using an average rate of sales growth of 5%, a constant EBITDA margin and a constant tax rateof 32%.These prudent assumptions represent trends that are lower than the historic (including recent) trend ofthe Group. Consequently, the budget projections comply with the prescriptions of IAS 36.ii. The terminal value was determined as disposal value. In regard to strategic assets (brands), it was preparedaccording to the royalties method, using the same prudent growth rate used to extrapolate budget data (5%) forfuture projections, as well as the rates of return on brand positioned at the lower end of the market for licenses.iii. To determine the“value in use,” aWACC,net of taxes,of 9.56% was used (theWACC rate used at December31st, 2010 was 8.84%), determined by referring to the discounting rates used by a series of international analystsin financial reports on the Group.The analyses performed on the recoverability of Group’s assets (including 137.2 million euros represented by pro-prietary brands and 11.8 million euros in goodwill from business combinations) showed that there was a positivedifference between the value of forecast cash flows and the aggregate amount of assets (cover), exceeding 1 bil-lion euros.The analysis carried out at the level of individual cash generating units (DOS) revealed indicators of impairmentfor each of the cash generating units (DOS).Therefore, the respective assets were impaired for a total of 0.1 mil-lion euros (at the line item“Leasehold improvements” and Other fixed assets“), insofar as it is not reasonably fore-seeable that they can be recovered through prospective cash flows.The sensitivity analysis performed on the impairment test in accordance with IAS 36, in order to reveal the ef-fects produced on the “value in use” by a reasonable change in the basic assumptions (WACC, growth rates,EBITDA margin) and determination of the terminal value (perpetual annuity), did not reveal an appreciable impacton determination of the “value in use” and cover. Given the significant value assumed by the cover, it would benecessary to make unrealistic base assumptions to render the “value in use” equal to the book value of Group as-sets (the breakeven hypothesis).
12. Investment property
This account refers to a property owned by the Group as a real estate investment and leased to third parties.
Euro 000’s
Historic cost 115
Accumulated depreciation (69)
Balance as of 01.01.11 46Increases -
Decreases -
Depreciation for the period (4)
Balance as of 12.31.11 42
No changes in the fair value of this investment, about 250 thousand euros, have been recognised since this previousfinancial year. This estimate is based on the market prices for similar properties in terms of location and condition.
13. Equity investments
The company E-TOD’S Inc. was incorporated on November 18th, 2011. It is a wholly owned subsidiary of theAmerican sub-holding An.Del.USA Inc.The company was not operative at December 31st, 2011.Moreover, the procedure for premature dissolution of the indirect subsidiary Tod’s Saint Barth Sas was complet-ed on December 5th, 2011.This company was not operative and its deconsolidation had no impact on the con-solidated financial statements at December 31st, 2011.
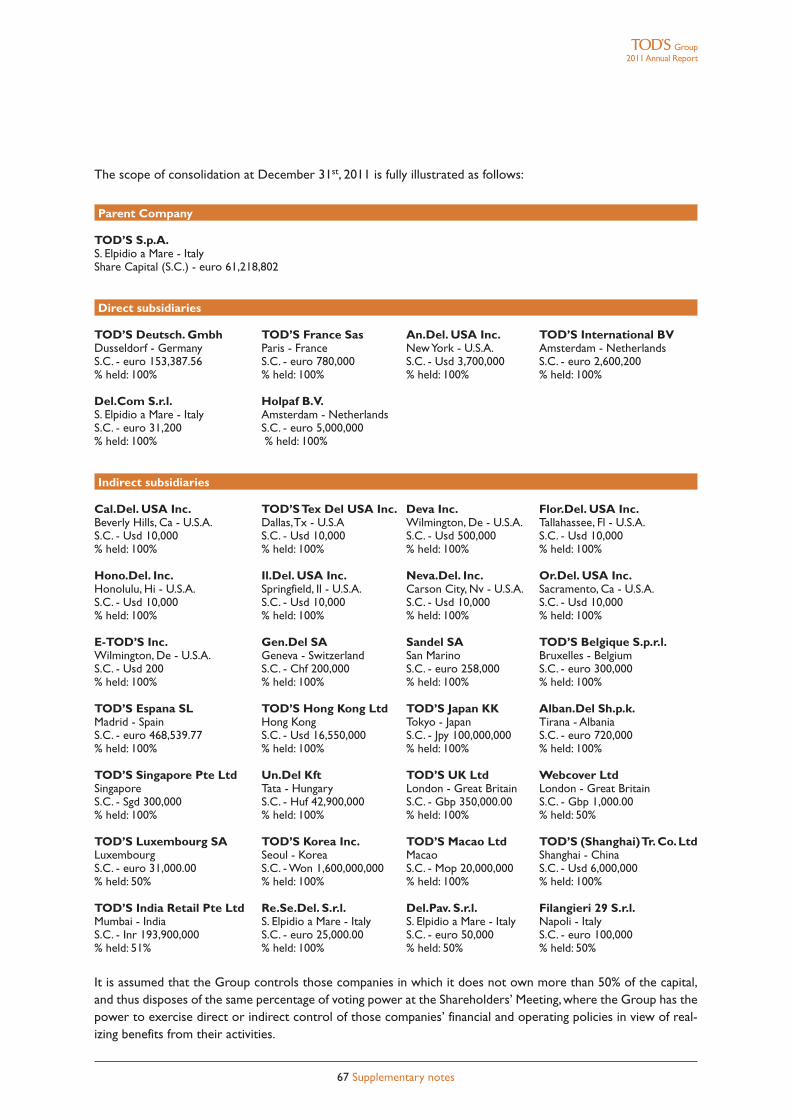
67 Supplementary notes
Group2011Annual Report
The scope of consolidation at December 31st, 2011 is fully illustrated as follows:
Parent Company
TOD’S S.p.A.S. Elpidio a Mare - ItalyShare Capital (S.C.) - euro 61,218,802
Direct subsidiaries
TOD’S Deutsch. Gmbh TOD’S France Sas An.Del. USA Inc. TOD’S International BVDusseldorf - Germany Paris - France NewYork - U.S.A. Amsterdam - NetherlandsS.C. - euro 153,387.56 S.C. - euro 780,000 S.C. - Usd 3,700,000 S.C. - euro 2,600,200% held: 100% % held: 100% % held: 100% % held: 100%
Del.Com S.r.l. Holpaf B.V.S. Elpidio a Mare - Italy Amsterdam - NetherlandsS.C. - euro 31,200 S.C. - euro 5,000,000% held: 100% % held: 100%
Indirect subsidiaries
Cal.Del. USA Inc. TOD’STex Del USA Inc. Deva Inc. Flor.Del. USA Inc.Beverly Hills, Ca - U.S.A. Dallas,Tx - U.S.A Wilmington, De - U.S.A. Tallahassee, Fl - U.S.A.S.C. - Usd 10,000 S.C. - Usd 10,000 S.C. - Usd 500,000 S.C. - Usd 10,000% held: 100% % held: 100% % held: 100% % held: 100%
Hono.Del. Inc. Il.Del. USA Inc. Neva.Del. Inc. Or.Del. USA Inc.Honolulu, Hi - U.S.A. Springfield, Il - U.S.A. Carson City, Nv - U.S.A. Sacramento, Ca - U.S.A.S.C. - Usd 10,000 S.C. - Usd 10,000 S.C. - Usd 10,000 S.C. - Usd 10,000% held: 100% % held: 100% % held: 100% % held: 100%
E-TOD’S Inc. Gen.Del SA Sandel SA TOD’S Belgique S.p.r.l.Wilmington, De - U.S.A. Geneva - Switzerland San Marino Bruxelles - BelgiumS.C. - Usd 200 S.C. - Chf 200,000 S.C. - euro 258,000 S.C. - euro 300,000% held: 100% % held: 100% % held: 100% % held: 100%
TOD’S Espana SL TOD’S Hong Kong Ltd TOD’S Japan KK Alban.Del Sh.p.k.Madrid - Spain Hong Kong Tokyo - Japan Tirana - AlbaniaS.C. - euro 468,539.77 S.C. - Usd 16,550,000 S.C. - Jpy 100,000,000 S.C. - euro 720,000% held: 100% % held: 100% % held: 100% % held: 100%
TOD’S Singapore Pte Ltd Un.Del Kft TOD’S UK Ltd Webcover LtdSingapore Tata - Hungary London - Great Britain London - Great BritainS.C. - Sgd 300,000 S.C. - Huf 42,900,000 S.C. - Gbp 350,000.00 S.C. - Gbp 1,000.00% held: 100% % held: 100% % held: 100% % held: 50%
TOD’S Luxembourg SA TOD’S Korea Inc. TOD’S Macao Ltd TOD’S (Shanghai)Tr.Co.LtdLuxembourg Seoul - Korea Macao Shanghai - ChinaS.C. - euro 31,000.00 S.C. - Won 1,600,000,000 S.C. - Mop 20,000,000 S.C. - Usd 6,000,000% held: 50% % held: 100% % held: 100% % held: 100%
TOD’S India Retail Pte Ltd Re.Se.Del. S.r.l. Del.Pav. S.r.l. Filangieri 29 S.r.l.Mumbai - India S. Elpidio a Mare - Italy S. Elpidio a Mare - Italy Napoli - ItalyS.C. - Inr 193,900,000 S.C. - euro 25,000.00 S.C. - euro 50,000 S.C. - euro 100,000% held: 51% % held: 100% % held: 50% % held: 50%
It is assumed that the Group controls those companies in which it does not own more than 50% of the capital,and thus disposes of the same percentage of voting power at the Shareholders’ Meeting,where the Group has thepower to exercise direct or indirect control of those companies’ financial and operating policies in view of real-izing benefits from their activities.
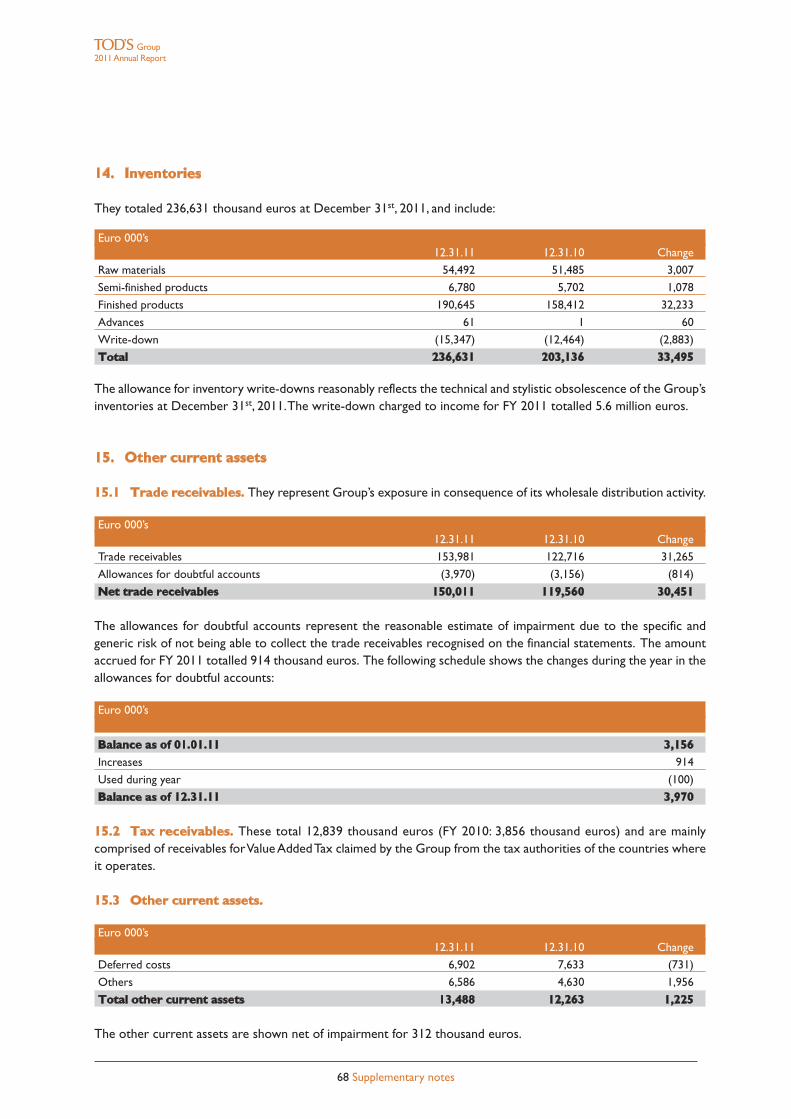
68 Supplementary notes
Group2011Annual Report
14. Inventories
They totaled 236,631 thousand euros at December 31st, 2011, and include:
Euro 000’s12.31.11 12.31.10 Change
Raw materials 54,492 51,485 3,007
Semi-finished products 6,780 5,702 1,078
Finished products 190,645 158,412 32,233
Advances 61 1 60
Write-down (15,347) (12,464) (2,883)
Total 236,631 203,136 33,495
The allowance for inventory write-downs reasonably reflects the technical and stylistic obsolescence of the Group’sinventories at December 31st, 2011.The write-down charged to income for FY 2011 totalled 5.6 million euros.
15. Other current assets
15.1 Trade receivables. They represent Group’s exposure in consequence of its wholesale distribution activity.
Euro 000’s12.31.11 12.31.10 Change
Trade receivables 153,981 122,716 31,265
Allowances for doubtful accounts (3,970) (3,156) (814)
Net trade receivables 150,011 119,560 30,451
The allowances for doubtful accounts represent the reasonable estimate of impairment due to the specific andgeneric risk of not being able to collect the trade receivables recognised on the financial statements. The amountaccrued for FY 2011 totalled 914 thousand euros. The following schedule shows the changes during the year in theallowances for doubtful accounts:
Euro 000’s
Balance as of 01.01.11 3,156Increases 914
Used during year (100)
Balance as of 12.31.11 3,970
15.2 Tax receivables. These total 12,839 thousand euros (FY 2010: 3,856 thousand euros) and are mainlycomprised of receivables forValueAddedTax claimed by the Group from the tax authorities of the countries whereit operates.
15.3 Other current assets.
Euro 000’s12.31.11 12.31.10 Change
Deferred costs 6,902 7,633 (731)
Others 6,586 4,630 1,956
Total other current assets 13,488 12,263 1,225
The other current assets are shown net of impairment for 312 thousand euros.
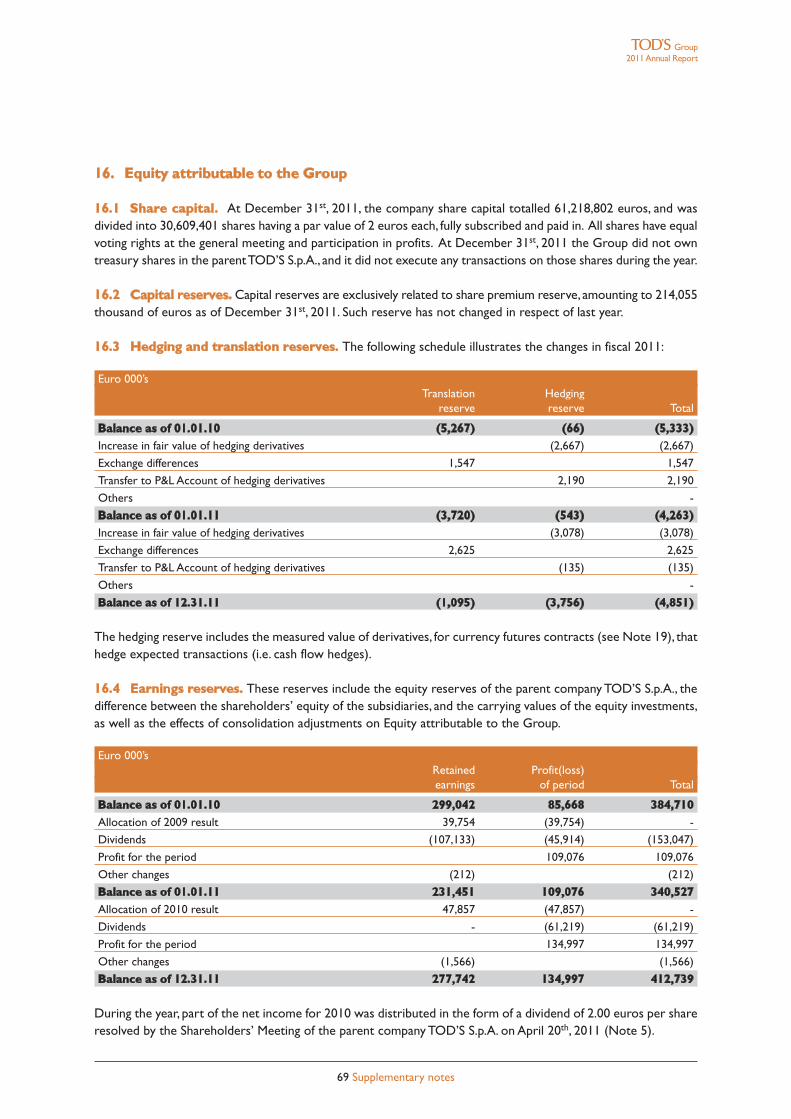
69 Supplementary notes
Group2011Annual Report
16. Equity attributable to the Group
16.1 Share capital. At December 31st, 2011, the company share capital totalled 61,218,802 euros, and wasdivided into 30,609,401 shares having a par value of 2 euros each, fully subscribed and paid in. All shares have equalvoting rights at the general meeting and participation in profits. At December 31st, 2011 the Group did not owntreasury shares in the parentTOD’S S.p.A., and it did not execute any transactions on those shares during the year.
16.2 Capital reserves. Capital reserves are exclusively related to share premium reserve, amounting to 214,055thousand of euros as of December 31st, 2011. Such reserve has not changed in respect of last year.
16.3 Hedging and translation reserves. The following schedule illustrates the changes in fiscal 2011:
Euro 000’sTranslation Hedging
reserve reserve Total
Balance as of 01.01.10 (5,267) (66) (5,333)Increase in fair value of hedging derivatives (2,667) (2,667)
Exchange differences 1,547 1,547
Transfer to P&L Account of hedging derivatives 2,190 2,190
Others -
Balance as of 01.01.11 (3,720) (543) (4,263)Increase in fair value of hedging derivatives (3,078) (3,078)
Exchange differences 2,625 2,625
Transfer to P&L Account of hedging derivatives (135) (135)
Others -
Balance as of 12.31.11 (1,095) (3,756) (4,851)
The hedging reserve includes the measured value of derivatives, for currency futures contracts (see Note 19), thathedge expected transactions (i.e. cash flow hedges).
16.4 Earnings reserves. These reserves include the equity reserves of the parent company TOD’S S.p.A., thedifference between the shareholders’ equity of the subsidiaries, and the carrying values of the equity investments,as well as the effects of consolidation adjustments on Equity attributable to the Group.
Euro 000’sRetained Profit(loss)earnings of period Total
Balance as of 01.01.10 299,042 85,668 384,710Allocation of 2009 result 39,754 (39,754) -
Dividends (107,133) (45,914) (153,047)
Profit for the period 109,076 109,076
Other changes (212) (212)
Balance as of 01.01.11 231,451 109,076 340,527Allocation of 2010 result 47,857 (47,857) -
Dividends - (61,219) (61,219)
Profit for the period 134,997 134,997
Other changes (1,566) (1,566)
Balance as of 12.31.11 277,742 134,997 412,739
During the year, part of the net income for 2010 was distributed in the form of a dividend of 2.00 euros per shareresolved by the Shareholders’ Meeting of the parent company TOD’S S.p.A. on April 20th, 2011 (Note 5).
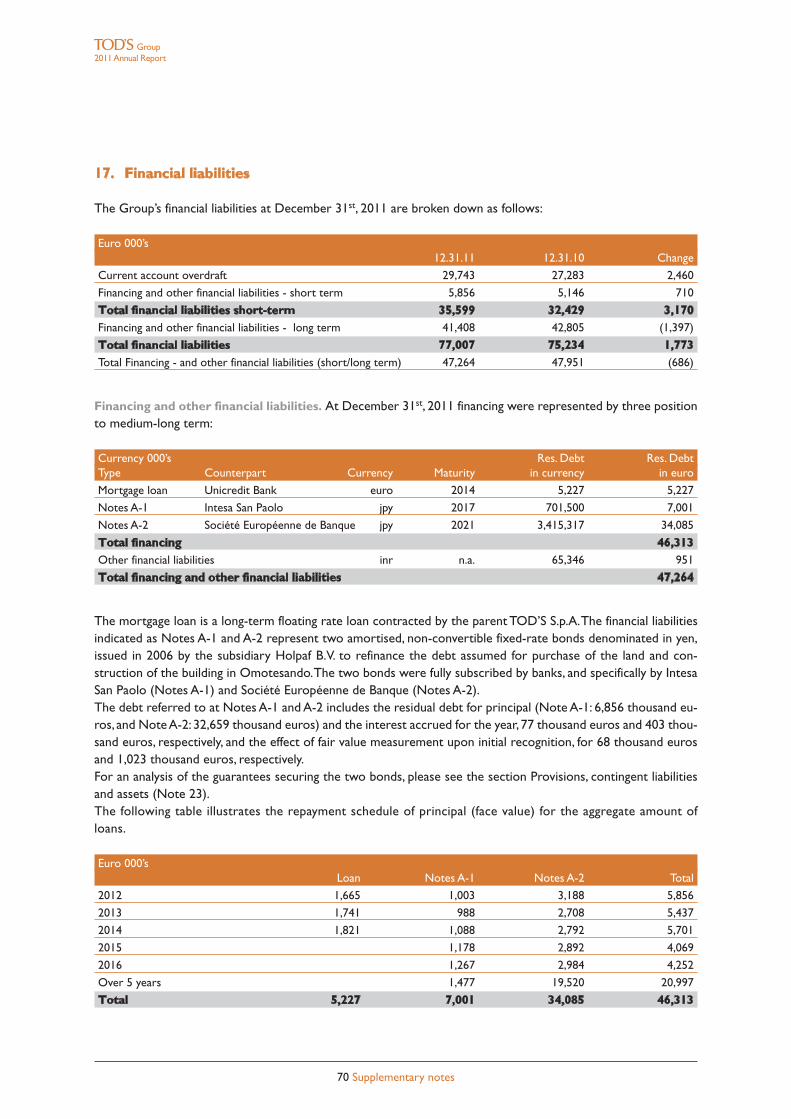
70 Supplementary notes
Group2011Annual Report
17. Financial liabilities
The Group’s financial liabilities at December 31st, 2011 are broken down as follows:
Euro 000’s12.31.11 12.31.10 Change
Current account overdraft 29,743 27,283 2,460
Financing and other financial liabilities - short term 5,856 5,146 710
Total financial liabilities short-term 35,599 32,429 3,170Financing and other financial liabilities - long term 41,408 42,805 (1,397)
Total financial liabilities 77,007 75,234 1,773Total Financing - and other financial liabilities (short/long term) 47,264 47,951 (686)
Financing and other financial liabilities. At December 31st, 2011 financing were represented by three positionto medium-long term:
Currency 000’s Res. Debt Res. DebtType Counterpart Currency Maturity in currency in euro
Mortgage loan Unicredit Bank euro 2014 5,227 5,227
Notes A-1 Intesa San Paolo jpy 2017 701,500 7,001
Notes A-2 Société Européenne de Banque jpy 2021 3,415,317 34,085
Total financing 46,313Other financial liabilities inr n.a. 65,346 951
Total financing and other financial liabilities 47,264
The mortgage loan is a long-term floating rate loan contracted by the parent TOD’S S.p.A.The financial liabilitiesindicated as Notes A-1 and A-2 represent two amortised, non-convertible fixed-rate bonds denominated in yen,issued in 2006 by the subsidiary Holpaf B.V. to refinance the debt assumed for purchase of the land and con-struction of the building in Omotesando.The two bonds were fully subscribed by banks, and specifically by IntesaSan Paolo (Notes A-1) and Société Européenne de Banque (Notes A-2).The debt referred to at Notes A-1 and A-2 includes the residual debt for principal (Note A-1: 6,856 thousand eu-ros, and NoteA-2: 32,659 thousand euros) and the interest accrued for the year, 77 thousand euros and 403 thou-sand euros, respectively, and the effect of fair value measurement upon initial recognition, for 68 thousand eurosand 1,023 thousand euros, respectively.For an analysis of the guarantees securing the two bonds, please see the section Provisions, contingent liabilitiesand assets (Note 23).The following table illustrates the repayment schedule of principal (face value) for the aggregate amount ofloans.
Euro 000’sLoan Notes A-1 Notes A-2 Total
2012 1,665 1,003 3,188 5,856
2013 1,741 988 2,708 5,437
2014 1,821 1,088 2,792 5,701
2015 1,178 2,892 4,069
2016 1,267 2,984 4,252
Over 5 years 1,477 19,520 20,997
Total 5,227 7,001 34,085 46,313
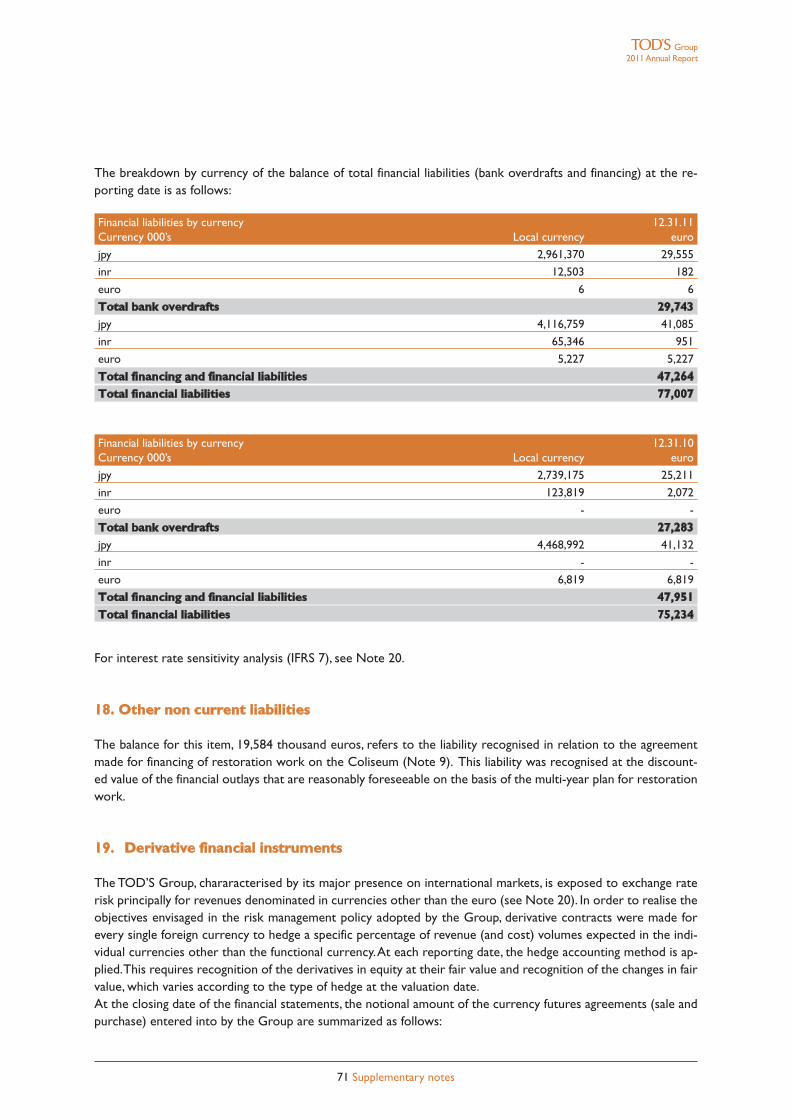
71 Supplementary notes
Group2011Annual Report
The breakdown by currency of the balance of total financial liabilities (bank overdrafts and financing) at the re-porting date is as follows:
Financial liabilities by currency 12.31.11Currency 000’s Local currency euro
jpy 2,961,370 29,555
inr 12,503 182
euro 6 6
Total bank overdrafts 29,743jpy 4,116,759 41,085
inr 65,346 951
euro 5,227 5,227
Total financing and financial liabilities 47,264Total financial liabilities 77,007
Financial liabilities by currency 12.31.10Currency 000’s Local currency euro
jpy 2,739,175 25,211
inr 123,819 2,072
euro - -
Total bank overdrafts 27,283jpy 4,468,992 41,132
inr - -
euro 6,819 6,819
Total financing and financial liabilities 47,951Total financial liabilities 75,234
For interest rate sensitivity analysis (IFRS 7), see Note 20.
18. Other non current liabilities
The balance for this item, 19,584 thousand euros, refers to the liability recognised in relation to the agreementmade for financing of restoration work on the Coliseum (Note 9). This liability was recognised at the discount-ed value of the financial outlays that are reasonably foreseeable on the basis of the multi-year plan for restorationwork.
19. Derivative financial instruments
The TOD’S Group, chararacterised by its major presence on international markets, is exposed to exchange raterisk principally for revenues denominated in currencies other than the euro (see Note 20). In order to realise theobjectives envisaged in the risk management policy adopted by the Group, derivative contracts were made forevery single foreign currency to hedge a specific percentage of revenue (and cost) volumes expected in the indi-vidual currencies other than the functional currency.At each reporting date, the hedge accounting method is ap-plied.This requires recognition of the derivatives in equity at their fair value and recognition of the changes in fairvalue, which varies according to the type of hedge at the valuation date.At the closing date of the financial statements, the notional amount of the currency futures agreements (sale andpurchase) entered into by the Group are summarized as follows:
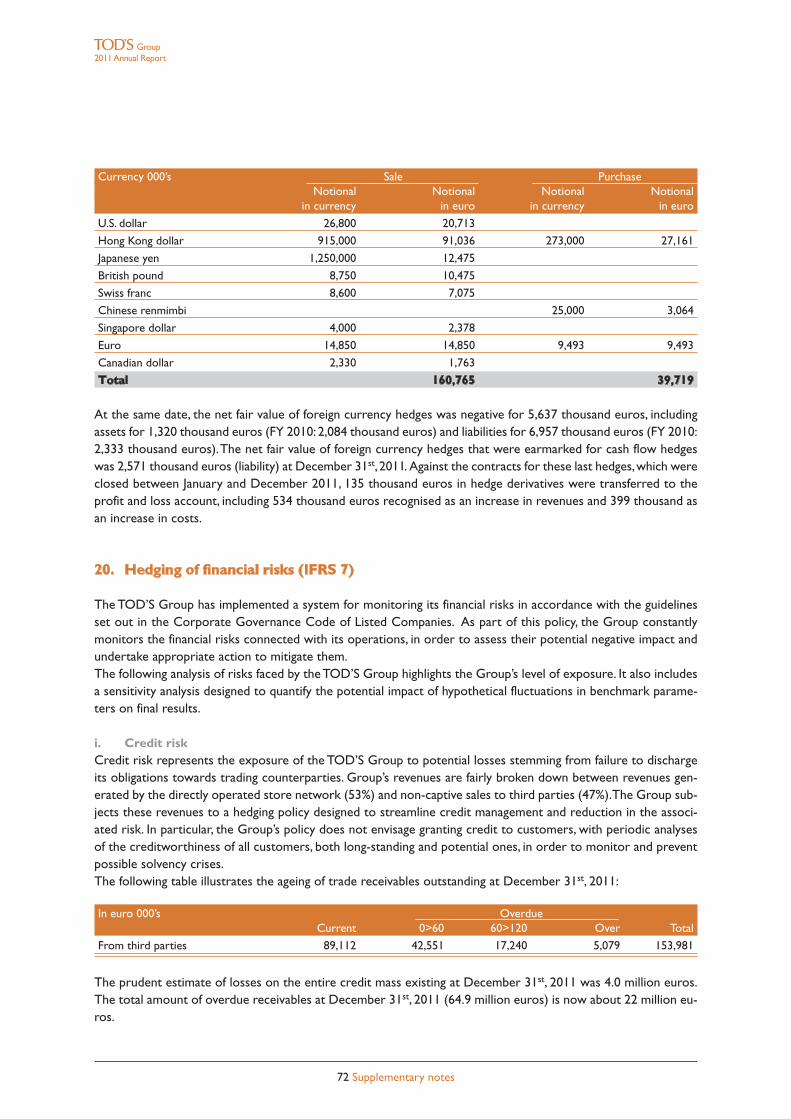
72 Supplementary notes
Group2011Annual Report
Currency 000’s Sale PurchaseNotional Notional Notional Notional
in currency in euro in currency in euro
U.S. dollar 26,800 20,713
Hong Kong dollar 915,000 91,036 273,000 27,161
Japanese yen 1,250,000 12,475
British pound 8,750 10,475
Swiss franc 8,600 7,075
Chinese renmimbi 25,000 3,064
Singapore dollar 4,000 2,378
Euro 14,850 14,850 9,493 9,493
Canadian dollar 2,330 1,763
Total 160,765 39,719
At the same date, the net fair value of foreign currency hedges was negative for 5,637 thousand euros, includingassets for 1,320 thousand euros (FY 2010:2,084 thousand euros) and liabilities for 6,957 thousand euros (FY 2010:2,333 thousand euros).The net fair value of foreign currency hedges that were earmarked for cash flow hedgeswas 2,571 thousand euros (liability) at December 31st, 2011. Against the contracts for these last hedges,which wereclosed between January and December 2011, 135 thousand euros in hedge derivatives were transferred to theprofit and loss account, including 534 thousand euros recognised as an increase in revenues and 399 thousand asan increase in costs.
20. Hedging of financial risks (IFRS 7)
The TOD’S Group has implemented a system for monitoring its financial risks in accordance with the guidelinesset out in the Corporate Governance Code of Listed Companies. As part of this policy, the Group constantlymonitors the financial risks connected with its operations, in order to assess their potential negative impact andundertake appropriate action to mitigate them.The following analysis of risks faced by theTOD’S Group highlights the Group’s level of exposure. It also includesa sensitivity analysis designed to quantify the potential impact of hypothetical fluctuations in benchmark parame-ters on final results.
i. Credit riskCredit risk represents the exposure of the TOD’S Group to potential losses stemming from failure to dischargeits obligations towards trading counterparties. Group’s revenues are fairly broken down between revenues gen-erated by the directly operated store network (53%) and non-captive sales to third parties (47%).The Group sub-jects these revenues to a hedging policy designed to streamline credit management and reduction in the associ-ated risk. In particular, the Group’s policy does not envisage granting credit to customers, with periodic analysesof the creditworthiness of all customers, both long-standing and potential ones, in order to monitor and preventpossible solvency crises.The following table illustrates the ageing of trade receivables outstanding at December 31st, 2011:
In euro 000’s OverdueCurrent 0>60 60>120 Over Total
From third parties 89,112 42,551 17,240 5,079 153,981
The prudent estimate of losses on the entire credit mass existing at December 31st, 2011 was 4.0 million euros.The total amount of overdue receivables at December 31st, 2011 (64.9 million euros) is now about 22 million eu-ros.
73 Supplementary notes
Group2011Annual Report
ii. Liquidity riskLiquidity risk is the risk that the Group will not dispose of the funds necessary to meet its short-term commit-ments and financial requirements.The principal factors that determine the Group’s degree of liquidity are the re-sources generated or used by operating and investment activities and on the other hand, the due dates or renewaldates of its payables or the liquidity of its financial investments and market conditions. In the specific case, theGroup’s profitability, and its current and historic capacity to generate cash and its relatively insignificant exposureto the banking system are factors that lead to the conclusion that it faces no liquidity risk over the foreseeable fu-ture.Also at December 31st, 2011 financial resources were far higher than the Group’s debt exposure: net finan-cial position was 110.7 million euros, comprised by 187.7 million euros in assets and 77.0 million euros in liabili-ties, including 41.4 million euros in medium-long term liabilities.The Group’s policy for financial assets is to keepall of its available liquidity invested in demand bank deposits without recourse to financial instruments, even onthe money market, and dividing the deposits amongst a reasonable number of bank counterparties, prudently se-lecting them according to the return on deposits and their solidity.
iii. Market riskIFRS 7 includes in this category all risks that are directly or indirectly connected with the fluctuation in prices onphysical and financial markets to which the company is exposed:– exchange rate risk;– interest rate risk;– commodity risk, connected with the volatility of prices for the raw materials used in the production
process.TheTOD’S Group is exposed to exchange rate and interest rate risk, since there is no physical market subject toactual fluctuations in the purchase prices for raw materials used in the production process.The following paragraphs analyse the individual risks, using sensitivity analysis as necessary to highlight the poten-tial risk on final results stemming from hypothetical fluctuations in benchmark parameters.As envisaged by IFRS7, these analyses are based on simplified scenarios applied to the final results for the periods referred to. By theirvery nature, they cannot be considered indicators of the actual effects of future changes in benchmark parame-ters of a different asset and liability structure and financial position different market conditions, nor can they re-flect the interrelations and complexity of the reference markets.
Exchange rate risk. Due to its commercial operations, the Group is exposed to fluctuations in the exchangerates for currencies in which some of its commercial transactions are denominated (particularly USD, GBP, CHFand those of certain countries in the Far East), against a cost structure that is concentrated principally in theeurozone.TheTOD’S Group realises greater revenues than costs in all these currencies; therefore, changes in theexchange rate between the euro and the aforementioned currencies can impact the Group’s results.With the exception of the foregoing, the Group is not particularly exposed to foreign exchange risk.The residualcomponent of this risk is connected principally with “translation risk”.This risk stems from the fact that the as-sets and liabilities of consolidated companies whose functional currency is different from the euro can have dif-ferent countervalues in euros according to changes in foreign exchange rates.The measured amount of this riskis recognised in the “translation reserve” in equity.The Group monitors the changes in the exposure.No hedges of this risk existed at the reporting date.Governanceof individual foreign currency operations by the Group’s subsidiaries is highly simplified by the fact that they arewholly owned by the parent company.The Group’s risk management policy aims to ensure that the average countervalue in euros of receipts on whole-sale transactions denominated in foreign currencies for each collection (Spring/Summer and Fall/Winter) is equalto or greater than what would be obtained by applying the pre-set target exchange rates.The Group pursues theseaims by entering into forward contracts for each individual currency to hedge a specific percentage of the expectedrevenue (and cost) volumes in the individual currencies other than the functional currency.These positions arenot hedged for speculative or trading purposes, consistently with the strategic policies adopted for prudent man-agement of cash flows. Consequently, the Group might forego opportunities to realise certain gains, but it avoidsrunning the risks of speculation.
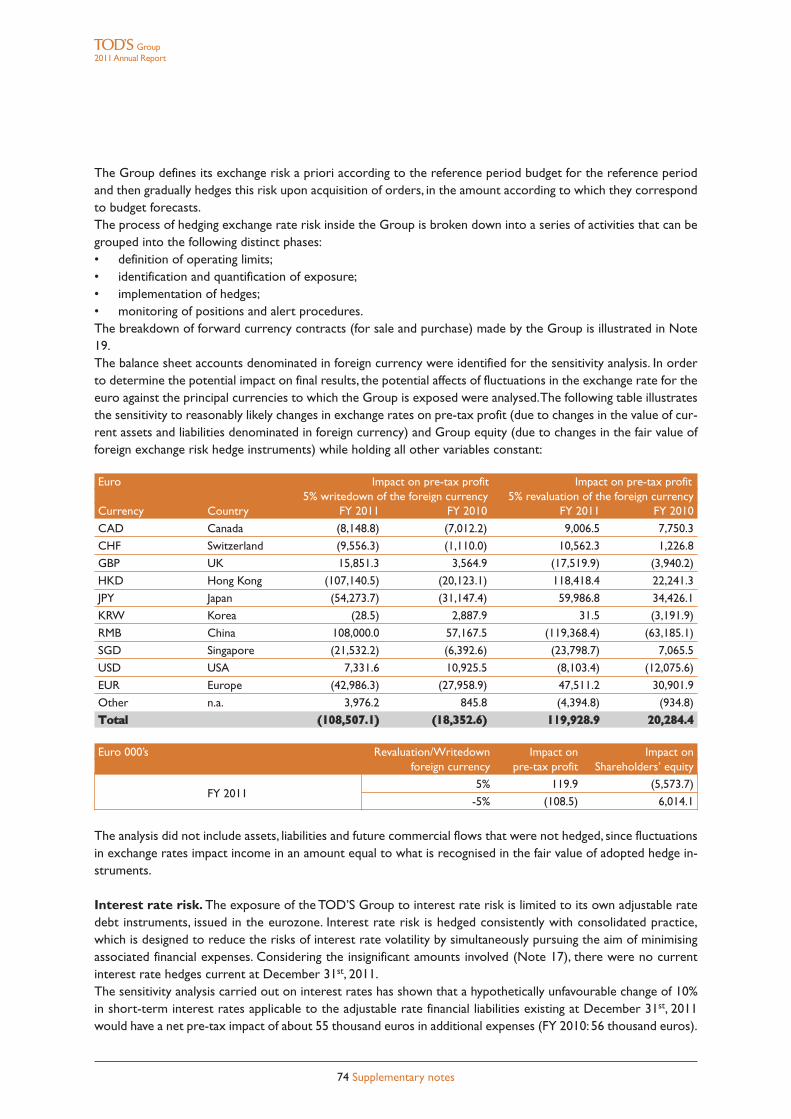
74 Supplementary notes
Group2011Annual Report
The Group defines its exchange risk a priori according to the reference period budget for the reference periodand then gradually hedges this risk upon acquisition of orders, in the amount according to which they correspondto budget forecasts.The process of hedging exchange rate risk inside the Group is broken down into a series of activities that can begrouped into the following distinct phases:• definition of operating limits;• identification and quantification of exposure;• implementation of hedges;• monitoring of positions and alert procedures.The breakdown of forward currency contracts (for sale and purchase) made by the Group is illustrated in Note19.The balance sheet accounts denominated in foreign currency were identified for the sensitivity analysis. In orderto determine the potential impact on final results, the potential affects of fluctuations in the exchange rate for theeuro against the principal currencies to which the Group is exposed were analysed.The following table illustratesthe sensitivity to reasonably likely changes in exchange rates on pre-tax profit (due to changes in the value of cur-rent assets and liabilities denominated in foreign currency) and Group equity (due to changes in the fair value offoreign exchange risk hedge instruments) while holding all other variables constant:
Euro Impact on pre-tax profit Impact on pre-tax profit5% writedown of the foreign currency 5% revaluation of the foreign currency
Currency Country FY 2011 FY 2010 FY 2011 FY 2010
CAD Canada (8,148.8) (7,012.2) 9,006.5 7,750.3
CHF Switzerland (9,556.3) (1,110.0) 10,562.3 1,226.8
GBP UK 15,851.3 3,564.9 (17,519.9) (3,940.2)
HKD Hong Kong (107,140.5) (20,123.1) 118,418.4 22,241.3
JPY Japan (54,273.7) (31,147.4) 59,986.8 34,426.1
KRW Korea (28.5) 2,887.9 31.5 (3,191.9)
RMB China 108,000.0 57,167.5 (119,368.4) (63,185.1)
SGD Singapore (21,532.2) (6,392.6) (23,798.7) 7,065.5
USD USA 7,331.6 10,925.5 (8,103.4) (12,075.6)
EUR Europe (42,986.3) (27,958.9) 47,511.2 30,901.9
Other n.a. 3,976.2 845.8 (4,394.8) (934.8)
Total (108,507.1) (18,352.6) 119,928.9 20,284.4
Euro 000’s Revaluation/Writedown Impact on Impact onforeign currency pre-tax profit Shareholders’ equity
5% 119.9 (5,573.7)FY 2011
-5% (108.5) 6,014.1
The analysis did not include assets, liabilities and future commercial flows that were not hedged, since fluctuationsin exchange rates impact income in an amount equal to what is recognised in the fair value of adopted hedge in-struments.
Interest rate risk. The exposure of the TOD’S Group to interest rate risk is limited to its own adjustable ratedebt instruments, issued in the eurozone. Interest rate risk is hedged consistently with consolidated practice,which is designed to reduce the risks of interest rate volatility by simultaneously pursuing the aim of minimisingassociated financial expenses. Considering the insignificant amounts involved (Note 17), there were no currentinterest rate hedges current at December 31st, 2011.The sensitivity analysis carried out on interest rates has shown that a hypothetically unfavourable change of 10%in short-term interest rates applicable to the adjustable rate financial liabilities existing at December 31st, 2011would have a net pre-tax impact of about 55 thousand euros in additional expenses (FY 2010: 56 thousand euros).
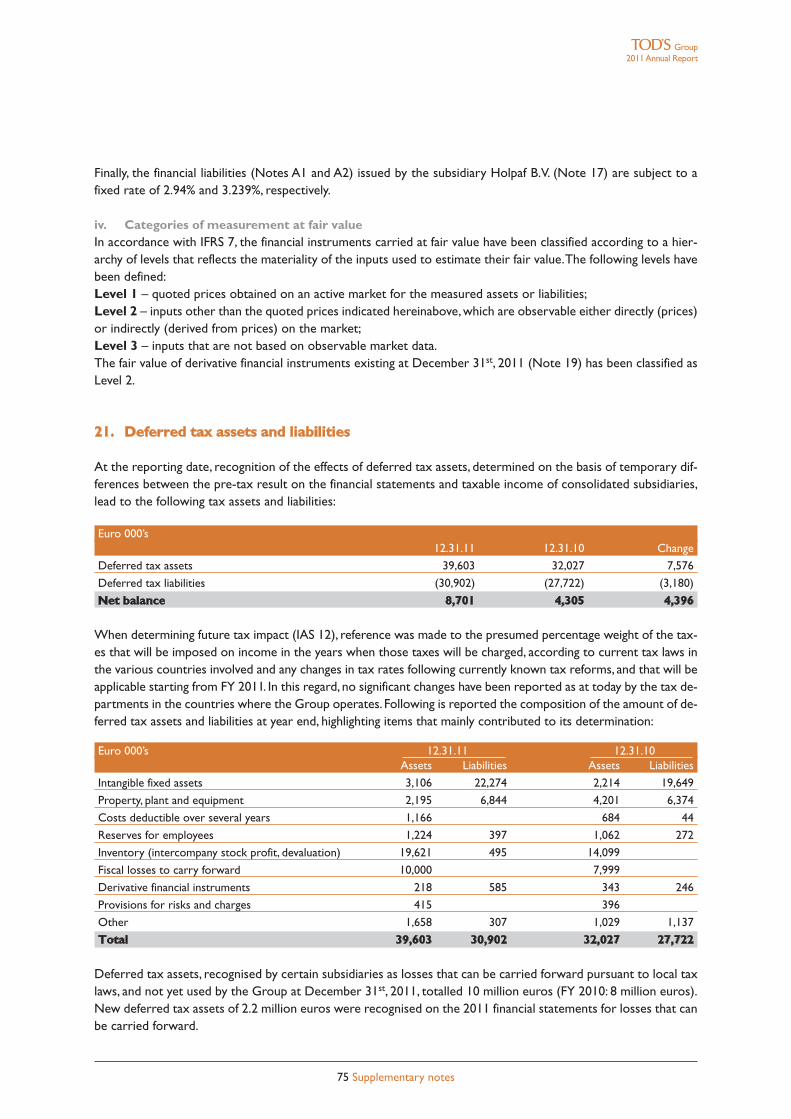
75 Supplementary notes
Group2011Annual Report
Finally, the financial liabilities (Notes A1 and A2) issued by the subsidiary Holpaf B.V. (Note 17) are subject to afixed rate of 2.94% and 3.239%, respectively.
iv. Categories of measurement at fair valueIn accordance with IFRS 7, the financial instruments carried at fair value have been classified according to a hier-archy of levels that reflects the materiality of the inputs used to estimate their fair value.The following levels havebeen defined:Level 1 – quoted prices obtained on an active market for the measured assets or liabilities;Level 2 – inputs other than the quoted prices indicated hereinabove,which are observable either directly (prices)or indirectly (derived from prices) on the market;Level 3 – inputs that are not based on observable market data.The fair value of derivative financial instruments existing at December 31st, 2011 (Note 19) has been classified asLevel 2.
21. Deferred tax assets and liabilities
At the reporting date, recognition of the effects of deferred tax assets, determined on the basis of temporary dif-ferences between the pre-tax result on the financial statements and taxable income of consolidated subsidiaries,lead to the following tax assets and liabilities:
Euro 000’s12.31.11 12.31.10 Change
Deferred tax assets 39,603 32,027 7,576
Deferred tax liabilities (30,902) (27,722) (3,180)
Net balance 8,701 4,305 4,396
When determining future tax impact (IAS 12), reference was made to the presumed percentage weight of the tax-es that will be imposed on income in the years when those taxes will be charged, according to current tax laws inthe various countries involved and any changes in tax rates following currently known tax reforms, and that will beapplicable starting from FY 2011. In this regard, no significant changes have been reported as at today by the tax de-partments in the countries where the Group operates. Following is reported the composition of the amount of de-ferred tax assets and liabilities at year end, highlighting items that mainly contributed to its determination:
Euro 000’s 12.31.11 12.31.10Assets Liabilities Assets Liabilities
Intangible fixed assets 3,106 22,274 2,214 19,649
Property, plant and equipment 2,195 6,844 4,201 6,374
Costs deductible over several years 1,166 684 44
Reserves for employees 1,224 397 1,062 272
Inventory (intercompany stock profit, devaluation) 19,621 495 14,099
Fiscal losses to carry forward 10,000 7,999
Derivative financial instruments 218 585 343 246
Provisions for risks and charges 415 396
Other 1,658 307 1,029 1,137
Total 39,603 30,902 32,027 27,722
Deferred tax assets, recognised by certain subsidiaries as losses that can be carried forward pursuant to local taxlaws, and not yet used by the Group at December 31st, 2011, totalled 10 million euros (FY 2010: 8 million euros).New deferred tax assets of 2.2 million euros were recognised on the 2011 financial statements for losses that canbe carried forward.
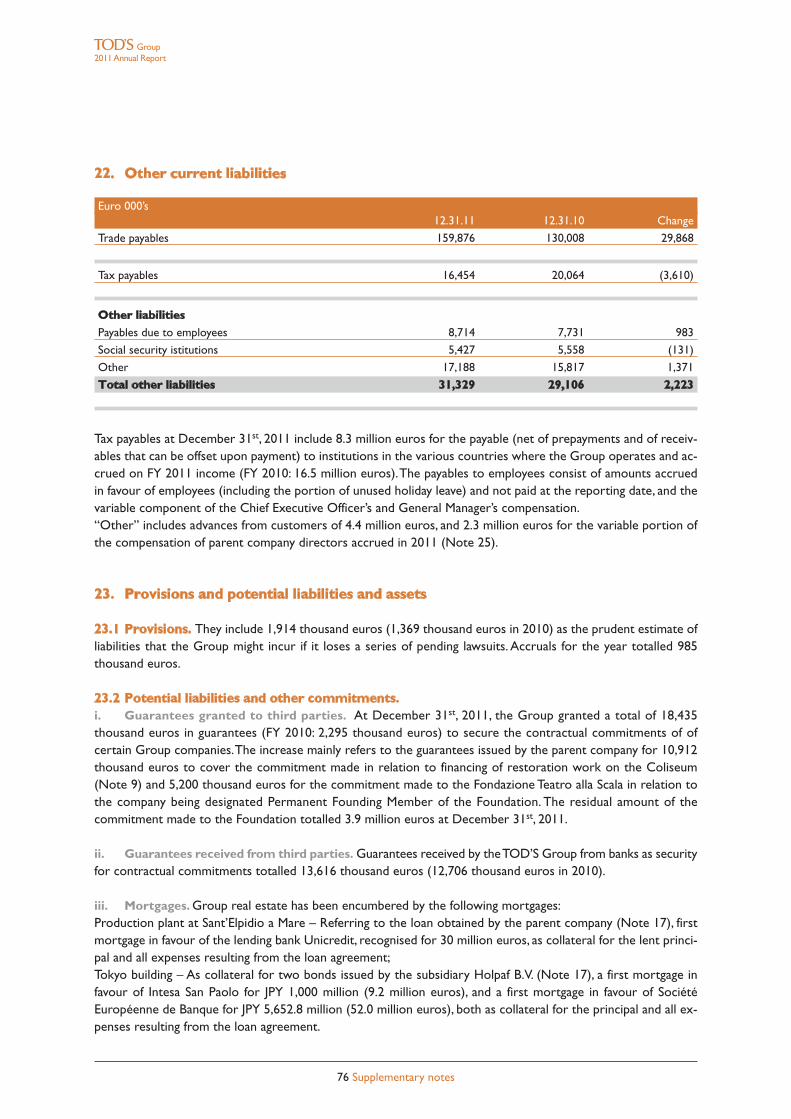
76 Supplementary notes
Group2011Annual Report
22. Other current liabilities
Euro 000’s12.31.11 12.31.10 Change
Trade payables 159,876 130,008 29,868
Tax payables 16,454 20,064 (3,610)
Other liabilitiesPayables due to employees 8,714 7,731 983
Social security istitutions 5,427 5,558 (131)
Other 17,188 15,817 1,371
Total other liabilities 31,329 29,106 2,223
Tax payables at December 31st, 2011 include 8.3 million euros for the payable (net of prepayments and of receiv-ables that can be offset upon payment) to institutions in the various countries where the Group operates and ac-crued on FY 2011 income (FY 2010: 16.5 million euros).The payables to employees consist of amounts accruedin favour of employees (including the portion of unused holiday leave) and not paid at the reporting date, and thevariable component of the Chief Executive Officer’s and General Manager’s compensation.“Other” includes advances from customers of 4.4 million euros, and 2.3 million euros for the variable portion ofthe compensation of parent company directors accrued in 2011 (Note 25).
23. Provisions and potential liabilities and assets
23.1 Provisions. They include 1,914 thousand euros (1,369 thousand euros in 2010) as the prudent estimate ofliabilities that the Group might incur if it loses a series of pending lawsuits. Accruals for the year totalled 985thousand euros.
23.2 Potential liabilities and other commitments.i. Guarantees granted to third parties. At December 31st, 2011, the Group granted a total of 18,435thousand euros in guarantees (FY 2010: 2,295 thousand euros) to secure the contractual commitments of ofcertain Group companies.The increase mainly refers to the guarantees issued by the parent company for 10,912thousand euros to cover the commitment made in relation to financing of restoration work on the Coliseum(Note 9) and 5,200 thousand euros for the commitment made to the Fondazione Teatro alla Scala in relation tothe company being designated Permanent Founding Member of the Foundation. The residual amount of thecommitment made to the Foundation totalled 3.9 million euros at December 31st, 2011.
ii. Guarantees received from third parties. Guarantees received by theTOD’S Group from banks as securityfor contractual commitments totalled 13,616 thousand euros (12,706 thousand euros in 2010).
iii. Mortgages. Group real estate has been encumbered by the following mortgages:Production plant at Sant’Elpidio a Mare – Referring to the loan obtained by the parent company (Note 17), firstmortgage in favour of the lending bank Unicredit, recognised for 30 million euros, as collateral for the lent princi-pal and all expenses resulting from the loan agreement;Tokyo building – As collateral for two bonds issued by the subsidiary Holpaf B.V. (Note 17), a first mortgage infavour of Intesa San Paolo for JPY 1,000 million (9.2 million euros), and a first mortgage in favour of SociétéEuropéenne de Banque for JPY 5,652.8 million (52.0 million euros), both as collateral for the principal and all ex-penses resulting from the loan agreement.
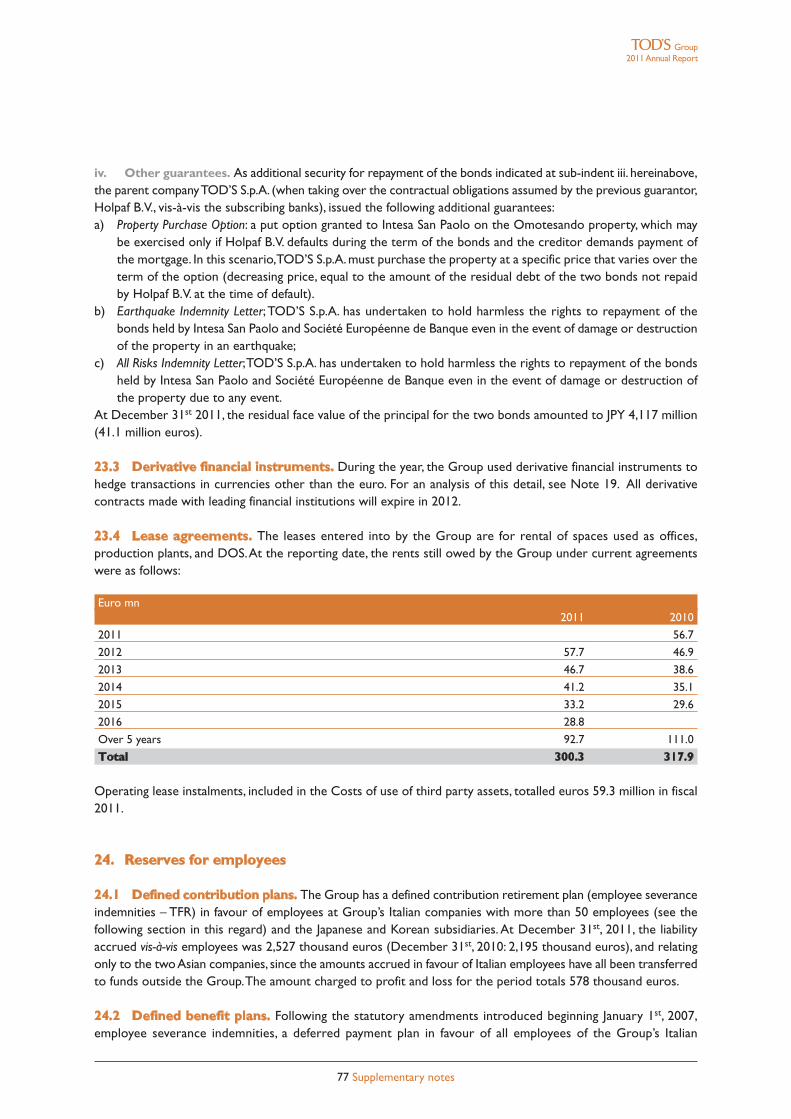
77 Supplementary notes
Group2011Annual Report
iv. Other guarantees. As additional security for repayment of the bonds indicated at sub-indent iii. hereinabove,the parent companyTOD’S S.p.A. (when taking over the contractual obligations assumed by the previous guarantor,Holpaf B.V., vis-à-vis the subscribing banks), issued the following additional guarantees:a) Property Purchase Option: a put option granted to Intesa San Paolo on the Omotesando property, which may
be exercised only if Holpaf B.V. defaults during the term of the bonds and the creditor demands payment ofthe mortgage. In this scenario,TOD’S S.p.A.must purchase the property at a specific price that varies over theterm of the option (decreasing price, equal to the amount of the residual debt of the two bonds not repaidby Holpaf B.V. at the time of default).
b) Earthquake Indemnity Letter; TOD’S S.p.A. has undertaken to hold harmless the rights to repayment of thebonds held by Intesa San Paolo and Société Européenne de Banque even in the event of damage or destructionof the property in an earthquake;
c) All Risks Indemnity Letter;TOD’S S.p.A. has undertaken to hold harmless the rights to repayment of the bondsheld by Intesa San Paolo and Société Européenne de Banque even in the event of damage or destruction ofthe property due to any event.
At December 31st 2011, the residual face value of the principal for the two bonds amounted to JPY 4,117 million(41.1 million euros).
23.3 Derivative financial instruments. During the year, the Group used derivative financial instruments tohedge transactions in currencies other than the euro. For an analysis of this detail, see Note 19. All derivativecontracts made with leading financial institutions will expire in 2012.
23.4 Lease agreements. The leases entered into by the Group are for rental of spaces used as offices,production plants, and DOS.At the reporting date, the rents still owed by the Group under current agreementswere as follows:
Euro mn2011 2010
2011 56.7
2012 57.7 46.9
2013 46.7 38.6
2014 41.2 35.1
2015 33.2 29.6
2016 28.8
Over 5 years 92.7 111.0
Total 300.3 317.9
Operating lease instalments, included in the Costs of use of third party assets, totalled euros 59.3 million in fiscal2011.
24. Reserves for employees
24.1 Defined contribution plans. The Group has a defined contribution retirement plan (employee severanceindemnities – TFR) in favour of employees at Group’s Italian companies with more than 50 employees (see thefollowing section in this regard) and the Japanese and Korean subsidiaries.At December 31st, 2011, the liabilityaccrued vis-à-vis employees was 2,527 thousand euros (December 31st, 2010: 2,195 thousand euros), and relatingonly to the twoAsian companies, since the amounts accrued in favour of Italian employees have all been transferredto funds outside the Group.The amount charged to profit and loss for the period totals 578 thousand euros.
24.2 Defined benefit plans. Following the statutory amendments introduced beginning January 1st, 2007,employee severance indemnities, a deferred payment plan in favour of all employees of the Group’s Italian
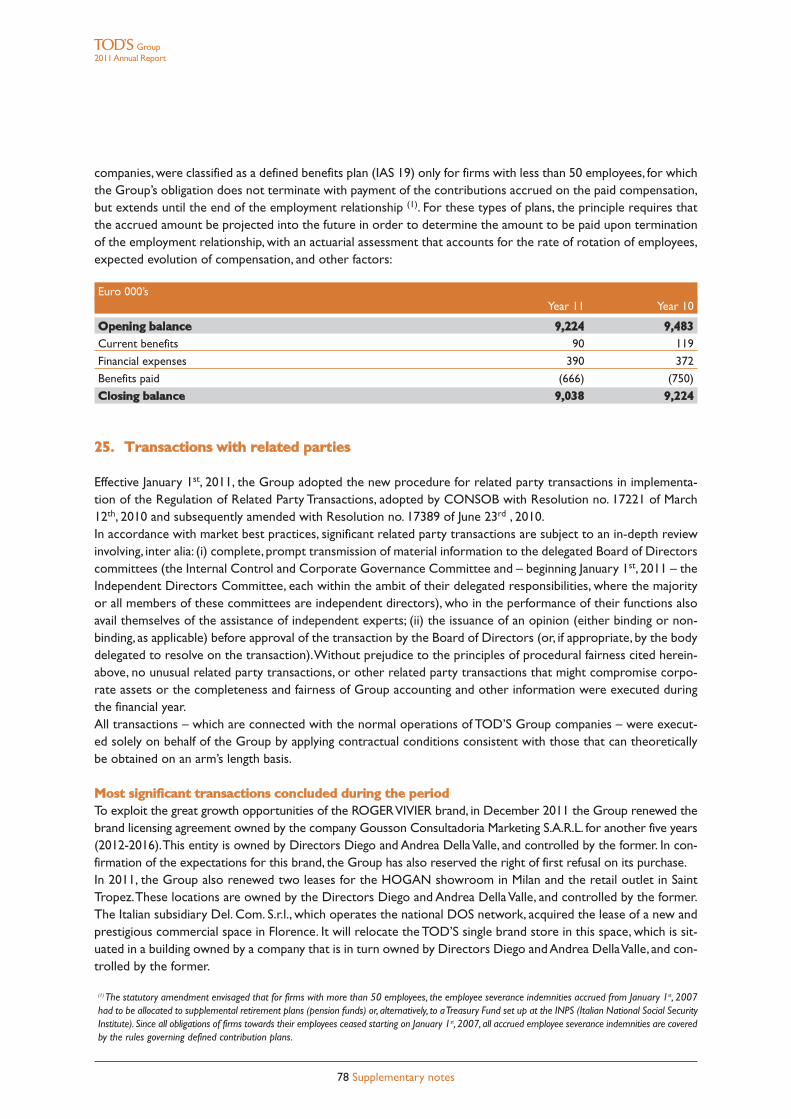
78 Supplementary notes
Group2011Annual Report
companies,were classified as a defined benefits plan (IAS 19) only for firms with less than 50 employees, for whichthe Group’s obligation does not terminate with payment of the contributions accrued on the paid compensation,but extends until the end of the employment relationship (1). For these types of plans, the principle requires thatthe accrued amount be projected into the future in order to determine the amount to be paid upon terminationof the employment relationship, with an actuarial assessment that accounts for the rate of rotation of employees,expected evolution of compensation, and other factors:
Euro 000’sYear 11 Year 10
Opening balance 9,224 9,483Current benefits 90 119
Financial expenses 390 372
Benefits paid (666) (750)
Closing balance 9,038 9,224
25. Transactions with related parties
Effective January 1st, 2011, the Group adopted the new procedure for related party transactions in implementa-tion of the Regulation of Related Party Transactions, adopted by CONSOB with Resolution no. 17221 of March12th, 2010 and subsequently amended with Resolution no. 17389 of June 23rd , 2010.In accordance with market best practices, significant related party transactions are subject to an in-depth reviewinvolving, inter alia: (i) complete, prompt transmission of material information to the delegated Board of Directorscommittees (the Internal Control and Corporate Governance Committee and – beginning January 1st, 2011 – theIndependent Directors Committee, each within the ambit of their delegated responsibilities, where the majorityor all members of these committees are independent directors), who in the performance of their functions alsoavail themselves of the assistance of independent experts; (ii) the issuance of an opinion (either binding or non-binding, as applicable) before approval of the transaction by the Board of Directors (or, if appropriate, by the bodydelegated to resolve on the transaction).Without prejudice to the principles of procedural fairness cited herein-above, no unusual related party transactions, or other related party transactions that might compromise corpo-rate assets or the completeness and fairness of Group accounting and other information were executed duringthe financial year.All transactions – which are connected with the normal operations of TOD’S Group companies – were execut-ed solely on behalf of the Group by applying contractual conditions consistent with those that can theoreticallybe obtained on an arm’s length basis.
Most significant transactions concluded during the periodTo exploit the great growth opportunities of the ROGERVIVIER brand, in December 2011 the Group renewed thebrand licensing agreement owned by the company Gousson Consultadoria Marketing S.A.R.L. for another five years(2012-2016).This entity is owned by Directors Diego and Andrea DellaValle, and controlled by the former. In con-firmation of the expectations for this brand, the Group has also reserved the right of first refusal on its purchase.In 2011, the Group also renewed two leases for the HOGAN showroom in Milan and the retail outlet in SaintTropez.These locations are owned by the Directors Diego and Andrea DellaValle, and controlled by the former.The Italian subsidiary Del. Com. S.r.l., which operates the national DOS network, acquired the lease of a new andprestigious commercial space in Florence. It will relocate the TOD’S single brand store in this space, which is sit-uated in a building owned by a company that is in turn owned by Directors Diego andAndrea DellaValle, and con-trolled by the former.
(1) The statutory amendment envisaged that for firms with more than 50 employees, the employee severance indemnities accrued from January 1st, 2007had to be allocated to supplemental retirement plans (pension funds) or, alternatively, to aTreasury Fund set up at the INPS (Italian National Social SecurityInstitute). Since all obligations of firms towards their employees ceased starting on January 1st, 2007, all accrued employee severance indemnities are coveredby the rules governing defined contribution plans.
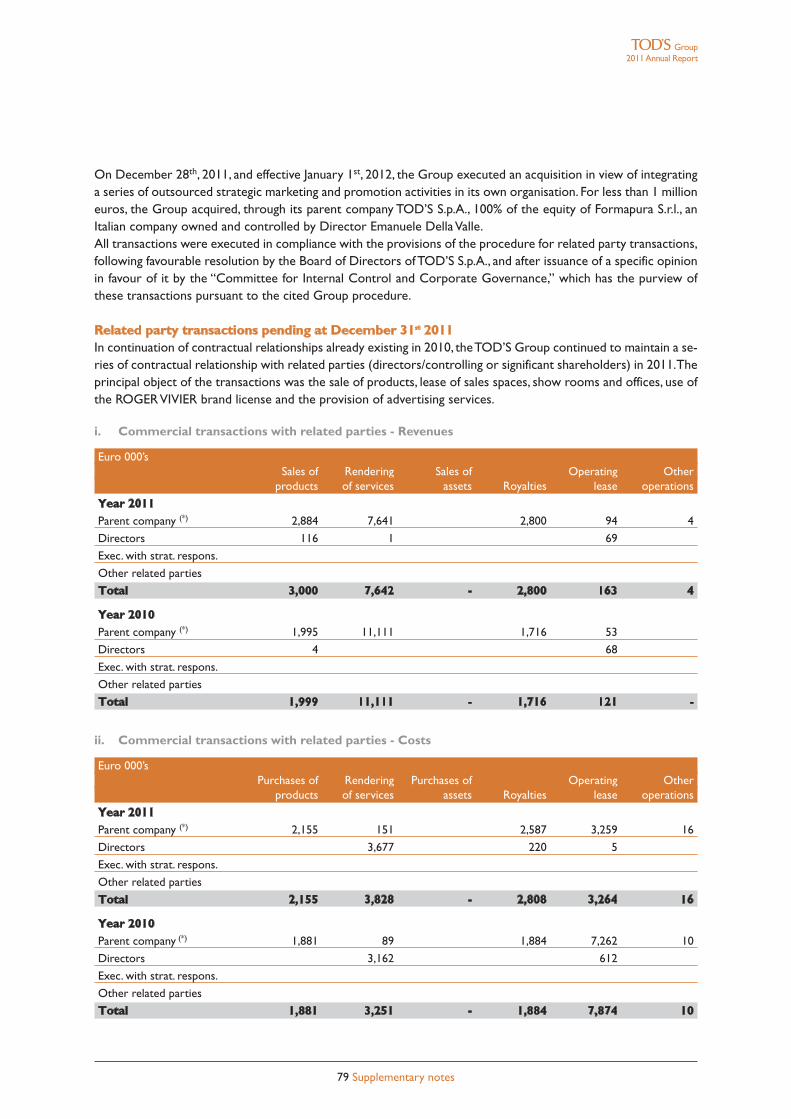
79 Supplementary notes
Group2011Annual Report
On December 28th, 2011, and effective January 1st, 2012, the Group executed an acquisition in view of integratinga series of outsourced strategic marketing and promotion activities in its own organisation. For less than 1 millioneuros, the Group acquired, through its parent company TOD’S S.p.A., 100% of the equity of Formapura S.r.l., anItalian company owned and controlled by Director Emanuele DellaValle.All transactions were executed in compliance with the provisions of the procedure for related party transactions,following favourable resolution by the Board of Directors ofTOD’S S.p.A., and after issuance of a specific opinionin favour of it by the “Committee for Internal Control and Corporate Governance,” which has the purview ofthese transactions pursuant to the cited Group procedure.
Related party transactions pending at December 31st 2011In continuation of contractual relationships already existing in 2010, theTOD’S Group continued to maintain a se-ries of contractual relationship with related parties (directors/controlling or significant shareholders) in 2011.Theprincipal object of the transactions was the sale of products, lease of sales spaces, show rooms and offices, use ofthe ROGERVIVIER brand license and the provision of advertising services.
i. Commercial transactions with related parties - Revenues
Euro 000’sSales of Rendering Sales of Operating Other
products of services assets Royalties lease operations
Year 2011Parent company (*) 2,884 7,641 2,800 94 4
Directors 116 1 69
Exec. with strat. respons.
Other related parties
Total 3,000 7,642 - 2,800 163 4
Year 2010Parent company (*) 1,995 11,111 1,716 53
Directors 4 68
Exec. with strat. respons.
Other related parties
Total 1,999 11,111 - 1,716 121 -
ii. Commercial transactions with related parties - Costs
Euro 000’sPurchases of Rendering Purchases of Operating Other
products of services assets Royalties lease operations
Year 2011Parent company (*) 2,155 151 2,587 3,259 16
Directors 3,677 220 5
Exec. with strat. respons.
Other related parties
Total 2,155 3,828 - 2,808 3,264 16
Year 2010Parent company (*) 1,881 89 1,884 7,262 10
Directors 3,162 612
Exec. with strat. respons.
Other related parties
Total 1,881 3,251 - 1,884 7,874 10
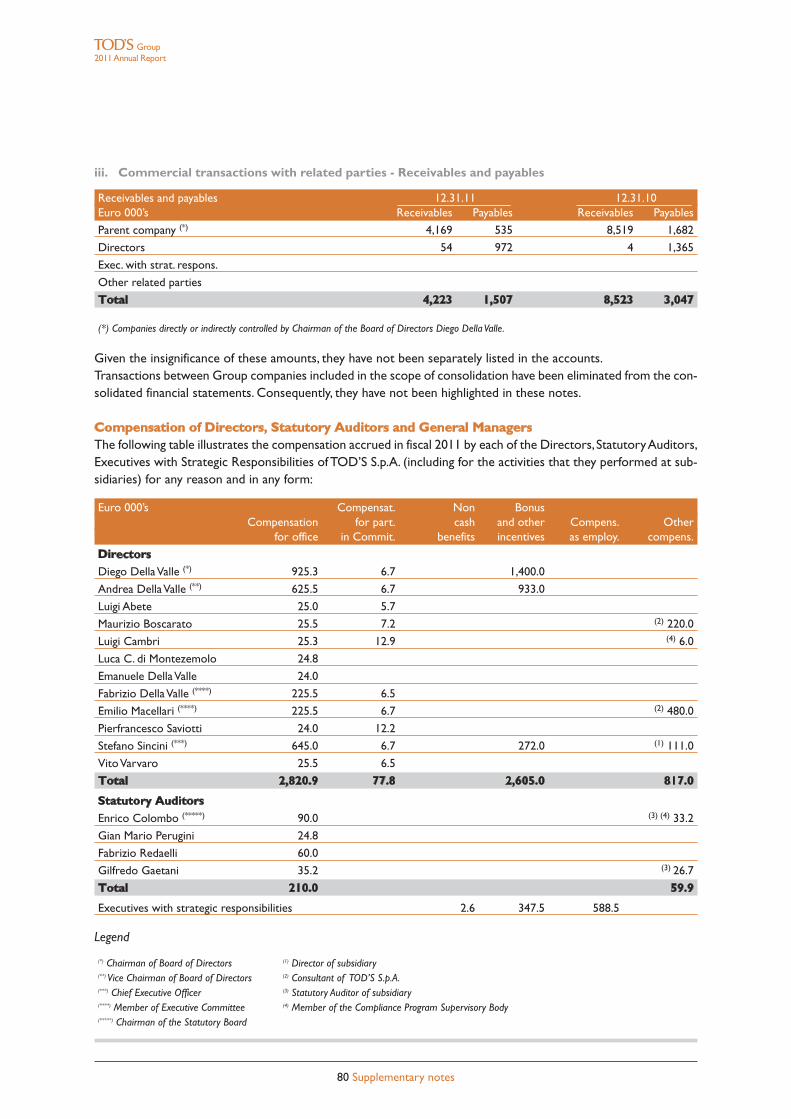
80 Supplementary notes
Group2011Annual Report
iii. Commercial transactions with related parties - Receivables and payables
Receivables and payables 12.31.11 12.31.10Euro 000’s Receivables Payables Receivables Payables
Parent company (*) 4,169 535 8,519 1,682
Directors 54 972 4 1,365
Exec. with strat. respons.
Other related parties
Total 4,223 1,507 8,523 3,047
(*) Companies directly or indirectly controlled by Chairman of the Board of Directors Diego DellaValle.
Given the insignificance of these amounts, they have not been separately listed in the accounts.Transactions between Group companies included in the scope of consolidation have been eliminated from the con-solidated financial statements. Consequently, they have not been highlighted in these notes.
Compensation of Directors, Statutory Auditors and General ManagersThe following table illustrates the compensation accrued in fiscal 2011 by each of the Directors, StatutoryAuditors,Executives with Strategic Responsibilities of TOD’S S.p.A. (including for the activities that they performed at sub-sidiaries) for any reason and in any form:
Euro 000’s Compensat. Non BonusCompensation for part. cash and other Compens. Other
for office in Commit. benefits incentives as employ. compens.
DirectorsDiego DellaValle (*) 925.3 6.7 1,400.0
Andrea DellaValle (**) 625.5 6.7 933.0
Luigi Abete 25.0 5.7
Maurizio Boscarato 25.5 7.2 (2) 220.0
Luigi Cambri 25.3 12.9 (4) 6.0
Luca C. di Montezemolo 24.8
Emanuele DellaValle 24.0
Fabrizio DellaValle (****) 225.5 6.5
Emilio Macellari (****) 225.5 6.7 (2) 480.0
Pierfrancesco Saviotti 24.0 12.2
Stefano Sincini (***) 645.0 6.7 272.0 (1) 111.0
VitoVarvaro 25.5 6.5
Total 2,820.9 77.8 2,605.0 817.0
Statutory AuditorsEnrico Colombo (*****) 90.0 (3) (4) 33.2
Gian Mario Perugini 24.8
Fabrizio Redaelli 60.0
Gilfredo Gaetani 35.2 (3) 26.7
Total 210.0 59.9
Executives with strategic responsibilities 2.6 347.5 588.5
Legend
(*) Chairman of Board of Directors (1) Director of subsidiary(**) Vice Chairman of Board of Directors (2) Consultant of TOD’S S.p.A.(***) Chief Executive Officer (3) Statutory Auditor of subsidiary(****) Member of Executive Committee (4) Member of the Compliance Program Supervisory Body(*****) Chairman of the Statutory Board
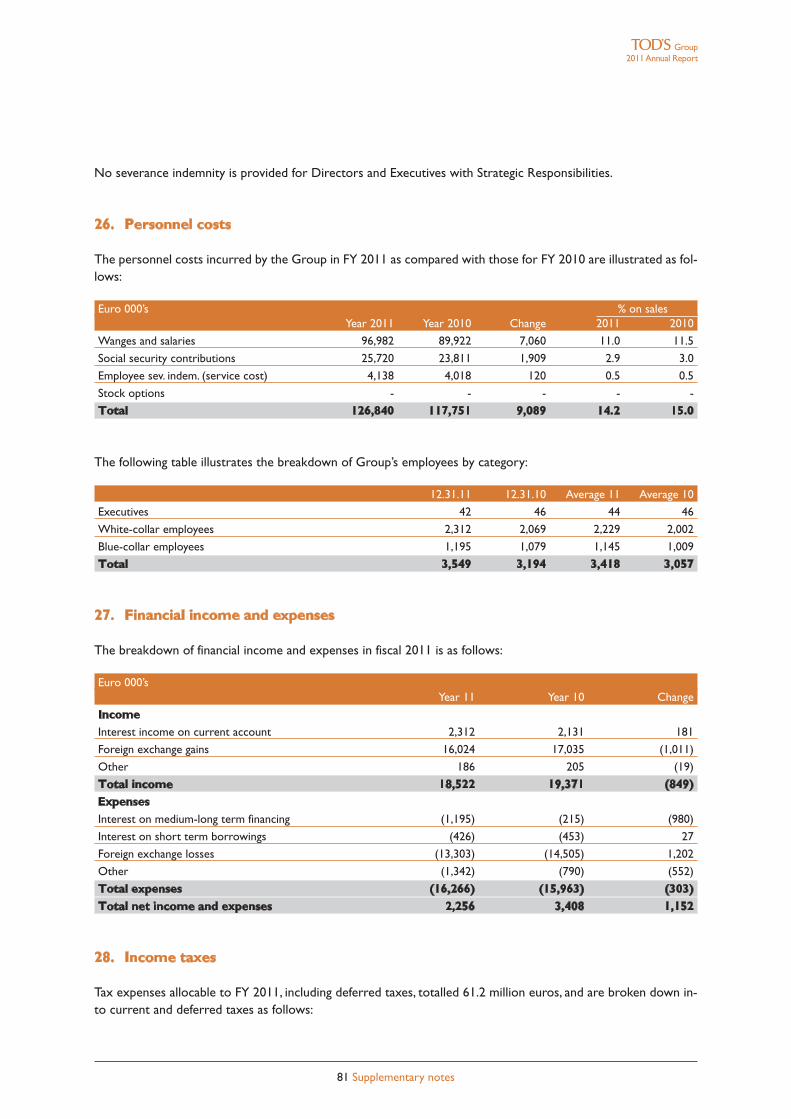
81 Supplementary notes
Group2011Annual Report
No severance indemnity is provided for Directors and Executives with Strategic Responsibilities.
26. Personnel costs
The personnel costs incurred by the Group in FY 2011 as compared with those for FY 2010 are illustrated as fol-lows:
Euro 000’s % on salesYear 2011 Year 2010 Change 2011 2010
Wanges and salaries 96,982 89,922 7,060 11.0 11.5
Social security contributions 25,720 23,811 1,909 2.9 3.0
Employee sev. indem. (service cost) 4,138 4,018 120 0.5 0.5
Stock options - - - - -
Total 126,840 117,751 9,089 14.2 15.0
The following table illustrates the breakdown of Group’s employees by category:
12.31.11 12.31.10 Average 11 Average 10
Executives 42 46 44 46
White-collar employees 2,312 2,069 2,229 2,002
Blue-collar employees 1,195 1,079 1,145 1,009
Total 3,549 3,194 3,418 3,057
27. Financial income and expenses
The breakdown of financial income and expenses in fiscal 2011 is as follows:
Euro 000’sYear 11 Year 10 Change
IncomeInterest income on current account 2,312 2,131 181
Foreign exchange gains 16,024 17,035 (1,011)
Other 186 205 (19)
Total income 18,522 19,371 (849)ExpensesInterest on medium-long term financing (1,195) (215) (980)
Interest on short term borrowings (426) (453) 27
Foreign exchange losses (13,303) (14,505) 1,202
Other (1,342) (790) (552)
Total expenses (16,266) (15,963) (303)Total net income and expenses 2,256 3,408 1,152
28. Income taxes
Tax expenses allocable to FY 2011, including deferred taxes, totalled 61.2 million euros, and are broken down in-to current and deferred taxes as follows:
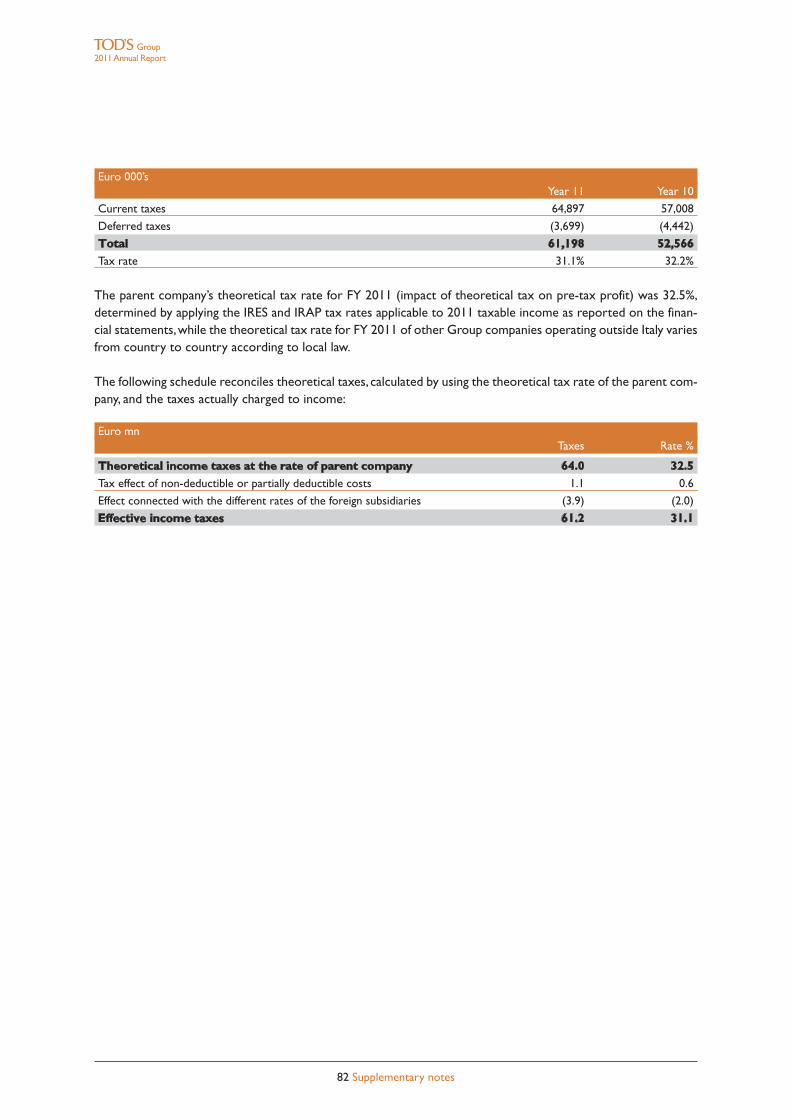
Euro 000’sYear 11 Year 10
Current taxes 64,897 57,008
Deferred taxes (3,699) (4,442)
Total 61,198 52,566Tax rate 31.1% 32.2%
The parent company’s theoretical tax rate for FY 2011 (impact of theoretical tax on pre-tax profit) was 32.5%,determined by applying the IRES and IRAP tax rates applicable to 2011 taxable income as reported on the finan-cial statements,while the theoretical tax rate for FY 2011 of other Group companies operating outside Italy variesfrom country to country according to local law.
The following schedule reconciles theoretical taxes, calculated by using the theoretical tax rate of the parent com-pany, and the taxes actually charged to income:
Euro mnTaxes Rate %
Theoretical income taxes at the rate of parent company 64.0 32.5Tax effect of non-deductible or partially deductible costs 1.1 0.6
Effect connected with the different rates of the foreign subsidiaries (3.9) (2.0)
Effective income taxes 61.2 31.1
82 Supplementary notes
Group2011Annual Report
[THIS PAGE HAS BEEN INTENTIONALLY LEFT BLANK]
83 2011 Annual Report

[THIS PAGE HAS BEEN INTENTIONALLY LEFT BLANK]
84 2011 Annual Report

REPORT OF INDEPENDENT AUDITORS
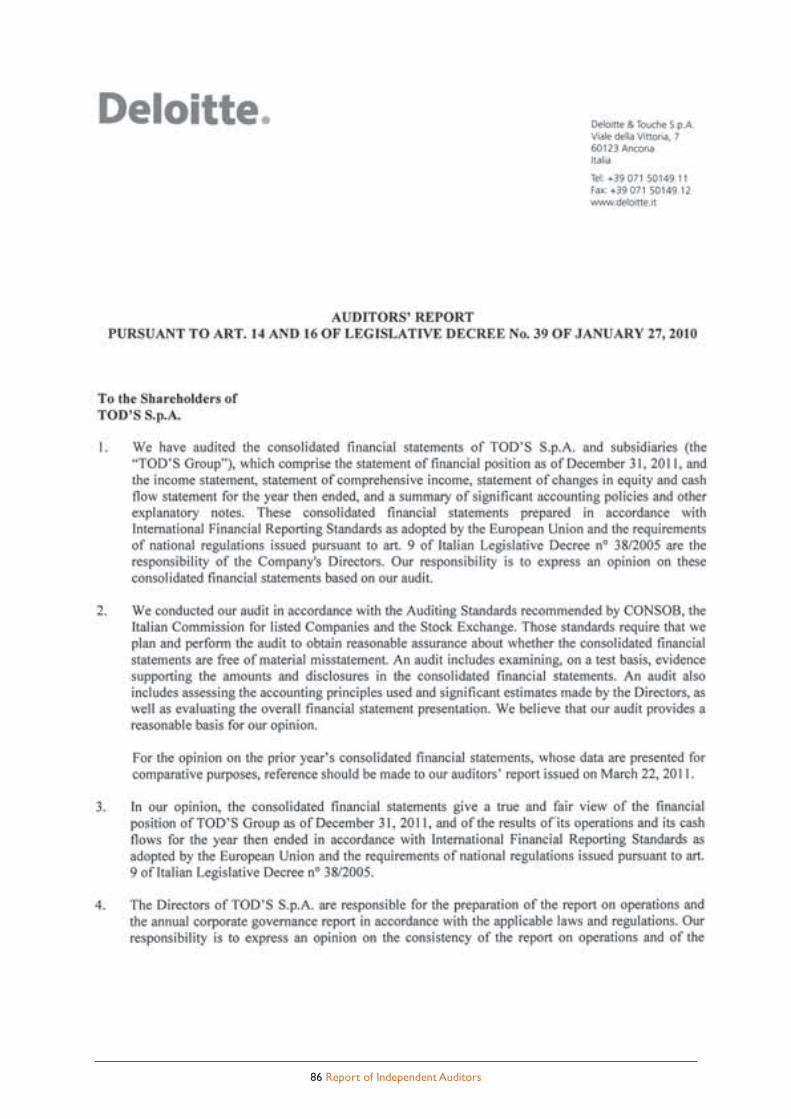
86 Report of Independent Auditors
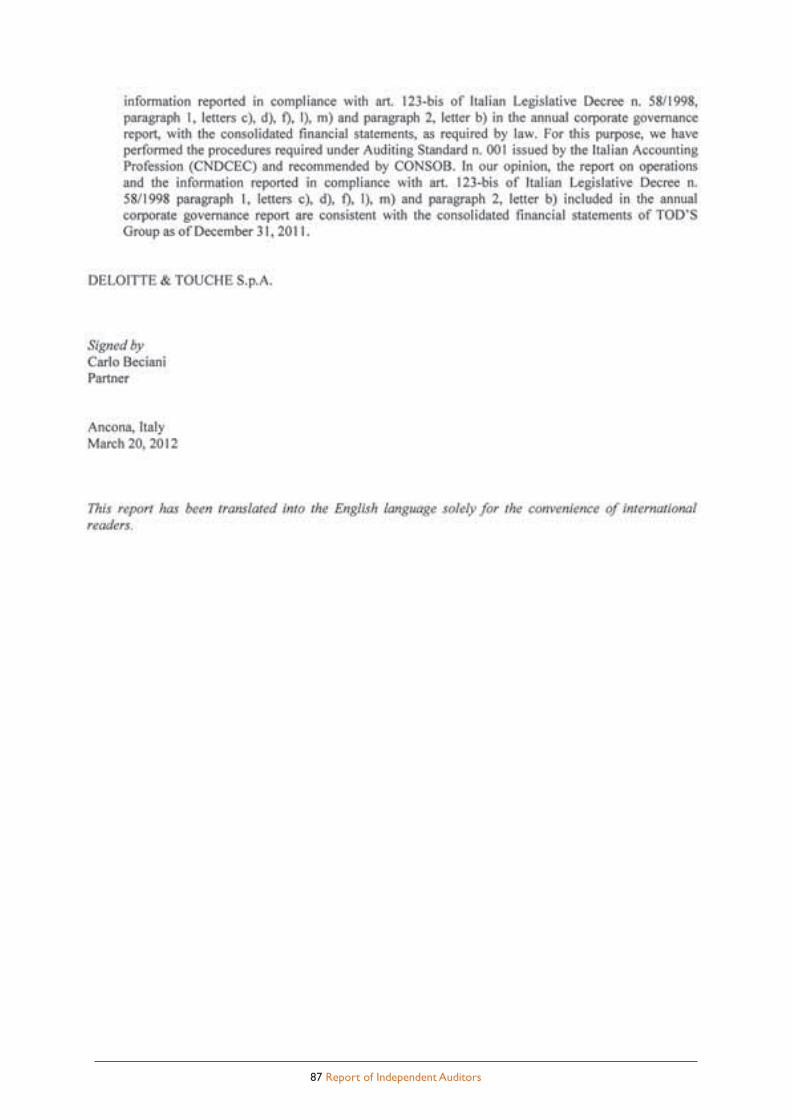
87 Report of Independent Auditors

88 2011 Annual Report
[THIS PAGE HAS BEEN INTENTIONALLY LEFT BLANK]
TOD'S S.p.A. - IAS/IFRS ANNUAL REPORTAS OF DECEMBER 31ST 2011

REPORT ON OPERATIONS
91 Report on operations
Introduction
The Report by the Board of Directors on Operations is based on the Separate Financial Statements of TOD’SS.p.A. at December 31st, 2011, prepared in accordance with IAS/IFRS (International Accounting Standards – IAS,and International Financial Reporting Standards – IFRSs) issued by the IASB and approved by the European Unionat the same date, on the assumption of the company’s status as a going concern.The Report on Operations mustbe read together with the Financial Statements and Notes to the Financial Statements, which are integral parts ofthe 2011 separate annual report.These documents include the additional information required by CONSOB,withthe measures issued in implementation of Article 9 of Legislative Decree 38/2005 (resolutions 15519 and 15520of July 27th, 2006 and DEM/6064293 memorandum of July 28th, 2006), as well as all subsequent notices containingprovisions regarding financial disclosures.The Separate Financial Statements have been prepared on the assumption that the Group can operate as a goingconcern.The Group believes that there are no asset, liability, financial or organisational indicators of material un-certainties, as defined in paragraph 25 of IAS 1 on business continuity.Separate Financial Statements annual report is approved by the Board of Directors ofTOD’S S.p.A. in March 13th,2012.
Alternative indicators of performances
In order to strip the effects of changes in exchange rates with respect to the average values for the previous yearfrom the results for the 2011 financial year, the typical economic reference indicators (Revenues, EBITDA, andEBIT) have been recalculated by applying the average exchange rates for 2010, rendering them fully comparablewith those for the previous reference period.Note that on the one hand, these principles for measurement of business performance represent a key to inter-pretation of results not envisaged in IFRSs, and on the other hand, must not be considered as substitutes for whatis set out in those standards.
Operating performances
As expected, the company realised outstanding revenue and earnings growth in 2011. Revenue rose from 577.0million euros in 2010 to 665.2 million euros in 2011, growing on an absolute basis by 88.1 million euros.EBIT totalled 144.1 million euros in 2011, as opposed to 124.2 million euros in 2010, growing by 16.1 percentagepoints.Net income for the year was 121.6 million euros, growing by 38.7 million euros (+46.6%) from its level in 2010,due in part to the 25 million euros in dividends received from subsidiaries.The 2011 financial year was also characterised by the Company’s major commitment to social responsibility. Itstwo most important initiatives were dedicated to the protection and promotion of Italian heritage.The first of these projects involved full financing, as sole sponsor, of urgent restoration work on the Coliseum.Following the agreement reached on January 21st, 2011 with the Ministry of Cultural Affairs and the SpecialArchaeological Service in Rome, the Company committed itself to pay 25 million euros for restoration of this mon-ument, which symbolises the history and culture of Italy.This commitment will be spread out over the entire du-ration of the restoration work.The Special Archaeological Service of Rome will remain responsible for planning(currently underway) and executing that work.Following a resolution by the General Meeting of the Fondazione Teatro alla Scala,TOD’S S.p.A. acquired the sta-tus of Permanent Founding Member of the Foundation on May 16th, 2011. By donating 5.2 million euros to theFoundation, to be paid over four years, the company manifested its intention to support the activity of this the-atre.The aim of this contribution is that La Scala continue affirming its enormous prestige and organisational ex-cellence around the world, and preserve its status as a global paragon of products “made in Italy”.
S.p.A.2011Annual Report
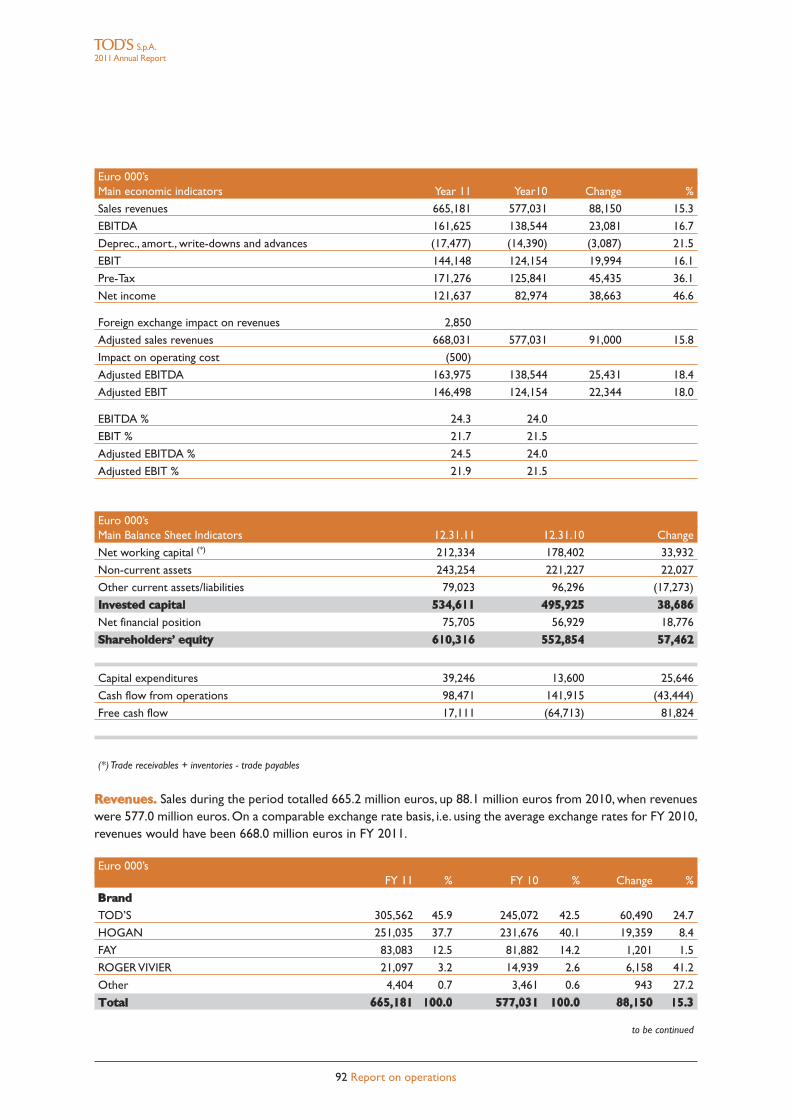
92 Report on operations
S.p.A.2011Annual Report
Euro 000’sMain economic indicators Year 11 Year10 Change %
Sales revenues 665,181 577,031 88,150 15.3
EBITDA 161,625 138,544 23,081 16.7
Deprec., amort., write-downs and advances (17,477) (14,390) (3,087) 21.5
EBIT 144,148 124,154 19,994 16.1
Pre-Tax 171,276 125,841 45,435 36.1
Net income 121,637 82,974 38,663 46.6
Foreign exchange impact on revenues 2,850
Adjusted sales revenues 668,031 577,031 91,000 15.8
Impact on operating cost (500)
Adjusted EBITDA 163,975 138,544 25,431 18.4
Adjusted EBIT 146,498 124,154 22,344 18.0
EBITDA % 24.3 24.0
EBIT % 21.7 21.5
Adjusted EBITDA % 24.5 24.0
Adjusted EBIT % 21.9 21.5
Euro 000’sMain Balance Sheet Indicators 12.31.11 12.31.10 Change
Net working capital (*) 212,334 178,402 33,932
Non-current assets 243,254 221,227 22,027
Other current assets/liabilities 79,023 96,296 (17,273)
Invested capital 534,611 495,925 38,686Net financial position 75,705 56,929 18,776
Shareholders’ equity 610,316 552,854 57,462
Capital expenditures 39,246 13,600 25,646
Cash flow from operations 98,471 141,915 (43,444)
Free cash flow 17,111 (64,713) 81,824
(*) Trade receivables + inventories - trade payables
Revenues. Sales during the period totalled 665.2 million euros, up 88.1 million euros from 2010, when revenueswere 577.0 million euros. On a comparable exchange rate basis, i.e. using the average exchange rates for FY 2010,revenues would have been 668.0 million euros in FY 2011.
Euro 000’sFY 11 % FY 10 % Change %
BrandTOD’S 305,562 45.9 245,072 42.5 60,490 24.7
HOGAN 251,035 37.7 231,676 40.1 19,359 8.4
FAY 83,083 12.5 81,882 14.2 1,201 1.5
ROGERVIVIER 21,097 3.2 14,939 2.6 6,158 41.2
Other 4,404 0.7 3,461 0.6 943 27.2
Total 665,181 100.0 577,031 100.0 88,150 15.3
to be continued
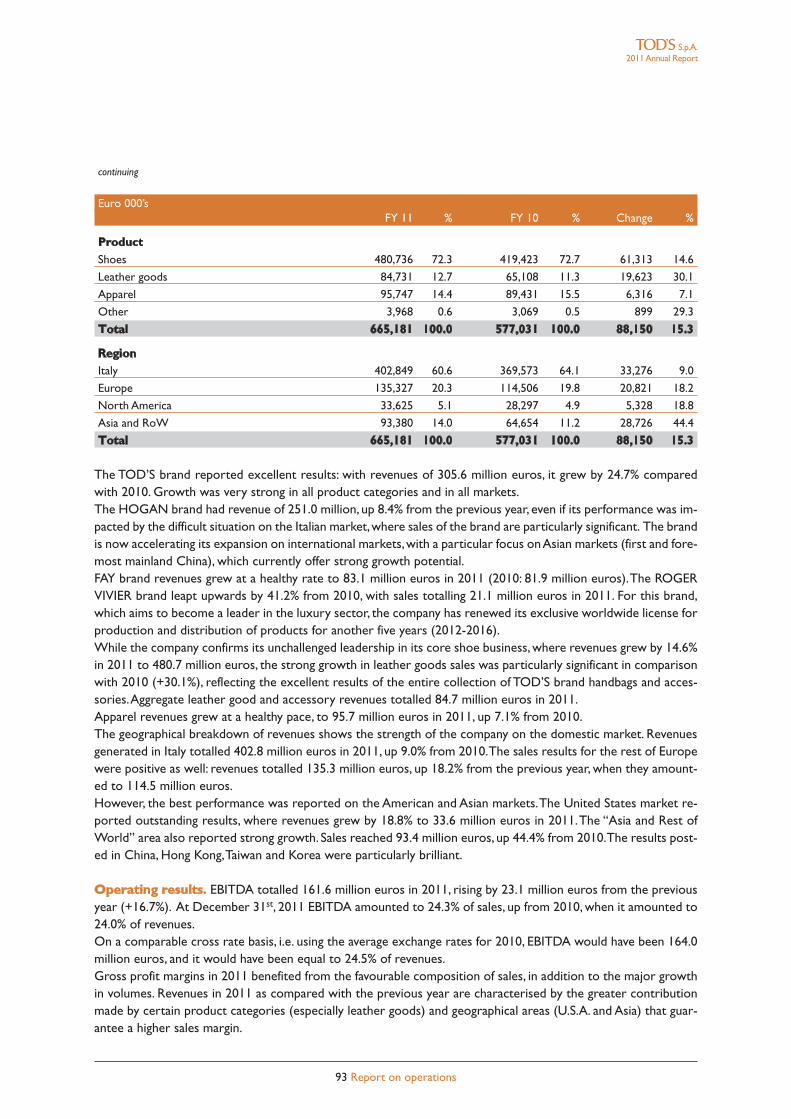
93 Report on operations
continuing
Euro 000’sFY 11 % FY 10 % Change %
ProductShoes 480,736 72.3 419,423 72.7 61,313 14.6
Leather goods 84,731 12.7 65,108 11.3 19,623 30.1
Apparel 95,747 14.4 89,431 15.5 6,316 7.1
Other 3,968 0.6 3,069 0.5 899 29.3
Total 665,181 100.0 577,031 100.0 88,150 15.3
RegionItaly 402,849 60.6 369,573 64.1 33,276 9.0
Europe 135,327 20.3 114,506 19.8 20,821 18.2
North America 33,625 5.1 28,297 4.9 5,328 18.8
Asia and RoW 93,380 14.0 64,654 11.2 28,726 44.4
Total 665,181 100.0 577,031 100.0 88,150 15.3
The TOD’S brand reported excellent results: with revenues of 305.6 million euros, it grew by 24.7% comparedwith 2010. Growth was very strong in all product categories and in all markets.The HOGAN brand had revenue of 251.0 million, up 8.4% from the previous year, even if its performance was im-pacted by the difficult situation on the Italian market,where sales of the brand are particularly significant. The brandis now accelerating its expansion on international markets,with a particular focus onAsian markets (first and fore-most mainland China), which currently offer strong growth potential.FAY brand revenues grew at a healthy rate to 83.1 million euros in 2011 (2010: 81.9 million euros).The ROGERVIVIER brand leapt upwards by 41.2% from 2010, with sales totalling 21.1 million euros in 2011. For this brand,which aims to become a leader in the luxury sector, the company has renewed its exclusive worldwide license forproduction and distribution of products for another five years (2012-2016).While the company confirms its unchallenged leadership in its core shoe business, where revenues grew by 14.6%in 2011 to 480.7 million euros, the strong growth in leather goods sales was particularly significant in comparisonwith 2010 (+30.1%), reflecting the excellent results of the entire collection of TOD’S brand handbags and acces-sories.Aggregate leather good and accessory revenues totalled 84.7 million euros in 2011.Apparel revenues grew at a healthy pace, to 95.7 million euros in 2011, up 7.1% from 2010.The geographical breakdown of revenues shows the strength of the company on the domestic market. Revenuesgenerated in Italy totalled 402.8 million euros in 2011, up 9.0% from 2010.The sales results for the rest of Europewere positive as well: revenues totalled 135.3 million euros, up 18.2% from the previous year, when they amount-ed to 114.5 million euros.However, the best performance was reported on the American and Asian markets.The United States market re-ported outstanding results, where revenues grew by 18.8% to 33.6 million euros in 2011.The “Asia and Rest ofWorld” area also reported strong growth. Sales reached 93.4 million euros, up 44.4% from 2010.The results post-ed in China, Hong Kong,Taiwan and Korea were particularly brilliant.
Operating results. EBITDA totalled 161.6 million euros in 2011, rising by 23.1 million euros from the previousyear (+16.7%). At December 31st, 2011 EBITDA amounted to 24.3% of sales, up from 2010, when it amounted to24.0% of revenues.On a comparable cross rate basis, i.e. using the average exchange rates for 2010, EBITDA would have been 164.0million euros, and it would have been equal to 24.5% of revenues.Gross profit margins in 2011 benefited from the favourable composition of sales, in addition to the major growthin volumes. Revenues in 2011 as compared with the previous year are characterised by the greater contributionmade by certain product categories (especially leather goods) and geographical areas (U.S.A. and Asia) that guar-antee a higher sales margin.
S.p.A.2011Annual Report
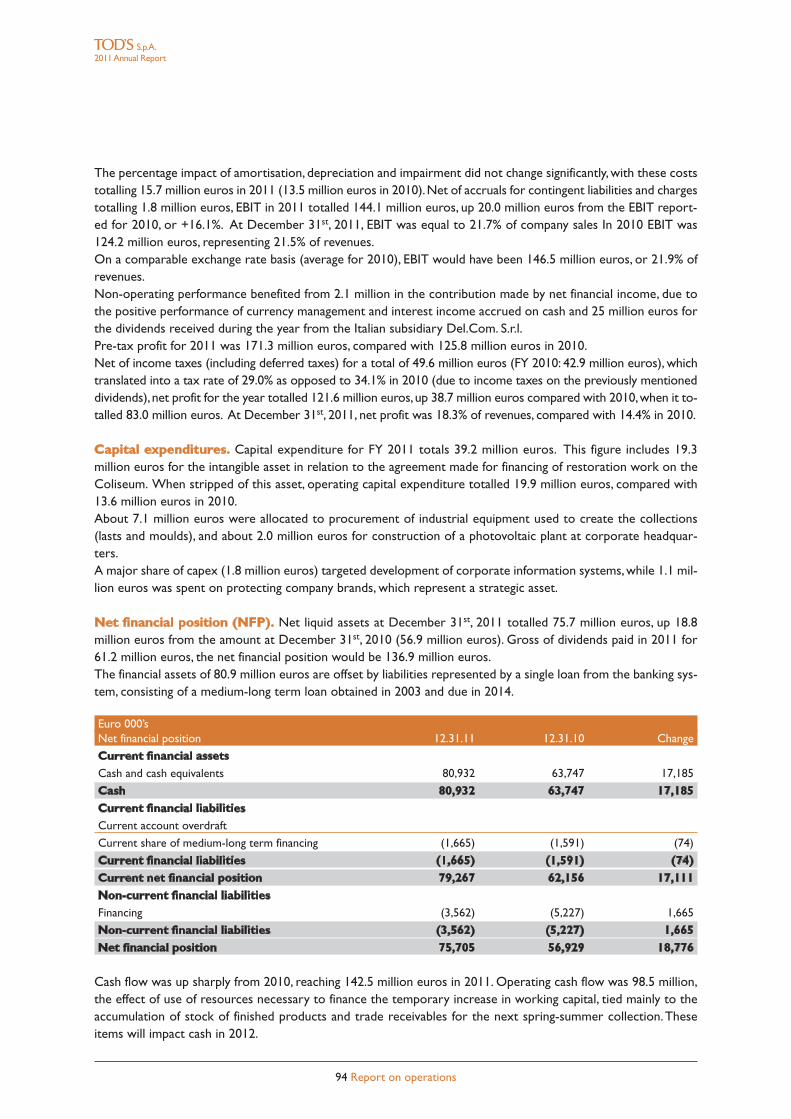
94 Report on operations
S.p.A.2011Annual Report
The percentage impact of amortisation, depreciation and impairment did not change significantly, with these coststotalling 15.7 million euros in 2011 (13.5 million euros in 2010).Net of accruals for contingent liabilities and chargestotalling 1.8 million euros, EBIT in 2011 totalled 144.1 million euros, up 20.0 million euros from the EBIT report-ed for 2010, or +16.1%. At December 31st, 2011, EBIT was equal to 21.7% of company sales In 2010 EBIT was124.2 million euros, representing 21.5% of revenues.On a comparable exchange rate basis (average for 2010), EBIT would have been 146.5 million euros, or 21.9% ofrevenues.Non-operating performance benefited from 2.1 million in the contribution made by net financial income, due tothe positive performance of currency management and interest income accrued on cash and 25 million euros forthe dividends received during the year from the Italian subsidiary Del.Com. S.r.l.Pre-tax profit for 2011 was 171.3 million euros, compared with 125.8 million euros in 2010.Net of income taxes (including deferred taxes) for a total of 49.6 million euros (FY 2010: 42.9 million euros), whichtranslated into a tax rate of 29.0% as opposed to 34.1% in 2010 (due to income taxes on the previously mentioneddividends), net profit for the year totalled 121.6 million euros,up 38.7 million euros compared with 2010,when it to-talled 83.0 million euros. At December 31st, 2011, net profit was 18.3% of revenues, compared with 14.4% in 2010.
Capital expenditures. Capital expenditure for FY 2011 totals 39.2 million euros. This figure includes 19.3million euros for the intangible asset in relation to the agreement made for financing of restoration work on theColiseum. When stripped of this asset, operating capital expenditure totalled 19.9 million euros, compared with13.6 million euros in 2010.About 7.1 million euros were allocated to procurement of industrial equipment used to create the collections(lasts and moulds), and about 2.0 million euros for construction of a photovoltaic plant at corporate headquar-ters.A major share of capex (1.8 million euros) targeted development of corporate information systems,while 1.1 mil-lion euros was spent on protecting company brands, which represent a strategic asset.
Net financial position (NFP). Net liquid assets at December 31st, 2011 totalled 75.7 million euros, up 18.8million euros from the amount at December 31st, 2010 (56.9 million euros). Gross of dividends paid in 2011 for61.2 million euros, the net financial position would be 136.9 million euros.The financial assets of 80.9 million euros are offset by liabilities represented by a single loan from the banking sys-tem, consisting of a medium-long term loan obtained in 2003 and due in 2014.
Euro 000’sNet financial position 12.31.11 12.31.10 Change
Current financial assetsCash and cash equivalents 80,932 63,747 17,185
Cash 80,932 63,747 17,185Current financial liabilitiesCurrent account overdraft
Current share of medium-long term financing (1,665) (1,591) (74)
Current financial liabilities (1,665) (1,591) (74)Current net financial position 79,267 62,156 17,111Non-current financial liabilitiesFinancing (3,562) (5,227) 1,665
Non-current financial liabilities (3,562) (5,227) 1,665Net financial position 75,705 56,929 18,776
Cash flow was up sharply from 2010, reaching 142.5 million euros in 2011. Operating cash flow was 98.5 million,the effect of use of resources necessary to finance the temporary increase in working capital, tied mainly to theaccumulation of stock of finished products and trade receivables for the next spring-summer collection.Theseitems will impact cash in 2012.
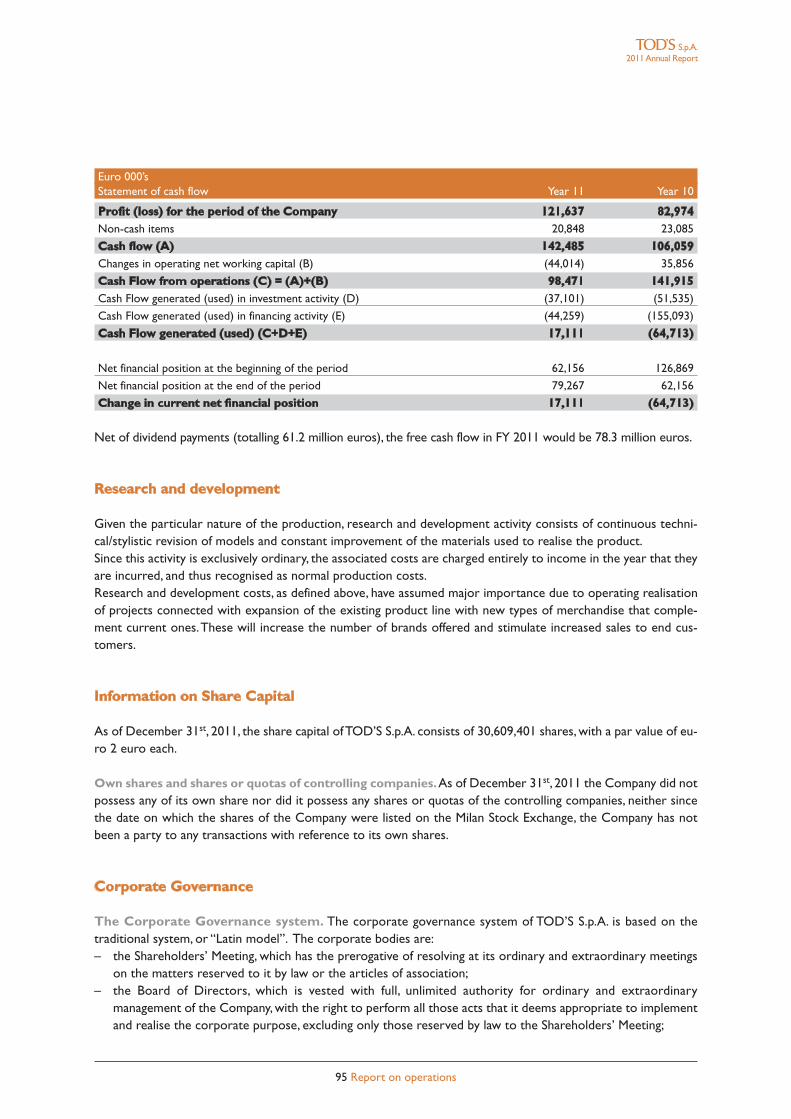
95 Report on operations
Euro 000’sStatement of cash flow Year 11 Year 10
Profit (loss) for the period of the Company 121,637 82,974Non-cash items 20,848 23,085
Cash flow (A) 142,485 106,059Changes in operating net working capital (B) (44,014) 35,856
Cash Flow from operations (C) = (A)+(B) 98,471 141,915Cash Flow generated (used) in investment activity (D) (37,101) (51,535)
Cash Flow generated (used) in financing activity (E) (44,259) (155,093)
Cash Flow generated (used) (C+D+E) 17,111 (64,713)
Net financial position at the beginning of the period 62,156 126,869
Net financial position at the end of the period 79,267 62,156
Change in current net financial position 17,111 (64,713)
Net of dividend payments (totalling 61.2 million euros), the free cash flow in FY 2011 would be 78.3 million euros.
Research and development
Given the particular nature of the production, research and development activity consists of continuous techni-cal/stylistic revision of models and constant improvement of the materials used to realise the product.Since this activity is exclusively ordinary, the associated costs are charged entirely to income in the year that theyare incurred, and thus recognised as normal production costs.Research and development costs, as defined above, have assumed major importance due to operating realisationof projects connected with expansion of the existing product line with new types of merchandise that comple-ment current ones.These will increase the number of brands offered and stimulate increased sales to end cus-tomers.
Information on Share Capital
As of December 31st, 2011, the share capital ofTOD’S S.p.A. consists of 30,609,401 shares, with a par value of eu-ro 2 euro each.
Own shares and shares or quotas of controlling companies.As of December 31st, 2011 the Company did notpossess any of its own share nor did it possess any shares or quotas of the controlling companies, neither sincethe date on which the shares of the Company were listed on the Milan Stock Exchange, the Company has notbeen a party to any transactions with reference to its own shares.
Corporate Governance
The Corporate Governance system. The corporate governance system of TOD’S S.p.A. is based on thetraditional system, or “Latin model”. The corporate bodies are:– the Shareholders’ Meeting, which has the prerogative of resolving at its ordinary and extraordinary meetings
on the matters reserved to it by law or the articles of association;– the Board of Directors, which is vested with full, unlimited authority for ordinary and extraordinary
management of the Company, with the right to perform all those acts that it deems appropriate to implementand realise the corporate purpose, excluding only those reserved by law to the Shareholders’ Meeting;
S.p.A.2011Annual Report
96 Report on operations
S.p.A.2011Annual Report
– the Board of StatutoryAuditors,which is delegated by law to monitor i) compliance with the law,memorandumof association and compliance with the principles of proper management; ii) the adequacy of the organisationalstructure for matters falling under its purview, its internal control system and administrative and accountingsystem, as well as the adequacy of the latter in fairly reporting operating performance; iii) the adequacy ofdirectives issued toTOD’S Group companies in regard to the information that they must provide in compliancewith disclosure obligations; iv) the procedures for effective implementation of the corporate governance rulesset out in the Corporate Governance Code adopted by the Group; Legislative Decree 39/2010 delegates theBoard of Statutory Auditors the task of monitoring the process of financial disclosure and the effectiveness ofthe risk control and management systems, as well as independent audits and certification of the annual accountsand consolidated accounts, and the independence of the accounting firm retained to do so;
– the Manager in charge of preparing the company financial documents.
The Board of Directors has set up several internal committees: the Executive Committee, the Internal Controland Corporate Governance Committee, the Compensation Committee and the Independent DirectorsCommittee.The last named committee has the role and significant responsibilities that the Regulation of RelatedPartyTransactions, adopted by CONSOB with Resolution no.17221 of March 12th, 2010 and subsequently amend-ed with Resolution no. 17389 of June 23rd, 2010, assigns to the committee comprised exclusively of independentdirectors.The adopted corporate governance system is substantially based on the Corporate Governance Code, whoseprinciples have been adopted byTOD’S S.p.A. through a series of Board of Directors resolutions since November2006, and the reference systems represented by international best practice.Insofar as the term of the current Board of Directors will expire upon approval of the 2011 Annual Report, it wasdecided to delegate the new Board of Directors with the task of adopting the principles set out in the newCorporate Governance Code of Listed Italian Companies approved by Borsa Italiana S.p.A. in December 2011,which the issuers are asked to implement by the end of FY 2012. However, all those principles for which theCorporate Governance Code recommends adoption prior to the suggested deadline will still have to be appliedbeforehand.
Disclosure pursuant toArticle 123-bis of Legislative Decree 58/1998 (“TUF”).At its meeting on March13th 2012, the Board of Directors of TOD’S S.p.A. approved the annual Report on Corporate Governance andShareholdings, which provides the disclosures mandated pursuant to Article 123-bis (1) of the Consolidated Lawon Finance (T.U.F.).That report also analytically illustrates the corporate governance system of TOD’S S.p.A., andit includes not only the information required underArticle 123-bis (2)T.U.F., but also a comprehensive examinationof the status of implementation of the corporate governance principles recommended by the CorporateGovernance Code in accordance with the “comply or explain” rule.The reader is referred to the Annual Corporate Governance and Shareholdings Report, which is available to thepublic together with this Report on Operations and accounting documentation. It may be consulted in the cor-porate section of the www.todsgroup.com website.
Disclosure pursuant to Article 123-ter of Legislative Decree 58/1998 (Consolidated Law onFinance - “TUF”). On March 13th, 2012, the Board of Directors ofTOD’S S.p.A. approved, in compliance withArticle 123-ter of Legislative Decree 58 of February 24th, 1998 (the “Consolidated Finance Law” or “T.U.F.”), asamended, and Article 84-quater of Consob Resolution no. 11971/99 (the “Issuers Regulation”), as amended, theRemuneration Report.The Report is composed of two sections:(i) the first is the policy ofTOD’S S.p.A. in regard to remuneration of the members of the Board of Directors, theGeneral Manager, and the executives with strategic responsibilities in regard to the 2012 financial year, as well asthe procedures used for adoption and implementation of this policy;(ii) the other is aimed at representing each of the items that compose remuneration, and describing the compen-sation paid in 2011 to members of the Board of Directors and Board of Statutory Auditors, the General Managerand the executives with strategic responsibilities;
97 Report on operations
it will be submitted to the Shareholders’ Meeting called forApril 19th, 2012,which will be asked to resolve in favourof or against the first section with a non-binding resolution.The Remuneration Report is available at the registered office of the Company, at Borsa Italiana S.p.A. and on thecorporate website www.todsgroup.com.
Disclosure of Significant Companies outside the EU. TOD’S S.p.A., directly or indirectly controls six com-panies that are incorporated and regulated pursuant to the laws of countries that do not belong to the EuropeanUnion (“Significant Companies outside the EU,” as defined by Consob Resolution no. 16191/2007, as amended).In reference to these companies, note that:– all of them prepare accounts used to prepare the consolidated financial statements.The balance sheet and
income statement of these entities are provided to shareholders of TOD’S S.p.A. at the times and in the waysenvisaged by applicable regulations;
– TOD’S S.p.A. has acquired the bylaws and composition and powers of the corporate bodies;– the Significant Companies outside the EU: i) provide the parent company’s independent auditor with information
that the latter needs to audit the annual and interim accounts of the parent; ii) have an administrative andaccounting system that is adequate for providing the management,Board of StatutoryAuditors and independentauditor of the parent company with the operating, financial position and earnings figures necessary for preparingthe consolidated financial statements.
In order to satisfy its own statutory obligations, the Board of Statutory Auditors of TOD’S S.p.A. has audited theadequacy of the administrative and accounting system regularly to provide the management and independent au-ditor of TOD’S S.p.A. with the operating, financial position and earnings figures necessary for preparation of theconsolidated financial statements and the effective flow of information through meetings with the independent au-ditor and with the Financial Reporting Manager.
Disclosure pursuant to Consob Resolution no.17221 of March 12th,2010 (Related Parties Regulation).In 2011 the Company did not conclude highly significant transactions with related parties or related party transac-tions that had a material impact on the assets, liabilities or net income of the Group, and there were no modifica-tions or developments in the transactions described in the 2010 Annual Report that had the same effects.All information regarding existing relations with related parties in 2011 are set out in the supplementary notes.
Management and coordination activities
Although TOD’S S.p.A. is subject to the control (pursuant to Article 93 of Legislative Decree 58/1998) of DI.VI.Finanziaria S.a.p.A., neither this latter company or any other party has dictated policy or interferred in the man-agement ofTOD’S S.p.A. (or any of the subsidiaries ofTOD’S S.p.A.). Indeed,management of the issuer and its sub-sidiaries was not subject to any influence by third parties outside the TOD’S Group.TOD’S S.p.A. is not subject to management and coordination by the parent company DI.VI. Finanziaria S.a.p.A. orany other party pursuant to Sections 2497 et seq. Italian Civil Code.Pursuant to the Corporate Governance Code, transactions that have a particularly significant impact on TOD’SS.p.A. strategy, operations, assets, liabilities, and financial position are subject to exclusive review and approval bythe Board of Directors of the issuer TOD’S S.p.A. Its members include independent directors without executiveresponsibilities at the company, in accordance with the rules set out in Article 3 of the Corporate GovernanceCode.The expertise and authority of the independent directors without executive responsibilities and their material im-pact on decisions taken by the Board of Directors represent a further guarantee that all decisions by the Boardof Directors are taken exclusively on behalf of TOD’S S.p.A. without being influenced by instructions or interfer-ence by third parties representing interests opposed to the Company’s.All subsidiaries ofTOD’S S.p.A. are subject to management and coordination by the issuer.This activity consists indefining the general strategic policies for the Group, the internal control and risk management system, and the
S.p.A.2011Annual Report
elaboration of general policies for management of the most important operating drivers (human, financial, pro-ductive, marketing and communication resources), without impairing the complete managerial and operating au-tonomy of the subsidiaries.
Significant events occurring after the end of the fiscal year
Effective January 1st, 2012, in view of integrating in its organisation a whole series of outsourced strategic mar-keting and promotion activities, the Company acquired 100% of the units of Formapura S.r.l., an Italian companywith which it had a collaboration relationship involving the aforementioned activities for several years. In view ofcompleting the integration process, and realising a more streamlined and functional structure in terms of assets,liabilities and earnings by simplifying the Group corporate structures, the boards of directors of the respective en-tities resolved in favour of merger through takeover of Formapura S.r.l. by TOD’S S.p.A.
Business outlook
The FY 2011 results have confirmed the solidity and the strength of Company’s brands whose high quality andother aspects characterise Company’s products, guarantee constant appreciation by consumers.In light of the foregoing, the business outlook for the current year is based on the positive sales results reportedby the retail network for the first part of the year and projects for expansion of the single-brand network.Consequently, it is reasonable to expect that company revenue and net earnings will continue to grow in 2012.
Motion for allocation of the profit for the year
It is proposed the allocation of the net profit for FY 2011, 121,637,416.66 euros, as follows:i. 45,113,914.16 euros to the extraordinary reserve;ii. 76,523,502.50 euros, to be distributed to shareholders in the form of a dividend of 2.50 euros per share for
each of the outstanding 30,609,401 shares.
Milan, March 13th, 2012
The Chairman of the Board of DirectorsDiego DellaValle
98 Report on operations
S.p.A.2011Annual Report

[THIS PAGE HAS BEEN INTENTIONALLY LEFT BLANK]
99 2011 Annual Report

[THIS PAGE HAS BEEN INTENTIONALLY LEFT BLANK]
100 2011 Annual Report

FINANCIAL STATEMENTS
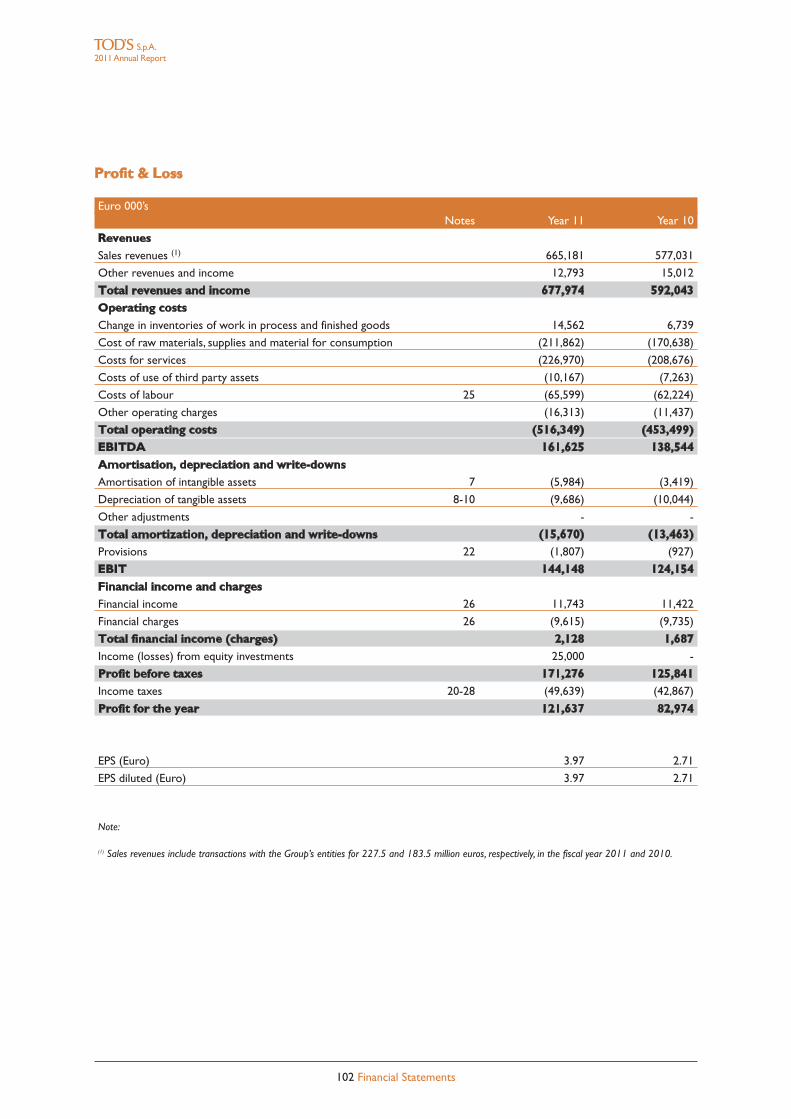
102 Financial Statements
S.p.A.2011Annual Report
Profit & Loss
Euro 000’sNotes Year 11 Year 10
RevenuesSales revenues (1) 665,181 577,031
Other revenues and income 12,793 15,012
Total revenues and income 677,974 592,043Operating costsChange in inventories of work in process and finished goods 14,562 6,739
Cost of raw materials, supplies and material for consumption (211,862) (170,638)
Costs for services (226,970) (208,676)
Costs of use of third party assets (10,167) (7,263)
Costs of labour 25 (65,599) (62,224)
Other operating charges (16,313) (11,437)
Total operating costs (516,349) (453,499)EBITDA 161,625 138,544Amortisation, depreciation and write-downsAmortisation of intangible assets 7 (5,984) (3,419)
Depreciation of tangible assets 8-10 (9,686) (10,044)
Other adjustments - -
Total amortization, depreciation and write-downs (15,670) (13,463)Provisions 22 (1,807) (927)
EBIT 144,148 124,154Financial income and chargesFinancial income 26 11,743 11,422
Financial charges 26 (9,615) (9,735)
Total financial income (charges) 2,128 1,687Income (losses) from equity investments 25,000 -
Profit before taxes 171,276 125,841Income taxes 20-28 (49,639) (42,867)
Profit for the year 121,637 82,974
EPS (Euro) 3.97 2.71
EPS diluted (Euro) 3.97 2.71
Note:
(1) Sales revenues include transactions with the Group’s entities for 227.5 and 183.5 million euros, respectively, in the fiscal year 2011 and 2010.
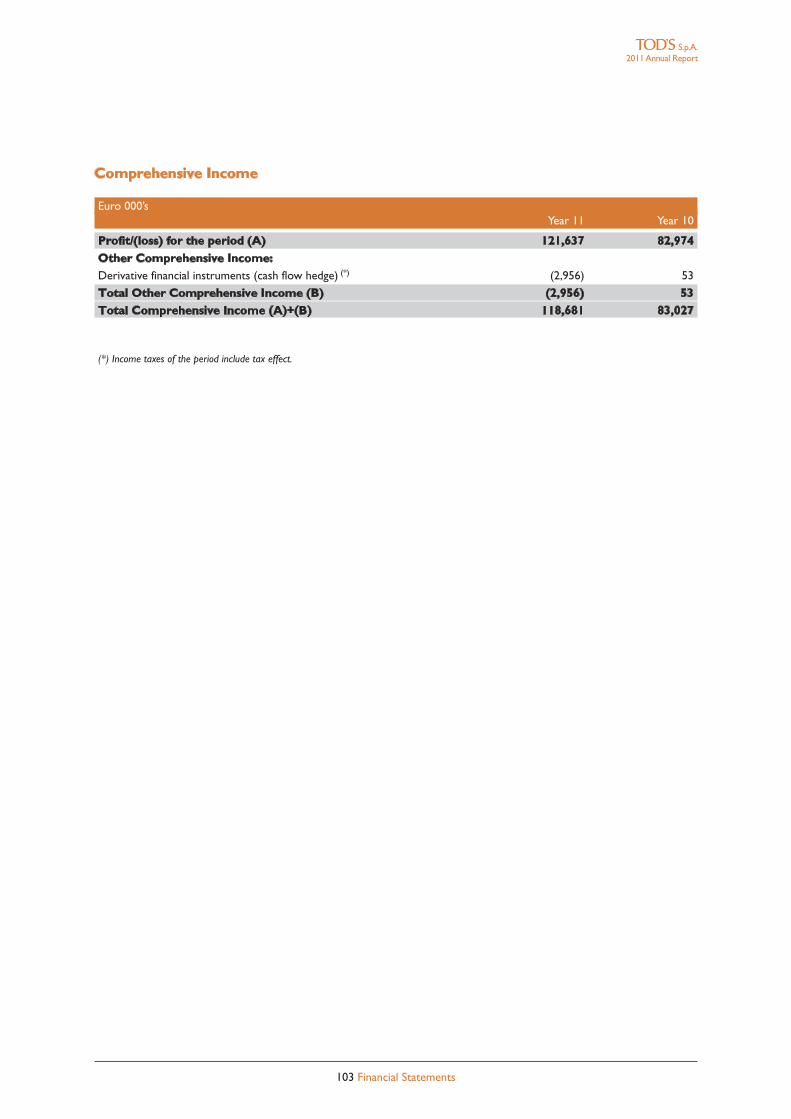
Comprehensive Income
Euro 000’sYear 11 Year 10
Profit/(loss) for the period (A) 121,637 82,974Other Comprehensive Income:Derivative financial instruments (cash flow hedge) (*) (2,956) 53
Total Other Comprehensive Income (B) (2,956) 53Total Comprehensive Income (A)+(B) 118,681 83,027
(*) Income taxes of the period include tax effect.
103 Financial Statements
S.p.A.2011Annual Report
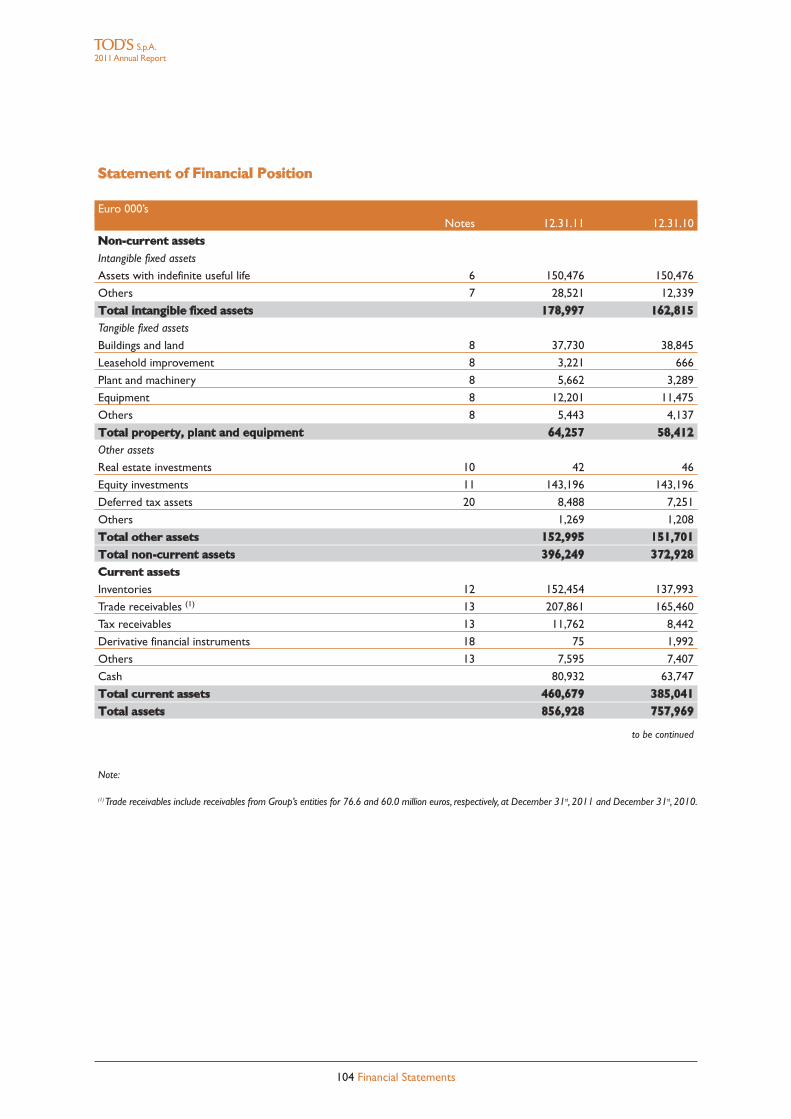
104 Financial Statements
S.p.A.2011Annual Report
Statement of Financial Position
Euro 000’sNotes 12.31.11 12.31.10
Non-current assetsIntangible fixed assets
Assets with indefinite useful life 6 150,476 150,476
Others 7 28,521 12,339
Total intangible fixed assets 178,997 162,815Tangible fixed assets
Buildings and land 8 37,730 38,845
Leasehold improvement 8 3,221 666
Plant and machinery 8 5,662 3,289
Equipment 8 12,201 11,475
Others 8 5,443 4,137
Total property, plant and equipment 64,257 58,412Other assets
Real estate investments 10 42 46
Equity investments 11 143,196 143,196
Deferred tax assets 20 8,488 7,251
Others 1,269 1,208
Total other assets 152,995 151,701Total non-current assets 396,249 372,928Current assetsInventories 12 152,454 137,993
Trade receivables (1) 13 207,861 165,460
Tax receivables 13 11,762 8,442
Derivative financial instruments 18 75 1,992
Others 13 7,595 7,407
Cash 80,932 63,747
Total current assets 460,679 385,041Total assets 856,928 757,969
to be continued
Note:
(1)Trade receivables include receivables from Group’s entities for 76.6 and 60.0 million euros, respectively, at December 31st, 2011 and December 31st, 2010.
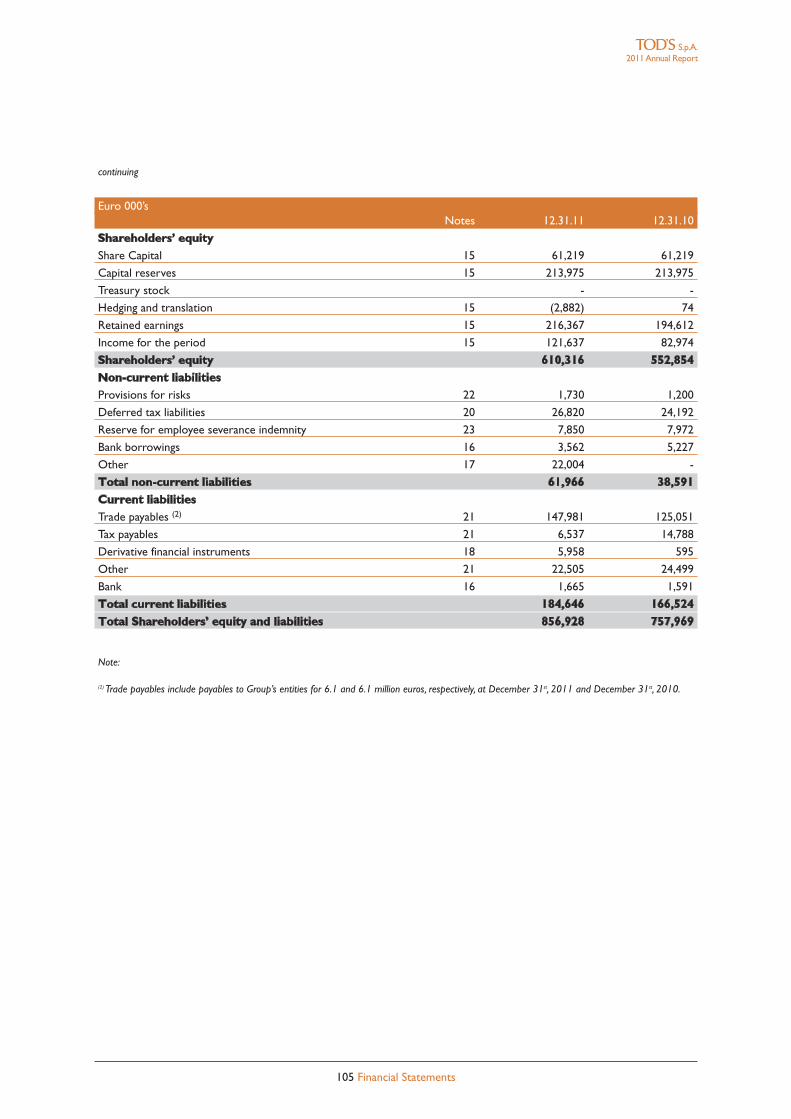
continuing
Euro 000’sNotes 12.31.11 12.31.10
Shareholders’ equityShare Capital 15 61,219 61,219
Capital reserves 15 213,975 213,975
Treasury stock - -
Hedging and translation 15 (2,882) 74
Retained earnings 15 216,367 194,612
Income for the period 15 121,637 82,974
Shareholders’ equity 610,316 552,854Non-current liabilitiesProvisions for risks 22 1,730 1,200
Deferred tax liabilities 20 26,820 24,192
Reserve for employee severance indemnity 23 7,850 7,972
Bank borrowings 16 3,562 5,227
Other 17 22,004 -
Total non-current liabilities 61,966 38,591Current liabilitiesTrade payables (2) 21 147,981 125,051
Tax payables 21 6,537 14,788
Derivative financial instruments 18 5,958 595
Other 21 22,505 24,499
Bank 16 1,665 1,591
Total current liabilities 184,646 166,524Total Shareholders’ equity and liabilities 856,928 757,969
Note:
(2) Trade payables include payables to Group’s entities for 6.1 and 6.1 million euros, respectively, at December 31st, 2011 and December 31st, 2010.
105 Financial Statements
S.p.A.2011Annual Report
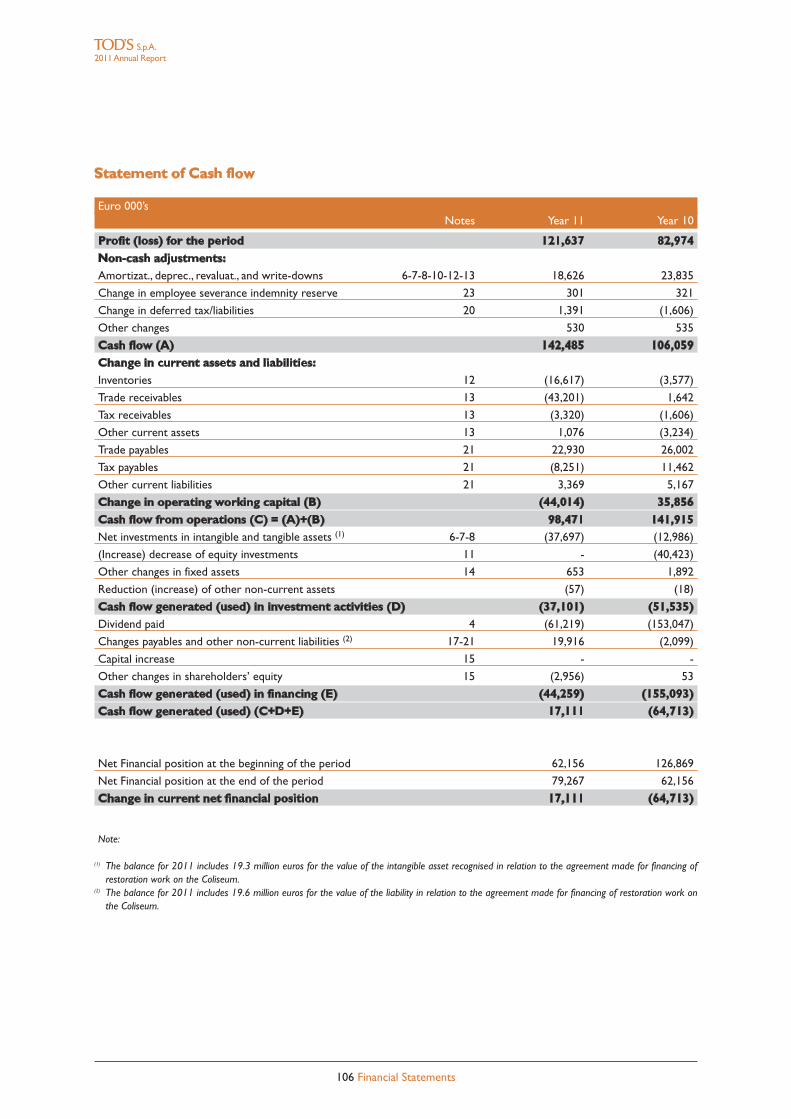
Statement of Cash flow
Euro 000’sNotes Year 11 Year 10
Profit (loss) for the period 121,637 82,974Non-cash adjustments:Amortizat., deprec., revaluat., and write-downs 6-7-8-10-12-13 18,626 23,835
Change in employee severance indemnity reserve 23 301 321
Change in deferred tax/liabilities 20 1,391 (1,606)
Other changes 530 535
Cash flow (A) 142,485 106,059Change in current assets and liabilities:Inventories 12 (16,617) (3,577)
Trade receivables 13 (43,201) 1,642
Tax receivables 13 (3,320) (1,606)
Other current assets 13 1,076 (3,234)
Trade payables 21 22,930 26,002
Tax payables 21 (8,251) 11,462
Other current liabilities 21 3,369 5,167
Change in operating working capital (B) (44,014) 35,856Cash flow from operations (C) = (A)+(B) 98,471 141,915Net investments in intangible and tangible assets (1) 6-7-8 (37,697) (12,986)
(Increase) decrease of equity investments 11 - (40,423)
Other changes in fixed assets 14 653 1,892
Reduction (increase) of other non-current assets (57) (18)
Cash flow generated (used) in investment activities (D) (37,101) (51,535)Dividend paid 4 (61,219) (153,047)
Changes payables and other non-current liabilities (2) 17-21 19,916 (2,099)
Capital increase 15 - -
Other changes in shareholders’ equity 15 (2,956) 53
Cash flow generated (used) in financing (E) (44,259) (155,093)Cash flow generated (used) (C+D+E) 17,111 (64,713)
Net Financial position at the beginning of the period 62,156 126,869
Net Financial position at the end of the period 79,267 62,156
Change in current net financial position 17,111 (64,713)
Note:
(1) The balance for 2011 includes 19.3 million euros for the value of the intangible asset recognised in relation to the agreement made for financing ofrestoration work on the Coliseum.
(2) The balance for 2011 includes 19.6 million euros for the value of the liability in relation to the agreement made for financing of restoration work onthe Coliseum.
106 Financial Statements
S.p.A.2011Annual Report
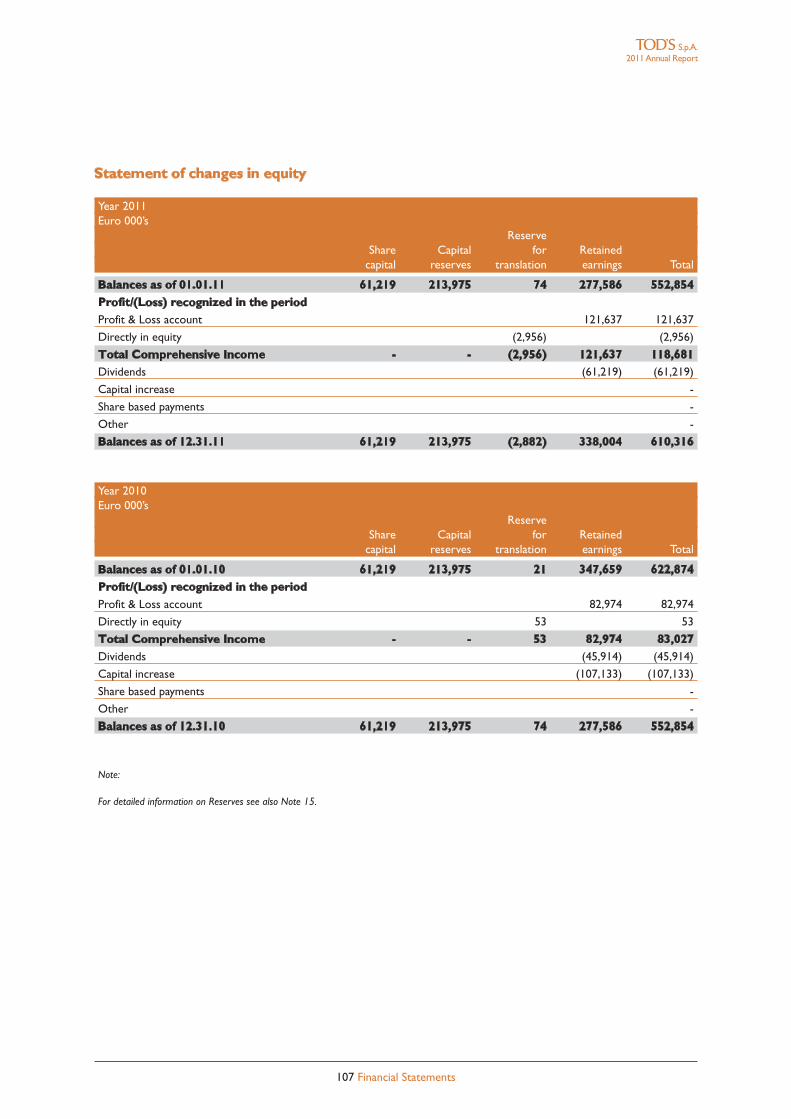
Statement of changes in equity
Year 2011Euro 000’s
ReserveShare Capital for Retained
capital reserves translation earnings Total
Balances as of 01.01.11 61,219 213,975 74 277,586 552,854Profit/(Loss) recognized in the periodProfit & Loss account 121,637 121,637
Directly in equity (2,956) (2,956)
Total Comprehensive Income - - (2,956) 121,637 118,681Dividends (61,219) (61,219)
Capital increase -
Share based payments -
Other -
Balances as of 12.31.11 61,219 213,975 (2,882) 338,004 610,316
Year 2010Euro 000’s
ReserveShare Capital for Retained
capital reserves translation earnings Total
Balances as of 01.01.10 61,219 213,975 21 347,659 622,874Profit/(Loss) recognized in the periodProfit & Loss account 82,974 82,974
Directly in equity 53 53
Total Comprehensive Income - - 53 82,974 83,027Dividends (45,914) (45,914)
Capital increase (107,133) (107,133)
Share based payments -
Other -
Balances as of 12.31.10 61,219 213,975 74 277,586 552,854
Note:
For detailed information on Reserves see also Note 15.
107 Financial Statements
S.p.A.2011Annual Report
[THIS PAGE HAS BEEN INTENTIONALLY LEFT BLANK]
108 2011 Annual Report

SUPPLEMENTARY NOTES
110 Supplementary Notes
S.p.A.2011Annual Report
1. General notes
The Notes to the Separate Financial Statements were prepared in accordance with IAS/IFRS and supplementedby the additional information required by CONSOB and the orders it issued in implementation of Article 9 ofLegislative Decree 38/2005 (Resolutions 15519 and 15520 of July 27th, 2006 and memorandum DEM/6064293 ofJuly 28th, 2006, pursuant to Article 114(5) of the Consolidated Law on Finance-TUF), Article 78 of the IssuerRegulation, the EC document of November 2003 and, when applicable, the Italian Civil Code.Consistently with the financial statements for the previous year, certain information is provided in the Report bythe Board of Directors on Operations.The Separate financial statements were approved by the Board of Directors ofTOD’S S.p.A. (the “Company”) onMarch 13th, 2012.
2. Financial statements format: choice of form and classification principles
On transition to IFRSs,TOD’S S.p.A. opted to continue using the same balance sheet and income statement for-mats used in its disclosures pursuant to Italian GAAP for presentation of its financial position and operating re-sults. These financial statements, complemented as necessary by the Report of the Board of Directors onOperations and the notes to the financial statements, are considered to be those that provide the best organizedrepresentation of the company financial position and income.More specifically, the balance sheet format shows current items separately from non-current items (both assetsand liabilities).On the profit and loss account, the format of representing revenues and costs by nature is followed,indicating the EBITDA and EBIT results as in the past, since they are considered representative indicators of com-pany performance.The “indirect” method is used for the statement of cash flows.
3. Highlights of the accounting standards
The separated financial statements are prepared in accordance with IAS/IFRS (InternationalAccounting Standards-IAS and International Financial Reporting Standards-IFRS) issued by the IASB, on the basis of the text published inthe Official Journal of the European Union (OJEU). Furthermore, they are prepared on the basis of historic costs,with the sole exception of derivative financial instruments, which are measured at fair value.
Accounting principles, amendments, interpretations applicable since January 1st, 2011 with effectson the Separate Financial statements of the Company as at December 31st, 2011
þ IAS 24 Revised - Related parties disclosures: it has been clarified the definition of a related party and simplifieddisclosures for government-related entities.
Accounting principles, amendments, interpretations applicable since January 1st, 2011 not applyingin the Separate Financial statements of the Company as at December 31st, 2011
þ IAS 34 Improvement - Interim financial reporting: it has been clarified the disclosure principle for significanttransactions on interim financial reporting.
þ IAS 1 Improvement - Presentation of financial statements: an entity, for each component of equity, may presentthe breakdown of other comprehensive income either in the statement of changes in equity or in the notesto the financial statements.
þ IFRS 1 Improvement - First time adoption: a first time adopter that changes its accounting policies or its use ofIFRS 1 exemptions after publishing a set of IAS 34 interim financial information should explain those changesand include the effects of such changes in its opening reconciliations within the first annual IFRS financial
111 Supplementary Notes
statements; the exemption to use a ‘deemed cost’ arising from a revaluation, is extended to revaluationsoccurred during the period covered by the first IFRS financial statements; entities subject to rate regulation arepermitted to use previous GAAP carrying amounts of property plant and equipment or intangible assets asdeemed cost.
þ IFRS 7 Improvement, Amendment - Financial instruments disclosures: it has been clarified disclosures on thenature and extent of risks arising from financial instruments;
þ IFRIC 13 Improvement - Customer loyalty programmes: it has been clarified the meaning of the term ‘fair value’in the context of measuring award credits under customer loyalty programmes.
þ IFRIC 14 Amendment -The limit on a defined benefit asset,minimum funding requirements and their interaction:it has been clarified the conditions under which an asset could be recognised in the financial statements.
þ IFRIC 19 - Extinguishing financial liabilities with equity instruments: it has been clarified the accounting treatmentfor renegotiating the term of a financial liability fully o partially issuing equity instruments.
3.1 Transactions in foreign currency. The functional currency (the currency used in the principal economicarea where the company operates) used to present the financial statements is the Euro. Foreign currencytransactions are translated into the functional currency by applying the exchange rate in effect at the date of thetransaction.Monetary assets and liabilities denominated in foreign currencies at the date of the financial statementsare translated by using the exchange rate in effect at the closing date.Non-monetary assets and liabilities are valuedat their historic cost in foreign currency and translated by using the exchange rate in effect at the transaction date.The foreign exchange differences arising upon settlement of these transactions or translation of cash assets andliabilities are recognized on the profit and loss account, with the exception of those deriving from derivative fi-nancial instruments qualified as hedging of financial flows. In fact, these differences are recognized as a separatecomponent of shareholders’ equity or on the profit and loss account.
3.2 Derivative financial instruments. The company uses derivate financial instruments (mainly currencyfutures contracts) to hedge the risks stemming from foreign exchange exposure deriving from its operating activity,without any speculative or trading purposes, and consistently with the strategic policies of centralized cashmanagement dictated by the Board of Directors.When derivative transactions refer to a risk connected with the variability of forecast transaction cash flow, theyare recognized according to the rules for cash flow hedge until the transaction is recorded on the books.Subsequently, the derivatives are treated in accordance with fair value hedge rules, insofar as they can be qualifiedas instruments for hedging changes in the value of assets or liabilities carried on the balance sheet.The hedge accounting method is used at every financial statement closing date.This method envisages posting de-rivatives on the balance sheet at their fair value. Posting of the changes in fair value varies according to the typeof hedging at the valuation date:• for derivatives that hedge forecast transactions (i.e. cash flow hedge), the changes are recognized in
shareholders’ equity, while the portion for the ineffective amount is recognized on the profit and loss account,under financial income and expenses;
• for derivatives that hedge receivables and payables recognized on the balance sheet (i.e. fair value hedge), thefair value differences are recognized entirely on the profit and loss account, adjusting operating margins.Furthermore, the value of the hedged item (receivables/payables) is adjusted for the change in value attributableto the hedged risk, using the item financial income and expenses as a contra-entry.
3.3 Intangible fixed assets.i. Goodwill. All business combinations are recognized by applying the acquisition method.Goodwill representsthe portion of the cost paid for the acquisition that exceeds the company’s interest in the fair value of the assets,liabilities, and identifiable potential liabilities of the subsidiary or jointly controlled entity at the acquisition date.If the company’s interest in the fair value of assets, liabilities, and identifiable potential liabilities exceeds the costof the acquisition (negative goodwill) after redetermination of these values, the excess is immediately recognizedon the profit and loss account.
S.p.A.2011Annual Report
112 Supplementary Notes
S.p.A.2011Annual Report
For acquisitions prior to January 1st, 2005, the date of transition to IAS/IFRS, goodwill retained the values recog-nized on the basis of the previous Italian GAAP, net of accumulated amortization up to the transition date.Goodwill is recognized on the financial statements at its cost adjusted for impairment losses. It is not subject toamortization, but the adequacy of the values is annually subjected to the impairment test, in accordance with therules set forth in the section Impairment losses.
ii. Trademarks.These are recognized according to the value of their cost and/or acquisition, net of accumulatedamortization at the date of transition to IAS/IFRS.Trademarks TOD’S, HOGAN e FAY are classified as intangiblefixed assets with an indefinite useful life and thus are not amortized, insofar as:• they play a primary role in company strategy and are an essential driver thereof;• the corporate structure, construed as organized property, plant, and equipment, and organization itself in a
figurative sense, is closely correlated with and dependent on dissemination and development of the trademarkson the markets;
• the trademarks are proprietary, properly registered, and constantly protected pursuant to law,with options forrenewal of legal protection, upon expiration of the registration periods, that are not burdensome, easilyimplemented, and without external impediments;
• the products sold by the company with these trademarks are not subject to particular technologicalobsolescence, which is characteristic of the luxury market in which the company operates; on the contrary,they are consistently perceived by the market as being innovative and trendy, to the point of being models forimitation or inspiration;
• in the national and/or international context characteristic of each trademark, they are distinguished by marketpositioning and notoriety that ensures their dominance of the respective market segments, being constantlyassociated and compared with benchmark brands;
• in the relative competitive context, it can be affirmed that the investments made for maintenance of thetrademarks are proportionately modest with respect to the large forecast cash flows.
The adequacy of the values is annually subjected to the impairment test, in accordance with the rules set forth inthe section Impairment losses.
iii. Research and development costs. The research costs for a project are charged fully to the profit and lossaccount of the period in which they are incurred.The development costs of an activity are instead capitalized if the technical and commercial feasibility of the rel-ative activity and economic return on the investment are certain and definite, and the company has the intentionand resources necessary to complete the development.The capitalized costs include the costs for materials, labor, and an adequate portion of overhead costs.They arerecognized at cost, net of accumulated amortization and depreciation (see below) and impairment losses.
iv. Other intangible fixed assets. These are identifiable non-monetary intangible assets under the control ofthe company and capable of causing the company to realize future economic benefits.They are initially recognized at their purchase cost, including expenses that are directly attributable to them dur-ing preparation of the asset for its intended purpose or production, if the conditions for capitalization of expens-es incurred for internally generated expenses are satisfied.The cost method is used for determining the value reported on subsequent statements, which entails posting theasset at its cost net of accumulated amortization and write-downs for impairment losses.
v. Subsequent capitalization.The costs incurred for these intangible fixed assets after purchase are capitalizedonly to the extent that they increase the future economic benefits of the specific asset they refer to.All the othercosts are charged to the profit and loss account in the fiscal year in which they are incurred.
vi. Amortization. Intangible fixed assets (excluding those with an indefinite useful life) are amortized on a straight-line basis over the period of their estimated useful life, starting from the time the assets are available for use.
113 Supplementary Notes
3.4 Tangible fixed assets.i. Property, plant, and equipment owned by the company. They are first recognized at their purchase costor at the cost recalculated at the date of transition to IFRS, including any directly attributable ancillary expenses.Following first-time recognition, these assets are reported net of their accumulated depreciation and impairmentlosses (i.e. in accordance with the cost model).For those assets whose depreciation must be calculated using the component approach, the portions of cost al-locable to the individual significant components characterized by a different useful life are determined. In this case,the value of land and buildings is kept separate, with only buildings being depreciated.
ii. Leasing.Lease agreements in which the Company assumes all the risks and benefits deriving from ownershipof the asset are classified as finance leasing.The assets (real estate, plant and machinery) possessed pursuant tothese agreements are recorded under property, plant and equipment at the lesser of their fair value on the datethe agreement was made and the current value of the minimum payments owed for leasing, net of accumulateddepreciation and any impairment losses (according to the rules described in the section Impairment losses). Afinancial payable for the same amount is recognized instead under liabilities, while the component of interestexpenses for finance leasing payments is reported on the profit and loss account according to the effective interestmethod.
iii. Subsequent capitalizations. The costs incurred for property, plant and equipment after purchase arecapitalized only to the extent that they increase the future economic benefits of the asset.All the other costs arecharged to the profit and loss account in the fiscal year in which they are incurred.
iv. Real estate investments. Real estate investments are originally recognized at cost and then recognized attheir cost as adjusted for accumulated depreciation and impairment losses.Depreciation is calculated on a systematic, straight-line basis according to the estimated useful life of the buildings.
v. Depreciation. Property, plant and equipment were systematically depreciated at a steady rate according tothe depreciation schedules defined on the basis of their estimated useful life. Land is not depreciated.The principaldepreciation rates applied are as follows:
% depreciation
Industrial buildings 3%
Machinery and plant 12.5%
Equipments 25%
Forms and punches, clichés, molds and stamp 25%
Furniture and furnishings 12%
Office machines 20%
Car and transport vehicles 20%-25%
The photovoltaic plant recognised by the parent company in 2011 is depreciated over a period of 20 years.Thecosts for leasehold improvements, which mainly include the costs incurred for set up and modernization of theDOS network and all the other real estate that is not owned but used by the company (and thus instrumental toits activity) are depreciated according to the term of the lease agreement or the useful life of the asset, if this isshorter.
3.5 Impairment losses. In the presence of indicators, events, or changes in circumstances that presume theexistence of impairment losses, IAS 36 envisages subjecting intangible fixed assets and property, plant and equipmentto the impairment test in order to assure that assets with a value higher than the recoverable value are notrecognized on the financial statements.As previously mentioned, this test is performed at least once annually for fixed assets with an indefinite useful life,and likewise for fixed assets that are not yet in use.
S.p.A.2011Annual Report
114 Supplementary Notes
S.p.A.2011Annual Report
Confirmation of the recoverability of the values recognized on the balance sheet is obtained by comparing thebook value at the reference date and the fair value net of sale costs (if available) or usage value.The usage valueof a tangible or intangible fixed asset is determined according to the estimated future financial flows expected fromthe asset, as actualized through use of a discount rate net of taxes, which reflects the current market value of thecurrent value of the cash and risks related to the Group activity, as well as the cash flows deriving from disposalof the asset at the end of its useful life.If it is not possible to estimate an independent financial flow for an individual asset, the cash generating unit towhich the asset belongs and with which it is possible to associate future cash flows that can be objectively deter-mined and independent from those generated by other operating units is identified. Identification of the cash gen-erating units was carried out consistently with the organizational and operating architecture of the Company.If the impairment test reveals an impairment loss for an asset, its book value is reduced to the recoverable valueby posting a charge on the profit and loss account, unless the asset is revalued. In that case, the write-down is rec-ognized in the revaluation reserve.When the reasons for a write-down cease to exist, the book value of the asset (or the cash generating unit), withthe exception of goodwill, is increased to the new value resulting from the estimate of its recoverable value, butnot beyond the net book value that the asset would have had if the impairment loss had not been charged.Therestored value is recognized immediately on the profit and loss account, unless the asset is revalued, in which casethe restored value is recognized in the revaluation reserve.
3.6 Investments in subsidiaries and associated companies. The investments in subsidiaries, joint venturesand associated companies that are not classified as held for sale in compliance with IFRS 5 are recognised at theirhistoric cost.The value recognised on the financial statements is periodically subjected to the impairment test, asenvisaged by IAS 36, and adjusted for any impairment losses.
3.7 Current assets.i. Financial assets. These are recognized and cancelled on the balance sheet according to the trading date andare initially valued at cost, including costs directly connected with the purchase.At the subsequent financial statement dates, the financial assets that the company intends and is able to hold un-til maturity (securities held until maturity) are recognized at the cost amortized according to the effective inter-est method, net of impairment losses.Financial assets other than those held until maturity are classified as held for trading or available for sale, and arerecognized at their fair value at the end of each period.When the financial assets are held for trading, the profitsand losses deriving from changes in the fair value are recognized on the profit and loss account for the period. Inthe case of financial assets available for sale, the profits and losses deriving from changes in the fair value are rec-ognized directly in shareholders’ equity until they are sold or have sustained a loss in value.At that time, the ag-gregate profits or losses that were previously recognized in shareholders’ equity are recognized on the profit andloss account of the period.
ii. Inventories. These are recognized at the lower of purchase cost and their assumed disposal value.The netdisposal value represents the best estimate of the net sales price that can be realized through ordinary businessprocesses, net of any production costs not yet incurred and direct sales costs.The cost of inventories is based on the weighted average cost method.The production cost is determined by in-cluding all costs that are directly allocable to the products, regarding – for work in progress and/or semi-finishedproducts – the specific stage of the process that has been reached.The values that are thus obtained do not dif-fer appreciably from the current production costs referring to the same classes of assets.A special depreciation reserve is set aside for the portion of inventories that are no longer considered econom-ically useable, or with a presumed disposal value that is less than the cost recognized on the financial statements.
iii. Trade receivables and other receivables. These are valued and recognized on a prudent basis accordingto their presumed disposal value, by means of adjusting the face value with a specific allowance for doubtfulaccounts determined as follows:
115 Supplementary Notes
• receivables under litigation,with certain and precise evidence documenting the impossibility of collecting them,have been analytically identified and then written down;
• for other bad debts, prudent allowances for write-downs have been set aside, estimated on the basis ofinformation updated at the date of this document.
iv. Cash.This includes cash on hand, bank demand deposits, and financial investments with a maturity of no morethan three months.These assets are highly liquid, easily convertible into cash, and subject to a negligible risk ofchange in value.
3.8 Employee benefits.i Defined contribution plans.The payments for eventual defined contribution plans are charged to the profitand loss account in the period that they are owed.
ii. Defined benefit plans. For defined benefit plans, the cost is determined by using the projected unit creditmethod, carrying out actuarial valuations at the end of every fiscal year.The accumulated actuarial profits andlosses not recognized at the beginning of the fiscal year are recognized only to the extent that they exceed 10%of the greater between the current volume of defined benefit plan liabilities and the fair value of the assets of theprogram at that date.The cost of past work services is recognized immediately in the amount in which the benefitshave already accrued or is otherwise amortized at a constant rate by the average period in which it is expectedthat the benefits will accrue.The liabilities for benefits paid out after termination of the employment relationship reported on the financialstatements represent the current value of liabilities for defined benefit plans adjusted to take into account the ac-tuarial profits and losses that were not recognized and the costs for past work services that were not recognizedand reduced by the fair value of the program assets.Any net assets resulting from this calculation are limited tothe value of the unreported actuarial losses and the cost for the past work services that were not recognized,plus the current value of any reimbursements and reductions in the future contributions to the plan.
iii. Share based payments.The payments based on shares are assessed at their fair value on the assignment date.This value is recognized on the profit and loss account on a straight-line basis throughout the period of accrualof the rights.This allocation is made on the basis of a management estimate of the stock options that will actuallyaccrue in favor of vested employees, considering the conditions for use thereof not based on their market value.The fair value is determined by using the binomial method.
3.9 Payables.i. Bank overdrafts and financing. Interest-bearing financing and bank overdrafts are recognized on the basisof the amounts collected, net of transaction costs, and subsequently valued at the amortized cost, using the effectiveinterest method.
ii. Trade payables and other payables. They are recognized at their face value.
3.10 Revenues recognition. Revenues are recognized on the profit and loss account when the significantrisks and benefits connected with ownership of the transferred assets are transferred to the buyer. In referenceto the principal types realized by the company, revenues are recognized on the basis of the following principles:a. Sales of goods - retail.The company operates in the retail channel through its DOS network. Revenues are
recognised when the goods are delivered to customers. Sales are usually collected in the form of cash orthrough credit cards;
b. Sales of goods - wholesale.The company distributes products on the wholesale market.These revenues arerecognised when the goods are shipped and considering the estimated effects of returns at the end of the year;
c. Provision of services.This income is recognised in proportion to the percentage of completion for the serviceprovided on the reference date;
d. Royalties.These are recognised on the financial statements according to the principle of period allocation.
S.p.A.2011Annual Report
3.11 Financial income and expenses. These include all financial items recognized on the profit and lossaccount for the period, including interest expenses accrued on financial payables calculated by using the effectiveinterest method (mainly current account overdrafts, medium-long term financing), foreign exchange gains andlosses, gains and losses on derivative financial instruments (according to the previously defined accountingprinciples), received dividends, the portion of interest expenses deriving from accounting treatment of assets heldunder finance leasing (IAS 17) and employee reserves (IAS 19).Interest income and expenses are recognized on the profit and loss account for the period in which they are re-alized/incurred, with the exception of capitalized expenses (IAS 23).Dividend income contributes to the result for the period in which the company accrues the right to receive thepayment.
3.12 Income taxes. The income taxes for the period include determination both of current taxes anddeferred taxes.They are recognized entirely on the profit and loss account and included in the result for theperiod, unless they are generated by transactions recognized directly to shareholders’ equity during the currentor another period. In this case, the relative deferred tax liabilities are also recognized under shareholders’equity.Current taxes on taxable income for the period represent the tax burden determined by using the tax rates ineffect at the reference date, and any adjustments to the tax payables calculated during previous periods.Deferred tax liabilities refer to the temporary differences between the book values of assets and liabilities on thebalance and the associated values relevant for determination of taxable income.The tax liability of all temporarytaxable differences,with the exception of liabilities deriving from initial recognition of an asset or liability in a trans-action other than a business combination that, at the time of the transaction, does not influence either the income(loss) reported on the financial statements or taxable income (tax loss).Deferred tax assets that derive from temporary deductible differences are recognized on the financial statementsonly to the extent that it is likely taxable income will be realized for which the temporary deductible differencecan be used. No allocation is envisaged if the deferred tax asset derives from business combinations, or from theinitial posting of an asset or liability in a transaction other than a business combination that, at the time of the trans-action, does not influence either the income (loss) reported on the financial statements or taxable income (taxloss).The tax benefits resulting from tax losses are recognized on the financial statements of the period in which thebenefits accrued, if it is likely that taxable income will be realized and for which the tax loss can be used.The taxes in question (deferred tax assets and liabilities) are determined on the basis of a forecast of the assumedpercentage weight of the taxes on the income of the fiscal years in which the taxes will occur, taking into accountthe specific nature of taxability and deductibility.The effect of change in tax rates is recognized on the profit andloss account of the fiscal year in which this change takes place.
3.13 Provisions. These are certain or probable liabilities that have not been determined at the date theyoccurred and in the amount of the economic resources to be used for fulfilling the obligation, but which cannonetheless be reliably estimated.They are recognized on the balance sheet in the event of an existing obligationresulting from a past event, and it is likely that the company will be asked to satisfy the obligation.If the effect is significant, and the date of the presumed discharge of the obligation can be estimated with sufficientreliability, the provisions are recognized on the balance sheet by actualizing future financial flows.The provisions that can be reasonably expected to be discharged twelve months after the reference date are clas-sified on the financial statements under non-current liabilities. Instead, the provisions for which the use of resourcescapable of generating economic benefits is expected to take place in less than twelve months after the referencedate are recognized as current liabilities.
3.14 Share capital.i. Share capital. The total value of shares issued by the parent company is recognized entirely undershareholders’ equity, as they are the instruments representing its capital.
116 Supplementary Notes
S.p.A.2011Annual Report
117 Supplementary Notes
ii. Treasury stock. The consideration paid for buy-back of share capital (treasury stock), including theexpenses directly related to the transaction, is subtracted from shareholders’ equity. In particular, the par valueof the shares reduces the share capital, while the excess value is recognized as an adjustment to additional paid-in capital.
iii. Dividends. The allocation of dividends to persons possessing instruments representing share capital afterthe reference date of the financial statement is not recognized under financial liabilities on the same referencedate.
3.15 Statement of cash flows. The statement of cash flows is drafted using the indirect method.The netfinancial flows of operating activity are determined by adjusting the result for the period of the effects deriving fromchange to net operating working capital, non-monetary items and all the other effects connected with investmentand financing activities.Cash at the beginning and end of the period represents the net-short-term financial position.
4. Dividends
In execution of a resolution by the Shareholders’ Meeting of April 20th, 2011, the parent company TOD’S S.p.A.paid the shareholders dividends in May for the net income realised in 2010.The aggregate amount of the dividendspaid 61.2 million euros, at the rate of 2 euros for each of the 30,609,401 shares representing the share capital atthe coupon detachment date (May 23rd, 2011). Regarding the net profit for FY 2011, totalling 121,637,416.66, theBoard of Directors has proposed to distribute a dividend for 2.5 euros per share, totalling 76,523,502.50 euros.The dividend is subject to approval by the annual Shareholders’ Meeting in April 19th, 2012, and was not includedamong the liabilities reported on this balance sheet.
5. Earnings per share
The calculation of base and diluted earnings per share is based on the following:
i. Reference profit.
Euro 000’sFor continuing and discontinued operations Year 11 Year 10
Profit used to determine basic earning per share 121,637 82,974
Dilution effects - -
Profit used to determine basic earning per share 121,637 82,974
Euro/000For continuing operations Year 11 Year 10
Net profit of the year 121,637 82,974
Income (loss) from discontinued operations - -
Profit used to determine basic earning per share 121,637 82,974Dilution effects - -
Profit used to determine diluted earning per share 121,637 82,974
In both fiscal 2011 and 2010, there were no dilutions of net consolidated earnings, partly as a result of activitiesthat were discontinued during the periods in question.
S.p.A.2011Annual Report
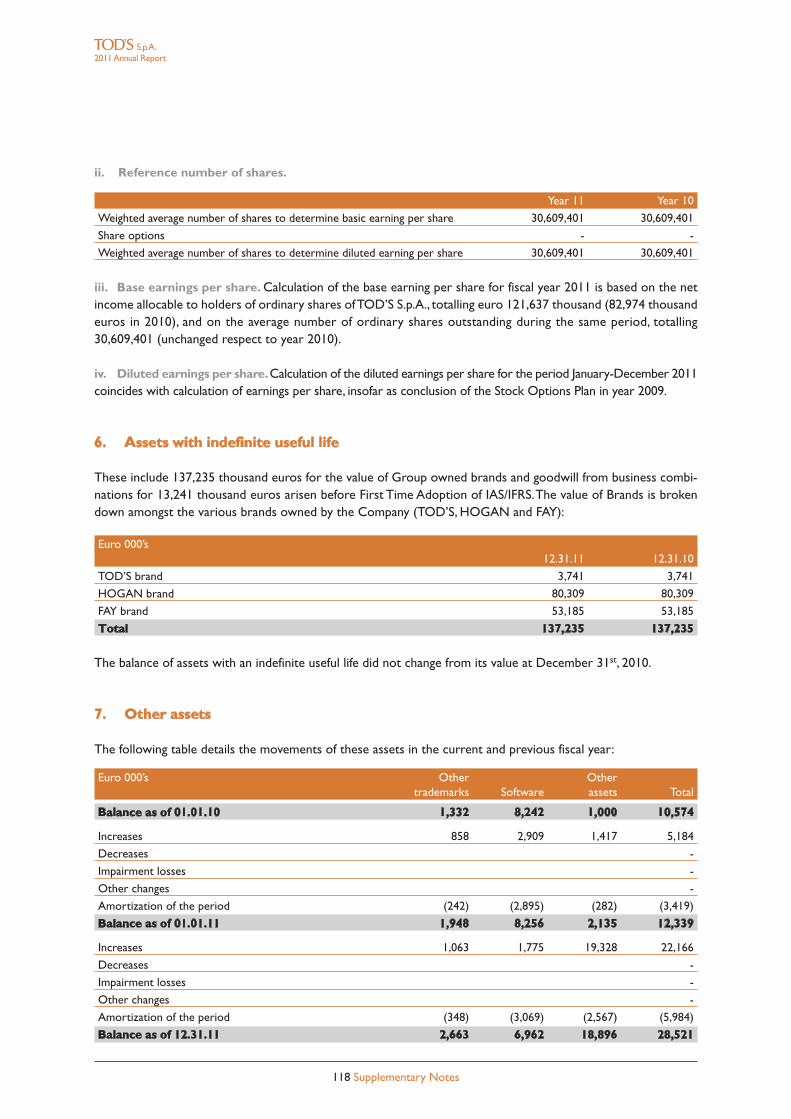
ii. Reference number of shares.
Year 11 Year 10
Weighted average number of shares to determine basic earning per share 30,609,401 30,609,401
Share options - -
Weighted average number of shares to determine diluted earning per share 30,609,401 30,609,401
iii. Base earnings per share. Calculation of the base earning per share for fiscal year 2011 is based on the netincome allocable to holders of ordinary shares ofTOD’S S.p.A., totalling euro 121,637 thousand (82,974 thousandeuros in 2010), and on the average number of ordinary shares outstanding during the same period, totalling30,609,401 (unchanged respect to year 2010).
iv. Diluted earnings per share.Calculation of the diluted earnings per share for the period January-December 2011coincides with calculation of earnings per share, insofar as conclusion of the Stock Options Plan in year 2009.
6. Assets with indefinite useful life
These include 137,235 thousand euros for the value of Group owned brands and goodwill from business combi-nations for 13,241 thousand euros arisen before First Time Adoption of IAS/IFRS.The value of Brands is brokendown amongst the various brands owned by the Company (TOD’S, HOGAN and FAY):
Euro 000’s12.31.11 12.31.10
TOD’S brand 3,741 3,741
HOGAN brand 80,309 80,309
FAY brand 53,185 53,185
Total 137,235 137,235
The balance of assets with an indefinite useful life did not change from its value at December 31st, 2010.
7. Other assets
The following table details the movements of these assets in the current and previous fiscal year:
Euro 000’s Other Othertrademarks Software assets Total
Balance as of 01.01.10 1,332 8,242 1,000 10,574
Increases 858 2,909 1,417 5,184
Decreases -
Impairment losses -
Other changes -
Amortization of the period (242) (2,895) (282) (3,419)
Balance as of 01.01.11 1,948 8,256 2,135 12,339
Increases 1,063 1,775 19,328 22,166
Decreases -
Impairment losses -
Other changes -
Amortization of the period (348) (3,069) (2,567) (5,984)
Balance as of 12.31.11 2,663 6,962 18,896 28,521
118 Supplementary Notes
S.p.A.2011Annual Report
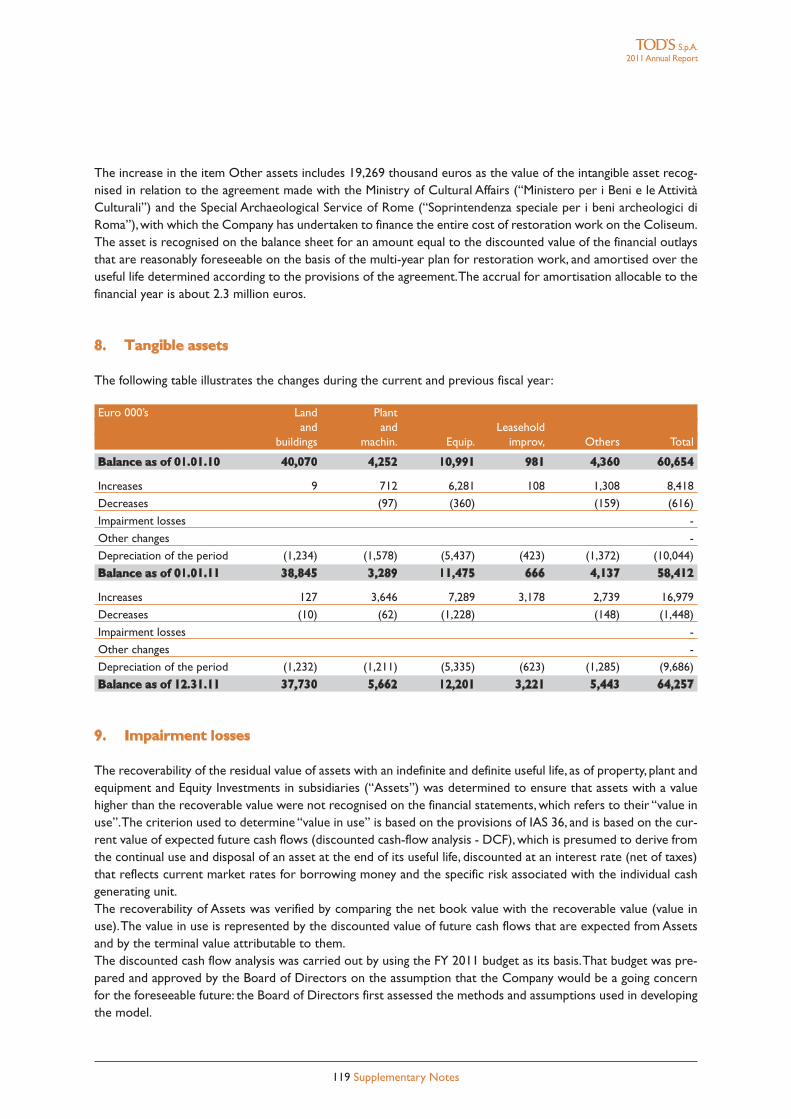
The increase in the item Other assets includes 19,269 thousand euros as the value of the intangible asset recog-nised in relation to the agreement made with the Ministry of Cultural Affairs (“Ministero per i Beni e le AttivitàCulturali”) and the Special Archaeological Service of Rome (“Soprintendenza speciale per i beni archeologici diRoma”),with which the Company has undertaken to finance the entire cost of restoration work on the Coliseum.The asset is recognised on the balance sheet for an amount equal to the discounted value of the financial outlaysthat are reasonably foreseeable on the basis of the multi-year plan for restoration work, and amortised over theuseful life determined according to the provisions of the agreement.The accrual for amortisation allocable to thefinancial year is about 2.3 million euros.
8. Tangible assets
The following table illustrates the changes during the current and previous fiscal year:
Euro 000’s Land Plantand and Leasehold
buildings machin. Equip. improv, Others Total
Balance as of 01.01.10 40,070 4,252 10,991 981 4,360 60,654
Increases 9 712 6,281 108 1,308 8,418
Decreases (97) (360) (159) (616)
Impairment losses -
Other changes -
Depreciation of the period (1,234) (1,578) (5,437) (423) (1,372) (10,044)
Balance as of 01.01.11 38,845 3,289 11,475 666 4,137 58,412
Increases 127 3,646 7,289 3,178 2,739 16,979
Decreases (10) (62) (1,228) (148) (1,448)
Impairment losses -
Other changes -
Depreciation of the period (1,232) (1,211) (5,335) (623) (1,285) (9,686)
Balance as of 12.31.11 37,730 5,662 12,201 3,221 5,443 64,257
9. Impairment losses
The recoverability of the residual value of assets with an indefinite and definite useful life, as of property, plant andequipment and Equity Investments in subsidiaries (“Assets”) was determined to ensure that assets with a valuehigher than the recoverable value were not recognised on the financial statements, which refers to their “value inuse”.The criterion used to determine “value in use” is based on the provisions of IAS 36, and is based on the cur-rent value of expected future cash flows (discounted cash-flow analysis - DCF), which is presumed to derive fromthe continual use and disposal of an asset at the end of its useful life, discounted at an interest rate (net of taxes)that reflects current market rates for borrowing money and the specific risk associated with the individual cashgenerating unit.The recoverability of Assets was verified by comparing the net book value with the recoverable value (value inuse).The value in use is represented by the discounted value of future cash flows that are expected from Assetsand by the terminal value attributable to them.The discounted cash flow analysis was carried out by using the FY 2011 budget as its basis.That budget was pre-pared and approved by the Board of Directors on the assumption that the Company would be a going concernfor the foreseeable future: the Board of Directors first assessed the methods and assumptions used in developingthe model.
119 Supplementary Notes
S.p.A.2011Annual Report
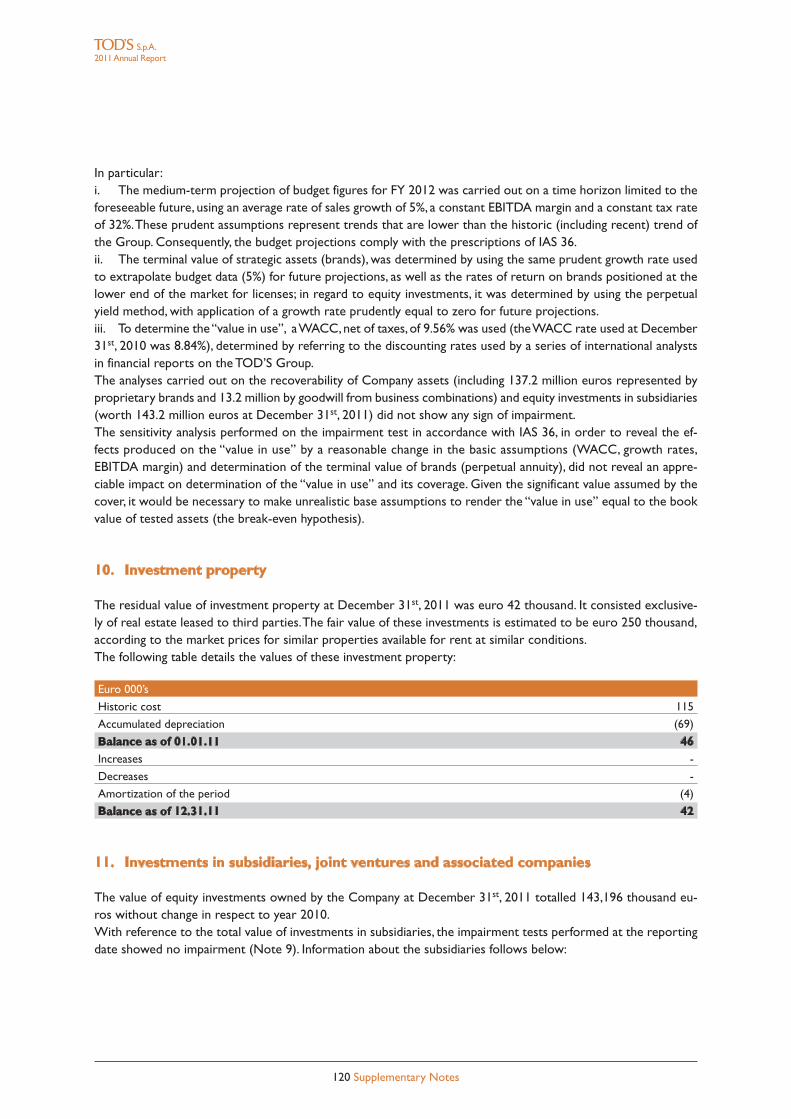
In particular:i. The medium-term projection of budget figures for FY 2012 was carried out on a time horizon limited to theforeseeable future, using an average rate of sales growth of 5%, a constant EBITDA margin and a constant tax rateof 32%.These prudent assumptions represent trends that are lower than the historic (including recent) trend ofthe Group. Consequently, the budget projections comply with the prescriptions of IAS 36.ii. The terminal value of strategic assets (brands), was determined by using the same prudent growth rate usedto extrapolate budget data (5%) for future projections, as well as the rates of return on brands positioned at thelower end of the market for licenses; in regard to equity investments, it was determined by using the perpetualyield method, with application of a growth rate prudently equal to zero for future projections.iii. To determine the“value in use”, aWACC,net of taxes, of 9.56% was used (theWACC rate used at December31st, 2010 was 8.84%), determined by referring to the discounting rates used by a series of international analystsin financial reports on the TOD’S Group.The analyses carried out on the recoverability of Company assets (including 137.2 million euros represented byproprietary brands and 13.2 million by goodwill from business combinations) and equity investments in subsidiaries(worth 143.2 million euros at December 31st, 2011) did not show any sign of impairment.The sensitivity analysis performed on the impairment test in accordance with IAS 36, in order to reveal the ef-fects produced on the “value in use” by a reasonable change in the basic assumptions (WACC, growth rates,EBITDA margin) and determination of the terminal value of brands (perpetual annuity), did not reveal an appre-ciable impact on determination of the “value in use” and its coverage. Given the significant value assumed by thecover, it would be necessary to make unrealistic base assumptions to render the “value in use” equal to the bookvalue of tested assets (the break-even hypothesis).
10. Investment property
The residual value of investment property at December 31st, 2011 was euro 42 thousand. It consisted exclusive-ly of real estate leased to third parties.The fair value of these investments is estimated to be euro 250 thousand,according to the market prices for similar properties available for rent at similar conditions.The following table details the values of these investment property:
Euro 000’s
Historic cost 115
Accumulated depreciation (69)
Balance as of 01.01.11 46Increases -
Decreases -
Amortization of the period (4)
Balance as of 12.31.11 42
11. Investments in subsidiaries, joint ventures and associated companies
The value of equity investments owned by the Company at December 31st, 2011 totalled 143,196 thousand eu-ros without change in respect to year 2010.With reference to the total value of investments in subsidiaries, the impairment tests performed at the reportingdate showed no impairment (Note 9). Information about the subsidiaries follows below:
120 Supplementary Notes
S.p.A.2011Annual Report
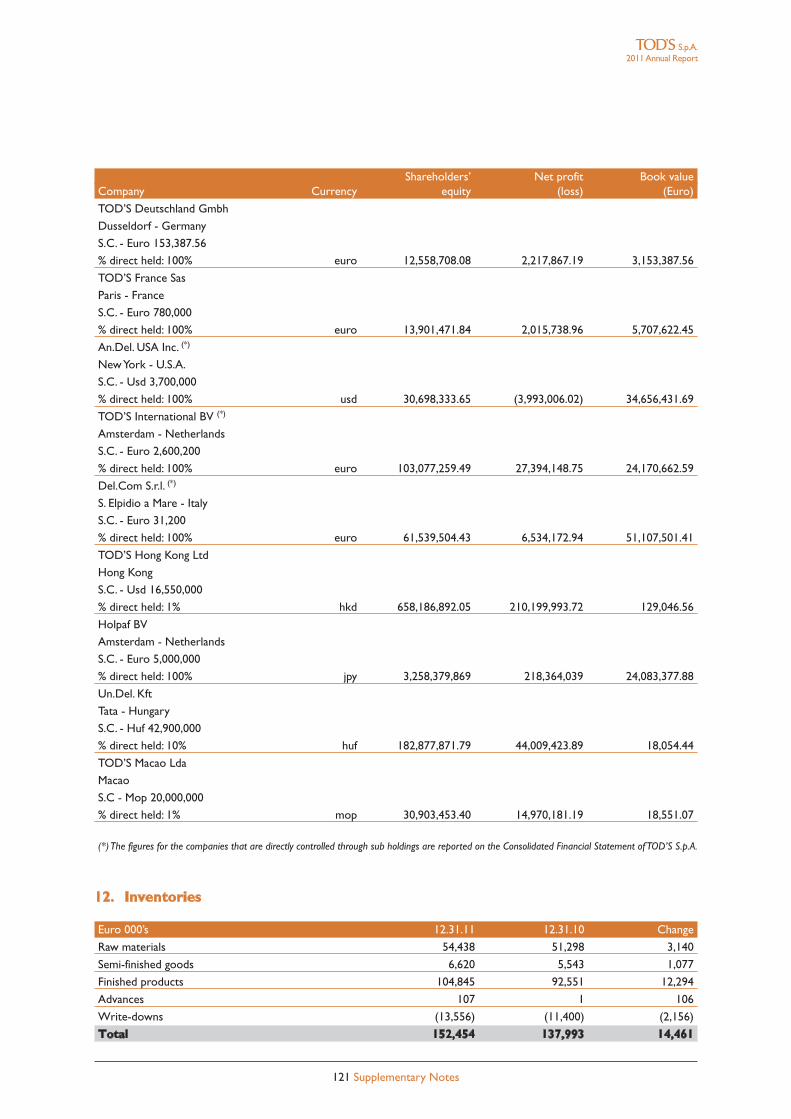
Shareholders’ Net profit Book valueCompany Currency equity (loss) (Euro)
TOD’S Deutschland GmbhDusseldorf - GermanyS.C. - Euro 153,387.56% direct held: 100% euro 12,558,708.08 2,217,867.19 3,153,387.56
TOD’S France SasParis - FranceS.C. - Euro 780,000% direct held: 100% euro 13,901,471.84 2,015,738.96 5,707,622.45
An.Del. USA Inc. (*)
NewYork - U.S.A.S.C. - Usd 3,700,000% direct held: 100% usd 30,698,333.65 (3,993,006.02) 34,656,431.69
TOD’S International BV (*)
Amsterdam - NetherlandsS.C. - Euro 2,600,200% direct held: 100% euro 103,077,259.49 27,394,148.75 24,170,662.59
Del.Com S.r.l. (*)
S. Elpidio a Mare - ItalyS.C. - Euro 31,200% direct held: 100% euro 61,539,504.43 6,534,172.94 51,107,501.41
TOD’S Hong Kong LtdHong KongS.C. - Usd 16,550,000% direct held: 1% hkd 658,186,892.05 210,199,993.72 129,046.56
Holpaf BVAmsterdam - NetherlandsS.C. - Euro 5,000,000% direct held: 100% jpy 3,258,379,869 218,364,039 24,083,377.88
Un.Del. KftTata - HungaryS.C. - Huf 42,900,000% direct held: 10% huf 182,877,871.79 44,009,423.89 18,054.44
TOD’S Macao LdaMacaoS.C - Mop 20,000,000% direct held: 1% mop 30,903,453.40 14,970,181.19 18,551.07
(*)The figures for the companies that are directly controlled through sub holdings are reported on the Consolidated Financial Statement ofTOD’S S.p.A.
12. Inventories
Euro 000’s 12.31.11 12.31.10 Change
Raw materials 54,438 51,298 3,140
Semi-finished goods 6,620 5,543 1,077
Finished products 104,845 92,551 12,294
Advances 107 1 106
Write-downs (13,556) (11,400) (2,156)
Total 152,454 137,993 14,461
121 Supplementary Notes
S.p.A.2011Annual Report
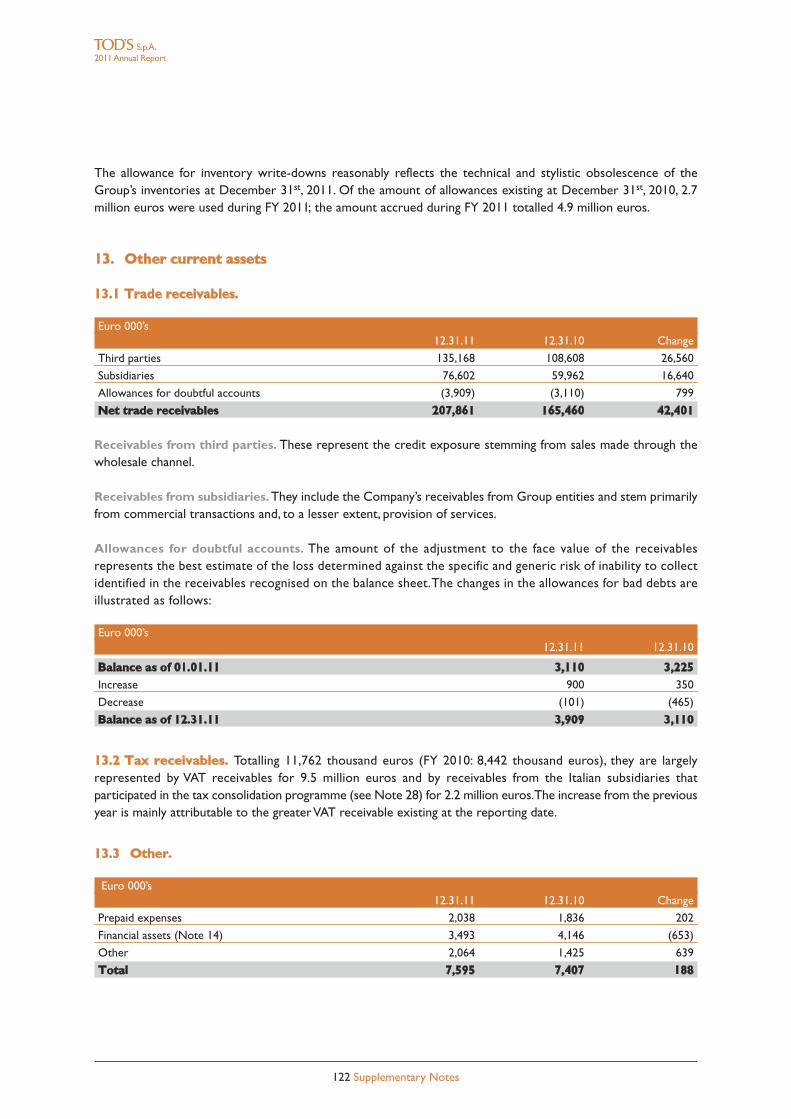
The allowance for inventory write-downs reasonably reflects the technical and stylistic obsolescence of theGroup’s inventories at December 31st, 2011. Of the amount of allowances existing at December 31st, 2010, 2.7million euros were used during FY 2011; the amount accrued during FY 2011 totalled 4.9 million euros.
13. Other current assets
13.1 Trade receivables.
Euro 000’s12.31.11 12.31.10 Change
Third parties 135,168 108,608 26,560
Subsidiaries 76,602 59,962 16,640
Allowances for doubtful accounts (3,909) (3,110) 799
Net trade receivables 207,861 165,460 42,401
Receivables from third parties. These represent the credit exposure stemming from sales made through thewholesale channel.
Receivables from subsidiaries. They include the Company’s receivables from Group entities and stem primarilyfrom commercial transactions and, to a lesser extent, provision of services.
Allowances for doubtful accounts. The amount of the adjustment to the face value of the receivablesrepresents the best estimate of the loss determined against the specific and generic risk of inability to collectidentified in the receivables recognised on the balance sheet.The changes in the allowances for bad debts areillustrated as follows:
Euro 000’s12.31.11 12.31.10
Balance as of 01.01.11 3,110 3,225Increase 900 350
Decrease (101) (465)
Balance as of 12.31.11 3,909 3,110
13.2 Tax receivables. Totalling 11,762 thousand euros (FY 2010: 8,442 thousand euros), they are largelyrepresented by VAT receivables for 9.5 million euros and by receivables from the Italian subsidiaries thatparticipated in the tax consolidation programme (see Note 28) for 2.2 million euros.The increase from the previousyear is mainly attributable to the greaterVAT receivable existing at the reporting date.
13.3 Other.
Euro 000’s12.31.11 12.31.10 Change
Prepaid expenses 2,038 1,836 202
Financial assets (Note 14) 3,493 4,146 (653)
Other 2,064 1,425 639
Total 7,595 7,407 188
122 Supplementary Notes
S.p.A.2011Annual Report
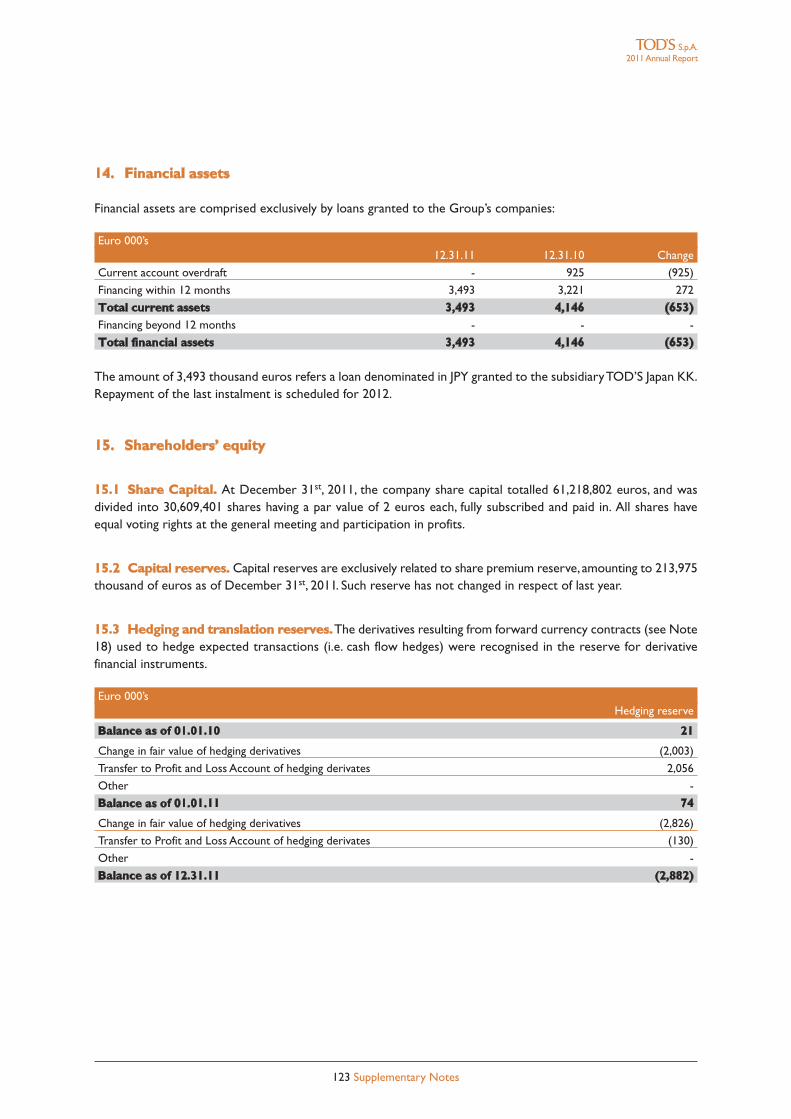
14. Financial assets
Financial assets are comprised exclusively by loans granted to the Group’s companies:
Euro 000’s12.31.11 12.31.10 Change
Current account overdraft - 925 (925)
Financing within 12 months 3,493 3,221 272
Total current assets 3,493 4,146 (653)Financing beyond 12 months - - -
Total financial assets 3,493 4,146 (653)
The amount of 3,493 thousand euros refers a loan denominated in JPY granted to the subsidiaryTOD’S Japan KK.Repayment of the last instalment is scheduled for 2012.
15. Shareholders’ equity
15.1 Share Capital. At December 31st, 2011, the company share capital totalled 61,218,802 euros, and wasdivided into 30,609,401 shares having a par value of 2 euros each, fully subscribed and paid in. All shares haveequal voting rights at the general meeting and participation in profits.
15.2 Capital reserves. Capital reserves are exclusively related to share premium reserve, amounting to 213,975thousand of euros as of December 31st, 2011. Such reserve has not changed in respect of last year.
15.3 Hedging and translation reserves.The derivatives resulting from forward currency contracts (see Note18) used to hedge expected transactions (i.e. cash flow hedges) were recognised in the reserve for derivativefinancial instruments.
Euro 000’sHedging reserve
Balance as of 01.01.10 21
Change in fair value of hedging derivatives (2,003)
Transfer to Profit and Loss Account of hedging derivates 2,056
Other -
Balance as of 01.01.11 74
Change in fair value of hedging derivatives (2,826)
Transfer to Profit and Loss Account of hedging derivates (130)
Other -
Balance as of 12.31.11 (2,882)
123 Supplementary Notes
S.p.A.2011Annual Report
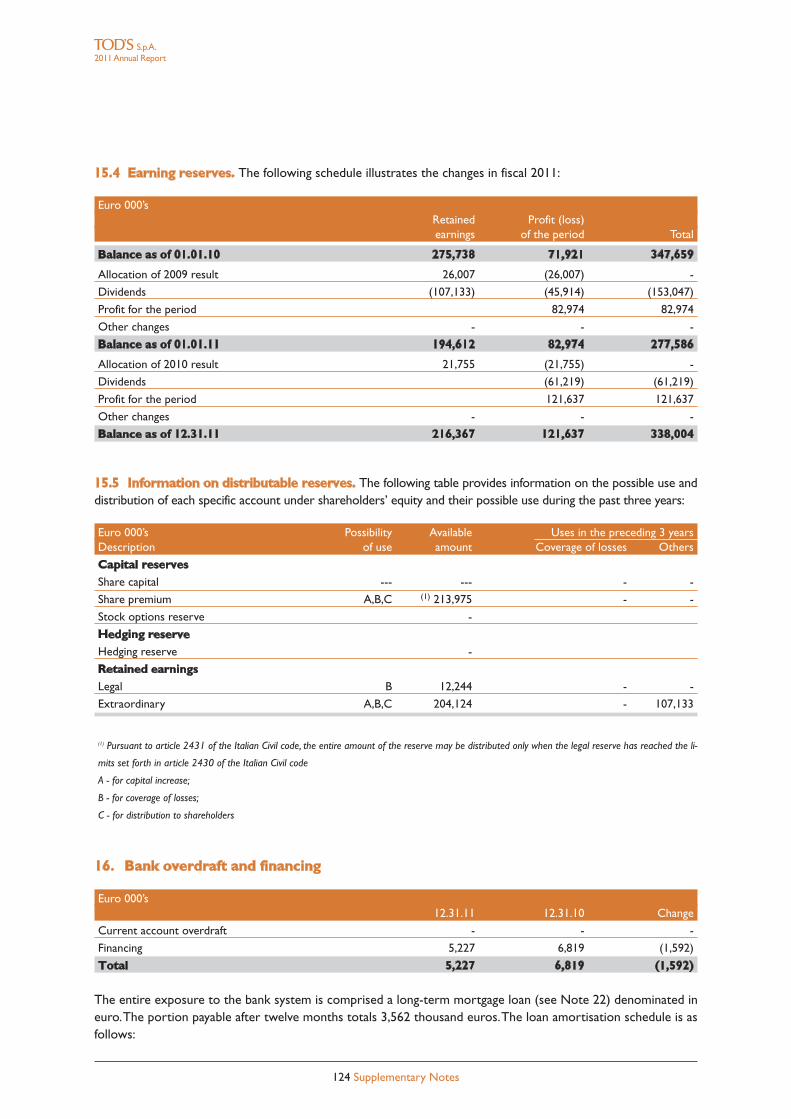
15.4 Earning reserves. The following schedule illustrates the changes in fiscal 2011:
Euro 000’sRetained Profit (loss)earnings of the period Total
Balance as of 01.01.10 275,738 71,921 347,659
Allocation of 2009 result 26,007 (26,007) -
Dividends (107,133) (45,914) (153,047)
Profit for the period 82,974 82,974
Other changes - - -
Balance as of 01.01.11 194,612 82,974 277,586
Allocation of 2010 result 21,755 (21,755) -
Dividends (61,219) (61,219)
Profit for the period 121,637 121,637
Other changes - - -
Balance as of 12.31.11 216,367 121,637 338,004
15.5 Information on distributable reserves. The following table provides information on the possible use anddistribution of each specific account under shareholders’ equity and their possible use during the past three years:
Euro 000’s Possibility Available Uses in the preceding 3 yearsDescription of use amount Coverage of losses Others
Capital reservesShare capital --- --- - -
Share premium A,B,C (1) 213,975 - -
Stock options reserve -
Hedging reserveHedging reserve -
Retained earningsLegal B 12,244 - -
Extraordinary A,B,C 204,124 - 107,133
(1) Pursuant to article 2431 of the Italian Civil code, the entire amount of the reserve may be distributed only when the legal reserve has reached the li-
mits set forth in article 2430 of the Italian Civil code
A - for capital increase;
B - for coverage of losses;
C - for distribution to shareholders
16. Bank overdraft and financing
Euro 000’s12.31.11 12.31.10 Change
Current account overdraft - - -
Financing 5,227 6,819 (1,592)
Total 5,227 6,819 (1,592)
The entire exposure to the bank system is comprised a long-term mortgage loan (see Note 22) denominated ineuro.The portion payable after twelve months totals 3,562 thousand euros.The loan amortisation schedule is asfollows:
124 Supplementary Notes
S.p.A.2011Annual Report
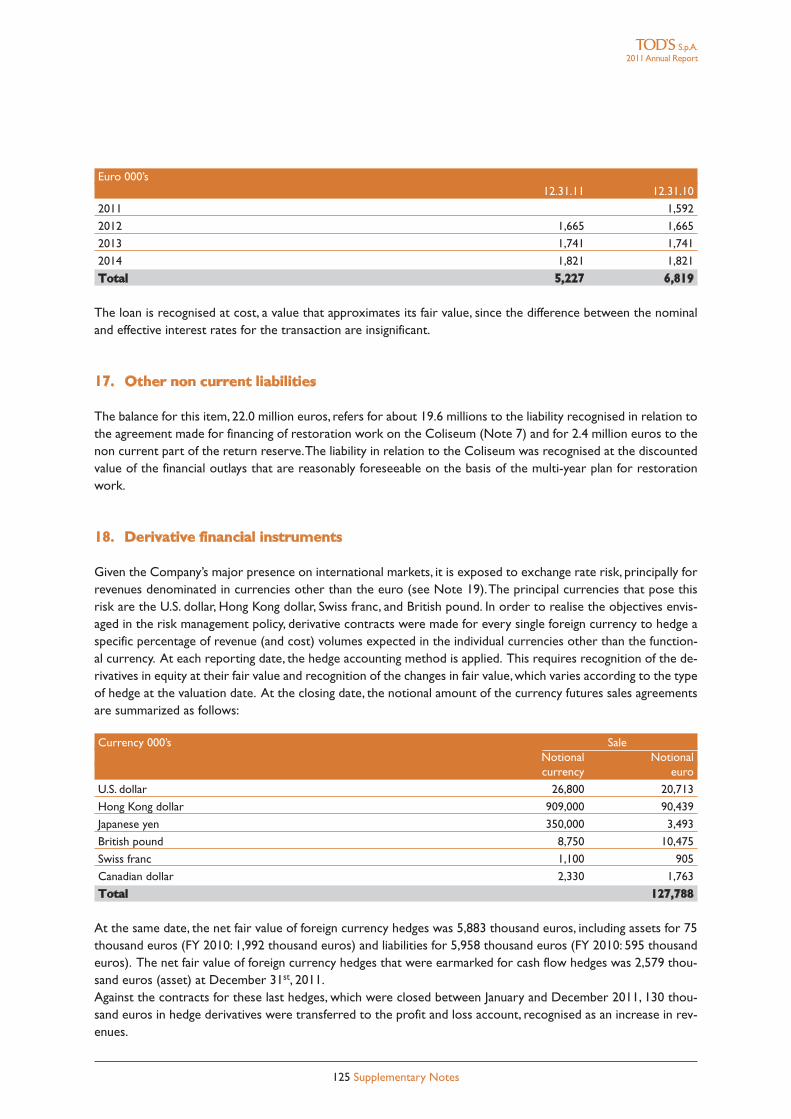
Euro 000’s12.31.11 12.31.10
2011 1,592
2012 1,665 1,665
2013 1,741 1,741
2014 1,821 1,821
Total 5,227 6,819
The loan is recognised at cost, a value that approximates its fair value, since the difference between the nominaland effective interest rates for the transaction are insignificant.
17. Other non current liabilities
The balance for this item, 22.0 million euros, refers for about 19.6 millions to the liability recognised in relation tothe agreement made for financing of restoration work on the Coliseum (Note 7) and for 2.4 million euros to thenon current part of the return reserve.The liability in relation to the Coliseum was recognised at the discountedvalue of the financial outlays that are reasonably foreseeable on the basis of the multi-year plan for restorationwork.
18. Derivative financial instruments
Given the Company’s major presence on international markets, it is exposed to exchange rate risk, principally forrevenues denominated in currencies other than the euro (see Note 19).The principal currencies that pose thisrisk are the U.S. dollar, Hong Kong dollar, Swiss franc, and British pound. In order to realise the objectives envis-aged in the risk management policy, derivative contracts were made for every single foreign currency to hedge aspecific percentage of revenue (and cost) volumes expected in the individual currencies other than the function-al currency. At each reporting date, the hedge accounting method is applied. This requires recognition of the de-rivatives in equity at their fair value and recognition of the changes in fair value,which varies according to the typeof hedge at the valuation date. At the closing date, the notional amount of the currency futures sales agreementsare summarized as follows:
Currency 000’s SaleNotional Notionalcurrency euro
U.S. dollar 26,800 20,713
Hong Kong dollar 909,000 90,439
Japanese yen 350,000 3,493
British pound 8,750 10,475
Swiss franc 1,100 905
Canadian dollar 2,330 1,763
Total 127,788
At the same date, the net fair value of foreign currency hedges was 5,883 thousand euros, including assets for 75thousand euros (FY 2010: 1,992 thousand euros) and liabilities for 5,958 thousand euros (FY 2010: 595 thousandeuros). The net fair value of foreign currency hedges that were earmarked for cash flow hedges was 2,579 thou-sand euros (asset) at December 31st, 2011.Against the contracts for these last hedges, which were closed between January and December 2011, 130 thou-sand euros in hedge derivatives were transferred to the profit and loss account, recognised as an increase in rev-enues.
125 Supplementary Notes
S.p.A.2011Annual Report
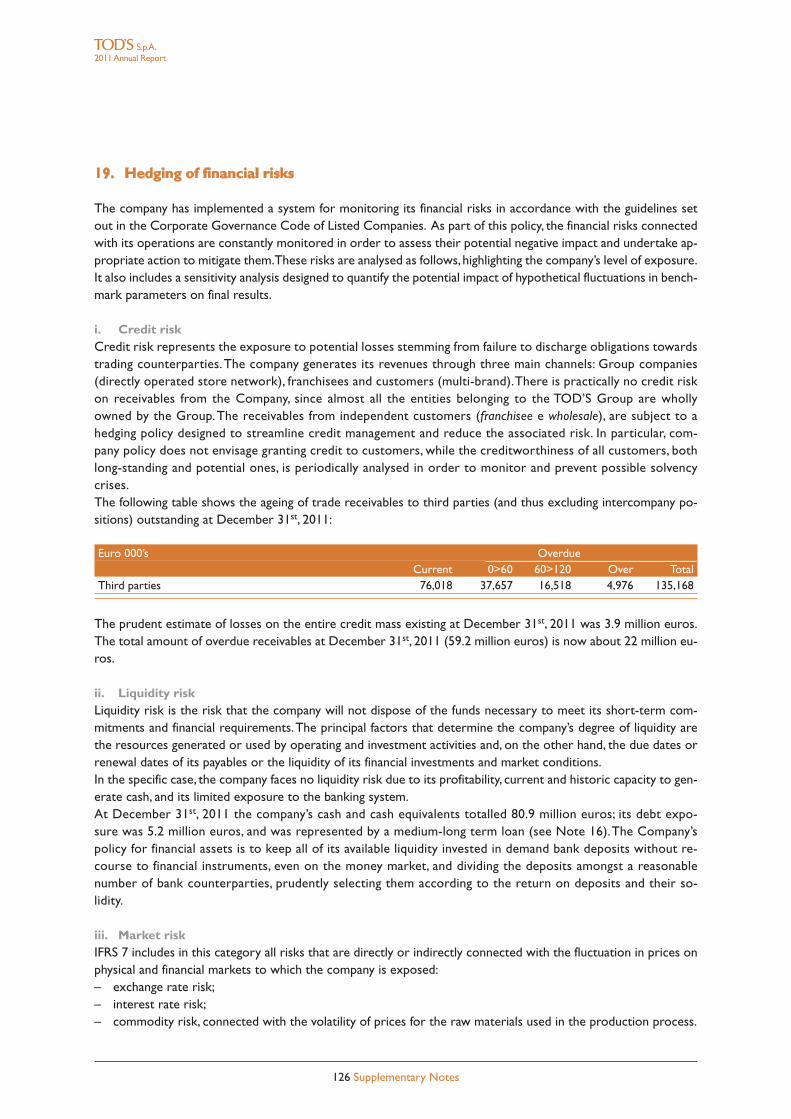
19. Hedging of financial risks
The company has implemented a system for monitoring its financial risks in accordance with the guidelines setout in the Corporate Governance Code of Listed Companies. As part of this policy, the financial risks connectedwith its operations are constantly monitored in order to assess their potential negative impact and undertake ap-propriate action to mitigate them.These risks are analysed as follows,highlighting the company’s level of exposure.It also includes a sensitivity analysis designed to quantify the potential impact of hypothetical fluctuations in bench-mark parameters on final results.
i. Credit riskCredit risk represents the exposure to potential losses stemming from failure to discharge obligations towardstrading counterparties.The company generates its revenues through three main channels: Group companies(directly operated store network), franchisees and customers (multi-brand).There is practically no credit riskon receivables from the Company, since almost all the entities belonging to the TOD’S Group are whollyowned by the Group.The receivables from independent customers (franchisee e wholesale), are subject to ahedging policy designed to streamline credit management and reduce the associated risk. In particular, com-pany policy does not envisage granting credit to customers, while the creditworthiness of all customers, bothlong-standing and potential ones, is periodically analysed in order to monitor and prevent possible solvencycrises.The following table shows the ageing of trade receivables to third parties (and thus excluding intercompany po-sitions) outstanding at December 31st, 2011:
Euro 000’s OverdueCurrent 0>60 60>120 Over Total
Third parties 76,018 37,657 16,518 4,976 135,168
The prudent estimate of losses on the entire credit mass existing at December 31st, 2011 was 3.9 million euros.The total amount of overdue receivables at December 31st, 2011 (59.2 million euros) is now about 22 million eu-ros.
ii. Liquidity riskLiquidity risk is the risk that the company will not dispose of the funds necessary to meet its short-term com-mitments and financial requirements.The principal factors that determine the company’s degree of liquidity arethe resources generated or used by operating and investment activities and, on the other hand, the due dates orrenewal dates of its payables or the liquidity of its financial investments and market conditions.In the specific case, the company faces no liquidity risk due to its profitability, current and historic capacity to gen-erate cash, and its limited exposure to the banking system.At December 31st, 2011 the company’s cash and cash equivalents totalled 80.9 million euros; its debt expo-sure was 5.2 million euros, and was represented by a medium-long term loan (see Note 16).The Company’spolicy for financial assets is to keep all of its available liquidity invested in demand bank deposits without re-course to financial instruments, even on the money market, and dividing the deposits amongst a reasonablenumber of bank counterparties, prudently selecting them according to the return on deposits and their so-lidity.
iii. Market riskIFRS 7 includes in this category all risks that are directly or indirectly connected with the fluctuation in prices onphysical and financial markets to which the company is exposed:– exchange rate risk;– interest rate risk;– commodity risk, connected with the volatility of prices for the raw materials used in the production process.
126 Supplementary Notes
S.p.A.2011Annual Report
The company is exposed to exchange rate and interest rate risk, since there is no physical market subject to ac-tual fluctuations in the purchase prices for raw materials used in the production process.The following paragraphs analyse the individual risks, using sensitivity analysis as necessary to highlight the poten-tial risk on final results stemming from hypothetical fluctuations in benchmark parameters.As envisaged by IFRS7, these analyses are based on simplified scenarios applied to the final results for the periods referred to. By theirvery nature, they cannot be considered indicators of the actual effects of future changes in benchmark parame-ters of a different asset and liability structure and financial position different market conditions, nor can they re-flect the interelations and complexity of the reference markets.
Exchange rate risk. Due to its commercial operations, the company is exposed to fluctuations in the ex-change rates for currencies in which some of its commercial transactions are denominated (particularly USD,GBP, CHF and those of certain countries in the Far East), against a cost structure that is concentrated princi-pally in the eurozone. The company realises greater revenues than costs in all these currencies; therefore,changes in the exchange rate between the euro and the aforementioned currencies can impact the company’sresults.With the exception of the foregoing, the company is not particularly exposed to foreign exchange risk.The resid-ual component of this risk is connected principally with “translation risk”.This risk stems from the fact that theassets and liabilities of consolidated companies whose functional currency is different from the euro can have dif-ferent countervalues in euros according to changes in foreign exchange rates.The measured amount of this riskis recognised in the “translation reserve” in equity.The company monitors the changes in the exposure. No hedges of this risk existed at the reporting date.Governance of individual foreign currency operations by Group subsidiaries is highly simplified by the fact that theyare wholly owned by the parent company.The company’s risk management policy aims to ensure that the average countervalue in euros of receipts onwholesale transactions denominated in foreign currencies for each collection (Spring/Summer and Fall/Winter) isequal to or greater than what would be obtained by applying the pre-set target exchange rates.The company pur-sues these aims by entering into forward contracts for each individual currency to hedge a specific percentage ofthe expected revenue (and cost) volumes in the individual currencies other than the functional currency.Thesepositions are not hedged for speculative or trading purposes, consistently with the strategic policies adopted forprudent management of cash flows.Consequently, the company might forego opportunities to realise certain gains,but it avoids running the risks of speculation.The company defines its exchange risk a priori according to the reference period budget for the reference peri-od and then gradually hedges this risk upon acquisition of orders, in the amount according to which they corre-spond to budget forecasts.The process of hedging exchange rate risk is broken down into a series of activitiesthat can be grouped into the following distinct phases:• definition of operating limits;• identification and quantification of exposure;• implementation of hedges;• monitoring of positions and alert procedures.The breakdown of forward currency contracts (for sale and purchase) outstanding at December 31st, 2011 is il-lustrated in Note 18.The assets and liabilities that are denominated in foreign currency are identified as part of the sensitivity analy-sis of exchange rates. In order to determine the potential impact on final results, the potential effects of fluc-tuations in the cross rates for the euro and major non-EU currencies have been analysed.The following tableillustrates the sensitivity to reasonably likely changes in exchange rates on pre-tax profit (due to changes inthe value of current assets and liabilities denominated in foreign currency) while holding all other variablesconstant:
127 Supplementary Notes
S.p.A.2011Annual Report
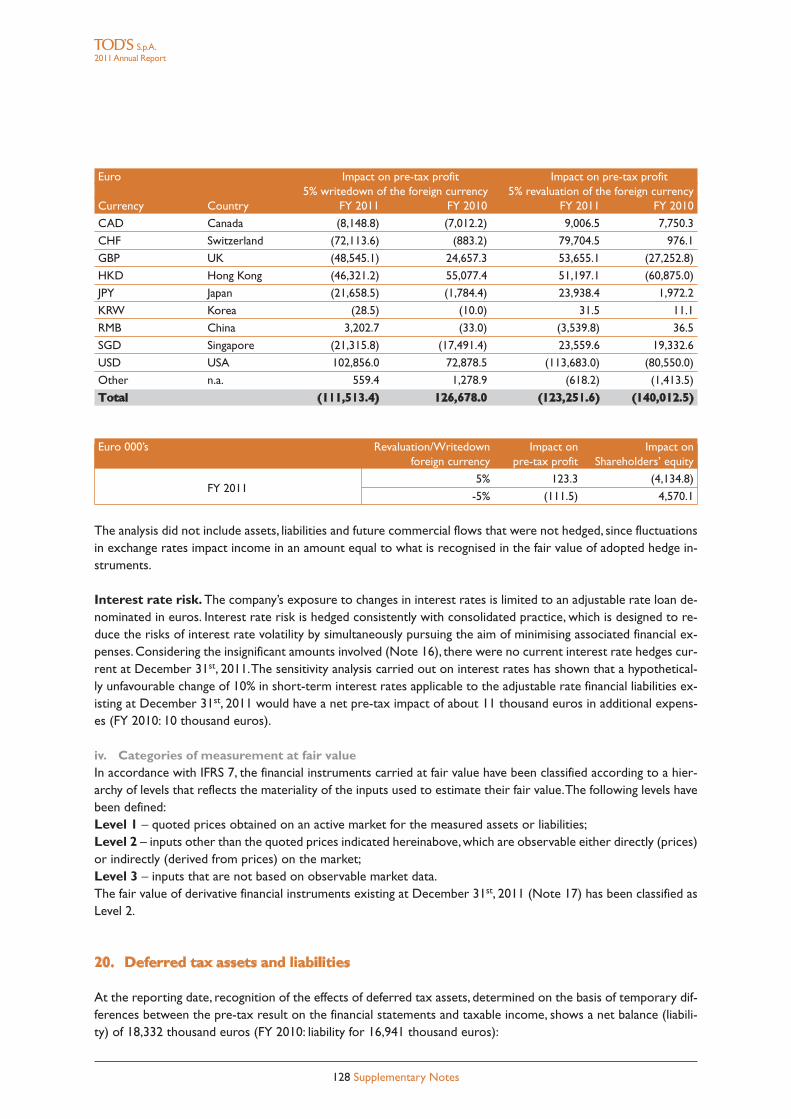
Euro Impact on pre-tax profit Impact on pre-tax profit5% writedown of the foreign currency 5% revaluation of the foreign currency
Currency Country FY 2011 FY 2010 FY 2011 FY 2010
CAD Canada (8,148.8) (7,012.2) 9,006.5 7,750.3
CHF Switzerland (72,113.6) (883.2) 79,704.5 976.1
GBP UK (48,545.1) 24,657.3 53,655.1 (27,252.8)
HKD Hong Kong (46,321.2) 55,077.4 51,197.1 (60,875.0)
JPY Japan (21,658.5) (1,784.4) 23,938.4 1,972.2
KRW Korea (28.5) (10.0) 31.5 11.1
RMB China 3,202.7 (33.0) (3,539.8) 36.5
SGD Singapore (21,315.8) (17,491.4) 23,559.6 19,332.6
USD USA 102,856.0 72,878.5 (113,683.0) (80,550.0)
Other n.a. 559.4 1,278.9 (618.2) (1,413.5)
Total (111,513.4) 126,678.0 (123,251.6) (140,012.5)
Euro 000’s Revaluation/Writedown Impact on Impact onforeign currency pre-tax profit Shareholders’ equity
5% 123.3 (4,134.8)FY 2011
-5% (111.5) 4,570.1
The analysis did not include assets, liabilities and future commercial flows that were not hedged, since fluctuationsin exchange rates impact income in an amount equal to what is recognised in the fair value of adopted hedge in-struments.
Interest rate risk. The company’s exposure to changes in interest rates is limited to an adjustable rate loan de-nominated in euros. Interest rate risk is hedged consistently with consolidated practice, which is designed to re-duce the risks of interest rate volatility by simultaneously pursuing the aim of minimising associated financial ex-penses.Considering the insignificant amounts involved (Note 16), there were no current interest rate hedges cur-rent at December 31st, 2011.The sensitivity analysis carried out on interest rates has shown that a hypothetical-ly unfavourable change of 10% in short-term interest rates applicable to the adjustable rate financial liabilities ex-isting at December 31st, 2011 would have a net pre-tax impact of about 11 thousand euros in additional expens-es (FY 2010: 10 thousand euros).
iv. Categories of measurement at fair valueIn accordance with IFRS 7, the financial instruments carried at fair value have been classified according to a hier-archy of levels that reflects the materiality of the inputs used to estimate their fair value.The following levels havebeen defined:Level 1 – quoted prices obtained on an active market for the measured assets or liabilities;Level 2 – inputs other than the quoted prices indicated hereinabove,which are observable either directly (prices)or indirectly (derived from prices) on the market;Level 3 – inputs that are not based on observable market data.The fair value of derivative financial instruments existing at December 31st, 2011 (Note 17) has been classified asLevel 2.
20. Deferred tax assets and liabilities
At the reporting date, recognition of the effects of deferred tax assets, determined on the basis of temporary dif-ferences between the pre-tax result on the financial statements and taxable income, shows a net balance (liabili-ty) of 18,332 thousand euros (FY 2010: liability for 16,941 thousand euros):
128 Supplementary Notes
S.p.A.2011Annual Report
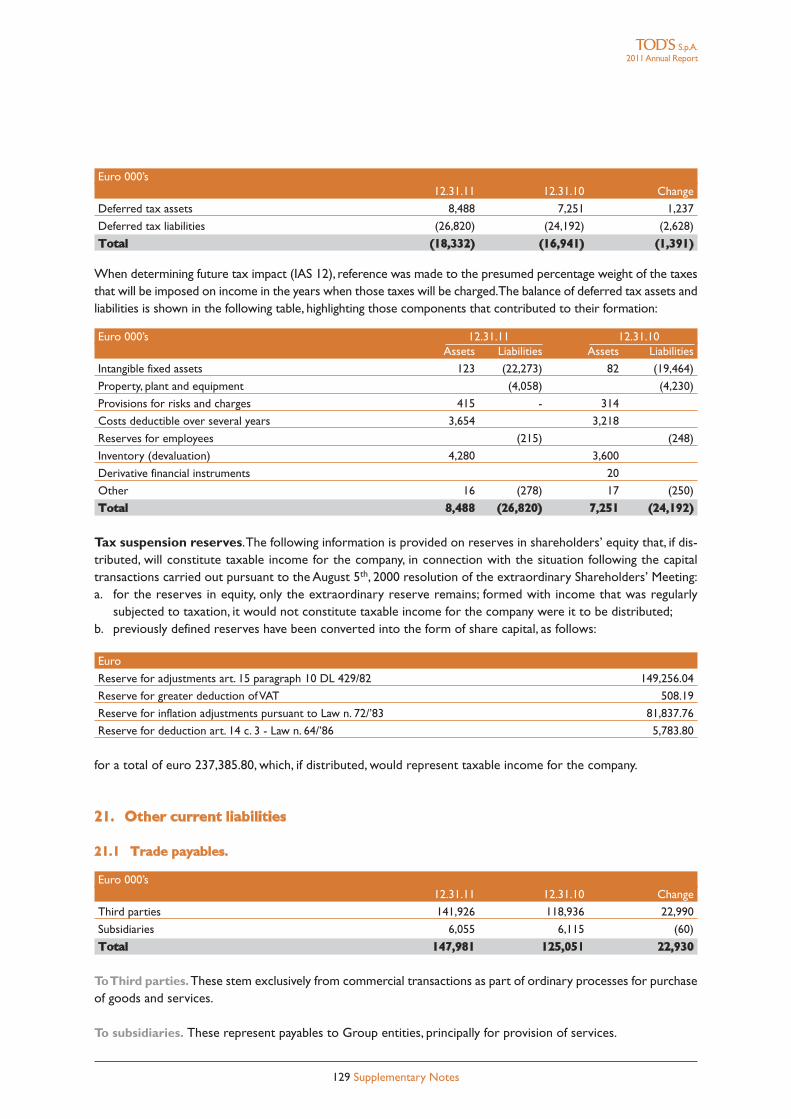
129 Supplementary Notes
Euro 000’s12.31.11 12.31.10 Change
Deferred tax assets 8,488 7,251 1,237
Deferred tax liabilities (26,820) (24,192) (2,628)
Total (18,332) (16,941) (1,391)
When determining future tax impact (IAS 12), reference was made to the presumed percentage weight of the taxesthat will be imposed on income in the years when those taxes will be charged.The balance of deferred tax assets andliabilities is shown in the following table, highlighting those components that contributed to their formation:
Euro 000’s 12.31.11 12.31.10Assets Liabilities Assets Liabilities
Intangible fixed assets 123 (22,273) 82 (19,464)
Property, plant and equipment (4,058) (4,230)
Provisions for risks and charges 415 - 314
Costs deductible over several years 3,654 3,218
Reserves for employees (215) (248)
Inventory (devaluation) 4,280 3,600
Derivative financial instruments 20
Other 16 (278) 17 (250)
Total 8,488 (26,820) 7,251 (24,192)
Tax suspension reserves.The following information is provided on reserves in shareholders’ equity that, if dis-tributed, will constitute taxable income for the company, in connection with the situation following the capitaltransactions carried out pursuant to the August 5th, 2000 resolution of the extraordinary Shareholders’ Meeting:a. for the reserves in equity, only the extraordinary reserve remains; formed with income that was regularly
subjected to taxation, it would not constitute taxable income for the company were it to be distributed;b. previously defined reserves have been converted into the form of share capital, as follows:
Euro
Reserve for adjustments art. 15 paragraph 10 DL 429/82 149,256.04
Reserve for greater deduction ofVAT 508.19
Reserve for inflation adjustments pursuant to Law n. 72/’83 81,837.76
Reserve for deduction art. 14 c. 3 - Law n. 64/’86 5,783.80
for a total of euro 237,385.80, which, if distributed, would represent taxable income for the company.
21. Other current liabilities
21.1 Trade payables.
Euro 000’s12.31.11 12.31.10 Change
Third parties 141,926 118,936 22,990
Subsidiaries 6,055 6,115 (60)
Total 147,981 125,051 22,930
ToThird parties.These stem exclusively from commercial transactions as part of ordinary processes for purchaseof goods and services.
To subsidiaries. These represent payables to Group entities, principally for provision of services.
S.p.A.2011Annual Report
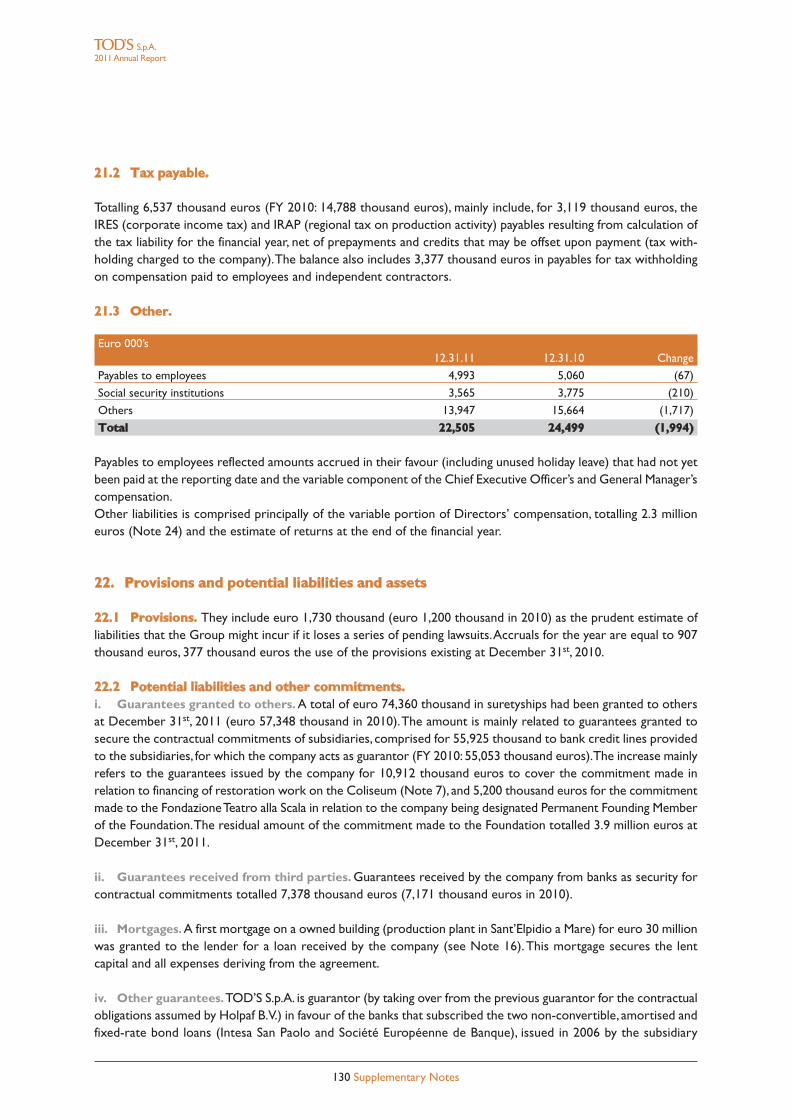
130 Supplementary Notes
S.p.A.2011Annual Report
21.2 Tax payable.
Totalling 6,537 thousand euros (FY 2010: 14,788 thousand euros), mainly include, for 3,119 thousand euros, theIRES (corporate income tax) and IRAP (regional tax on production activity) payables resulting from calculation ofthe tax liability for the financial year, net of prepayments and credits that may be offset upon payment (tax with-holding charged to the company).The balance also includes 3,377 thousand euros in payables for tax withholdingon compensation paid to employees and independent contractors.
21.3 Other.
Euro 000’s12.31.11 12.31.10 Change
Payables to employees 4,993 5,060 (67)
Social security institutions 3,565 3,775 (210)
Others 13,947 15,664 (1,717)
Total 22,505 24,499 (1,994)
Payables to employees reflected amounts accrued in their favour (including unused holiday leave) that had not yetbeen paid at the reporting date and the variable component of the Chief Executive Officer’s and General Manager’scompensation.Other liabilities is comprised principally of the variable portion of Directors’ compensation, totalling 2.3 millioneuros (Note 24) and the estimate of returns at the end of the financial year.
22. Provisions and potential liabilities and assets
22.1 Provisions. They include euro 1,730 thousand (euro 1,200 thousand in 2010) as the prudent estimate ofliabilities that the Group might incur if it loses a series of pending lawsuits.Accruals for the year are equal to 907thousand euros, 377 thousand euros the use of the provisions existing at December 31st, 2010.
22.2 Potential liabilities and other commitments.i. Guarantees granted to others. A total of euro 74,360 thousand in suretyships had been granted to othersat December 31st, 2011 (euro 57,348 thousand in 2010).The amount is mainly related to guarantees granted tosecure the contractual commitments of subsidiaries, comprised for 55,925 thousand to bank credit lines providedto the subsidiaries, for which the company acts as guarantor (FY 2010: 55,053 thousand euros).The increase mainlyrefers to the guarantees issued by the company for 10,912 thousand euros to cover the commitment made inrelation to financing of restoration work on the Coliseum (Note 7), and 5,200 thousand euros for the commitmentmade to the FondazioneTeatro alla Scala in relation to the company being designated Permanent Founding Memberof the Foundation.The residual amount of the commitment made to the Foundation totalled 3.9 million euros atDecember 31st, 2011.
ii. Guarantees received from third parties. Guarantees received by the company from banks as security forcontractual commitments totalled 7,378 thousand euros (7,171 thousand euros in 2010).
iii. Mortgages.A first mortgage on a owned building (production plant in Sant’Elpidio a Mare) for euro 30 millionwas granted to the lender for a loan received by the company (see Note 16).This mortgage secures the lentcapital and all expenses deriving from the agreement.
iv. Other guarantees.TOD’S S.p.A. is guarantor (by taking over from the previous guarantor for the contractualobligations assumed by Holpaf B.V.) in favour of the banks that subscribed the two non-convertible, amortised andfixed-rate bond loans (Intesa San Paolo and Société Européenne de Banque), issued in 2006 by the subsidiary
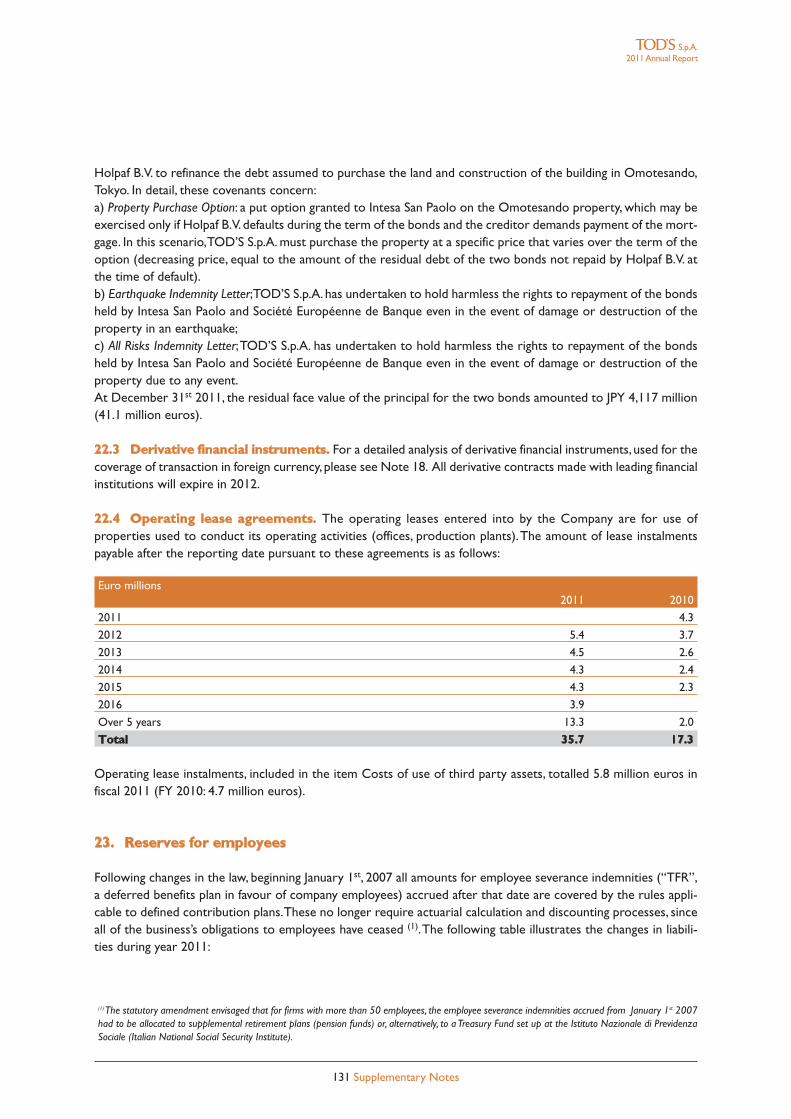
Holpaf B.V. to refinance the debt assumed to purchase the land and construction of the building in Omotesando,Tokyo. In detail, these covenants concern:a) Property Purchase Option: a put option granted to Intesa San Paolo on the Omotesando property, which may beexercised only if Holpaf B.V.defaults during the term of the bonds and the creditor demands payment of the mort-gage. In this scenario,TOD’S S.p.A. must purchase the property at a specific price that varies over the term of theoption (decreasing price, equal to the amount of the residual debt of the two bonds not repaid by Holpaf B.V. atthe time of default).b) Earthquake Indemnity Letter;TOD’S S.p.A. has undertaken to hold harmless the rights to repayment of the bondsheld by Intesa San Paolo and Société Européenne de Banque even in the event of damage or destruction of theproperty in an earthquake;c) All Risks Indemnity Letter;TOD’S S.p.A. has undertaken to hold harmless the rights to repayment of the bondsheld by Intesa San Paolo and Société Européenne de Banque even in the event of damage or destruction of theproperty due to any event.At December 31st 2011, the residual face value of the principal for the two bonds amounted to JPY 4,117 million(41.1 million euros).
22.3 Derivative financial instruments. For a detailed analysis of derivative financial instruments, used for thecoverage of transaction in foreign currency, please see Note 18. All derivative contracts made with leading financialinstitutions will expire in 2012.
22.4 Operating lease agreements. The operating leases entered into by the Company are for use ofproperties used to conduct its operating activities (offices, production plants).The amount of lease instalmentspayable after the reporting date pursuant to these agreements is as follows:
Euro millions2011 2010
2011 4.3
2012 5.4 3.7
2013 4.5 2.6
2014 4.3 2.4
2015 4.3 2.3
2016 3.9
Over 5 years 13.3 2.0
Total 35.7 17.3
Operating lease instalments, included in the item Costs of use of third party assets, totalled 5.8 million euros infiscal 2011 (FY 2010: 4.7 million euros).
23. Reserves for employees
Following changes in the law, beginning January 1st, 2007 all amounts for employee severance indemnities (“TFR”,a deferred benefits plan in favour of company employees) accrued after that date are covered by the rules appli-cable to defined contribution plans.These no longer require actuarial calculation and discounting processes, sinceall of the business’s obligations to employees have ceased (1).The following table illustrates the changes in liabili-ties during year 2011:
131 Supplementary Notes
S.p.A.2011Annual Report
(1)The statutory amendment envisaged that for firms with more than 50 employees, the employee severance indemnities accrued from January 1st 2007had to be allocated to supplemental retirement plans (pension funds) or, alternatively, to aTreasury Fund set up at the Istituto Nazionale di PrevidenzaSociale (Italian National Social Security Institute).
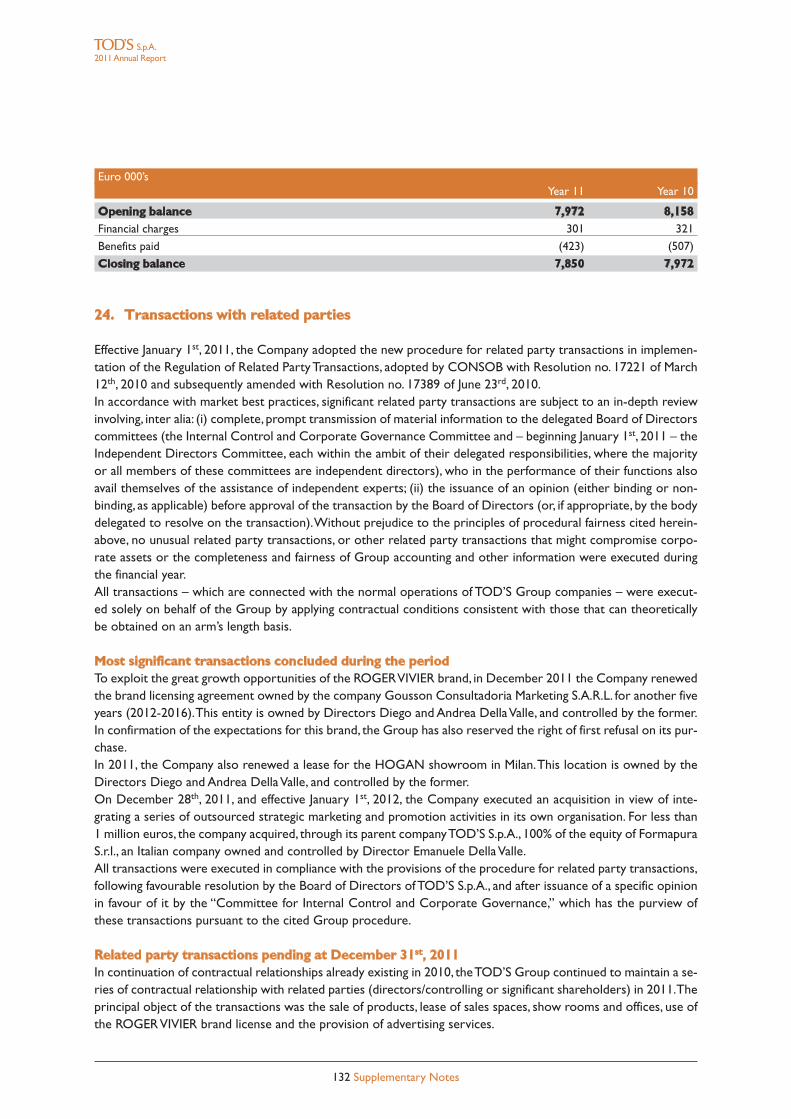
Euro 000’sYear 11 Year 10
Opening balance 7,972 8,158Financial charges 301 321
Benefits paid (423) (507)
Closing balance 7,850 7,972
24. Transactions with related parties
Effective January 1st, 2011, the Company adopted the new procedure for related party transactions in implemen-tation of the Regulation of Related PartyTransactions, adopted by CONSOB with Resolution no. 17221 of March12th, 2010 and subsequently amended with Resolution no. 17389 of June 23rd, 2010.In accordance with market best practices, significant related party transactions are subject to an in-depth reviewinvolving, inter alia: (i) complete, prompt transmission of material information to the delegated Board of Directorscommittees (the Internal Control and Corporate Governance Committee and – beginning January 1st, 2011 – theIndependent Directors Committee, each within the ambit of their delegated responsibilities, where the majorityor all members of these committees are independent directors), who in the performance of their functions alsoavail themselves of the assistance of independent experts; (ii) the issuance of an opinion (either binding or non-binding, as applicable) before approval of the transaction by the Board of Directors (or, if appropriate, by the bodydelegated to resolve on the transaction).Without prejudice to the principles of procedural fairness cited herein-above, no unusual related party transactions, or other related party transactions that might compromise corpo-rate assets or the completeness and fairness of Group accounting and other information were executed duringthe financial year.All transactions – which are connected with the normal operations of TOD’S Group companies – were execut-ed solely on behalf of the Group by applying contractual conditions consistent with those that can theoreticallybe obtained on an arm’s length basis.
Most significant transactions concluded during the periodTo exploit the great growth opportunities of the ROGERVIVIER brand, in December 2011 the Company renewedthe brand licensing agreement owned by the company Gousson Consultadoria Marketing S.A.R.L. for another fiveyears (2012-2016).This entity is owned by Directors Diego and Andrea DellaValle, and controlled by the former.In confirmation of the expectations for this brand, the Group has also reserved the right of first refusal on its pur-chase.In 2011, the Company also renewed a lease for the HOGAN showroom in Milan.This location is owned by theDirectors Diego and Andrea DellaValle, and controlled by the former.On December 28th, 2011, and effective January 1st, 2012, the Company executed an acquisition in view of inte-grating a series of outsourced strategic marketing and promotion activities in its own organisation. For less than1 million euros, the company acquired, through its parent companyTOD’S S.p.A., 100% of the equity of FormapuraS.r.l., an Italian company owned and controlled by Director Emanuele DellaValle.All transactions were executed in compliance with the provisions of the procedure for related party transactions,following favourable resolution by the Board of Directors ofTOD’S S.p.A., and after issuance of a specific opinionin favour of it by the “Committee for Internal Control and Corporate Governance,” which has the purview ofthese transactions pursuant to the cited Group procedure.
Related party transactions pending at December 31st, 2011In continuation of contractual relationships already existing in 2010, theTOD’S Group continued to maintain a se-ries of contractual relationship with related parties (directors/controlling or significant shareholders) in 2011.Theprincipal object of the transactions was the sale of products, lease of sales spaces, show rooms and offices, use ofthe ROGERVIVIER brand license and the provision of advertising services.
132 Supplementary Notes
S.p.A.2011Annual Report
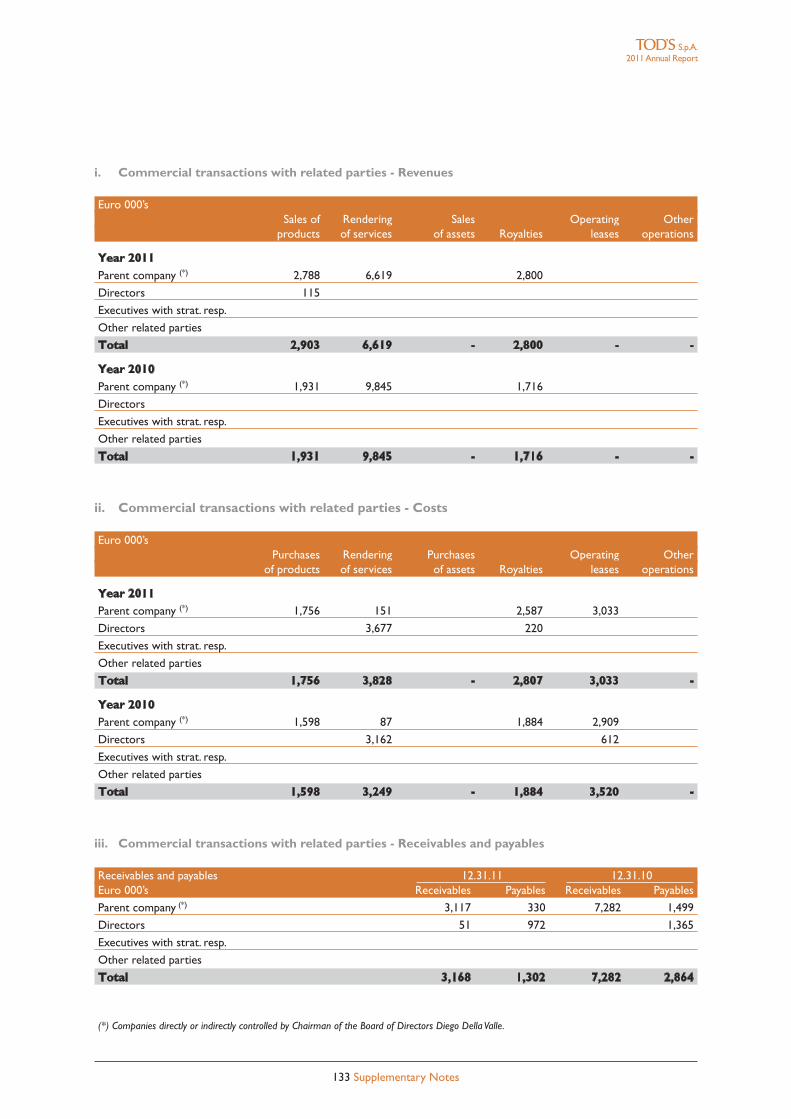
i. Commercial transactions with related parties - Revenues
Euro 000’sSales of Rendering Sales Operating Other
products of services of assets Royalties leases operations
Year 2011Parent company (*) 2,788 6,619 2,800
Directors 115
Executives with strat. resp.
Other related parties
Total 2,903 6,619 - 2,800 - -
Year 2010Parent company (*) 1,931 9,845 1,716
Directors
Executives with strat. resp.
Other related parties
Total 1,931 9,845 - 1,716 - -
ii. Commercial transactions with related parties - Costs
Euro 000’sPurchases Rendering Purchases Operating Other
of products of services of assets Royalties leases operations
Year 2011Parent company (*) 1,756 151 2,587 3,033
Directors 3,677 220
Executives with strat. resp.
Other related parties
Total 1,756 3,828 - 2,807 3,033 -
Year 2010Parent company (*) 1,598 87 1,884 2,909
Directors 3,162 612
Executives with strat. resp.
Other related parties
Total 1,598 3,249 - 1,884 3,520 -
iii. Commercial transactions with related parties - Receivables and payables
Receivables and payables 12.31.11 12.31.10Euro 000’s Receivables Payables Receivables Payables
Parent company (*) 3,117 330 7,282 1,499
Directors 51 972 1,365
Executives with strat. resp.
Other related parties
Total 3,168 1,302 7,282 2,864
(*) Companies directly or indirectly controlled by Chairman of the Board of Directors Diego DellaValle.
133 Supplementary Notes
S.p.A.2011Annual Report
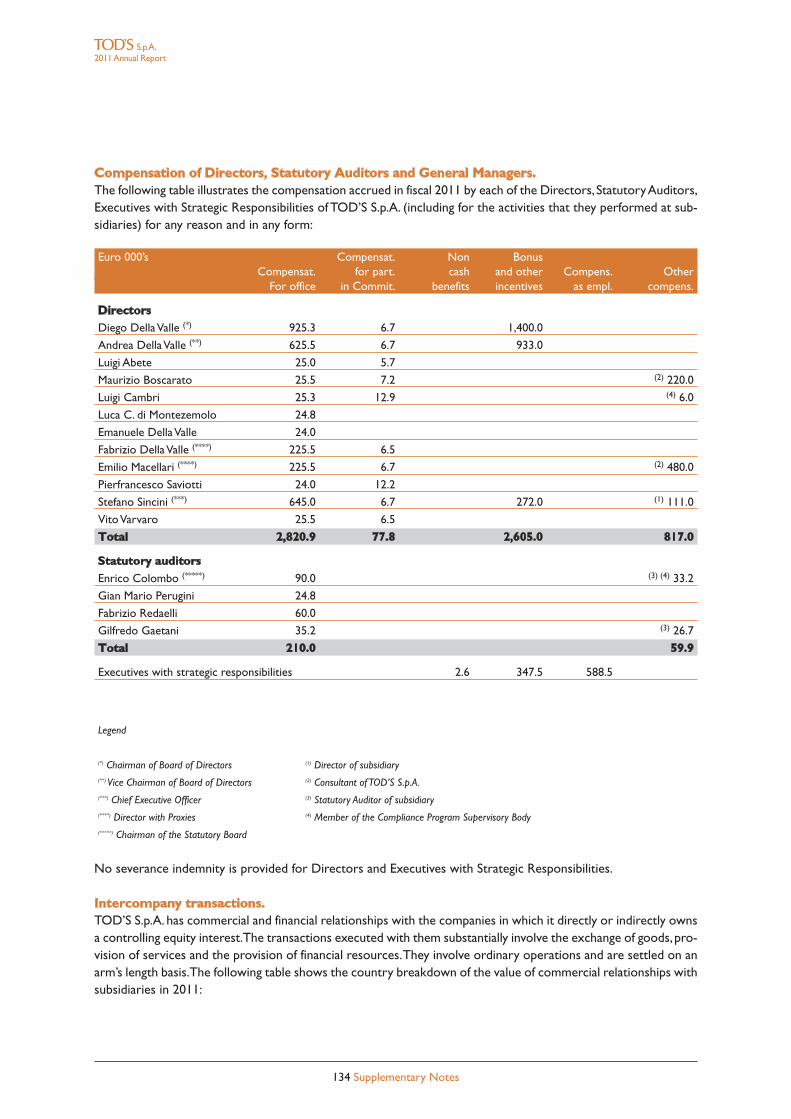
Compensation of Directors, Statutory Auditors and General Managers.The following table illustrates the compensation accrued in fiscal 2011 by each of the Directors, StatutoryAuditors,Executives with Strategic Responsibilities of TOD’S S.p.A. (including for the activities that they performed at sub-sidiaries) for any reason and in any form:
Euro 000’s Compensat. Non BonusCompensat. for part. cash and other Compens. Other
For office in Commit. benefits incentives as empl. compens.
DirectorsDiego DellaValle (*) 925.3 6.7 1,400.0
Andrea DellaValle (**) 625.5 6.7 933.0
Luigi Abete 25.0 5.7
Maurizio Boscarato 25.5 7.2 (2) 220.0
Luigi Cambri 25.3 12.9 (4) 6.0
Luca C. di Montezemolo 24.8
Emanuele DellaValle 24.0
Fabrizio DellaValle (****) 225.5 6.5
Emilio Macellari (****) 225.5 6.7 (2) 480.0
Pierfrancesco Saviotti 24.0 12.2
Stefano Sincini (***) 645.0 6.7 272.0 (1) 111.0
VitoVarvaro 25.5 6.5
Total 2,820.9 77.8 2,605.0 817.0
Statutory auditorsEnrico Colombo (*****) 90.0 (3) (4) 33.2
Gian Mario Perugini 24.8
Fabrizio Redaelli 60.0
Gilfredo Gaetani 35.2 (3) 26.7
Total 210.0 59.9
Executives with strategic responsibilities 2.6 347.5 588.5
Legend
(*) Chairman of Board of Directors (1) Director of subsidiary(**) Vice Chairman of Board of Directors (2) Consultant of TOD’S S.p.A.(***) Chief Executive Officer (3) Statutory Auditor of subsidiary(****) Director with Proxies (4) Member of the Compliance Program Supervisory Body(*****) Chairman of the Statutory Board
No severance indemnity is provided for Directors and Executives with Strategic Responsibilities.
Intercompany transactions.TOD’S S.p.A. has commercial and financial relationships with the companies in which it directly or indirectly ownsa controlling equity interest.The transactions executed with them substantially involve the exchange of goods,pro-vision of services and the provision of financial resources.They involve ordinary operations and are settled on anarm’s length basis.The following table shows the country breakdown of the value of commercial relationships withsubsidiaries in 2011:
134 Supplementary Notes
S.p.A.2011Annual Report
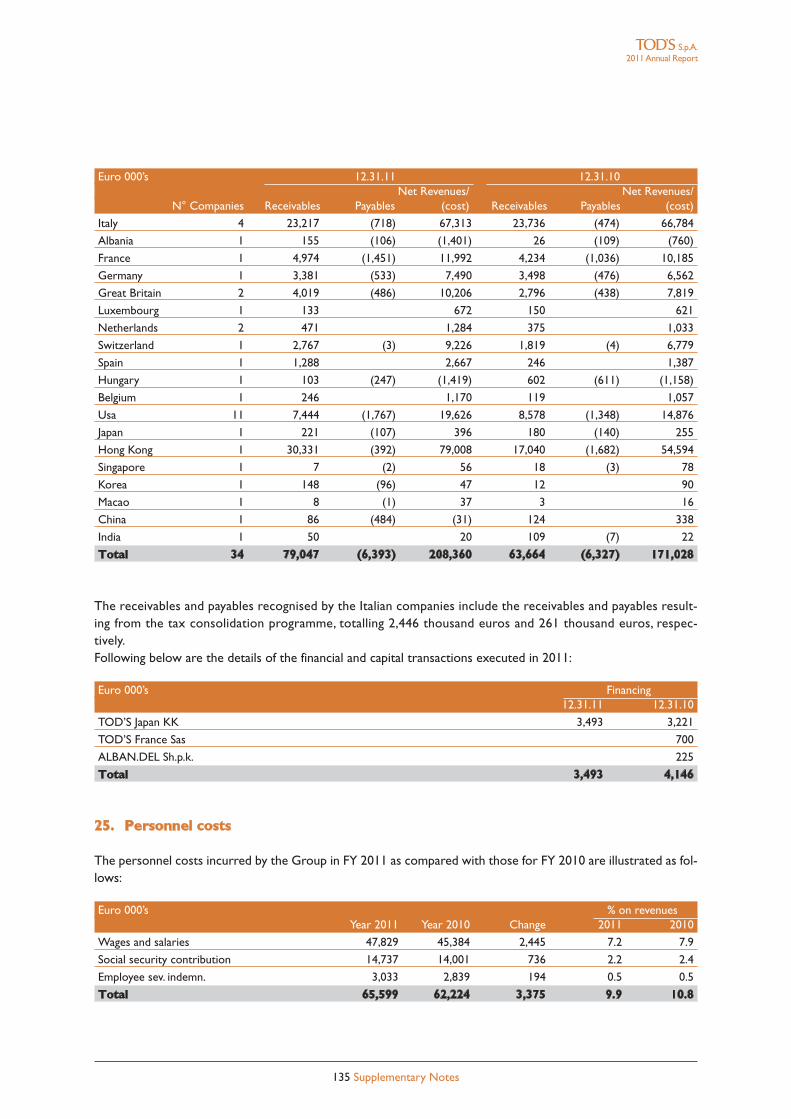
Euro 000’s 12.31.11 12.31.10Net Revenues/ Net Revenues/
N° Companies Receivables Payables (cost) Receivables Payables (cost)
Italy 4 23,217 (718) 67,313 23,736 (474) 66,784
Albania 1 155 (106) (1,401) 26 (109) (760)
France 1 4,974 (1,451) 11,992 4,234 (1,036) 10,185
Germany 1 3,381 (533) 7,490 3,498 (476) 6,562
Great Britain 2 4,019 (486) 10,206 2,796 (438) 7,819
Luxembourg 1 133 672 150 621
Netherlands 2 471 1,284 375 1,033
Switzerland 1 2,767 (3) 9,226 1,819 (4) 6,779
Spain 1 1,288 2,667 246 1,387
Hungary 1 103 (247) (1,419) 602 (611) (1,158)
Belgium 1 246 1,170 119 1,057
Usa 11 7,444 (1,767) 19,626 8,578 (1,348) 14,876
Japan 1 221 (107) 396 180 (140) 255
Hong Kong 1 30,331 (392) 79,008 17,040 (1,682) 54,594
Singapore 1 7 (2) 56 18 (3) 78
Korea 1 148 (96) 47 12 90
Macao 1 8 (1) 37 3 16
China 1 86 (484) (31) 124 338
India 1 50 20 109 (7) 22
Total 34 79,047 (6,393) 208,360 63,664 (6,327) 171,028
The receivables and payables recognised by the Italian companies include the receivables and payables result-ing from the tax consolidation programme, totalling 2,446 thousand euros and 261 thousand euros, respec-tively.Following below are the details of the financial and capital transactions executed in 2011:
Euro 000’s Financing12.31.11 12.31.10
TOD’S Japan KK 3,493 3,221
TOD’S France Sas 700
ALBAN.DEL Sh.p.k. 225
Total 3,493 4,146
25. Personnel costs
The personnel costs incurred by the Group in FY 2011 as compared with those for FY 2010 are illustrated as fol-lows:
Euro 000’s % on revenuesYear 2011 Year 2010 Change 2011 2010
Wages and salaries 47,829 45,384 2,445 7.2 7.9
Social security contribution 14,737 14,001 736 2.2 2.4
Employee sev. indemn. 3,033 2,839 194 0.5 0.5
Total 65,599 62,224 3,375 9.9 10.8
135 Supplementary Notes
S.p.A.2011Annual Report
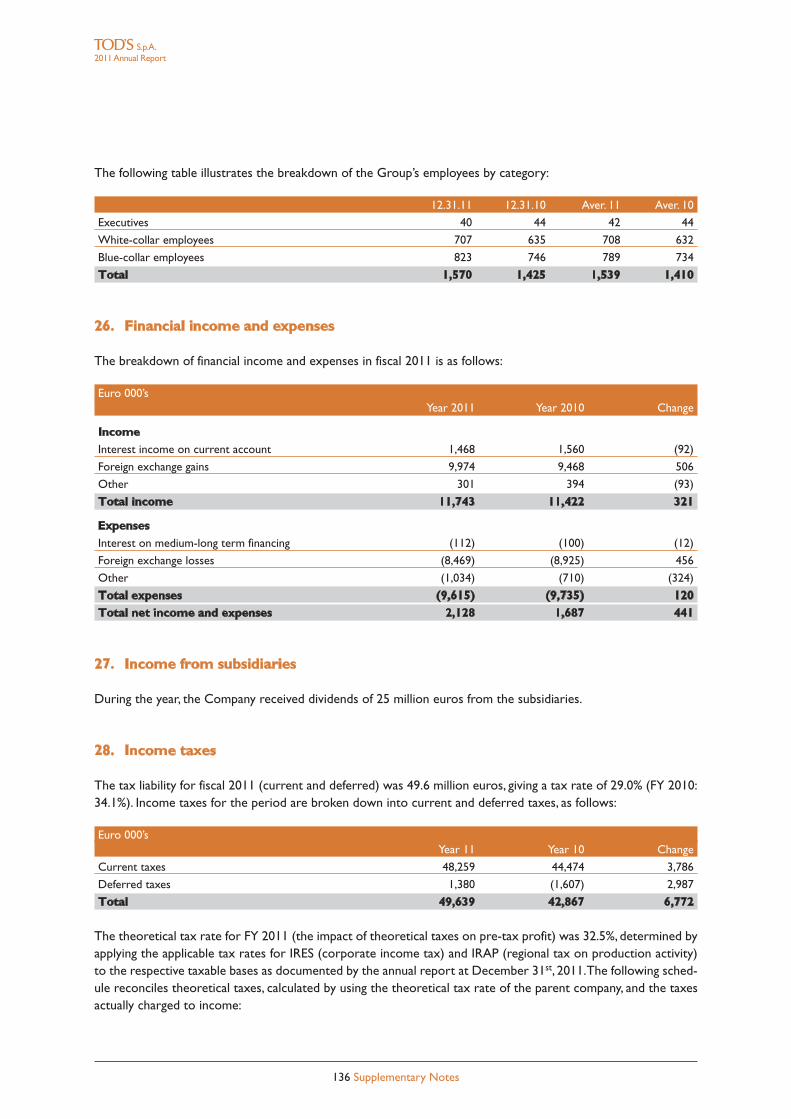
The following table illustrates the breakdown of the Group’s employees by category:
12.31.11 12.31.10 Aver. 11 Aver. 10
Executives 40 44 42 44
White-collar employees 707 635 708 632
Blue-collar employees 823 746 789 734
Total 1,570 1,425 1,539 1,410
26. Financial income and expenses
The breakdown of financial income and expenses in fiscal 2011 is as follows:
Euro 000’sYear 2011 Year 2010 Change
IncomeInterest income on current account 1,468 1,560 (92)
Foreign exchange gains 9,974 9,468 506
Other 301 394 (93)
Total income 11,743 11,422 321
ExpensesInterest on medium-long term financing (112) (100) (12)
Foreign exchange losses (8,469) (8,925) 456
Other (1,034) (710) (324)
Total expenses (9,615) (9,735) 120Total net income and expenses 2,128 1,687 441
27. Income from subsidiaries
During the year, the Company received dividends of 25 million euros from the subsidiaries.
28. Income taxes
The tax liability for fiscal 2011 (current and deferred) was 49.6 million euros, giving a tax rate of 29.0% (FY 2010:34.1%). Income taxes for the period are broken down into current and deferred taxes, as follows:
Euro 000’sYear 11 Year 10 Change
Current taxes 48,259 44,474 3,786
Deferred taxes 1,380 (1,607) 2,987
Total 49,639 42,867 6,772
The theoretical tax rate for FY 2011 (the impact of theoretical taxes on pre-tax profit) was 32.5%, determined byapplying the applicable tax rates for IRES (corporate income tax) and IRAP (regional tax on production activity)to the respective taxable bases as documented by the annual report at December 31st, 2011.The following sched-ule reconciles theoretical taxes, calculated by using the theoretical tax rate of the parent company, and the taxesactually charged to income:
136 Supplementary Notes
S.p.A.2011Annual Report
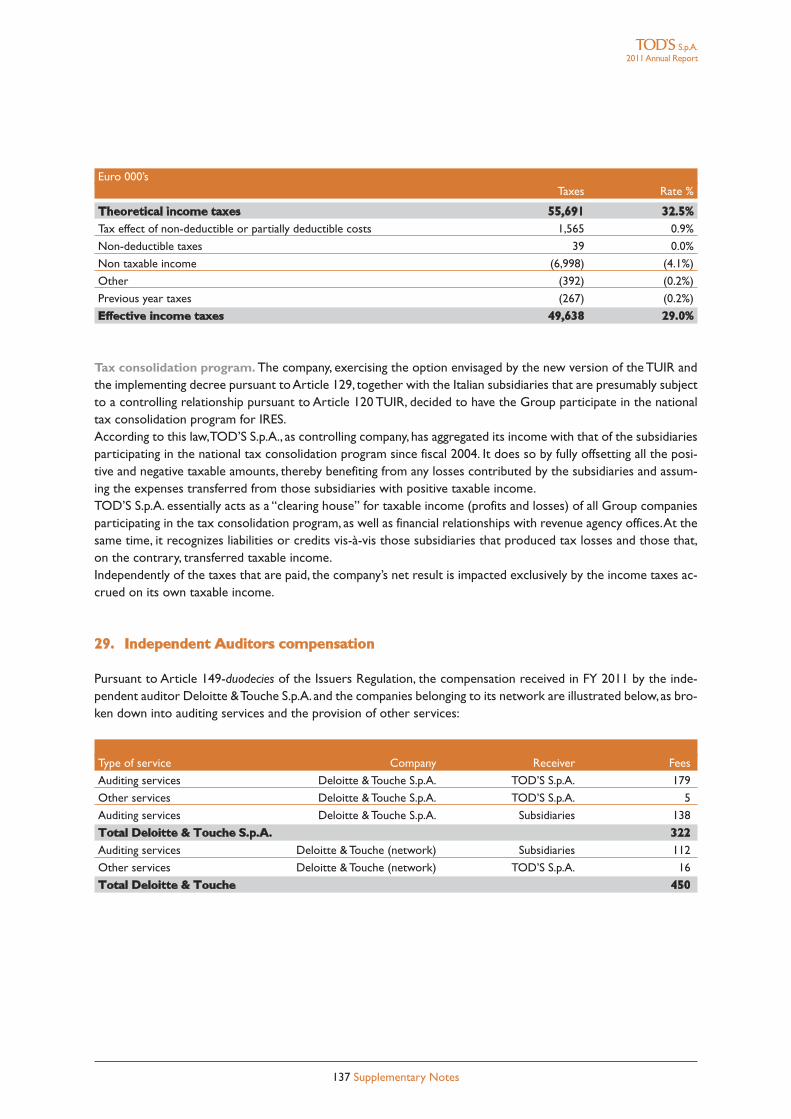
Euro 000’sTaxes Rate %
Theoretical income taxes 55,691 32.5%Tax effect of non-deductible or partially deductible costs 1,565 0.9%
Non-deductible taxes 39 0.0%
Non taxable income (6,998) (4.1%)
Other (392) (0.2%)
Previous year taxes (267) (0.2%)
Effective income taxes 49,638 29.0%
Tax consolidation program. The company, exercising the option envisaged by the new version of the TUIR andthe implementing decree pursuant toArticle 129, together with the Italian subsidiaries that are presumably subjectto a controlling relationship pursuant to Article 120 TUIR, decided to have the Group participate in the nationaltax consolidation program for IRES.According to this law,TOD’S S.p.A., as controlling company, has aggregated its income with that of the subsidiariesparticipating in the national tax consolidation program since fiscal 2004. It does so by fully offsetting all the posi-tive and negative taxable amounts, thereby benefiting from any losses contributed by the subsidiaries and assum-ing the expenses transferred from those subsidiaries with positive taxable income.TOD’S S.p.A. essentially acts as a “clearing house” for taxable income (profits and losses) of all Group companiesparticipating in the tax consolidation program, as well as financial relationships with revenue agency offices.At thesame time, it recognizes liabilities or credits vis-à-vis those subsidiaries that produced tax losses and those that,on the contrary, transferred taxable income.Independently of the taxes that are paid, the company’s net result is impacted exclusively by the income taxes ac-crued on its own taxable income.
29. Independent Auditors compensation
Pursuant to Article 149-duodecies of the Issuers Regulation, the compensation received in FY 2011 by the inde-pendent auditor Deloitte &Touche S.p.A. and the companies belonging to its network are illustrated below,as bro-ken down into auditing services and the provision of other services:
Type of service Company Receiver Fees
Auditing services Deloitte & Touche S.p.A. TOD’S S.p.A. 179
Other services Deloitte & Touche S.p.A. TOD’S S.p.A. 5
Auditing services Deloitte & Touche S.p.A. Subsidiaries 138
Total Deloitte & Touche S.p.A. 322Auditing services Deloitte & Touche (network) Subsidiaries 112
Other services Deloitte & Touche (network) TOD’S S.p.A. 16
Total Deloitte & Touche 450
137 Supplementary Notes
S.p.A.2011Annual Report
30. Certification of the Separate Financial Statements of TOD’S S.p.A. and theConsolidated Financial Statements of the TOD’S Group pursuant to Article 81-ter ofConsob Regulation no. 11971 of May 14th, 1999, as amended
1. The undersigned Stefano Sincini, Chief Executive Officer of TOD’S S.p.A., and Rodolfo Ubaldi, managerresponsible for the drawing up of the financial reports of TOD’S S.p.A., certify, in accordance with the provisionsof Article 154-bis, subsections 3 and 4, of Legislative Decree no. 58 of February 24th, 1998:
• the adequacy in terms of the company’s characteristics and• effective application
of administrative and accounting procedures for preparation of the Separate Financial Statements andConsolidated Financial Statements during the period January 1st, 2011 to December 31st, 2011.
2. They also certify that the Separate Financial Statements and Consolidated Financial Statements:a) have been prepared in compliance with the International Financial Reporting Standards recognised in the
European Union pursuant to Regulation EC 1606/2002 of the European Parliament and Council of July 19th
2002.b) correspond with the account books and ledger entries;c) give a true and fair view of the assets, liabilities, income and financial position of the issuer and entities
included in the scope of consolidation.
3. Report on operations provides a reliable analysis of the issuer’s operating performance and income, as wellas the financial position of the issuer and all the businesses included in the scope of consolidation, together witha description of the principal risks and uncertainties to which they are exposed.
Milan, March 13th 2012
Stefano Sincini Rodolfo UbaldiChief Executive Officer Manager responsible for the drawing
up of the financial reports
138 Supplementary Notes
S.p.A.2011Annual Report

[THIS PAGE HAS BEEN INTENTIONALLY LEFT BLANK]
139 2011 Annual Report
[THIS PAGE HAS BEEN INTENTIONALLY LEFT BLANK]
140 2011 Annual Report

REPORT OF THE BOARD OF STATUTORY AUDITORS
REPORT BY THE BOARD OF AUDITORS TO THE GENERAL MEETING OFSHAREHOLDERS OF TOD’S S.p.A., PURSUANT TO ARTICLE 153 OF LEGISLATIVEDECREE N° 58/1998 AND ARTICLE 2429 OF THE ITALIAN CIVIL CODE(Translation of the document issued in Italian solely for the convenience of international readers)
Dear Shareholders,In the year ended on December 31st, 2011, we discharged the supervisory tasks imposed under law, in accordance withthe rules of conduct for the Board of Auditors as provided for by the Italian Board of Professional Accountants andAuditors, attending the meetings of corporate organs, carrying out periodic checks and meeting with the IndependentAuditors’ managers, the Company’s Internal Control managers and the Executive in charge of drawing up of theCompany’s accounting documents, to exchange information on the activities undertaken by them, and to assess thetimetable of scheduled internal control operations.Pursuant to article 153 of legislative decree no. 58/1998 and section 2429 of the Italian Civil Code, as well as taking in-to account the indications provided by CONSOB, we report the following:• we have supervised and checked compliance with the law and the instruments of incorporation;• the Directors provided us, with the required periodicity, information on the activities undertaken by them, and
on the most significant economic, financial and capital transactions effected by the Company and its subsidiaries,ensuring us that the same were in accordance with law and the articles of association and were not manifest-ly imprudent or risky, in potential conflict of interest, in breach of the resolutions passed by the General Meetingof Shareholders or susceptible of compromising the integrity of the Company’s assets and its business conti-nuity;
• we have not found nor received information from the Board of Directors, the IndependentAuditors or the InternalControl and Corporate Governance Committee regarding the existence of atypical and/or unusual transactionseffected with third parties, related parties or between group companies;
• in the explanatory notes attached to the consolidated financial statements of theTod’s Group, as well as in the ex-planatory notes attached to the separate financial statements of Tod’s S.p.A., the directors have provided an ac-count of the ordinary transactions undertaken with other group companies and/or related parties during thecourse of the financial yearReference is here made to such documents with regard to matters falling within ourpurview, and especially in respect of their features and economic and financial effects.
With regard to such transactions, the Board ofAuditors,with the help of the Board of Directors and the Internal Controland Corporate Governance Committee, checked for the imposition of and compliance with procedures aimed at en-suring that the said transactions are concluded at suitable terms and in the Company’s interest.• since the conditions therefore have not been met, no mention has been made of atypical and/or unusual transac-
tions;• the information pertaining to transactions with group companies and/or related parties, contained, in particular,
in the paragraphs “Transactions with related entities” in the explanatory notes attached to the IAS/IFRS consoli-dated financial statements of theTod’s Group, and “Transactions with related parties” in the explanatory notes tothe separate IAS/IFRS financial statements of Tod’s S.p.A., are adequate in light of the Company’s size and struc-ture;
• we ascertained that the information flows supplied by controlled companies outside EU are adequate in order toaudit annual and interim accounts as provided for by article 36 of Market Regulations adopted by means of Consobresolution no. 16191 of October 29th 2007;
• the independent auditors have expressed an opinion without comment on the financial statements, thereby at-testing that the same are in accordance with the rules governing financial statements;
• neither complaints - pursuant to article 2408 of the Italian Civil Code - nor reports were received during thecourse of the financial year;
• the information received indicates that in 2011,Tod’s S.p.A. did not entrust the Independent Auditors nor any oth-er subjects belonging to the “network” other tasks in addition to those pertaining to the auditing of the financialstatements of the Company and its subsidiaries. Such tasks mainly pertained and referred to the updating of theOrganizational and Managerial Model as provided for by Legislative Decree no. 231/2001.The assessment carriedout by the board of auditors in respect of independence of the auditing firm pursuant to article 19 of LegislativeDecree no. 39/2010, revealed no critical aspects worthy of mention;
142 Report of Statutory Auditors
S.p.A.2011Annual Report
• we checked the correct and adequate application of criteria and procedures adopted by the Board of Directorsin order to verify and assure the independence of its members. Furthermore,we checked that such independencecriteria even apply to the Board of Auditors, in compliance with the principles provided for by the CorporateGovernance;
• during the course of the year we have issued our opinions as provided for by the law;• during the course of the financial year we attended 6 meetings of the Board of Directors and 6 meetings of the
Executive Committee. Furthermore, 8 meetings of the Board of Auditors were held;• to the extent of our powers and purview, we oversaw and checked for compliance with the principles of good
corporate governance and the appropriateness of the organisational structure and the instructions imparted bythe Company to subsidiaries pursuant to article 114, paragraph 2 of Legislative Decree no. 58/1998, through di-rect observation, information gathered during meetings with company officers in charge of corporate organisa-tion, and exchanges of significant information during meetings with the Independent Auditors and with theExecutive in charge of drawing up of the Company’s accounting documents;
• to the extent of our powers and purview, we oversaw and checked, pursuant to article 19 of Legislative Decreeno. 39/2010, the appropriateness and efficacy of the internal control and risk management system, as well as theactivities undertaken by staff in charge of internal control and the administrative/accounting system and the reli-ability of the latter to faithfully reflect corporate management, by obtaining information from the company offi-cers in charge of the relevant corporate departments, examining corporate documents and analysing the resultsof the work undertaken by the Independent Auditors, attending Internal Control and Corporate GovernanceCommittee meetings and meetings with the Executive Director in charge with the supervision of Internal Controlas well as with the Executive in charge of drawing up of the Company’s accounting documents;
• the financial reporting processed was monitored as required pursuant to article 19 of Legislative Decree no.39/2010;
• following the contacts with the corresponding bodies of the subsidiaries, where no members of the board of au-ditors were already present, no material aspects have emerged;
• no significant aspects or issues worthy of mention arose during the meetings held with the Independent Auditorspursuant to article 150(3) of Legislative Decree no. 58/1998, nor have any significant shortfalls been found in theinternal control system as far as the financial reporting process is concerned;
• we checked the procedures for the proper implementation of the rules of corporate governance entrenched inthe Self-Regulatory Code of the Corporate Governance Committee of listed companies, adopted by the Boardof Directors in 2006. At the meeting of November 11th 2011,Tod’s S.p.A’s Board of Directors confirmed Tod’sFrance Sas,Tod’s Japan KK, Deva Inc.,Tod’s Hong Kong Ltd. and Tod’s (Shangai) Trading Co. Ltd – namely thosecompanies which were identified in the meeting held on November 11th 2010, as“strategically significant subsidiaries”;
• through direct checks and information obtained from the Independent Auditors and the Executive in charge ofDrawing up of the Company’s accounting documents, we oversaw compliance with statutory provisions pertain-ing to the preparation and layout of the consolidated financial statements of the Tod’s Group, the separate finan-cial statements of Tod’s S.p.A. and the related reports. Our oversight activities did not reveal any facts warrantinga report to internal control organs or worthy of mention in this report;
• pursuant to article 19 of Legislative Decree no.39/2010, the statutory auditing of the annual accounts and the con-solidated accounts was duly monitored.
The company adopted an Organizational and Managerial Model pursuant to Legislative Decree no. 231/2001 which hasbeen updated by the Board of Directors during its meeting held on March 7th 2012.In light of the above, and with regard to matters falling within our purview, we have not found any reasons hindering theapproval of the financial statements as at December 31st, 2011 and we have no comments to make on the proposed dis-tribution of dividends as recommended in the directors’ report to the separate IAS/IFRS financial statements ofTod’s S.p.A.
Milan, March 20th , 2012The Board of Auditors
Dr. Enrico Colombo - ChairmanDr. Fabrizio Redaelli - Auditor in officeRag. Gilfredo Gaetani - Auditor in office
143 Report of Statutory Auditors
S.p.A.2011Annual Report

REPORT OF INDEPENDENT AUDITORS
145 Report of Independent Auditors
146 Report of Independent Auditors
[THIS PAGE HAS BEEN INTENTIONALLY LEFT BLANK]
147 2011 Annual Report
[THIS PAGE HAS BEEN INTENTIONALLY LEFT BLANK]
148 2011 Annual Report