transient increase in breast cancer risk after giving birth: postpartum period with the highest risk...
TRANSCRIPT

Transient increase in breast cancer risk after giving birth: postpartum period
with the highest risk (Sweden)
Qin Liu1, Joanne Wuu1, Mats Lambe2, Shu-Feng Hsieh1,3, Anders Ekbom2 & Chung-Cheng Hsieh1,*1Division of Biostatistics and Epidemiology, Cancer Center, University of Massachusetts Medical School, Suite 202,373 Plantation Street, Worcester, MA 01605, USA; 2Department of Medical Epidemiology, Karolinska Institute,Stockholm, Sweden; 3Chung Hwa Institute of Technology, Tainan County, Taiwan
Received 12 February 2001; revised version accepted 24 November 2001
Key words: breast cancer, case–control study, parity, pregnancy, regression analysis.
Abstract
Objective: Identify time-points when the elevated postpartum maternal breast cancer risk peaks.Methods: A case–control study nested within the Swedish Fertility Register included 34,018 breast cancer casesfrom the Swedish Cancer Register between 1961 and 1995. From the Fertility Register, 170,001 eligible subjectsmatched to the cases by age were selected as controls. Analysis contrasted risk between uniparous (7084 cases and31,703 controls) and nulliparous (5411 cases and 22,580 controls) women and between biparous (13,239 cases and65,858 controls) and uniparous women. Logistic regression analysis included indicator variables representing eachyear of age, ages at delivery, and time since delivery.Results: Comparing uniparous with nulliparous women the transient increase in maternal breast cancer risk peaked5 years following delivery (odds ratio¼ 1.49, 95% confidence interval 1.01–2.20) and leveled off 15 yearspostpartum. Biparous women had a transient increase in risk that was lower at its peak than that of uniparouswomen, occurring about 3 years following second delivery.Conclusions: A time window of 5 years postpartum when maternal breast cancer risk is highest was observed.Establishing timing of peak transient increase in postpartum breast cancer risk may define the latent period requiredfor pregnancy hormones in promoting progression of breast cells that have undergone early stages of malignanttransformation.
Introduction
There is evidence of a transient increase in breast cancerrisk after giving birth: some investigators have found anassociation between shorter interval since last birth anda higher risk of breast cancer [1, 2]; others have foundthat uniparous women were at higher risk than nulli-parous women in the period immediately after delivery[3, 4]. Several investigators have proposed methods toexamine postpartum time-dependent breast cancer risk.Rosner and Colditz incorporated in their mathematicalmodels of breast cancer incidence rate an immediate,
one-time increase in risk at the time of childbirth [5]. Incase–control studies Lambe et al., and others, modeledrelative risk associated with time-since-delivery usingcontinuous variables and comparing adjacent parities,mainly uniparous versus nulliparous women [3, 4, 6, 7].Linear extrapolation from models using continuousvariables and sample size limitations prevented previousstudies from identifying specific postpartum time-points,if any, when the risk of breast cancer is at its highest.Based on simulated data, Heuch et al. recently proposeda categorical model that could estimate risk associatedwith different periods since childbirth in case–controlstudies while taking age at delivery into consideration[8]. Application of such a model has not been reportedin a case–control study.To better characterize whether the risk of breast
cancer peaks at a certain time after giving birth, we
* Address correspondence to: C.-C. Hsieh, University of Massa-
chusetts Medical School Cancer Center, Suite 202, 373 Plantation
Street, Worcester, MA 01605, USA. Ph.: (508) 856-4780; Fax: (508)
856-2212; E-mail: [email protected]
Cancer Causes and Control 13: 299–305, 2002. 299� 2002 Kluwer Academic Publishers. Printed in the Netherlands.
conducted a large study based on the Swedish nation-wide population registers. To avoid linear-extrapolatedestimates from models using continuous variables inprevious studies, we have applied in this article a single-year categorical modeling approach to examine thepattern of maternal breast cancer risk over time follow-ing delivery.
Subjects and methods
Members of the study cohort were from the nationwideSwedish Fertility Register. The Fertility Register in-cludes all women who were resident citizens of Swedenand who were born in 1925 and thereafter. It containsfertility information on number (including nulliparity),gender, and dates of live births for more than 2.7 millionSwedish women. Information on dates of birth forbiological and adopted children born between 1943 and1960 was collected retrospectively at the 1960 Census.From 1961 only biological children were included, withall new births added annually from vital statisticsrecords. Female residents in Sweden can be identifiedby a unique national registration number assigned toevery Swedish citizen in 1947 and thereafter at birth or,for immigrants, at the time of first residency. The qualityof information on reproductive history (i.e. number anddates of births) is generally high, with the exception ofthe oldest cohorts (mainly women born 1925–1929) forwhom individual fertility levels may be both under- andoverestimated. Use of the unique national registrationnumber permits linkage of information about individ-uals in these registers [9]. Vital statistics for women inthe Fertility Register are updated annually, based oninformation supplied by the Swedish Register of Causesof Death.Since 1958 the Swedish National Cancer Registry has
received reports about all newly diagnosed malignanttumors from both the physician who made the diagnosisand the pathologist/cytologist who confirmed the diag-nosis [10]. Each histopathologically confirmed cancercase is assigned a pathological code. The Cancer Registryalso contains information concerning residence at thetime of diagnosis, as well as the hospital and pathologydepartment where the diagnosis was made. The com-pleteness of cancer registration is considered to be closeto 100% [10].Thus, members of the study cohort were all women
who were born on or after 1925 and listed in theFertility Register. Incident cases of breast canceroccurring from 1961 to 1995 among the cohort mem-bers were ascertained through an updated linkage withthe Cancer Register. We adopted a nested case–control
sampling design to allow more efficient analyses. Casesubjects were cohort members diagnosed with incidentbreast cancer from 1961 to 1995, as ascertained fromthe records of the Swedish National Cancer Register.For each woman with breast cancer, five comparisoncontrol subjects were randomly selected from cohortmembers listed in the Fertility Register. These womenwere individually matched by birth year with the indexcase, were residents of Sweden at the time when thecase was diagnosed, were alive at least to the date ofthe diagnosis for the index case, and had not beenpreviously diagnosed with breast cancer before thisdate. For both cases and controls, only live birthsbefore the index case’s date of diagnosis were includedin the analyses.
Statistical analysis
To detect whether the relative rate of breast cancervaries over time after first delivery, and whether there isa peak in breast cancer risk after giving birth, ouranalysis focused on the exposure contrast betweenadjacent parities, assuming that, without childbirth andwith comparable other risk factors, uniparous womenwould have the same age-specific rates of breast canceras nulliparous women [6]. Similarly, biparous women,given the same age at first birth but without the secondbirth, would have had the same age-specific rates asuniparous women, and so on. To obtain odds ratioestimates associated with single-year time variables wefurther refined the logistic regression model withcategorical predictor variables suggested by Heuchet al. [8]. We generated indicator variables for eachindividual year of subject’s age (attained age, i.e. casesubject’s age at diagnosis or control subject’s age atidentification), age at each delivery and time since lastdelivery. Age was a matching variable and was adjustedin the analyses using single-year indicator variablerepresentation. For time since delivery the first cate-gory (<1 year since delivery) served as the referencecategory. For age at first and second delivery thecategory with the largest number of subjects (age 24 atfirst delivery for uniparous and biparous women, andage 28 at second delivery for biparous women) waschosen as the reference category for stability of effectestimate. For the purpose of graphic presentation wefirst fitted a six-degree polynomial function to categor-ical-specific odds ratio point estimates to identifyvertexes for the smoothed curve over years sincedelivery [11]. We then fitted a quadratic spline modelto the original data using as knots the correspondinginflexion points identified from the fitted polynomialfunctions [12].
300 Q. Liu et al.
Results
Of the 38,922 women registered with a diagnosis ofinvasive breast cancer in the Cancer Register between1961 and 1995, 87.4% had matching information in theFertility Register. Non-matches represent women whohad died or emigrated prior to the 1960 Census, non-Swedish citizens who are on record in the CancerRegistry only, and records with aberrant nationalregistration numbers. A total of 34,018 patients withbreast cancer and 170,001 control subjects was obtainedin this nested case–control study.Our analysis focused first on the comparison between
uniparous and nulliparous women; 5411 cases and22,580 controls were nulliparous while 7084 cases and31,703 controls were uniparous. Table 1 shows thedistribution of these subjects according to age atdiagnosis and age at delivery.Table 2 shows odds ratio estimates and 95% confi-
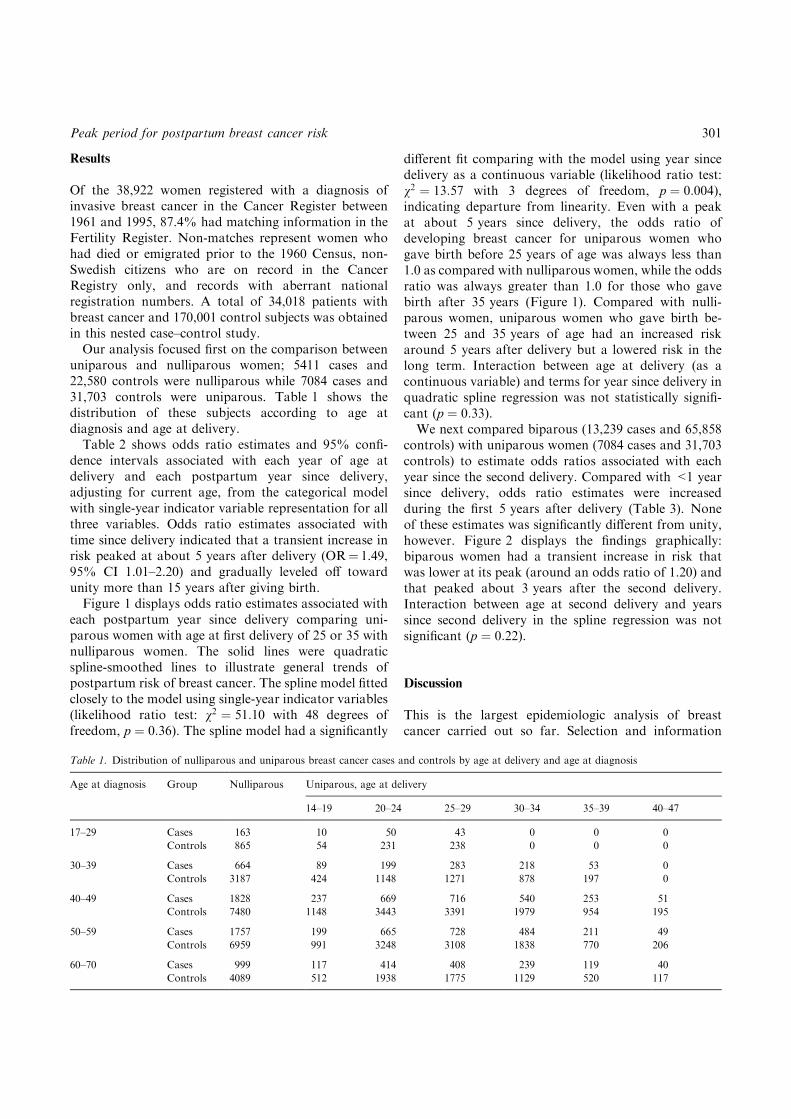
dence intervals associated with each year of age atdelivery and each postpartum year since delivery,adjusting for current age, from the categorical modelwith single-year indicator variable representation for allthree variables. Odds ratio estimates associated withtime since delivery indicated that a transient increase inrisk peaked at about 5 years after delivery (OR¼ 1.49,95% CI 1.01–2.20) and gradually leveled off towardunity more than 15 years after giving birth.Figure 1 displays odds ratio estimates associated with
each postpartum year since delivery comparing uni-parous women with age at first delivery of 25 or 35 withnulliparous women. The solid lines were quadraticspline-smoothed lines to illustrate general trends ofpostpartum risk of breast cancer. The spline model fittedclosely to the model using single-year indicator variables(likelihood ratio test: v2 ¼ 51:10 with 48 degrees offreedom, p ¼ 0:36). The spline model had a significantly
different fit comparing with the model using year sincedelivery as a continuous variable (likelihood ratio test:v2 ¼ 13:57 with 3 degrees of freedom, p ¼ 0:004),indicating departure from linearity. Even with a peakat about 5 years since delivery, the odds ratio ofdeveloping breast cancer for uniparous women whogave birth before 25 years of age was always less than1.0 as compared with nulliparous women, while the oddsratio was always greater than 1.0 for those who gavebirth after 35 years (Figure 1). Compared with nulli-parous women, uniparous women who gave birth be-tween 25 and 35 years of age had an increased riskaround 5 years after delivery but a lowered risk in thelong term. Interaction between age at delivery (as acontinuous variable) and terms for year since delivery inquadratic spline regression was not statistically signifi-cant (p ¼ 0:33).We next compared biparous (13,239 cases and 65,858
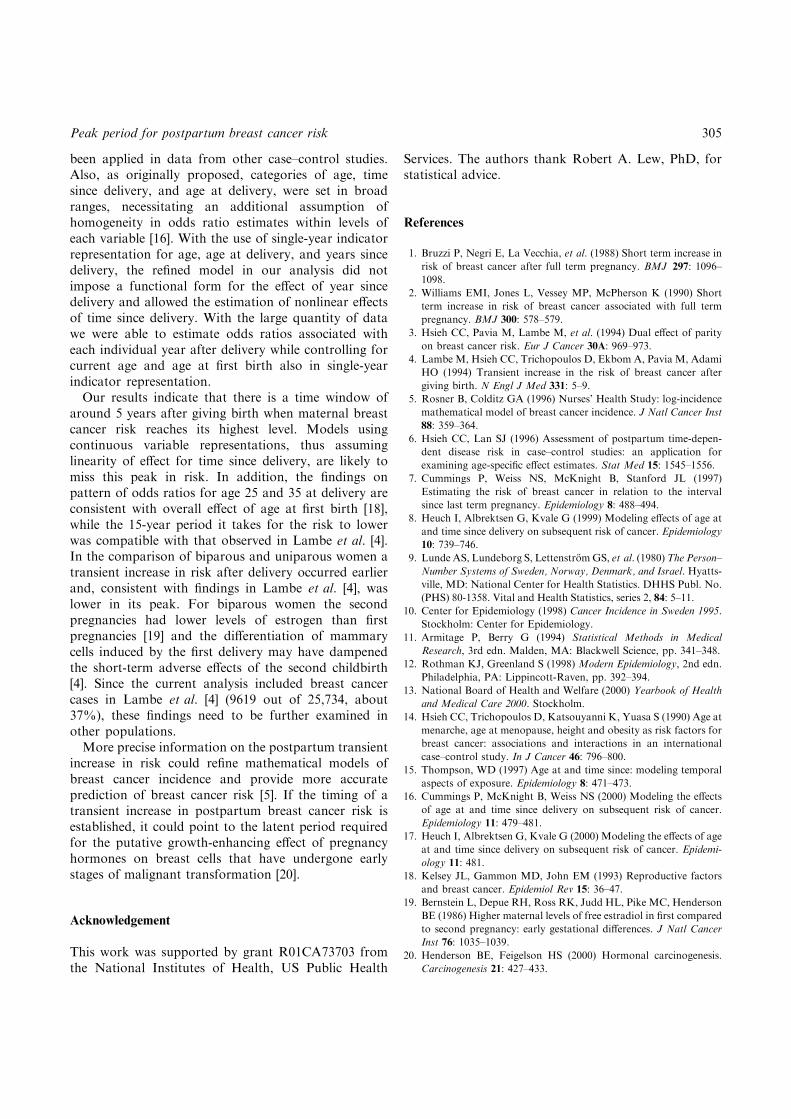
controls) with uniparous women (7084 cases and 31,703controls) to estimate odds ratios associated with eachyear since the second delivery. Compared with <1 yearsince delivery, odds ratio estimates were increasedduring the first 5 years after delivery (Table 3). Noneof these estimates was significantly different from unity,however. Figure 2 displays the findings graphically:biparous women had a transient increase in risk thatwas lower at its peak (around an odds ratio of 1.20) andthat peaked about 3 years after the second delivery.Interaction between age at second delivery and yearssince second delivery in the spline regression was notsignificant (p ¼ 0:22).
Discussion
This is the largest epidemiologic analysis of breastcancer carried out so far. Selection and information
Table 1. Distribution of nulliparous and uniparous breast cancer cases and controls by age at delivery and age at diagnosis
Age at diagnosis Group Nulliparous Uniparous, age at delivery
14–19 20–24 25–29 30–34 35–39 40–47
17–29 Cases 163 10 50 43 0 0 0
Controls 865 54 231 238 0 0 0
30–39 Cases 664 89 199 283 218 53 0
Controls 3187 424 1148 1271 878 197 0
40–49 Cases 1828 237 669 716 540 253 51
Controls 7480 1148 3443 3391 1979 954 195
50–59 Cases 1757 199 665 728 484 211 49
Controls 6959 991 3248 3108 1838 770 206
60–70 Cases 999 117 414 408 239 119 40
Controls 4089 512 1938 1775 1129 520 117
Peak period for postpartum breast cancer risk 301

biases are minimized in this study, since the case–controlsampling was nested within a well-defined cohort andthe exposure information was recorded independent ofoutcome. The database contains no information on stillbirths, and recorded parity status is based on number oflive births. However, still births represented only a smallproportion of all births in Sweden. In 1955 there were16.7 still births per 1000 births (1.67%). The corre-sponding figure for 1985 was 3.9 per 1000 births (0.39%)[13]. Possible residual bias from excluding still birthsand misclassification of parity from adopted children fora small number of subjects in the oldest birth cohorts islikely to be negligible and non-differential. We could notexamine and control for confounding by age at menar-
Table 2. Odds ratios and 95% confidence intervals (CI) of developing
breast cancer in uniparous women, based on single-year categorical
model with separate terms for age at first delivery and time since
delivery
Variables Cases
(n)
Controls
(n)
Odds
ratio
95% confidence
interval
Parity
Nulliparous 5411 22,580 1.00 reference
Uniparousa 7084 31,703 0.82 0.69 0.97
Age at delivery (years)
14 0 4 0.00 0.00 115 9 31 1.48 0.70 3.15
16 33 176 0.96 0.65 1.41
17 98 521 0.96 0.75 1.22
18 214 979 1.10 0.92 1.32
19 298 1418 1.06 0.90 1.25
20 364 1938 0.94 0.81 1.10
21 380 1889 1.01 0.87 1.17
22 403 1886 1.07 0.92 1.24
23 392 2007 0.98 0.84 1.13
24 458 2288 1.00 reference
25 406 2130 0.95 0.82 1.10
26 500 2087 1.19 1.03 1.37
27 414 1950 1.06 0.91 1.22
28 490 1987 1.21 1.05 1.40
29 368 1629 1.11 0.95 1.30
30 355 1465 1.19 1.01 1.39
31 330 1347 1.19 1.01 1.40
32 321 1214 1.29 1.09 1.52
33 237 985 1.15 0.96 1.38
34 238 813 1.39 1.16 1.68
35 178 675 1.24 1.01 1.53
36 172 694 1.15 0.94 1.42
37 136 423 1.49 1.18 1.88
38 89 357 1.14 0.88 1.49
39 61 292 0.95 0.70 1.29
40 63 224 1.28 0.94 1.75
41 34 125 1.19 0.80 1.79
42 22 72 1.35 0.82 2.22
43 11 49 0.96 0.49 1.89
44 8 28 1.24 0.56 2.76
45 1 17 0.26 0.03 1.97
46 1 2 2.24 0.20 25.30
47 1 0 1 0.00 1
Years since delivery
<1 36 174 1.00 reference
1 76 345 1.14 0.75 1.74
2 95 384 1.29 0.86 1.92
3 76 332 1.17 0.77 1.76
4 93 343 1.37 0.93 2.04
5 94 317 1.49 1.01 2.20
6 102 354 1.43 0.98 2.09
7 105 368 1.40 0.97 2.04
8 103 423 1.18 0.82 1.71
9 87 509 0.82 0.56 1.19
10 112 509 1.06 0.74 1.51
11 139 606 1.10 0.79 1.54
12 156 594 1.25 0.90 1.74
13 145 673 1.02 0.74 1.42
14 179 763 1.11 0.81 1.52
Table 2. (Continued)
15 184 762 1.15 0.84 1.56
16 188 878 1.02 0.75 1.37
17 209 905 1.08 0.81 1.45
18 228 1028 1.05 0.79 1.39
19 219 958 1.08 0.82 1.43
20 220 1080 0.96 0.73 1.26
21 218 1043 0.99 0.76 1.30
22 265 1095 1.14 0.88 1.48
23 246 1098 1.05 0.81 1.35
24 228 1134 0.93 0.73 1.20
25 245 1098 1.03 0.81 1.32
26 257 1109 1.08 0.85 1.37
27 239 1062 1.05 0.83 1.33
28 227 1082 0.98 0.78 1.24
29 243 979 1.14 0.91 1.43
30 206 946 0.95 0.76 1.20
31 185 919 0.92 0.73 1.15
32 166 847 0.94 0.75 1.17
33 173 838 0.97 0.78 1.21
34 169 762 1.04 0.84 1.29
35 163 687 1.15 0.93 1.42
36 150 658 0.98 0.79 1.21
37 133 631 0.99 0.80 1.23
38 103 557 0.89 0.72 1.11
39 126 561 1.17 0.95 1.43
40 94 438 1.10 0.90 1.36
41 80 420 0.98 0.80 1.21
42 75 371 1.16 0.95 1.42
43 68 255 1.16 0.94 1.44
44 52 231 0.93 0.75 1.14
45 37 170 1.14 0.93 1.40
46 29 152 1.06 0.86 1.30
47 26 111 1.09 0.89 1.32
48 19 72 0.92 0.76 1.12
49 7 42 1.09 0.88 1.34
50 7 16 1.00 0.81 1.24
51 11 1 1.06 0.85 1.32
52 3 1 1.17 0.94 1.46
a For uniparous women with age at delivery = 24 years and time
since delivery = 0 years, relative to nulliparous women, adjusting for
age in single-year indicator representation.
302 Q. Liu et al.

che, age at menopause, and anthropometric factors. Themagnitude of collective confounding by these factors islikely to be small, however [14]. Confounding by age,parity, and age at first delivery is likely to be moresubstantial and was accounted for in this analysis.Due to sample size limitation, most previous studies
on the time-varying effects of childbirth on maternalbreast cancer risk fit models using continuous forms forage, age at delivery, and year since delivery [6–8, 15].Consequently, effect estimates for extreme categorieswere derived from linearly extrapolated values fromsuch models and yearly variations in postpartum riskcould not be determined.In the model using categorical variables as suggested
by Heuch et al. [8], relative risk associated withdifferent periods since childbirth could be estimatedwhile taking age and age at delivery into consideration.The validity of that model depends on the tenability ofat least two assumptions: (1) the effects of age are thesame for uniparous and nulliparous women and (2) theeffect of age at delivery was homogeneous over age(not modified by age) [16]. The two assumptions were,however, judged to impose no restriction on theinterpretation of the effect of time since delivery [17].To understand better, the model in our analysis can bepartitioned into two parts: the first is a model with age(baseline effect) using the data of nulliparous women;the second is a model with age and age at delivery for
Fig. 1. Odds ratio estimates associated with each year since delivery
for uniparous women with age at delivery of 25 (e) or 35 (·) ascompared with nulliparous women. Solid lines represent fitted results
from quadratic spline logistic regression. The quadratic spline logistic
regression core model is:
b0 þ bp (parity) þ ba (age) þ baafd (age at first delivery) þ b1x1þb2x
21 þ b3x
22 þ b4x
23
where age and age at first delivery are 1-year categorical time variables;
x1 is the continuous variable of years since first delivery; x2¼ x1 ) 7 ifx1 > 7, otherwise x2¼ 0; x3¼x1 ) 15 if x1 > 15, otherwise x3¼ 0;b1 ¼ 0:0912; b2 ¼ �0:0097; b3 ¼ 0:0121; b4 ¼ �0:0023.
Table 3. Odds ratios and 95% confidence intervals (CI) of developing
breast cancer in biparous women, based on single-year categorical
model with separate terms for age at first and second delivery and year
since second delivery
Variables Cases
(n)
Controls
(n)
Odds
ratio
95% confidence
interval
Parity
Uniparous 7084 31,703 1.00 reference
Biparousa 13,239 65,858 0.97 0.71 1.33
Age at first delivery (years)
14 2 12 0.85 0.19 3.79
15 18 89 1.07 0.64 1.80
16 120 608 1.04 0.84 1.29
17 344 1925 0.95 0.83 1.09
18 708 3586 1.05 0.95 1.17
19 983 5375 0.99 0.90 1.08
20 1308 7226 0.98 0.91 1.07
21 1355 7321 1.01 0.93 1.10
22 1460 7646 1.04 0.96 1.12
23 1541 8154 1.01 0.93 1.09
24 1700 8890 1.00 reference
25 1600 7740 1.07 0.99 1.16
26 1530 7232 1.10 1.01 1.18
27 1382 6263 1.14 1.05 1.24
28 1315 5723 1.18 1.09 1.29
29 1005 4248 1.21 1.11 1.33
30 832 3418 1.24 1.13 1.37
31 689 2795 1.25 1.13 1.39
32 607 2325 1.33 1.19 1.48
33 420 1684 1.28 1.13 1.45
34 348 1327 1.36 1.19 1.55
35 285 1061 1.39 1.20 1.61
36 247 976 1.29 1.11 1.51
37 172 576 1.51 1.26 1.81
38 118 448 1.34 1.08 1.66
39 74 341 1.10 0.85 1.42
40 74 252 1.45 1.11 1.89
41 39 137 1.39 0.97 2.00
42 25 77 1.55 0.98 2.47
43 12 54 1.01 0.53 1.93
44 8 30 1.24 0.56 2.73
45 1 17 0.29 0.04 2.21
46 1 3 1.76 0.17 17.92
47 0 1 0.00 0.00 149 0 1 0.00 0.00 1
Age at second delivery (years)
16 2 6 1.79 0.35 9.00
17 2 29 0.37 0.09 1.57
18 28 140 1.07 0.70 1.63
19 82 407 1.07 0.82 1.38
20 193 958 1.05 0.88 1.26
21 279 1548 0.95 0.82 1.11
22 440 2433 0.95 0.84 1.08
23 542 3071 0.93 0.83 1.05
24 712 4299 0.86 0.78 0.96
25 834 4735 0.91 0.82 1.01
26 946 5259 0.93 0.84 1.02
27 1108 5635 1.00 0.91 1.09
28 1232 6111 1.00 reference
29 1116 5453 0.99 0.90 1.08
Peak period for postpartum breast cancer risk 303

uniparous women. Assuming that, without childbirth,uniparous women would have the same baseline ageeffect as nulliparous women [6], odds ratio comparinguniparous with nulliparous women could be estimatedby subtracting the first from the second model. Theresidual effect of age (after removing the baseline effectof age) for uniparous women could then be furtherdecomposed into age at delivery and year sincedelivery. The model in Heuch et al. [8] has not yet
Table 3. (Continued)
Variables Cases
(n)
Controls
(n)
Odds
ratio
95% confidence
interval
30 1029 5090 0.95 0.86 1.04
31 965 4488 0.98 0.89 1.08
32 884 4014 0.98 0.88 1.08
33 682 3010 0.99 0.88 1.10
34 581 2393 1.03 0.92 1.16
35 463 1912 1.01 0.89 1.15
36 356 1549 0.94 0.82 1.08
37 241 1136 0.85 0.73 1.00
38 169 783 0.86 0.71 1.03
39 141 526 1.05 0.85 1.28
40 94 399 0.91 0.72 1.16
41 57 237 0.94 0.70 1.28
42 24 126 0.73 0.47 1.14
43 19 57 1.29 0.76 2.20
44 8 37 0.78 0.36 1.70
45 8 10 3.09 1.19 8.02
46 1 6 0.61 0.07 5.38
47 1 0 1 0.00 151 0 1 – – –
Years since second delivery
<1 53 257 1.00 reference
1 164 620 1.27 0.90 1.80
2 159 621 1.25 0.89 1.76
3 179 720 1.22 0.87 1.72
4 196 844 1.14 0.81 1.59
5 216 860 1.24 0.89 1.74
6 224 1067 1.04 0.75 1.46
7 233 1096 1.07 0.77 1.49
8 266 1254 1.06 0.77 1.48
9 312 1240 1.26 0.91 1.75
10 331 1529 1.09 0.78 1.50
11 319 1598 1.00 0.72 1.39
12 353 1864 0.95 0.68 1.31
13 422 1938 1.09 0.79 1.51
14 453 2105 1.08 0.79 1.50
15 460 2248 1.03 0.74 1.42
16 481 2329 1.04 0.75 1.43
17 461 2500 0.93 0.67 1.28
18 533 2571 1.04 0.76 1.44
19 560 2658 1.06 0.77 1.46
20 553 2652 1.04 0.76 1.44
21 487 2654 0.92 0.67 1.28
22 491 2667 0.93 0.67 1.28
23 488 2565 0.96 0.69 1.33
24 486 2526 0.96 0.70 1.33
25 443 2403 0.92 0.67 1.28
26 450 2256 1.00 0.72 1.39
27 361 2104 0.86 0.62 1.20
28 406 2009 1.01 0.73 1.40
29 378 1924 0.98 0.71 1.37
30 336 1642 1.03 0.74 1.44
31 280 1553 0.92 0.65 1.28
32 291 1413 1.05 0.75 1.48
33 244 1281 0.98 0.69 1.38
34 203 1143 0.92 0.65 1.30
35 195 927 1.10 0.78 1.57
36 153 915 0.88 0.61 1.26
37 147 752 1.04 0.72 1.49
Table 3. (Continued)
38 110 599 0.99 0.68 1.44
39 94 510 1.00 0.68 1.47
40 75 409 0.99 0.66 1.49
41 68 301 1.23 0.81 1.87
42 38 247 0.84 0.53 1.35
43 35 170 1.13 0.69 1.84
44 20 144 0.76 0.43 1.35
45 15 87 0.96 0.50 1.82
46 10 43 1.29 0.60 2.79
47 1 17 0.31 0.04 2.41
48 5 14 1.81 0.61 5.38
49 1 8 0.79 0.09 6.67
50 0 3 0.00 0.00 151 0 1 0.00 0.00 1
a For biparous women with age at second delivery¼ 28 years andtime since second delivery¼ 0 years, relative to uniparous women withthe same age at first delivery, adjusting for age in single-year indicator
representation.
Fig. 2. Odds ratio estimates associated with each year since second
delivery for biparous women with age at second delivery of 25 (e) or
35 (·) as compared with uniparous women. Solid lines represent fittedresults from quadratic spline logistic regression. The quadratic spline
logistic regression core model is:
b0þp (parity) + ba (age) + baafd (age at first delivery)þbaasd (age atsecond delivery) + b1x1 þ b2x
21 þ b3x
22 þ b4x
23
where age, age at first delivery, and age at second delivery are 1-year
categorical time variables; x1 is the continuous variable of years since
second delivery; x2¼ x1 ) 1 if x1 > 1, otherwise x2¼ 0; x3¼x1 ) 15 ifx1>15, otherwise x3¼ 0; b1 ¼ 0:4717; b2 ¼ �0:2463; b3 ¼ 0:2468;
b4 ¼ �0:0002.
304 Q. Liu et al.
been applied in data from other case–control studies.Also, as originally proposed, categories of age, timesince delivery, and age at delivery, were set in broadranges, necessitating an additional assumption ofhomogeneity in odds ratio estimates within levels ofeach variable [16]. With the use of single-year indicatorrepresentation for age, age at delivery, and years sincedelivery, the refined model in our analysis did notimpose a functional form for the effect of year sincedelivery and allowed the estimation of nonlinear effectsof time since delivery. With the large quantity of datawe were able to estimate odds ratios associated witheach individual year after delivery while controlling forcurrent age and age at first birth also in single-yearindicator representation.Our results indicate that there is a time window of
around 5 years after giving birth when maternal breastcancer risk reaches its highest level. Models usingcontinuous variable representations, thus assuminglinearity of effect for time since delivery, are likely tomiss this peak in risk. In addition, the findings onpattern of odds ratios for age 25 and 35 at delivery areconsistent with overall effect of age at first birth [18],while the 15-year period it takes for the risk to lowerwas compatible with that observed in Lambe et al. [4].In the comparison of biparous and uniparous women atransient increase in risk after delivery occurred earlierand, consistent with findings in Lambe et al. [4], waslower in its peak. For biparous women the secondpregnancies had lower levels of estrogen than firstpregnancies [19] and the differentiation of mammarycells induced by the first delivery may have dampenedthe short-term adverse effects of the second childbirth[4]. Since the current analysis included breast cancercases in Lambe et al. [4] (9619 out of 25,734, about37%), these findings need to be further examined inother populations.More precise information on the postpartum transient
increase in risk could refine mathematical models ofbreast cancer incidence and provide more accurateprediction of breast cancer risk [5]. If the timing of atransient increase in postpartum breast cancer risk isestablished, it could point to the latent period requiredfor the putative growth-enhancing effect of pregnancyhormones on breast cells that have undergone earlystages of malignant transformation [20].
Acknowledgement
This work was supported by grant R01CA73703 fromthe National Institutes of Health, US Public Health
Services. The authors thank Robert A. Lew, PhD, forstatistical advice.
References
1. Bruzzi P, Negri E, La Vecchia, et al. (1988) Short term increase in
risk of breast cancer after full term pregnancy. BMJ 297: 1096–
1098.
2. Williams EMI, Jones L, Vessey MP, McPherson K (1990) Short
term increase in risk of breast cancer associated with full term
pregnancy. BMJ 300: 578–579.
3. Hsieh CC, Pavia M, Lambe M, et al. (1994) Dual effect of parity
on breast cancer risk. Eur J Cancer 30A: 969–973.
4. Lambe M, Hsieh CC, Trichopoulos D, Ekbom A, Pavia M, Adami
HO (1994) Transient increase in the risk of breast cancer after
giving birth. N Engl J Med 331: 5–9.
5. Rosner B, Colditz GA (1996) Nurses’ Health Study: log-incidence
mathematical model of breast cancer incidence. J Natl Cancer Inst
88: 359–364.
6. Hsieh CC, Lan SJ (1996) Assessment of postpartum time-depen-
dent disease risk in case–control studies: an application for
examining age-specific effect estimates. Stat Med 15: 1545–1556.
7. Cummings P, Weiss NS, McKnight B, Stanford JL (1997)
Estimating the risk of breast cancer in relation to the interval
since last term pregnancy. Epidemiology 8: 488–494.
8. Heuch I, Albrektsen G, Kvale G (1999) Modeling effects of age at
and time since delivery on subsequent risk of cancer. Epidemiology
10: 739–746.
9. Lunde AS, Lundeborg S, LettenstromGS, et al. (1980) The Person–
Number Systems of Sweden, Norway, Denmark, and Israel. Hyatts-
ville, MD: National Center for Health Statistics. DHHS Publ. No.
(PHS) 80-1358. Vital and Health Statistics, series 2, 84: 5–11.
10. Center for Epidemiology (1998) Cancer Incidence in Sweden 1995.
Stockholm: Center for Epidemiology.
11. Armitage P, Berry G (1994) Statistical Methods in Medical
Research, 3rd edn. Malden, MA: Blackwell Science, pp. 341–348.
12. Rothman KJ, Greenland S (1998)Modern Epidemiology, 2nd edn.
Philadelphia, PA: Lippincott-Raven, pp. 392–394.
13. National Board of Health and Welfare (2000) Yearbook of Health
and Medical Care 2000. Stockholm.
14. Hsieh CC, Trichopoulos D, Katsouyanni K, Yuasa S (1990) Age at
menarche, age at menopause, height and obesity as risk factors for
breast cancer: associations and interactions in an international
case–control study. In J Cancer 46: 796–800.
15. Thompson, WD (1997) Age at and time since: modeling temporal
aspects of exposure. Epidemiology 8: 471–473.
16. Cummings P, McKnight B, Weiss NS (2000) Modeling the effects
of age at and time since delivery on subsequent risk of cancer.
Epidemiology 11: 479–481.
17. Heuch I, Albrektsen G, Kvale G (2000) Modeling the effects of age
at and time since delivery on subsequent risk of cancer. Epidemi-
ology 11: 481.
18. Kelsey JL, Gammon MD, John EM (1993) Reproductive factors
and breast cancer. Epidemiol Rev 15: 36–47.
19. Bernstein L, Depue RH, Ross RK, Judd HL, Pike MC, Henderson
BE (1986) Higher maternal levels of free estradiol in first compared
to second pregnancy: early gestational differences. J Natl Cancer
Inst 76: 1035–1039.
20. Henderson BE, Feigelson HS (2000) Hormonal carcinogenesis.
Carcinogenesis 21: 427–433.
Peak period for postpartum breast cancer risk 305