transcriptomic analysis of the oleaginous microalga neochloris
TRANSCRIPT
Rismani-Yazdi et al. Biotechnology for Biofuels 2012, 5:74http://www.biotechnologyforbiofuels.com/content/5/1/74
RESEARCH Open Access
Transcriptomic analysis of the oleaginousmicroalga Neochloris oleoabundans revealsmetabolic insights into triacylglycerideaccumulationHamid Rismani-Yazdi1,2, Berat Z Haznedaroglu1, Carol Hsin1 and Jordan Peccia1*
Abstract
Background: The lack of sequenced genomes for oleaginous microalgae limits our understanding of themechanisms these organisms utilize to become enriched in triglycerides. Here we report the de novo transcriptomeassembly and quantitative gene expression analysis of the oleaginous microalga Neochloris oleoabundans, with a focuson the complex interaction of pathways associated with the production of the triacylglycerol (TAG) biofuel precursor.
Results: After growth under nitrogen replete and nitrogen limiting conditions, we quantified the cellular content ofmajor biomolecules including total lipids, triacylglycerides, starch, protein, and chlorophyll. Transcribed genes weresequenced, the transcriptome was assembled de novo, and the expression of major functional categories, relevantpathways, and important genes was quantified through the mapping of reads to the transcriptome. Over 87 million,77 base pair high quality reads were produced on the Illumina HiSeq sequencing platform. Metabolite measurementssupported by genes and pathway expression results indicated that under the nitrogen-limiting condition, carbon ispartitioned toward triglyceride production, which increased fivefold over the nitrogen-replete control. In addition tothe observed overexpression of the fatty acid synthesis pathway, TAG production during nitrogen limitation wasbolstered by repression of the β-oxidation pathway, up-regulation of genes encoding for the pyruvate dehydrogenasecomplex which funnels acetyl-CoA to lipid biosynthesis, activation of the pentose phosphate pathway to supplyreducing equivalents to inorganic nitrogen assimilation and fatty acid biosynthesis, and the up-regulation oflipases—presumably to reconstruct cell membranes in order to supply additional fatty acids for TAG biosynthesis.
Conclusions: Our quantitative transcriptome study reveals a broad overview of how nitrogen stress results inexcess TAG production in N. oleoabundans, and provides a variety of genetic engineering targets and strategiesfor focused efforts to improve the production rate and cellular content of biofuel precursors in oleaginous microalgae.
Keywords: Microalgae, Biofuel, de novo transcriptomics, Nitrogen limitation, RNA-Seq, Gene expression, Triacylglyceride,Triglyceride, Neochloris oleoabundans
BackgroundImportant advantages of microalgae-based biofuels overfirst generation biofuels include algae’s greater solar en-ergy conversion efficiency compared to land plants [1],the ability of oleaginous microalgae to utilize non-arableland and saline or waste-water, and their high content of
* Correspondence: [email protected] of Chemical and Environmental Engineering, Yale University, 9Hillhouse Ave, New Haven, CT 06520, USAFull list of author information is available at the end of the article
© 2012 Rismani-Yazdi et al.; licensee BioMed CCreative Commons Attribution License (http:/distribution, and reproduction in any medium
energy dense neutral lipids that can be readily transester-ified to produce biodiesel [2,3]. Under stress conditionssuch as nutrient deprivation or high light intensity, sev-eral species of oleaginous microalgae can alter lipid bio-synthetic pathways to produce intracellular total lipidcontents between 30 to 60% of dry cell weight (DCW)[4]. Triacylglycerides (TAGs) are the dominant form oflipids produced under these conditions. The excess pro-duction of TAGs in microalgae is thought to play a role
entral Ltd. This is an Open Access article distributed under the terms of the/creativecommons.org/licenses/by/2.0), which permits unrestricted use,, provided the original work is properly cited.

Rismani-Yazdi et al. Biotechnology for Biofuels 2012, 5:74 Page 2 of 16http://www.biotechnologyforbiofuels.com/content/5/1/74
in carbon and energy storage and functions as part of thecell’s stress response [5].Due to the limited understanding of microalgae genetics
and physiology, lipid metabolism from higher plants andbacteria have been the basis from which the accumulationof TAGs in microalgae has been modeled [5]. TAGs andpolar membrane lipids are synthesized from fatty acids,that are primarily produced in the chloroplast [6]. Thecommitted step in fatty acid biosynthesis starts with theconversion of acetyl CoA to malonyl CoA through the en-zyme acetyl CoA carboxylase (ACCase). In some plants,there is evidence that both photosynthesis- and glycolysis-derived pyruvate could be endogenous sources of acetylCoA pool for fatty acid biosynthesis [5]. Fatty acid produc-tion in E. coli is regulated through feedback-inhibition bylong chain fatty acyl carrier proteins (ACP) [7,8], and a re-cent study in the microalgae Phaeodactylum tricornutumdemonstrated that overexpression of genes that encodefor the thioesterases that hydrolyze the thioester bond oflong chain fatty acyl ACPs resulted in a significant in-crease in fatty acid production [9]. Recent nitrogendeprivation studies in the model, nonoleaginous microalgaChlamydomonas reinhardtii have also suggested an im-portant role for lipases in restructuring the cell membraneunder nitrogen limitation in order to supply fatty acids forTAG biosynthesis [10].The stress-induced production of TAGs provides an op-
portunity to observe differential gene expression betweenhigh and low TAG accumulating phenotypes. Becausemultiple pathways are associated with the enhanced pro-duction of neutral lipids in microalgae, transcriptomicstudies are an appropriate tool to provide an initial, broadview of carbon partitioning [11] and regulation of TAGbiosynthesis during microalgae stress responses. However,the most promising strains thus far identified by growthexperiments and lipid content screening [4,12] do nothave sequenced, fully annotated genomes [13-15]. Inmicroalgae, transcriptomic studies have instead focuses onmodel organisms that are not oleaginous but havesequenced genomes [10,16]. There is a growing numberof oleaginous microalgae from which de novo transcrip-tomes have been assembled and annotated but compre-hensive quantitative gene expression analysis in thesemicroalgae has not yet been performed [14,17-19]. Re-cently, a de novo assembled-transcriptome was used as asearch model to enable a proteomic analysis of the ole-aginous microalga Chlorella vulgaris that demonstratedup-regulation of fatty acid and TAG biosynthetic pathwaysin response to nitrogen limitations [13].In the present study, we quantitatively analyzed the
transcriptome of the oleaginous microalga Neochlorisoleoabundans to elucidate the metabolic pathway inter-actions and regulatory mechanisms involved in the ac-cumulation of TAG. N. oleoabundans (a taxonomic
synonym of Ettlia oleoabundans [20]) is a unicellulargreen microalga belonging to the Chlorophyta phylum(class Chlorophyceae). It is known to produce large quan-tities of lipids (35 to 55% dry cell weight total lipids andgreater than 10% TAGs) [4,12,21] in response to physio-logical stresses caused by nitrogen deprivation. To pro-duce differences in lipid enrichment, N. oleoabundans wascultured under nitrogen replete and nitrogen limited con-ditions and major biomolecules including total lipids,TAGs, starch, protein, and chlorophyll were measured.The transcriptome was sequenced and assembled de novo,gene expression was quantified, and comparative analysisof genes, pathways and broader gene ontology categorieswas conducted. The results provide new insight into theregulation of lipid metabolism in oleaginous microalgae atthe transcriptomic level, and suggest several potentialstrategies to improve lipid production in microalgae basedon a rational genetic engineering approach.
ResultsMajor biomolecule content and composition differbetween the nitrogen replete (+N) and nitrogen-limited(−N) growth environmentsTo track gene transcription in the oleaginous microalgaN. oleoabundans, cells were first grown under + N and−N conditions as a method to produce differential cellularenrichments of TAGs. Cells were harvested after 11 days.This sampling time corresponded to below detectionlevel concentrations for NO3
- and a reduction in growthrate in the –N reactors (Figure 1A, B). The maximumgrowth rate for the –N cultures was 113 ± 4 (std. err.)mgl-1 day-1 and decreased to 34 ± 0.7 mgl-1 day-1 oncenitrogen became limited in the reactor. Total lipidsextracted under the + N and −N scenarios revealed astatistically significant increase (p < 0.05) from 22%DCW in +N to 36% in the −N condition (Figure 1C).Extracted lipids were transesterified and fatty acid me-thyl esters (FAMEs) (FAMEs assumed to be equivalentto TAGs content [22]), were quantified. Compared tothe + N condition, the FAME or TAG content per cellmass increased by five times in the −N case (p <0.05),demonstrating that the additional lipids produced duringN limitations were mostly TAGs (Figure 1C). Estimatesof total cell mass based on direct microscopic countsand DCW determinations revealed that the average massof a cell in −N was 81% of that in +N, confirming thatthe change in TAG was independent of changes inDCW. FAME profiles are presented in Figure 1D, andshow a 50% decrease in the proportion of unsaturatedfatty acids (i.e. C16:2, C16:3, C16:4, C18:2, and C18:3)under nitrogen limitation. The most significant changewas in the amount of oleic acid (C18:1), which increasedover 5 times, while the quantity of α-linoleic acid(C18:3) decreased by 4.8-fold under –N conditions. This
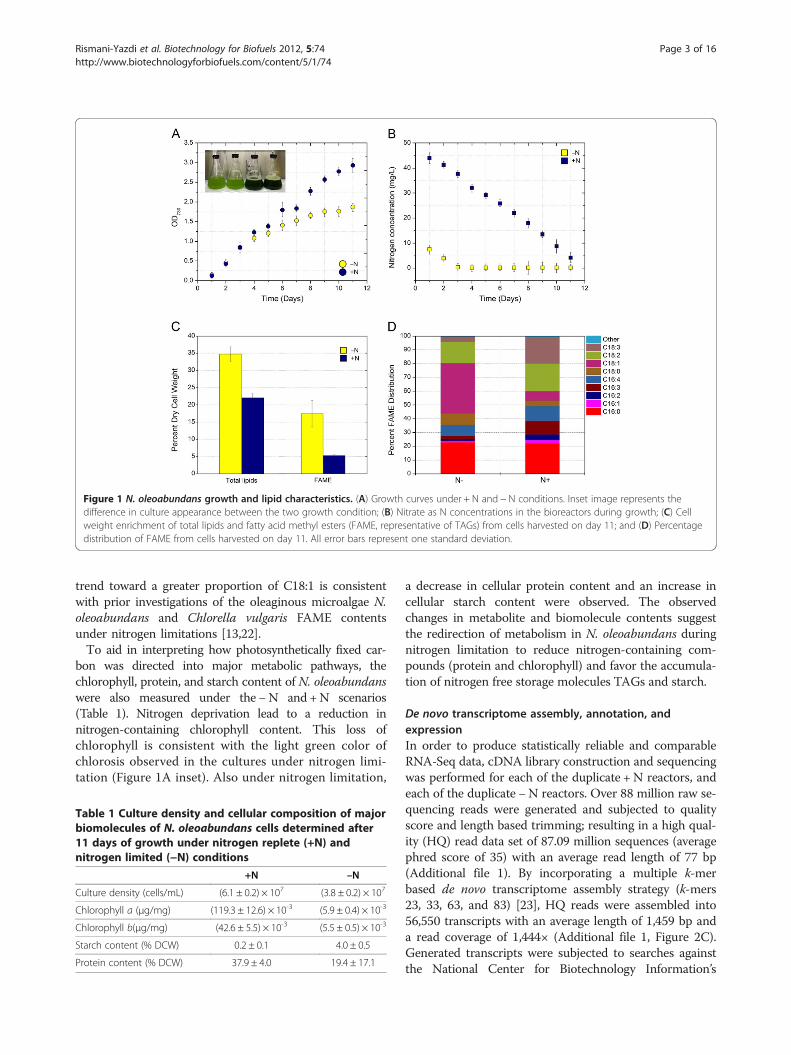
Figure 1 N. oleoabundans growth and lipid characteristics. (A) Growth curves under + N and − N conditions. Inset image represents thedifference in culture appearance between the two growth condition; (B) Nitrate as N concentrations in the bioreactors during growth; (C) Cellweight enrichment of total lipids and fatty acid methyl esters (FAME, representative of TAGs) from cells harvested on day 11; and (D) Percentagedistribution of FAME from cells harvested on day 11. All error bars represent one standard deviation.
Rismani-Yazdi et al. Biotechnology for Biofuels 2012, 5:74 Page 3 of 16http://www.biotechnologyforbiofuels.com/content/5/1/74
trend toward a greater proportion of C18:1 is consistentwith prior investigations of the oleaginous microalgae N.oleoabundans and Chlorella vulgaris FAME contentsunder nitrogen limitations [13,22].To aid in interpreting how photosynthetically fixed car-
bon was directed into major metabolic pathways, thechlorophyll, protein, and starch content of N. oleoabundanswere also measured under the −N and +N scenarios(Table 1). Nitrogen deprivation lead to a reduction innitrogen-containing chlorophyll content. This loss ofchlorophyll is consistent with the light green color ofchlorosis observed in the cultures under nitrogen limi-tation (Figure 1A inset). Also under nitrogen limitation,
Table 1 Culture density and cellular composition of majorbiomolecules of N. oleoabundans cells determined after11 days of growth under nitrogen replete (+N) andnitrogen limited (−N) conditions
+N –N
Culture density (cells/mL) (6.1 ± 0.2) × 107 (3.8 ± 0.2) × 107
Chlorophyll a (μg/mg) (119.3 ± 12.6) × 10-3 (5.9 ± 0.4) × 10-3
Chlorophyll b(μg/mg) (42.6 ± 5.5) × 10-3 (5.5 ± 0.5) × 10-3
Starch content (% DCW) 0.2 ± 0.1 4.0 ± 0.5
Protein content (% DCW) 37.9 ± 4.0 19.4 ± 17.1
a decrease in cellular protein content and an increase incellular starch content were observed. The observedchanges in metabolite and biomolecule contents suggestthe redirection of metabolism in N. oleoabundans duringnitrogen limitation to reduce nitrogen-containing com-pounds (protein and chlorophyll) and favor the accumula-tion of nitrogen free storage molecules TAGs and starch.
De novo transcriptome assembly, annotation, andexpressionIn order to produce statistically reliable and comparableRNA-Seq data, cDNA library construction and sequencingwas performed for each of the duplicate + N reactors, andeach of the duplicate −N reactors. Over 88 million raw se-quencing reads were generated and subjected to qualityscore and length based trimming; resulting in a high qual-ity (HQ) read data set of 87.09 million sequences (averagephred score of 35) with an average read length of 77 bp(Additional file 1). By incorporating a multiple k-merbased de novo transcriptome assembly strategy (k-mers23, 33, 63, and 83) [23], HQ reads were assembled into56,550 transcripts with an average length of 1,459 bp anda read coverage of 1,444× (Additional file 1, Figure 2C).Generated transcripts were subjected to searches againstthe National Center for Biotechnology Information’s
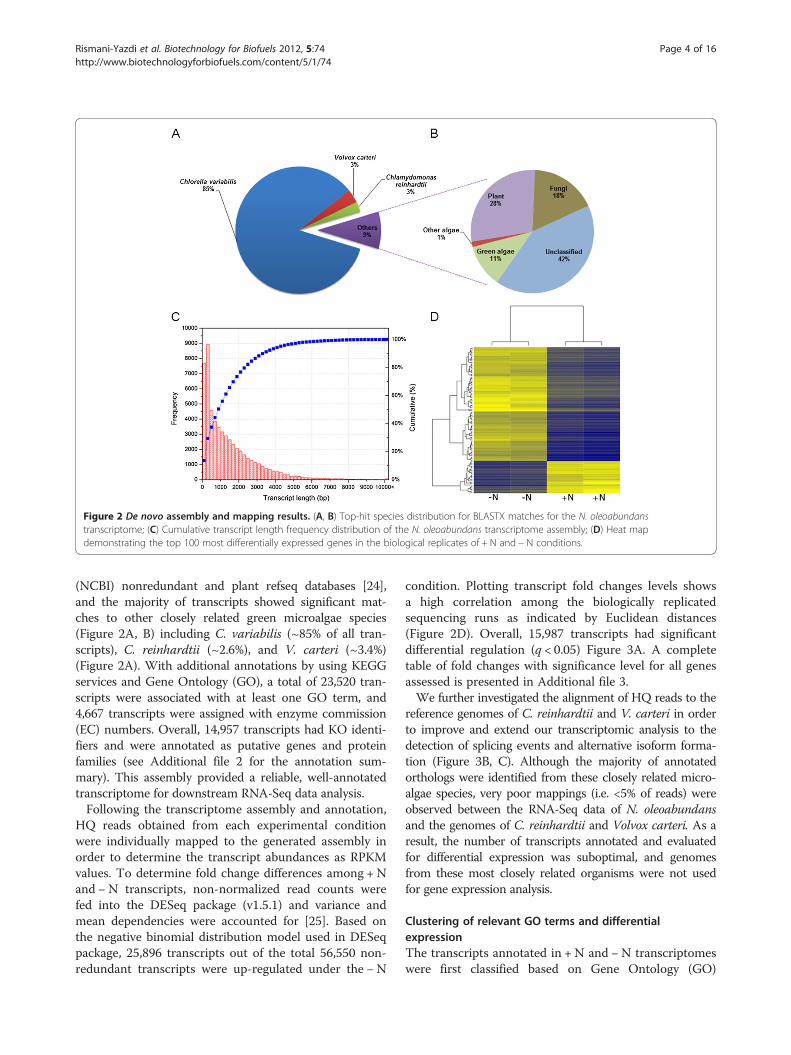
Figure 2 De novo assembly and mapping results. (A, B) Top-hit species distribution for BLASTX matches for the N. oleoabundanstranscriptome; (C) Cumulative transcript length frequency distribution of the N. oleoabundans transcriptome assembly; (D) Heat mapdemonstrating the top 100 most differentially expressed genes in the biological replicates of + N and − N conditions.
Rismani-Yazdi et al. Biotechnology for Biofuels 2012, 5:74 Page 4 of 16http://www.biotechnologyforbiofuels.com/content/5/1/74
(NCBI) nonredundant and plant refseq databases [24],and the majority of transcripts showed significant mat-ches to other closely related green microalgae species(Figure 2A, B) including C. variabilis (~85% of all tran-scripts), C. reinhardtii (~2.6%), and V. carteri (~3.4%)(Figure 2A). With additional annotations by using KEGGservices and Gene Ontology (GO), a total of 23,520 tran-scripts were associated with at least one GO term, and4,667 transcripts were assigned with enzyme commission(EC) numbers. Overall, 14,957 transcripts had KO identi-fiers and were annotated as putative genes and proteinfamilies (see Additional file 2 for the annotation sum-mary). This assembly provided a reliable, well-annotatedtranscriptome for downstream RNA-Seq data analysis.Following the transcriptome assembly and annotation,
HQ reads obtained from each experimental conditionwere individually mapped to the generated assembly inorder to determine the transcript abundances as RPKMvalues. To determine fold change differences among + Nand −N transcripts, non-normalized read counts werefed into the DESeq package (v1.5.1) and variance andmean dependencies were accounted for [25]. Based onthe negative binomial distribution model used in DESeqpackage, 25,896 transcripts out of the total 56,550 non-redundant transcripts were up-regulated under the −N
condition. Plotting transcript fold changes levels showsa high correlation among the biologically replicatedsequencing runs as indicated by Euclidean distances(Figure 2D). Overall, 15,987 transcripts had significantdifferential regulation (q < 0.05) Figure 3A. A completetable of fold changes with significance level for all genesassessed is presented in Additional file 3.We further investigated the alignment of HQ reads to the
reference genomes of C. reinhardtii and V. carteri in orderto improve and extend our transcriptomic analysis to thedetection of splicing events and alternative isoform forma-tion (Figure 3B, C). Although the majority of annotatedorthologs were identified from these closely related micro-algae species, very poor mappings (i.e. <5% of reads) wereobserved between the RNA-Seq data of N. oleoabundansand the genomes of C. reinhardtii and Volvox carteri. As aresult, the number of transcripts annotated and evaluatedfor differential expression was suboptimal, and genomesfrom these most closely related organisms were not usedfor gene expression analysis.
Clustering of relevant GO terms and differentialexpressionThe transcripts annotated in + N and −N transcriptomeswere first classified based on Gene Ontology (GO)

Figure 3 (A) MvA plot contrasting gene expression levels between the − N and + N scenarios based on reads mapped to theN. oleoabundans transcriptome. The x-axis represents the mean expression level at the gene scale, and the y-axis represents the log2 foldchange from − N to + N. Negative fold changes indicate up-regulation of –N genes. Red dots are genes that are significant at a false discoveryrate of 5%; (B) MvA plot for reads mapped to the C. reinhardtii genome; and (C) MvA plot for reads mapped to the V. carteri genome.
Rismani-Yazdi et al. Biotechnology for Biofuels 2012, 5:74 Page 5 of 16http://www.biotechnologyforbiofuels.com/content/5/1/74
terms. In the + N and –N datasets, respectively, 6,846and 7,473 transcripts were classified into 306 and 218broader GO term categories in accordance with theGene Ontology Consortium [26] (Additional files 4 and5). An enrichment analysis of the broader GO terms wasperformed using the modified Fisher’s Exact test inBlast2GO to quantitatively compare the distribution ofdifferentially enriched GO terms between the + N caseand the entire data set (Figure 4A), and between the –Ncase and the entire data set (Figure 4B). The functionalcategories enriched under + N were distinctly differentfrom those enriched under the –N condition. In the + Ncase (Figure 4A), functional categories linked to carbonfixation, photosynthesis, protein machinery, and cellulargrowth were highly enriched compared to the –N condi-tion; reflecting the higher growth rate, higher cell mass,and increased chlorophyll content observed in + N.Under –N conditions, genes associated with carboxylicacid and lipid biosynthetic process, NADPH regener-ation, the pentose-phosphate pathway, phospholipidmetabolic process, and lipid transport demonstrated agreater enrichment of transcripts than the overall dataset(Figure 4B). These enriched GO terms directly corre-lated with the observed increase of lipid accumulation in–N cells. Other major categories identified as signifi-cantly expressed under the –N condition included thesynthesis of value added products such as terpenoids,pigments, and vitamins as well as cellular response to ni-trogen starvation, nitrate metabolic process, and nitrateassimilation (Figure 4B). Genes involved in the latterthree functional categories were exclusively expressed inthe nitrogen-limited cells.
Fatty acid biosynthesis pathway is up-regulated and theβ-oxidation pathway is repressed under nitrogen-limitingconditionsThe majority of genes governing fatty acid biosynthesiswere identified as being overexpressed in nitrogen limited
cells as shown in the global metabolic pathway level andfatty acid biosynthesis module (Additional file 6). The fold-change and abundances of identified transcripts for thecomponents of fatty acid biosynthesis at the gene level arepresented in Figure 5A. The first step in fatty acid biosyn-thesis is the transduction of acetyl-CoA into malonyl-CoAby addition of carbon dioxide. This reaction is the firstcommitting step in the pathway and catalyzed by Acetyl-CoA Carboxylase (ACCase). While the gene encodingACCase was repressed under the –N condition, the biotin-containing subunit of ACCase, biotin carboxylase (BC),was significantly up-regulated in response to nitrogen star-vation. The BC catalyzes the ATP-dependent carboxylationof the biotin subunit and is part of the heteromericACCase that is present in the plastid—the site of de novofatty acid biosynthesis [27]. To proceed with fatty acid bio-synthesis, malonyl-CoA is transferred to an acyl-carrierprotein (ACP), by the action of malonyl-CoA ACP tran-sacylase (MAT). This step is followed by a round of con-densation, reduction, dehydration, and again reductionreactions catalyzed by beta-ketoacyl-ACP synthase (KAS),beta-ketoacyl-ACP reductase (KAR), beta-hydroxyacyl-ACPdehydrase (HAD), and enoyl-ACP reductase (EAR), re-spectively. The expression of genes coding for MAT, KAS,HAD, and EAR were up-regulated, whereas the KAR en-coding gene was repressed in –N cells. The synthesis ceasesafter six or seven cycles when the number of carbon atomsreaches sixteen (C16:0-[ACP]) or eighteen (C18:0-[ACP]).ACP residues are then cleaved off by thioesterases oleoyl-ACP hydrolase (OAH) and Acyl-ACP thioesterase A (FatA)generating the end products of fatty acid synthesis (i.e. pal-mitic (C16:0) and stearic (C18:0) acids). Genes coding forthese thioesterases, i.e. FatA and OAH, were over-expressed in –N cells. The up-regulation of these thioes-terase encoding genes, as previously reported in E. coliand the microalga P. tricornutum, is associated with re-ducing the feedback inhibition that partially controls theproduction rate of fatty acid biosynthesis [7,8], and

Figure 4 Over representation analysis of selected significant GO terms. (A) contains results for + N versus the full dataset and (B) containsresults for − N versus the full dataset.
Rismani-Yazdi et al. Biotechnology for Biofuels 2012, 5:74 Page 6 of 16http://www.biotechnologyforbiofuels.com/content/5/1/74
results in the overproduction of fatty acids [9]. It hasalso been suggested that an increase in FatA gene ex-pression and the associated acyl-ACP hydrolysis may aidin increased fatty acid transport from the chloroplast tothe endoplasmic reticulum site where TAG assemblyoccurs [10,28]. Finally, for supplying reducing equivalentsvia NADPH to power fatty acid biosynthesis, genes en-coding for the pentose phosphate pathway were stronglyup-regulated in the –N condition (Table 2).The altered expression of genes associated with the
generation of double bonds in fatty acids reflects the
observed increase in the proportion of unsaturated offatty acids (Figure 1D), and the enrichment of C18:1during nitrogen limitations. The acyl-ACP desaturase(AAD), which introduces a one double bond to C16:0/C18:0, and delta-15 desaturase, which converts C18:2 toC18:3, were significantly up-regulated in the −N case,whereas the delta-12 desaturase catalyzing the formationof C18:2 from C18:1was repressed during nitrogenlimitation.Under nitrogen limitations, 10 of the 13 genes asso-
ciated with fatty acid degradation (α and β-oxidation
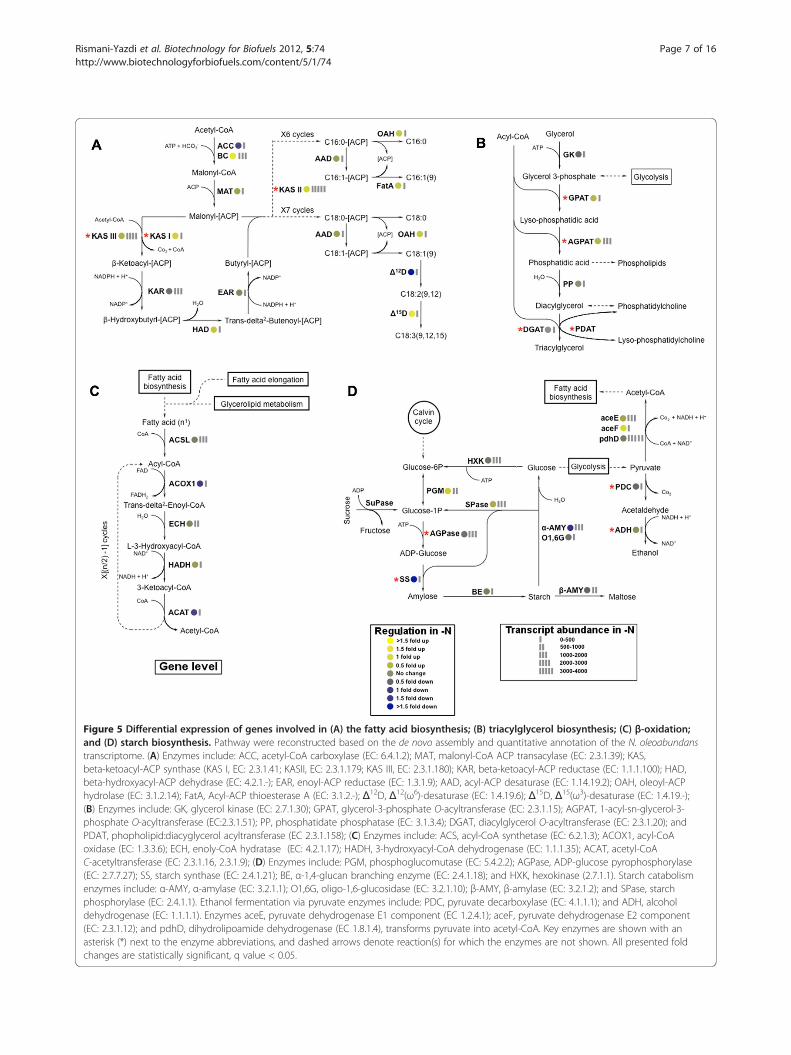
Figure 5 Differential expression of genes involved in (A) the fatty acid biosynthesis; (B) triacylglycerol biosynthesis; (C) β-oxidation;and (D) starch biosynthesis. Pathway were reconstructed based on the de novo assembly and quantitative annotation of the N. oleoabundanstranscriptome. (A) Enzymes include: ACC, acetyl-CoA carboxylase (EC: 6.4.1.2); MAT, malonyl-CoA ACP transacylase (EC: 2.3.1.39); KAS,beta-ketoacyl-ACP synthase (KAS I, EC: 2.3.1.41; KASII, EC: 2.3.1.179; KAS III, EC: 2.3.1.180); KAR, beta-ketoacyl-ACP reductase (EC: 1.1.1.100); HAD,beta-hydroxyacyl-ACP dehydrase (EC: 4.2.1.-); EAR, enoyl-ACP reductase (EC: 1.3.1.9); AAD, acyl-ACP desaturase (EC: 1.14.19.2); OAH, oleoyl-ACPhydrolase (EC: 3.1.2.14); FatA, Acyl-ACP thioesterase A (EC: 3.1.2.-); Δ12D, Δ12(ω6)-desaturase (EC: 1.4.19.6); Δ15D, Δ15(ω3)-desaturase (EC: 1.4.19.-);(B) Enzymes include: GK, glycerol kinase (EC: 2.7.1.30); GPAT, glycerol-3-phosphate O-acyltransferase (EC: 2.3.1.15); AGPAT, 1-acyl-sn-glycerol-3-phosphate O-acyltransferase (EC:2.3.1.51); PP, phosphatidate phosphatase (EC: 3.1.3.4); DGAT, diacylglycerol O-acyltransferase (EC: 2.3.1.20); andPDAT, phopholipid:diacyglycerol acyltransferase (EC 2.3.1.158); (C) Enzymes include: ACS, acyl-CoA synthetase (EC: 6.2.1.3); ACOX1, acyl-CoAoxidase (EC: 1.3.3.6); ECH, enoly-CoA hydratase (EC: 4.2.1.17); HADH, 3-hydroxyacyl-CoA dehydrogenase (EC: 1.1.1.35); ACAT, acetyl-CoAC-acetyltransferase (EC: 2.3.1.16, 2.3.1.9); (D) Enzymes include: PGM, phosphoglucomutase (EC: 5.4.2.2); AGPase, ADP-glucose pyrophosphorylase(EC: 2.7.7.27); SS, starch synthase (EC: 2.4.1.21); BE, α-1,4-glucan branching enzyme (EC: 2.4.1.18); and HXK, hexokinase (2.7.1.1). Starch catabolismenzymes include: α-AMY, α-amylase (EC: 3.2.1.1); O1,6G, oligo-1,6-glucosidase (EC: 3.2.1.10); β-AMY, β-amylase (EC: 3.2.1.2); and SPase, starchphosphorylase (EC: 2.4.1.1). Ethanol fermentation via pyruvate enzymes include: PDC, pyruvate decarboxylase (EC: 4.1.1.1); and ADH, alcoholdehydrogenase (EC: 1.1.1.1). Enzymes aceE, pyruvate dehydrogenase E1 component (EC 1.2.4.1); aceF, pyruvate dehydrogenase E2 component(EC: 2.3.1.12); and pdhD, dihydrolipoamide dehydrogenase (EC 1.8.1.4), transforms pyruvate into acetyl-CoA. Key enzymes are shown with anasterisk (*) next to the enzyme abbreviations, and dashed arrows denote reaction(s) for which the enzymes are not shown. All presented foldchanges are statistically significant, q value < 0.05.
Rismani-Yazdi et al. Biotechnology for Biofuels 2012, 5:74 Page 7 of 16http://www.biotechnologyforbiofuels.com/content/5/1/74
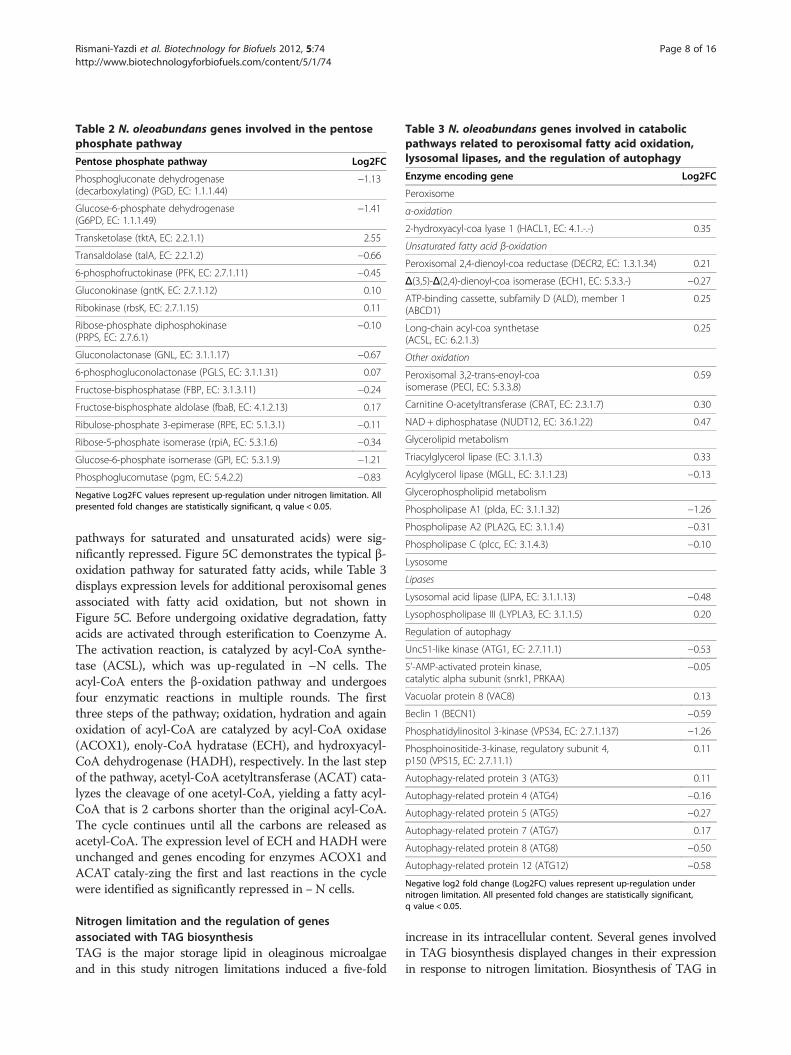
Table 3 N. oleoabundans genes involved in catabolicpathways related to peroxisomal fatty acid oxidation,lysosomal lipases, and the regulation of autophagy
Enzyme encoding gene Log2FC
Peroxisome
α-oxidation
2-hydroxyacyl-coa lyase 1 (HACL1, EC: 4.1.-.-) 0.35
Unsaturated fatty acid β-oxidation
Peroxisomal 2,4-dienoyl-coa reductase (DECR2, EC: 1.3.1.34) 0.21
Δ(3,5)-Δ(2,4)-dienoyl-coa isomerase (ECH1, EC: 5.3.3.-) −0.27
ATP-binding cassette, subfamily D (ALD), member 1(ABCD1)
0.25
Long-chain acyl-coa synthetase(ACSL, EC: 6.2.1.3)
0.25
Other oxidation
Peroxisomal 3,2-trans-enoyl-coaisomerase (PECI, EC: 5.3.3.8)
0.59
Carnitine O-acetyltransferase (CRAT, EC: 2.3.1.7) 0.30
NAD + diphosphatase (NUDT12, EC: 3.6.1.22) 0.47
Glycerolipid metabolism
Triacylglycerol lipase (EC: 3.1.1.3) 0.33
Acylglycerol lipase (MGLL, EC: 3.1.1.23) −0.13
Glycerophospholipid metabolism
Phospholipase A1 (plda, EC: 3.1.1.32) −1.26
Phospholipase A2 (PLA2G, EC: 3.1.1.4) −0.31
Phospholipase C (plcc, EC: 3.1.4.3) −0.10
Lysosome
Lipases
Lysosomal acid lipase (LIPA, EC: 3.1.1.13) −0.48
Lysophospholipase III (LYPLA3, EC: 3.1.1.5) 0.20
Regulation of autophagy
Unc51-like kinase (ATG1, EC: 2.7.11.1) −0.53
5'-AMP-activated protein kinase,catalytic alpha subunit (snrk1, PRKAA)
−0.05
Vacuolar protein 8 (VAC8) 0.13
Beclin 1 (BECN1) −0.59
Phosphatidylinositol 3-kinase (VPS34, EC: 2.7.1.137) −1.26
Phosphoinositide-3-kinase, regulatory subunit 4,p150 (VPS15, EC: 2.7.11.1)
0.11
Autophagy-related protein 3 (ATG3) 0.11
Autophagy-related protein 4 (ATG4) −0.16
Autophagy-related protein 5 (ATG5) −0.27
Autophagy-related protein 7 (ATG7) 0.17
Autophagy-related protein 8 (ATG8) −0.50
Autophagy-related protein 12 (ATG12) −0.58
Negative log2 fold change (Log2FC) values represent up-regulation undernitrogen limitation. All presented fold changes are statistically significant,q value < 0.05.
Table 2 N. oleoabundans genes involved in the pentosephosphate pathway
Pentose phosphate pathway Log2FC
Phosphogluconate dehydrogenase(decarboxylating) (PGD, EC: 1.1.1.44)
−1.13
Glucose-6-phosphate dehydrogenase(G6PD, EC: 1.1.1.49)
−1.41
Transketolase (tktA, EC: 2.2.1.1) 2.55
Transaldolase (talA, EC: 2.2.1.2) −0.66
6-phosphofructokinase (PFK, EC: 2.7.1.11) −0.45
Gluconokinase (gntK, EC: 2.7.1.12) 0.10
Ribokinase (rbsK, EC: 2.7.1.15) 0.11
Ribose-phosphate diphosphokinase(PRPS, EC: 2.7.6.1)
−0.10
Gluconolactonase (GNL, EC: 3.1.1.17) −0.67
6-phosphogluconolactonase (PGLS, EC: 3.1.1.31) 0.07
Fructose-bisphosphatase (FBP, EC: 3.1.3.11) −0.24
Fructose-bisphosphate aldolase (fbaB, EC: 4.1.2.13) 0.17
Ribulose-phosphate 3-epimerase (RPE, EC: 5.1.3.1) −0.11
Ribose-5-phosphate isomerase (rpiA, EC: 5.3.1.6) −0.34
Glucose-6-phosphate isomerase (GPI, EC: 5.3.1.9) −1.21
Phosphoglucomutase (pgm, EC: 5.4.2.2) −0.83
Negative Log2FC values represent up-regulation under nitrogen limitation. Allpresented fold changes are statistically significant, q value < 0.05.
Rismani-Yazdi et al. Biotechnology for Biofuels 2012, 5:74 Page 8 of 16http://www.biotechnologyforbiofuels.com/content/5/1/74
pathways for saturated and unsaturated acids) were sig-nificantly repressed. Figure 5C demonstrates the typical β-oxidation pathway for saturated fatty acids, while Table 3displays expression levels for additional peroxisomal genesassociated with fatty acid oxidation, but not shown inFigure 5C. Before undergoing oxidative degradation, fattyacids are activated through esterification to Coenzyme A.The activation reaction, is catalyzed by acyl-CoA synthe-tase (ACSL), which was up-regulated in –N cells. Theacyl-CoA enters the β-oxidation pathway and undergoesfour enzymatic reactions in multiple rounds. The firstthree steps of the pathway; oxidation, hydration and againoxidation of acyl-CoA are catalyzed by acyl-CoA oxidase(ACOX1), enoly-CoA hydratase (ECH), and hydroxyacyl-CoA dehydrogenase (HADH), respectively. In the last stepof the pathway, acetyl-CoA acetyltransferase (ACAT) cata-lyzes the cleavage of one acetyl-CoA, yielding a fatty acyl-CoA that is 2 carbons shorter than the original acyl-CoA.The cycle continues until all the carbons are released asacetyl-CoA. The expression level of ECH and HADH wereunchanged and genes encoding for enzymes ACOX1 andACAT cataly-zing the first and last reactions in the cyclewere identified as significantly repressed in −N cells.
Nitrogen limitation and the regulation of genesassociated with TAG biosynthesisTAG is the major storage lipid in oleaginous microalgaeand in this study nitrogen limitations induced a five-fold
increase in its intracellular content. Several genes involvedin TAG biosynthesis displayed changes in their expressionin response to nitrogen limitation. Biosynthesis of TAG in
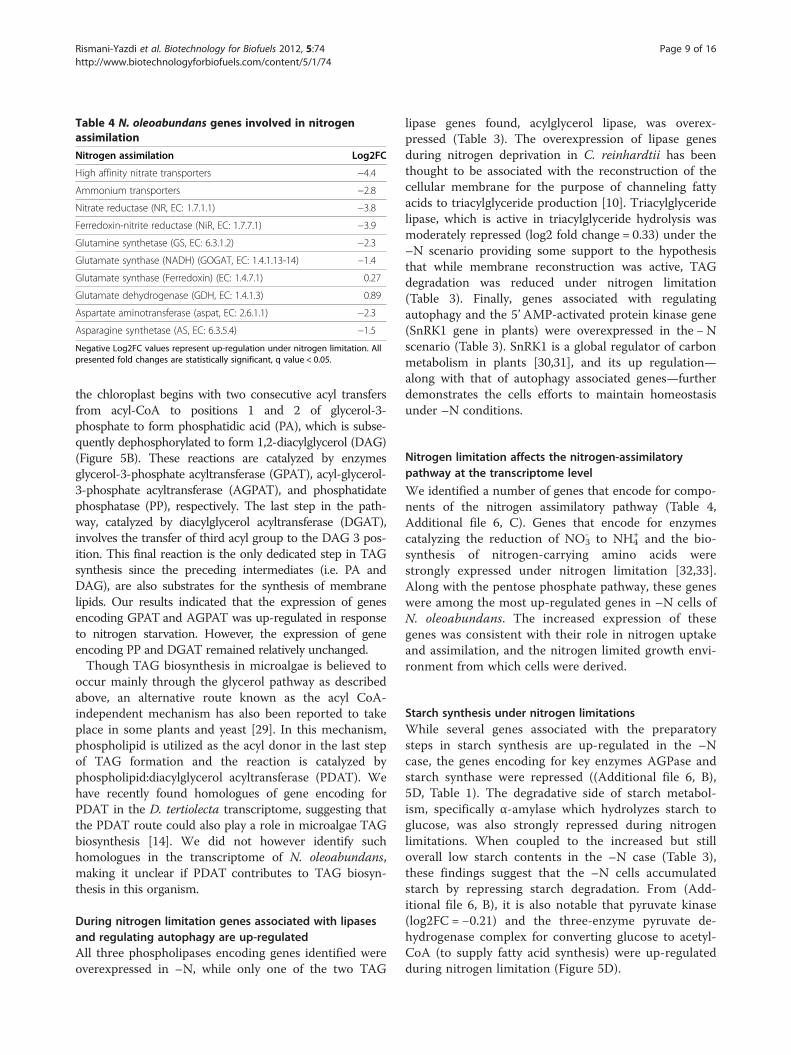
Table 4 N. oleoabundans genes involved in nitrogenassimilation
Nitrogen assimilation Log2FC
High affinity nitrate transporters −4.4
Ammonium transporters −2.8
Nitrate reductase (NR, EC: 1.7.1.1) −3.8
Ferredoxin-nitrite reductase (NiR, EC: 1.7.7.1) −3.9
Glutamine synthetase (GS, EC: 6.3.1.2) −2.3
Glutamate synthase (NADH) (GOGAT, EC: 1.4.1.13-14) −1.4
Glutamate synthase (Ferredoxin) (EC: 1.4.7.1) 0.27
Glutamate dehydrogenase (GDH, EC: 1.4.1.3) 0.89
Aspartate aminotransferase (aspat, EC: 2.6.1.1) −2.3
Asparagine synthetase (AS, EC: 6.3.5.4) −1.5
Negative Log2FC values represent up-regulation under nitrogen limitation. Allpresented fold changes are statistically significant, q value < 0.05.
Rismani-Yazdi et al. Biotechnology for Biofuels 2012, 5:74 Page 9 of 16http://www.biotechnologyforbiofuels.com/content/5/1/74
the chloroplast begins with two consecutive acyl transfersfrom acyl-CoA to positions 1 and 2 of glycerol-3-phosphate to form phosphatidic acid (PA), which is subse-quently dephosphorylated to form 1,2-diacylglycerol (DAG)(Figure 5B). These reactions are catalyzed by enzymesglycerol-3-phosphate acyltransferase (GPAT), acyl-glycerol-3-phosphate acyltransferase (AGPAT), and phosphatidatephosphatase (PP), respectively. The last step in the path-way, catalyzed by diacylglycerol acyltransferase (DGAT),involves the transfer of third acyl group to the DAG 3 pos-ition. This final reaction is the only dedicated step in TAGsynthesis since the preceding intermediates (i.e. PA andDAG), are also substrates for the synthesis of membranelipids. Our results indicated that the expression of genesencoding GPAT and AGPAT was up-regulated in responseto nitrogen starvation. However, the expression of geneencoding PP and DGAT remained relatively unchanged.Though TAG biosynthesis in microalgae is believed to
occur mainly through the glycerol pathway as describedabove, an alternative route known as the acyl CoA-independent mechanism has also been reported to takeplace in some plants and yeast [29]. In this mechanism,phospholipid is utilized as the acyl donor in the last stepof TAG formation and the reaction is catalyzed byphospholipid:diacylglycerol acyltransferase (PDAT). Wehave recently found homologues of gene encoding forPDAT in the D. tertiolecta transcriptome, suggesting thatthe PDAT route could also play a role in microalgae TAGbiosynthesis [14]. We did not however identify suchhomologues in the transcriptome of N. oleoabundans,making it unclear if PDAT contributes to TAG biosyn-thesis in this organism.
During nitrogen limitation genes associated with lipasesand regulating autophagy are up-regulatedAll three phospholipases encoding genes identified wereoverexpressed in –N, while only one of the two TAG
lipase genes found, acylglycerol lipase, was overex-pressed (Table 3). The overexpression of lipase genesduring nitrogen deprivation in C. reinhardtii has beenthought to be associated with the reconstruction of thecellular membrane for the purpose of channeling fattyacids to triacylglyceride production [10]. Triacylglyceridelipase, which is active in triacylglyceride hydrolysis wasmoderately repressed (log2 fold change = 0.33) under the–N scenario providing some support to the hypothesisthat while membrane reconstruction was active, TAGdegradation was reduced under nitrogen limitation(Table 3). Finally, genes associated with regulatingautophagy and the 5’ AMP-activated protein kinase gene(SnRK1 gene in plants) were overexpressed in the −Nscenario (Table 3). SnRK1 is a global regulator of carbonmetabolism in plants [30,31], and its up regulation—along with that of autophagy associated genes—furtherdemonstrates the cells efforts to maintain homeostasisunder –N conditions.
Nitrogen limitation affects the nitrogen-assimilatorypathway at the transcriptome level
We identified a number of genes that encode for compo-nents of the nitrogen assimilatory pathway (Table 4,Additional file 6, C). Genes that encode for enzymescatalyzing the reduction of NO3
- to NH4+ and the bio-
synthesis of nitrogen-carrying amino acids werestrongly expressed under nitrogen limitation [32,33].Along with the pentose phosphate pathway, these geneswere among the most up-regulated genes in –N cells ofN. oleoabundans. The increased expression of thesegenes was consistent with their role in nitrogen uptakeand assimilation, and the nitrogen limited growth envi-ronment from which cells were derived.
Starch synthesis under nitrogen limitationsWhile several genes associated with the preparatorysteps in starch synthesis are up-regulated in the –Ncase, the genes encoding for key enzymes AGPase andstarch synthase were repressed ((Additional file 6, B),5D, Table 1). The degradative side of starch metabol-ism, specifically α-amylase which hydrolyzes starch toglucose, was also strongly repressed during nitrogenlimitations. When coupled to the increased but stilloverall low starch contents in the –N case (Table 3),these findings suggest that the –N cells accumulatedstarch by repressing starch degradation. From (Add-itional file 6, B), it is also notable that pyruvate kinase(log2FC = −0.21) and the three-enzyme pyruvate de-hydrogenase complex for converting glucose to acetyl-CoA (to supply fatty acid synthesis) were up-regulatedduring nitrogen limitation (Figure 5D).
Rismani-Yazdi et al. Biotechnology for Biofuels 2012, 5:74 Page 10 of 16http://www.biotechnologyforbiofuels.com/content/5/1/74
DiscussionOleaginous microalgae can accumulate large quantitiesof lipid under stress inducing growth conditions, makingthem a target organism for sustainable liquid biofuelproduction. In the present study, we induced TAG pro-duction and accumulation in N. oleoabundans throughnitrogen deprivation, and investigated the expression ofgenes involved in TAG production at the transcriptomelevel. Mapping reads to the assembled and annotatedtranscriptome provided significantly more informationthan mapping reads to other microalgae for which thegenome has been sequenced and annotated (Figure 3).While transcriptomic analysis is not substitute fordetailed gene and pathway studies, it does provide abroad overview of the important metabolic processesfrom which to efficiently build hypotheses that can guidefuture detailed studies on improving lipid accumulation.Our results suggest that under –N conditions, the altered
expression of coordinated metabolic processes, many ofwhich occur in the plastid, redirect the flow of fixed carbontoward biosynthesis and storage of lipids. These processesinclude up-regulation of de novo fatty acid and TAG syn-thesis, and concomitant repression of β-oxidation and TAGlipases. To supply precursors for lipid production, genesassociated with the pyruvate dehydrogenase complex forconverting pyruvate to acetyl CoA and lipases involved inthe release free fatty acids from cell wall glycerophospholi-pids were overexpressed in the –N scenario. To power fattyacid production, strong overexpression under –N wasobserved in the pentose-phosphate pathway, which isprimarily involved in supplying reducing equivalents foranabolic metabolism, including the production of fattyacids and assimilation of inorganic nitrogen [34].
Transcriptome response of N. oleoabundans to nitrogenlimitationA primary physiological response to nitrogen limitationis a decrease in cell growth, as observed with the threetimes reduction in N. oleoabundans growth rate. Thetranscript profile of nitrogen-starved N. oleoabundansclearly reflects the decrease in cell proliferation andstressed physiological status of the cells. Gene ontologyterms related to cellular growth, photosynthesis, andprotein machinery are significantly suppressed under –Nconditions, and autophagy genes were up-regulated. The5’ AMP-activated protein kinase (SnRK1 gene in plants)was slightly overexpressed in the −N scenario. SnRK1 isactivated under starvation conditions, including nitrogendepletion [31] and is a global regulator of starch andTAGs production in plants [30]. Overexpression ofSnRK1 in the transgenic potato Solanum tubersum cv.Prairie [35] and Arabidopsis thaliana [36] has resultedin changes in starch and carbohydrate levels, thus con-firming this gene’s central role in carbon partitioning and
suggesting that SnRK1 may be an important target formetabolic engineering efforts in oleaginous microalgae.We note also that genes encoding for the components ofnitrogen assimilation are identified as the most signifi-cantly up-regulated genes in the transcriptome of nitro-gen limited N. oleoabundans. Overexpression of nitrogenassimilation pathways under nitrogen limiting conditionshas been previously reported in the transcriptome ofother non-oleaginous microalgae species [10,33].
The regulation of fatty acid and TAG biosynthesis andsupply of precursorsWhile under nitrogen deprivations, there has been consi-derable uncertainty expressed whether the increase inTAG content is due to a reduction in the mass of the cell,rather than increase in TAG production [2]. Both themeasured increase in TAG content per cell dry weightreported here (which accounted for the loss of cell massduring nitrogen limitation), and the observed changes inthe FAME profile unequivocally demonstrate the overpro-duction and accumulation of TAG in N. oleoabundansunder nitrogen stress. Quantitative gene expression resultsalso support these TAG production observations. In ourstudy, most of the genes involved in the fatty acid biosyn-thetic pathway were up-regulated under –N conditions.The gene encoding for ACCase, the first enzyme in thepathway, was reported as down-regulated under –N.However, the biotin-containing subunit of ACCase, biotincarboxylase (BC), was significantly overexpressed. Inphotosynthetic organisms, two different forms of ACCasehave been identified, one located in the plastid and theother located in the cytosol. The plastidal ACCase is a het-eromeric multi-subunit enzyme that contains BC, whereasthe cytosolic ACCase is a homomeric multifunctional pro-tein that does not contain BC [27]. In our transcriptomeanalysis, we identified genes encoding for both forms ofACCase. In the plastid—the primary cite of lipid biosyn-thesis in microalgae—we have observed a significant in-crease in expression of the BC subunit of heteromericisoform that catalyzes the very first step of carboxylation.On the other hand, the expression of homomeric ACCase,predominantly located in the cytosol where lipid biosyn-thesis does not typically occur, was repressed.Although the overexpression of BC points to a key step
in the pathway as a potential target to genetically engineeran improved oleaginous strain, mixed results for improvingfatty acid synthesis in microalgae have been observed whenACCase is overexpressed [2]. Recent research has sug-gested that fatty acid synthesis may also be regulated by in-hibition from the buildup of long chain fatty acyl ACPs [9].Overexpressing genes that cleave ACP residues from thelong chain fatty acyl ACPs is a condition observed in bac-teria and recently in the microalga P. tricornutum to resultin increased production of fatty acids [9]. In our study,
Rismani-Yazdi et al. Biotechnology for Biofuels 2012, 5:74 Page 11 of 16http://www.biotechnologyforbiofuels.com/content/5/1/74
genes encoding for these enzymes were highly overex-pressed under the –N conditions. Therefore, a potentialtarget for metabolic engineering in N. oleoabundans is theoverexpression of thioesterases FatA and OAH that cleaveoff ACP residues.Genes encoding enzymes involved in the steps down-
stream of fatty acid biosynthesis, including elongationand desaturation, have also displayed significant changesin transcription levels in response to nitrogen starvation.In particular, the genes encoding AAD and delta-15desaturase, which catalyze the formation of double bondbetween the 9th, 10th, 14th, and 15th carbon, respectively,were up-regulated under –N conditions. A similar obser-vation has been reported by Morin et al. [37], where thegene encoding delta-9 fatty acid desaturase is up-regulated in the oleaginous yeast Y. lipolytica culturedunder nitrogen limitation. As observed here, and sup-ported by gene expression levels, nitrogen limitationalter the lipid profile towards higher saturation (increasein C18:1, and decrease in C18:2 and C18:3). Theincreased proportion of saturated fatty acids in TAG hasbeen demonstrated to improve cetane number andstability of resulting biodiesel [38].Based on the lipid metabolism genes discovered from
our transcriptome assembly, the acyl-CoA dependentmechanism is the major contributor to TAG biosyn-thesis in N. oleoabundans. In our study, two genes asso-ciated with biosynthesis of TAG show significantchanges in their expression under –N condition: oneencoding GPAT and the other one encoding AGPAT.These enzymes catalyze the acyl-CoA-dependentacylation of positions 1 and 2 of glycerol-3-phosphate,respectively. The acylation of glycerol-3-phosphaterepresents the first and committed step in glycerolipidbiosynthesis, and likely the rate limiting step in thepathway as GPAT exhibits the lowest specific activityamong all enzymes involved in the glycerol-3-phosphatepathway [39]. A recent proteomics study also reportedsignificant up-regulation of TAG-related acyltrans-ferases in parallel with accumulation of large quantitiesof lipid in C. vulgaris cultured under nitrogen limitation[13]. The overexpression of GPAT and AGPAT has beenreported to increase seed oil accumulation in Arabidop-sis and Brassica napus [40-42]. The up-regulation ofthese two genes also indicates an increase in the flow ofacyl-CoA toward TAG biosynthesis. The final step ofthe TAG biosynthesis pathway is catalyzed by DGAT,the third acyltransferase. In our study, the gene encod-ing DGAT displays relatively no change in its expressionunder nitrogen limitation. This observation coupledwith the significant increase in TAG production in the –N case, and previous proteomics studies that showedoverexpression of DGAT in the C. vulgaris due to nitro-gen limitation [13] provides evidence that DGAT
expression in N. oleoabundans may be regulated post-transcriptionally. The post-transcriptional regulation ofDGAT has previously been documented in the oilseedrape Brassica napus [43].Finally, the enrichment of intracellular starch increased
during the –N case. Although starch synthase andAGPase encoding genes were repressed in –N, the geneencoding for α-amylase, responsible for the hydrolysis ofstarch to glucose monomers, was also repressed. Theconcomitant accumulation of starch and lipids under ni-trogen limitation has been reported in the nonoleaginousC. reinhardtii [44,45] and recently reported for N. oleoa-bundans [46]. This contrasts with recent reports inMicractinium pusillum where carbohydrate content wasreduced and TAG production was increased under nitro-gen limitation [19]. Genetic manipulations (sta6 mutant)that block starch synthesis in C. reinhardtii have resultedin a significant increase in TAG accumulation [47]. Undernitrogen limitation, the increased TAG content in N.oleoabundans and concomitant repression of starch syn-thase are analogous to the C. reinhardtii sta6 mutant.These results extend the idea of blocking starch synthesisfor improvement of TAG production to the oleagenousmicroalga N. oleoabundans.
Lipid turnoverIn our study, several genes encoding enzymes involvedin the intracellular breakdown of fatty acids and lipidsare significantly repressed under –N (Table 3). Repres-sing β-oxidation is a clear strategy for maintaining ahigher concentration of fatty acids within a cell. In con-trast, most of the identified lipases (with the exceptionof triacylglycerol lipases) are overexpressed during nitro-gen limitation. Upon closer examination, the up-regulated lipases are mostly phospholipases associatedwith hydrolyzing cell wall glycerophospholipids andphospholipids into free fatty acids, potentially for incor-poration into TAGs. A known result of nitrogen limita-tion induced autophagy in C. reinhardtii is thedegradation of the chloroplast phospholipid membrane[47,48]. Moreover, the overexpression of lipases duringnitrogen limitation in C. reinhardtii has previously beenhypothesized to be associated with the reconstruction ofcell membranes [10]. In addition to phospholipases, wehave identified an enriched number of transcripts forphospholipid metabolic processes and lipid transport inthe –N case (Figure 4B). The up-regulation of genes en-coding for enzymes that produce free fatty acids is alsoconsistent with the fact that the PDAT enzyme asso-ciated with the acyl-CoA-independent mechanism ofTAG synthesis (which utilizes phospholipids, rather thanfree fatty acids, as acyl donors) was not recovered in ourassembled transcriptome.
Rismani-Yazdi et al. Biotechnology for Biofuels 2012, 5:74 Page 12 of 16http://www.biotechnologyforbiofuels.com/content/5/1/74
ConclusionsAssembling the transcriptome and quantifying gene ex-pression responses of Neochloris oleoabundans undernitrogen replete and nitrogen limited conditions enabledthe exploration of a broad diversity of genes and pathways,many of which comprise the metabolic responses asso-ciated with lipid production and carbon partitioning. Thehigh coverage of genes encoding for full central metabolicpathways demonstrates the completeness of the transcrip-tome assembly and the repeatability of gene expressiondata. Furthermore, the concordance of metabolite mea-surements and observed physiological responses with geneexpression results lends strength to the quality of the as-sembly and our quantitative assessment. Our findingspoint to several molecular mechanisms that potentiallydrive the overproduction of TAG during nitrogenlimitation. These include up-regulation of fatty acid andTAG biosynthesis associated genes, shuttling excessacetyl CoA to lipid production through the pyruvatedehydrogenase complex, the role of autophagy andlipases for supplying an additional pool of fatty acids forTAG synthesis, and up-regulation of the pentose phos-phate pathway to produce NADPH to power lipid bio-synthesis. These identified gene sequences and measuredmetabolic responses during excess TAG production canbe leveraged in future metabolic engineering studies toimprove TAG content and character in microalgae andultimately contribute to the production of a sustainableliquid fuel.
MethodsBioreactor experimentsN. oleoabundans (UTEX # 1185) was obtained from theCulture Collection of Algae at the University of Texas(UTEX, Austin, TX, USA). Batch cultures were startedby inoculation with 106 log growth phase cells into 1liter glass flasks filled with 750 ml of Modified Bold-3 Nmedium [49] without soil extract. The concentration ofnitrogen in the medium was adjusted to 50 mg as N l-1
(nitrogen replete; denoted as + N) and 10 mg as N l-1
(nitrogen limited; denoted as –N) using potassium ni-trate (KNO3) as the sole source of nitrogen. Theseconcentrations were chosen based on preliminaryexperiments that identified incubation times and nitro-gen concentrations necessary to induce nitrogen deple-tion in the mid log-phase of the –N cultures and toensure that the nitrogen-replete cultures never encoun-tered nitrogen-limitation during the course of the experi-ment. For each nitrogen condition, cells were culturedin duplicate reactors. Reactors were operated at roomtemperature (25°C ± 2°C), and with a 14:10 h light:darkcycle of exposure to fluorescent light (32 Watt Ecolux,General Electric, Fairfield, CT, USA) at a photosyntheticphoton flux density of 110 μmol-photon m-2 s-1.
Cultures were mixed by an orbital shaker at 200 rpm andcontinuously aerated with sterile, activated carbon filteredair at a flow rate of 200 ml min-1 using a mass flowcontroller (Cole-Parmer Instrument Company, IL, USA).
Nitrogen, biomass and biomolecule analysisThe nitrate concentration of culture media was deter-mined daily by passage through a 0.2 μm pore-size filterand analysis on an ion chromatograph equipped withconductivity detection [50]. Microalgae growth wasmonitored daily by measuring the optical density of thecultures at 730 nm (OD730) using a spectrophotometer(HP 8453, Hewlett Packard, Palo Alto, CA, USA). Bio-mass samples for analysis of cellular constituents (starch,proteins, chlorophyll and lipids), and extraction of totalRNA were harvested on day-11 by centrifugation at10,000 g for 5 min at 4°C. Cell pellets were snap-frozenin liquid nitrogen and immediately transferred to −80°Cuntil further analysis. The dry cell weight (DCW) of cul-tures was determined by filtering an aliquot of cultureson pre-weighed 0.45 μm pore size filters and drying thefilters at 90°C until constant weight was reached. Foranalysis of starch content, 109 cells ml-1 were suspendedin deionized water in 2 ml screw-cap tubes containing0.3 g of 0.5 mm glass beads, and disrupted by two cyclesof bead-beating at 4800 oscillations per minute for2 min, followed by three freeze/thaw cycles. The suspen-sion was then incubated in a boiling water bath for3 min and autoclaved for 1 hour at 121°C to convertstarch granules into a colloidal solution. After sampleswere cooled to 60°C, cell debris was removed by centrifu-gation at 4,000 g for 5 min. The concentration of starchin the supernatant was measured enzymatically usingthe Sigma Starch Assay Kit (amylase/amyloglucosidasemethod, Sigma-Aldrich, Saint Louis, MO, USA) accord-ing to the manufacturer’s instruction. Chlorophyll aand b were measured by the N,N’-dimethylformamidemethod and calculated from spectrophotometric adsorp-tion measurement at 603, 647, and 664 nm, as previouslyreported [51,52]. The total protein content of cells wasdetermined with minor modifications to the originalBradford method [53] as described in [54]. Starch, chloro-phyll, and protein measurements were performed in atleast triplicates, and averages and standard deviations arereported as a percent of DCW.The total lipid content of the cells was determined
using a modified Bligh and Dyer method utilizing 2:1chloroform:methanol [55]. To determine the profile offatty acids, lipid samples were transesterified [56] andthe resulting fatty acid methyl esters (FAME) were ana-lyzed using a liquid chromatography-mass spectrometer(Varian 500-MS, 212-LC pumps, Agilent Technologies,Santa Clara, CA, USA) equipped with a Waters normalphase, Atlantis® HILIC silica column (2.1 × 150 mm,
Rismani-Yazdi et al. Biotechnology for Biofuels 2012, 5:74 Page 13 of 16http://www.biotechnologyforbiofuels.com/content/5/1/74
3 μm pore size) (Waters, Milford, MA, USA), and at-mospheric pressure chemical ionization [56]. Identifica-tion was based upon the retention time and the mass tocharge ratio of standard FAME mixtures. The sum ofFAME was used as a proxy for TAG content [22].
RNA extraction, construction of cDNA libraries and DNAsequencingTo control for cell synchronization, cells for the + Nand –N conditions were harvested at the same time ofday. Total RNA was extracted and purified separatelyfrom each of the two nitrogen replete and the twonitrogen limited cultures using the RNeasy Lipid TissueMini Kit (Qiagen, Valencia, CA, USA). The quality ofpurified RNA was determined on an Agilent 2100bioanalyzer (Agilent Technologies, Santa Clara, CA,USA). Isolation of mRNA from total RNA was carriedout using two rounds of hybridization to Dynal oligo(dT) magnetic beads (Invitrogen, Carlsbad, CA, USA).Aliquots from mRNA samples were used for construc-tion of the cDNA libraries using the mRNA-Seq Kitsupplied by Illumina (Illumina, Inc., San Diego, CA,USA). Briefly, the mRNA was fragmented in thepresence of divalent cations at 94°C, and subsequentlyconverted into double stranded cDNA following thefirst- and second-strand cDNA synthesis using randomhexamer primers. After polishing the ends of the cDNAusing T4 DNA polymerase and Klenow DNA polyme-rase for 30 min at 20°C, a single adenine base wasadded to the 3’ ends of cDNA molecules. IlluminamRNA-Seq Kit specific adaptors were then ligated tocDNA 3’ ends. Next, the cDNA was PCR-amplified for15 cycles, amplicons were purified (QIAquick PCRpurification kit, Qiagen Inc., Valencia CA, USA), andthe size and concentration of the cDNA libraries weredetermined on an Agilent 2100 bioanalyzer. Each of thefour cDNA libraries (two nitrogen deplete and two ni-trogen replete) was layered on a separate Illumina flowcell and sequenced at the Yale University Center forGenome Analysis using Illumina HiSeq 100 bp single-end sequencing. An additional lane was dedicated tosequencing PhiX control libraries to provide internalcalibration and to optimize base calling. The sequencedata produced in this study can be accessed at NCBI’sSequence Read Achieve with the accession numberSRA048723.
RNA-seq data analysesFor quality control, raw sequencing reads were analyzedby FastQC tool (v0.10.0) [57] and low quality reads witha Phred score of less than 13 were removed using theSolexaQA package (v1.1) [58]. De novo transcriptome as-sembly was conducted using Velvet (v1.2.03) [23] andOases (v0.2.06) [59] assembly algorithms with a multi-k
hash length (i.e. 23, 33, 63, and 83 bp) based strategy tocapture the most diverse assembly with improved speci-ficity and sensitivity [59,60]. Final clustering of tran-scripts were obtained using the CD-HIT-EST package(v4.0-210-04-20) [61] and a non-redundant contigs setwas generated.For transcriptome annotation, the final set of contigs
was searched against the NCBI’s non-redundant (nr)protein and plant refseq [24] databases using theBLASTX algorithm [62] with a cut off E-value ≤ 10-6.Contigs with significant matches were annotated usingthe Blast2GO platform [63]. Additional annotations wereobtained through the Kyoto Encyclopedia of Genesand Genomes (KEGG) gene and protein families data-base through the KEGG Automatic Annotation Server(KAAS) (v1.6a) [64]. Associated Gene Ontology (GO)terms as well as enzyme commission (EC) numberswere retrieved and KEGG metabolic pathways wereassigned [65].To determine transcript abundances and differential
expression, high quality reads from each experimentalcondition were individually mapped to the assembledtranscriptome using Bowtie software (v0.12.7) [66].Reads mapping to each contig were counted using SAM-tools (v0.1.16) [67] and transcript abundances were cal-culated as reads per kilobase of exon model per millionmapped reads (RPKM) [68]. All differential expressionanalysis (fold changes) and related statistical computa-tions were conducted by feeding non-normalized readcounts into the DESeq package (v1.5.1) [25]. Separate se-quence read datasets were used as inputs into the DESeqpackage where size factors for each dataset were calcu-lated and overall means and variances were determinedbased on a negative binomial distribution model. Foldchange differences were considered significant when aq-value < 0.05 was achieved based on Benjamin andHochberg’s false discovery rate (FDR) procedure [69],and only statistically significant fold changes were usedin the results analysis. In addition to individual enzymeencoding transcripts, contigs were pooled for each ex-perimental condition and tested against the combineddataset to determine the enriched GO terms using theGossip package [70] integrated in the Blast2GO platform.Significantly enriched GO terms (q-value < 0.05) weredetermined for both + N and −N conditions.Finally, reference guided mapping and differential
expression was as also explored as a quantitation method.In this case, the Tophat package (v1.3.3) [71] was used tomap high quality reads from each experimental conditionagainst the genomes of closely related green algae speciesChlamydomonas reinhardtii (version 169) and Volvoxcarteri (version 150) available through Phytozome (v7.0)[72]. Differential gene expression analysis was quantifiedusing the Cufflinks package (v1.2.1) [73].

Rismani-Yazdi et al. Biotechnology for Biofuels 2012, 5:74 Page 14 of 16http://www.biotechnologyforbiofuels.com/content/5/1/74
Additional files
Additional file 1: Table containing de novo transcriptome assemblymetrics for N. oleoabundans.
Additional file 2: Table containing transcriptome annotationsummary for N. oleoabundans.
Additional file 3: Complete spreadsheet of fold changes withsignificance levels for all transcripts assessed.
Additional file 4: Table containing the complete list of broader GOterms and differential enrichment for the + N condition.
Additional file 5: Table containing the complete list of broader GOterms and differential enrichment for the –N condition.
Additional file 6: Global pathway level representation ofdifferential gene expression in N. oleoabundans. Central metabolicpathways appear within the top right boxes and pathways associatedwith the biosynthesis of secondary metabolites are shown bottom right.Module level close-up representation (light gray boxes) of differentialregulation are presented for (A) Fatty acid biosynthesis and metabolism,biosynthesis of unsaturated fatty acids, and glycerolipid metabolism; (B)Starch metabolism; (C) Nitrogen metabolism; (D) Terpenoid backbonesynthesis; and (E) Diterpenoid and carotenoid biosynthesis. The metabolicpathway map was generated as described by Gianoulis et al. [24] usingiPath2.0 [74].
AbbreviationsTAG: triacylglycerol; DCW: dry cell weight; ACCase: acytyl CoA carboxylase;ACP: acyl carrier protein; +N: nitrogen replete growth; -N: nitrogen-limitedgrowth; FAME: fatty acid methyl ester; NCBI: national center forbiotechnology information; GO: gene ontology; KEGG: Kyoto encyclopedia ofgenes and genomes; KO: KEGG orthology; EC: enzyme commission; HQ: highquality; NADPH: nicotinamide adenine dinucleotide phosphate; Log2FC: foldchange of log2 transformed values; UTEX: the culture collection of algae atthe University of Texas; RPKM: reads per kilobase exon model per millionmapped reads; FDR: false discovery rate.
Competing interestsThe authors declare that they have no competing interests.
Authors’ contributionsHR-Y carried out the growth experiments, conducted the transcriptomesequencing, and participated in the study design and in the preparation ofthe manuscript. BH assisted with the growth experiments and biomoleculemeasurements, performed the bioinformatics analysis, and assisted in thepreparation of the manuscript. CH participated in the algal growth andbiomolecule measurement. JP conceived the study, participated in the studydesign, and oversaw manuscript drafting. All authors read and approved thefinal manuscript.
Authors' informationHamid Rismani-Yazdi and Berat Z. Haznedaroglu denote equal authorship.
AcknowledgmentsThis research was supported by the Connecticut Center for AdvancedTechnologies under a Fuel Diversification Grant, by the National ScienceFoundation Grant #0854322, and by the Yale Climate and Energy Instituteand Yale Institute for Biospheric Studies. We acknowledge the Yale UniversityBiomedical High Performance Computing Center and the NIH Grant#RR19895, for providing access to computational facilities.
Author details1Department of Chemical and Environmental Engineering, Yale University, 9Hillhouse Ave, New Haven, CT 06520, USA. 2Department of ChemicalEngineering, Massachusetts Institute of Technology, Cambridge, MA 02139,USA.
Received: 13 July 2012 Accepted: 13 September 2012Published: 24 September 2012
References1. Melis A: Solar energy conversion efficiencies in photosynthesis:
Minimizing the chlorophyll antennae to maximize efficiency. Plant Sci2009, 177:272–280.
2. National Renewable Energy Labs: A look back at the US Department ofEngergy's aquatic species program: biodiesel from algae, report NREL/TP-580-24190. National Renewable Energy Labs; 1998.
3. Chisti Y: Biodiesel from microalgae. Biotechnol Adv 2007, 25:294–306.4. Griffiths M, Harrison S: Lipid productivity as a key characteristic for
choosing algal species for biodiesel production. J Appl Phycology 2009,21:493–507.
5. Hu Q, Sommerfeld M, Jarvis E, Ghirardi M, Posewitz M, Seibert M, Darzins A:Microalgal triacylglycerols as feedstocks for biofuel production:perspectives and advances. Plant J 2008, 54:621–639.
6. Ohlrogge J, Browse J: Lipid biosynthesis. Plant Cell 1995, 7:957–970.7. Davis MS, Solbiati J, Cronan JE: Overproduction of acetyl-CoA carboxylase
activity increases the rate of fatty acid biosynthesis in Escherichia coli.J Biol Chem 2000, 275:28593–28598.
8. Lu X, Vora H, Khosla C: Overproduction of free fatty acids in E. coli:Implications for biodiesel production. Metab Eng 2008, 10:333–339.
9. Gong Y, Guo X, Wan X, Liang Z, Jiang M: Characterization of a novelthioesterase (PtTE) from Phaeodactylum tricornutum. J Basic Microbiol2011, 51:666–672.
10. Miller R, Wu G, Deshpande R, Vieler A, Gartner K, Li X, Moellering E, Zauner S,Cornish A, Liu B: Changes in transcript abundance in Chlamydomonasreinhardtii following nitrogen deprivation predict diversion ofmetabolism. Plant Physiol 2010, 154:1737–1752.
11. Bourgis F, Kilaru A, Cao X, Ngando-Ebongue G-F, Drira N, Ohlrogge JB,Arondel V: Comparative transcriptome and metabolite analysis of oilpalm and date palm mesocarp that differ dramatically in carbonpartitioning. Proc Natl Acad Sci 2011, 108:12527–12532.
12. Li Y, Horsman M, Wang B, Wu N, Lan C: Effects of nitrogen sources on cellgrowth and lipid accumulation of green alga Neochloris oleoabundans.Appl Microbiol Biotechnol 2008, 81:629–636.
13. Guarnieri MT, Nag A, Smolinski SL, Darzins A, Seibert M, Pienkos PT:Examination of triacylglycerol biosynthetic pathways via de novotranscriptomic and proteomic analyses in an unsequenced microalga.PLoS One 2011, 6(10):e25851.
14. Rismani-Yazdi H, Haznedaroglu B, Bibby K, Peccia J: Transcriptomesequencing and annotation of the microalgae Dunaliella tertiolecta:Pathway description and gene discovery for production of next-generation biofuels. BMC Genomics 2011, 12(1):148.
15. Radakovits R, Jinkerson R, Darzins A, Posewitz M: Genetic engineering ofalgae for enhanced biofuel production. Eukaryot Cell 2010,9:486–501.
16. Gonzalez-Ballester D, Casero D, Cokus S, Pellegrini M, Merchant SS,Grossman AR: RNA-Seq nalysis of sulfur-deprived Chlamydomonas cellsreveals aspects of acclimation critical for cell survival. The Plant Cell Online2010, 22:2058–2084.
17. Baba M, Ioki M, Nakajima N, Shiraiwa Y, Watanabe MM: Transcriptomeanalysis of an oil-rich race A strain of Botryococcus braunii (BOT-88-2) byde novo assembly of pyrosequencing cDNA reads. Bioresour Technol 2012,109:282–286.
18. Wan L, Han J, Sang M, Li A, Wu H, Yin S, Zhang C: De novo transcriptomicanalysis of an oleaginous microalga: Pathway description and genediscovery for production of next-generation biofuels. PLoS One 2012,7(4):e35142.
19. Li Y, Fei X, Deng X: Novel molecular insights into nitrogen starvation-induced triacylglycerols accumulation revealed by differential geneexpression analysis in green algae Micractinium pusillum. Biomass andBioenergy 2012, 42:199–211.
20. Deason TR, Silva PC, Watanabe S, Floyd GL: Taxonomic status of thespecies of the green algal genus Neochoris. Plant Systematics andEvolution 1991, 177:213–219.
21. Pruvost J, Van Vooren G, Le Gouic B, Couzinet-Mossion A, Legrand J:Systematic investigation of biomass and lipid productivity by microalgaein photobioreactors for biodiesel application. Bioresour Technol 2011,102:150–158.
22. Griffiths M, van Hille R, Harrison S: Selection of direct transesterification asthe preferred method for assay of fatty acid content of microalgae.Lipids 2010, 45(11):1053–1060.
Rismani-Yazdi et al. Biotechnology for Biofuels 2012, 5:74 Page 15 of 16http://www.biotechnologyforbiofuels.com/content/5/1/74
23. Zerbino DR, Birney E: Velvet: algorithms for de novo short read assemblyusing de Bruijn graphs. Genome Res 2008, 18:821–829.
24. Gianoulis TA, Raes J, Patel PV, Bjornson R, Korbel JO, Letunic I, Yamada T,Paccanaro A, Jensen LJ, Snyder M, et al: Quantifying environmentaladaptation of metabolic pathways in metagenomics. Proc Natl Acad Sci2009, 106:1374–1379.
25. Anders S, Huber W: Differential expression analysis for sequence countdata. Genome Biol 2010, 11:R106.
26. Ashburner M, Ball CA, Blake JA, Botstein D, Butler H, Cherry JM, Davis AP,Dolinski K, Dwight SS, Eppig JT, et al: Gene Ontology: tool for theunification of biology. Nat Genet 2000, 25:25–29.
27. Sasaki Y, Nagano Y: Plant acetyl-CoA carboxylase: Structure, biosynthesis,regulation, and gene manipulation for plant breeding. Biosci BiotechnolBiochem 2004, 68:1175–1184.
28. Pollard M, Ohlrogge J: Testing models of fatty acid transfer and lipidsynthesis in spinach leaf using in vivo oxygen-18 labeling. Plant Physiol1999, 121:1217–1226.
29. Dahlqvist A, Stahl U, Lenman M, Banas A, Lee M, Sandager L, Ronne H,Stymne H: Phospholipid: diacylglycerol acyltransferase: an enzyme thatcatalyzes the acyl-CoA-independent formation of triacylglycerol in yeastand plants. Proc Natl Acad Sci USA 2000, 97:6487–6492.
30. Baena-Gonzalez E, Rolland F, Thevelein JM, Sheen J: A central integrator oftranscription networks in plant stress and energy signalling. Nature 2007,448:938–942.
31. Ghillebert R, Swinnen E, Wen J, Vandesteene L, Ramon M, Norga K,Rolland F, Winderickx J: The AMPK/SNF1/SnRK1 fuel gauge and energyregulator: structure, function and regulation. FEBS J 2011,278:3978–3990.
32. Kang L-K, Hwang S-PL, Gong G-C, Lin H-J, Chen P-C, Chang J: Influences ofnitrogen deficiency on the transcript levels of ammonium transporter,nitrate transporter and glutamine synthetase genes in Isochrysis galbana(Isochrysidales, Haptophyta). Phycologia 2007, 46:521–533.
33. Morey J, Monroe E, Kinney A, Beal M, Johnson J, Hitchcock G, Van Dolah F:Transcriptomic response of the red tide dinoflagellate, Karenia brevis, tonitrogen and phosphorus depletion and addition. BMC Genomics 2011,12(1):346.
34. Neuhaus HE, Emes MJ: Nonphotosynthetic metabolism in plastids.Annu Rev Plant Physiol Plant Mol Biol 2000, 51:111–140.
35. McKibbin RS, Muttucumaru N, Paul MJ, Powers SJ, Burrell MM, Coates S,Purcell PC, Tiessen A, Geigenberger P, Halford NG: Production of high-starch, low-glucose potatoes through over-expression of the metabolicregulator SnRK1. Plant Biotechnol J 2006, 4:409–418.
36. Jossier M, Bouly J-P, Meimoun P, Arjmand A, Lessard P, Hawley S, GrahameHardie D, Thomas M: SnRK1 (SNF1-related kinase 1) has a central role insugar and ABA signalling in Arabidopsis thaliana. Plant J 2009, 59:316–328.
37. Morin N, Cescut J, Beopoulos A, Lelandais G, Le Berre V, Uribelarrea J-L,Molina-Jouve C, Nicaud J-M: Transcriptomic analyses during the transitionfrom biomass production to lipid accumulation in the oleaginous yeastYarrowia lipolytica. PLoS One 2011, 6(11):e27966.
38. Bamgboye AI, Hansen AC: Prediction of cetane number of biodiesel fuelfrom the fatty acid methyl ester (FAME) composition. Int Agrophysics2008, 22:21–29.
39. Coleman RA, Lee DP: Enzymes of triacylglycerol synthesis and theirregulation. Prog Lipid Res 2004, 43:134–176.
40. Zou JT, Katavic V, Giblin EM, Barton DL, MacKenzie SL, Keller WA, Hu X,Taylor DC: Modification of seed oil content and acyl composition in thebrassicaceae by expression of a yeast sn-2 acyltransferase gene.Plant Cell 1997, 9:909–923.
41. Taylor DC, Katavic V, Zou JT, MacKenzie SL, Keller WA, An J, Friesen W,Barton DL, Pedersen KK, Giblin EM, et al: Field testing of transgenicrapeseed cv. Hero transformed with a yeast sn-2 acyltransferase resultsin increased oil content, erucic acid content and seed yield.Molecular Breeding 2002, 8:317–322.
42. Jain RK, Coffey M, Lai K, Kumar A, MacKenzie SL: Enhancement of seed oilcontent by expression of glycerol-3-phosphate acyltransferase genes.Biochem Soc Trans 2000, 28:958–961.
43. Nykiforuk CL, Furukawa-Stoffer TL, Huff PW, Sarna M, Laroche A, Moloney MM,Weselake RJ: Characterization of cDNAs encoding diacylglycerolacyltransferase from cultures of Brassica napus and sucrose-mediatedinduction of enzyme biosynthesis. Biochimica Et Biophysica Acta-Mol Cell BiolLipids 2002, 1580:95–109.
44. Ball SG, Dirick L, Decq A, Martiat J-C, Matagne RF: Physiology of starchstorage in the monocellular alga Chlamydomonas reinhardtii. Plant Sci1990, 66(1):1–9.
45. Wattebled F, Ral JP, Dauvillee D, Myers AM, James MG, Schlichting R,Giersch C, Ball SG, D'Hulst C: STA11, a Chlamydomonas reinhardtii locusrequired for normal starch granule biogenesis, encodesdisproportionating enzyme. Further evidence for a function of alpha-1,4glucanotransferases during starch granule biosynthesis in green algae.Plant Physiol 2003, 132:137–145.
46. Giovanardi M, Ferroni L, Baldisserotto C, Tedeschi P, Maietti A, Pantaleoni L,Pancaldi S: Morphophysiological analyses of Neochloris oleoabundans;(Chlorophyta) grown mixotrophically in a carbon-rich waste product.Protoplasma, doi:10.1007/s00709-012-0390-x.
47. Wang ZT, Ullrich N, Joo S, Waffenschmidt S, Goodenough U: Algal lipidbodies: Stress induction, purification, and biochemical characterization inwild-type and starch-less Chlamydomonas reinhardtii. Eukaryot Cell 2009,8:1856–1868.
48. Martin NC, Goodenough UW: Gametic differentiation in Chlamydomonasreinhardi. I. Production of gametes and their fine structure. J Cell Biol1975, 67:587–605.
49. Karampudi S, Chowdhury K: Effect of media on algae growth for bio-fuelproduction. Notulae Scientia Biologicae 2011, 3:33–41.
50. APHA, AWWA, WEF: Standard methods for the examination of water andwastewater. 18th edition. Washington, D.C: APHA, AWWA, WEF; 2005.
51. Arnon DI: Copper enxymes in isolated chloroplasts. Polyphenoloxidae inBeta vulgaris. Plant Physiol 1949, 24:1–15.
52. Mochizuki N, Brusslan JA, Larkin R, Nagatani A, Chory J: Arabidopsisgenomes uncoupled 5 (GUN5) mutant reveals the involvement of Mg-chelatase H subunit in plastid-to-nucleus signal transduction. Proc NatlAcad Sci 2001, 98:2053–2058.
53. Bradford MM: A rapid and sensitive method for the quantitation ofmicrogram quantities of protein utilizing the principle of protein-dyebinding. Anal Biochem 1976, 72:248–254.
54. Kruger NJ: The Bradford method for protein quantitation. In The ProteinProtocols Handbook. Edited by Walker JM. New Jersey: Humana Press;2002:15–21.
55. Bligh EG, Dyer WJ: A rapid method of total lipid extraction andpurification. Can J Biochem Physiol 1959, 37:911–917.
56. Soh L, Zimmerman J: Biodiesel production: the potential of algal lipidsextracted with supercritical carbon dioxide. Green Chem 2011,13:1422–1429.
57. Andrews S: FastQC. Babraham: Bioinformatics; 2011.58. Cox M, Peterson D, Biggs P: SolexaQA: At-a-glance quality assessment of
Illumina second-generation sequencing data. BMC Bioinformatics 2010,11(1):485.
59. Schulz MH, Zerbino DR, Vingron M, Birney E: Oases: Robust de novo RNA-seq assembly across the dynamic range of expression levels.Bioinformatics, doi:10.1093/bioinformatics/bts094.
60. Surget-Groba Y, Montoya-Burgos JI: Optimization of de novotranscriptome assembly from next-generation sequencing data.Genome Res 2010, 20:1432–1440.
61. Li W, Godzik A: Cd-hit: a fast program for clustering and comparing largesets of protein or nucleotide sequences. Bioinformatics 2006,22:1658–1659.
62. Altschul SF, Madden TL, Schäffer AA, Zhang J, Zhang Z, Miller W, Lipman DJ:Gapped BLAST and PSI-BLAST: a new generation of protein databasesearch programs. Nucleic Acids Res 1997, 25:3389–3402.
63. Conesa A, Götz S, Garcia-Gomez JM, Terol J, Talon M, Robles M: Blast2GO: auniversal tool for annotation, visualization and analysis in functionalgenomics research. Bioinformatics 2005, 21:3674–3676.
64. Moriya Y, Itoh M, Okuda S, Yoshizawa AC, Kanehisa M: KAAS: an automaticgenome annotation and pathway reconstruction server. Nucleic Acids Res2007, 35(suppl 2):W182–W185.
65. Ogata H, Goto S, Sato K, Fujibuchi W, Bono H, Kanehisa M: KEGG: KyotoEncyclopedia of Genes and Genomes. Nucleic Acids Res 1999, 27:29–34.
66. Langmead B, Trapnell C, Pop M, Salzberg S: Ultrafast and memory-efficientalignment of short DNA sequences to the human genome. Genome Biol2009, 10(3):R25.
67. Li H, Handsaker B, Wysoker A, Fennell T, Ruan J, Homer N, Marth G, Abecasis G,Durbin R, Subgroup GPDP: The Sequence Alignment/Map format andSAMtools. Bioinformatics 2009, 25:2078–2079.
Rismani-Yazdi et al. Biotechnology for Biofuels 2012, 5:74 Page 16 of 16http://www.biotechnologyforbiofuels.com/content/5/1/74
68. Mortazavi A, Williams BA, McCue K, Schaeffer L, Wold B: Mapping andquantifying mammalian transcriptomes by RNA-Seq. Nat Meth 2008,5:621–628.
69. Benjamini Y, Hochberg Y: Controlling the false discovery rate: a practicaland powerful approach to multiple testing. J Royal Stat Soc Ser B(Methodological) 1995, 57:289–300.
70. Bluthgen N, Kielbasa SM, Herzel H: Inferring combinatorial regulation oftranscription in silico. Nucleic Acids Res 2005, 33:272–279.
71. Trapnell C, Pachter L, Salzberg SL: TopHat: discovering splice junctionswith RNA-Seq. Bioinformatics 2009, 25:1105–1111.
72. Goodstein DM, Shu S, Howson R, Neupane R, Hayes RD, Fazo J, Mitros T,Dirks W, Hellsten U, Putnam NÄ, et al: Phytozome: a comparative platformfor green plant genomics. Nucleic Acids Res 2012, 40:D1178–D1186.
73. Roberts A, Pimentel H, Trapnell C, Pachter L: Identification of noveltranscripts in annotated genomes using RNA-Seq. Bioinformatics 2011,17:2325–2329.
74. Yamada T, Letunic I, Okuda S, Kanehisa M, Bork P: iPath2.0: interactivepathway explorer. Nucleic Acids Res 2011, 39(suppl 2):W412–W415.
doi:10.1186/1754-6834-5-74Cite this article as: Rismani-Yazdi et al.: Transcriptomic analysis of theoleaginous microalga Neochloris oleoabundans reveals metabolicinsights into triacylglyceride accumulation. Biotechnology for Biofuels 20125:74.
Submit your next manuscript to BioMed Centraland take full advantage of:
• Convenient online submission
• Thorough peer review
• No space constraints or color figure charges
• Immediate publication on acceptance
• Inclusion in PubMed, CAS, Scopus and Google Scholar
• Research which is freely available for redistribution
Submit your manuscript at www.biomedcentral.com/submit