training-based spectral reconstruction from a …mbrown/pdf/eccv2014_spectral...training-based...
TRANSCRIPT

Training-Based Spectral Reconstruction from aSingle RGB Image
Rang M. H. Nguyen Dilip K. Prasad Michael S. Brown
School of Computing, National University of Singapore
Abstract. This paper focuses on a training-based method to recon-struct a scene’s spectral reflectance from a single RGB image captured bya camera with known spectral response. In particular, we explore a newstrategy to use training images to model the mapping between camera-specific RGB values and scene reflectance spectra. Our method is basedon a radial basis function network that leverages RGB white-balancingto normalize the scene illumination to recover the scene reflectance. Weshow that our method provides the best result against three state-of-artmethods, especially when the tested illumination is not included in thetraining stage. In addition, we also show an effective approach to recoverthe spectral illumination from the reconstructed spectral reflectance andRGB image. As a part of this work, we present a newly captured, publiclyavailable, data set of hyperspectral images that are useful for addressingproblems pertaining to spectral imaging, analysis and processing.
1 Introduction
A scene visible to the human eye is composed of the scene’s spectral reflectanceand the scene spectral illumination which spans visible wavelengths. Commoditycameras use filters on their sensors to convert the incoming light spectra intothree color channels (denoted as Red, Green, and Blue). While only three colorchannels are needed to reproduce the perceptual quality of the scene, the projec-tive nature of the imaging process results in a loss of the spectral information.
Directly capturing spectral information from specialized hyperspectral cam-eras remains costly. The goal of this work is to reconstruct a scene’s spectralproperties, i.e. scene reflection and illumination, from a single RGB image (seeFigure 1). This is done by learning a mapping between spectral responses andtheir corresponding RGB values for a given make and model of a camera.
Prior work in this area follow a similar training-based approach, but attemptto find a mapping using RGB images where the effects of different illuminationare included in the learning process. This makes these approaches sensitive toinput images captured under illuminations which were not present in the trainingdata.Contribution We introduce a new strategy that learns a non-linear mappingbased on a radial basis function network between the training-data and RGB im-ages. Our approach uses a white-balance step to provide an approximate normal-ization of the illumination in the RGB images to improve the learned mapping

2 Rang M. H. Nguyen Dilip K. Prasad Michael S. Brown
RGB input image
Spectral reflectance image
Reconstruct
Spectral illumination 400 500 600 7000
0.5
1
Training dataset
Fig. 1. Our approach takes in an input RGB image and then estimates both the spec-tral reflectance and the overall spectral illumination based on pre-computed trainingdataset.
between the RGB images and spectral reflectances. This white-balance step alsohelps in making our approach robust to input images captured under illumina-tions not in our training data. Moreover, we propose a technique to estimate theillumination given our estimated spectral reflectance. Our experimental resultsdemonstrate our approach is superior to prior methods. An additional contri-bution of our work is a publicly available spectral image dataset of dozens ofreal-world scenes taken under a number of illuminations.
2 Related Work
The need to reconstruct the spectral properties of scene reflectance (and illumi-nation) from a three channel device or a standard color space (such as CIE-XYZ)was recognized as early as 1980s [14, 15, 20, 21, 24]. Several works targeted thereconstruction of the spectral properties of standard color samples such as theMunsell Book of Colors [2, 8, 10, 11, 15, 20, 24], OSA UCS [11], Swedish NaturalColor System [11], and Pantone dataset [17]. Additionally, [15] considered thespectral reflectances of natural objects also.
Virtually all methods rely on the use of training-data to learn a mappingbetween RGB images and the corresponding spectra. For many years, a lin-ear model was considered sufficient for this problem. It was determined usingstatistical analysis on standard color samples that a few (typically 3-10) ba-sis functions are sufficient to represent the spectral reflectances [15, 20, 24, 32].Further, in general, basis functions were assumed to be continuous and bandlimited [20, 24]. Most methods considered either PCA bases [2, 3, 11, 15, 17, 20,30] or the Karhunen-Loeve transformation [8, 10, 24, 25, 28, 32] (also called ma-trix R approach) which were typically pre-learnt using a few hundred to a littlemore than thousand spectral samples. Interestingly, [11] consider two types ofPCA bases - one with least squares fit and another with assumption that thetristimulus function of the sensor and the illumination are known. The latter ap-

Training-Based Spectral Reconstruction from a Single RGB Image 3
proach is more accurate although it is restricted in application since illuminationis generally unknown.
An interesting statistical approach was used in [22] where the bases werechosen not to minimize the error in spectral reflectance representation alone,but to minimize the error in predicting the sensor response as well such that thespectral response function of the sensor plays a role in determining the suitablebases. In the work of Abed et al. [1], a tessellation of the scatter RGB points andtheir reflectance spectra of a standard color chart (for a given illumination) wasused as a nearest-neighbor look-up table. Then, in the general case of a scene inthe same illumination, the reflectance of the nodes of the polytope that enclosesthe scene’s RGB point are used to interpolate the reflectance at that point.
Recently, the need of non-linear mappings was recognized [4, 26, 29], thoughsuch a requirement was indicated earlier in [22]. Further, it was recognized bysome researchers that while PCA itself may be insufficient for accurate recon-struction of spectral reflectance, splitting the color space into overlapping sub-spaces of 10 different hues [3, 30] and low-chromaticity sub-space [30] and thenusing PCA on each subspace performs better. Similarly, Agahian et al. [2] pro-posed to put weighted coefficients for each spectral reflectance in the datasetbefore computing PCA. Some works [9, 11] highlight that illumination has a di-rect and important role in the ability to reconstruct the spectral reflectances.Using Bayesian decision theory, Brainard and Freeman [5] reconstructed bothspectral reflectance and illumination information for color constancy. Lenz et al.[18] statistically approximated the logarithm of the reflectance spectra of Mun-sell and NCS color chips instead of the usual reflectance spectra themselves.Further they computed approximate distribution of the illuminant and showedits utility for color constancy.
In our work, we consider a novel non-linear mapping strategy for modelingthe mapping between camera-specific RGB values and scene reflectance spectra.Specifically, we use a radial basis function network for modeling the mapping.Our model for spectral reflectances is made illumination independent by usingRGB white-balancing to normalize the scene illumination before reconstructingthe spectral reflectance.
The remainder of this paper is organized as follows: Sections 3 and 4 presentour approaches for spectral reflectance and illumination reconstruction, respec-tively; Section 5 presents the details of our spectral image dataset; Section 6describes reconstruction results using three commercial cameras; Section 7 con-cludes the paper.
3 Scene Reflectance Reconstruction
As discussed in previous section, most of the methods for reconstructing re-flectance are not clear how to deal with different illuminations. For example,consider we have two different spectral reflectances R1(λ) and R2(λ) illumi-nated by two different spectral illuminations L1(λ) and L2(λ) respectively. It ispossible that under a certain observer Cc(λ) (where c = r, g, b), these two spec-

4 Rang M. H. Nguyen Dilip K. Prasad Michael S. Brown
tral reflectances share the same RGB values as described in Eq. 1. This metamerproblem can be expressed as:∫
λ
L1(λ)R1(λ)Cc(λ) dλ =
∫λ
L2(λ)R2(λ)Cc(λ) dλ. (1)
From the above equation, we see it is difficult to determine whether the re-flectance is R1(λ) or R2(λ) when information about illumination is not avail-able. Therefore, one mapping for all illuminations can not handle this case. Onestraightforward solution is to build a mapping for each illumination. This ap-proach will be the best in terms of reconstruction accuracy. However, it requiresnot only a huge effort to calibrate mappings over all illuminations but also knownillumination of a new scene for reconstructing its reflectance. This approach isimpractical for most applications.
In our approach, the illumination in the RGB is normalized before it is usedfor learning. The RGB images have been corrected using conventional white-balancing method. The details are discussed in Section 3.2. The following arefour assumptions made in our approach:
– The mapping is specific to the camera and one mapping for a camera canbe used for any spectral reflectance.
– The color matching functions of the camera are known.– The scene is illuminated by a uniform illumination.– The white balancing algorithm gives good performance for images taken
under a variety of illuminations.
3.1 Pre-requisites
In this paper, we do not use RGB images taken directly from the camera. In-stead, we synthesize RGB images from hyperspectral images using known cam-era’s sensitivity functions. Computing the RGB images in this manner gives ustwo main advantages. Firstly, it removes the need to create a dataset of theimages captured using the chosen camera for the same scenes as captured bythe spectral camera. This method can be used for any commercial camera sofar as its sensitivity functions are known. Note however that it is possible touse a given camera, however, care will be needed to ensure spatial scene corre-spondence between the RGB image and spectral image. This will likely limit thetraining data to planar scenes for accurate correspondence.Color matching functions The color matching functions are generally mea-sured using sophisticated instruments. However, recent methods were proposedto reconstruct the color matching functions using standard colorcharts and illu-minations satisfying certain practical requirements (for more details, see [16, 27]).Alternatively, existing datasets such as [31] can be used if the chosen camera is apart of these datasets. Irrespective of the method used, measurement/estimationof the color matching functions is a one time process and the color matchingfunctions can be stored for further use.

Training-Based Spectral Reconstruction from a Single RGB Image 5
Spectral image
Scene reflectance
Illumination spectrum 400 500 600 700
Scene
Calibration WHITE Tile
Light
Source
Spectral Camera
/
Spectral image
Fig. 2. This figure shows how to obtain scene reflectance and spectral illuminationusing a hyperspectral camera. First, a spectral image is captured from the real scene.Then, a calibration white tile is used to measure the illumination spectrum. Finally,the scene reflectance is obtained by dividing the spectral image by the illuminationspectrum.
Illuminations To obtain the illumination spectrum, we use a calibration whitetile supplied with the spectral camera to capture a spectral image of the whitetile illuminated by the light source (see Figure 2). We represent the spectralimage captured using white tile as SW (λ, x), where λ is the wavelength, x isthe pixel index, W denotes the white tile, and S denotes the spectral intensitycaptured using the spectral camera. The spectral illumination L(λ) is computedas the average of the spectral information at all the pixels as follows:
L(λ) =1
N
N∑x=1
SW (λ, x) (2)
where N is the total number of pixels.
Spectral reflectances After obtaining the spectral illumination, the spectralreflectance R(λ, x) corresponding to each pixel in the spectral image S(λ, x) canbe computed directly as follows:
R(λ, x) = S(λ, x)/L(λ) (3)
3.2 Training Stage
As discussed in the previous section, most existing methods consider comput-ing mappings between RGB images under different illuminations and their re-flectances (see Figure 3-(A)). While our approach considers a mapping betweenRGB images under canonical illumination (using white-balancing) and their re-flectances. The training process for our model is shown in Figure 3-(B). Our ap-proach has three steps: synthesizing the RGB image, white-balancing the RGBimage, and computing the mapping.

6 Rang M. H. Nguyen Dilip K. Prasad Michael S. Brown
RBF
model
White-
balancing
Training
model
Mapping 𝒇
Scene reflectance
RGB image under
illumination L1
(A) (B)
⋮
RGB image under
illumination Lk
Scene reflectance
RGB image under
canonical illumination LC
White-
balancing
Scene reflectance
RGB image under
illumination L1
⋮
RGB image under
illumination Lk
Scene reflectance
Mapping 𝒇
RGB image under
canonical illumination LC
Fig. 3. This figure shows the training process for reflectance reconstruction for previousapproaches and our approach. (A) shows that previous approaches consider the map-ping f of RGB image to spectral reflectances. (B) shows that our approach considersthe mapping f of RGB white-balanced image to the spectral reflectances.
Firstly, synthesized the RGB images corresponding to scenes and illumina-tions in spectral images can be formed by using the intrinsic image model as:
Ic(x) =
∫λ
L(λ)R(λ, x)Cc(λ) dλ (4)
where L(λ) is the illumination spectrum, R(λ, x) is the scene reflectance forthe pixel x, Cc(λ) is the color matching function for the cth color channel, andc = r, g, b is the color channel.
After forming the RGB image Ic(x), we obtain a white balanced image Ic(x)as follows:
Ic(x) = diag
(1
tr,
1
tg,
1
tb
)Ic(x) (5)
where t = [tr, tg, tb] is the white balancing vector obtained by a chosen whitebalancing algorithm. For the white-balancing step, we have used shades of grey(SoG) method [12] that uses the Minkowsky norm of order 5. We note thatseveral other methods are known for white balancing [7, 13]. Here, we havechosen SoG for its simplicity, low computational requirement and proven efficacyover various datasets 1.
Next, a mapping f is learnt between the white balanced RGB images Ic(x)and their spectral reflectances. Because we cannot guarantee the uniformity ofthe spectral and RGB samples, we use scatter point interpolation based on aradial basis function (RBF) network for mapping. RBF network is a popular
1 http:/www.colorconstancy.com/

Training-Based Spectral Reconstruction from a Single RGB Image 7
interpolation method in multidimensional space. It is used to implement a map-ping f : R3 → RP according to
f(x) = w0 +
M∑i=1
wiφ(‖x− ci‖) (6)
where x ∈ R3 is the RGB input value, f(x) ∈ RP is the spectral reflectancevalue in P-dimensional space, φ(.) is the radial basis function, ‖.‖ denotes theEuclidean distance, wi (0 ≤ i ≤ M) are the weights, ci ∈ R3 (1 ≤ i ≤ M) arethe RBF centers, M is the number of center. The RBF centers ci are chosenby the orthogonal least squares method. The weights wi are determined usinglinear least squares method. For more information see [6].
To control the number of centers M for the RBF network model against over-fitting, we use repeated random sub-sampling validation to do cross-validation.Specifically, we randomly split the data into two sets: a training set and a vali-dation set. The RBF network model is fitted by the training set and its gener-alization ability is assessed by the validation set. We ran this procedure severaltimes on our data and found that the number of centers M which gave the bestresult for validation set was within 45− 50.
3.3 Reconstruction Stage
Once the training is performed, the mapping can be saved and used offline forspectral reflectance reconstruction. To reconstruct spectral reflectance for a newRGB image, this image must be white-balanced to transform the image to thenormalized illumination space Irgb(x). The learned mapping f is used to mapthe white-balanced image to the spectral reflectance image as in Eq. 7.
R(λ, x) = f(Irgb(x)) (7)
4 Spectral Illumination Reconstruction
In theory, the spectral illumination L(λ) can be solved from Eq. 4 when giventhe spectral reflectance R(λ, x) (estimated in Section 3.3), camera sensitivityfunctions Cc(λ) (given) and RGB values Ic(x) (input). This equation can bewritten into product of matrices as follows:
Irgb = Cdiag(L)R (8)
where Irgb is a matrix of 3×N , C is a matrix of 3×P , L is a vector of P × 1, Ris a matrix of P ×N , P is the number of spectral bands, and N is the numberof pixels.
To solve the vector L, Eq. 8 needs to be rewritten as follows:
I = TL (9)

8 Rang M. H. Nguyen Dilip K. Prasad Michael S. Brown
where I = [Ir, Ig, Ib]> is a vector of 3N×1, T = [diag(Cr)R,diag(Cg)R,diag(Cb)R]>
is a matrix of 3N × P .This means that the spectral illumination L(λ) can be solved in a linear
least squares manner. However, in practice the noise in Ic(x) and the inaccuracyin estimation of R(x, λ) impedes the reconstruction of L(λ). As a result, it isnecessary to include additional non-negative and smoothness constraints into theoptimization function before solving L(λ) as Eq. 10. This step is similar withwork proposed by Park et al. [23] and can be expressed as follows:
L = arg minL
(||TL− I||22 + α ||WL||22
)s.t L ≥ 0
(10)
where ‖.‖2 denotes l2-norm, the term α is a weight for the smoothness constraint,and W is the first-derivative matrix defined as follows:
W =
∣∣∣∣∣∣∣∣0 0 . . . 0 01 −1 . . . 0 0
. . .0 0 . . . 1 −1
∣∣∣∣∣∣∣∣ (11)
We additionally use PCA basis functions to allow L(λ) to fall in a definitesubspace. Therefore, spectral illumination L(λ) can be described as
L(λ) =
M∑i=1
aiBi(λ) (12)
where Bi(λ) are the basis functions, ai are the corresponding coefficients, andM is the number of basis functions. Eq. 12 can be rewritten into product ofmatrices as follows:
L = Ba
where a = [ai]Mi=1 is the vector of the coefficients, and B = [Bi]
Mi=1 is the matrix
of the basis functions.Thus, the optimization function in Eq. 10 becomes:
a = arg mina
(||TBa− I||22 + α ||WBa||22
)s.t Ba ≥ 0
(13)
Eq. 13 is a convex optimization and the global solution can be easily obtained.To make it more robust against noise from T and I (as discussed above), theoptimization step in Eq. 13 should be run several times, and for each time, noisesamples are removed from T and I. To determine them, the spectral illuminationL is estimated and the error for each pixel is computed as in Eq. 14 at each time.
ε(x) = ‖Cdiag(L)R(x)− Irgb(x)‖2 (14)
where x is the pixel in the image. The noise samples are determined by comparingwith standard deviation. Then T and I are updated by removing these noisesamples for the next run.

Training-Based Spectral Reconstruction from a Single RGB Image 9
Fig. 4. This figure shows some hyperspectral images from our dataset. For visual-ization, these hyperspectral images are rendered to RGB images by using sensitivityfunctions of Canon 1D Mark III. There are a total of 64 spectral images and theircorresponding illumination spectra in our dataset.
5 Dataset of Hyperspectral Images
Our dataset contains spectral images and illumination spectra taken using Specim’sPFD-CL-65-V10E (400 nm to 1000 nm) spectral camera 2. We have used anOLE23 fore lens (400 nm to 1000 nm), also from Specim. For light sources, wehave considered natural sunlight and shade conditions. Additionally, we consid-ered artificial wideband lights using metal halide lamps of different color temper-atures - 2500 K, 3000 K, 3500 K, 4300K, 6500K and a commercial off-the-shelfLED E400 light. For the natural light sources, we have taken outdoor imagesof natural objects (plants, human beings, etc.) as well as man made objects.Further, a few images of buildings at very large focal length were also taken.The images corresponding to the other light sources have manmade objects astheir scene content. For each spectral image, a total of 31 bands were used forimaging (400 nm to 700 nm at a spacing of about 10 nm). Figure 4 shows somesamples from our dataset.
There are a total of 64 spectral images and their corresponding illuminationspectra. We use 24 images with color charts as the test images for the reconstruc-tion stage. This is because explicit ground truth of their spectral reflectances areavailable and thus the accuracy of reconstruction can be better assessed. Theseimages are referred to as the test images. We have used the remaining 40 imagesas training images.
2 http://www.specim.fi/index.php/products/industrial/spectral-cameras/
vis-vnir/

10 Rang M. H. Nguyen Dilip K. Prasad Michael S. Brown
In addition, we also used the dataset of illumination spectra from Barnard’swebsite3. This dataset consists of 11 different spectral illuminations. We usedthese spectral illumination to synthetically generate more hyperspectral imagesfrom spectral reflectance captured by our hyperspectral camera. These hyper-spectral images were used to test performance of all methods.
6 Experimental Results
In order to compare the different methods and verify their accuracy, we considerthree cameras: Canon 1D Mark III, Canon 600D, and Nikon D40, whose colormatching functions are available in the dataset of [31]. We first trained all meth-ods from samples from our training images. Because the total number of pixelsfrom 40 training images is too large and most of them are similar together, wesub-sampled each training image by using k-means clustering [19] and collectedaround 16,000 spectral reflectances from all the images for the training step.For the PCA method, three principal components are computed from this setof spectral reflectances. For weighted PCA proposed by Agahian et al. [2] andDelaunay interpolation proposed by Abed et al. [1], all 16,000 pairs of spectralreflectances and their corresponding RGB values are stored. Matlab code andspectral datasets used in this paper will be available online 4.
To verify the quantitative performance for the spectral reflectance reconstruc-tion, we use two types of measurements: the goodness-of-fit coefficient (GFC) asin Eq. 15 to measure the similarity, and root mean square error (RMSE) as inEq. 16 to measure the error.
sR =1
N
∑x
|∑λ
R (λ, x) R (λ, x)|√∑λ
[R (λ, x)]2√∑
λ
[R (λ, x)]2(15)
εR =
√√√√∑x‖R (λ, x)− R (λ, x)‖22
N(16)
where R (x, λ) and R (x, λ) are the actual and reconstructed spectral reflectances,N are the number of pixels in the image, and ‖.‖2 is l2-norm.
We compare our method against other three methods: traditional PCA,Agahian et al. [2], and Abed et al. [1] method. Firstly, the RGB test imagesfor reconstruction are formed using the intrinsic image model in Eq. 4. We re-construct reflectances of 24 images (size of 1312 × 1924). The average time toreconstruct the whole image required by the four methods are presented in Ta-ble 1. We also test our method without using white-balance step to analyze thecontribution of each steps in our framework.
3 http://www.cs.sfu.ca/~colour/data/colour_constancy_synthetic_test_data/
index.html4 http://www.comp.nus.edu.sg/~whitebal/spectral_reconstruction/index.html

Training-Based Spectral Reconstruction from a Single RGB Image 11
In order to investigate the impact of illumination on the reconstruction per-formance, we test all the five methods on two test conditions. The first testcondition considers images taken under illuminations that were present in thetraining images also. Table 2 shows the similarity and error measurement re-spectively under illumination present in training data. The second test conditionconsiders images taken under illuminations that were not present in the trainingimages. Table 3 shows the similarity and error measurement respectively underillumination not present in training data. The results show that our methodprovides the best result for spectral reflectance reconstruction in terms of bothsimilarity and error for both test conditions. It is clear that white-balance stepis important especially when the illumination is not present in training data.Moreover, RBF has better performance than other technique and much morecompact than Delaunay interpolation and weighted PCA.
Table 1. This table shows the average time for each method to reconstruct spectralreflectances from a whole image of size 1312 × 1924.
Methods PCA Agahian [2] Abed [1] Our
Time (s) 1.14 144.30 23.14 8.56
In addition, we also compare the actual reconstruction results for eight colorpatches in the color chart in Figure 5 for Canon 1D Mark III. The images aretaken under indoor illumination using metal halide lamp of 4300K color tem-perature (spectrum in Figure 6). The ground truth of the spectral reflectancesare obtained from the hyperspectral camera. The quantitative results of thesepatches for all methods are shown in Table 4. Again, it can be seen that ourmethod performs better than the others methods. Additional results are shownin the supplementary material.
Our method also obtains good results for recovering spectral illumination.The reconstructed spectra of six illuminations are also shown in Figure 6 alongwith the ground truth ones. Three top illuminations are metal halide lamp2500K, metal halide lamp 4300K and sunlight from our dataset. Three bot-tom illuminations are Sylvania 50MR16Q, Solux 3500K and Solux 4700K fromBarnard’s website. Our accuracies of the recovered spectral illumination arewithin 0.94−0.99 in term of similarity measurement (goodness-of-fit coefficient).
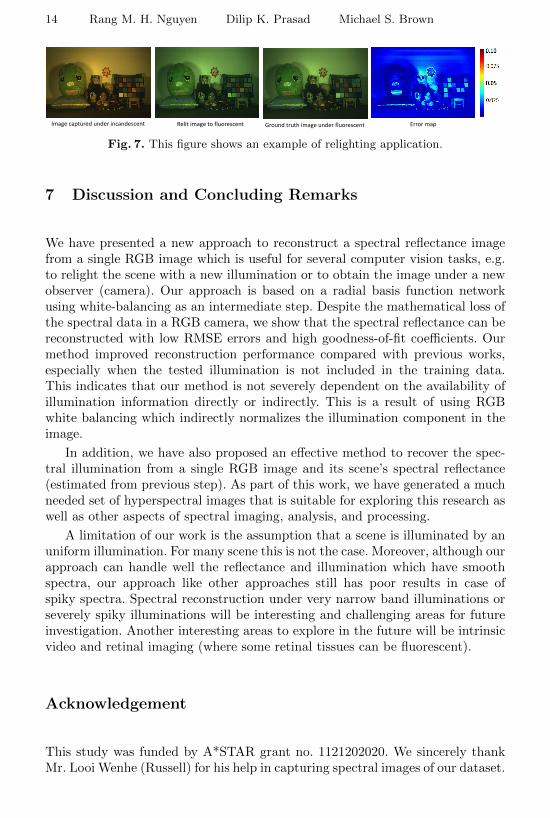
We also test our method in terms of RGB accuracy. The reconstructed spec-tral reflectance and illumination are projected back onto the same camera sen-sitivity functions to measure the error in RGB space. Table 5 shows the meanvalues of similarity measurements sR and error measurement εR. Our result isalmost the same with the input RGB with only small errors. In addition, Fig-ure 7 show an example of relighting application for our work. Our relit image isclose to the ground truth image captured under the target illumination.

12 Rang M. H. Nguyen Dilip K. Prasad Michael S. Brown
Table 2. This table shows the reflectance reconstruction results of three commercialcameras: Canon 1D Mark III, Canon 600D, and Nikon D40. he mean values of similaritymeasurements sR in Eq. 15 and error measurement εR in Eq. 16 are shown. In thisexperiment, we test all five methods under illuminations present in the training data.
Canon 1D Mark III Canon 600D Nikon D40
sR εR sR εR sR εRPCA 0.8422 0.0957 0.8340 0.0966 0.8438 0.0947Agahian [2] 0.8743 0.1139 0.8757 0.1079 0.8837 0.1008Abed [1] 0.9715 0.0350 0.9707 0.0356 0.9723 0.0347Ours w/o WB 0.9736 0.0315 0.9742 0.0313 0.9743 0.0320Ours 0.9802 0.0311 0.9811 0.0312 0.9805 0.0313
Table 3. This table shows the reflectance reconstruction results of three commercialcameras: Canon 1D Mark III, Canon 600D, and Nikon D40. he mean values of simi-larity measurements sR in Eq. 15 and error measurement εR in Eq. 16 are shown. Inthis experiment, we test all five methods under illuminations not present in the train-ing data. These spectral illuminations are downloaded from the dataset in Barnard’swebsite.
Canon 1D Mark III Canon 600D Nikon D40
sR εR sR εR sR εRPCA 0.8528 0.0873 0.8438 0.0896 0.8568 0.0856Agahian [2] 0.8971 0.0791 0.8941 0.0793 0.8973 0.0773Abed [1] 0.9293 0.0796 0.9107 0.0867 0.9281 0.0815Ours w/o WB 0.9529 0.0722 0.9393 0.0727 0.9434 0.0702Ours 0.9805 0.0315 0.9812 0.0315 0.9810 0.0314
Table 4. This table shows the reconstruction result (in RMSE) of colorchecker’s re-flectance using Canon 1D Mark III under indoor illumination using metal halide lampof 4300K color temperature.
(a) (b) (c) (d) (e) (f) (g) (h)
PCA 0.0464 0.0517 0.0360 0.0321 0.0597 0.0560 0.0366 0.0668Agahian [2] 0.0470 0.0286 0.0328 0.0252 0.0511 0.0457 0.0350 0.0832Abed [1] 0.0465 0.0845 0.0382 0.0225 0.0908 0.0507 0.0603 0.0721Ours w/o WB 0.0367 0.0516 0.0553 0.0330 0.0474 0.0375 0.0723 0.0292Ours 0.0228 0.0260 0.0210 0.0117 0.0229 0.0226 0.0271 0.0416
Table 5. This table shows colorimetric accuracy of our spectral reconstruction forthree commercial cameras: Canon 1D Mark III, Canon 600D, and Nikon D40. Themean values of similarity measurements sR in Eq. 15 and error measurement εR inEq. 16 are shown.
Canon 1D Mark III Canon 600D Nikon D40
sR εR sR εR sR εR0.9967 0.0146 0.9969 0.0139 0.9929 0.0169

Training-Based Spectral Reconstruction from a Single RGB Image 13
400 500 600 7000
0.1
0.2
0.3
0.4
0.5
Wavelength (nm)
Spectr
al re
flecta
nce
Groudtruth
PCA
Agahian
Abed
Ours w/o WB
Ours
400 500 600 7000
0.1
0.2
0.3
0.4
Wavelength (nm)
Sp
ectr
al re
fle
cta
nce
Groudtruth
PCA
Agahian
Abed
Ours w/o WB
Ours
400 500 600 7000
0.1
0.2
0.3
0.4
Wavelength (nm)
Sp
ectr
al re
fle
cta
nce
Groudtruth
PCA
Agahian
Abed
Ours w/o WB
Ours
400 500 600 7000
0.1
0.2
0.3
0.4
Wavelength (nm)
Sp
ectr
al re
fle
cta
nce
Groudtruth
PCA
Agahian
Abed
Ours w/o WB
Ours
400 500 600 7000
0.05
0.1
0.15
0.2
Wavelength (nm)
Sp
ectr
al re
fle
cta
nce
Groudtruth
PCA
Agahian
Abed
Ours w/o WB
Ours
400 500 600 7000
0.1
0.2
0.3
0.4
Wavelength (nm)
Sp
ectr
al re
fle
cta
nce
Groudtruth
PCA
Agahian
Abed
Ours w/o WB
Ours
400 500 600 7000
0.1
0.2
0.3
0.4
Wavelength (nm)
Sp
ectr
al re
fle
cta
nce
Groudtruth
PCA
Agahian
Abed
Ours w/o WB
Ours
400 500 600 7000
0.1
0.2
0.3
0.4
Wavelength (nm)
Sp
ectr
al re
fle
cta
nce
Groudtruth
PCA
Agahian
Abed
Ours w/o WB
Ours
(a) (b) (c)
(d) (e)
(f) (g) (h)
Fig. 5. This figure shows the reconstruction result of colorchecker’s reflectance usingCanon 1D Mark III under indoor illumination using metal halide lamp of 4300K colortemperature. The quantitative errors of all patches are shown in Table 4.
400 500 600 7000
0.2
0.4
0.6
0.8
1
Wavelength (nm)
Sp
ectr
al ill
um
ina
tio
n
Groudtruth
Estimated
400 500 600 7000
0.2
0.4
0.6
0.8
1
Wavelength (nm)
Sp
ectr
al ill
um
ina
tio
n
Groudtruth
Estimated
400 500 600 7000
0.2
0.4
0.6
0.8
1
Wavelength (nm)
Sp
ectr
al ill
um
ina
tio
n
Groudtruth
Estimated
400 500 600 7000.4
0.6
0.8
1
Wavelength (nm)
Sp
ectr
al ill
um
ina
tio
n
Groudtruth
Estimated
400 500 600 7000
0.2
0.4
0.6
0.8
1
Wavelength (nm)
Sp
ectr
al ill
um
ina
tio
n
Groudtruth
Estimated
400 500 600 7000.2
0.4
0.6
0.8
1
Wavelength (nm)
Sp
ectr
al ill
um
ina
tio
n
Groudtruth
Estimated
Fig. 6. This figure shows the reconstruction result for six illuminations. Three topilluminations are metal halide lamp 2500K, metal halide lamp 4300K and sunlightfrom our dataset. Three bottom illuminations are Sylvania 50MR16Q, Solux 3500Kand Solux 4700K from Barnard’s website.
14 Rang M. H. Nguyen Dilip K. Prasad Michael S. Brown
Image captured under incandescent Relit image to fluorescent Ground truth image under fluorescent Error map
Fig. 7. This figure shows an example of relighting application.
7 Discussion and Concluding Remarks
We have presented a new approach to reconstruct a spectral reflectance imagefrom a single RGB image which is useful for several computer vision tasks, e.g.to relight the scene with a new illumination or to obtain the image under a newobserver (camera). Our approach is based on a radial basis function networkusing white-balancing as an intermediate step. Despite the mathematical loss ofthe spectral data in a RGB camera, we show that the spectral reflectance can bereconstructed with low RMSE errors and high goodness-of-fit coefficients. Ourmethod improved reconstruction performance compared with previous works,especially when the tested illumination is not included in the training data.This indicates that our method is not severely dependent on the availability ofillumination information directly or indirectly. This is a result of using RGBwhite balancing which indirectly normalizes the illumination component in theimage.
In addition, we have also proposed an effective method to recover the spec-tral illumination from a single RGB image and its scene’s spectral reflectance(estimated from previous step). As part of this work, we have generated a muchneeded set of hyperspectral images that is suitable for exploring this research aswell as other aspects of spectral imaging, analysis, and processing.
A limitation of our work is the assumption that a scene is illuminated by anuniform illumination. For many scene this is not the case. Moreover, although ourapproach can handle well the reflectance and illumination which have smoothspectra, our approach like other approaches still has poor results in case ofspiky spectra. Spectral reconstruction under very narrow band illuminations orseverely spiky illuminations will be interesting and challenging areas for futureinvestigation. Another interesting areas to explore in the future will be intrinsicvideo and retinal imaging (where some retinal tissues can be fluorescent).
Acknowledgement
This study was funded by A*STAR grant no. 1121202020. We sincerely thankMr. Looi Wenhe (Russell) for his help in capturing spectral images of our dataset.

Training-Based Spectral Reconstruction from a Single RGB Image 15
References
1. Abed, F.M., Amirshahi, S.H., Abed, M.R.M.: Reconstruction of reflectance datausing an interpolation technique. J. Opt. Soc. Am. A 26(3), 613–624 (2009)
2. Agahian, F., Amirshahi, S.A., Amirshahi, S.H.: Reconstruction of reflectance spec-tra using weighted principal component analysis. Color Research & Application33(5), 360–371 (2008)
3. Ayala, F., Echavarri, J.F., Renet, P., Negueruela, A.I.: Use of three tristimulusvalues from surface reflectance spectra to calculate the principal components forreconstructing these spectra by using only three eigenvectors. J. Opt. Soc. Am. A23(8), 2020–2026 (2006)
4. Barakzehi, M., Amirshahi, S.H., Peyvandi, S., Afjeh, M.G.: Reconstruction of totalradiance spectra of fluorescent samples by means of nonlinear principal componentanalysis. J. Opt. Soc. Am. A 30(9), 1862–1870 (2013)
5. Brainard, D.H., Freeman, W.T.: Bayesian color constancy. J. Opt. Soc. Am. A14(7), 1393–1411 (1997)
6. Chen, S., Cowan, C.F., Grant, P.M.: Orthogonal least squares learning algorithmfor radial basis function networks. IEEE Transactions on Neural Networks 2(2),302–309 (1991)
7. Cheng, D., Prasad, D.K., Brown, M.S.: Illuminant estimation for color constancy:why spatial-domain methods work and the role of the color distribution. J. Opt.Soc. Am. A 31(5), 1049–1058 (2014)
8. Cohen, J.: Dependency of the spectral reflectance curves of the munsell color chips.Psychonomic Science (1964)
9. Connah, D., Westland, S., Thomson, M.G.: Recovering spectral information usingdigital camera systems. Coloration Technology 117(6), 309–312 (2001)
10. Eslahi, N., Amirshahi, S.H., Agahian, F.: Recovery of spectral data using weightedcanonical correlation regression. Optical Review 16(3), 296–303 (2009)
11. Fairman, H.S., Brill, M.H.: The principal components of reflectances. Color Re-search & Application 29(2), 104–110 (2004)
12. Finlayson, G.D., Trezzi, E.: Shades of gray and colour constancy. In: Color andImaging Conference. vol. 2004, pp. 37–41 (2004)
13. Gijsenij, A., Gevers, T., van de Weijer, J.: Computational color constancy: Surveyand experiments. IEEE Transactions on Image Processing 20(9), 2475–2489 (2011)
14. Hall, R., Hall, R.: Illumination and color in computer generated imagery, vol. 7.Springer-Verlag, New York (1989)
15. Jaaskelainen, T., Parkkinen, J., Toyooka, S.: Vector-subspace model for color rep-resentation. J. Opt. Soc. Am. A 7(4), 725–730 (1990)
16. Jiang, J., Liu, D., Gu, J., Susstrunk, S.: What is the space of spectral sensitiv-ity functions for digital color cameras? In: IEEE Workshop on Applications ofComputer Vision. pp. 168–179 (2013)
17. Laamanen, H., Jetsu, T., Jaaskelainen, T., Parkkinen, J.: Weighted compressionof spectral color information. J. Opt. Soc. Am. A 25(6), 1383–1388 (2008)
18. Lenz, R., Meer, P., Hauta-Kasari, M.: Spectral-based illumination estimation andcolor correction. Color Research & Application 24, 98–111 (1999)
19. MacQueen, J.: Some methods for classification and analysis of multivariate obser-vations. In: Proceedings of the fifth Berkeley symposium on mathematical statisticsand probability. vol. 1, pp. 281–297. California, USA (1967)
20. Maloney, L.T.: Evaluation of linear models of surface spectral reflectance withsmall numbers of parameters. J. Opt. Soc. Am. A 3(10), 1673–1683 (1986)

16 Rang M. H. Nguyen Dilip K. Prasad Michael S. Brown
21. Maloney, L.T., Wandell, B.A.: Color constancy: a method for recovering surfacespectral reflectance. J. Opt. Soc. Am. A 3(1), 29–33 (1986)
22. Marimont, D.H., Wandell, B.A.: Linear models of surface and illuminant spectra.J. Opt. Soc. Am. A 9(11), 1905–1913 (1992)
23. Park, J.I., Lee, M.H., Grossberg, M.D., Nayar, S.K.: Multispectral imaging usingmultiplexed illumination. In: International Conference on Computer Vision (2007)
24. Parkkinen, J.P., Hallikainen, J., Jaaskelainen, T.: Characteristic spectra of munsellcolors. J. Opt. Soc. Am. A 6(2), 318–322 (1989)
25. Peyvandi, S., Amirshahi, S.H.: Generalized spectral decomposition: a theory andpractice to spectral reconstruction. J. Opt. Soc. Am. A 28(8), 1545–1553 (2011)
26. Peyvandi, S., Amirshahi, S.H., Hernandez-Andres, J., Nieves, J.L., Romero, J.:Spectral recovery of outdoor illumination by an extension of the bayesian inverseapproach to the gaussian mixture model. J. Opt. Soc. Am. A 29(10), 2181–2189(2012)
27. Prasad, D.K., Nguyen, R., Brown, M.S.: Quick approximation of camera’s spectralresponse from casual lighting. In: IEEE International Conference on ComputerVision Workshops. pp. 844–851 (2013)
28. Romero, J., Garcia-Beltran, A., Hernandez-Andres, J.: Linear bases for represen-tation of natural and artificial illuminants. J. Opt. Soc. Am. A 14(5), 1007–1014(1997)
29. Sharma, G., Wang, S.: Spectrum recovery from colorimetric data for color repro-ductions. In: Proc. SPIE 4663, Color Imaging: Device-Independent Color, ColorHardcopy, and Applications VII. pp. 8–14 (2002)
30. Zhang, X., Xu, H.: Reconstructing spectral reflectance by dividing spectral spaceand extending the principal components in principal component analysis. J. Opt.Soc. Am. A 25(2), 371–378 (2008)
31. Zhao, H., Kawakami, R., Tan, R.T., Ikeuchi, K.: Estimating basis functions forspectral sensitivity of digital cameras. In: Meeting on Image Recognition and Un-derstanding. No. 1 (2009)
32. Zhao, Y., Berns, R.S.: Image-based spectral reflectance reconstruction using thematrix r method. Color Research & Application 32(5), 343–351 (2007)