traffic quality report 2009
DESCRIPTION
Anchor Intelligence reports on attempted click fraud rates for 2009: 1 out of every 4 ad clicks was an attempt at fraud in Q4TRANSCRIPT
ANCHOR INTELLIGENCETRAFFIC QUALITY REPORT: 2009 YEAR IN REVIEW
January 19, 2010
HIGHLIGHTS
In 2009, the attempted click fraud rate hovered between a low of 18.6% in Q3 and a high
of 25.7% in Q4; in other words, 1 out of every 4 clicks in Q4 was an attempt at click fraud
The increase in attempted click fraud in Q4 was due to:
• active click fraud rings among new Anchor customers
• a swell of activity by fraudsters taking advantage of holiday ad spend
• a surge in the size and scope of active botnets, the primary tool for automating
click fraud attempts, during the second and third weeks of December
In 2009, the 5 countries in which attempted click fraud rates were highest were Vietnam,
the U.S., Egypt, Canada, and Australia
Anchor Intelligence saved advertisers more than $35M in potentially wasted ad spend by
identifying and removing click fraud from customers’ networks
•
•
•
•
ANCHOR INTELLIGENCE TRAFFIC QUALITY REPORT: 2009 YEAR IN REVIEW
2
INTRODUCTION
The Anchor Intelligence Traffic Quality Report: 2009 Year In Review provides the Anchor Intelligence
network’s perspective on traffic quality as well as trends observed throughout 2009. All traffic
quality statistics are based on data from Anchor’s search engine, ad network, and advertiser
customers. This report breaks down traffic into two major categories: valid and invalid. Invalid
traffic is further broken down into two subcategories: attempted click fraud and innocuous invalid.
The purpose of the Traffic Quality Report is to provide the online advertising industry with
insight into the magnitude of traffic quality issues observed by Anchor Intelligence, while
providing clear and accurate definitions for the statistics provided.
2009 NETWORK RESULTS
2009 was an active year for online advertising related crimes. Malware attacks, fraudulent insertion
orders on behalf of fake ad agencies, and click fraud are just a few examples of the types of
malicious activities that adversely impacted advertisers, ad sellers, and consumers this past year.
The attempted click fraud rate may serve as a barometer by which the online advertising industry
can assess the level of threats to online advertising. (See Appendix A for definitions.)
In 2009, the invalid rate fluctuated quite a bit from quarter to quarter, hovering anywhere between
23.2% (Q3) and 32.1% (Q4). The attempted click fraud rate also varied with a low of 18.6% in Q3
and a high of 25.7% in Q4. Attempted click fraud declined in Q3, which can be attributed to three
major factors: increased vigilance and enforcement of traffic quality standards by current Anchor

3
ANCHOR INTELLIGENCE TRAFFIC QUALITY REPORT: 2009 YEAR IN REVIEW
Figure 2. Graph of attempted click fraud rates for the Anchor Intelligence network in each quarter of 2009.
Attempted click fraud increased overall during 2009 for a number of reasons. First, malware
volumes grew over the course of the year; according to the Shadowserver Foundation, the
number of unique binaries swelled by more than 150% during 2009. The increased availability of
user-friendly kits, such as Zeus, has enabled fraudsters to create malware with unprecedented
ease. Malware — malicious code, which is downloaded onto a user’s computer without
conforming to standard authentication procedures — is commonly used to create zombie
machines, which comprise botnets. These machines are at the beck and call of a botnet master
and can be used to engage in any number of criminal activities, including click fraud. According to
Shadowserver, the number of active command-and-control servers, which are used to instruct
botnet armies, increased by roughly 65% over the course of the year. This growth in malware
and botnets helped drive a surge in velocity-based click fraud and click fraud rings as witnessed
across the Anchor network last year.
ATTEMPTED CLICK FRAUD RATES IN 2009
30%
25%
20%
15%
10%
5%
0%
Q1 Q2 Q3 Q4
RA
TE
21.7%22.9%
18.6%
25.7%
customers; the identification and elimination of several organized click fraud rings by Anchor
Intelligence; and slightly lower attempted click fraud rates among new Anchor network custom-
ers. Meanwhile, attempted click fraud starkly increased in Q4 as a result of holiday fraud and
the addition of new customers to the Anchor network with much higher-than-average
attempted click fraud rates (additional details in “Q4 Results” below). As a result, at least 1 out
of every 4 ad clicks in the final quarter of 2009 was considered to be invalid and therefore, not
billable to advertisers.
Traffic Quality Rates
Valid
Invalid
Attempted Click Fraud
Innocuous Invalid
Total
Q3 Q4Q1 Q2
67.9%
32.1%
25.7%
6.4%
72.1%
27.9%
21.7%
6.2%
72.9%
27.1%
22.9%
4.2%
100.0%
76.8%
23.2%
18.6%
4.6%
100.0% 100.0% 100.0%
Figure 1. Table of traff ic quality rates for customers in each quarter of 2009.
4
ANCHOR INTELLIGENCE TRAFFIC QUALITY REPORT: 2009 YEAR IN REVIEW
Top 10 Countries by Volume
AttemptedClick Fraud
Country Total InvalidValidInvalid
United States
Canada
United Kingdom
Germany
India
Australia
China
Vietnam
Egypt
France
72.1%
73.6%
81.8%
84.2%
79.3%
73.9%
80.7%
53.9%
73.9%
87.5%
25.8%
24.8%
15.6%
14.2%
18.4%
24.4%
14.5%
44.1%
24.9%
10.0%
2.1%
1.6%
2.6%
1.6%
2.3%
1.7%
4.9%
1.9%
1.2%
2.5%
27.9%
26.4%
18.2%
15.8%
20.7%
26.1%
19.3%
46.1%
26.1%
12.5%
*
* Highest indexed value. Not drawn to scale.
InnocuousInvalid
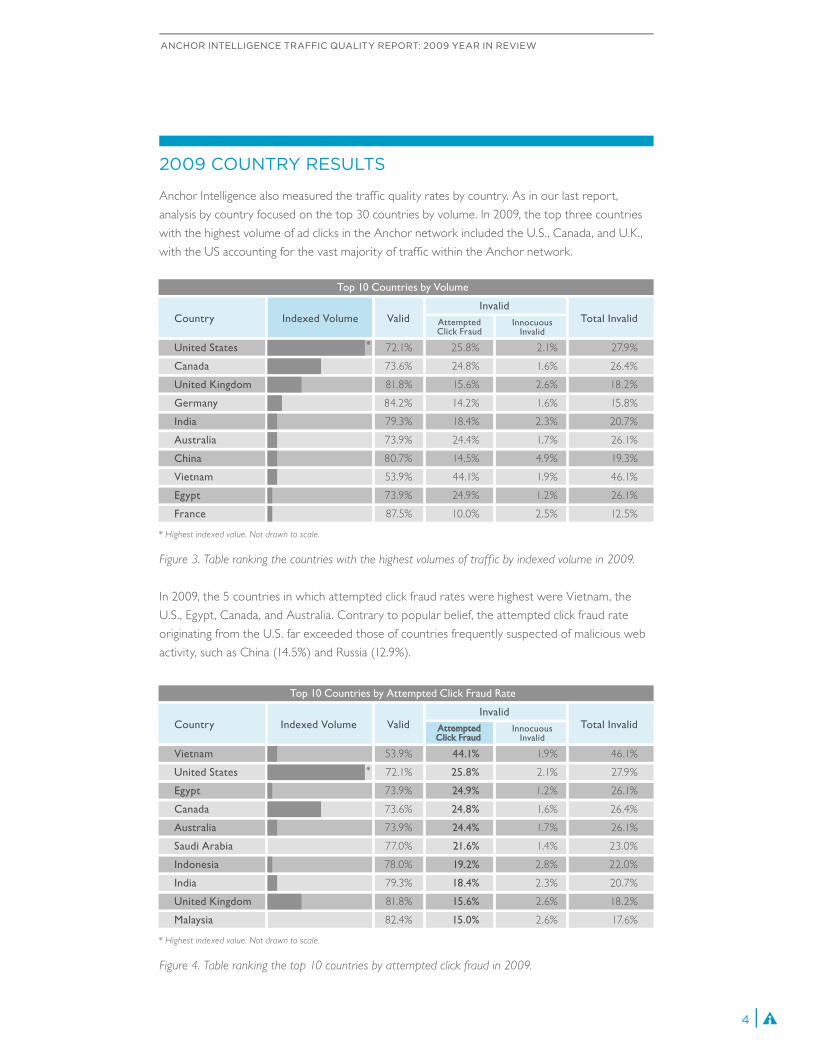
Figure 3. Table ranking the countries with the highest volumes of traff ic by indexed volume in 2009.
In 2009, the 5 countries in which attempted click fraud rates were highest were Vietnam, the
U.S., Egypt, Canada, and Australia. Contrary to popular belief, the attempted click fraud rate
originating from the U.S. far exceeded those of countries frequently suspected of malicious web
activity, such as China (14.5%) and Russia (12.9%).
Top 10 Countries by Attempted Click Fraud Rate
Country Indexed Volume Total InvalidValidInvalid
Vietnam
United States
Egypt
Canada
Australia
Saudi Arabia
Indonesia
India
United Kingdom
Malaysia
53.9%
72.1%
73.9%
73.6%
73.9%
77.0%
78.0%
79.3%
81.8%
82.4%
44.1%
25.8%
24.9%
24.8%
24.4%
21.6%
19.2%
18.4%
15.6%
15.0%
1.9%
2.1%
1.2%
1.6%
1.7%
1.4%
2.8%
2.3%
2.6%
2.6%
46.1%
27.9%
26.1%
26.4%
26.1%
23.0%
22.0%
20.7%
18.2%
17.6%
*
* Highest indexed value. Not drawn to scale.
InnocuousInvalid
Figure 4. Table ranking the top 10 countries by attempted click fraud in 2009.
2009 COUNTRY RESULTS
Anchor Intelligence also measured the traffic quality rates by country. As in our last report,
analysis by country focused on the top 30 countries by volume. In 2009, the top three countries
with the highest volume of ad clicks in the Anchor network included the U.S., Canada, and U.K.,
with the US accounting for the vast majority of traffic within the Anchor network.
5
ANCHOR INTELLIGENCE TRAFFIC QUALITY REPORT: 2009 YEAR IN REVIEW
Q4 RESULTS
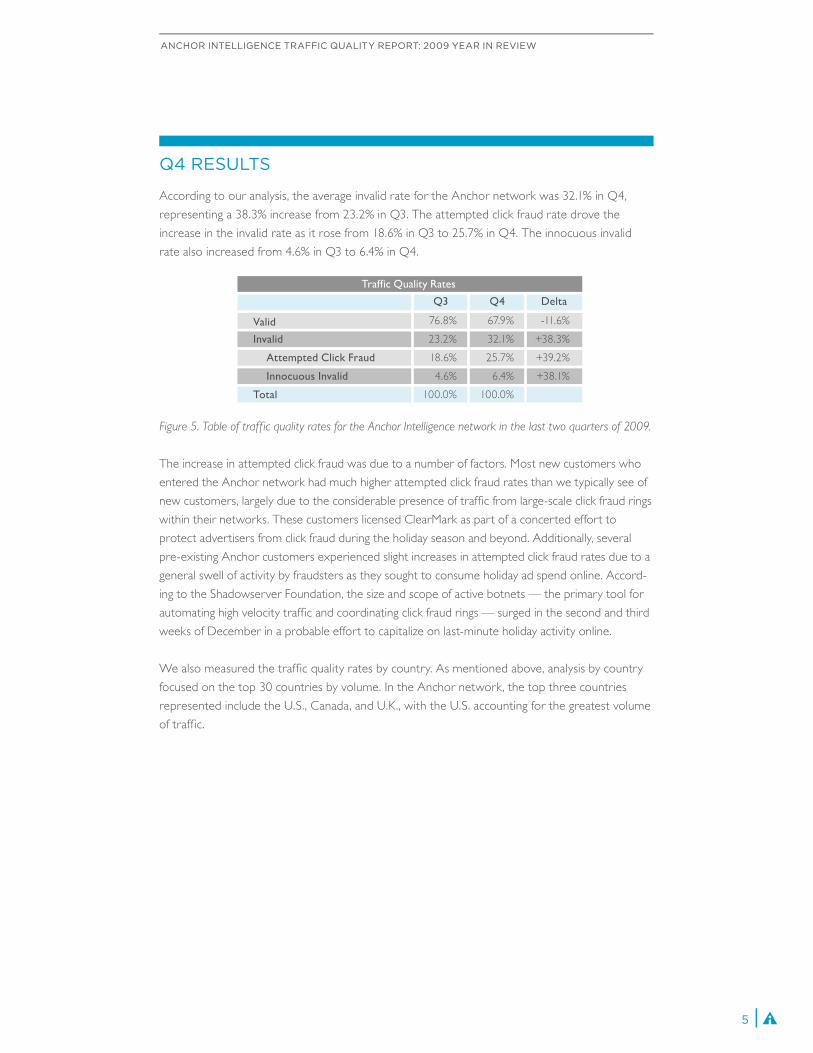
According to our analysis, the average invalid rate for the Anchor network was 32.1% in Q4,
representing a 38.3% increase from 23.2% in Q3. The attempted click fraud rate drove the
increase in the invalid rate as it rose from 18.6% in Q3 to 25.7% in Q4. The innocuous invalid
rate also increased from 4.6% in Q3 to 6.4% in Q4.
Figure 5. Table of traffic quality rates for the Anchor Intelligence network in the last two quarters of 2009.
The increase in attempted click fraud was due to a number of factors. Most new customers who
entered the Anchor network had much higher attempted click fraud rates than we typically see of
new customers, largely due to the considerable presence of traffic from large-scale click fraud rings
within their networks. These customers licensed ClearMark as part of a concerted effort to
protect advertisers from click fraud during the holiday season and beyond. Additionally, several
pre-existing Anchor customers experienced slight increases in attempted click fraud rates due to a
general swell of activity by fraudsters as they sought to consume holiday ad spend online. Accord-
ing to the Shadowserver Foundation, the size and scope of active botnets — the primary tool for
automating high velocity traffic and coordinating click fraud rings — surged in the second and third
weeks of December in a probable effort to capitalize on last-minute holiday activity online.
We also measured the traffic quality rates by country. As mentioned above, analysis by country
focused on the top 30 countries by volume. In the Anchor network, the top three countries
represented include the U.S., Canada, and U.K., with the U.S. accounting for the greatest volume
of traffic.
Traffic Quality Rates
Valid
Invalid
Attempted Click Fraud
Innocuous Invalid
Total
DeltaQ3 Q4
-11.6%
+38.3%
+39.2%
+38.1%
76.8%
23.2%
18.6%
4.6%
100.0%
67.9%
32.1%
25.7%
6.4%
100.0%
Top 10 Countries by Volume
AttemptedClick Fraud
Country Total InvalidValidInvalid
United States
Canada
United Kingdom
Australia
India
Germany
France
Egypt
Spain
China
67.3%
73.7%
78.2%
59.5%
76.5%
84.3%
87.2%
60.2%
88.7%
81.7%
29.8%
23.8%
18.0%
38.4%
21.8%
12.3%
7.4%
38.7%
8.8%
13.7%
2.9%
2.5%
3.8%
2.1%
1.8%
3.4%
5.4%
1.1%
2.5%
4.6%
32.7%
26.3%
21.8%
40.5%
23.5%
15.7%
12.8%
39.8%
11.3%
18.3%
*
* Highest indexed value. Not drawn to scale.
InnocuousInvalid
6
ANCHOR INTELLIGENCE TRAFFIC QUALITY REPORT: 2009 YEAR IN REVIEW
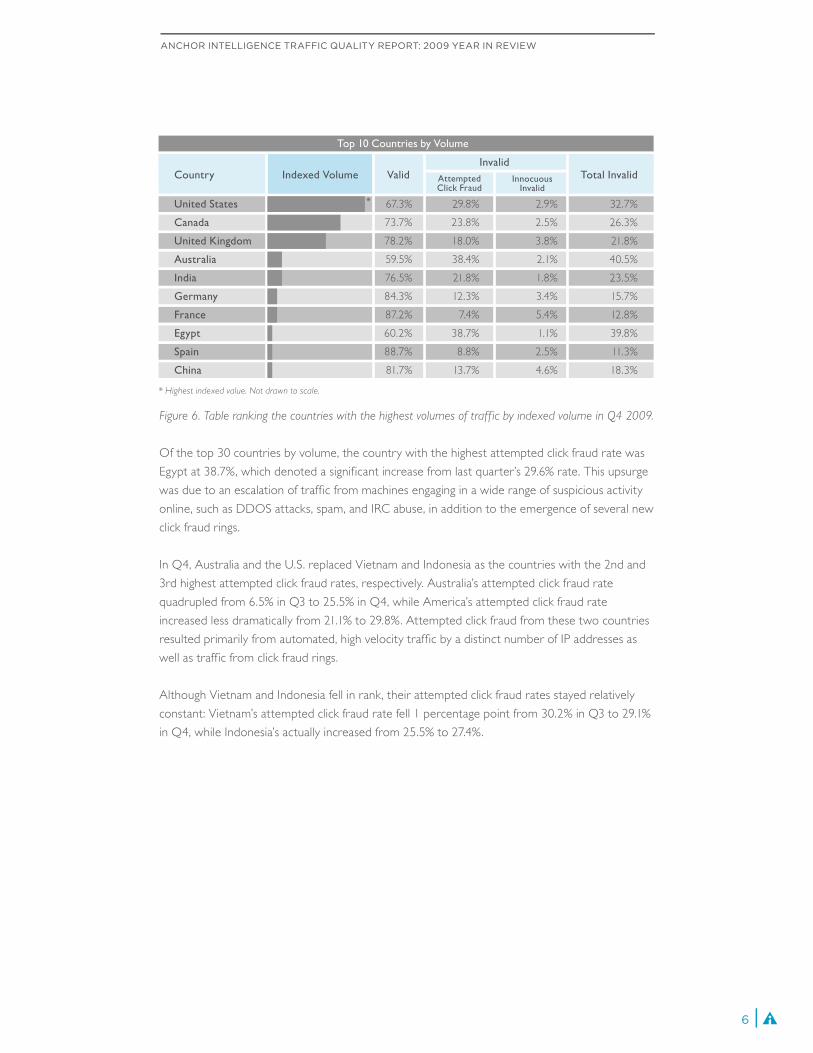
Figure 6. Table ranking the countries with the highest volumes of traff ic by indexed volume in Q4 2009.
Of the top 30 countries by volume, the country with the highest attempted click fraud rate was
Egypt at 38.7%, which denoted a significant increase from last quarter’s 29.6% rate. This upsurge
was due to an escalation of traffic from machines engaging in a wide range of suspicious activity
online, such as DDOS attacks, spam, and IRC abuse, in addition to the emergence of several new
click fraud rings.
In Q4, Australia and the U.S. replaced Vietnam and Indonesia as the countries with the 2nd and
3rd highest attempted click fraud rates, respectively. Australia’s attempted click fraud rate
quadrupled from 6.5% in Q3 to 25.5% in Q4, while America’s attempted click fraud rate
increased less dramatically from 21.1% to 29.8%. Attempted click fraud from these two countries
resulted primarily from automated, high velocity traffic by a distinct number of IP addresses as
well as traffic from click fraud rings.
Although Vietnam and Indonesia fell in rank, their attempted click fraud rates stayed relatively
constant: Vietnam’s attempted click fraud rate fell 1 percentage point from 30.2% in Q3 to 29.1%
in Q4, while Indonesia’s actually increased from 25.5% to 27.4%.
7
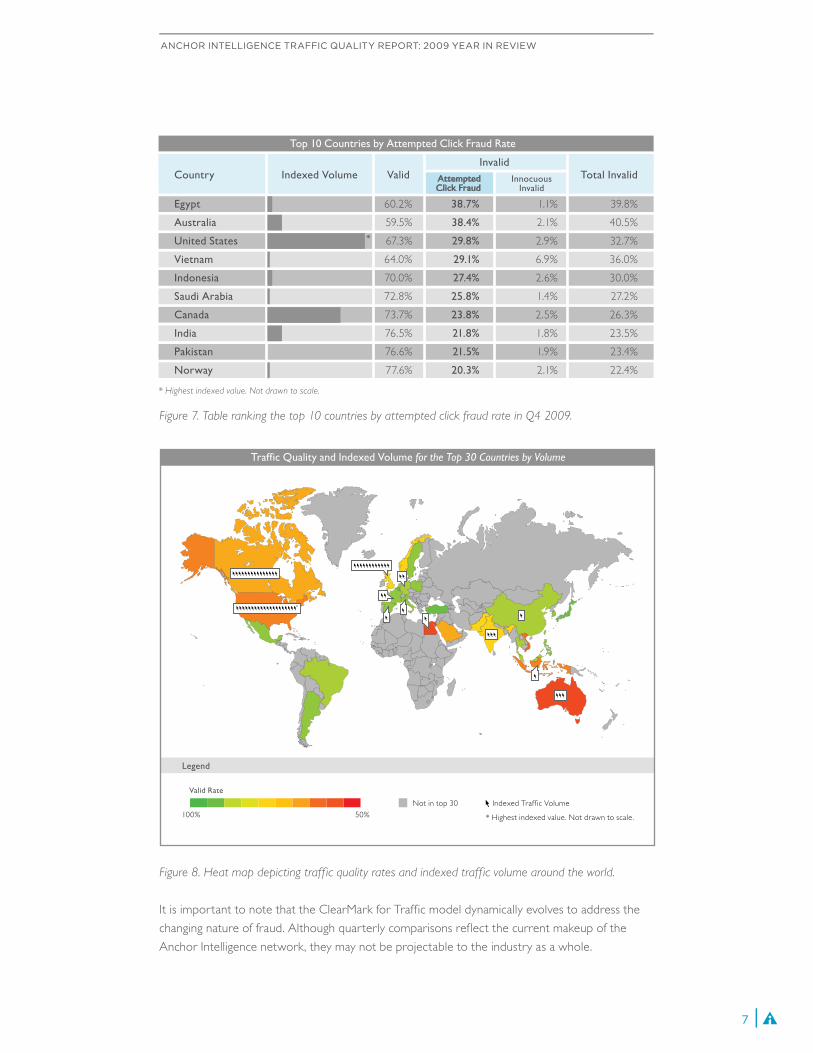
Figure 8. Heat map depicting traff ic quality rates and indexed traff ic volume around the world.
It is important to note that the ClearMark for Traffic model dynamically evolves to address the
changing nature of fraud. Although quarterly comparisons reflect the current makeup of the
Anchor Intelligence network, they may not be projectable to the industry as a whole.
Traffic Quality and Indexed Volume for the Top 30 Countries by Volume
Legend
*
100% 50%
Not in top 30
Valid Rate
* Highest indexed value. Not drawn to scale.
Indexed Traff ic Volume
Top 10 Countries by Attempted Click Fraud Rate
Country Indexed Volume Total InvalidValidInvalid
Egypt
Australia
United States
Vietnam
Indonesia
Saudi Arabia
Canada
India
Pakistan
Norway
60.2%
59.5%
67.3%
64.0%
70.0%
72.8%
73.7%
76.5%
76.6%
77.6%
38.7%
38.4%
29.8%
29.1%
27.4%
25.8%
23.8%
21.8%
21.5%
20.3%
1.1%
2.1%
2.9%
6.9%
2.6%
1.4%
2.5%
1.8%
1.9%
2.1%
39.8%
40.5%
32.7%
36.0%
30.0%
27.2%
26.3%
23.5%
23.4%
22.4%
*
* Highest indexed value. Not drawn to scale.
InnocuousInvalid
ANCHOR INTELLIGENCE TRAFFIC QUALITY REPORT: 2009 YEAR IN REVIEW
Figure 7. Table ranking the top 10 countries by attempted click fraud rate in Q4 2009.
8
CONCLUSION
During 2009, click fraud reemerged as a tremendous concern for the online advertising
industry: Microsoft f iled multiple lawsuits against click fraud perpetrators and malvertisers;
Facebook became the subject of multiple click fraud lawsuits; and Anchor Intelligence
announced that it uncovered a massive click fraud ring operating primarily out of China.
Anchor Intelligence observed a general increase in the average attempted click fraud rate
during 2009 with a peak of 25.7% in Q4. Tried-and-true perpetration mechanisms grew in
popularity. Click fraud rings continued to exploit vulnerable networks by leveraging a growing
army of botnets. Botnets have become the fundamental means by which click fraudsters
automate invalid traff ic, and their numbers show no signs of weakening. Furthermore, fraud-
sters sought to capitalize on the holiday ad spend by ramping up their activities. Finally, major
ad markets such as the U.S. and Canada continued to generate high rates of attempted click
fraud, even though the majority of concern over online security has historically centered on
Asia and Eastern Europe.
Over the course of 2009, Anchor saved advertisers approximately $35 million in potentially
wasted ad spend by identifying and removing click fraud from customers’ networks. Moreover,
by eliminating payouts to fraudulent perpetrators, Anchor reduced click fraud attempts for
customers as perpetrators sought more vulnerable networks to exploit.
ANCHOR INTELLIGENCE TRAFFIC QUALITY REPORT: 2009 YEAR IN REVIEW
9
2010 FORECAST
Click fraud attempts will increase in 2010. Botnets will continue to grow in size and scope
via social engineering attack vectors. As cybercriminals exploit the growth and adoption of
social networks such as Facebook and tools such as Twitter, the rate of social engineering
infections will increase. The proliferation of malware through social networks will almost
certainly lead to more zombies and botnets. As a result, attempted click fraud volumes will
likely increase.
The rate of adaptation for click fraud perpetrators will increase as never seen before.
Botnet infrastructure will become more flexible and resilient. By shifting from a centralized
hosting model to rely instead upon peer-to-peer technologies, distributed command and
control, and proxy redirection, botnets will become increasingly diff icult to locate. Click
fraud perpetrators are likely to follow suit, making detection even more challenging in the
coming year.
The increasing use of shortened URLs such as bit.ly and tinyURL will create a hotbed for
malware distribution. Because shortened URLs mask the actual destination of a link,
fraudsters are able to disguise links users might otherwise avoid. As such, fraudsters are
likely to use more of these URLs to distribute malware and create more zombies, contribut-
ing to the increase in attempted click fraud in 2010.
Click fraud will be increasingly perpetrated by Macs and mobile phones. The notable
popularity of iPhones has already attracted the notice of malware authors and fraudsters.
As the market share of these devices continues to grow in 2010, more fraudsters will likely
turn them into zombies used to perpetrate click fraud.
Fraudulent advertisements will become a popular infection vector as advertisers are given
more control to create dynamic ad content via APIs. As a result, ad agencies will need to
intensify security measures to ensure that fraudulent orders are not placed on their behalf.
Search engines and ad networks will increasingly turn to third parties, like Anchor
Intelligence, for traffic certification. Ad sellers will become increasingly vigilant in their
efforts to ensure that advertisers are not being victimized and turn to specialists to better
manage their traff ic quality and deliver more value to advertisers.
ANCHOR INTELLIGENCE TRAFFIC QUALITY REPORT: 2009 YEAR IN REVIEW
If the past year’s fraudulent activity in online advertising is indicative of fraudsters’ deviousness
and industriousness, click fraud attempts should prove even more pervasive in 2010. Anchor
Intelligence foresees the following traff ic quality and security trends in online advertising in the
year ahead:
1.
2.
3.
4.
5.
6.
10
APPENDIX A: TERMINOLOGY
ClearMark scores the quality of each ad traffic event on a scale of 0.00 to 1.00, where 0.00 is the
lowest quality and 1.00 is the highest quality traffic. Based on a fixed threshold that differentiates
between valid and invalid traffic, ClearMark labels any ad traffic event that receives a score above
the threshold as valid and any event that receives a score at or below that threshold as invalid.
Valid traffic is defined as traffic that is generated by users with a legitimate interest in the ad or
link; conversely invalid traffic is defined as traffic generated by sources with no valid interest in
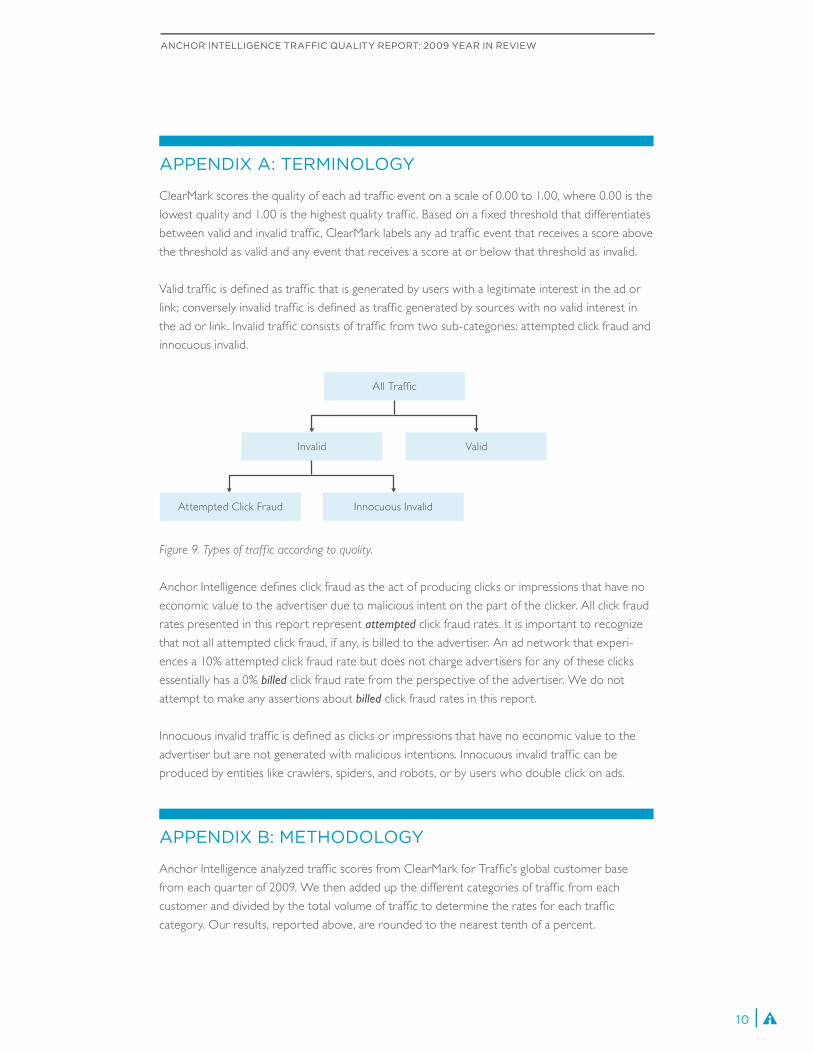
the ad or link. Invalid traffic consists of traffic from two sub-categories: attempted click fraud and
innocuous invalid.
Figure 9. Types of traff ic according to quality.
Anchor Intelligence defines click fraud as the act of producing clicks or impressions that have no
economic value to the advertiser due to malicious intent on the part of the clicker. All click fraud
rates presented in this report represent attempted click fraud rates. It is important to recognize
that not all attempted click fraud, if any, is billed to the advertiser. An ad network that experi-
ences a 10% attempted click fraud rate but does not charge advertisers for any of these clicks
essentially has a 0% billed click fraud rate from the perspective of the advertiser. We do not
attempt to make any assertions about billed click fraud rates in this report.
Innocuous invalid traffic is defined as clicks or impressions that have no economic value to the
advertiser but are not generated with malicious intentions. Innocuous invalid traffic can be
produced by entities like crawlers, spiders, and robots, or by users who double click on ads.
All Traffic
ValidInvalid
Attempted Click Fraud Innocuous Invalid
ANCHOR INTELLIGENCE TRAFFIC QUALITY REPORT: 2009 YEAR IN REVIEW
APPENDIX B: METHODOLOGY
Anchor Intelligence analyzed traffic scores from ClearMark for Traffic’s global customer base
from each quarter of 2009. We then added up the different categories of traffic from each
customer and divided by the total volume of traffic to determine the rates for each traffic
category. Our results, reported above, are rounded to the nearest tenth of a percent.

© 2010 Anchor Intelligence, Inc. All rights reserved.
www.anchorintelligence.com
480 San Antonio Road, Suite 235
Mountain View, CA 94040
Anchor Intelligence Inc., headquartered in Mountain View, CA, is the traffic quality solutions provider of
choice among ad networks, search engines, and advertisers from across the globe. Using Anchor
Intelligence's ClearMark, the industry's first and only real-time traffic scoring system, industry players
obtain the necessary intelligence to fight click and impression fraud, efficiently manage traffic sources, and
capitalize on high quality clicks while maximizing advertiser ROI.
For more information, email [email protected], or visit www.anchorintelligence.com.