traffic noise and cardiovascular disease
TRANSCRIPT
From THE INSTITUTE OF ENVIRONMENTAL MEDICINE,
Karolinska Institutet, Stockholm, Sweden
TRAFFIC NOISE AND CARDIOVASCULAR
DISEASE
Jenny Selander
Stockholm 2010

2010
Gårdsvägen 4, 169 70 Solna
Printed by
All previously published papers were reproduced with permission from the publisher. Published by Karolinska Institutet. Printed by [name of printer] © Jenny Selander, 2010 ISBN 978-91-7409-888-4
Till:
Martin, Gustav och Lennarth
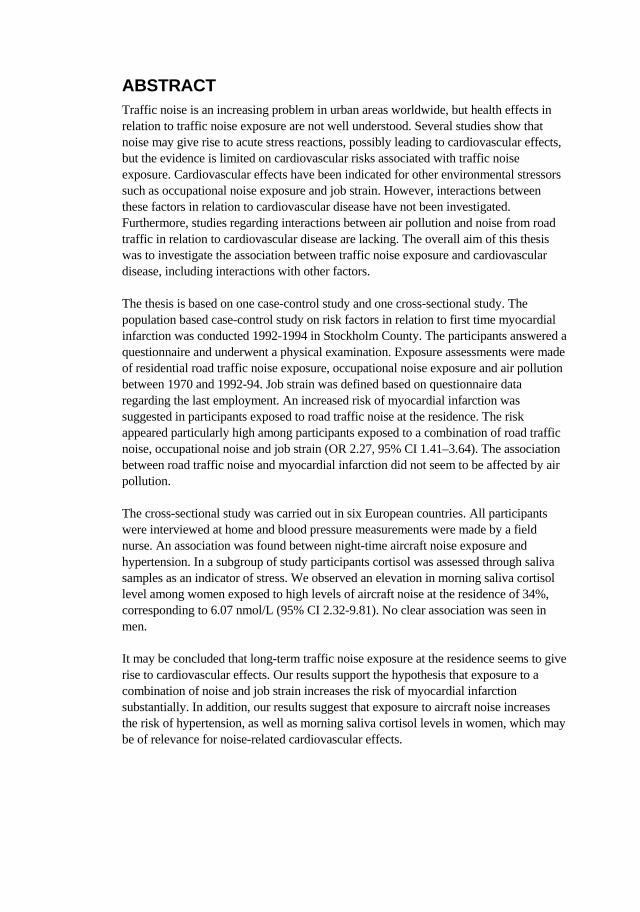
ABSTRACT Traffic noise is an increasing problem in urban areas worldwide, but health effects in relation to traffic noise exposure are not well understood. Several studies show that noise may give rise to acute stress reactions, possibly leading to cardiovascular effects, but the evidence is limited on cardiovascular risks associated with traffic noise exposure. Cardiovascular effects have been indicated for other environmental stressors such as occupational noise exposure and job strain. However, interactions between these factors in relation to cardiovascular disease have not been investigated. Furthermore, studies regarding interactions between air pollution and noise from road traffic in relation to cardiovascular disease are lacking. The overall aim of this thesis was to investigate the association between traffic noise exposure and cardiovascular disease, including interactions with other factors. The thesis is based on one case-control study and one cross-sectional study. The population based case-control study on risk factors in relation to first time myocardial infarction was conducted 1992-1994 in Stockholm County. The participants answered a questionnaire and underwent a physical examination. Exposure assessments were made of residential road traffic noise exposure, occupational noise exposure and air pollution between 1970 and 1992-94. Job strain was defined based on questionnaire data regarding the last employment. An increased risk of myocardial infarction was suggested in participants exposed to road traffic noise at the residence. The risk appeared particularly high among participants exposed to a combination of road traffic noise, occupational noise and job strain (OR 2.27, 95% CI 1.41–3.64). The association between road traffic noise and myocardial infarction did not seem to be affected by air pollution. The cross-sectional study was carried out in six European countries. All participants were interviewed at home and blood pressure measurements were made by a field nurse. An association was found between night-time aircraft noise exposure and hypertension. In a subgroup of study participants cortisol was assessed through saliva samples as an indicator of stress. We observed an elevation in morning saliva cortisol level among women exposed to high levels of aircraft noise at the residence of 34%, corresponding to 6.07 nmol/L (95% CI 2.32-9.81). No clear association was seen in men. It may be concluded that long-term traffic noise exposure at the residence seems to give rise to cardiovascular effects. Our results support the hypothesis that exposure to a combination of noise and job strain increases the risk of myocardial infarction substantially. In addition, our results suggest that exposure to aircraft noise increases the risk of hypertension, as well as morning saliva cortisol levels in women, which may be of relevance for noise-related cardiovascular effects.
LIST OF PUBLICATIONS
I. Selander J, Nilsson ME, Bluhm G, Rosenlund M, Lindqvist M, Nise G †, Pershagen G. Long-term exposure to road traffic noise and myocardial infarction. Epidemiology 2009;20(2): 272-79.
II. Selander J, Bluhm G, Nilsson ME, Hallqvist J, Theorell T, Willix P, Pershagen G. Road traffic noise and myocardial infarction in relation to occupational noise exposure and job strain (manuscript).
III. Järup L, Babisch W, Houthuijs D, Pershagen G, Katsouyanni K, Cadum E, Dudley M-L, Savigny P, Seiffert I, Swart W, Breugelmans O, Bluhm G, Selander J, Haralabidis A, Dimakopoulou K, Sourtzi P, Velonakis M, Vigna-Taglianti F on behalf of the HYENA study team. Hypertension and exposure to noise near airports: the HYENA study. Environmental Health Perspectives 2008;116(3):329-33.
IV. Selander J, Bluhm G, Theorell T, Pershagen G, Babisch W, Seiffert I, Houthuijs D, Breugelmans O, Vigna-Taglianti F, Chiara Antoniotti M, Velonakis E, Davou E, Dudley M-L, Järup L for the HYENA consortium. Exposure to aircraft noise and saliva cortisol in six European countries. Environmental Health Perspectives 2009;117(11): 1713–17.
CONTENTS 1 Introduction.................................................................................................1
1.1 Noise..................................................................................................1 1.2 Cardiovascular disease ......................................................................2 1.3 Noise and cardiovascular disease ......................................................4
2 Aims ............................................................................................................6 3 Material and method ...................................................................................7
3.1 SHEEP – Stockholm heart epidemiology program...........................7 3.1.1 Study participants ..................................................................8 3.1.2 Exposure assessment .............................................................9 3.1.3 Statistical approach..............................................................11
3.2 HYENA – Hypertension and exposure to noise near airports.........12 3.2.1 Study participants ................................................................12 3.2.2 Exposure assessment ...........................................................13 3.2.3 Statistical approach..............................................................15
4 Results .......................................................................................................16 4.1 Road traffic noise, air pollution and myocardial infarction.............16 4.2 Traffic noise and myocardial infarction in relation to occupational noise and job strain....................................................................................................22 4.3 Traffic noise exposure and hypertension.........................................25 4.4 Air traffic noise and morning saliva cortisol ...................................28
5 Discussion .................................................................................................32 5.1 General discussion...........................................................................32 5.2 Methodological considerations........................................................35
5.2.1 Systematic error...................................................................35 5.2.2 Random error.......................................................................37
6 Conclusions...............................................................................................38 7 Future research..........................................................................................39 8 Sammanfattning på svenska......................................................................40 9 Acknowledgements...................................................................................41 10 References.................................................................................................44
LIST OF ABBREVIATIONS WHO World Health Organization MI Myocardial infarction BP Blood pressure HPA-axis Hypothalamic-pituitary-adrenal axis SHEEP Stockholm Heart Epidemiology Program HYENA Hypertension and Exposure to Noise near Airports JEM Job Exposure Matrix ICBEN International Commission on Biological Effects of Noise GIS Geographical Information System INM Integrated Noise Model

1
1 INTRODUCTION Traffic noise exposure is not a new phenomenon, records show that even in medieval times horse carriages and horse back riding were banned during night in some cities in Europe in order to prevent sleep-disturbance [1]. Today traffic noise is much more intense and an increasing problem in urban areas worldwide. The World Health Organization (WHO) estimates that about 40% of the population in Europe is exposed to road traffic noise levels exceeding the guideline value of 55 dB during daytime and more than 30% is exposed to levels exceeding this value during night time. In a recent review of epidemiological and experimental research conducted by the WHO, it was concluded that sufficient evidence exists of health effects related to noise exposure at the residence already at levels of 40 dB of night noise outdoor at the facade [2]. A substantial number of Europeans are exposed to this noise level or more, making traffic noise exposure an important environmental exposure to investigate. Noise pollution is not only a concern for the high income countries, there is also severe exposure of noise pollution in developing countries [1]. Causal associations between traffic noise exposure at the residence and various types of health effects have been established. These effects include interference with speech communication, disturbance of rest and sleep, psycho-physiological effects, mental-health and performance effects, effects on residential behavior and annoyance as well as interference with intended activities. [1] In addition, associations between traffic noise exposure and cardiovascular endpoints have been indicated [3, 4]. This thesis focuses on cardiovascular effects related to residential traffic noise exposure. 1.1 NOISE
Noise is defined as unwanted sound. It is often measured as sound pressure level, and expressed in a quantity that is proportional to the logarithm of the sound pressure. Environmental sounds contain energy in many frequencies. A frequency is measured in Hertz (Hz) and refers to the number of vibrations per second in the air in which the sound is propagating. Our hearing is not equally sensitive to all frequencies and to adjust for this, filters or weighting are used. The A-weighting filter is adapted after our hearing and weighs lower frequencies as less important than mid- and higher frequencies. A-weighted sound pressure level has the unit dBA. Noise could also be expressed using the C-weighting filter (dBC) where the dominance lies on the low frequency sounds, commonly found in ventilation noise [1]. The weakest sound that a human ear can hear is about 0 dBA and 125 dBA is the pain limit. Since the decibel scale is logarithmic, a doubling in traffic flow will only contribute to an increase of approximately 3dB. To be able to assess traffic noise at the residence a daily annual average is calculated. This average can be expressed in a 24-hour average LAeq,24h or a 24 hour average with a penalty for evening (+5dB) and nighttime noise (+10dB) Lden. Lden is a summary measure and can be divided into day, evening and night measures Lday, Levening and Lnight. Traffic noise at the residence is usually calculated by the use of information regarding traffic flow, speed and distance.
2
1.2 CARDIOVASCULAR DISEASE
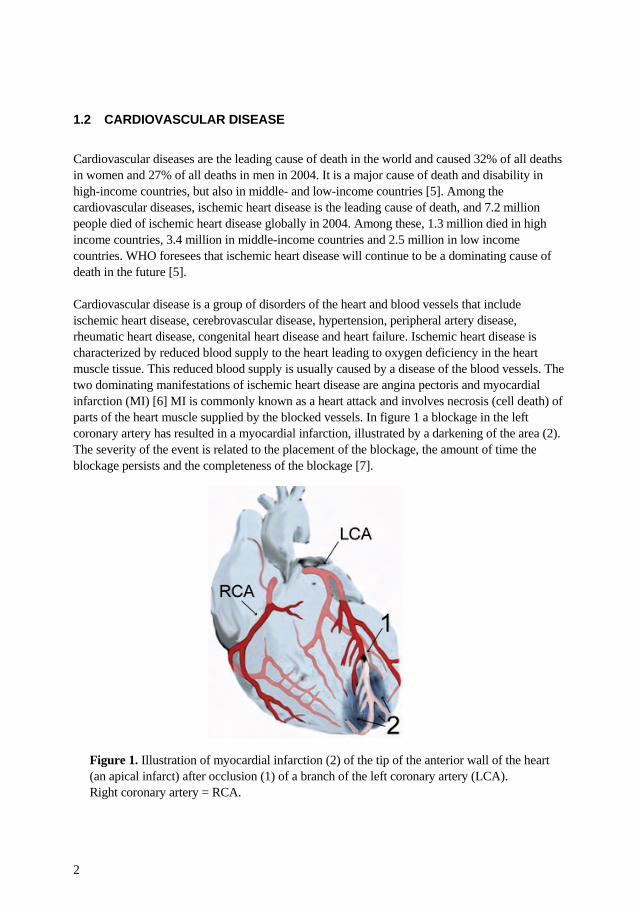
Cardiovascular diseases are the leading cause of death in the world and caused 32% of all deaths in women and 27% of all deaths in men in 2004. It is a major cause of death and disability in high-income countries, but also in middle- and low-income countries [5]. Among the cardiovascular diseases, ischemic heart disease is the leading cause of death, and 7.2 million people died of ischemic heart disease globally in 2004. Among these, 1.3 million died in high income countries, 3.4 million in middle-income countries and 2.5 million in low income countries. WHO foresees that ischemic heart disease will continue to be a dominating cause of death in the future [5]. Cardiovascular disease is a group of disorders of the heart and blood vessels that include ischemic heart disease, cerebrovascular disease, hypertension, peripheral artery disease, rheumatic heart disease, congenital heart disease and heart failure. Ischemic heart disease is characterized by reduced blood supply to the heart leading to oxygen deficiency in the heart muscle tissue. This reduced blood supply is usually caused by a disease of the blood vessels. The two dominating manifestations of ischemic heart disease are angina pectoris and myocardial infarction (MI) [6] MI is commonly known as a heart attack and involves necrosis (cell death) of parts of the heart muscle supplied by the blocked vessels. In figure 1 a blockage in the left coronary artery has resulted in a myocardial infarction, illustrated by a darkening of the area (2). The severity of the event is related to the placement of the blockage, the amount of time the blockage persists and the completeness of the blockage [7].
Figure 1. Illustration of myocardial infarction (2) of the tip of the anterior wall of the heart (an apical infarct) after occlusion (1) of a branch of the left coronary artery (LCA). Right coronary artery = RCA.
3
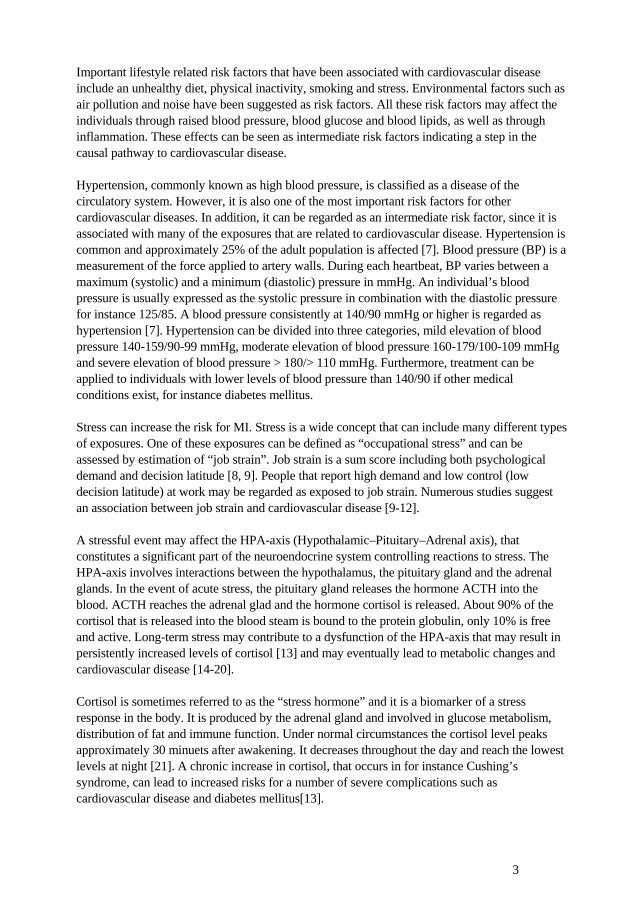
Important lifestyle related risk factors that have been associated with cardiovascular disease include an unhealthy diet, physical inactivity, smoking and stress. Environmental factors such as air pollution and noise have been suggested as risk factors. All these risk factors may affect the individuals through raised blood pressure, blood glucose and blood lipids, as well as through inflammation. These effects can be seen as intermediate risk factors indicating a step in the causal pathway to cardiovascular disease. Hypertension, commonly known as high blood pressure, is classified as a disease of the circulatory system. However, it is also one of the most important risk factors for other cardiovascular diseases. In addition, it can be regarded as an intermediate risk factor, since it is associated with many of the exposures that are related to cardiovascular disease. Hypertension is common and approximately 25% of the adult population is affected [7]. Blood pressure (BP) is a measurement of the force applied to artery walls. During each heartbeat, BP varies between a maximum (systolic) and a minimum (diastolic) pressure in mmHg. An individual’s blood pressure is usually expressed as the systolic pressure in combination with the diastolic pressure for instance 125/85. A blood pressure consistently at 140/90 mmHg or higher is regarded as hypertension [7]. Hypertension can be divided into three categories, mild elevation of blood pressure 140-159/90-99 mmHg, moderate elevation of blood pressure 160-179/100-109 mmHg and severe elevation of blood pressure > 180/> 110 mmHg. Furthermore, treatment can be applied to individuals with lower levels of blood pressure than 140/90 if other medical conditions exist, for instance diabetes mellitus. Stress can increase the risk for MI. Stress is a wide concept that can include many different types of exposures. One of these exposures can be defined as “occupational stress” and can be assessed by estimation of “job strain”. Job strain is a sum score including both psychological demand and decision latitude [8, 9]. People that report high demand and low control (low decision latitude) at work may be regarded as exposed to job strain. Numerous studies suggest an association between job strain and cardiovascular disease [9-12]. A stressful event may affect the HPA-axis (Hypothalamic–Pituitary–Adrenal axis), that constitutes a significant part of the neuroendocrine system controlling reactions to stress. The HPA-axis involves interactions between the hypothalamus, the pituitary gland and the adrenal glands. In the event of acute stress, the pituitary gland releases the hormone ACTH into the blood. ACTH reaches the adrenal glad and the hormone cortisol is released. About 90% of the cortisol that is released into the blood steam is bound to the protein globulin, only 10% is free and active. Long-term stress may contribute to a dysfunction of the HPA-axis that may result in persistently increased levels of cortisol [13] and may eventually lead to metabolic changes and cardiovascular disease [14-20]. Cortisol is sometimes referred to as the “stress hormone” and it is a biomarker of a stress response in the body. It is produced by the adrenal gland and involved in glucose metabolism, distribution of fat and immune function. Under normal circumstances the cortisol level peaks approximately 30 minuets after awakening. It decreases throughout the day and reach the lowest levels at night [21]. A chronic increase in cortisol, that occurs in for instance Cushing’s syndrome, can lead to increased risks for a number of severe complications such as cardiovascular disease and diabetes mellitus[13].
4
1.3 NOISE AND CARDIOVASCULAR DISEASE
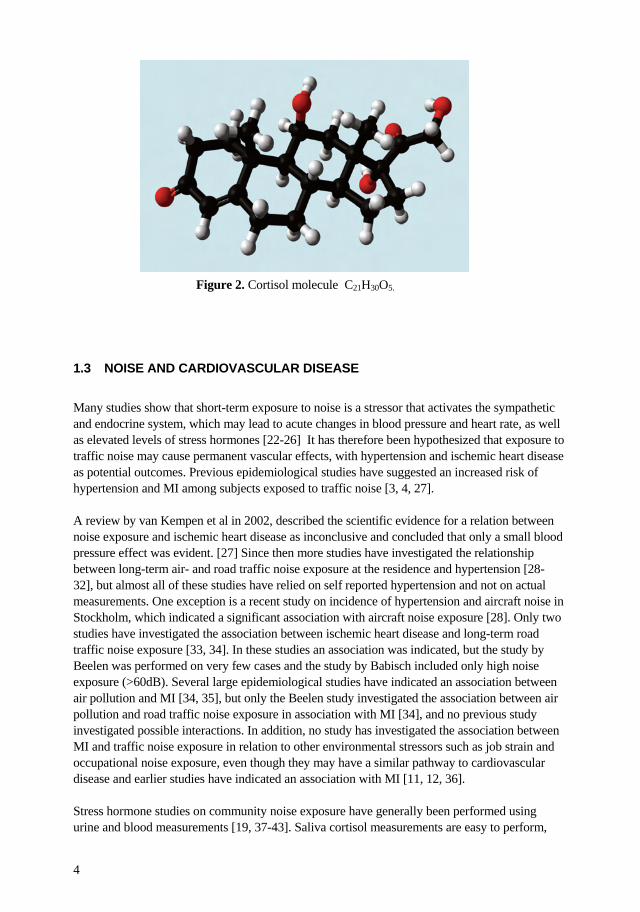
Many studies show that short-term exposure to noise is a stressor that activates the sympathetic and endocrine system, which may lead to acute changes in blood pressure and heart rate, as well as elevated levels of stress hormones [22-26] It has therefore been hypothesized that exposure to traffic noise may cause permanent vascular effects, with hypertension and ischemic heart disease as potential outcomes. Previous epidemiological studies have suggested an increased risk of hypertension and MI among subjects exposed to traffic noise [3, 4, 27]. A review by van Kempen et al in 2002, described the scientific evidence for a relation between noise exposure and ischemic heart disease as inconclusive and concluded that only a small blood pressure effect was evident. [27] Since then more studies have investigated the relationship between long-term air- and road traffic noise exposure at the residence and hypertension [28-32], but almost all of these studies have relied on self reported hypertension and not on actual measurements. One exception is a recent study on incidence of hypertension and aircraft noise in Stockholm, which indicated a significant association with aircraft noise exposure [28]. Only two studies have investigated the association between ischemic heart disease and long-term road traffic noise exposure [33, 34]. In these studies an association was indicated, but the study by Beelen was performed on very few cases and the study by Babisch included only high noise exposure (>60dB). Several large epidemiological studies have indicated an association between air pollution and MI [34, 35], but only the Beelen study investigated the association between air pollution and road traffic noise exposure in association with MI [34], and no previous study investigated possible interactions. In addition, no study has investigated the association between MI and traffic noise exposure in relation to other environmental stressors such as job strain and occupational noise exposure, even though they may have a similar pathway to cardiovascular disease and earlier studies have indicated an association with MI [11, 12, 36]. Stress hormone studies on community noise exposure have generally been performed using urine and blood measurements [19, 37-43]. Saliva cortisol measurements are easy to perform,
Figure 2. Cortisol molecule C21H30O5.

5
reliably reflect free cortisol levels in blood [44], and have recently been used in a few studies on exposure to road traffic and aircraft noise [45-47]. In two review articles, the evidence on road traffic noise as well as aircraft noise and cortisol was evaluated [3, 38]. Six of the 14 studies reviewed showed an increase in cortisol level related to exposure, but these were mainly based on urine measurements and had small sample sizes. Only two of the studies used saliva cortisol measures, and the results were inconclusive [45, 46]. Thus, the association between community noise exposure and cortisol levels is still unclear.
6
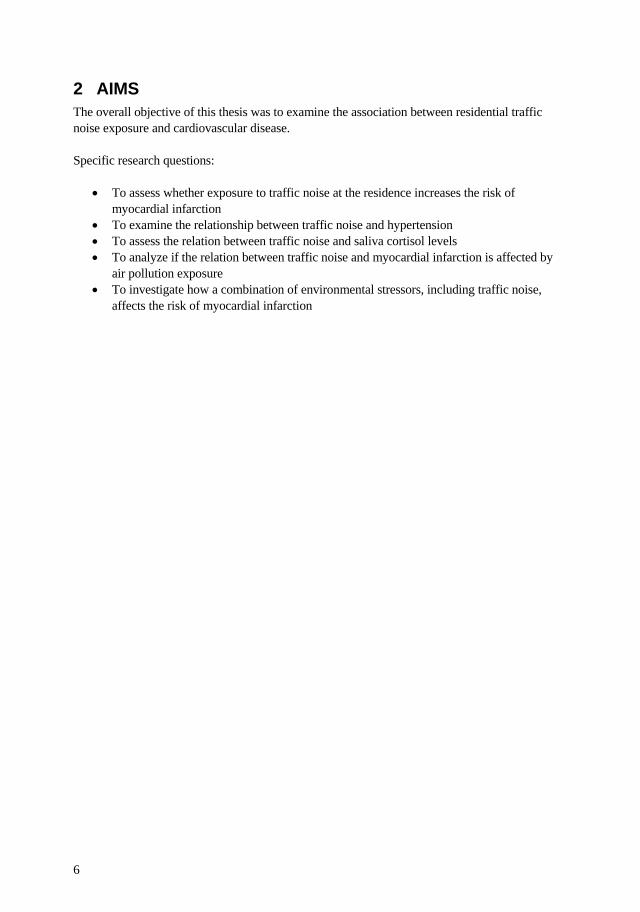
2 AIMS The overall objective of this thesis was to examine the association between residential traffic noise exposure and cardiovascular disease. Specific research questions:
• To assess whether exposure to traffic noise at the residence increases the risk of myocardial infarction
• To examine the relationship between traffic noise and hypertension • To assess the relation between traffic noise and saliva cortisol levels • To analyze if the relation between traffic noise and myocardial infarction is affected by
air pollution exposure • To investigate how a combination of environmental stressors, including traffic noise,
affects the risk of myocardial infarction
7
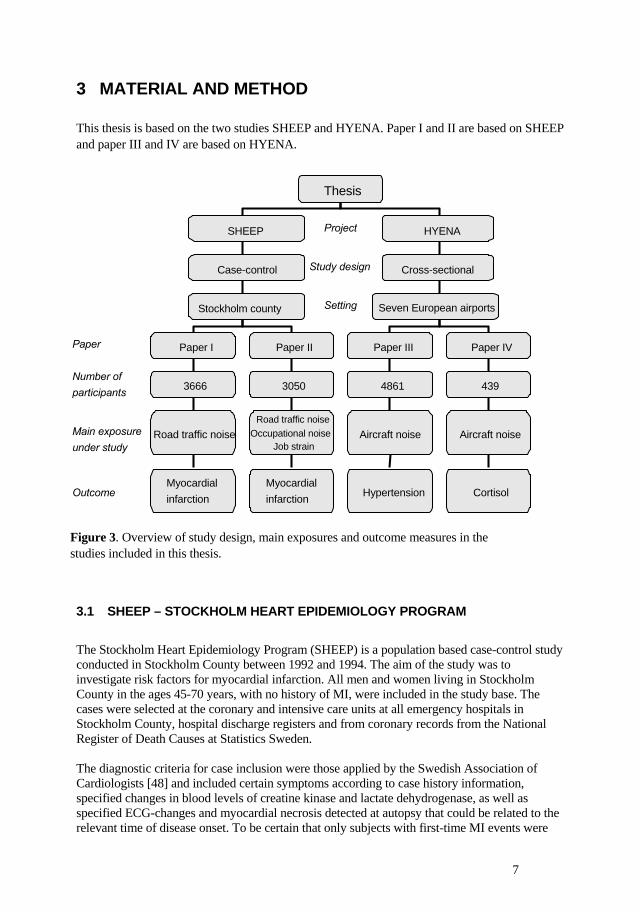
3 MATERIAL AND METHOD This thesis is based on the two studies SHEEP and HYENA. Paper I and II are based on SHEEP and paper III and IV are based on HYENA. 3.1 SHEEP – STOCKHOLM HEART EPIDEMIOLOGY PROGRAM
The Stockholm Heart Epidemiology Program (SHEEP) is a population based case-control study conducted in Stockholm County between 1992 and 1994. The aim of the study was to investigate risk factors for myocardial infarction. All men and women living in Stockholm County in the ages 45-70 years, with no history of MI, were included in the study base. The cases were selected at the coronary and intensive care units at all emergency hospitals in Stockholm County, hospital discharge registers and from coronary records from the National Register of Death Causes at Statistics Sweden. The diagnostic criteria for case inclusion were those applied by the Swedish Association of Cardiologists [48] and included certain symptoms according to case history information, specified changes in blood levels of creatine kinase and lactate dehydrogenase, as well as specified ECG-changes and myocardial necrosis detected at autopsy that could be related to the relevant time of disease onset. To be certain that only subjects with first-time MI events were
Thesis
SHEEP HYENA
Case-control Cross-sectional
Stockholm county Seven European airports
Paper I Paper II Paper III Paper IV
3666 3050 4861 439
Road traffic noise Aircraft noise Aircraft noise
Myocardial infarction
Myocardial infarction Hypertension Cortisol
Paper
Number of participants
Main exposure under study
Project
Outcome
Study design
Setting
Road traffic noiseOccupational noise
Job strain
Figure 3. Overview of study design, main exposures and outcome measures in the studies included in this thesis.
8
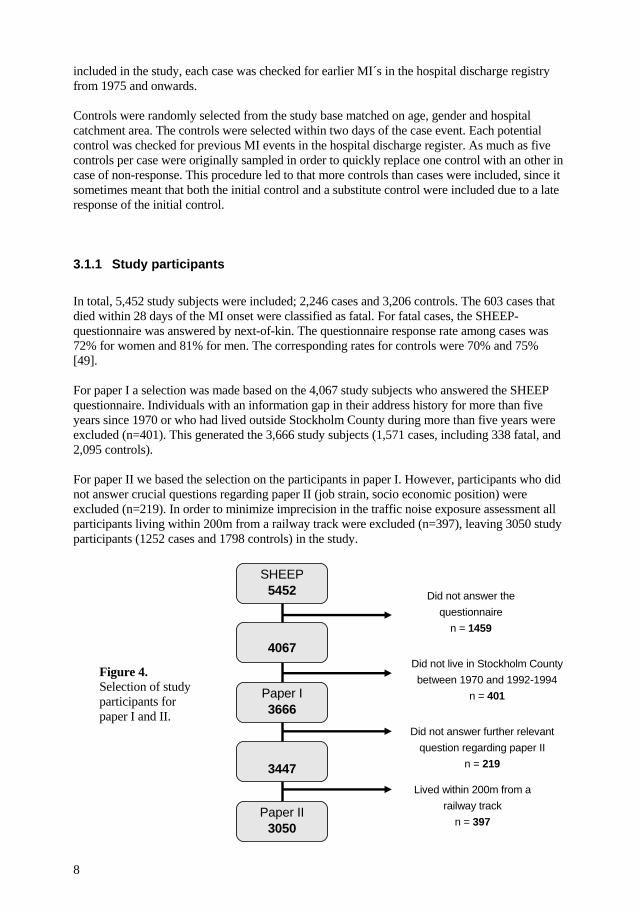
included in the study, each case was checked for earlier MI´s in the hospital discharge registry from 1975 and onwards. Controls were randomly selected from the study base matched on age, gender and hospital catchment area. The controls were selected within two days of the case event. Each potential control was checked for previous MI events in the hospital discharge register. As much as five controls per case were originally sampled in order to quickly replace one control with an other in case of non-response. This procedure led to that more controls than cases were included, since it sometimes meant that both the initial control and a substitute control were included due to a late response of the initial control. 3.1.1 Study participants In total, 5,452 study subjects were included; 2,246 cases and 3,206 controls. The 603 cases that died within 28 days of the MI onset were classified as fatal. For fatal cases, the SHEEP-questionnaire was answered by next-of-kin. The questionnaire response rate among cases was 72% for women and 81% for men. The corresponding rates for controls were 70% and 75% [49]. For paper I a selection was made based on the 4,067 study subjects who answered the SHEEP questionnaire. Individuals with an information gap in their address history for more than five years since 1970 or who had lived outside Stockholm County during more than five years were excluded (n=401). This generated the 3,666 study subjects (1,571 cases, including 338 fatal, and 2,095 controls). For paper II we based the selection on the participants in paper I. However, participants who did not answer crucial questions regarding paper II (job strain, socio economic position) were excluded (n=219). In order to minimize imprecision in the traffic noise exposure assessment all participants living within 200m from a railway track were excluded (n=397), leaving 3050 study participants (1252 cases and 1798 controls) in the study.
SHEEP 5452
4067
Paper I 3666
3447
Paper II 3050
Did not answer the questionnaire
n = 1459
Did not live in Stockholm County between 1970 and 1992-1994
n = 401
Did not answer further relevant question regarding paper II
n = 219
Lived within 200m from a railway track
n = 397
Figure 4. Selection of study participants for paper I and II.
9
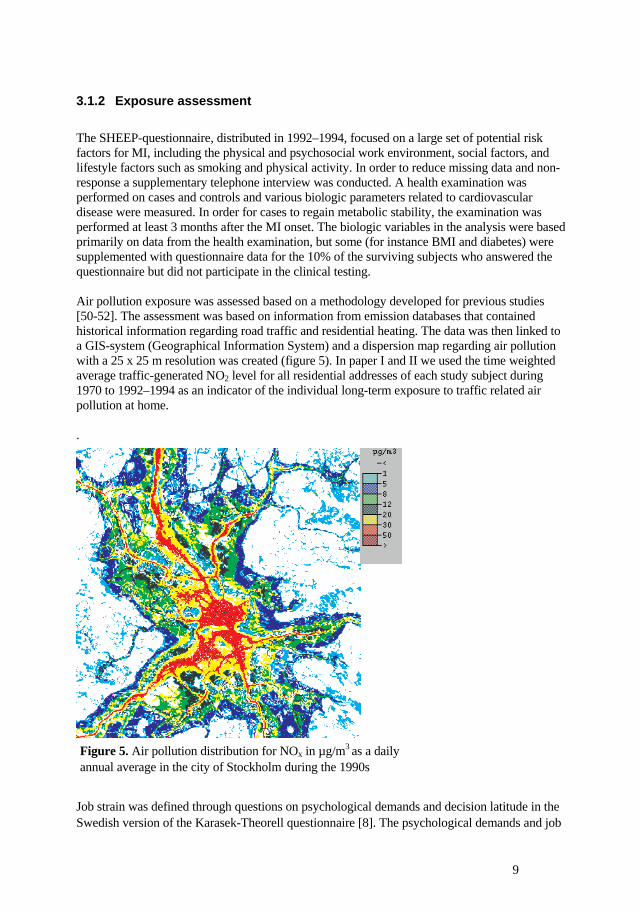
3.1.2 Exposure assessment The SHEEP-questionnaire, distributed in 1992–1994, focused on a large set of potential risk factors for MI, including the physical and psychosocial work environment, social factors, and lifestyle factors such as smoking and physical activity. In order to reduce missing data and non-response a supplementary telephone interview was conducted. A health examination was performed on cases and controls and various biologic parameters related to cardiovascular disease were measured. In order for cases to regain metabolic stability, the examination was performed at least 3 months after the MI onset. The biologic variables in the analysis were based primarily on data from the health examination, but some (for instance BMI and diabetes) were supplemented with questionnaire data for the 10% of the surviving subjects who answered the questionnaire but did not participate in the clinical testing. Air pollution exposure was assessed based on a methodology developed for previous studies [50-52]. The assessment was based on information from emission databases that contained historical information regarding road traffic and residential heating. The data was then linked to a GIS-system (Geographical Information System) and a dispersion map regarding air pollution with a 25 x 25 m resolution was created (figure 5). In paper I and II we used the time weighted average traffic-generated NO2 level for all residential addresses of each study subject during 1970 to 1992–1994 as an indicator of the individual long-term exposure to traffic related air pollution at home. .
Job strain was defined through questions on psychological demands and decision latitude in the Swedish version of the Karasek-Theorell questionnaire [8]. The psychological demands and job
Figure 5. Air pollution distribution for NOx in µg/m3 as a daily annual average in the city of Stockholm during the 1990s
10
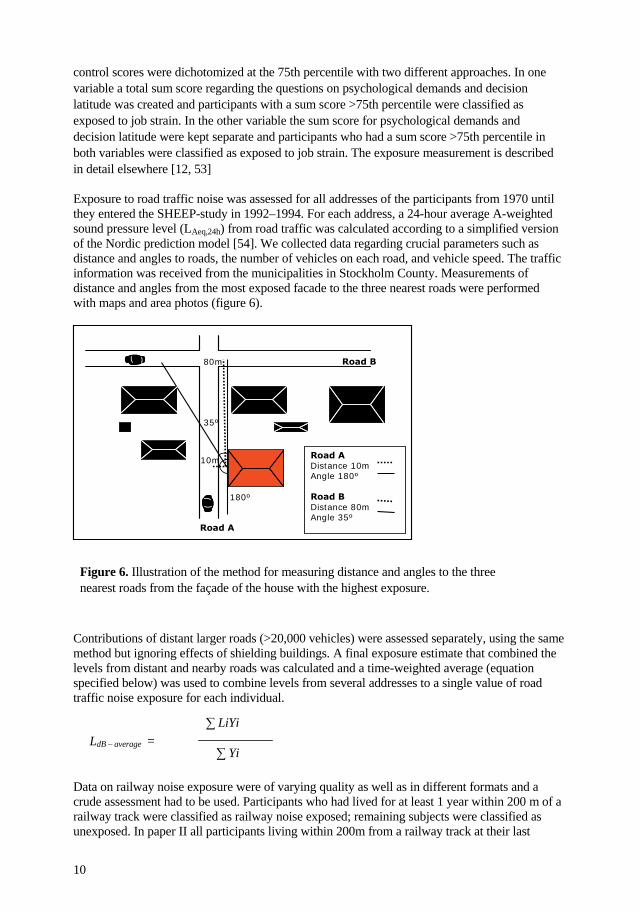
control scores were dichotomized at the 75th percentile with two different approaches. In one variable a total sum score regarding the questions on psychological demands and decision latitude was created and participants with a sum score >75th percentile were classified as exposed to job strain. In the other variable the sum score for psychological demands and decision latitude were kept separate and participants who had a sum score >75th percentile in both variables were classified as exposed to job strain. The exposure measurement is described in detail elsewhere [12, 53] Exposure to road traffic noise was assessed for all addresses of the participants from 1970 until they entered the SHEEP-study in 1992–1994. For each address, a 24-hour average A-weighted sound pressure level (LAeq,24h) from road traffic was calculated according to a simplified version of the Nordic prediction model [54]. We collected data regarding crucial parameters such as distance and angles to roads, the number of vehicles on each road, and vehicle speed. The traffic information was received from the municipalities in Stockholm County. Measurements of distance and angles from the most exposed facade to the three nearest roads were performed with maps and area photos (figure 6).
Road B
Road A
35º
180º
80m
10m Road A Distance 10m Angle 180º
Road BDistance 80mAngle 35º
Road B
Road A
35º
180º
80m
10m Road A Distance 10m Angle 180º
Road BDistance 80mAngle 35º
Contributions of distant larger roads (>20,000 vehicles) were assessed separately, using the same method but ignoring effects of shielding buildings. A final exposure estimate that combined the levels from distant and nearby roads was calculated and a time-weighted average (equation specified below) was used to combine levels from several addresses to a single value of road traffic noise exposure for each individual. Data on railway noise exposure were of varying quality as well as in different formats and a crude assessment had to be used. Participants who had lived for at least 1 year within 200 m of a railway track were classified as railway noise exposed; remaining subjects were classified as unexposed. In paper II all participants living within 200m from a railway track at their last
Figure 6. Illustration of the method for measuring distance and angles to the three nearest roads from the façade of the house with the highest exposure.
LdB – average = ∑ Yi
∑ LiYi
11
address were excluded from the analyses (12% of the study population) to reduce imprecision in the traffic noise exposure assessment. We used a job-exposure matrix (JEM) to assess occupational noise exposure. The matrix is described in detail elsewhere [55]. Briefly, the JEM was derived from measurements performed by occupational medicine clinics and occupational health services units in Sweden during the period 1970-2004. The JEM included 320 occupations, and was based on up to 35 different measurements per occupation. In case of missing data, an expert judgment was performed. Estimated exposure for each occupation was coded as <75 dB, 75-84 dB, or ≥85 dB (LAeq,8h) based on the consensus of three occupational hygienists. We used the JEM together with questionnaire information on type and duration of occupation to calculate the level and duration of each subject’s occupational noise exposure. Subjects were classified as noise exposed if they had had an occupational exposure ≥75 dB for more than 1 year. In 2003, a supplementary questionnaire was distributed to enhance the noise exposure assessment. This included questions on hearing impairment, window insulation, bedroom orientation, and noise annoyance. If the case or control had died, the questionnaire was sent to the next-of-kin. The questionnaire response rate among cases was 66% for women and 68% for men, and for controls, 76% for women and 79% for men. 3.1.3 Statistical approach
For paper I and II odds ratios and 95% confidence intervals were calculated using unconditional logistic regression analyses. Interaction effects in paper II were calculated on the additive scale. Trend tests in both papers were performed assuming a linear increase across categorical variables. Regression coefficients were adjusted for the matching variables age (five categories), sex and catchment area (ten categories) and for a number of selected covariates. A covariate was selected if the inclusion of this variable in the preliminary model changed the crude estimate for noise exposure by 10% or more. The covariates included in the fully adjusted regression model in paper I were diabetes (dichotomous), physical activity (dichotomous), and smoking (5 categories). In addition, we also adjusted for air pollution (continuous) and occupational noise exposure (dichotomous), although these changed the crude estimate for road traffic noise exposure by only 7% and 3%, respectively. The covariates included in the fully adjusted regression model for paper II were physical activity (dichotomous), socioeconomic position (three categories) and smoking (five categories). We also adjusted for air pollution (continuous), although this changed the regression coefficient for road-traffic noise exposure by only 7%. Diabetes was not included as a covariate in the final model in paper II despite the fact that it changed the estimate by 10%, because of the possibility that it constitutes an intermediate step in the causal chain between noise exposure and myocardial infarction. The statistical analyses in paper I was performed with STATA 8.2 and for paper II with STATA 11.0 (Stata Corp., College Station, TX).
12
3.2 HYENA – HYPERTENSION AND EXPOSURE TO NOISE NEAR AIRPORTS
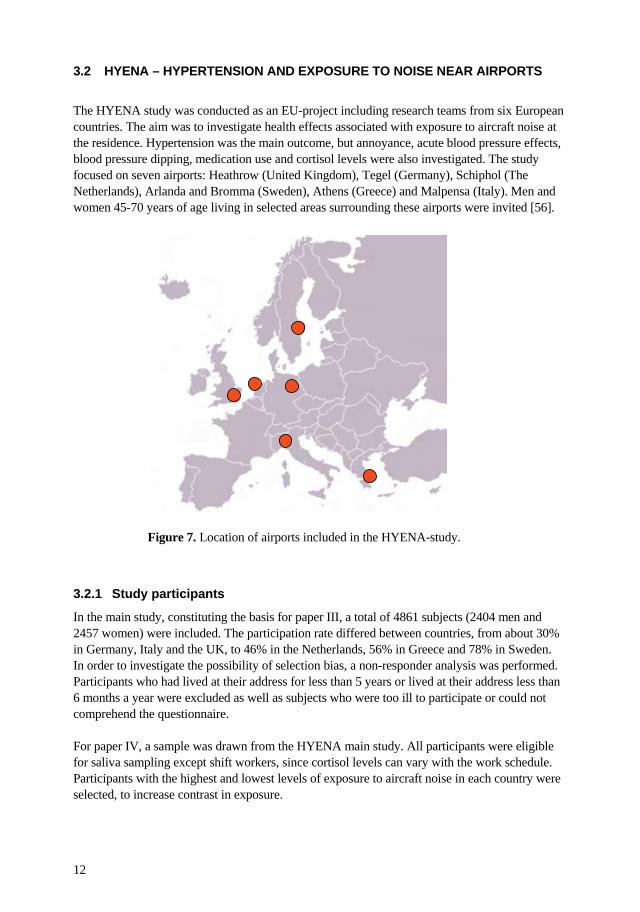
The HYENA study was conducted as an EU-project including research teams from six European countries. The aim was to investigate health effects associated with exposure to aircraft noise at the residence. Hypertension was the main outcome, but annoyance, acute blood pressure effects, blood pressure dipping, medication use and cortisol levels were also investigated. The study focused on seven airports: Heathrow (United Kingdom), Tegel (Germany), Schiphol (The Netherlands), Arlanda and Bromma (Sweden), Athens (Greece) and Malpensa (Italy). Men and women 45-70 years of age living in selected areas surrounding these airports were invited [56]. 3.2.1 Study participants
In the main study, constituting the basis for paper III, a total of 4861 subjects (2404 men and 2457 women) were included. The participation rate differed between countries, from about 30% in Germany, Italy and the UK, to 46% in the Netherlands, 56% in Greece and 78% in Sweden. In order to investigate the possibility of selection bias, a non-responder analysis was performed. Participants who had lived at their address for less than 5 years or lived at their address less than 6 months a year were excluded as well as subjects who were too ill to participate or could not comprehend the questionnaire. For paper IV, a sample was drawn from the HYENA main study. All participants were eligible for saliva sampling except shift workers, since cortisol levels can vary with the work schedule. Participants with the highest and lowest levels of exposure to aircraft noise in each country were selected, to increase contrast in exposure.
Figure 7. Location of airports included in the HYENA-study.
13
The participation rate for the cortisol-study was high in Sweden, UK and the Netherlands (99, 98 and 85%), lower in Italy (49%) and Germany (26%) and was not recorded in Greece. The final sample consisted of 439 participants (209 men and 230 women).
3.2.2 Exposure assessment
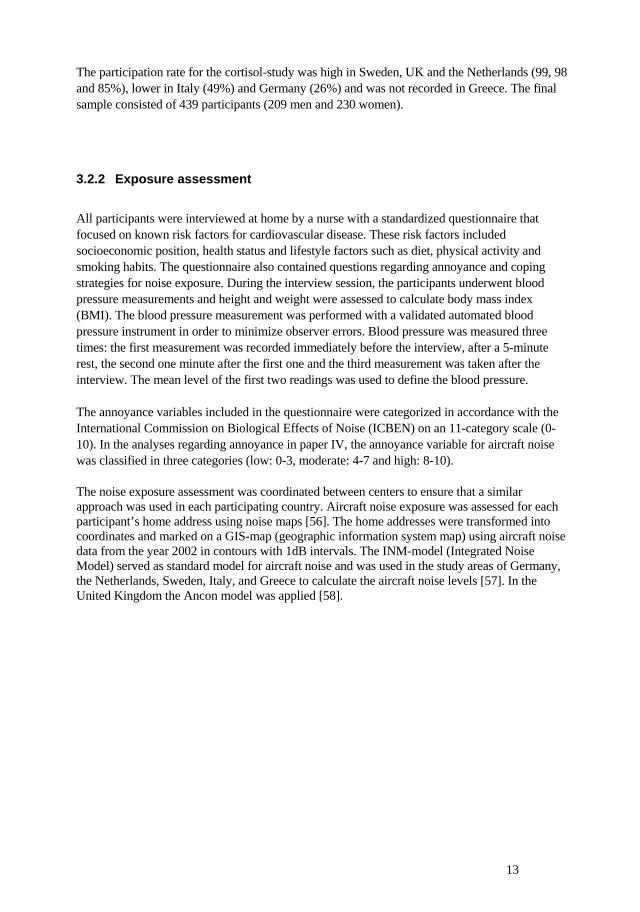
All participants were interviewed at home by a nurse with a standardized questionnaire that focused on known risk factors for cardiovascular disease. These risk factors included socioeconomic position, health status and lifestyle factors such as diet, physical activity and smoking habits. The questionnaire also contained questions regarding annoyance and coping strategies for noise exposure. During the interview session, the participants underwent blood pressure measurements and height and weight were assessed to calculate body mass index (BMI). The blood pressure measurement was performed with a validated automated blood pressure instrument in order to minimize observer errors. Blood pressure was measured three times: the first measurement was recorded immediately before the interview, after a 5-minute rest, the second one minute after the first one and the third measurement was taken after the interview. The mean level of the first two readings was used to define the blood pressure. The annoyance variables included in the questionnaire were categorized in accordance with the International Commission on Biological Effects of Noise (ICBEN) on an 11-category scale (0-10). In the analyses regarding annoyance in paper IV, the annoyance variable for aircraft noise was classified in three categories (low: 0-3, moderate: 4-7 and high: 8-10). The noise exposure assessment was coordinated between centers to ensure that a similar approach was used in each participating country. Aircraft noise exposure was assessed for each participant’s home address using noise maps [56]. The home addresses were transformed into coordinates and marked on a GIS-map (geographic information system map) using aircraft noise data from the year 2002 in contours with 1dB intervals. The INM-model (Integrated Noise Model) served as standard model for aircraft noise and was used in the study areas of Germany, the Netherlands, Sweden, Italy, and Greece to calculate the aircraft noise levels [57]. In the United Kingdom the Ancon model was applied [58].
14
Figure 8. GIS-map with exposure assessments made for aircraft noise exposure ≥55 Lden, INM-model, at the international Stockholm Arlanda airport, 2-runway-system.
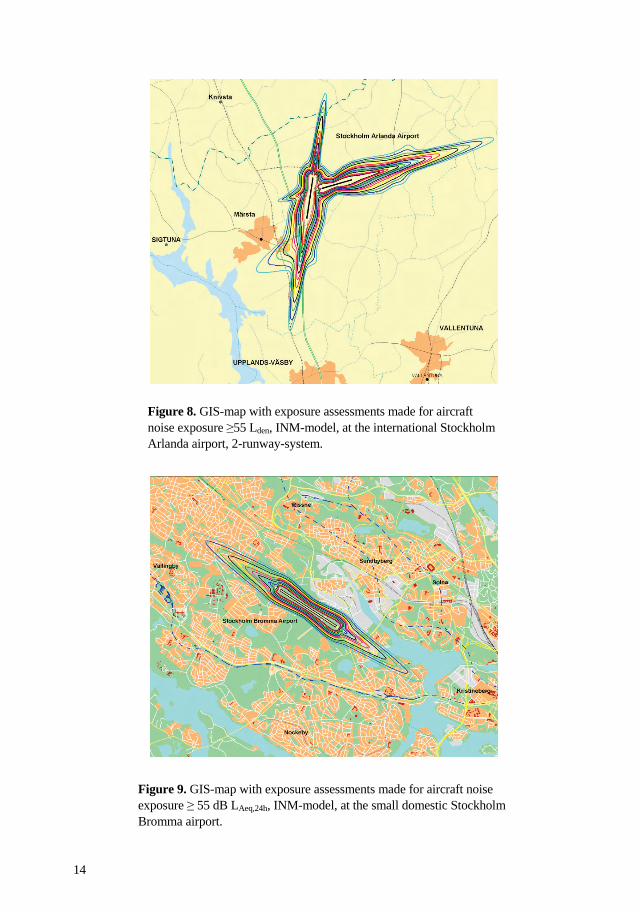
Figure 9. GIS-map with exposure assessments made for aircraft noise exposure ≥ 55 dB LAeq,24h, INM-model, at the small domestic Stockholm Bromma airport.
15
Local models were used in each country for road traffic noise since no uniform traffic data were available. The Good Practice Guide for Strategic Noise Mapping was applied to merge the data between countries [59]. Road traffic noise levels in all countries had a 1-dB resolution, except for the United Kingdom, where 5-dB classes were used. The midpoints of these classes were chosen for the analyses using continuous exposure data. The participants selected for saliva sampling were instructed to collect three samples. The first sample was to be taken 30 min after awakening (which usually corresponds to the peak excretion of cortisol), the second sample immediately before lunch, and the third sample just before going to bed in the evening. Detailed instructions were provided in order to ensure that the samples were taken in a similar fashion for all participants in each country and that the samples would be marked properly. Participants were instructed to write the date and time on the label of the test tube, and put it in the refrigerator. The samples were collected by a nurse or put in an envelope and mailed to the laboratory in each of the participating countries responsible for the cortisol sampling. The samples were then centrifuged and frozen. When all samples had been collected, the saliva tubes were sent to a laboratory at Karolinska Institutet (Stockholm, Sweden) for analysis. Cortisol levels in saliva were determined by the Spectria cortisol coated tube radioimmunoassay kit (Orion Diagnostica, Espoo, Finland). All samples from each subject or group of subjects were analyzed simultaneously in duplicate. The within- and between-assay coefficient of variation never exceeded 5.0% and 10.0%, respectively. Cortisol was analyzed and compared for 30 samples at the Department of Physiological Psychology, University of Düsseldorf, Germany [60]. There was a very high correlation (0.98) but a slight difference in level, with systematically lower levels in the Stockholm laboratory. The difference was 12.5% (95% CI 1.5–22.3%). 3.2.3 Statistical approach
In paper III logistic regression models were used to calculate the association between traffic noise exposure and hypertension. All analyses were adjusted for country, age, BMI, alcohol intake, education and exercise. The statistical software SAS (SAS institute inc. Cary, NC, USA) and EGRET (Cytel Software Corporation, Cambridge, MA, USA) were applied. In paper IV linear regression models were used to assess the relation between traffic noise exposure and saliva cortisol levels. The analyses were adjusted for traffic noise exposure (air or road), country, age, sex, employment status, occupational status, medication use, BMI, alcohol intake, diet, remedy during night and other noise sources. In paper IV a covariate was selected as a confounder if the inclusion of this variable changed the regression coefficient in the crude model by 10% or more. A full model was applied and covariates that affected the full model less than 3% were excluded in the final model. The analyses were conducted using the statistical software STATA 8.2 (Stata Corp., Collage Station, TX, USA). In both papers tests for heterogeneity between countries were performed and no significant difference was found, indicating that combined analyses could be used.
16
4 RESULTS The results presented below mainly focus on the tables and figures published in paper I-IV. However, some further analyses have been performed and these results are also presented below. 4.1 ROAD TRAFFIC NOISE, AIR POLLUTION AND MYOCARDIAL INFARCTION
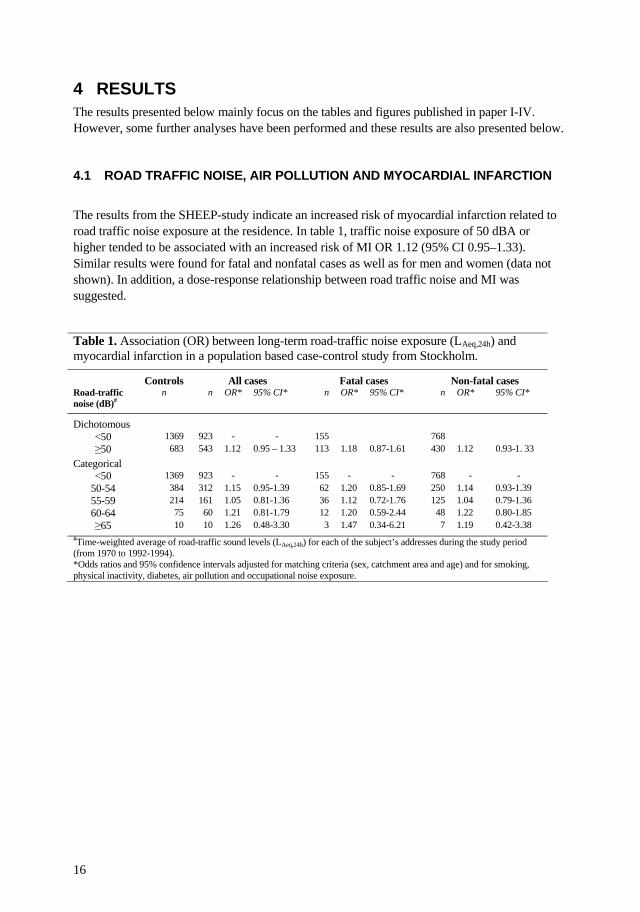
The results from the SHEEP-study indicate an increased risk of myocardial infarction related to road traffic noise exposure at the residence. In table 1, traffic noise exposure of 50 dBA or higher tended to be associated with an increased risk of MI OR 1.12 (95% CI 0.95–1.33). Similar results were found for fatal and nonfatal cases as well as for men and women (data not shown). In addition, a dose-response relationship between road traffic noise and MI was suggested. Table 1. Association (OR) between long-term road-traffic noise exposure (LAeq,24h) and myocardial infarction in a population based case-control study from Stockholm.
Controls All cases Fatal cases Non-fatal cases Road-traffic noise (dB)#
n n OR* 95% CI* n OR* 95% CI* n OR* 95% CI*
Dichotomous <50 1369 923 - - 155 768 ≥50 683 543 1.12 0.95 – 1.33 113 1.18 0.87-1.61 430 1.12 0.93-1. 33
Categorical <50 1369 923 - - 155 - - 768 - -
50-54 384 312 1.15 0.95-1.39 62 1.20 0.85-1.69 250 1.14 0.93-1.39 55-59 214 161 1.05 0.81-1.36 36 1.12 0.72-1.76 125 1.04 0.79-1.36 60-64 75 60 1.21 0.81-1.79 12 1.20 0.59-2.44 48 1.22 0.80-1.85 ≥65 10 10 1.26 0.48-3.30 3 1.47 0.34-6.21 7 1.19 0.42-3.38
#Time-weighted average of road-traffic sound levels (LAeq,24h) for each of the subject’s addresses during the study period (from 1970 to 1992-1994). *Odds ratios and 95% confidence intervals adjusted for matching criteria (sex, catchment area and age) and for smoking, physical inactivity, diabetes, air pollution and occupational noise exposure.
17
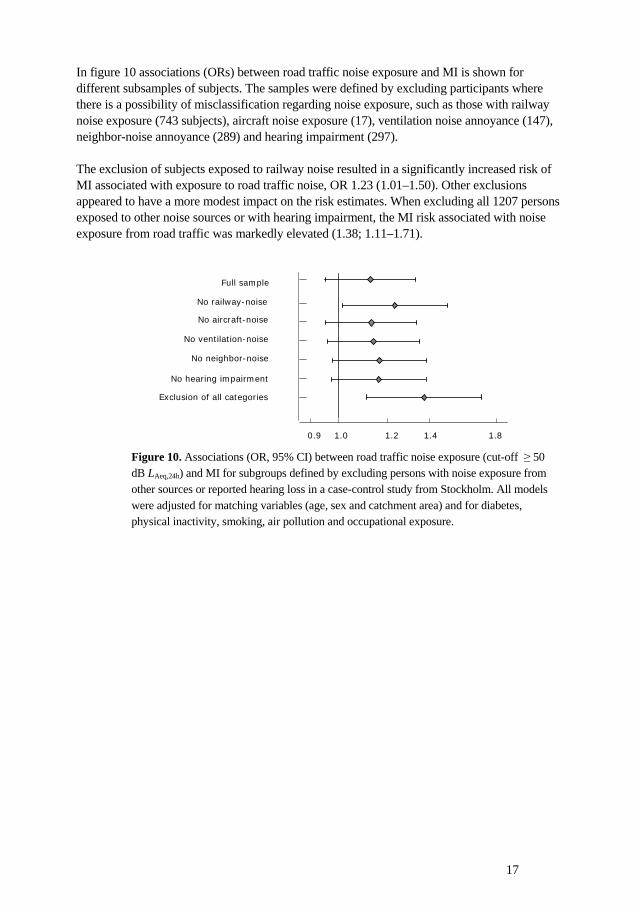
In figure 10 associations (ORs) between road traffic noise exposure and MI is shown for different subsamples of subjects. The samples were defined by excluding participants where there is a possibility of misclassification regarding noise exposure, such as those with railway noise exposure (743 subjects), aircraft noise exposure (17), ventilation noise annoyance (147), neighbor-noise annoyance (289) and hearing impairment (297). The exclusion of subjects exposed to railway noise resulted in a significantly increased risk of MI associated with exposure to road traffic noise, OR 1.23 (1.01–1.50). Other exclusions appeared to have a more modest impact on the risk estimates. When excluding all 1207 persons exposed to other noise sources or with hearing impairment, the MI risk associated with noise exposure from road traffic was markedly elevated (1.38; 1.11–1.71).
0.9 1.0 1.2 1.4 1.8
OR 95%
Full sample
No railway-noise
No aircraft-noise
No ventilation-noise
No neighbor-noise
No hearing impairment
Exclusion of all categories
Figure 10. Associations (OR, 95% CI) between road traffic noise exposure (cut-off ≥ 50 dB LAeq,24h) and MI for subgroups defined by excluding persons with noise exposure from other sources or reported hearing loss in a case-control study from Stockholm. All models were adjusted for matching variables (age, sex and catchment area) and for diabetes, physical inactivity, smoking, air pollution and occupational exposure.
18
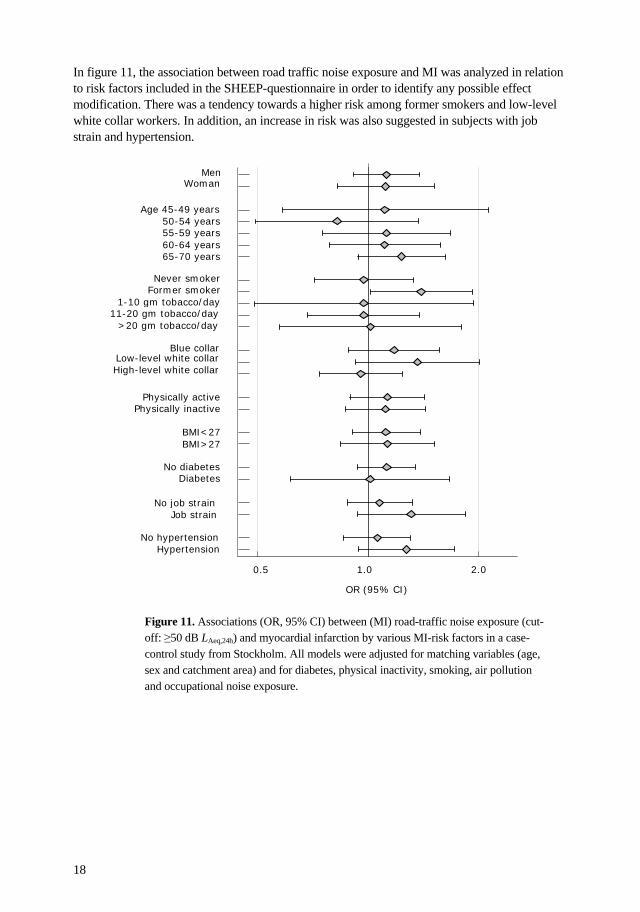
In figure 11, the association between road traffic noise exposure and MI was analyzed in relation to risk factors included in the SHEEP-questionnaire in order to identify any possible effect modification. There was a tendency towards a higher risk among former smokers and low-level white collar workers. In addition, an increase in risk was also suggested in subjects with job strain and hypertension.
0.5 1.0 2.0
OR (95% CI)
MenWoman
Age 45-49 years50-54 years55-59 years60-64 years65-70 years
Never smokerFormer smoker
1-10 gm tobacco/day11-20 gm tobacco/day
>20 gm tobacco/day
Physically activePhysically inactive
No job strainJob strain
Blue collarLow-level white collarHigh-level white collar
BMI<27BMI>27
No hypertensionHypertension
No diabetesDiabetes
Figure 11. Associations (OR, 95% CI) between (MI) road-traffic noise exposure (cut-off: ≥50 dB LAeq,24h) and myocardial infarction by various MI-risk factors in a case-control study from Stockholm. All models were adjusted for matching variables (age, sex and catchment area) and for diabetes, physical inactivity, smoking, air pollution and occupational noise exposure.
19
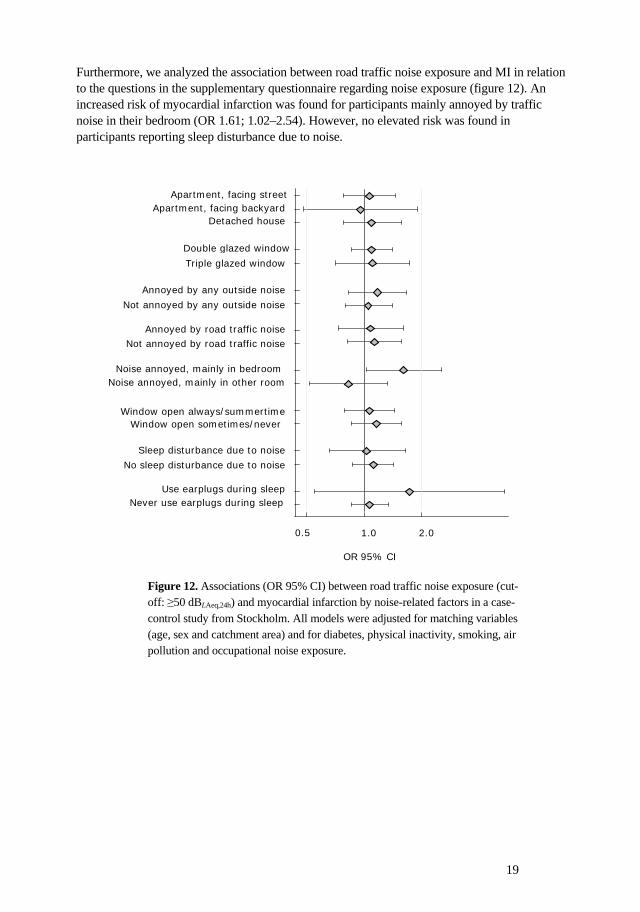
Furthermore, we analyzed the association between road traffic noise exposure and MI in relation to the questions in the supplementary questionnaire regarding noise exposure (figure 12). An increased risk of myocardial infarction was found for participants mainly annoyed by traffic noise in their bedroom (OR 1.61; 1.02–2.54). However, no elevated risk was found in participants reporting sleep disturbance due to noise.
Apartment, facing streetApartment, facing backyard
Detached house
Double glazed window
Triple glazed window
Annoyed by road traffic noiseNot annoyed by road traffic noise
Annoyed by any outside noise
Not annoyed by any outside noise
Noise annoyed, mainly in bedroomNoise annoyed, mainly in other room
Window open always/summertimeWindow open sometimes/never
Sleep disturbance due to noise
No sleep disturbance due to noise
Use earplugs during sleepNever use earplugs during sleep
0.5 1.0 2.0
OR 95% CI
Figure 12. Associations (OR 95% CI) between road traffic noise exposure (cut-off: ≥50 dBLAeq,24h) and myocardial infarction by noise-related factors in a case-control study from Stockholm. All models were adjusted for matching variables (age, sex and catchment area) and for diabetes, physical inactivity, smoking, air pollution and occupational noise exposure.
20
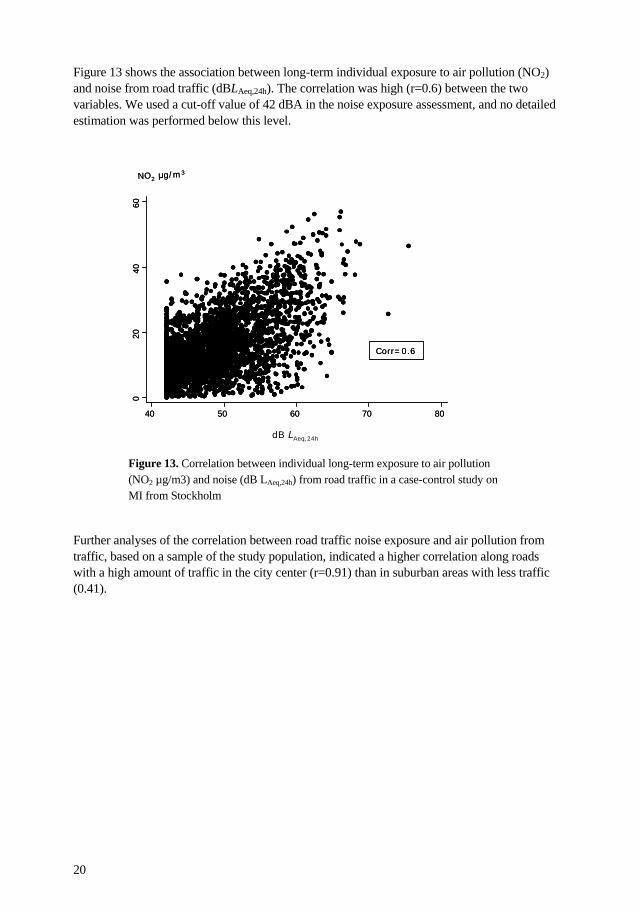
Figure 13 shows the association between long-term individual exposure to air pollution (NO2) and noise from road traffic (dBLAeq,24h). The correlation was high (r=0.6) between the two variables. We used a cut-off value of 42 dBA in the noise exposure assessment, and no detailed estimation was performed below this level. Further analyses of the correlation between road traffic noise exposure and air pollution from traffic, based on a sample of the study population, indicated a higher correlation along roads with a high amount of traffic in the city center (r=0.91) than in suburban areas with less traffic (0.41).
020
4060
NO2 μg/m3
40 50 60 70 80
Corr=0.6
020
4060
NO2 μg/m3
40 50 60 70 80
Corr=0.6
dB LAeq,24h
Figure 13. Correlation between individual long-term exposure to air pollution (NO2 µg/m3) and noise (dB LAeq,24h) from road traffic in a case-control study on MI from Stockholm
21
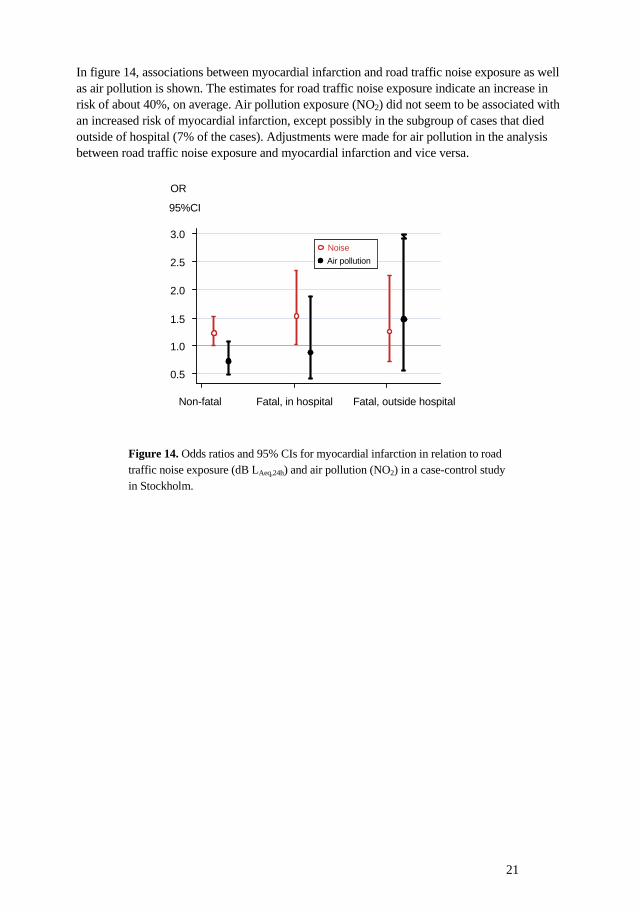
In figure 14, associations between myocardial infarction and road traffic noise exposure as well as air pollution is shown. The estimates for road traffic noise exposure indicate an increase in risk of about 40%, on average. Air pollution exposure (NO2) did not seem to be associated with an increased risk of myocardial infarction, except possibly in the subgroup of cases that died outside of hospital (7% of the cases). Adjustments were made for air pollution in the analysis between road traffic noise exposure and myocardial infarction and vice versa.
0.5
1.0
1.5
2.0
2.5
3.0
95%CI
Non-fatal Fatal, in hospital Fatal, outside hospital
OR
NoiseNoiseAir pollution
Figure 14. Odds ratios and 95% CIs for myocardial infarction in relation to road traffic noise exposure (dB LAeq,24h) and air pollution (NO2) in a case-control study in Stockholm.
22
4.2 TRAFFIC NOISE AND MYOCARDIAL INFARCTION IN RELATION TO
OCCUPATIONAL NOISE AND JOB STRAIN
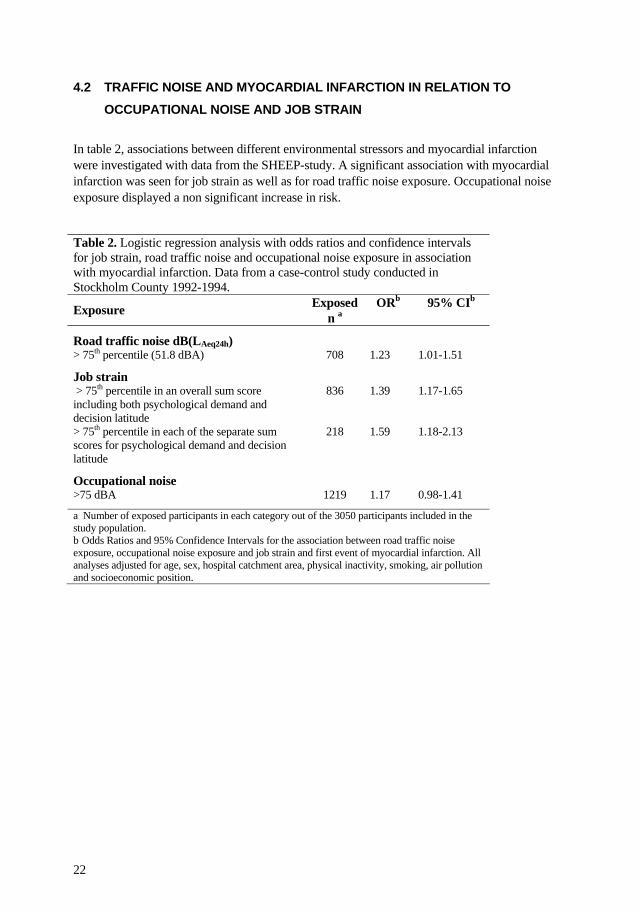
In table 2, associations between different environmental stressors and myocardial infarction were investigated with data from the SHEEP-study. A significant association with myocardial infarction was seen for job strain as well as for road traffic noise exposure. Occupational noise exposure displayed a non significant increase in risk. Table 2. Logistic regression analysis with odds ratios and confidence intervals for job strain, road traffic noise and occupational noise exposure in association with myocardial infarction. Data from a case-control study conducted in Stockholm County 1992-1994.
Exposed ORb 95% CIb
Exposure n a
Road traffic noise dB(LAeq24h) > 75th percentile (51.8 dBA) 708 1.23 1.01-1.51
Job strain > 75th percentile in an overall sum score including both psychological demand and decision latitude
836 1.39 1.17-1.65
> 75th percentile in each of the separate sum scores for psychological demand and decision latitude
218 1.59 1.18-2.13
Occupational noise >75 dBA 1219 1.17 0.98-1.41
a Number of exposed participants in each category out of the 3050 participants included in the study population. b Odds Ratios and 95% Confidence Intervals for the association between road traffic noise exposure, occupational noise exposure and job strain and first event of myocardial infarction. All analyses adjusted for age, sex, hospital catchment area, physical inactivity, smoking, air pollution and socioeconomic position.
23
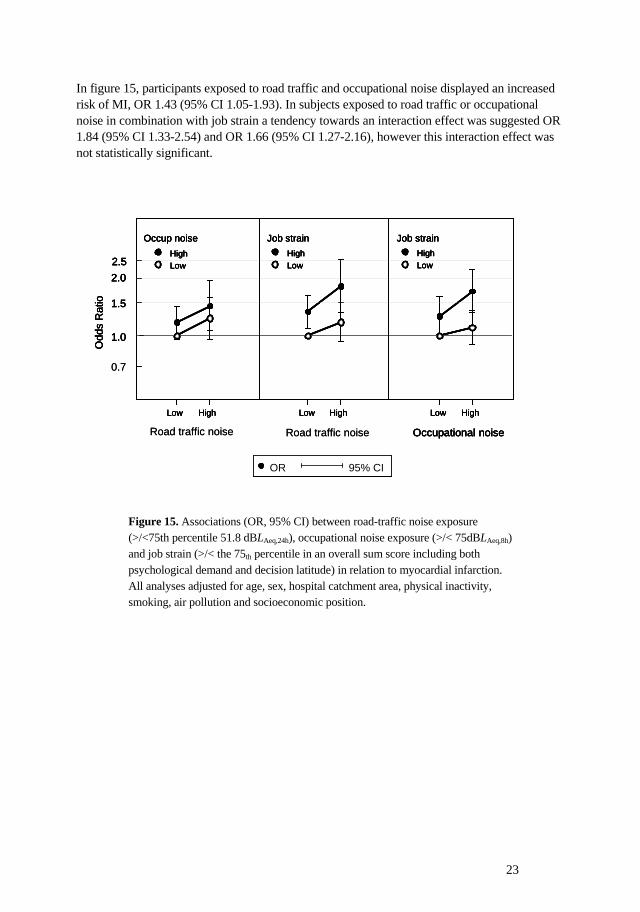
In figure 15, participants exposed to road traffic and occupational noise displayed an increased risk of MI, OR 1.43 (95% CI 1.05-1.93). In subjects exposed to road traffic or occupational noise in combination with job strain a tendency towards an interaction effect was suggested OR 1.84 (95% CI 1.33-2.54) and OR 1.66 (95% CI 1.27-2.16), however this interaction effect was not statistically significant.
Figure 15. Associations (OR, 95% CI) between road-traffic noise exposure (>/<75th percentile 51.8 dBLAeq,24h), occupational noise exposure (>/< 75dBLAeq,8h) and job strain (>/< the 75th percentile in an overall sum score including both psychological demand and decision latitude) in relation to myocardial infarction. All analyses adjusted for age, sex, hospital catchment area, physical inactivity, smoking, air pollution and socioeconomic position.
1.0
1.5
2.02.5
Odd
s R
atio
Low High Low High Low High
Job strain Job strainOccup noise
LowHigh
LowHigh
LowHigh
Road traffic noise Road traffic noise Occupational noise
OR 95% CI
1.0
1.5
2.02.5
Odd
s R
atio
Low High Low High Low High
Job strain Job strainOccup noise
LowHigh
LowHigh
LowHigh
Occupational noise
OR 95% CI
0.7
1.0
1.5
2.02.5
Odd
s R
atio
Low High Low High Low High
Job strain Job strainOccup noise
LowHigh
LowHigh
LowHigh
Road traffic noise Road traffic noise Occupational noise
OR 95% CI
1.0
1.5
2.02.5
Odd
s R
atio
Low High Low High Low High
Job strain Job strainOccup noise
LowHigh
LowHigh
LowHigh
Occupational noise
OR 95% CI
0.7
24
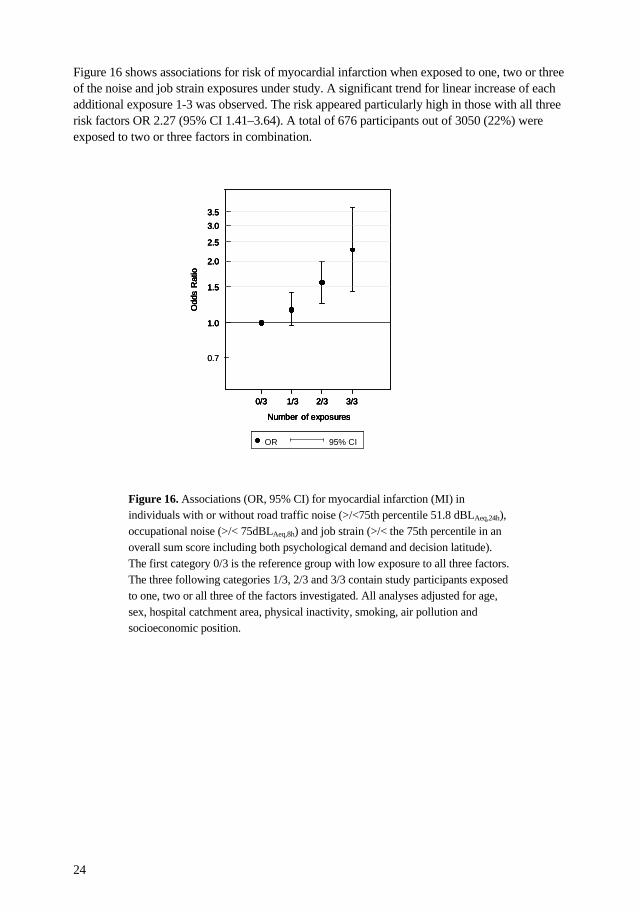
Figure 16 shows associations for risk of myocardial infarction when exposed to one, two or three of the noise and job strain exposures under study. A significant trend for linear increase of each additional exposure 1-3 was observed. The risk appeared particularly high in those with all three risk factors OR 2.27 (95% CI 1.41–3.64). A total of 676 participants out of 3050 (22%) were exposed to two or three factors in combination.
Figure 16. Associations (OR, 95% CI) for myocardial infarction (MI) in individuals with or without road traffic noise (>/<75th percentile 51.8 dBLAeq,24h), occupational noise (>/< 75dBLAeq,8h) and job strain (>/< the 75th percentile in an overall sum score including both psychological demand and decision latitude). The first category 0/3 is the reference group with low exposure to all three factors. The three following categories 1/3, 2/3 and 3/3 contain study participants exposed to one, two or all three of the factors investigated. All analyses adjusted for age, sex, hospital catchment area, physical inactivity, smoking, air pollution and socioeconomic position.
1.0
1.5
2.0
2.5
3.03.5
0/3 1/3 2/3 3/3
OR 95% CI
Odd
s R
atio
Number of exposures
1.0
1.5
2.0
2.5
3.03.5
0/3 1/3 2/3 3/3
OR 95% CIOR 95% CI
Odd
s R
atio
0.7
Number of exposures
1.0
1.5
2.0
2.5
3.03.5
0/3 1/3 2/3 3/3
OR 95% CIOR 95% CI
Odd
s R
atio
Number of exposures
1.0
1.5
2.0
2.5
3.03.5
0/3 1/3 2/3 3/3
OR 95% CIOR 95% CI
Odd
s R
atio
0.7
Number of exposures
25
4.3 TRAFFIC NOISE EXPOSURE AND HYPERTENSION
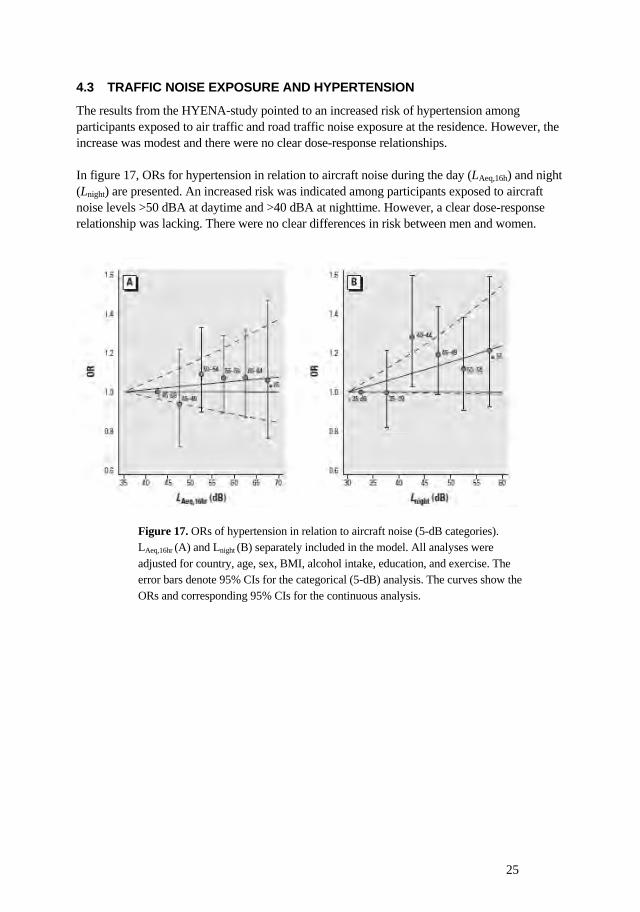
The results from the HYENA-study pointed to an increased risk of hypertension among participants exposed to air traffic and road traffic noise exposure at the residence. However, the increase was modest and there were no clear dose-response relationships. In figure 17, ORs for hypertension in relation to aircraft noise during the day (LAeq,16h) and night (Lnight) are presented. An increased risk was indicated among participants exposed to aircraft noise levels >50 dBA at daytime and >40 dBA at nighttime. However, a clear dose-response relationship was lacking. There were no clear differences in risk between men and women.
Figure 17. ORs of hypertension in relation to aircraft noise (5-dB categories). LAeq,16hr (A) and Lnight (B) separately included in the model. All analyses were adjusted for country, age, sex, BMI, alcohol intake, education, and exercise. The error bars denote 95% CIs for the categorical (5-dB) analysis. The curves show the ORs and corresponding 95% CIs for the continuous analysis.
26
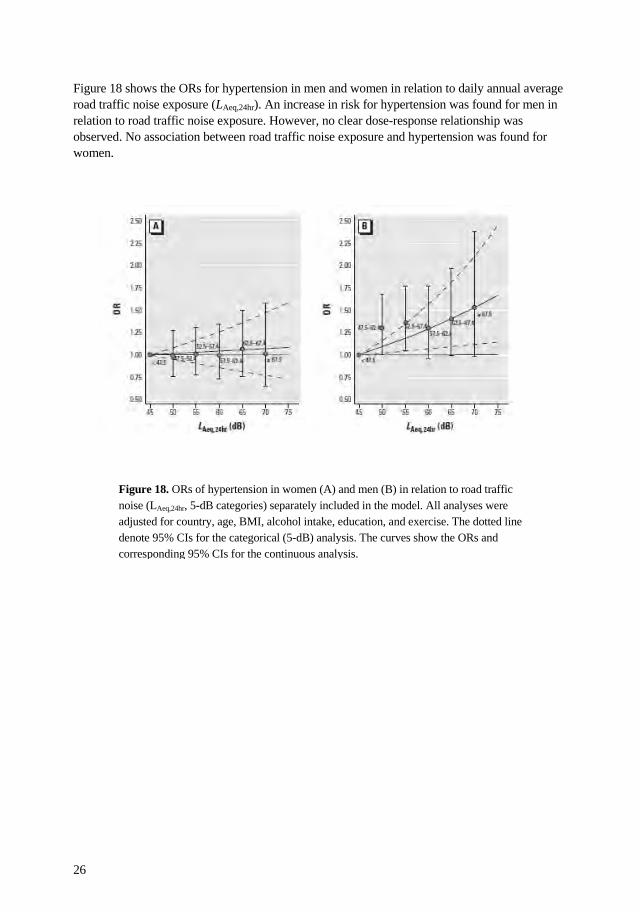
Figure 18 shows the ORs for hypertension in men and women in relation to daily annual average road traffic noise exposure (LAeq,24hr). An increase in risk for hypertension was found for men in relation to road traffic noise exposure. However, no clear dose-response relationship was observed. No association between road traffic noise exposure and hypertension was found for women.
Figure 18. ORs of hypertension in women (A) and men (B) in relation to road traffic noise (LAeq,24hr, 5-dB categories) separately included in the model. All analyses were adjusted for country, age, BMI, alcohol intake, education, and exercise. The dotted line denote 95% CIs for the categorical (5-dB) analysis. The curves show the ORs and corresponding 95% CIs for the continuous analysis.
27
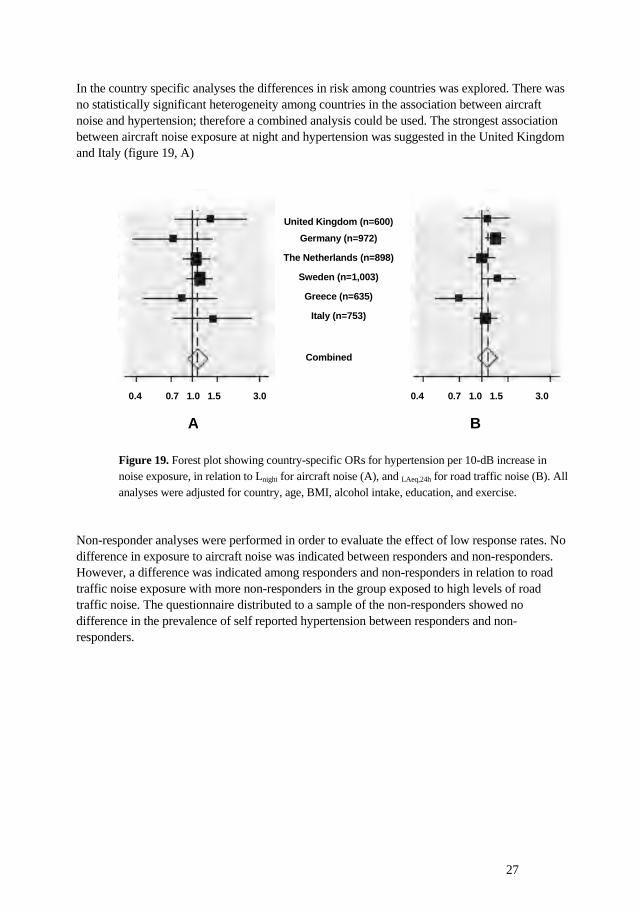
In the country specific analyses the differences in risk among countries was explored. There was no statistically significant heterogeneity among countries in the association between aircraft noise and hypertension; therefore a combined analysis could be used. The strongest association between aircraft noise exposure at night and hypertension was suggested in the United Kingdom and Italy (figure 19, A) Non-responder analyses were performed in order to evaluate the effect of low response rates. No difference in exposure to aircraft noise was indicated between responders and non-responders. However, a difference was indicated among responders and non-responders in relation to road traffic noise exposure with more non-responders in the group exposed to high levels of road traffic noise. The questionnaire distributed to a sample of the non-responders showed no difference in the prevalence of self reported hypertension between responders and non-responders.
United Kingdom (n=600) Germany (n=972)
The Netherlands (n=898)
Sweden (n=1,003)
Greece (n=635)
Italy (n=753)
Combined
A
0.4 0.7 1.0 1.5 3.0
B
0.4 0.7 1.0 1.5 3.0
Figure 19. Forest plot showing country-specific ORs for hypertension per 10-dB increase in noise exposure, in relation to Lnight for aircraft noise (A), and LAeq,24h for road traffic noise (B). All analyses were adjusted for country, age, BMI, alcohol intake, education, and exercise.
28
4.4 AIR TRAFFIC NOISE AND MORNING SALIVA CORTISOL
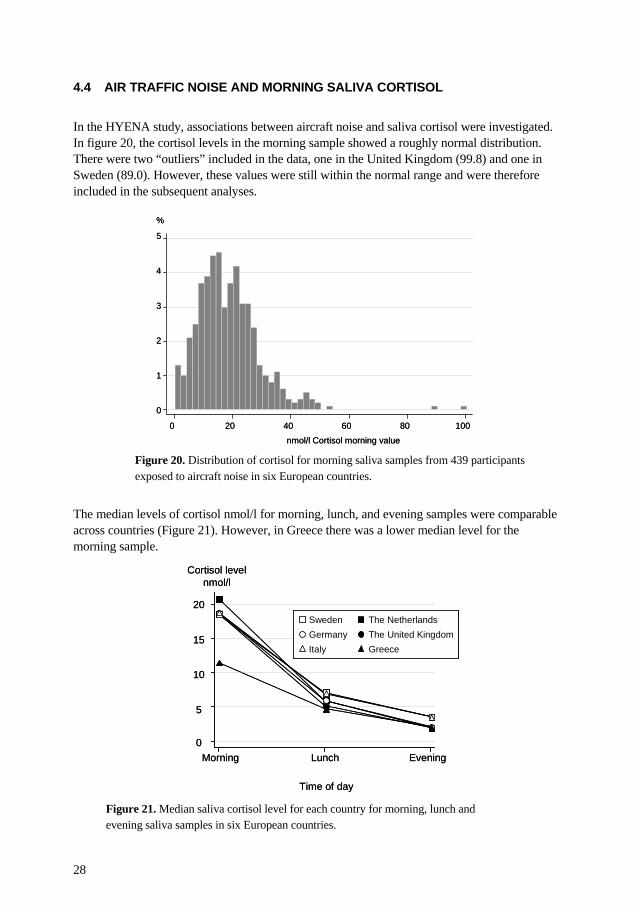
In the HYENA study, associations between aircraft noise and saliva cortisol were investigated. In figure 20, the cortisol levels in the morning sample showed a roughly normal distribution. There were two “outliers” included in the data, one in the United Kingdom (99.8) and one in Sweden (89.0). However, these values were still within the normal range and were therefore included in the subsequent analyses. The median levels of cortisol nmol/l for morning, lunch, and evening samples were comparable across countries (Figure 21). However, in Greece there was a lower median level for the morning sample.
0
5
10
15
20
Cortisol level nmol/l
Morning Lunch Evening
Time of day
Sweden The NetherlandsGermany The United KingdomItaly Greece
0
5
10
15
20
Cortisol level nmol/l
Morning Lunch Evening
Time of day
Sweden The NetherlandsGermany The United KingdomItaly Greece
0
1
2
3
4
5
%
0 20 40 60 80 100
nmol/l Cortisol morning value
0
1
2
3
4
5
%
0 20 40 60 80 100
nmol/l Cortisol morning value
Figure 21. Median saliva cortisol level for each country for morning, lunch and evening saliva samples in six European countries.
Figure 20. Distribution of cortisol for morning saliva samples from 439 participants exposed to aircraft noise in six European countries.
29
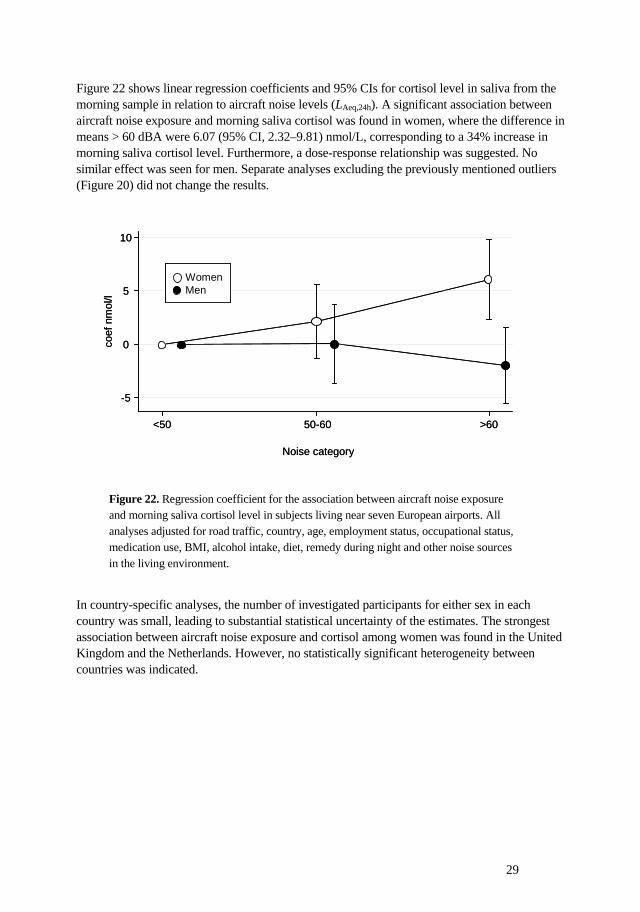
Figure 22 shows linear regression coefficients and 95% CIs for cortisol level in saliva from the morning sample in relation to aircraft noise levels (LAeq,24h). A significant association between aircraft noise exposure and morning saliva cortisol was found in women, where the difference in means > 60 dBA were 6.07 (95% CI, 2.32–9.81) nmol/L, corresponding to a 34% increase in morning saliva cortisol level. Furthermore, a dose-response relationship was suggested. No similar effect was seen for men. Separate analyses excluding the previously mentioned outliers (Figure 20) did not change the results. In country-specific analyses, the number of investigated participants for either sex in each country was small, leading to substantial statistical uncertainty of the estimates. The strongest association between aircraft noise exposure and cortisol among women was found in the United Kingdom and the Netherlands. However, no statistically significant heterogeneity between countries was indicated.
Figure 22. Regression coefficient for the association between aircraft noise exposure and morning saliva cortisol level in subjects living near seven European airports. All analyses adjusted for road traffic, country, age, employment status, occupational status, medication use, BMI, alcohol intake, diet, remedy during night and other noise sources in the living environment.
-5
0
5
10
coef
nmol
/l
<50 50-60 >60
Noise category
WomenMen
-5
0
5
10
coef
nmol
/l
<50 50-60 >60
Noise category
WomenMen
30
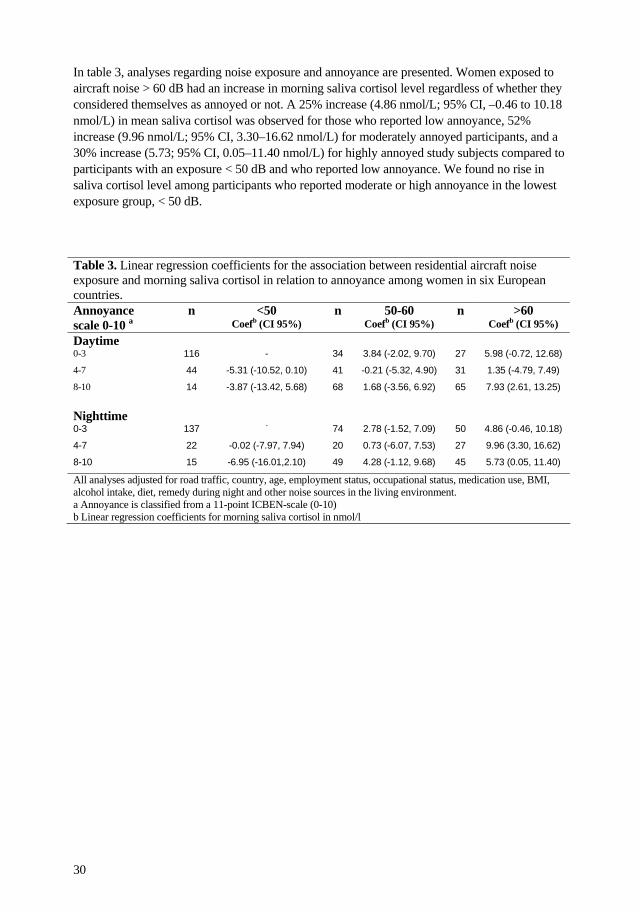
In table 3, analyses regarding noise exposure and annoyance are presented. Women exposed to aircraft noise > 60 dB had an increase in morning saliva cortisol level regardless of whether they considered themselves as annoyed or not. A 25% increase (4.86 nmol/L; 95% CI, –0.46 to 10.18 nmol/L) in mean saliva cortisol was observed for those who reported low annoyance, 52% increase (9.96 nmol/L; 95% CI, 3.30–16.62 nmol/L) for moderately annoyed participants, and a 30% increase (5.73; 95% CI, 0.05–11.40 nmol/L) for highly annoyed study subjects compared to participants with an exposure < 50 dB and who reported low annoyance. We found no rise in saliva cortisol level among participants who reported moderate or high annoyance in the lowest exposure group, < 50 dB. Table 3. Linear regression coefficients for the association between residential aircraft noise exposure and morning saliva cortisol in relation to annoyance among women in six European countries. Annoyance scale 0-10 a
n <50 Coefb (CI 95%)
n 50-60 Coefb (CI 95%)
n >60 Coefb (CI 95%)
Daytime 0-3 116 - 34 3.84 (-2.02, 9.70) 27 5.98 (-0.72, 12.68)
4-7 44 -5.31 (-10.52, 0.10) 41 -0.21 (-5.32, 4.90) 31 1.35 (-4.79, 7.49)
8-10 14 -3.87 (-13.42, 5.68) 68 1.68 (-3.56, 6.92) 65 7.93 (2.61, 13.25)
Nighttime 0-3 137 - 74 2.78 (-1.52, 7.09) 50 4.86 (-0.46, 10.18)
4-7 22 -0.02 (-7.97, 7.94) 20 0.73 (-6.07, 7.53) 27 9.96 (3.30, 16.62)
8-10 15 -6.95 (-16.01,2.10) 49 4.28 (-1.12, 9.68) 45 5.73 (0.05, 11.40)
All analyses adjusted for road traffic, country, age, employment status, occupational status, medication use, BMI, alcohol intake, diet, remedy during night and other noise sources in the living environment. a Annoyance is classified from a 11-point ICBEN-scale (0-10) b Linear regression coefficients for morning saliva cortisol in nmol/l
31
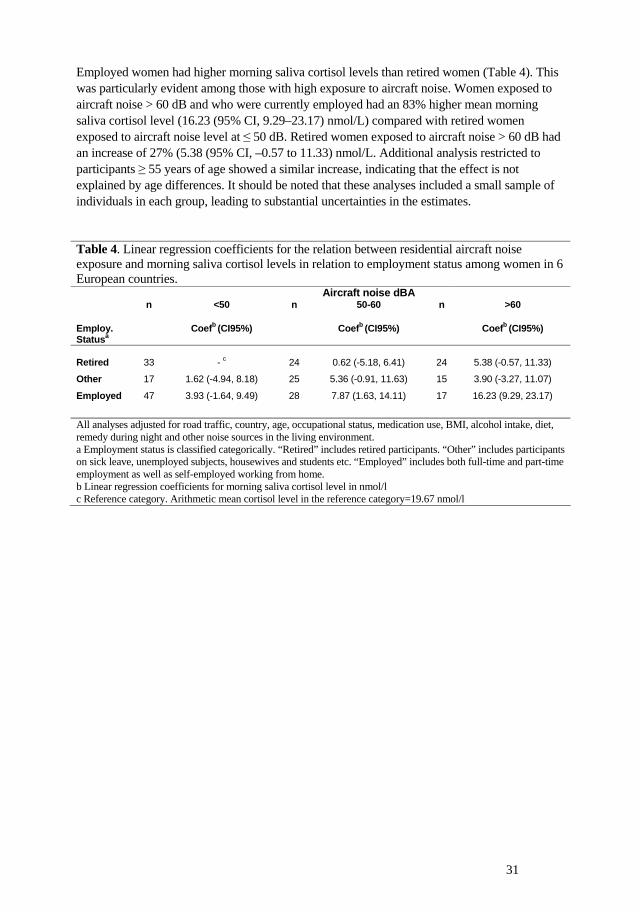
Employed women had higher morning saliva cortisol levels than retired women (Table 4). This was particularly evident among those with high exposure to aircraft noise. Women exposed to aircraft noise > 60 dB and who were currently employed had an 83% higher mean morning saliva cortisol level (16.23 (95% CI, 9.29–23.17) nmol/L) compared with retired women exposed to aircraft noise level at ≤ 50 dB. Retired women exposed to aircraft noise > 60 dB had an increase of 27% (5.38 (95% CI, –0.57 to 11.33) nmol/L. Additional analysis restricted to participants ≥ 55 years of age showed a similar increase, indicating that the effect is not explained by age differences. It should be noted that these analyses included a small sample of individuals in each group, leading to substantial uncertainties in the estimates. Table 4. Linear regression coefficients for the relation between residential aircraft noise exposure and morning saliva cortisol levels in relation to employment status among women in 6 European countries. Aircraft noise dBA n <50 n 50-60 n >60
Employ. Statusa
Coefb (CI95%) Coefb (CI95%) Coefb (CI95%)
Retired 33 - c 24 0.62 (-5.18, 6.41) 24 5.38 (-0.57, 11.33)
Other 17 1.62 (-4.94, 8.18) 25 5.36 (-0.91, 11.63) 15 3.90 (-3.27, 11.07)
Employed 47 3.93 (-1.64, 9.49) 28 7.87 (1.63, 14.11) 17 16.23 (9.29, 23.17)
All analyses adjusted for road traffic, country, age, occupational status, medication use, BMI, alcohol intake, diet, remedy during night and other noise sources in the living environment. a Employment status is classified categorically. “Retired” includes retired participants. “Other” includes participants on sick leave, unemployed subjects, housewives and students etc. “Employed” includes both full-time and part-time employment as well as self-employed working from home. b Linear regression coefficients for morning saliva cortisol level in nmol/l c Reference category. Arithmetic mean cortisol level in the reference category=19.67 nmol/l
32
5 DISCUSSION 5.1 GENERAL DISCUSSION
The overall objective of this thesis was to examine the association between residential traffic noise exposure and cardiovascular disease. Our findings provide evidence supporting an increased risk of MI, hypertension and elevated levels of cortisol associated with traffic noise exposure at the residence in line with previous studies [3, 4, 38]. In the SHEEP-study an increased risk of MI was indicated, with a suggestive dose-response trend. This increased risk was observed in as low levels as >/< 50 dBA in contrast to the studies by Beelen and Babisch, that observed an effect in higher categories of noise exposure [33, 34]. In the presence of other environmental stressors, such as job strain and occupational noise exposure the risk of MI associated with road traffic noise exposure increased. The highest risk was seen among participants with all three exposures, indicating that each exposure has the potential to increase the risk of MI. This gives further support for the hypothesis that traffic noise increases the risk of MI. Associations between occupational noise exposure or job strain in relation to MI have been observed in previous investigations [9, 11, 61-63]. However, no previous study has investigated the relationship between all three risk factors in association with MI. In the HYENA-study an increased risk of hypertension was suggested in participants with outside exposure to aircraft noise at night of more than 40 dB. This is in line with previous studies observing an association between aircraft noise exposure and hypertension [28, 64]. In addition, an increased risk of MI in relation to traffic noise exposure in the SHEEP-study was found in participants who reported annoyance by traffic noise mainly in the bedroom. Earlier studies have suggested an association between sleep disturbance and an increased risk of myocardial infarction [65, 66] as well as between sleep disturbance and stress [67, 68], indicating that the stress-related effect regarding noise exposure at night may be mediated by sleep disturbance. An increased level of cortisol was found in morning saliva among women exposed to high levels of aircraft noise. Previous studies regarding traffic noise and cortisol have been inconclusive [3, 37, 38, 45, 46, 69, 70] However, they often included few subjects or did not keep a strict time-line to capture the cortisol level at a specific time-point during the first morning hour. According to a review by Chida et al, that indicated an increase in morning saliva cortisol level among subjects exposed to job strain, assessment of morning cortisol level is a more appropriate measure for assessing HPA-activation following awaking then repeated measurements during the day [71]. This might also be relevant for noise research. Previous studies regarding traffic noise have suggested that the causal pathway behind the association between traffic noise exposure and MI involves annoyance [4]. It is therefore of interest that the associations between aircraft noise exposure and morning saliva cortisol level was not affected by the degree of annoyance. Furthermore, in another part of the HYENA-study, not included in the thesis, the association between traffic noise and acute blood pressure change during sleep was investigated. A significant increase in blood pressure was observed in relation
33
to noise exposure events LAmax >35dB indoor [25]. This increase in blood pressure was evident in relation to aircraft noise, road traffic noise and other indoor noise sources. This suggests a direct effect of noise on blood pressure not mediated by annoyance. The overall correlation between traffic noise exposure and air pollution from traffic was high (r=0.6). It varied between different parts of the county indicating a higher correlation along roads with a high amount of traffic in the city center. This is not surprising since both models are more accurate at high levels of exposure. In addition, at lower levels of exposure in the suburbs other factors, such as topography, prevailing wind direction and presence of obstacles may be more influential. The overall correlation measure might therefore depend on how many of the study participants that live close to roads with a high amount of traffic. In previous studies the correlation between traffic noise and air pollution has varied [70, 72, 73], from low (r=0.32) to high (r=0.89). Several large epidemiological studies have indicated an association between air pollution and MI [74, 75]. However, in our study there was no statistically significant association between air pollution and MI after adjustment for traffic noise exposure and the estimates for the association between road traffic noise and myocardial infarction did not appear to be affected by adjustments for air pollution. No interaction effect between road traffic noise exposure and air pollution in association with MI was found. It should be pointed out that because of the comparatively high correlation between exposure to air pollution and noise from traffic it is difficult to independently assess the effect of each factor and to evaluate interactions. The estimate for the association between road traffic noise exposure and myocardial infarction increased and became statistically significant after exclusion of participants living within 200 meters from a railway track. This change in estimate indicates that railway traffic noise may have confounded the estimates. Studies regarding railway noise and cardiovascular endpoints are few [30], but effects of railway noise, such as annoyance and sleep disturbance, are well-documented [76-78]. In our study we lacked sufficient precision in the estimation of railway noise exposure and we were therefore unable to investigate the association between railway traffic noise and myocardial infarction or properly adjust for railway noise exposure in the analyses regarding road traffic. In paper II all analysis were performed on study participants who lived further away than 200m from a railway track (88% of the study population). While, the estimate for the association between road traffic noise exposure and myocardial infarction changed when excluding participants living close to a railway track, the estimates for job strain or occupational noise exposure remained the same. Diabetes mellitus was included as a covariate in the regression model in paper I since it changed the estimate with 10%. However, because of a growing suspicion that diabetes mellitus may constitute an intermediate step in the causal chain between noise exposure and cardiovascular disease, it was not included in the regression model in paper II. Some studies suggest that stress is related to development of the metabolic syndrome [15, 18], and might thus also affect diabetes occurrence, which is a risk factor for cardiovascular disease. The estimates in our study with regard to noise and MI did not change markedly when including diabetes in the model and our conclusions would have remained the same. The risk of MI in relation to road traffic noise exposure appeared to be similar in men and women. However, our results on hypertension pointed to a difference in risk between men and

34
women with regard to road traffic noise exposure, but not for aircraft noise exposure. In addition, an association between aircraft noise and cortisol was only suggested among women. This difference in risk between men and women is difficult to explain and previous studies regarding traffic noise exposure in relation to hypertension or myocardial infarction have been inconclusive regarding sex differences [28, 33, 79, 80]. It is also of interest that women who were employed had a higher cortisol level than did retired women. We found a particularly strong increase in employed women exposed to high levels of aircraft noise. This effect could be a result of disrupted sleep during night and the lack of recovery during the day due to employment. It can also be a result of stressful activities related to employment [81-84] combined with aircraft noise exposure at home.
35
5.2 METHODOLOGICAL CONSIDERATIONS
Even though the findings in this thesis suggest an increased risk of cardiovascular disease in relation to traffic noise exposure, the estimates indicate a modest increase in risk, vulnerable to chance findings and residual confounding, and with weak or inconsistent dose-response. This thesis is based on two observational studies with different study designs, one cross-sectional and one case-control study. A major strength of the case-control study was the extensive assessment of road-traffic noise exposure, occupational noise exposure, job strain and air pollution. The detailed road-traffic noise exposure and air pollution assessment for all addresses since 1970 made it possible to estimate the exposure for a longer period (22-24 years) than in previous longitudinal studies[4]. The extensive job exposure matrix covering 320 occupations and based on up to 35 different measurements per occupation enabled a thorough exposure classification of occupational noise exposure. A well-defined and validated method of assessing job strain used in many earlier studies was used [12, 53]. However, in all observational studies errors occur and they can be divided in to systematic and random errors. 5.2.1 Systematic error Systematic error is usually referred to as bias. It does not depend on study size or chance, instead it is a methodological error that is introduced when you select your study participants, determine your outcome or assess the exposure under study. An estimate that has little systematic error may be described as valid. Systematic error can be divided into three categories: selection bias, information bias and confounding. 5.2.1.1 Selection bias
Selection bias occurs when the association between exposure and outcome differs among those who participate in the study and those who do not. In the case-control study SHEEP, the different sources of case identification, the strict diagnostic criteria and the high autopsy rate contributed to a high reliability of case identification. This minimized the risk of self-selection, since a very large part of cases of first event MI in Stockholm County were probably included. The controls were sampled randomly from the population matched on age, sex and catchment area. The high response rate and the fact that the response rate did not differ across case-control status, age or hospital catchment area further minimized the risk of selection bias. In the cross-sectional study HYENA, the well trained nurses, the validated automatic blood pressure device and the use of a mean level of two measurements for each participant contributed to a high reliability of case identification. However, the low response rate in some countries may have introduced a selection bias. The non-responder analysis showed no difference in the prevalence of self reported hypertension between responders and non-responders or difference in aircraft noise exposure. However, a difference in exposure to road traffic noise among responders and non-responders was suggested, indicating a lower response rate among individuals exposed to high levels of road traffic noise. This could have contributed to the low noise exposure contrast in our study for road traffic noise, making it more difficult to observe an association with hypertension or cortisol.
36
5.2.1.2 Information bias
Information bias occurs when the collected information regarding study participants is faulty and the participants are categorized incorrectly. Such misclassification can be divided into differential and non-differential misclassification. Differential misclassification occurs when the misclassification of exposure is different among those with and without the disease. Likewise, it is also present when misclassification of disease is different among those with and without the exposure. Differential misclassification can either exaggerate or underestimate an effect. In non-differential misclassification, the misclassification does not differ between exposed or unexposed or those with or without a disease. This bias may lead to a diluted effect estimate. In SHEEP, the exposure to traffic noise was not determined until after the original data collection and it could not have influenced the diagnosis. Therefore, differential misclassification of disease appears unlikely. As previously described, the different sources of case identification, the strict diagnostic criteria and the high autopsy rate contributed to a high reliability of case identification. This minimized the risk of non-differential misclassification of disease. In HYENA, the procedure regarding recruitment, case identification and exposure assessment was the same for exposed and unexposed participants. However, it can not be completely ruled out that the staff differed in their procedure regarding the blood pressure measurement and the questionnaire-based interviews in exposed and unexposed individuals, since they were not blinded to exposure status. Therefore differential misclassification of disease and exposure to cardiovascular risk factors may exist. The cortisol assessment was performed in the lab, blinded to exposure status and the assessment of cortisol level could therefore not have been influenced by exposure status, and thereby misclassification of outcome was not likely in the cortisol part of the study. In case-control studies, differential misclassification of exposure due to recall bias is always a concern. In SHEEP the exposure assessment of traffic noise, occupational noise and air pollution were performed with objective calculation models, not influenced by case-control status, and thereby not affected by recall bias. However, the assessment of job strain was based on questionnaire data after disease onset and can therefore be affected by bias. However, a previously published analysis regarding the subjective measures with inferred measures as standards indicated a high validity in the exposure assessment of job strain, particularly regarding decision latitude, making differential misclassification due to recall bias less likely [53] Road traffic noise exposure in the SHEEP study was assessed by the use of a simplified calculation model and even though this model was found to be of high validity, it is less precise than the full calculation model. In the smallest roads that lacked information regarding traffic flow and speed, imputed values were applied. In addition, road traffic noise exposure was assessed in reference to the façade of the house with the highest amount of exposure. This may differ from the true exposure, especially regarding apartment buildings where the location of the apartment was not established. This misclassification would be expected to primarily result in non-differential misclassification of exposure, leading to a dilution of the associations. In SHEEP, misclassification of exposure should also be considered regarding occupational noise exposure. The job-exposure matrix is a simplified assessment and in order to obtain a more
37
precise estimation an individual assessment of occupational noise exposure has to be performed. However, a similar approach with a job exposure matrix has been used in earlier studies and was found to be of high validity [85]. Any possible imprecision in exposure assessment would primarily lead to attenuation of the effect estimates. In HYENA, the exposure assessment regarding aircraft noise exposure was of high validity and assessed with the same calculation model, in all counties except in The United Kingdom. However, the road traffic assessment was made with different calculation models in most countries and in United Kingdom, road traffic noise could only be assessed in 5 dB-categories. Therefore, substantial non-differential misclassification of road traffic noise exposure is probably present, and may partly explain the lack of association between road traffic noise and hypertension or saliva cortisol levels. The exposure assessment to aircraft noise and road traffic noise was made blinded to outcome status and differential misclassification of exposure was therefore minimized. 5.2.1.3 Confounding
Confounding is present when an observed association between exposure and outcome is distorted due to an extraneous factor that have been mistaken for or mixed with the actual exposure effect. It could lead to an overestimation or an underestimation of the true effect. In order to be classified as a confounder the variable has to have an association with both exposure and outcome. When studying the association between traffic noise and cardiovascular disease, air pollution is always referred to as a potential confounder since it is correlated with noise exposure from road traffic and has been established as a risk factor for cardiovascular disease. However, in our study air pollution had no major effect on the estimates, primarily because of a weak effect on its own. Residual confounding has to be considered even if several known risk factors for cardiovascular disease were included in the different analyzes. It is of less concern in studies involving a high increase in risk. However, in our studies the risk associated with cardiovascular endpoints was small, increasing the possibility of residual confounding affecting the estimates. 5.2.2 Random error
Random error is the variability in the data. It is sometimes a result of chance that can be solved with bigger study sizes, but usually random errors are not strictly due to chance and can thereby be eliminated with better information. A study with a small random error can be described as a study with high precision. Both SHEEP and HYENA had a comparatively high number of participants, leading to random errors of minor importance. However, subgroup analyzes such as several exposure classes, may lead to considerable statistical uncertainty in each group. Furthermore, in the cortisol part of the HYENA study, only 439 participants were recruited. This low number of study participants might introduce random error due to chance and lead to a greater uncertainty regarding the estimates.
38
6 CONCLUSIONS The findings in this thesis provide evidence supporting an association between long-term traffic noise exposure at the residence and cardiovascular disease. However, the results show a modest increase in risk, vulnerable to chance findings and a clear overall dose-response result is lacking.
• We found an increased risk of myocardial infarction (MI) following residential exposure to noise from road traffic, particularly after exclusion of those with noise exposure from other sources (to reduce exposure misclassification) or hearing loss. Together with earlier evidence this points to exposure to noise from traffic as a possible risk factor for MI.
• There was a correlation between exposure to air pollution and noise from road traffic.
However, the association between road traffic noise and MI did not seem to be affected by air pollution, primarily because of a weak relation between air pollution and MI. The confounding effect by air pollution on the relationship between traffic noise and MI (and vice versa) is study specific. It depends on the correlation between the two exposures, which may differ between highly trafficked streets in city centers and streets in other areas, as well as on the risk associated with either exposure.
• A particularly high risk was observed in subjects exposed to both traffic and
occupational noise as well as job strain. This indicates that combined exposure to several environmental stressors may be especially harmful. Although these data need confirmation, it provides some guidance for prioritization of preventive measures.
• Our findings suggest that exposure to aircraft noise may increase the risk of
hypertension, even though a clear dose-response relationship was lacking. For road traffic noise an increased risk was seen only in men. Considering also earlier evidence there seems to be substantial support for traffic noise, particularly from aircraft, as a risk factor for hypertension.
• We saw an increased saliva cortisol level in women related to aircraft noise exposure,
while no corresponding association was observed among men. The reason for the apparent sex difference is unclear, but it is supported by some earlier data. An increased saliva cortisol level related to noise exposure indicates a stress response, and a potential pathway for cardiovascular effects induced by noise.
39
7 FUTURE RESEARCH Finding an association you believe are there can be difficult. It has sometimes been compared with the situation when you trying to tune in a radio station on an old transistor radio. It will take some time before you can hear the radio station loud and clear. We are not there yet regarding the association between traffic noise at the residence and cardiovascular disease. Through the static we can hear people talk, but we can not yet make out what they are saying. We believe we have found an association, but we can not yet establish at what noise levels an increase in risk occurs and what the true dose-response relationship looks like. Further, we can not yet completely rule out that the talking is coming from a different radio station. We need many more high qualitative studies that investigate the association between long-term exposure to traffic noise at the residence and cardiovascular disease. As a consequence of the EU-directive on environmental noise (Directive, 2002/49/EC, 2002), every country has to produce noise maps showing the distribution of traffic noise in all major cities before 2012. This will contribute to an easier access to qualitative noise data and increase the possibility of conducting health related noise studies. Further research regarding how the association between traffic noise and cardiovascular disease is affected by traffic generated air pollution and vice versa is also needed. Probably they both have an association with cardiovascular disease, but there is still a possibility that one exposure is confounding the estimates for the other. Since an association between traffic noise exposure and cortisol has been suggested, it is not far fetched that an association between traffic noise and diabetes/ metabolic syndrome may also exist. This association should be investigated in future studies.
40
8 SAMMANFATTNING PÅ SVENSKA Trafikbuller är ett ökande problem i storstadsområden över hela världen, men kunskaperna om hälsoeffekter kopplade till trafikbuller vid bostaden är mycket ofullständiga. Tidigare studier tyder på att buller ger upphov till en stressreaktion i kroppen som i slutändan kan leda till en ökad risk för hjärt-kärlsjukdom. Andra faktorer som buller och stress på arbetet har även de associerats till hjärt-kärlsjukdom, men hur dessa samverkar med trafikbuller har inte tidigare undersökts. Dessutom är sambanden mellan buller och luftföroreningar i relation till hjärt-kärlsjukdom bristfälligt utredda. Syftet med denna avhandling var att undersöka sambandet mellan trafikbuller i bostaden och hjärt-kärlsjukdom. Ett ytterligare syfte var att undersöka hur detta samband påverkas av andra miljöfaktorer såsom luftföroreningar, yrkesbuller och yrkesstress. Denna avhandling bygger på en fall-kontroll studie samt en tvärsnittsstudie. Fall-kontrollstudien genomfördes 1992-1994 i Stockholms län. Personer som drabbats av hjärtinfarkt och inkom till något av akutsjukhusen i Stockholms län eller återfanns i register under samma tidsperiod, rekryterades till studien. Kontroller valdes ur befolkningen matchade för ålder, kön och upptagningsområde. Deltagarna svarade på en enkät och genomgick en hälsoundersökning. En exponeringsbedömning av trafikbuller, luftföroreningar samt yrkesbuller mellan 1970 och 1992-94 genomfördes. Yrkesstress definierades genom svar på specifika frågor i frågeformuläret. Vi fann en ökad risk för hjärtinfarkt hos personer exponerade för vägtrafikbuller i bostaden. Denna risk var extra hög hos personer som exponerats för en kombination av trafikbuller, yrkesbuller och yrkesstress. Sambandet mellan vägtrafikbuller och hjärtinfarkt påverkades inte av exponering för luftföroreningar. Tvärsnittstudien genomfördes i sex europeiska länder och syftade till att undersöka sambandet mellan flygbuller och hjärt-kärlsjukdom. Alla deltagare intervjuades hemma av en sjuksköterska, som även mätte blodtrycket. Vi fann en ökad risk för hypertoni kopplat till flygtrafikbuller nattetid. Ett urval av studiepersonerna fick även lämna salivprover för bestämning av nivån av stresshormonet kortisol. En ökning av kortisolnivåerna i relation till flygbullerexponering observerades bland kvinnor, men inga tydliga samband sågs hos män. Sammanfattningsvis ger våra resultat stöd för att långtidsexponering för vägtrafikbuller i bostaden kan öka risken för hjärtinfarkt. En kombination av vägtrafikbuller, yrkesbuller och yrkesstress ökade risken märkbart. Dessutom antyddes en ökad risk för högt blodtryck och höga morgonvärden av kortisol hos personer utsatta för flygtrafikbuller.
41
9 ACKNOWLEDGEMENTS Many family members, friends and co-workers have contributed to this thesis, I will here take a moment to try and thank you all. I would especially like to thank my main supervisor Göran Pershagen for the opportunity to become a PhD-student in your research group, for believing in me, for valuable advice, support and guidance and for great patience during my two maternity leaves. I have really learned a lot in your research group. I would also like to thank my co-supervisor Mats E Nilsson for your support, knowledge and your positive attitude. Thank you for always listening and for being so helpful, even when you have a lot to do. I further would like to thank my mentor Gösta Bluhm for valuable knowledge in the cardiovascular field and for always being updated on the latest publications, but mostly for being so kind and understanding. I have really enjoyed working with all three of you. Thank you!!! I would also like to thank my wonderful co-workers for making my work so much easier. Thank you Charlotta Eriksson for your support and for all the laughters, Eva Undsén for all your expertise and helpfulness Anna Bergström for great advise in both the epidemiological and “parental” field, Svietlana Panasevic for always smiling, Michal Korek for your positive and inspiring energy, Jessica Öhman for good company, Johanna Penell for all the nice conversations and Anna Sidorchuk for your kindness. I would also like to thank all the other wonderful co-workers: Fredrik Nyberg, Olena Gruzieva, Saskia Willers, Magnus Wickman, Åsa Neuman, Anna Undeman Asarnoj, Anna Gref, Anna Bessö, Susanna Larsson, Camilla Olofsson, Niclas Håkansson, Susanne Rautiainen, Ann Burgaz, Bettina Julin, Agneta Åkesson, Alicja Wolk, Jin-Jin Zheng, Mimi Danielsson, Laura Thomas, Heather Jonasson, Daniela Di Giuseppe and Nicola Orsini (for valuable STATA advice). Finally, thank you Helen Rosenlund for making my dissertation process so much easier, I am grateful for all the support and for your kindness. Thank you Birgitta Ohlander, Eva Thunberg, Lisbeth Eriksson and Eva Hessleryd for all the help with the data collection and for being such kind and thoughtful co-workers. Thank you Åsa Wikman, Annika Strangert, Rebecka Pershagen and Anna Ohlander for all the help with the data-entry and for being so nice. Thank you all the members of my old journal club, for valuable and interesting discussions about epidemiology Henrik Källberg, Maria-Pia Hergens, Eva Skillgate, Annette Wigertz, Lena Holm and Mats Halldin. Thank you all co-workers in the International Strategy group (IS-gruppen) at KI for informative meetings Jenny Löfgren, Clara Hellner Gumpert, Anna Beijmo, Anna-Lena Paulson, Gunilla
42
Norhagen, Vinod Diwan, Nancy Pedersen, Jan Ygge and Sabina Bossi. I have really learned a lot about KIs international work. Thank you my co-authors Töres Theorell and Johan Hallqvist for your expertise and kindness. I would also like to thank all the other co-authors for your knowledge and improvement to my papers Lars Järup, Wolfgang Babisch, Danny Houthuijs, Wim Swart, Oscar Breugelmans, Federica Vigna-Tagliante, Marie-Louise Dudley, Klea Katsouyanni, Alexandros Haralabidis Konstantina Dimakopoulou, Ennio Cadum, and all the rest of the HYENA-study team, Pernilla Willix, Gun Nise, Mats Rosenlund and Magnus Lindqvist, Thank you Annika Gustavsson for always helping me with the SHEEP-data. Thank you Ylva Rodvall for your kindness, your positive personality, and for all support. Thank you Hanna Hultin for great company during the physiology course. Thank you Anna Persson and all the other personnel at the IMM-administration for helping me during these years. Thank you all personnel at the municipalities in Stockholm County, the Swedish Road Administration and the LFV-group – Swedish airports and air navigation services for maps, traffic counts and speed data so that we were able to perform the noise exposure assessment in the studies. Thank you all participants in the HYENA and SHEEP study for your valuable contribution. Last but not least, thank you all friends and family. Thank you Hanna and Filip for all the laughter’s. Hanna, thank you for your endless positive energy and Filip, thank you for your great insights. Thank you Anna, for being so kind and Frida and Ester for being so sweet, and Pelle for a new friendship. Thank you Linda, Ronny, Erik and Emma for all your support and friendship. I am very happy to have you as my friends. I can always talk to you about everything, Linda, and you always make me feel better. Thank you Emilie, Johan, Viktor and Kasper for your friendship. Emilie, it is so nice to talk to you and thank you for your support and pep-talks. Thank you Sanna, my oldest friend, for being you and for our endless talks about everything. Thank you Terese, John, Alva, Paul and Mark as well as Bella, Henrik, Benjamin and Aaron for being such wonderful neighbors, it made our move to Täby so much easier and thank you John for the wonderful drawing on the cover. Thank you Inger for taking such good care of my children and for always being so positive and inspiring.
43
Thank you my dearest sister, Maria, for being you and for all the wonderful times we have shared together, for your support and friendship and for always providing a stress-free environment. Thank you Jimmy for your kindness and support and thank you my sweet nieces Amanda, Jonna and Fanny, you will always be my perfect little princesses. Thank you Maja, my cousin, for being my “extra sister”. Thank you for always caring. Thank you Fredrik for your kindness and little Axel for being so sweet. Thank you all my others cousins Emma, Erik and Karin and my uncles Bengt and Anders and their wives for your kindness. Thank you my mother Kerstin for being such a great role-model and for believing in me always. I would not have made it this far without your endless love and support. Thank you my Father Jan and my half-brothers Joakim, Jerry and Jimmy for being so kind. It is so nice to spend time with you all. Thank you my mother-in-law Ylva for your kindness and support and for your friendship. I really enjoy spending time with you. Thank you my father-in-law Rolf and Lena for your support and for your thoughtfulness. Thank you my sister-in-law Marianne and her family Björn, Elinor and Erik for being so kind and generous. Thank you my-brother-in-law Andreas and his family Artemis, Miron and Ira for your kindness. Finally, most of all thank you my wonderful husband Lennarth for all your endless love and support. You are the love of my life. Thank you my dearest sweetest sons Martin and Gustav. I am so happy that I got the honor of being your mother.
44
10 REFERENCES 1. WHO, Guidelines for Community Noise. 2000, World Health Organisation: Geneva. 2. WHO, Night noise guidelines for Europe. 2009: Copenhagen. 3. Ising, H. and B. Kruppa, Health effects caused by noise: evidence in the literature from
the past 25 years. Noise Health, 2004. 6(22): p. 5-13. 4. Babisch, W., Transportation noise and cardiovascular risk: updated review and
synthesis of epidemiological studies indicate that the evidence has increased. Noise Health, 2006. 8(30): p. 1-29.
5. WHO, Global burden of disease, Part 2 Causes of death. 2004. 6. WHO - Colin Mathers, T.T., Stephen Begg, Toshi Satoh, Global burden of ischaemic
heart disease in the year 2000. 2004. 7. Lakhani, D., Finlayson, Basic Pathology. 4th edition ed. 2009, London: Hoddler Arnold. 8. Theorell, T., et al., Changes in job strain in relation to changes in physiological state. A
longitudinal study. Scand J Work Environ Health, 1988. 14(3): p. 189-96. 9. Theorell, T. and R.A. Karasek, Current issues relating to psychosocial job strain and
cardiovascular disease research. J Occup Health Psychol, 1996. 1(1): p. 9-26. 10. Belkic, K., et al., The workplace and cardiovascular health: conclusions and thoughts
for a future agenda. Occup Med, 2000. 15(1): p. 307-21, v-vi. 11. Belkic, K.L., et al., Is job strain a major source of cardiovascular disease risk? Scand J
Work Environ Health, 2004. 30(2): p. 85-128. 12. Hallqvist, J., et al., Is the effect of job strain on myocardial infarction risk due to
interaction between high psychological demands and low decision latitude? Results from Stockholm Heart Epidemiology Program (SHEEP). Soc Sci Med, 1998. 46(11): p. 1405-15.
13. Währborg, P., Stress och den nya ohälsan. 2002: Natur och Kultur. 14. Theorell, T., On biochemical and physiological indicators of stress relevant to
cardiovascular illness. Eur Heart J, 1988. 9(6): p. 705-8. 15. Kyrou, I., G.P. Chrousos, and C. Tsigos, Stress, visceral obesity, and metabolic
complications. Ann N Y Acad Sci, 2006. 1083: p. 77-110. 16. Rosmond, R. and P. Bjorntorp, The hypothalamic-pituitary-adrenal axis activity as a
predictor of cardiovascular disease, type 2 diabetes and stroke. J Intern Med, 2000. 247(2): p. 188-97.
17. Rosmond, R., Stress induced disturbances of the HPA axis: a pathway to Type 2 diabetes? Med Sci Monit, 2003. 9(2): p. RA35-9.
18. Ljung, T., et al., The activity of the hypothalamic-pituitary-adrenal axis and the sympathetic nervous system in relation to waist/hip circumference ratio in men. Obes Res, 2000. 8(7): p. 487-95.
19. Dallman, M.F., Stress update Adaptation of the hypothalamic-pituitary-adrenal axis to chronic stress. Trends Endocrinol Metab, 1993. 4(2): p. 62-9.
20. Chandola, T., E. Brunner, and M. Marmot, Chronic stress at work and the metabolic syndrome: prospective study. BMJ, 2006. 332(7540): p. 521-5.
21. Dahlgren, A., et al., Day-to-day variation in saliva cortisol--relation with sleep, stress and self-rated health. Biol Psychol, 2009. 82(2): p. 149-55.
22. Ising, H. and R. Michalak, Stress effects of noise in a field experiment in comparison to reactions to short term noise exposure in the laboratory. Noise Health, 2004. 6(24): p. 1-7.
23. Ising, H. and C. Braun, Acute and chronic endocrine effects of noise: Review of the research conducted at the Institute for Water, Soil and Air Hygiene. Noise Health, 2000. 2(7): p. 7-24.
24. Andren, L., Cardiovascular effects of noise. Acta Med Scand Suppl, 1982. 657: p. 1-45. 25. Haralabidis, A.S., et al., Acute effects of night-time noise exposure on blood pressure in
populations living near airports. Eur Heart J, 2008. 29(5): p. 658-64. 26. Chang, T.Y., et al., Effects of environmental noise exposure on ambulatory blood
pressure in young adults. Environ Res, 2009. 109(7): p. 900-5.
45
27. van Kempen, E.E., et al., The association between noise exposure and blood pressure and ischemic heart disease: a meta-analysis. Environ Health Perspect, 2002. 110(3): p. 307-17.
28. Eriksson, C., et al., Aircraft noise and incidence of hypertension. Epidemiology, 2007. 18(6): p. 716-21.
29. de Kluizenaar, Y., et al., Hypertension and road traffic noise exposure. J Occup Environ Med, 2007. 49(5): p. 484-92.
30. Barregard, L., E. Bonde, and E. Ohrstrom, Risk of hypertension from exposure to road traffic noise in a population-based sample. Occup Environ Med, 2009. 66(6): p. 410-5.
31. Bodin, T., et al., Road traffic noise and hypertension: results from a cross-sectional public health survey in southern Sweden. Environ Health, 2009. 8: p. 38.
32. Leon Bluhm, G., et al., Road traffic noise and hypertension. Occup Environ Med, 2007. 64(2): p. 122-6.
33. Babisch, W., et al., Traffic noise and risk of myocardial infarction. Epidemiology, 2005. 16(1): p. 33-40.
34. Beelen, R., et al., The joint association of air pollution and noise from road traffic with cardiovascular mortality in a cohort study. Occup Environ Med, 2009. 66(4): p. 243-50.
35. Miller, K.A., et al., Long-term exposure to air pollution and incidence of cardiovascular events in women. N Engl J Med, 2007. 356(5): p. 447-58.
36. Davies, H.W., et al., Occupational exposure to noise and mortality from acute myocardial infarction. Epidemiology, 2005. 16(1): p. 25-32.
37. Babisch, W., et al., Increased catecholamine levels in urine in subjects exposed to road traffic noise: the role of stress hormones in noise research. Environ Int, 2001. 26(7-8): p. 475-81.
38. Babisch, W., Stress hormones in the research on cardiovascular effects of noise. Noise Health, 2003. 5(18): p. 1-11.
39. Evans, G.W., et al., Community noise exposure and stress in children. J Acoust Soc Am, 2001. 109(3): p. 1023-7.
40. Maschke, C., Stress Hormone Changes in Persons exposed to Simulated Night Noise. Noise Health, 2003. 5(17): p. 35-45.
41. Miki, K., et al., Urinary and salivary stress hormone levels while performing arithmetic calculation in a noisy environment. Ind Health, 1998. 36(1): p. 66-9.
42. Pruessner, J.C., D.H. Hellhammer, and C. Kirschbaum, Burnout, perceived stress, and cortisol responses to awakening. Psychosom Med, 1999. 61(2): p. 197-204.
43. Schulz, P., et al., Increased free cortisol secretion after awakening in chronically stressed individuals due to work overload. Stress Med, 1998. 14: p. 91-97.
44. Hofman, L.F., Human saliva as a diagnostic specimen. J Nutr, 2001. 131(5): p. 1621S-5S.
45. Poll, R.V., M. Straetemans, and N.A. Nicolson. Ambient noise in daily life, a pilot study. in Internoise. 2001. Hague: Nederlands Akoestisch Genootschap.
46. Stansfeld, S.A., S.L. Brentnall, and M.M. Haines. Investigating the effects of noise exposure on stress hormone response in children. . in Internoise. 2001. Hague: Nederlands Akoestisch Genootschap.
47. Waye, K.P., et al., Effects of nighttime low frequency noise on the cortisol response to awakening and subjective sleep quality. Life Sci, 2003. 72(8): p. 863-75.
48. StockholmCountyCouncil, Behandlingsprogram för Danderyds sjukhus, Ersta sjukhus, Huddinge sjukhus, Karolinska sjukhuset, Löwenströmska sjukhuset, Nacka sjukhus, Norrtälje sjukhus, Sabbatsbergs sjukhus, S:t Görans sjukhus, Södersjukhuset, Södertälje sjukhus (In Swedish). 1990, Stockholm County Council: Stockholm.
49. Reuterwall, C., et al., Higher relative, but lower absolute risks of myocardial infarction in women than in men: analysis of some major risk factors in the SHEEP study. The SHEEP Study Group. J Intern Med, 1999. 246(2): p. 161-74.
50. Rosenlund, M., et al., Long-term exposure to urban air pollution and myocardial infarction. Epidemiology, 2006. 17(4): p. 383-90.
51. Nyberg, F., et al., Urban air pollution and lung cancer in Stockholm. Epidemiology, 2000. 11(5): p. 487-95.
52. Bellander, T., et al., Using geographic information systems to assess individual historical exposure to air pollution from traffic and house heating in Stockholm. Environ Health Perspect, 2001. 109(6): p. 633-9.
46
53. Theorell, T., et al., Decision latitude, job strain, and myocardial infarction: a study of working men in Stockholm. The SHEEP Study Group. Stockholm Heart epidemiology Program. Am J Public Health, 1998. 88(3): p. 382-8.
54. SwedishEPA, Vägtrafikbuller. Nordisk beräkningsmodell, reviderad 1996 [Road traffic noise. The Nordic calculation Method, revised 1996] (Swedish). 1996: Stockholm.
55. Edwards, C.G., et al., Occupational noise exposure and risk of acoustic neuroma. Am J Epidemiol, 2007. 166(11): p. 1252-8.
56. Jarup, L., et al., Hypertension and exposure to noise near airports (HYENA): Study design and noise exposure assessment. Environmental Health Perspectives, 2005. 113(11): p. 1473-1478.
57. Gulding, J., et al., Integrated Noise Model (INM) Version 6.0 User's guide. 1999, US Department of Transportation Federal Aviation Administration: Washington, DC.
58. Ollerhead, J., et al., The UK Civil Aircraft Noise Contour Model ANCON: Improvments in Version 2. 1999, Civil Aviation Authority TSO: Norwich.
59. WG-AEN, Good Practice Guide for Strategic Noise Mapping and the Production of Associated Data on Noise Exposure. 2006, European Commission Working Group Assessment of Exposure to Noise
60. Kirschbaum, C. and D.H. Hellhammer, Noise and Stress - Salivary Cortisol as a Non-Invasive Measure of Allostatic Load. Noise Health, 1999. 1(4): p. 57-66.
61. Chandola, T., et al., Work stress and coronary heart disease: what are the mechanisms? Eur Heart J, 2008. 29(5): p. 640-8.
62. Schnall, P.L., P.A. Landsbergis, and D. Baker, Job strain and cardiovascular disease. Annu Rev Public Health, 1994. 15: p. 381-411.
63. Pickering, T.G., Mental stress as a causal factor in the development of hypertension and cardiovascular disease. Curr Hypertens Rep, 2001. 3(3): p. 249-54.
64. Rosenlund, M., et al., Increased prevalence of hypertension in a population exposed to aircraft noise. Occup Environ Med, 2001. 58(12): p. 769-73.
65. Meisinger, C., et al., Sleep duration and sleep complaints and risk of myocardial infarction in middle-aged men and women from the general population: the MONICA/KORA Augsburg cohort study. Sleep, 2007. 30(9): p. 1121-7.
66. Wolk, R., et al., Sleep and cardiovascular disease. Curr Probl Cardiol, 2005. 30(12): p. 625-62.
67. Akerstedt, T., et al., Sleep disturbances, work stress and work hours: a cross-sectional study. J Psychosom Res, 2002. 53(3): p. 741-8.
68. Nordin, M., A. Knutsson, and E. Sundbom, Is disturbed sleep a mediator in the association between social support and myocardial infarction? J Health Psychol, 2008. 13(1): p. 55-64.
69. Bigert, C., G. Bluhm, and T. Theorell, Saliva cortisol--a new approach in noise research to study stress effects. Int J Hyg Environ Health, 2005. 208(3): p. 227-30.
70. Ising, H., et al., Low frequency noise and stress: bronchitis and cortisol in children exposed chronically to traffic noise and exhaust fumes. Noise Health, 2004. 6(23): p. 21-8.
71. Chida, Y. and A. Steptoe, Cortisol awakening response and psychosocial factors: a systematic review and meta-analysis. Biol Psychol, 2009. 80(3): p. 265-78.
72. Allen, R.W., et al., The spatial relationship between traffic-generated air pollution and noise in 2 US cities. Environ Res, 2009. 109(3): p. 334-42.
73. Davies, H.W., et al., Correlation between co-exposures to noise and air pollution from traffic sources. Occup Environ Med, 2009. 66(5): p. 347-50.
74. Routledge, H.C. and J.G. Ayres, Air pollution and the heart. Occup Med (Lond), 2005. 55(6): p. 439-47.
75. Vermylen, J., et al., Ambient air pollution and acute myocardial infarction. J Thromb Haemost, 2005. 3(9): p. 1955-61.
76. Miedema, H.M. and C.G. Oudshoorn, Annoyance from transportation noise: relationships with exposure metrics DNL and DENL and their confidence intervals. Environ Health Perspect, 2001. 109(4): p. 409-16.
77. Miedema, H.M. and H. Vos, Associations between self-reported sleep disturbance and environmental noise based on reanalyses of pooled data from 24 studies. Behav Sleep Med, 2007. 5(1): p. 1-20.
78. Ohrstrom, E., et al., Annoyance due to single and combined sound exposure from railway and road traffic. J Acoust Soc Am, 2007. 122(5): p. 2642-52.
47
79. Belojevic, G.A., et al., Nighttime road-traffic noise and arterial hypertension in an urban population. Hypertens Res, 2008. 31(4): p. 775-81.
80. Willich, S.N., et al., Noise burden and the risk of myocardial infarction. Eur Heart J, 2006. 27(3): p. 276-82.
81. Alderling, M., et al., The demand control model and circadian saliva cortisol variations in a Swedish population based sample (The PART study). BMC Public Health, 2006. 6: p. 288.
82. Lundberg, U., Stress hormones in health and illness: the roles of work and gender. Psychoneuroendocrinology, 2005. 30(10): p. 1017-21.
83. Maina, G., et al., [Sex specific differences in physiologic response to stress evaluated by means of salivary cortisol]. G Ital Med Lav Ergon, 2007. 29(3 Suppl): p. 359-60.
84. Rystedt, L.W., et al., The relationship between long-term job strain and morning and evening saliva cortisol secretion among white-collar workers. J Occup Health Psychol, 2008. 13(2): p. 105-13.
85. Davies, H.W., et al., A retrospective assessment of occupational noise exposures for a longitudinal epidemiological study. Occup Environ Med, 2009. 66(6): p. 388-94.
