traffic analysis toolbox volume viii: work zone …...traffic analysis toolbox volume viii: work...
TRANSCRIPT

Traffic Analysis Toolbox Volume VIII:Work Zone Modeling and Simulation—A Guide for Decision-Makers
PUBLICATION NO. FHWA-HOP-08-029 August 2008
Office of Operations1200 New Jersey Avenue, SE
Washington, DC 20590


i
ForewordWork zone planning and management has become increasingly challenging because of increasing travel demand and an aging roadway network infrastructure facing both more frequent maintenance and major rehabilitation projects. These two factors have sharpened interest in analytical tools to assist in better understanding projected work zone mobility impacts. An understanding of projected mobility impacts is critical for two reasons. First, the work zone planner/manager must be able to consider mobility impacts in a complex balance of life-cycle costs, safety, environmental, and other impacts. Second, mobility impact measures are used to support the analysis of other impacts (e.g., environmental impacts). This document is intended to provide guidance to decision-makers at agencies and jurisdictions considering the role of analytical tools in work zone planning and management. It is often unclear what kind of analytical approach may be of most value, particularly in light of complex data requirements and staff training. The decision to create an analytical capability to support decision making can be a significant investment, and deserves careful consideration. In the end, work zone analysis should never be used to make key decisions but instead developed as a trusted resource for understanding the potential mobility impacts and using this information to inform key decisions. This document serves as Volume VIII in the FHWA Traffic Analysis Toolbox. Preceding volumes in the toolbox include: Volume I: Traffic Analysis Tools Primer, Volume II: Decision Support Methodology for Selecting Traffic Analysis Tools, Volume III: Guidelines for Applying Traffic Microsimulation Modeling Software, Volume IV: Guidelines for Applying CORSIM Microsimulation Modeling Software, Volume V: Traffic Analysis Tools Case Studies - Benefits and Best Practices, Volume VI: Definition, Interpretation, and Calculation of Traffic Analysis Tools Measures of Effectiveness, and Volume VII: Predicting Performance with Traffic Analysis Tools: Case Studies.
Robert ArnoldDirectorOffice of Transportation Operations

ii
Notice
This document is disseminated under the sponsorship of the U.S. Department of Transportationin the interest of information exchange. The U.S. Government assumes no liability for the use ofthe information contained in this document.
The U.S. Government does not endorse products or manufacturers. Trademarks ormanufacturers’ names appear in this report only because they are considered essential to theobject of the document.
Quality Assurance Statement
The Federal Highway Administration (FHWA) provides high-quality information to serveGovernment, industry, and the public in a manner that promotes public understanding.Standards and policies are used to ensure and maximize the quality, objectivity, utility, andintegrity of its information. FHWA periodically reviews quality issues and adjusts its programsand processes to ensure continuous quality improvement.

iii
Technical Report Documentation Page
1. Report No. FHWA—HOP-08-029
2. Government Accession No. 3. Recipient's Catalog No.
5. Report Date July 2008
4. Title and Subtitle
Tra�c Analysis Tools Volume VIII: Work Zone Analysis—A Guide for Decision-Makers 6. Performing Organization Code
7. Author(s)
Matthew Hardy Karl Wunderlich, Ph.D
8. Performing Organization Report No.
10. Work Unit No. (TRAIS)9. Performing Organization Name and Address Noblis 600 Maryland Ave, SW Suite 755 Washington, DC 20024
11. Contract or Grant No.
13. Type of Report and Period Covered12. Sponsoring Agency Name and Address Federal Highway Administration O�ce of Operations Room E86-205 1200 New Jersey Avenue, SE Washington, DC 20590
14. Sponsoring Agency Code
15. Supplementary Notes
16. AbstractThis document is intended to provide guidance to decision-makers at agencies and jurisdictions considering therole of analytical tools in work zone planning and management. It is often unclear what kind of analyticalapproach may be of most value, particularly in light of complex data requirements and sta� training. Thedecision to create an analytical capability to support decision making can be a signi�cant investment, anddeserves careful consideration. In the end, work zone analysis should never be used to make key decisions butinstead developed as a trusted resource for understanding the potential mobility impacts and using thisinformation to inform key decisions.
This document serves as Volume VIII in the FHWA Tra�c Analysis Toolbox. Preceding volumes in the toolboxinclude: Volume I: Tra�c Analysis Tools Primer, Volume II: Decision Support Methodology for SelectingTra�c Analysis Tools, Volume III: Guidelines for Applying Tra�c Microsimulation Modeling Software,Volume IV: Guidelines for Applying CORSIM Microsimulation Modeling Software, and Volume V: Tra�cAnalysis Tools Case Studies - Bene�ts and Best Practices.17. Key Words
Work Zones, Modeling, Simulation, Tra�cAnalysis
18. Distribution Statement
No restriction. This document is available to the public from the sponsoring agency at the website http://www.ops.fhwa.dot.gov.
19. Security Classif. (of this report)Unclassi�ed
20. Security Classif. (of this page)Unclassi�ed
21. No. of Pages29
22. Price
Form DOT F 1700.7 (8-72) Reproduction of completed page authorized

iv
SI* (MODERN METRIC) CONVERSION FACTORSAPPROXIMATE CONVERSIONS TO SI UNITS
Symbol When You Know Multiply By To Find Symbol
LENGTHin inches 25.4 millimeters mmft feet 0.305 meters myd yards 0.914 meters mmi miles 1.61 kilometers km
AREAin
2square inches 645.2 square millimeters mm
2
ft2
square feet 0.093 square meters m2
yd2
square yard 0.836 square meters m2
ac acres 0.405 hectares hami
2square miles 2.59 square kilometers km
2
VOLUMEfl oz fluid ounces 29.57 milliliters mLgal gallons 3.785 liters Lft
3cubic feet 0.028 cubic meters m
3
yd3
cubic yards 0.765 cubic meters m3
NOTE: volumes greater than 1000 L shall be shown in m3
MASSoz ounces 28.35 grams glb pounds 0.454 kilograms kgT short tons (2000 lb) 0.907 megagrams (or "metric ton") Mg (or "t")
TEMPERATURE (exact degrees)°F Fahrenheit 5 (F-32)/9 Celsius °C
or (F-32)/1.8
ILLUMINATIONfc foot-candles 10.76 lux lxfl foot-Lamberts 3.426 candela/m
2cd/m
2
FORCE and PRESSURE or STRESSlbf poundforce 4.45 newtons Nlbf/in
2poundforce per square inch 6.89 kilopascals kPa
APPROXIMATE CONVERSIONS FROM SI UNITS
Symbol When You Know Multiply By To Find Symbol
LENGTHmm millimeters 0.039 inches inm meters 3.28 feet ftm meters 1.09 yards ydkm kilometers 0.621 miles mi
AREAmm
2square millimeters 0.0016 square inches in
2
m2
square meters 10.764 square feet ft2
m2
square meters 1.195 square yards yd2
ha hectares 2.47 acres ackm
2square kilometers 0.386 square miles mi
2
VOLUMEmL milliliters 0.034 fluid ounces fl ozL liters 0.264 gallons galm
3cubic meters 35.314 cubic feet ft
3
m3
cubic meters 1.307 cubic yards yd3
MASSg grams 0.035 ounces oz
kg kilograms 2.202 pounds lbMg (or "t") megagrams (or "metric 1.103 short tons (2000 lb) T
TEMPERATURE (exact degrees)°C Celsius 1.8C+32 Fahrenheit °F
ILLUMINATIONlx lux 0.0929 foot-candles fccd/m
2candela/m
20.2919 foot-Lamberts fl
FORCE and PRESSURE or STRESSN newtons 0.225 poundforce lbfkPa kilopascals 0.145 poundforce per square inch lbf/in
2
*SI is the symbol for the International System of Units. Appropriate rounding should be made to comply with Section 4 of ASTM E380.(Revised March 2003)

v
Table of Contents
1.0 IntroductIon ...................................................................................................1
2.0 Work Zone Impacts .......................................................................................3
3.0 decIsIon makIng In the project LIfe cycLe .........................................5
3.1 Planning ...........................................................................................................................................................8
3.2 PE/Design ........................................................................................................................................................9
3.3 Construction ..................................................................................................................................................11
3.4 Decisions are Interdependent ......................................................................................................................12
4.0 transportatIon anaLysIs approaches ...............................................14
4.1 Sketch-Planning Tools and Analytical/Deterministic Tools (HCM Methodologies) ...............................14
4.2 Travel Demand Models ................................................................................................................................15
4.3 Traffic Signal Optimization Tools ...............................................................................................................16
4.4 Macroscopic Simulation Models .................................................................................................................17
4.5 Mesoscopic Simulation Models ...................................................................................................................17
4.6 Microscopic Simulation Models ..................................................................................................................18
5.0 synthesIs and ImpLementatIon ...............................................................20
5.1 Work Zone Modeling Spectrum ..................................................................................................................20
5.2 Work Zone Analysis Process and Checklist ...............................................................................................21
5.3 Summary .......................................................................................................................................................26
resources ...................................................................................................................................................... 27

vi
Table of Figures
Figure 1 Work Zone Analysis Strategies Decision-Making Engine .............................................. 6
Figure 2 Decision-Making Engine within the Analysis Framework ............................................. 7
Figure 3 Decision-Making Engine in the Planning Stage .............................................................. 8
Figure 4 Decision-Making Engine in the PE/Design Stage ......................................................... 10
Figure 5 Decision-Making Engine in the Construction Stage ......................................................11
Figure 6 Work Zone Decision-Making Engine Process ............................................................... 13
Figure 7 Work Zone Modeling Spectrum .................................................................................... 20

1
Introduction1.0 Road-operating organizations across the nation are increasingly motivated to reduce congestion impacts resulting from road work, particularly on roadways where congestion is already a recurrent feature even before road work begins. Work zone planning and management has become increasingly challenging because of increasing travel demand and an aging roadway network infrastructure facing both more frequent maintenance and major rehabilitation projects. Increased travel demand and increased need for road work has sharpened interest in the application of analytical tools to assist in better understanding, among many considerations related to work zones, projected mobility impacts resulting from work zones.
At the same time that more demands are being placed on efficient work zone planning, the range of analytical tools have become more complex; data sources more abundant; and computing technology more powerful; all of which can be used to assist in the decision-making process. It is often unclear what kind of analytical approach may be of most value, particularly in light of complex data requirements and staff training. Thus, the decision to use analytical tools to support decision making can be a significant financial and intellectual investment, and deserves careful consideration. The purpose of this document is to provide high-level guidance to decision-makers on the applicability and use of a broad range of analytical tools for work zone planning and management. Successfully deployed, an analytical capability to assess and characterize mobility impacts can be invaluable assets in minimizing road user delays, reducing overall costs of traffic management, and keeping key stakeholders informed (including the public).
This guidance document is intended to provide the local decision-maker with a broad, fundamental understanding of how analytical tools can be used to support work zone decision making throughout an entire project life cycle. The guidance is rooted in an overall philosophy that “one size does NOT fit all” with respect to the best analytical approach, that is, no single tool or analytical approach is the right answer for all work zone analyses. Work zones are associated with a vast range of road work activities, ranging from multi-billion dollar mega-projects to emergency pothole repair. Further, mobility impacts can be an issue for projects on almost any type of facility ranging from low-volume rural roadways to highly congested urban freeway interchanges.
The organization of the document reflects this broad analytical philosophy for work zones and is organized as follows:
Section 2.0 Work Zone Impacts —Identifies a range of work zone impacts that should be considered when analyzing work zones. Options for an analyst considering these impacts are presented, and the role of mobility impacts assessment in addressing these considerations is discussed.
Section 3.0 Decision-Making in the Project Life Cycle —Presents the context for decision making throughout a typical project life cycle. This includes explicit recognition that decisions made in earlier stages of the project will impact and/or constrain decisions in later stages.

2
Section 4.0 Transportation Analysis Approaches —Describes the classes of analytical tools available to support work zone mobility analysis. While specific software titles are identified in this section, the discussion is focused on classes of tools, particularly in terms of trade offs between the geographic/temporal scope of analysis with the desired level of detail for the work zone analysis.
Section 5.0 Synthesis and Implementation —Provides a synthesis looking across all of the issues detailed in previous sections. This section includes an analysis process and checklist that may prove helpful in structuring an effective approach to developing an analytical process to support work zone planning.

3
Work Zone Impacts2.0 There are many considerations that must be taken into account when planning, designing and implementing a transportation management plan for work zones which FHWA discusses in the publications Developing and Implementing Transportation Management Plans for Work Zones and Work Zone Impact Assessment: An Approach to Assess and Manage Work Zone Safety and Mobility Impacts of Road Projects (1, 2). The work zone impacts discussed in these two documents can be summarized as follows:
Safety Impacts (motorists and workers)Mobility ImpactsEconomic ConsiderationsEnvironmental ConcernsUser Cost
The analysis of work zone impacts often requires the comparison of options that differ in fundamental ways with potentially differing impact in all six areas identified above. The availability and maturity of tools designed to produce quantitative estimates vary significantly when considering the range of work zone impacts. The broadest range of tools and analytical techniques available to an analyst focuses on work zone mobility impacts. Further, when the full range of mobility impacts can be quantitatively assessed, these impacts can be used in other analyses of safety, economic, environmental, and user cost impacts.
As an example, consider motorist safety impacts (an inclusive analysis will also consider worker safety as well). Some factors an analyst might want to assess include:
Potential for increased crash rates on the section of road affected by construction. Traffic diverting from the main route having to travel on a facility which is designed to support a lower volume of traffic, which may result in a higher crash rate.The diversion route may be longer than the main route and involve more intersections. Since more vehicle-miles are traveled, more crashes may occur.
An analysis of mobility impacts can be helpful in supporting a safety analysis of all three factors. The duration of congested conditions in the section of road affected by construction can be estimated when mobility impacts are projected. If the tool includes an estimate of diverted traffic volumes, these estimates can be key elements of an analysis of increased vehicle-miles traveled on alternative (possibly lower standard) roadways. The analysis of mobility impacts does not complete the safety analysis, but provides key estimates that support a robust safety analysis. In this case, crash rates on key facility types would have to be estimated and combined with the results of the mobility analysis.
A broader discussion of work zone safety considerations is available in the report Work Zone Impacts Assessment: An Approach to Assess and Manage Work Zone Safety and Mobility Impacts of Road Projects (2).

4
Other key impacts are user delay and economic considerations. These considerations can encompass aggregate estimates of user delay as well as impacts to local businesses and costs to the local agency. Many of these costs are based upon results of a mobility impacts assessment using transportation models. For example, road user delay can be estimated from speed calculations prepared using the Highway Capacity Manual (HCM) or taken directly from a mesoscopic simulation model. These data are converted to travel time, multiplied by the number of affected vehicles, and then multiplied by a factor representing the financial value of travel time. This monetary value can then be used as part of the decision-making process as to whether it is cost-effective to use a specific work zone temporary traffic control strategy such as constructing a temporary bridge to reduce road user delay. In some cases the diversion of traffic away from businesses located along a facility with significant work zone-related delay can be an important local concern. Here, an estimate of diverted traffic volume can be paired with projected revenue generated by passing motorists to provide an informed estimate of these economic impacts. This type of economic analysis was conducted for Louis Lake Road in Fremont County, Wyoming where long-term road closures were considered (3).
Clearly mobility impacts assessment is only one component that a decision-maker must consider in the complex balance of safety, economic, environmental, user cost, and other impacts (2). However, a robust mobility analysis is often instrumental in the assessment of these other factors. Broader issues in work zone planning are examined in a range of other FHWA documents and resources including the following:
FHWA Office of Operations, Work Zone Safety and Mobility Program: http://www.fhwa.dot.gov/workzones
Work Zone and Traffic Analysis: http://www.ops.fhwa.dot.gov/wz/traffic_analysis/wzta.htm
Work Zone Impacts Assessment: An Approach to Assess and Manage Work Zone Safety and Mobility Impacts of Road Projects: http://www.ops.fhwa.dot.gov/wz/resources/final_rule/wzi_guide/index.htm
Work Zone Traffic Management http://www.ops.fhwa.dot.gov/wz/traffic_analysis/wztm.htm
FHWA Economic Analysis Primer http://www.fhwa.dot.gov/infrastructure/asstmgmt/primer.cfm
Manual of User Benefit Analysis for Highways (commonly referred to as the Red Book) https://bookstore.transportation.org/item_details.aspx?ID=5

5
Decision Making in the Project Life Cycle3.0 Analyzing and mitigating the mobility impacts of work zones are closely linked with the life cycle of the road work project which encompasses a complex decision-making process detailed in a related FHWA publication, Work Zone Impacts Assessment: An Approach to Assess and Manage Work Zone Safety and Mobility Impacts of Road Projects (2). This report provides a detailed assessment of the many factors present in planning and managing work zones and provides a framework for assessing and managing the multitude of work zone impacts. The report provides a context for understanding the range of issues and decisions faced by work zone planners and managers. Each of these issues and decisions represents a potential opportunity for models to inform and strengthen overall work zone planning. While the report does mention the use of analytical tools and describes the types of tools available, it does not provide a detailed description of the various approaches to modeling mobility impacts of work zones nor address comprehensive analytical approaches supporting decision making throughout the project life-cycle. This volume of the Traffic Analysis Toolbox is a natural follow-on to provide a more detailed discussion of these tools and approaches for decision-makers.
The Work Zone Impacts Assessment report presents a typical program delivery process that includes four key components: System Planning, Preliminary Engineering, Design, and Construction (2). For the purpose of providing guidance on the role of work zone analysis within this larger process, a simplified framework specific to analyze work zone mobility impacts was developed that condenses the project delivery process components of Preliminary Engineering and Design into a single category. The reason for collapsing these two categories into one is that from the perspective of work zone analysis, the functions conducted during both are similar with no distinct boundary between the two. In fact, these two activities are often conducted in tandem with each other and any distinctions are primarily programmatic in nature (30 percent, 60 percent or 90 percent complete) rather than technical (e.g., selecting a certain type of construction method) and do not have a strong bearing on the selection and use of a work zone analysis tool. Thus, the work zone analysis framework is defined as containing three primary components: 1) System Planning, 2) PE/Design, and 3) Construction.
However, more important to the discussion at hand is not specifically where in the program delivery process one is (Planning, PE/Design, Construction) but rather the types of decisions that need to be made. These decisions are represented by three inter-related decision types that drive the overall work zone decision-making process as a three-part decision-making engine:
Scheduling Decisions —Decisions impacting when work zone activity will occur, ranging from the selection of time of day (e.g., the decision to perform work at night), to days of week (e.g., the decision to restrict work zone activity to weekends only), to time of year (e.g., a decision to work in summer only). For longer projects this includes how the work will be phased and staged along the roadway network, potentially over several years.
Application Decisions —Decisions pertaining to the construction technique to be used within the work zone (e.g., a decision to use cast-in-place techniques rather than a pre-cast approach). There are numerous construction techniques that may be considered (see

6
Resources, FHWA Office of Infrastructure available at the end of this report for links to more information). The selection of any one of these techniques will have different implications for work zone planning.
Transportation Management Plan Decisions —Decisions that determine how traffic will be managed while work zones are in place. This includes issues of temporary traffic control (TTC—control strategies, traffic control devices), public information (PI—public awareness strategies, motorist information), and transportation operations (TO—demand management, work zone safety management). For example, developing a transportation management plan for a two-lane rural roadway may involve selecting between TTCs such as temporary traffic signals or a flagging crew to support two-way, one lane operations; notifying the motoring public of possible delays through a PI campaign; and finally developing a TO enforcement plan to ensure worker safety. For large-scale projects, a critical component may be the identification and implementation of a detour route. A more detailed discussion of developing transportation management plans (TMPs) is available in the publication Developing and Implementing Transportation Management Plans for Work Zones (1).
The decision-making engine concept is visually represented in Figure 1, with each decision type represented by one of the three circles. Scheduling is the circle on top denoted with an “S”; Application is the circle on the bottom left with an “A”; and Transportation Management Plan is the circle on the right with “TMP”. Adjacent to each circle is a smaller circle used to indicate a relative level of finality regarding the decisions within each category. For example, in Figure 1, all of the decisions regarding the Application have been made indicating there is little, if any, room to make adjustments or refine those decisions. In contrast, the decision regarding TMP is shown approximately 25 percent complete indicating that many of these decisions have not yet been finalized, implying considerable flexibility potentially remaining in this area.
figure 1 Work Zone analysis strategies decision-making engine

7
All of the three circles are connected indicating each decision type does not operate in isolation but is influenced by decisions made in other areas. Thus, a decision made about the application (e.g. cast-in-place concrete) may dictate the scheduling of the work (e.g. to work in warmer-weather months) which in turn impacts the transportation management plan that could be implemented. In the following sub-sections, the thickness and directionality of these connecting segments are used to graphically indicate the potential impact and direction of influence of decisions made in one area impacting or constraining decisions in other areas.
These decisions and their influences are highly dependent on when in the project life-cycle their relationships are examined. This natural dynamism in the process is represented by the central arrow in the center of the circle indicating rotational motion. As more decisions are made momentum is gained indicated by a darkening of the arrow. This arrow is a reminder that the decision-making engine is not static and is always moving forward and gaining momentum.
There are four key pieces of information the decision engine concept conveys:
The decision-making process is a dynamic one. 1. Decisions made in one category (scheduling, application or traffic management) affect 2. decisions in other categories. Decisions made in earlier stages of the project life-cycle will have an affect in later 3. stages. Once momentum is gained early in the planning process it becomes more difficult to 4. deviate from that course of action later in the process.
These concepts are illustrated in Figure 2 where the size of the decision-making engine represents the momentum gained and as more and more decisions are made (represented by the two shaded arrows that grow larger as one moves from Planning to PE/Design to Construction), the amount of momentum grows larger (darkened central rotational arrow).
figure 2 decision-making engine within the analysis framework
Figure 1 and Figure 2 present an overall conceptual framework which is used to better understand the concepts that are expanded upon in the following four subsections. The following subsections address in more detail the various decisions that have to be made during each stage (Planning,

8
PE/Design and Construction), which components of the decision-making engine are more critical (scheduling, application and transportation management plan), and how decisions made during each stage affect available options later in the decision-making process.
Planning3.1 The Work Zone Impacts Assessment guide defines systems planning as the stage of the larger program delivery process where planning for the future is carried out by identifying transportation system needs and deficiencies, developing and evaluating alternative improvement solutions, and compiling plans and programs for implementing the solutions (2). While the Work Zone Impacts Assessment guide implies a much larger planning process examining an entire region, the planning process for implementing a work zone and accounting for its impacts has similar attributes, whether for a region or a specific project. During this process there are many questions about the impact of the work zone but the key decisions are often focused on the construction application to be used and scheduling of the construction. At this point in the process, the notion of a transportation management plan is somewhat limited since it will be heavily influenced by the scheduling and application. The Planning component of the decision-making process is shown in Figure 3.
figure 3 decision-making engine in the planning stage
As seen in Figure 3, each of the three decision categories is represented by a circle with an indistinct boundary indicating that although a general sense of feasible options may have been identified, all of the decisions to be made regarding each category have not been finalized. As the project moves from Planning to PE/design many decisions regarding the application and scheduling will be made and the circles will become more distinct. The lines connecting the three categories indicate influences from the application technique impacting primarily the scheduling and the transportation management plan; and the dotted lines indicate that these interactions are considered at a high-level only. Similarly, the dotted line connecting scheduling and the transportation management

9
plan indicate the two are accounted for but no formal decisions regarding each have been made. Finally, the central rotational arrow indicates that momentum is starting to build as decisions are made. Options in all three of the decision categories are influenced and constrained by other forces as well, e.g., funding availability, institutional policies or preferred contractual arrangements. For example, work zone scheduling may be staged to coincide with incremental funding available over multiple years. This may impact the application to be used (such as pre-cast concrete decking) which will in turn preclude some types of temporary traffic control options.
Going to the Sun Road, Glacier National Park
The application of work zone analysis in the planning stage is often used to assess the feasibility of broad project strategies relative to financial and institutional constraints. For example, when the Going to the Sun Road in Glacier National Park was in the planning stage for major reconstruction, an analytical approach was used to help determine the feasibility of conducting the work subject to a variety of constraints (3):
Scheduling. Road work limited to summer months in higher altitude sections, coinciding with the periods of highest travel demand. Overall staging also influenced by funding available in various years of the multi-year project.Application . Rugged terrain, as well as worker safety concerns, limited the use of certain construction applications.Transportation Management Plan . Given the critical nature of the road to the local economy, an agreement was made to maintain traffic flow at all times and to constrain delays from all work zones to 30 minutes or less.
The use of analytical tools early on in the process enabled decision-makers to explore the number and types of concurrent work zones along the scenic roadway that could be planned in each season over several years balancing funding constraints and mobility impacts. More information on the Going to the Sun Road can be found in the report FLH-QuickZone Case Studies: The Application of FLH-QuickZone in Six Federal Lands Projects (3).
PE/Design3.2 The Work Zone Impacts Assessment guide separates PE/Design into two distinct categories within a larger construct of project design. The guide indicates that both stages of the project delivery process often occur in tandem without a clear-cut distinction between them (2). During the PE/Design stage some flexibility may remain in each category, however, key decisions influencing work zone activity are made in this stage—whether or not the potential mobility impacts have been actively considered or analyzed. For example, the primary application technique is often identified at this stage. As the project progresses in design, final drawings are being prepared influencing the feasible geometric plans for the work zone in general and transportation management plan in particular. Further, as the project moves forward in this stage, the overall project schedule takes on more tangible shape, typically identifying how long the project will take (duration) and when it will begin (start date). For example, as more decisions are made, prospective work zone analysts

10
can better estimate how traffic will be impacted such as over the summer months or during the winter holiday season. As the decisions regarding applications and scheduling are firmed up, more emphasis is directed towards analyzing the impacts on traffic and developing the transportation management plan. The PE/Design component of the decision-making process is shown in Figure 4 below.
figure 4 decision-making engine in the pe/design stage
As shown in Figure 4, each of the three decision areas is similar to those shown in Figure 3 with the difference being the dashed circle around the scheduling and application areas. Notice, too, that the central rotational arrow is darker in color. These circles indicate that decisions regarding these areas have been firmed up with more emphasis being transferred to the transportation management plans. Overall momentum is building, indicated by the central rotational arrow. The flexibility to go back and make significant changes to the overall approach declines as each decision impacting the work zone is made, not only because of the difficulty in altering a single aspect of the project, but because of the increasing inter-connection between decisions about the project.
The PE/Design stage represents a strong connection and dialog between the scheduling of the project and the application technique to be used. At this point, the decisions regarding the scheduling and application begin to constrain the types of transportation management plans available. By the end of this stage, the decisions regarding scheduling and application will have been made and the ability to change them difficult. Based upon the decisions being made about scheduling and application, a range of techniques for overall traffic control will begin to be explored. Decisions regarding the overall transportation management plan are still somewhat high-level at the beginning of the PE/Design stage but then firmed up as final designs are made. The decision to be made at this point includes placement of construction equipment and the use of temporary traffic control devices (flagger versus traffic signal). A more detailed discussion of developing a transportation management plan is available in the publication Developing and Implementing Transportation Management Plans for Work Zones (1).

11
M-10 Lodge Freeway, Detroit, Michigan
A critical element that will impact overall work zone staging and operations during construction may be the application technique requiring a full closure or partial closure of the roadway. The reconstruction of portions of the M-10 Lodge Freeway in Detroit, Michigan was eventually conducted using a full closure. The decision to use this nontraditional technique was made during the PE/Design stage of the process, after consideration of four alternatives, and represented a constraint on the scheduling and transportation management plan. This decision was supported, in part, by results from a simple analysis that indicated the abundance of alternate routes could handle the expected demand. The M-10 Lodge Freeway example demonstrates that the use of simple transportation analytical techniques during the PE/Design stage represents another opportunity where decisions can be further supported by a quantitative assessment. Further information about the M-10 Lodge Freeway project can be found in the case study Full Road Closure for Work Zone Operations: A Case Study (4).
Construction3.3 Construction is defined by the Work Zone Impacts Assessment report as the stage where the project is actually built. At this point, most decisions have been made regarding the application to be used though some modification may be made once construction begins (2). Also, key decisions on scheduling have been firmed up except for some leeway in adjusting the schedule based upon flexible start dates built into a contract or the impact of unforeseen circumstances (construction equipment availability, weather, etc.). The transportation management plan has also been completed and will be implemented as part of the Construction stage. Though, the possibility of modifying the transportation management plan does exist based upon input from the contractor or other extenuating circumstances. In both instances (adjusting the schedule and modifying the transportation management plan) the need to reanalyze work zone mobility impacts may arise. The construction component of the decision-making process is shown in Figure 5 below.
figure 5 decision-making engine in the construction stage

12
As shown in Figure 5, most decisions regarding the application have been made along with decisions about the scheduling. The solid circle for the application component indicates that major changes to the construction technique are not likely to be made at this point. The shaded circle around the scheduling circle signifies there is still some flexibility available, but this is limited (for example, shifting the start of construction by a week rather than by a year). Where there is still room for change is with the transportation management plan. While the overall transportation management plan has been nearly complete by this point, unforeseen circumstances that were not accounted for in the Planning or PE/Design stage may reveal some needed modifications to the overall plan. At this point, overall momentum is at its greatest (indicated by the opaque central rotational arrow) and the ability for decision-makers to make changes is difficult (of course extreme decisions such as funding cuts may always be a possibility).
The Construction stage represents the strongest connections between scheduling and the transportation management plan. Planners, engineers and analysts in each area are working together to better ensure the impact to travelers is minimized. The decisions made here are being constrained by earlier decisions regarding application technique as well as outside policy forces. For example, the decision to use a certain type of high-strength concrete that must be placed during certain temperatures may force construction to begin earlier or later depending upon weather conditions. Also, policies limiting construction to non-holiday periods may impact the overall schedule start time.
Overall, during the Construction stage there is limited flexibility to make changes and what changes do have to be made will have to be supported by evidence and data so as not to impact the construction schedule or costs to the locality or the contractor. However, often the transportation management plan does need to be modified to accommodate unexpected conditions or unforeseen opportunities to improve work zone operations.
Woodrow Wilson Bridge, Northern Virginia
In the case of I-495/Route 1 Construction Project in Northern Virginia, the construction contractor proposed the closure of a one block section of a local street to better facilitate the installation of various equipment that would have required intermittent lane closures over several months. Working with the Virginia DOT, the contractor’s proposal was analyzed and the results indicated no significant mobility impacts at the local street level. In addition, traffic flow through the work zone was shown to improve. In the end, the recommendation was implemented. For more information see Appendix A in the Work Zone Impacts Assessment report (2).
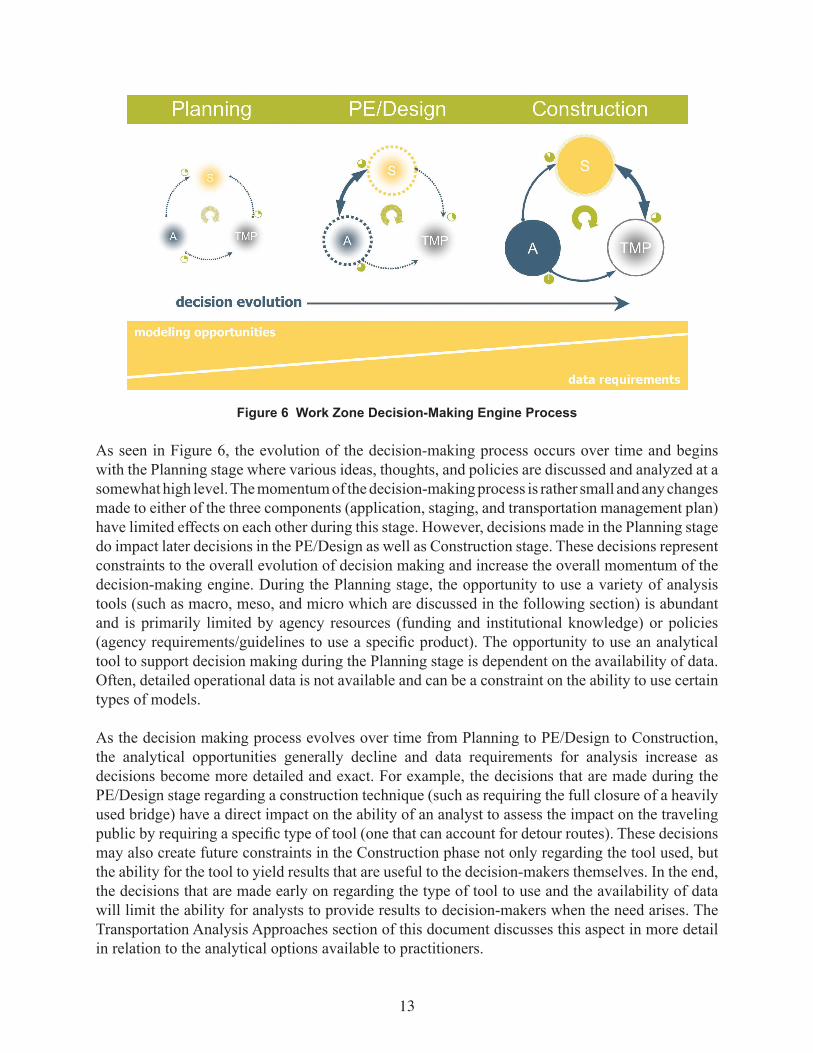
Decisions are Interdependent3.4 The individual stages of the overall Work Zone Decision-Making Engine Process were discussed in the previous three sections. Figure 6 below combines all three individual stages into the overall work zone analysis framework. The three stages of the decision-making process are listed above the decision-making engine. Below it, represented by the two trapezoids, are the tradeoffs that are made between analysis opportunities and data requirements as the decision-making process evolves over time.
13
figure 6 Work Zone decision-making engine process
As seen in Figure 6, the evolution of the decision-making process occurs over time and begins with the Planning stage where various ideas, thoughts, and policies are discussed and analyzed at a somewhat high level. The momentum of the decision-making process is rather small and any changes made to either of the three components (application, staging, and transportation management plan) have limited effects on each other during this stage. However, decisions made in the Planning stage do impact later decisions in the PE/Design as well as Construction stage. These decisions represent constraints to the overall evolution of decision making and increase the overall momentum of the decision-making engine. During the Planning stage, the opportunity to use a variety of analysis tools (such as macro, meso, and micro which are discussed in the following section) is abundant and is primarily limited by agency resources (funding and institutional knowledge) or policies (agency requirements/guidelines to use a specific product). The opportunity to use an analytical tool to support decision making during the Planning stage is dependent on the availability of data. Often, detailed operational data is not available and can be a constraint on the ability to use certain types of models.
As the decision making process evolves over time from Planning to PE/Design to Construction, the analytical opportunities generally decline and data requirements for analysis increase as decisions become more detailed and exact. For example, the decisions that are made during the PE/Design stage regarding a construction technique (such as requiring the full closure of a heavily used bridge) have a direct impact on the ability of an analyst to assess the impact on the traveling public by requiring a specific type of tool (one that can account for detour routes). These decisions may also create future constraints in the Construction phase not only regarding the tool used, but the ability for the tool to yield results that are useful to the decision-makers themselves. In the end, the decisions that are made early on regarding the type of tool to use and the availability of data will limit the ability for analysts to provide results to decision-makers when the need arises. The Transportation Analysis Approaches section of this document discusses this aspect in more detail in relation to the analytical options available to practitioners.

14
Transportation Analysis Approaches4.0 Transportation analysis involves the use of various methodologies and transportation software tools in order to better understand the effect a proposed alternative will have on the transportation network. FHWA maintains an extensive on-line resource devoted to the use of transportation modeling tools for analysis purposes called the Traffic Analysis Toolbox (TAT) (see the Resources section at the end of this document). The TAT organizes the available tools into seven categories: Sketch-Planning and Analytical/Deterministic Tools (HCM-Based), Travel Demand Models, Traffic Signal Optimization, Macroscopic Simulation, Mesoscopic Simulation, and Microscopic Simulation (5).
Each of the following sections on the analysis approaches includes a description of the basic concept that differentiates it from other approaches along with the strengths and weaknesses associated with the approach. This discussion takes place within the context of work zone analysis. A more detailed discussion of the application of various analytical approaches specifically for work zone analysis is provided in Traffic Analysis Tools Volume IX: Work Zone Analysis: A Guide for Analysts.
Sketch-Planning toolS and analytical/determiniStic toolS (hcm 4.1 methodologieS)
Sketch-Planning Tools and Analytical/Deterministic Tools (HCM Methodologies) (referred to here collectively as sketch-planning tools) are typically specialized models designed for a specific task or application such as work zone assessment or ITS analysis. These types of tools are in contrast to other general-purpose tools, such as travel demand models and microscopic simulation models which are targeted towards a much wider range of application, not just work zones analysis. Sketch-planning tools encompass a wide range of software including spreadsheet models developed by individuals and DOTs for specific projects or conditions, to more generalized delay estimation tools such as QUEWZ-98 and QuickZone. And, sketch-planning tools vary in complexity from analyzing only individual roadway segments to network-based analyses. Often, sketch-planning tools will be based upon simple queuing techniques or volume-to-capacity relationships from the Highway Capacity Manual. Although work zone specific sketch-planning tools have been available for many years, as a whole they continue to evolve and become more sophisticated in terms of features, use, and outputs.
The strength of sketch-planning tools rests upon their relative ease of use and ability to facilitate a rapid analysis. Typically, a sketch-planning tool will require fewer resources and less staff training to deploy than a mesoscopic or microscopic simulation model since they are simpler in terms of data requirements, calibration, and interpretation of the results. Regarding work zones, an analysis using a sketch-planning tool is normally quite rapid including both the input of the data and the model run time. This is important in cases where a decision needs to be made quickly or the agency desires a less resource-intensive analysis (e.g., for a project with a modest level of expected work zone impacts).
The strengths of these tools must be balanced with some of the weaknesses of them such as limited network complexity and a high-level analysis. For example, QUEWZ-98 only allows simple

15
“pipeline” analysis without the ability to model cross-streets and detour routes. However, some of the more complex sketch-planning tools (e.g., QuickZone) do include the ability to model a detour route. The results of both of these models do not provide the detailed fidelity (level of accuracy and analysis) available in simulation models. In the end, the results from any sketch-planning tool will be relatively high-level (e.g., average or maximum queue) even though the input data is provided at a fairly detailed level (such as 15 minute traffic counts).
Lists of commonly used delay estimation tools are available at the following links:
Sketch-Planning Tools: http://ops.fhwa.dot.gov/trafficanalysistools/tat_vol1/sectapp_a.htm#a1
HCM Methodologies: http://ops.fhwa.dot.gov/trafficanalysistools/tat_vol1/sectapp_a.htm#a3
Appendix B of Work Zone Impacts Assessment: http://www.ops.fhwa.dot.gov/wz/resources/final_rule/wzi_guide/appb.htm
The use of delay estimation tools to analyze work zone impacts have been documented in a number of case study reports. These resources include the following links:
FHWA Work Zone Operations Best Practices Guidebook: http://www.ops.fhwa.dot.gov/wz/practices/practices.htm
The Application of QuickZone in Eight Common Construction Projects . Available from FHWA Office of Operations.
The Application of FLH-QuickZone in Six Federal Lands Projects . Available from FHWA Federal Lands Highway Division
travel demand modelS4.2 Travel Demand Models are widely used today and were originally developed to model traffic in distinct transportation subnetworks, such as freeways, corridors (including freeways and parallel arterials), surface-street grid networks, and rural highways. The FHWA Traffic Analysis Toolbox describes travel demand models as being mathematical models that forecast future travel demand based on current conditions, and future projections of household and employment centers (5).
Travel demand models are traditionally thought of as the large regional planning models used by Regional Planning Commissions and Metropolitan Planning Organizations throughout the U.S. and were originally developed to determine the benefits and impacts of major highway improvements in metropolitan areas. To this end, a distinguishing feature of travel demand models is their geographic coverage. Generally speaking, travel demand models include an entire metropolitan area: a city, its suburbs, and the adjacent counties as required by law or need. The basic goal of these models is to forecast long-term future travel demand based on current conditions and projections of future household and employment characteristics.

16
For work zone analysis, one strength offered by travel demand models is their ability to predict area-wide traffic redistribution. For example, if an agency is considering closing an important urban freeway-to-freeway interchange for several months while it is rebuilt, a travel demand model could help evaluate the overall changes in total daily traffic volumes on various roadways throughout the region.
However, travel demand models have limited capabilities to accurately estimate changes in operational characteristics (such as speed, delay, and queuing) resulting from the implementation of operational strategies and changes (including the effects associated with roadwork construction). Because these models are prepared at a broad regional scale, they may lack accurate intersection turn volumes, so they may not be appropriate for detailed operational studies. They may model only one or two time periods (such as the AM peak hour or the daily average), which may not be sufficient for analyzing time-specific work zone traffic management strategies.
Some travel demand models contain only the total traffic volume on each link (combining the traffic volume from both travel directions). If this is the case, it may be difficult to adapt the model for analyzing routes or time periods that have unequal directional flows. For example, if the modeled volumes represent the Annual Average Daily Traffic, extensive re-working of the model may be required if the work zone analysis requires determining the directional peak hour flows into and out of a city’s central business district.
Other limitations include their relative complexity and expense to build and maintain. However, these limitations must be balanced with the fact that these types of models can handle larger networks more efficiently than mesoscopic and microscopic simulation models. Another important consideration is that most major metropolitan areas already have a travel demand model constructed that could be used as a foundation for developing a transportation network for another model type.
A list of commonly used travel demand models is available at the FHWA Traffic Analysis Toolbox at http://ops.fhwa.dot.gov/trafficanalysistools/tat_vol1/sectapp_a.htm#a2.
traffic Signal oPtimization toolS4.3 Traffic signal optimization tools are used to develop signal timing plans for isolated signal intersections, signalized arterial corridors, and signal networks. The FHWA Traffic Analysis Toolbox indicates that many of the available traffic signal optimization tools include the ability to conduct capacity calculations, cycle length determinations, splits optimizations, and coordination/offset plans (5). With respect to work zones, traffic signal optimization tools are useful when developing a signal plan for a temporary traffic signal or analyzing signal plans when a detour route directs traffic to an existing signalized arterial roadway. The primary limitation of these tools is their single focus. Traffic signal optimization tools are typically used to provide supplementary analysis when analyzing the overall mobility impacts of a work zone.
A list of commonly used traffic signal optimization tools is available at the FHWA Traffic Analysis Toolbox at http://ops.fhwa.dot.gov/trafficanalysistools/tat_vol1/sectapp_a.htm#a4.

17
macroScoPic Simulation modelS4.4 The FHWA Traffic Analysis Toolbox describes macroscopic simulation models as based upon the deterministic relationships of the flow, speed, and density of the traffic stream (5). The simulation in a macroscopic model takes place on a section-by-section basis rather than by tracking individual vehicles. In other words, macroscopic tools treat traffic flows as an aggregated quantity; they do not model the movement of individual vehicles on a network.
In similar fashion to travel demand models, a characteristic feature of macroscopic models is their ability to cover large geographic areas. However, not all macroscopic simulation models include the ability to simulate a large network. The ability to model a large geographic area is useful when the work zone impacts may affect a larger corridor or region where large geographic impacts need to be better understood based upon a certain work zone design such as a full closure. Another characteristic of macroscopic simulation models pertaining to work zones is the run time. Because these models simulate aggregate flows, speeds, and density measures on each section of the network (rather than individual vehicles) they can be set up more quickly and run faster. This is useful where results need to be estimated quickly since these models generally require less time to run than travel demand models and other simulation models. The primary limitation of macroscopic models is their simple representation of traffic movement (e.g., no car following algorithms) which will limit the fidelity of the results.
A list of commonly used macroscopic simulation models is available at the FHWA Traffic Analysis Toolbox at http://ops.fhwa.dot.gov/trafficanalysistools/tat_vol1/sectapp_a.htm#a5.
meSoScoPic Simulation modelS4.5 Mesoscopic simulation models are the newest generation of traffic simulation modeling tools. These tools evolved from a need for an intermediate level of analysis. They provide more detail than both the travel demand models and macroscopic simulation models discussed previously, but not as much fidelity as the microscopic simulation tools discussed in the next section. Mesoscopic models tend to represent the relative flow of vehicles on a network link, but do not represent individual lanes on the link.
The strength of mesoscopic simulation models when analyzing work zones includes the ability to model both large geographic areas and corridors. In addition, diversion routes and signalized intersections can be modeled. In the case of a corridor with an Interstate and a signalized arterial road running through it, the diversion route onto the arterial could be more readily modeled using a mesoscopic simulation model. This type of analysis would not be easy to conduct using travel demand models or macroscopic simulation models, and can only be represented in a more limited fashion in some sketch-planning tools.
Mesoscopic simulation models do have a number of weaknesses. One is their limited ability to model detailed operational strategies such as complex signal control. Thus, if a work zone includes a number of signalized intersections, a different type of model (such as a microscopic simulation model or traffic signal optimization tool) may be a better choice. Another weakness of mesoscopic
18
simulation models is the overall model complexity and data requirements necessary for accurate results. Mesoscopic models are an order of magnitude more complex than the most sophisticated sketch-planning tools, require similar amounts of data (albeit at a more granular level) as regional planning models, and similar resources (time, money, and knowledge) as travel demand models and microscopic simulation models.
Commonly used mesoscopic simulation tools for work zone analysis include the family of DYNASMART and DYNAMIT models as well as newly introduced hybrid/multi-scale models including Cube’s Avenue and Caliper’s TransModeler. Additional information on mesoscopic simulation models can be found at the following links:
FHWA Traffic Analysis Tools—Mesoscopic Simulation Models: http://ops.fhwa.dot.gov/trafficanalysistools/tat_vol1/sectapp_a.htm#a6
Evacuation Management Operations Modeling Assessment: Transportation Modeling Inventory. Available from the U.S. DOT RITA ITS Joint Program Office.
microScoPic Simulation modelS4.6 Microscopic simulation models were developed to accurately represent transportation systems at the individual vehicle level. They simulate the movement of individual vehicles based on car-following and lane-changing theories and other parameters. Microscopic simulation models update the positions and intentions of individual vehicles every second (or fraction of a second) as they move through a network. To account for the diversity of vehicles and driving styles that are encountered in real-world traffic, each vehicle is assigned a set of characteristics that influence the way it responds to the presence of other vehicles and to traffic control devices.
In the past, available computing power tended to limit the size of networks that could be modeled with microscopic simulation models. Recent advances in processor speed have reduced this problem but the desire to model larger areas and more complex travel behavior still exists. Today, the primary limitation of microscopic simulation models is the substantial amount of roadway geometry, traffic control, and traffic pattern data they require. Many transportation agencies currently use microscopic models in conjunction with travel demand models to better understand the impact of roadway geometry modifications on level of service and carrying capacity.
Today, microscopic simulation models are extensively used in a range of applications including evacuation planning and work zone impact analysis. These general-purpose models are effective in evaluating a wide range of scenarios including heavily congested conditions, complex geometric configurations, and system-level impacts of proposed transportation improvements that are beyond the limitations of other model types. While practical considerations may limit the geographic coverage of a microscopic simulation model, these models are useful in analyzing key bottlenecks on roadway segments and corridors where the movement of each individual vehicle needs to be represented to better understand the impact on roadway conditions.
A limitation of microscopic simulation models includes the inability to model large geographic areas. The reason is not a function of computing power, but the difficulty of calibrating a larger

19
network that requires substantial data, resources, and technical expertise. The Michigan DOT has completed a microscopic simulation network of the entire Detroit Metropolitan Area freeway system which could be used for work zone analysis. More typical examples include smaller-scale analysis (in terms of geographic scale) for road projects such as the replacement of the Woodrow Wilson Bridge in Maryland and Virginia (2).
Commonly used microscopic simulation tools include CORSIM, VISSIM, and Paramics. Additional information on microscopic simulation tools can be found at the following links:
FHWA Traffic Analysis Tools—Microscopic Simulation Models: http://ops.fhwa.dot.gov/trafficanalysistools/tat_vol1/sectapp_a.htm#a7
Traffic Analysis Toolbox Volume IV: Guidelines for Applying CORSIM Microsimulation Modeling Software: http://ops.fhwa.dot.gov/trafficanalysistools/tat_vol4/vol4_guidelines.pdf

20
Synthesis and Implementation5.0 This section pulls together the material discussed earlier in this document and addresses how to put these concepts into practice. First, some current tools from each of the seven categories are presented in a modeling spectrum. While it is useful to consider the categories of tools when developing an analytical approach for work zone planning and management, in the end specific models/tools are applied, not categories. Second, this section presents a checklist of conditions under which particular categories of tools are likely to be a valuable component of an analytical capability. The section ends with a summary of the motivation and benefits for developing and deploying an appropriate analytical capability in support of work zone decision making.
Work Zone Modeling Spectrum5.1 As discussed in Section 4.0, there are many approaches available to analysts to address work zones, as illustrated in Figure 7 below. The spectrum described here includes seven of the many tools currently available that could be used to assess the impacts of roadway construction projects. Many other tools are available for use and are described in more detail at the Traffic Analysis Toolbox (TAT) website (see the Resources section for more detail). The tools shown here are used for comparison purposes and are placed on a continuum from simple to complex. Simpler tools include the categories of HCM and sketch-planning while the more complex tools include macro, meso, and microscopic simulation software.
sim
ple
co
mp
lex
Travel DemandSketch-planning Meso Micro
dynasmart
corsImsynchro
QuickZone
LimitedLimited
rough estimationrough estimation
shortershorter
LimitedLimited
LowerLower
comprehensivecomprehensive
precise representationprecise representation
LongerLonger
requiredrequired
higherhigher
LEVEL OF DETAIL
FUNCTIONALITY
TRAINING
COST
DEVELOPMENT TIME
MacroSignal Optimization
emme/2
highway capacity manual
hcs 2000
figure 7 Work Zone modeling spectrum
There are many factors associated with selecting a specific methodology or tool which include functionality, level of detail (results and input data), time, training, and cost. Choosing a tool is generally a tradeoff among these five criteria. Functionality (the capability to represent specific work zone attributes) and level of detail (capability to quantitatively differentiate between alternatives) are two critical criteria because if the tool cannot analyze a specific situation or provide the necessary results to the precision or accuracy required, it would not be useful regardless of the cost, training, or development time applied. In some instances, such as a project currently in

21
the construction phase, it may be critical that results are provided in a timely manner. The time required to assemble the required data and calibrate a simulation tool is generally much longer than the time and resources required to utilize a sketch-planning (delay estimation) tool. The need for timeliness must be balanced against the ability of the sketch-planning tool to provide a meaningful solution accurately reflecting the problem under study. Finally, the training and cost associated with a particular tool should be considered. Simulation tools often require a high level of expertise and training, skills which are possessed by relatively fewer individuals and can be costly to hire and retain. On the other hand, many of the sketch-planning and HCM tools are more accessible, can be mastered by a broad range of staff within a short time, and are inexpensive to purchase.
A critical element that will further impact these factors and tool selection is the availability of data. Regardless of the functionality desired or time available, the absence of data will influence both tool selection and the usefulness of analytical results.
Work Zone Analysis Process and Checklist5.2 This subsection provides a high-level synthesis combining the concepts presented in Sections 2.0 through 4.0, and describes the various conditions under which the more common categories of tools is likely to be most helpful in supporting work zone planning and management: Sketch-Planning or Analytical/Deterministic Tools, Travel Demand/Macro Models, Mesoscopic Simulation Models, and Microscopic Simulation Models. A more detailed assessment is provided in the report Traffic Analysis Tools IX: Work Zone Analysis: A Guide for Analysts which includes concepts such as problem complexity, availability of resources and time, individual tool selection, fidelity of results, and multi-scale analysis approaches.
Not all conditions in an individual list need be present for the specific class of tools to be appropriate.

22
In what context is a Sketch-Planning Tool or Analytical/Deterministic Tool (HCM Methodologies) likely to be most useful?
Work zone impacts are confined to a single facility; one or more work zones are located in a series along the facility (of any length).
Resources for analysis are limited and rough estimation of congestion timing, extent, and intensity is sufficient to guide decision making.
Mobility impacts must be rapidly assessed to support modifications to the transportation management plan, i.e., a quick response to a request for a change is required.
Multi-season or multi-year projects wherein many (10+) potential phasing and staging sequences need to be assessed.
A large number of smaller projects must be screened and ranked according to potential mobility impacts.
No calibrated network analysis tool (meso or micro simulation) encompassing the area impacted by the planned work zone activity is available (or feasible to develop given resource and schedule constraints).

23
In what context is a Travel Demand/Macro Model likely to be most useful? A calibrated, well-maintained travel demand or macro model is available encompassing the area impacted by the planned work zone activity.
The time periods represented in the travel demand model coincide with those that are important for the work zone analysis.
Work zone mobility impacts are expected over a large geographic area, particularly impacts on parallel and adjacent facilities, including transit networks.
Accurate estimates of congestion timing, extent, and intensity are less critical than a need to identify the likelihood that congestion will form.
Multiple concurrent and potentially interacting projects must be phased and staged across a broad geographic network with unknown mobility impacts.

24
In what context is a Mesoscopic Simulation Model likely to be most useful?
A calibrated, well-maintained corridor model at the meso-scale is available encompassing the area impacted by the planned work zone activity.
Work zone mobility impacts are expected on parallel facilities, including diversion impacts; key facilities generally feature uninterrupted flow (few signals or stop signs).
Projects on parallel facilities must be conducted simultaneously with clearly interacting congestion and diversion impacts. Rates of diversion are expected to vary with changing congestion conditions in or near the work zone.
Travel demand management and/or traveler information strategies are critical elements of the transportation management plan.
Significant staff and data resources are available for model development and validation, including time-dependent vehicle counts at key bottlenecks in the network and dynamic end-to-end travel time estimates for the mainline and alternative routes at 15-minute intervals for recurring congestion.

25
In what context is a Microscopic Simulation Model likely to be most useful?
A calibrated, well-maintained network for a traffic micro simulation is available encompassing the area impacted by the planned work zone activity.
Critical performance measures are required at the lane level, or require the detailed assessment of alternative traffic control configurations (including signals) at interchanges, intersections, or lane shifts in the work zone.
Diversion impacts are less critical than the detailed assessment of mainline traffic control.
Significant staff and data resources are available for model development and validation, including network level descriptions of lane widths, turning movement bay lengths, traffic signal timing plans, and validation data including time-variant turning movement counts, vehicle counts by lane at critical bottlenecks, and end-to-end travel time estimates for the mainline at 15-minute intervals for recurring congestion.

26
Summary5.3 The results from analyzing transportation impacts can serve to improve decision making as well as improve overall understanding of the relationships between the many forces affecting work zone decision making: mobility, financial, environmental, safety, and user costs. Work zone analysis should never be used to make key decisions but instead developed as a trusted resource for understanding the potential mobility impacts and using this information to inform key decisions. The informative value of analysis used by decision-makes will directly relate to how well the analyst has considered both the context for analysis (decisions to be supported and relevant performance measures) and the context for validation (data and staff resources). The job of the work zone analyst extends beyond merely conducting an analysis and reporting results; but to provide decision-makers with a broader understanding that connects the findings of the analysis within the decision-making context. Placed in context, a well-summarized level of understanding can be provided to decision-makers and other staff working on the project, even if decision-makers do not have first-hand experience with the analytical approach.

27
reSourceS
FHWA Office of Operations, Work Zone Safety and Mobility Program : The FHWA Work Zone Mobility and Safety Program goal is to “make work zones work better” by providing transportation practitioners with high-quality products, tools, and information that can be used to help improve work zone management, and ultimately reduce congestion and crashes due to work zones. http://www.fhwa.dot.gov/workzones.
Work Zone and Traffic Analysis : Understanding the anticipated type, severity, and extent of work zone impacts associated with various project alternatives facilitates the incorporation of appropriate mitigation measures and strategies in project programming, design, and in the development of effective transportation management plans (TMPs). This online resource provides a wealth of information related to examples and use of work zone traffic analyses. http://www.ops.fhwa.dot.gov/wz/traffic_analysis/wzta.htm.
Work Zone Impacts Assessment: An Approach to Assess and Manage Work Zone Safety and Mobility Impacts of Road Projects: This Guide is designed to help transportation agencies develop and/or update their own policies, processes, and procedures for assessing and managing the work zone impacts of their road projects throughout the different program delivery stages. http://www.ops.fhwa.dot.gov/wz/resources/final_rule/wzi_guide/index.htm.
Work Zone Traffic Management : Online resource for managing traffic during construction to minimize traffic delays, maintain or improve motorist and worker safety, complete roadwork in a timely manner, and maintain access for businesses and residents. http://www.ops.fhwa.dot.gov/wz/traffic_analysis/wztm.htm.
FHWA Traffic Analysis Toolbox (TAT) : The Traffic Analysis Tools Program was formulated by FHWA in an attempt to strike a balance between efforts to develop new, improved tools in support of traffic operations analysis and efforts to facilitate the deployment and use of existing tools. The TAT provides a detailed description of applying traffic modeling tools http://ops.fhwa.dot.gov/trafficanalysistools/index.htm.
FHWA Work Zone Operations Best Practices Guidebook : Keyword-searchable guide to nationwide best practices in areas such as modeling and impact assessment, planning and programming, contracting and bidding procedures, project design, public relations/outreach, and many others. http://www.ops.fhwa.dot.gov/wz/practices/practices.htm.

28
The Application of QuickZone in Eight Common Construction Projects : This report summarizes the use of QuickZone for eight projects throughout North America. The analysis includes a listing of key observations that are important to how QuickZone was used for each project, a project overview, a discussion on network design for each case study, and an analysis of the results and how they were used Available from FHWA Office of Operations.
The Application of FLH-QuickZone in Six Federal Lands Projects : This paper provides a summary of how FLH-QuickZone fits within a spectrum of other work zone delay estimation tools and how FLH-QuickZone was used for six FLH roadway construction projects. The paper concludes with observations on the challenge of addressing the “soft cost” of roadway construction projects, through the use of FLH-QuickZone or with other analytical tools. Available from FHWA Federal Lands Highway Division.
Evacuation Management Operations Modeling Assessment: Transportation Modeling Inventory: This research documents more than 30 surface transportation modeling tools that have been applied or could be applied to evacuation modeling. Each tool represents a tradeoff between desired scope and analytical complexity, ranging from state-to-state coordination tools such as the Evacuation Traveler Information System (ETIS) to detailed traffic micro-simulation models such as the TSIS/CORSIM traffic simulation model. Available from the USDOT RITA ITS Joint Program Office.
FHWA Office of Infrastructure: The Office of Infrastructure provides leadership, technical expertise, and program assistance in: Federal-Aid Highway Programs; Asset Management; Pavements; and Bridges to help sustain America’s mobility. http://www.fhwa.dot.gov/infrastructure/.

29
REFERENCES
(1) Federal Highway Administration, Developing and Implementing Transportation Management Plans for Work Zones. 2005.
(2) Federal Highway Administration, Work Zone Impacts Assessment: An Approach to Assess and Manage Work Zone Safety and Mobility Impacts of Road Projects. 2006.
(3) Federal Lands Highway Division, FLH-QuickZone Case Studies: The Application of FLH-QuickZone in Six Federal Lands Projects. 2005.
(4) Federal Highway Administration, Full Road Closure for Work Zone Operations: A Case Study. 2004.
(5) Federal Highway Administration, Traffic Analysis Toolbox, Volume 1: Traffic Analysis Tools Primer. 2004.


Office of OperationsRoom E86-205
1200 New Jersey Avenue, SEWashington, DC 20590
www.ops.fhwa.dot.gov
FHWA-HOP-08-029